EP3141898A1 - A bio-impedance spectroscopy system and method for bio-impedance measurement - Google Patents
A bio-impedance spectroscopy system and method for bio-impedance measurement Download PDFInfo
- Publication number
- EP3141898A1 EP3141898A1 EP16188313.7A EP16188313A EP3141898A1 EP 3141898 A1 EP3141898 A1 EP 3141898A1 EP 16188313 A EP16188313 A EP 16188313A EP 3141898 A1 EP3141898 A1 EP 3141898A1
- Authority
- EP
- European Patent Office
- Prior art keywords
- signal
- impedance
- bio
- analog
- digital
- Prior art date
- Legal status (The legal status is an assumption and is not a legal conclusion. Google has not performed a legal analysis and makes no representation as to the accuracy of the status listed.)
- Granted
Links
Images


Classifications
-
- A—HUMAN NECESSITIES
- A61—MEDICAL OR VETERINARY SCIENCE; HYGIENE
- A61B—DIAGNOSIS; SURGERY; IDENTIFICATION
- A61B5/00—Measuring for diagnostic purposes; Identification of persons
- A61B5/05—Detecting, measuring or recording for diagnosis by means of electric currents or magnetic fields; Measuring using microwaves or radio waves
- A61B5/053—Measuring electrical impedance or conductance of a portion of the body
- A61B5/0537—Measuring body composition by impedance, e.g. tissue hydration or fat content
-
- A—HUMAN NECESSITIES
- A61—MEDICAL OR VETERINARY SCIENCE; HYGIENE
- A61B—DIAGNOSIS; SURGERY; IDENTIFICATION
- A61B5/00—Measuring for diagnostic purposes; Identification of persons
- A61B5/72—Signal processing specially adapted for physiological signals or for diagnostic purposes
- A61B5/7271—Specific aspects of physiological measurement analysis
- A61B5/7278—Artificial waveform generation or derivation, e.g. synthesizing signals from measured signals
-
- A—HUMAN NECESSITIES
- A61—MEDICAL OR VETERINARY SCIENCE; HYGIENE
- A61B—DIAGNOSIS; SURGERY; IDENTIFICATION
- A61B5/00—Measuring for diagnostic purposes; Identification of persons
- A61B5/02—Detecting, measuring or recording for evaluating the cardiovascular system, e.g. pulse, heart rate, blood pressure or blood flow
- A61B5/0205—Simultaneously evaluating both cardiovascular conditions and different types of body conditions, e.g. heart and respiratory condition
-
- A—HUMAN NECESSITIES
- A61—MEDICAL OR VETERINARY SCIENCE; HYGIENE
- A61B—DIAGNOSIS; SURGERY; IDENTIFICATION
- A61B5/00—Measuring for diagnostic purposes; Identification of persons
- A61B5/24—Detecting, measuring or recording bioelectric or biomagnetic signals of the body or parts thereof
- A61B5/30—Input circuits therefor
- A61B5/307—Input circuits therefor specially adapted for particular uses
- A61B5/308—Input circuits therefor specially adapted for particular uses for electrocardiography [ECG]
-
- A—HUMAN NECESSITIES
- A61—MEDICAL OR VETERINARY SCIENCE; HYGIENE
- A61B—DIAGNOSIS; SURGERY; IDENTIFICATION
- A61B5/00—Measuring for diagnostic purposes; Identification of persons
- A61B5/24—Detecting, measuring or recording bioelectric or biomagnetic signals of the body or parts thereof
- A61B5/316—Modalities, i.e. specific diagnostic methods
- A61B5/318—Heart-related electrical modalities, e.g. electrocardiography [ECG]
-
- A—HUMAN NECESSITIES
- A61—MEDICAL OR VETERINARY SCIENCE; HYGIENE
- A61B—DIAGNOSIS; SURGERY; IDENTIFICATION
- A61B5/00—Measuring for diagnostic purposes; Identification of persons
- A61B5/72—Signal processing specially adapted for physiological signals or for diagnostic purposes
- A61B5/7225—Details of analogue processing, e.g. isolation amplifier, gain or sensitivity adjustment, filtering, baseline or drift compensation
-
- A—HUMAN NECESSITIES
- A61—MEDICAL OR VETERINARY SCIENCE; HYGIENE
- A61B—DIAGNOSIS; SURGERY; IDENTIFICATION
- A61B5/00—Measuring for diagnostic purposes; Identification of persons
- A61B5/72—Signal processing specially adapted for physiological signals or for diagnostic purposes
- A61B5/7235—Details of waveform analysis
- A61B5/725—Details of waveform analysis using specific filters therefor, e.g. Kalman or adaptive filters
-
- G—PHYSICS
- G01—MEASURING; TESTING
- G01N—INVESTIGATING OR ANALYSING MATERIALS BY DETERMINING THEIR CHEMICAL OR PHYSICAL PROPERTIES
- G01N27/00—Investigating or analysing materials by the use of electric, electrochemical, or magnetic means
- G01N27/02—Investigating or analysing materials by the use of electric, electrochemical, or magnetic means by investigating impedance
- G01N27/026—Dielectric impedance spectroscopy
-
- G—PHYSICS
- G01—MEASURING; TESTING
- G01N—INVESTIGATING OR ANALYSING MATERIALS BY DETERMINING THEIR CHEMICAL OR PHYSICAL PROPERTIES
- G01N33/00—Investigating or analysing materials by specific methods not covered by groups G01N1/00 - G01N31/00
- G01N33/48—Biological material, e.g. blood, urine; Haemocytometers
- G01N33/483—Physical analysis of biological material
- G01N33/4833—Physical analysis of biological material of solid biological material, e.g. tissue samples, cell cultures
- G01N33/4836—Physical analysis of biological material of solid biological material, e.g. tissue samples, cell cultures using multielectrode arrays
-
- A—HUMAN NECESSITIES
- A61—MEDICAL OR VETERINARY SCIENCE; HYGIENE
- A61B—DIAGNOSIS; SURGERY; IDENTIFICATION
- A61B5/00—Measuring for diagnostic purposes; Identification of persons
- A61B5/05—Detecting, measuring or recording for diagnosis by means of electric currents or magnetic fields; Measuring using microwaves or radio waves
- A61B5/053—Measuring electrical impedance or conductance of a portion of the body
-
- A—HUMAN NECESSITIES
- A61—MEDICAL OR VETERINARY SCIENCE; HYGIENE
- A61B—DIAGNOSIS; SURGERY; IDENTIFICATION
- A61B5/00—Measuring for diagnostic purposes; Identification of persons
- A61B5/72—Signal processing specially adapted for physiological signals or for diagnostic purposes
- A61B5/7235—Details of waveform analysis
- A61B5/7253—Details of waveform analysis characterised by using transforms
- A61B5/7257—Details of waveform analysis characterised by using transforms using Fourier transforms
Definitions
- This invention relates to the measurement of bio-impedance, in particular complex bio-impedance values over a broad range of frequencies, in order to implement a spectral bio-impedance analysis.
- Non-invasive wearable medical devices for lifestyle and healthcare are increasingly being used for monitoring chronic diseases and detecting early health problems.
- Congestive heart failure a chronic heart failure characterized by fluid overload, is one of the major conditions with detrimental effects on quality of life, and potentially fatal.
- Bio-impedance analysis has been clinically used to track congestive heart failure. By injecting a low-level AC current to a body segment, a voltage proportional to the tissue impedance can be measured. Bio-impedance is used to estimate various physiochemical and physiological states, such as thoracic fluid, respiration, skin hydration and body composition.
- ECG is often used as a diagnosis tool of congestive heart failure, by measuring the electrical activity in the heart to detect coronary artery diseases and heart attacks. Therefore, simultaneous measurement of the bio-impedance and ECG can extend the range of extracted biomedical information for improved diagnosis accuracy.
- Bio-impedance can be measured at single-frequency (SF), multifrequencies (MF), or by impedance spectroscopy (IS).
- Single-frequency measurement has the advantage of high signal-to-noise ratio (SNR).
- SNR signal-to-noise ratio
- impedance should be measured at several frequencies.
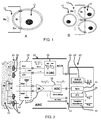
- Figure 1A shows an equivalent model of the bio-impedance of a cellular organism.
- the extra-cellular region 10 is modeled by a series (external) resistance Re in a first branch
- the intra-cellular region 12 is modeled by a second branch of cell wall capacitors Cm in series with an (internal) resistance Ri.
- the two branches are in parallel.
- Figure 1B shows the current flowing.
- a low frequency current 14 flows through the extra-cellular regions and a high frequency current 16 flows through the intra-cellular regions.
- Impedance spectroscopy can lead to shorter acquisition time and analog hardware simplicity by measuring the whole spectrum (including bio-impedance and ECG) simultaneously. This is realized by using a wideband stimulation signal, such as a chirp, square wave or pseudo-random sequence.
- a chirp often leads to a low signal to noise ratio (SNR), as the current magnitude is spread over the whole bandwidth.
- SNR signal to noise ratio
- a square wave is easy to generate, but it suffers from lower magnitudes at higher frequencies.
- a maximal length sequence i.e. a pseudo random pulse sequence with an equally distributed power spectrum, maintains an even SNR throughout the entire frequency range, while still allocating sufficient magnitude to each frequency bin.
- the MLS signal is easy to generate.
- a bio-impedance spectroscopy circuit should be able to detect very small dynamic impedance variations (e.g. ⁇ 0.1 ⁇ ) superimposed on a large static impedance (e.g. 10 ⁇ - 1k ⁇ ) across a wide frequency range (e.g. 1kHz - 100kHz), while only using a low stimulation current (e.g. ⁇ 100uA@10kHz).
- very small dynamic impedance variations e.g. ⁇ 0.1 ⁇
- a large static impedance e.g. 10 ⁇ - 1k ⁇
- a wide frequency range e.g. 1kHz - 100kHz
- a low stimulation current e.g. ⁇ 100uA@10kHz
- bio-impedance spectroscopy circuits utilize wideband amplifiers (typically >100kHz) and highspeed high-resolution ADCs, which are both power hungry components. This is because both the amplifier and the ADC must have a bandwidth at least equal to the maximum frequency of the bio-impedance spectroscopy.
- an ECG acquisition circuit should achieve low noise (e.g. 1 ⁇ VRMS) at low frequencies (e.g. ⁇ 150Hz), with the capability to tolerate a large electrode offset (e.g. ⁇ 300mV).
- the readout circuit should also have good power supply rejection ratio (PSRR) and common mode rejection ratio (CMRR).
- an impedance spectroscopy system for bio-impedance measurement, comprising: a signal generator for generating a signal with a broadband frequency spectrum, and generating an analog injection current from the signal, wherein the analog injection signal has a high pass frequency characteristic; an amplifier for measuring a voltage signal in response to the analog injection current and simultaneously a biopotential signal; and a processor for analyzing the voltage signal to derive a bio-impedance spectrum as well to derive further information from the biopotential signal.
- This system makes use of an injection current with a high pass frequency characteristic so that the injection current increases with frequency. This compensates for the typical bio-impedance behavior which typically has a low pass characteristic. By this is meant that the impedance is greater at lower frequencies and therefore more easily measured.
- the overall signal to noise ratio of the system is flattened with respect to frequency, so that a more constant signal to noise ratio is achieved during a bio-impedance spectral analysis.
- the system also derives further information from a biopotential signal measurement, for example the further information may comprise as ECG, EEG, or EMG signal.
- biopotential signal is used to refer to a voltage signal that is directly generated from the subject, such as an ECG, EEG or EMG signal.
- the voltage is not directly generated from the subject, but is derived from a stimulation current which then enables the bio-impedance to be determined.
- the system thus provides simultaneous multi-parameter measurements using a single voltage readout channel.
- An ECG signal may for example be obtained simultaneously with the bio-impedance spectroscopy (BIS) information, and separated by further signal processing
- the system also enables a lower bandwidth amplifier to be used, because the frequency characteristic (in particular rolling off) of the amplifier is compensated by the analog injection signal, such that the effective bandwidth of the readout circuit can be increased.
- the generated signal for example comprises a wideband stimulation current source which is actuated by a pseudo-random binary sequence.
- the system may comprise a digital to analog converter for generating the analog injection current from the signal. It may for example comprise a current injection circuit for injecting current in dependence on a digital input.
- the signal generator may comprise a maximal length sequence generator for generating a digital maximal length sequence signal.
- This type of sequence has an equally distributed power spectrum.
- the injection signal is better adapted to the nature of the bio-impedance to be measured as well as the amplifier characteristics.
- the signal generator may further comprise a (digital or analog) differentiator for applying differentiation, thereby to result in the high pass frequency characteristic.
- the differentiation may be digital and implemented before the digital to analog conversion.
- the differentiation implements the high pass characteristic and converts a two level signal into a three level signal. This also has the advantage that the power of the analog signal is reduced, if one of the three levels is a zero level.
- the analog injection signal may be a three level current signal with a zero level, a positive level and a negative level.
- the signal generator may be controllable in a first mode to output a maximal length sequence and in a second mode to output a differentiated maximal length sequence.
- the maximum length sequence is for example used to give better signal to noise ratio at low frequencies.
- the first mode may also be used as a reference for the second mode.
- the amplifier may comprise a current feedback instrumentation amplifier or any other type of instrumentation amplifier.
- the system may comprise an analog to digital converter for converting the output of the amplifier to a digital signal. It may comprise a successive approximation analog to digital converter.
- the system may comprise two electrodes for current injection and two electrodes for capture of a signal for amplification by the amplifier. However, the system may be scaled with one pair of current injection electrodes and multiple pairs of signal readout electrodes at different locations.
- the analog injection current may have no component below 100Hz and the system further comprises an ECG monitor which comprises a low pass filter at the amplifier output.
- the bio-impedances changes which are of interest are caused by physiological behaviors at high frequencies. At very low frequency ( ⁇ 1kHz) or at very high frequency (>1 MHz), the bio-impedance is almost constant regardless of the physiological behaviors. There are many artifacts or aggressors at low frequency during a bio-impedance measurement, such as motion artifacts, 1/ f noise, mains interference (50/60Hz) and the ECG signal, and these significantly reduce the impedance measurement accuracy. Bio-impedance is thus not measured in these frequency ranges. However, the same single readout channel may be used for ECG measurements for example.
- Examples in accordance with another aspect provide a bio-impedance measurement method, comprising: generating a signal with a broadband frequency spectrum; generating an analog injection current from the signal, wherein the analog injection current has a high pass frequency characteristic; measuring voltages in response to the analog injection signal; and measuring biopotential signals from the subject; analyzing the voltages to derive a bio-impedance spectrum and analyzing the biopotential signals to obtain further information.
- This method provides an impedance spectroscopy method for bio-impedance measurement in which a signal is generated with a broadband frequency spectrum, and an analog injection current is derived from the signal, wherein the analog injection signal has a high pass frequency characteristic.
- the voltages and biopotential signals measured provide multi-parameter analysis including bio-impedance spectrum analysis as well as biopotential analysis such as ECG or EEG and/or EMG analysis.
- the method may comprise: generating a digital maximal length sequence signal; applying digital differentiation; and performing digital to analog conversion, thereby to result in the high pass frequency characteristic.
- the invention provides an impedance spectroscopy system in which a signal is generated with a broadband frequency spectrum, and an analog injection current is derived from the signal.
- the analog injection current has a high pass frequency characteristic.
- An amplifier is used for measuring a voltage in response to the analog injection signal, but also containing biopotential information (e.g., ECG. EMG or EEG), from which a bio-impedance spectrum as well as other parameters may be obtained.
- biopotential information e.g., ECG. EMG or EEG
- An amplifier is used for measuring a biopotential impedance spectrum in response to the analog injection signal.
- This system makes use of an injection current with a high pass frequency characteristic so that the injection current increases with frequency. This compensates for the typical bio-impedance behavior so that the signal to noise ratio of the system is more uniform over frequency.
- FIG. 2 shows an example of an impedance spectroscopy system for bio-impedance measurement.
- the system comprises an electrode array 20 for application to tissue 22 to be analyzed. There is a further electrode (now shown) for grounding the tissue 22.
- a first signal processing portion 24 is provided on chip (as an application specific integrated circuit, ASIC) for locally processing the signals delivered to and captured from the tissue. It implements analog signal processing and analog to digital conversion and digital to analog conversion.
- ASIC application specific integrated circuit
- the second signal processing portion 26 comprises a signal generator 28 for generating a digital signal 29 with a broadband frequency spectrum.
- the broadband frequency spectrum for example includes the range 1kHz to 100kHz.
- the first signal processing portion 24 has a current source 30 for generating an analog injection current from the digital signal 29. Digital to analog conversion is effectively implemented by the current source 30.
- the analog injection current is driven so that it flows between a first pair of electrodes 32 of the electrode array 20.
- the analog injection current has a high pass frequency characteristic, by which is meant the current amplitude tails off at low frequencies.
- An analog to digital converter 36 generating a digital signal which is coupled back to the second signal processing portion 26 where digital signal processing takes place.
- the analog to digital converter (ADC) for example comprises a power efficient 12 bit successive approximation ADC.
- the digital signal processing comprises spectral analysis using a Fast Fourier Transform (FFT) which is controlled in synchronism with the original digital signal 29 generated by the signal generator 28, by means of the sync unit 40. From the spectral analysis, a complex impedance is derived as a function of frequency, in unit 42. The magnitude and phase of the bio-impedance is thereby determined.
- the first signal processing unit portion also includes test terminals 44.
- FIG. 2 is a four-electrode system (plus ground), using two stimulation electrodes 32 for current injection, and two recording electrodes 46 for bio-impedance acquisition, and these may also be used for ECG acquisition as explained further below.
- a four electrode configuration reduces the measurement error induced by electrode-tissue impedance (ETI), which is the major issue of a two electrode system in which the same electrodes are used for current injection as for signal measurement. In such a case, the electrode-tissue impedance is also measured, and thus cannot be distinguished from the bio-impedance.
- ETI electrode-tissue impedance
- the approach of the invention may also be applied to a two electrode system.
- the system can be extended to include multiple pairs of recording electrodes and associated amplifiers but with a shared pair of current injection electrodes.
- An external floating high pass filter 48 (1M ⁇ and 22nF) at the current source output blocks any DC current flowing to the tissue 22, while another high pass filter 50 (10M ⁇ and 100nF) provides biasing to the amplifier and blocks electrode offset to prevent saturation of the readout circuit.
- the digital signal 29 comprises a maximal length sequence (MLS). This has a flat frequency spectrum.
- the current source 30 supports two modes of operation. A first mode is the standard MLS mode, and a second (new) mode is a differentiated MLS mode (which will be termed "DMLS"). The differentiation is implemented in the digital domain in the second signal processing portion 26.
- the current source 30 In normal MLS mode, the current source 30 outputs 1-bit MLS current pulses with magnitude ⁇ Iref.
- the MLS sequence has frequency components at f s k/(2 n -1), where f s is the MLS sampling frequency, n is the MLS order and 0 ⁇ k ⁇ 2 n -1.
- the magnitude of the MLS current (Iref) can be set in a range of 1-100 ⁇ A pp , where "pp" denotes peak to peak, and results in uniformly spread frequency components with equal magnitude, due to the properties of MLS.
- the bio-impedance is typically measured at high frequencies (10kHz-100kHz) where current starts penetrating into the cell as shown in Figure 1 .
- the dynamic bio-impedance (0.1 ⁇ -10 ⁇ ) at high frequencies can be several orders of magnitude less than the baseline static bio-impedance (10 ⁇ -1k ⁇ ).
- the voltage gain of the amplifier should be limited and a high-resolution ADC 36 is normally required, resulting in increased power consumption.
- the current source 30 is configurable to the differentiated DMLS mode, where a digital differentiator (1-Z -1 )/2 is applied to the normal MLS before the actual digital to analog conversion (as implemented by the current source 30 ), resulting in the desired high pass frequency characteristic.
- the current source 30 is in this way adjusted to support tri-level outputs: ⁇ Iref and 0. It may be considered to have a 1.5 bit output.
- the DMLS compensates for the bio-impedance behavior that tends to have a low-pass frequency characteristic.
- the DMLS improves sensitivity at higher frequencies and relaxes the dynamic range requirements, thus saving power. Furthermore, the DMLS spectrum has low current magnitudes at low frequencies, which complies with bio-excitation limits that restrict low-frequency excitation current to the body. On the other hand, the DMLS spectrum has a higher magnitude at high frequencies, which compensates the bandwidth roll-off of the instrumentation amplifier and improves the signal to noise ratio above the bandwidth of the amplifier.
- Figure 3 shows the current source 30. It comprises a current source 60 and a switching arrangement 62 for coupling the current source to the two excitation electrodes 32 in the two possible current flow directions.
- the current source is connected to one of the excitation electrodes by one switch and the other is connected to one of a pair of power supply terminal 33 by another switch.
- Figure 4 shows an example of instrumentation amplifier circuit. It uses a current feedback architecture, for example as described more fully in R. F. Yazicioglu, P. Merken, et al., "A 60 ⁇ W 60 nV/ ⁇ Hz Readout Front-End for Portable Biopotential Acquisition Systems," IEEE J. Solid-State Circuits, pp. 1100-1110, May 2007 .
- a transconductance input stage 70 converts the input voltage into current, which is mirrored to a transimpedance (TI) stage 72 and converted to the output voltage via an output resistor Ro.
- the instrumentation amplifier gain is determined by a ratio of an output resistance to an input resistance, Ro/Ri.
- the input resistance Ri programmable, for example from 10k ⁇ to 175k ⁇ , and Ro fixed, for example to 700k ⁇ , there is a variable gain setting of 4, 17 and 70, while maintaining a constant bandwidth.
- the maximum input dynamic range is determined by R i I b , which is 15mV at the highest gain of 70.
- R i I b the maximum input dynamic range
- Figure 5 shows the analog to digital converter 36 in more detail. It comprises an asynchronous successive approximation (SAR) ADC. It is for example similar to the design described in P. Harpe, et al., "A 7-to-10b 0-to-4MS/s flexible SAR ADC with 6.5-16fJ/conversion-step", Digest ISSCC pp.472-474, Feb. 2012 , but features a higher resolution of 12b, and a higher sampling rate (0-5MS/s). As a result of the dynamic circuitry, its power consumption scales proportionally to the sampling rate to accommodate system configurability.
- the internal DAC 80 for example utilizes a monotonic switching scheme and metal finger capacitors of 0.5fF to save power and chip area.
- redundancy in the DAC and a 2-mode comparator 82 are used to tolerate DAC settling and comparator decision errors, leading to further power reduction.
- the small overall input capacitance of 1 pF relaxes the driving requirements for the amplifier while maintaining a sufficiently low kT/C sampling noise in the ADC.
- the high-pass characteristic of the DMLS results in about 25dB less energy than MLS. This may reduce the precision for DMLS at low frequencies.
- the DMLS has similar energy compared to the MLS as expected.
- the slow roll-off at higher frequencies for both signals is due to the DAC's sinc function.
- the high-pass function of the DMLS signal means that a higher injection current Iref could be used to improve the measurement performance while still meeting the low frequency current stimulation regulations.
- the measured bio-impedance spectrum is normalized to data obtained from a reference resistor measurement. In this way, all gain, phase and frequency dependencies of the entire system can be compensated and a higher measurement accuracy and bandwidth can be obtained.
- the injected MLS signal can be adjusted to only contain energy above 1 kHz (or only above a lower threshold such as 300Hz or 100Hz). In that way, the readout circuit can simultaneously measure a low-frequency ECG signal and a high-frequency bio-impedance signal. Furthermore, the time-variance of the measured bio-impedance can also acquire respiration simultaneously.
- Figure 7 shows the Cole-Cole plot of an ideal RC bio-impedance model (as shown in Figure 1A ) as plot 100 and shows the MLS and DMLS based measurements.
- the solid circles 102 show the MLS measurements and the open circles 104 show the DMLS measurements.
- a 250kS/s 6th-order MLS/DMLS stimulation current is used to cover a wide frequency range from 4kHz to 125kHz, and 50 ⁇ A pp current is selected for precision.
- the ADC 36 is sampled at 2MS/s and a reference measurement uses a 33 ⁇ resistor. For compensating gain, phase and frequency dependencies as mentioned above.
- the MLS-based measurement confirms that the circuit is able to capture complex impedances over a wide frequency range.
- the DMLS-based measurement shows less precision at low frequencies because the stimulation current is about 25dB lower compared to MLS (as seen in Figure 6 ).
- the DMLS has similar performance as the MLS above 20kHz, while injecting much less low-frequency current.
- the measurement time is only 125ms (including averaging 256 measurements for noise reduction), and the power consumption of the first signal processing portion 24 (implemented as an ASIC) is 155 ⁇ W, including 91 ⁇ W from the current source DAC 30, 12.6 ⁇ W for the amplifier 34 and 51 ⁇ W for the ADC 36 sampling at 2MS/s.
- the DMLS mode of operation is used for high frequency measurement with low current injection, while the MLS mode is used for low frequency measurement for better accuracy, or when the current injection amplitude is not limited.
- the gain of the instrumentation amplifier is desired for the best use of the output dynamic range.
- ECG measured at the chest has a larger amplitude (about 5mV) than measured at wrist (about 1 mV), while the bio-impedance measured between wrists (about 100 Ohm) is higher than measured at the wrist (about 10 Ohm).
- the amplifier gain is adjustable between a set of values.
- This example has three different gain settings, but this is merely by way of example.
- the raw data is delivered by the ADC 36 in step 110 for example at 20k samples per second.
- a 6th-order 10 ⁇ A pp DMLS current is for example used for long-term and low power stimulation.
- the lowest AC component of this signal is at 317Hz to avoid overlap with the ECG.
- the ECG is recovered after a 100Hz low pass filtering step in step 112.
- the filtered signal is used for ECG monitoring in step 114.
- step 116 The same raw data undergoes the processing of the second signal processing portion 26, namely the synchronization, correlation and FFT analysis using the (D)MLS signal as the reference. This is all shown as step 116.
- step 118 The construction of the bio-impedance spectrum is shown as step 118.
- the bio-impedance is derived from correlation with the (D)MLS reference signal, resulting in one FFT per MLS sequence (317 FFTs/s). Respiration is derived from bio-impedance modulation at high frequencies. Averaging over a range 7k-10kHz is performed in step 120 so that the slower respiration variations remain, before extracting the respiration information in step 122.
- FIG 9 shows the power density spectrum (PSD) of the captured signal.
- the ECG signal occupies a lower bandwidth region 130 and the bio-impedance signal occupies a higher bandwidth region 132.
- the two measurements are taken at the same time, but located at different bandwidth.
- the separation of two types of signals is performed in the digital domain when all the signals are digitized, using digital low pass filter 112.
- Figure 10 shows the simultaneous recording of ECG and respiration, where stimulation electrodes were placed on the left and right wrists, and two recording electrodes were laced on the chest. Bio-impedance variation (2 ⁇ pp ) due to respiration and ECG are detected simultaneously.
- the top plot shows the modulus of the measured impedance (as averaged over the frequency range 7kHz to 10kHz) and the bottom plot shows the ECG signal. The effect of the ECG waveform can also be seen in the top respiration plot.
- the system thus provides a single channel output (the 20kS/s digital signal) which is then processed to provide multi-parameter analysis.
- ECG signals and biopotential signals.
- EEG signals in which biopotentials are measured on the scalp. These biopotential signals may for example be analyzed to determine the biospectral index (BIS) which is used for determining the depth of anesthesia.
- BIOS biospectral index
- the amplifier achieved 40nV/ ⁇ Hz input referred noise density above 1kHz, corresponding to a 40m ⁇ / ⁇ Hz sensitivity (with 1 ⁇ A excitation current at each MLS frequency).
- the amplifier is only connected to the on-chip ADC, which has only 1pF input capacitance.
- the amplifier consumed 7.3 ⁇ A current and has CMRR and PSRR (including the external high pass filter) of 62dB and 75dB, respectively.
- the ADC achieves a 10.4b effective number of bits (ENOB) for input signals up to 50kHz and sampling rates of 100kS/s and 5MS/s.
- the ENOB gradually degrades.
- the power consumption of the ADC scales linearly with the sampling rate up to 128 ⁇ W at 5MS/s and down to 8nW leakage power.
- the achieved Figure of Merit (FoM) was 20fJ/conversion-step.
- the overall power consumption was 31 ⁇ W, including 18.1 ⁇ W from the current source DAC, 12.6 ⁇ W for the amplifier and 0.5 ⁇ W for the ADC sampling at 20kS/s.
- a calibration process prior to real bio-impedance measurement enables better measurement accuracy.
- a well-defined test resistor or more generally impedance
- Rref is first measured as a reference as shown in Figure 11A . This gives rise to a test frequency response shown as 140.
- the bio-impedance is measured as shown in Figure 11 B giving the frequency response shown as 142.
- the calibration compensates the non-ideal transfer function of the system, including the current source digital to analog converter, the bio-impedance electrode interface and the readout channel.
- the calibration involves setting the product of the measured impedance spectrum with the actual impedance spectrum as a constant. This product is known from the analysis of the known reference impedance.
- pseudo noise sequences may be shaped to provide the desired high pass frequency characteristic. This may be achieved by implementing digital weighting or analog signal transformation (using a high pass filter).
- a first order filter may be used to generate the MLS sequence, and digital differentiation implements the high pass frequency characteristic.
- a higher order digital filter may be used to generate a shaped sequence thereby implementing the high pass frequency characteristic at source.
- a broad frequency spectrum signal may be implemented based on a chirped signal.
- the high pass frequency characteristic of the injection current may have a smooth function with respect to frequency as shown in Figure 6 , but it may also be stepped.
- a chirped signal may have discrete frequency steps, each associated with a particular current level.
- High pass filtering has been shown above implemented in the digital domain. It can also be implemented in analog domain after the digital to analogue converter.
- the excitation signal is not only limited to MLS, other type of signals are also possible, such as multi-sine signals, where multiple-frequency sine waves with the same amplitude are injected at the same time, or a chirp, where high-pass filtering can be performed between the fmin and fmax (or the flat band) of a chirp signal.
- the invention is of interest generally for the simultaneous measurement of a bio-impedance spectrum as well as the analysis of biopotential information, by which is meant electrical signals generated by the body without the need for a stimulus.
- ECG, EEG and EMG are common non-limiting examples of information which can be derived from such biopotential signals.
Landscapes
- Health & Medical Sciences (AREA)
- Life Sciences & Earth Sciences (AREA)
- Engineering & Computer Science (AREA)
- Physics & Mathematics (AREA)
- Biomedical Technology (AREA)
- General Health & Medical Sciences (AREA)
- Pathology (AREA)
- Molecular Biology (AREA)
- Biophysics (AREA)
- Veterinary Medicine (AREA)
- Surgery (AREA)
- Public Health (AREA)
- Animal Behavior & Ethology (AREA)
- Heart & Thoracic Surgery (AREA)
- Medical Informatics (AREA)
- Chemical & Material Sciences (AREA)
- Physiology (AREA)
- Cardiology (AREA)
- Signal Processing (AREA)
- Computer Vision & Pattern Recognition (AREA)
- Artificial Intelligence (AREA)
- Psychiatry (AREA)
- Analytical Chemistry (AREA)
- Immunology (AREA)
- General Physics & Mathematics (AREA)
- Biochemistry (AREA)
- Food Science & Technology (AREA)
- Nuclear Medicine, Radiotherapy & Molecular Imaging (AREA)
- Chemical Kinetics & Catalysis (AREA)
- Spectroscopy & Molecular Physics (AREA)
- Radiology & Medical Imaging (AREA)
- Optics & Photonics (AREA)
- Hematology (AREA)
- Urology & Nephrology (AREA)
- Electrochemistry (AREA)
- Medicinal Chemistry (AREA)
- Power Engineering (AREA)
- Pulmonology (AREA)
- Measurement And Recording Of Electrical Phenomena And Electrical Characteristics Of The Living Body (AREA)
- Investigating Or Analyzing Materials By The Use Of Electric Means (AREA)
Abstract
Description
- This invention relates to the measurement of bio-impedance, in particular complex bio-impedance values over a broad range of frequencies, in order to implement a spectral bio-impedance analysis.
- Non-invasive wearable medical devices for lifestyle and healthcare are increasingly being used for monitoring chronic diseases and detecting early health problems. Congestive heart failure (CHF), a chronic heart failure characterized by fluid overload, is one of the major conditions with detrimental effects on quality of life, and potentially fatal.
- Bio-impedance analysis (BIA) has been clinically used to track congestive heart failure. By injecting a low-level AC current to a body segment, a voltage proportional to the tissue impedance can be measured. Bio-impedance is used to estimate various physiochemical and physiological states, such as thoracic fluid, respiration, skin hydration and body composition.
- ECG is often used as a diagnosis tool of congestive heart failure, by measuring the electrical activity in the heart to detect coronary artery diseases and heart attacks. Therefore, simultaneous measurement of the bio-impedance and ECG can extend the range of extracted biomedical information for improved diagnosis accuracy.
- Bio-impedance can be measured at single-frequency (SF), multifrequencies (MF), or by impedance spectroscopy (IS). Single-frequency measurement has the advantage of high signal-to-noise ratio (SNR). However, in order to extract the RC components of a complex bio-impedance network, impedance should be measured at several frequencies.
-
Figure 1A shows an equivalent model of the bio-impedance of a cellular organism. Theextra-cellular region 10 is modeled by a series (external) resistance Re in a first branch, and theintra-cellular region 12 is modeled by a second branch of cell wall capacitors Cm in series with an (internal) resistance Ri. The two branches are in parallel.Figure 1B shows the current flowing. Alow frequency current 14 flows through the extra-cellular regions and ahigh frequency current 16 flows through the intra-cellular regions. - State-of-the-art multi-frequency implementations, relying on analog signal processing, where bio-impedance measurement is performed separately at each frequency, can lead to an increased acquisition time. In addition, simultaneous bio-impedance and ECG measurement increases the system complexity and power by using two separate readout circuits.
- Impedance spectroscopy (IS) can lead to shorter acquisition time and analog hardware simplicity by measuring the whole spectrum (including bio-impedance and ECG) simultaneously. This is realized by using a wideband stimulation signal, such as a chirp, square wave or pseudo-random sequence.
- A chirp often leads to a low signal to noise ratio (SNR), as the current magnitude is spread over the whole bandwidth. A square wave is easy to generate, but it suffers from lower magnitudes at higher frequencies. Compared to these, a maximal length sequence (MLS), i.e. a pseudo random pulse sequence with an equally distributed power spectrum, maintains an even SNR throughout the entire frequency range, while still allocating sufficient magnitude to each frequency bin. Besides, the MLS signal is easy to generate. These features make the MLS stimulation source suitable for low-power wideband bio-impedance analysis or bio-impedance spectroscopy. This approach has for example been disclosed in T. Sun, D. Holmes, et al, "High speed multi-frequency impedance analysis of single particles in a microfluidic cytometer using maximum length sequences", Lab on a Chip, issue 7, pp. 1034-1040, Aug, 2007.
- A bio-impedance spectroscopy circuit should be able to detect very small dynamic impedance variations (e.g. <0.1Ω) superimposed on a large static impedance (e.g. 10Ω - 1kΩ) across a wide frequency range (e.g. 1kHz - 100kHz), while only using a low stimulation current (e.g. <100uA@10kHz).
- To meet these targets, however, conventional bio-impedance spectroscopy circuits utilize wideband amplifiers (typically >100kHz) and highspeed high-resolution ADCs, which are both power hungry components. This is because both the amplifier and the ADC must have a bandwidth at least equal to the maximum frequency of the bio-impedance spectroscopy.
- In addition to the above, an ECG acquisition circuit should achieve low noise (e.g. 1µVRMS) at low frequencies (e.g. <150Hz), with the capability to tolerate a large electrode offset (e.g. ±300mV). In order to minimize the mains interference, the readout circuit should also have good power supply rejection ratio (PSRR) and common mode rejection ratio (CMRR).
- There is therefore a need for a power-efficient circuit for bio-impedance spectroscopy which can be implemented at low cost.
- Aspects of the invention are defined by the claims.
- According to an exemplary embodiment, there is provided an impedance spectroscopy system for bio-impedance measurement, comprising: a signal generator for generating a signal with a broadband frequency spectrum, and generating an analog injection current from the signal, wherein the analog injection signal has a high pass frequency characteristic; an amplifier for measuring a voltage signal in response to the analog injection current and simultaneously a biopotential signal; and a processor for analyzing the voltage signal to derive a bio-impedance spectrum as well to derive further information from the biopotential signal.
- This system makes use of an injection current with a high pass frequency characteristic so that the injection current increases with frequency. This compensates for the typical bio-impedance behavior which typically has a low pass characteristic. By this is meant that the impedance is greater at lower frequencies and therefore more easily measured. By reducing the injection current at lower frequencies using a high pass characteristic, the overall signal to noise ratio of the system is flattened with respect to frequency, so that a more constant signal to noise ratio is achieved during a bio-impedance spectral analysis. The system also derives further information from a biopotential signal measurement, for example the further information may comprise as ECG, EEG, or EMG signal.
- Note that the term "biopotential signal" is used to refer to a voltage signal that is directly generated from the subject, such as an ECG, EEG or EMG signal. For bio-impedance measurement, the voltage is not directly generated from the subject, but is derived from a stimulation current which then enables the bio-impedance to be determined.
- The system thus provides simultaneous multi-parameter measurements using a single voltage readout channel. An ECG signal may for example be obtained simultaneously with the bio-impedance spectroscopy (BIS) information, and separated by further signal processing
- According to an exemplary embodiment, the system also enables a lower bandwidth amplifier to be used, because the frequency characteristic (in particular rolling off) of the amplifier is compensated by the analog injection signal, such that the effective bandwidth of the readout circuit can be increased.
- The generated signal for example comprises a wideband stimulation current source which is actuated by a pseudo-random binary sequence.
- The system may comprise a digital to analog converter for generating the analog injection current from the signal. It may for example comprise a current injection circuit for injecting current in dependence on a digital input.
- The signal generator may comprise a maximal length sequence generator for generating a digital maximal length sequence signal. This type of sequence has an equally distributed power spectrum. By additionally introducing a high pass characteristic, the injection signal is better adapted to the nature of the bio-impedance to be measured as well as the amplifier characteristics.
- The signal generator may further comprise a (digital or analog) differentiator for applying differentiation, thereby to result in the high pass frequency characteristic. The differentiation may be digital and implemented before the digital to analog conversion. The differentiation implements the high pass characteristic and converts a two level signal into a three level signal. This also has the advantage that the power of the analog signal is reduced, if one of the three levels is a zero level. The analog injection signal may be a three level current signal with a zero level, a positive level and a negative level.
- The signal generator may be controllable in a first mode to output a maximal length sequence and in a second mode to output a differentiated maximal length sequence. The maximum length sequence is for example used to give better signal to noise ratio at low frequencies. The first mode may also be used as a reference for the second mode.
- The amplifier may comprise a current feedback instrumentation amplifier or any other type of instrumentation amplifier.
- The system may comprise an analog to digital converter for converting the output of the amplifier to a digital signal. It may comprise a successive approximation analog to digital converter.
- The system may comprise two electrodes for current injection and two electrodes for capture of a signal for amplification by the amplifier. However, the system may be scaled with one pair of current injection electrodes and multiple pairs of signal readout electrodes at different locations.
- The analog injection current may have no component below 100Hz and the system further comprises an ECG monitor which comprises a low pass filter at the amplifier output.
- The bio-impedances changes which are of interest are caused by physiological behaviors at high frequencies. At very low frequency (<1kHz) or at very high frequency (>1 MHz), the bio-impedance is almost constant regardless of the physiological behaviors. There are many artifacts or aggressors at low frequency during a bio-impedance measurement, such as motion artifacts, 1/f noise, mains interference (50/60Hz) and the ECG signal, and these significantly reduce the impedance measurement accuracy. Bio-impedance is thus not measured in these frequency ranges. However, the same single readout channel may be used for ECG measurements for example.
- Examples in accordance with another aspect provide a bio-impedance measurement method, comprising: generating a signal with a broadband frequency spectrum; generating an analog injection current from the signal, wherein the analog injection current has a high pass frequency characteristic; measuring voltages in response to the analog injection signal; and measuring biopotential signals from the subject; analyzing the voltages to derive a bio-impedance spectrum and analyzing the biopotential signals to obtain further information.
- This method provides an impedance spectroscopy method for bio-impedance measurement in which a signal is generated with a broadband frequency spectrum, and an analog injection current is derived from the signal, wherein the analog injection signal has a high pass frequency characteristic. The voltages and biopotential signals measured provide multi-parameter analysis including bio-impedance spectrum analysis as well as biopotential analysis such as ECG or EEG and/or EMG analysis. The method may comprise: generating a digital maximal length sequence signal; applying digital differentiation; and performing digital to analog conversion, thereby to result in the high pass frequency characteristic.
- Examples of the invention will now be described in detail, with reference to the accompanying drawings, in which:
-
Figures 1 A and 1B show a model of the impedance of a cellular organism and the currents flowing. -
Figure 2 shows an impedance spectroscopy system. -
Figure 3 shows the injection current source in more detail. -
Figure 4 shows the instrumentation amplifier in more detail. -
Figure 5 shows the analog to digital converter in more detail. -
Figure 6 shows the high pass frequency characteristic applied to the analog injection current. -
Figure 7 shows the measured impedance as a function of frequency. -
Figure 8 shows how the system may perform simultaneous ECG monitoring, bio-impedance measurement and respiration tracking. -
Figure 9 shows how an ECG signal and bio-impedance signal of interest occupy different frequency bands. -
Figure 10 is a graph to show how respiration tracking and ECG monitoring are performed. -
Figures 11A and11 B are used to explain a calibration process. - The invention provides an impedance spectroscopy system in which a signal is generated with a broadband frequency spectrum, and an analog injection current is derived from the signal. The analog injection current has a high pass frequency characteristic. An amplifier is used for measuring a voltage in response to the analog injection signal, but also containing biopotential information (e.g., ECG. EMG or EEG), from which a bio-impedance spectrum as well as other parameters may be obtained.
- An amplifier is used for measuring a biopotential impedance spectrum in response to the analog injection signal.
- This system makes use of an injection current with a high pass frequency characteristic so that the injection current increases with frequency. This compensates for the typical bio-impedance behavior so that the signal to noise ratio of the system is more uniform over frequency.
-
Figure 2 shows an example of an impedance spectroscopy system for bio-impedance measurement. The system comprises anelectrode array 20 for application totissue 22 to be analyzed. There is a further electrode (now shown) for grounding thetissue 22. A firstsignal processing portion 24 is provided on chip (as an application specific integrated circuit, ASIC) for locally processing the signals delivered to and captured from the tissue. It implements analog signal processing and analog to digital conversion and digital to analog conversion. A second, off-chip,signal processing portion 26, for example a field programmable gate array (FPGA), is also provided for digital signal processing. The analog signals are thus kept as close to the electrode array as possible. - The second
signal processing portion 26 comprises asignal generator 28 for generating adigital signal 29 with a broadband frequency spectrum. The broadband frequency spectrum for example includes the range 1kHz to 100kHz. The firstsignal processing portion 24 has acurrent source 30 for generating an analog injection current from thedigital signal 29. Digital to analog conversion is effectively implemented by thecurrent source 30. The analog injection current is driven so that it flows between a first pair ofelectrodes 32 of theelectrode array 20. The analog injection current has a high pass frequency characteristic, by which is meant the current amplitude tails off at low frequencies. - The first signal processing portion has an
amplifier 34 for measuring a biopotential value in response to the analog injection current. It comprises a low noise instrumentation amplifier with a variable gain, for example with three possible gain settings (e.g. G=4, 17 or 70). An analog todigital converter 36 generating a digital signal which is coupled back to the secondsignal processing portion 26 where digital signal processing takes place. The analog to digital converter (ADC) for example comprises a power efficient 12 bit successive approximation ADC. - The digital signal processing comprises spectral analysis using a Fast Fourier Transform (FFT) which is controlled in synchronism with the original
digital signal 29 generated by thesignal generator 28, by means of thesync unit 40. From the spectral analysis, a complex impedance is derived as a function of frequency, inunit 42. The magnitude and phase of the bio-impedance is thereby determined. The first signal processing unit portion also includestest terminals 44. - The example of
Figure 2 is a four-electrode system (plus ground), using twostimulation electrodes 32 for current injection, and tworecording electrodes 46 for bio-impedance acquisition, and these may also be used for ECG acquisition as explained further below. - A four electrode configuration reduces the measurement error induced by electrode-tissue impedance (ETI), which is the major issue of a two electrode system in which the same electrodes are used for current injection as for signal measurement. In such a case, the electrode-tissue impedance is also measured, and thus cannot be distinguished from the bio-impedance.
- However, the approach of the invention may also be applied to a two electrode system. Similarly, the system can be extended to include multiple pairs of recording electrodes and associated amplifiers but with a shared pair of current injection electrodes.
- An external floating high pass filter 48 (1MΩ and 22nF) at the current source output blocks any DC current flowing to the
tissue 22, while another high pass filter 50 (10MΩ and 100nF) provides biasing to the amplifier and blocks electrode offset to prevent saturation of the readout circuit. - In one example, the
digital signal 29 comprises a maximal length sequence (MLS). This has a flat frequency spectrum. In order to implement the high pass frequency characteristic explained above, thecurrent source 30 supports two modes of operation. A first mode is the standard MLS mode, and a second (new) mode is a differentiated MLS mode (which will be termed "DMLS"). The differentiation is implemented in the digital domain in the secondsignal processing portion 26. - In normal MLS mode, the
current source 30 outputs 1-bit MLS current pulses with magnitude ±Iref. The MLS sequence has frequency components at fsk/(2n-1), where fs is the MLS sampling frequency, n is the MLS order and 0≤k≤2n-1. Thus, by simply choosing the MLS sample rate fs and the MLS order n, the stimulated bandwidth and the number of frequency points can be selected conveniently in the digital domain. The magnitude of the MLS current (Iref) can be set in a range of 1-100µApp, where "pp" denotes peak to peak, and results in uniformly spread frequency components with equal magnitude, due to the properties of MLS. - The bio-impedance is typically measured at high frequencies (10kHz-100kHz) where current starts penetrating into the cell as shown in
Figure 1 . The dynamic bio-impedance (0.1Ω-10Ω) at high frequencies can be several orders of magnitude less than the baseline static bio-impedance (10Ω-1kΩ). To accommodate this very large dynamic range, the voltage gain of the amplifier should be limited and a high-resolution ADC 36 is normally required, resulting in increased power consumption. - To mitigate this tradeoff, the
current source 30 is configurable to the differentiated DMLS mode, where a digital differentiator (1-Z-1)/2 is applied to the normal MLS before the actual digital to analog conversion (as implemented by the current source 30), resulting in the desired high pass frequency characteristic. Thecurrent source 30 is in this way adjusted to support tri-level outputs: ±Iref and 0. It may be considered to have a 1.5 bit output. The DMLS compensates for the bio-impedance behavior that tends to have a low-pass frequency characteristic. - In this way, the DMLS improves sensitivity at higher frequencies and relaxes the dynamic range requirements, thus saving power. Furthermore, the DMLS spectrum has low current magnitudes at low frequencies, which complies with bio-excitation limits that restrict low-frequency excitation current to the body. On the other hand, the DMLS spectrum has a higher magnitude at high frequencies, which compensates the bandwidth roll-off of the instrumentation amplifier and improves the signal to noise ratio above the bandwidth of the amplifier.
-
Figure 3 shows thecurrent source 30. It comprises acurrent source 60 and a switchingarrangement 62 for coupling the current source to the twoexcitation electrodes 32 in the two possible current flow directions. The current source is connected to one of the excitation electrodes by one switch and the other is connected to one of a pair ofpower supply terminal 33 by another switch. In the DMLS mode, there is anotherbranch 63 for providing a zero current level. -
Figure 4 shows an example of instrumentation amplifier circuit. It uses a current feedback architecture, for example as described more fully in R. F. Yazicioglu, P. Merken, et al., "A 60 . Atransconductance input stage 70 converts the input voltage into current, which is mirrored to a transimpedance (TI)stage 72 and converted to the output voltage via an output resistor Ro. As a result, the instrumentation amplifier gain is determined by a ratio of an output resistance to an input resistance, Ro/Ri. By making the input resistance Ri programmable, for example from 10kΩ to 175kΩ, and Ro fixed, for example to 700kΩ, there is a variable gain setting of 4, 17 and 70, while maintaining a constant bandwidth. - The maximum input dynamic range is determined by RiIb, which is 15mV at the highest gain of 70. On system level, thanks to a calibration resistor measurement (discussed further below) and the DMLS mode, bio-impedance measurements up to 125kHz are possible, well beyond the bandwidth of the amplifier of 35kHz in this example.
-
Figure 5 shows the analog todigital converter 36 in more detail. It comprises an asynchronous successive approximation (SAR) ADC. It is for example similar to the design described in P. Harpe, et al., "A 7-to-10b 0-to-4MS/s flexible SAR ADC with 6.5-16fJ/conversion-step", Digest ISSCC pp.472-474, Feb. 2012, but features a higher resolution of 12b, and a higher sampling rate (0-5MS/s). As a result of the dynamic circuitry, its power consumption scales proportionally to the sampling rate to accommodate system configurability. Theinternal DAC 80 for example utilizes a monotonic switching scheme and metal finger capacitors of 0.5fF to save power and chip area. Further, redundancy in the DAC and a 2-mode comparator 82 are used to tolerate DAC settling and comparator decision errors, leading to further power reduction. On system-level, the small overall input capacitance of 1 pF relaxes the driving requirements for the amplifier while maintaining a sufficiently low kT/C sampling noise in the ADC. -
Figure 6 shows an MLS spectrum asplot 90 and a differentiated MLS spectrum (i.e. the DMLS signal as explained above) asplot 92, both for a 6th order sequence with fs=250kHz and with an identical injection current Iref. At low frequencies, the high-pass characteristic of the DMLS results in about 25dB less energy than MLS. This may reduce the precision for DMLS at low frequencies. For higher frequencies, the DMLS has similar energy compared to the MLS as expected. The slow roll-off at higher frequencies for both signals is due to the DAC's sinc function. The high-pass function of the DMLS signal means that a higher injection current Iref could be used to improve the measurement performance while still meeting the low frequency current stimulation regulations. - In the digital second
signal processing portion 26, the measured bio-impedance spectrum is normalized to data obtained from a reference resistor measurement. In this way, all gain, phase and frequency dependencies of the entire system can be compensated and a higher measurement accuracy and bandwidth can be obtained. - Since bio-impedance is usually measured above 1 kHz, the injected MLS signal can be adjusted to only contain energy above 1 kHz (or only above a lower threshold such as 300Hz or 100Hz). In that way, the readout circuit can simultaneously measure a low-frequency ECG signal and a high-frequency bio-impedance signal. Furthermore, the time-variance of the measured bio-impedance can also acquire respiration simultaneously.
-
Figure 7 shows the Cole-Cole plot of an ideal RC bio-impedance model (as shown inFigure 1A ) asplot 100 and shows the MLS and DMLS based measurements. Thesolid circles 102 show the MLS measurements and theopen circles 104 show the DMLS measurements. For the bio-impedance, Ri=33Ω, Re=33Ω and Cm=220nF are selected as typical bio-impedance values measured on chest. A 250kS/s 6th-order MLS/DMLS stimulation current is used to cover a wide frequency range from 4kHz to 125kHz, and 50µApp current is selected for precision. - The
ADC 36 is sampled at 2MS/s and a reference measurement uses a 33Ω resistor. For compensating gain, phase and frequency dependencies as mentioned above. - The MLS-based measurement confirms that the circuit is able to capture complex impedances over a wide frequency range. The DMLS-based measurement shows less precision at low frequencies because the stimulation current is about 25dB lower compared to MLS (as seen in
Figure 6 ). However, the DMLS has similar performance as the MLS above 20kHz, while injecting much less low-frequency current. The measurement time is only 125ms (including averaging 256 measurements for noise reduction), and the power consumption of the first signal processing portion 24 (implemented as an ASIC) is 155µW, including 91µW from thecurrent source DAC 30, 12.6µW for theamplifier 34 and 51µW for theADC 36 sampling at 2MS/s. - The DMLS mode of operation is used for high frequency measurement with low current injection, while the MLS mode is used for low frequency measurement for better accuracy, or when the current injection amplitude is not limited.
- When input signal is large, the gain of the instrumentation amplifier is desired for the best use of the output dynamic range. For example ECG measured at the chest has a larger amplitude (about 5mV) than measured at wrist (about 1 mV), while the bio-impedance measured between wrists (about 100 Ohm) is higher than measured at the wrist (about 10 Ohm). For this reason, the amplifier gain is adjustable between a set of values. This example has three different gain settings, but this is merely by way of example.
- To record ECG and respiration simultaneously in-vivo, a data extraction process as shown in
Figure 8 may be used. - The raw data is delivered by the
ADC 36 instep 110 for example at 20k samples per second. A 6th-order 10µApp DMLS current is for example used for long-term and low power stimulation. The lowest AC component of this signal is at 317Hz to avoid overlap with the ECG. The ECG is recovered after a 100Hz low pass filtering step instep 112. The filtered signal is used for ECG monitoring instep 114. - The same raw data undergoes the processing of the second
signal processing portion 26, namely the synchronization, correlation and FFT analysis using the (D)MLS signal as the reference. This is all shown asstep 116. The construction of the bio-impedance spectrum is shown asstep 118. - The bio-impedance is derived from correlation with the (D)MLS reference signal, resulting in one FFT per MLS sequence (317 FFTs/s). Respiration is derived from bio-impedance modulation at high frequencies. Averaging over a
range 7k-10kHz is performed instep 120 so that the slower respiration variations remain, before extracting the respiration information instep 122. -
Figure 9 shows the power density spectrum (PSD) of the captured signal. The ECG signal occupies alower bandwidth region 130 and the bio-impedance signal occupies ahigher bandwidth region 132. The two measurements are taken at the same time, but located at different bandwidth. The separation of two types of signals is performed in the digital domain when all the signals are digitized, using digitallow pass filter 112. -
Figure 10 shows the simultaneous recording of ECG and respiration, where stimulation electrodes were placed on the left and right wrists, and two recording electrodes were laced on the chest. Bio-impedance variation (2Ωpp) due to respiration and ECG are detected simultaneously. The top plot shows the modulus of the measured impedance (as averaged over the frequency range 7kHz to 10kHz) and the bottom plot shows the ECG signal. The effect of the ECG waveform can also be seen in the top respiration plot. - The system thus provides a single channel output (the 20kS/s digital signal) which is then processed to provide multi-parameter analysis. One example is given of ECG signals and biopotential signals. Another example is EEG signals, in which biopotentials are measured on the scalp. These biopotential signals may for example be analyzed to determine the biospectral index (BIS) which is used for determining the depth of anesthesia.
- The system described above has been implemented, and the performance and results will now be outlined. At the highest gain of 70, the amplifier achieved 40nV/√Hz input referred noise density above 1kHz, corresponding to a 40mΩ/√Hz sensitivity (with 1µA excitation current at each MLS frequency). In the bio-impedance measurement mode, the amplifier is only connected to the on-chip ADC, which has only 1pF input capacitance. The amplifier consumed 7.3µA current and has CMRR and PSRR (including the external high pass filter) of 62dB and 75dB, respectively. At 1.8V supply, the ADC achieves a 10.4b effective number of bits (ENOB) for input signals up to 50kHz and sampling rates of 100kS/s and 5MS/s. For higher input frequencies, the ENOB gradually degrades. The power consumption of the ADC scales linearly with the sampling rate up to 128µW at 5MS/s and down to 8nW leakage power. At 100kS/s, the achieved Figure of Merit (FoM) was 20fJ/conversion-step.
- When implementing the system of
Figure 8 , the overall power consumption was 31µW, including 18.1µW from the current source DAC, 12.6µW for the amplifier and 0.5µW for the ADC sampling at 20kS/s. - It has thus been demonstrated that the approach described above is able to measure bio-impedance from 1Ω to 10kΩ with a 0.1Ω resolution, and covers a frequency range up to 125kHz. In addition, the realized implementation of the system can simultaneously record ECG and respiration while consuming only 31µW from a 1.8V supply.
- As mentioned above, a calibration process, as shown in
Figure 11 , prior to real bio-impedance measurement enables better measurement accuracy. During the calibration, a well-defined test resistor (or more generally impedance) Rref is first measured as a reference as shown inFigure 11A . This gives rise to a test frequency response shown as 140. After this, the bio-impedance is measured as shown inFigure 11 B giving the frequency response shown as 142. - The calibration compensates the non-ideal transfer function of the system, including the current source digital to analog converter, the bio-impedance electrode interface and the readout channel. The calibration involves setting the product of the measured impedance spectrum with the actual impedance spectrum as a constant. This product is known from the analysis of the known reference impedance.
- Calibration with a simple resistor and MLS/DMLS stimulation enables a frequency range beyond the instrumentation amplifier bandwidth, leading to a low power system. In long-term measurements, power can be saved in the DAC and ADC by trading measurement speed or precision, as a result of the digital configurability.
- The invention has been described above implemented using an MLS sequence. However, other pseudo noise sequences may be shaped to provide the desired high pass frequency characteristic. This may be achieved by implementing digital weighting or analog signal transformation (using a high pass filter).
- In the example above, a first order filter may be used to generate the MLS sequence, and digital differentiation implements the high pass frequency characteristic. However a higher order digital filter may be used to generate a shaped sequence thereby implementing the high pass frequency characteristic at source. Instead of a pseudo-random sequence, a broad frequency spectrum signal may be implemented based on a chirped signal. One example of DAC, ADC and instrumentation amplifier has been given above. The invention can be applied with any DAC, ADC and amplifier design, and the above detailed implementation is purely by way of example.
- The high pass frequency characteristic of the injection current may have a smooth function with respect to frequency as shown in
Figure 6 , but it may also be stepped. For example a chirped signal may have discrete frequency steps, each associated with a particular current level. - High pass filtering has been shown above implemented in the digital domain. It can also be implemented in analog domain after the digital to analogue converter. In addition, the excitation signal is not only limited to MLS, other type of signals are also possible, such as multi-sine signals, where multiple-frequency sine waves with the same amplitude are injected at the same time, or a chirp, where high-pass filtering can be performed between the fmin and fmax (or the flat band) of a chirp signal.
- The invention is of interest generally for the simultaneous measurement of a bio-impedance spectrum as well as the analysis of biopotential information, by which is meant electrical signals generated by the body without the need for a stimulus. ECG, EEG and EMG are common non-limiting examples of information which can be derived from such biopotential signals.
- Various other modifications will be readily apparent to those skilled in the art.
Claims (15)
- An impedance spectroscopy system for bio-impedance measurement, comprising:a signal generator for generating a signal with a broadband frequency spectrum, and generating an analog injection current from the signal, wherein the analog injection current has a high pass frequency characteristic;an amplifier for measuring a voltage signal in response to the analog injection current and simultaneously measuring a biopotential signal; anda processor for analyzing the voltage signal to derive a bio-impedance spectrum as well to derive further information from the biopotential signal.
- An impedance spectroscopy system as claimed in claim 1, further comprising a digital to analog converter configured for generating the analog injection current from the signal with the broadband frequency spectrum.
- An impedance spectroscopy system as claimed in claim 2, wherein the signal generator comprises a pseudo-random sequence generator.
- An impedance spectroscopy system as claimed in claim 3, wherein the signal generator further comprises a differentiator configured for applying differentiation thereby to result in the high pass frequency characteristic, and wherein the differentiator comprises a digital differentiator configured for applying digital differentiation before the digital to analog conversion.
- An impedance spectroscopy system as claimed in claim 4, wherein the signal generator is controllable in a first mode to output a maximal length sequence and in a second mode to output a differentiated maximal length sequence.
- An impedance spectroscopy system as claimed in any preceding claim, wherein the analog injection current is a three level current signal with a zero level, a positive level and a negative level.
- An impedance spectroscopy system as claimed in any preceding claim, wherein the amplifier comprises an instrumentation amplifier
- An impedance spectroscopy system as claimed in any preceding claim, comprising a digital to analog converter configured for converting an output of the amplifier to a digital signal.
- An impedance spectroscopy system as claimed in claim 8, wherein the analog to digital converter comprises a successive approximation analog to digital converter
- An impedance spectroscopy system as claimed in any preceding claim, comprising two electrodes for current injection and two electrodes for capture of a signal for amplification by the amplifier.
- An impedance spectroscopy system as claimed in any preceding claim, wherein the analog injection signal has no component below 100Hz and the system further comprises an electrocardiography monitor which comprises a low pass filter at the amplifier output.
- A bio-impedance measurement method, comprising:generating a signal with a broadband frequency spectrum;generating an analog injection current from the signal, wherein the analog injection current has a high pass frequency characteristic;measuring voltages in response to the analog injection current;measuring biopotential signals from the subject simultaneously;analyzing the voltages to derive a bio-impedance spectrum; andanalyzing the biopotential signals to obtain further information.
- A bio-impedance measurement method as claimed in claim 12, further comprising:generating a digital maximal length sequence signal;applying digital differentiation;performing digital to analog conversion, thereby to result in the high pass frequency characteristic.
- A bio-impedance measurement method as claimed in claim 13, further comprising generating, in a first mode, a maximal length sequence; and generating, in a second mode, a differentiated maximal length sequence.
- A bio-impedance measurement method as claimed in one of claims 12 to 14, wherein the analog injection current has no component below 100Hz and the method further comprises electrocardiography monitoring by low pass filtering the amplifier output.
Applications Claiming Priority (1)
| Application Number | Priority Date | Filing Date | Title |
|---|---|---|---|
| EP15184978 | 2015-09-14 |
Publications (2)
| Publication Number | Publication Date |
|---|---|
| EP3141898A1 true EP3141898A1 (en) | 2017-03-15 |
| EP3141898B1 EP3141898B1 (en) | 2020-02-05 |
Family
ID=54147000
Family Applications (1)
| Application Number | Title | Priority Date | Filing Date |
|---|---|---|---|
| EP16188313.7A Active EP3141898B1 (en) | 2015-09-14 | 2016-09-12 | A bio-impedance spectroscopy system and method for bio-impedance measurement |
Country Status (2)
| Country | Link |
|---|---|
| US (1) | US11096629B2 (en) |
| EP (1) | EP3141898B1 (en) |
Cited By (4)
| Publication number | Priority date | Publication date | Assignee | Title |
|---|---|---|---|---|
| CN109381180A (en) * | 2018-12-06 | 2019-02-26 | 深圳市优创亿科技有限公司 | Detectable bio-impedance and cardiac electrical wearable device, measuring system and method |
| DE102022133018B3 (en) | 2022-12-12 | 2024-05-29 | Ilmsens Gmbh | Method and measuring system for carrying out an impedance spectroscopic measurement |
| CN118604674A (en) * | 2024-05-23 | 2024-09-06 | 国网宁夏电力有限公司电力科学研究院 | A method for measuring dual currents of transformer core and clamp grounding |
| US12458243B2 (en) | 2021-11-10 | 2025-11-04 | Nxp B.V. | Bio-impedance measurement using voltage to current conversion |
Families Citing this family (42)
| Publication number | Priority date | Publication date | Assignee | Title |
|---|---|---|---|---|
| US10489544B2 (en) | 2016-12-14 | 2019-11-26 | iCometrue Company Ltd. | Logic drive based on standard commodity FPGA IC chips |
| US11625523B2 (en) | 2016-12-14 | 2023-04-11 | iCometrue Company Ltd. | Logic drive based on standard commodity FPGA IC chips |
| CN106909340A (en) * | 2017-04-26 | 2017-06-30 | 江西师范大学 | Random sequence generation device and method based on electromyographic signals |
| US10447274B2 (en) | 2017-07-11 | 2019-10-15 | iCometrue Company Ltd. | Logic drive based on standard commodity FPGA IC chips using non-volatile memory cells |
| US10957679B2 (en) | 2017-08-08 | 2021-03-23 | iCometrue Company Ltd. | Logic drive based on standardized commodity programmable logic semiconductor IC chips |
| US10630296B2 (en) | 2017-09-12 | 2020-04-21 | iCometrue Company Ltd. | Logic drive with brain-like elasticity and integrality based on standard commodity FPGA IC chips using non-volatile memory cells |
| WO2019060298A1 (en) | 2017-09-19 | 2019-03-28 | Neuroenhancement Lab, LLC | Method and apparatus for neuroenhancement |
| DE102017128488A1 (en) | 2017-11-30 | 2019-06-06 | Hamilton Bonaduz Ag | A method and cell population sensor for determining a value indicative of the permittivity of a cell population |
| US11717686B2 (en) | 2017-12-04 | 2023-08-08 | Neuroenhancement Lab, LLC | Method and apparatus for neuroenhancement to facilitate learning and performance |
| US12280219B2 (en) | 2017-12-31 | 2025-04-22 | NeuroLight, Inc. | Method and apparatus for neuroenhancement to enhance emotional response |
| US11318277B2 (en) | 2017-12-31 | 2022-05-03 | Neuroenhancement Lab, LLC | Method and apparatus for neuroenhancement to enhance emotional response |
| US10608642B2 (en) | 2018-02-01 | 2020-03-31 | iCometrue Company Ltd. | Logic drive using standard commodity programmable logic IC chips comprising non-volatile radom access memory cells |
| US10623000B2 (en) | 2018-02-14 | 2020-04-14 | iCometrue Company Ltd. | Logic drive using standard commodity programmable logic IC chips |
| US11364361B2 (en) | 2018-04-20 | 2022-06-21 | Neuroenhancement Lab, LLC | System and method for inducing sleep by transplanting mental states |
| US12476637B2 (en) | 2018-05-24 | 2025-11-18 | iCometrue Company Ltd. | Logic drive using standard commodity programmable logic IC chips |
| US11047821B2 (en) * | 2018-05-31 | 2021-06-29 | Analog Devices International Unlimited Company | Bio-impedance and contact impedances measurement |
| US11309334B2 (en) | 2018-09-11 | 2022-04-19 | iCometrue Company Ltd. | Logic drive using standard commodity programmable logic IC chips comprising non-volatile random access memory cells |
| CN113382683A (en) | 2018-09-14 | 2021-09-10 | 纽罗因恒思蒙特实验有限责任公司 | System and method for improving sleep |
| US10937762B2 (en) | 2018-10-04 | 2021-03-02 | iCometrue Company Ltd. | Logic drive based on multichip package using interconnection bridge |
| US11616046B2 (en) * | 2018-11-02 | 2023-03-28 | iCometrue Company Ltd. | Logic drive based on chip scale package comprising standardized commodity programmable logic IC chip and memory IC chip |
| US11211334B2 (en) | 2018-11-18 | 2021-12-28 | iCometrue Company Ltd. | Logic drive based on chip scale package comprising standardized commodity programmable logic IC chip and memory IC chip |
| DE102018130487A1 (en) * | 2018-11-30 | 2020-06-04 | Hamilton Bonaduz Ag | Method and sensor for determining a value indicating the impedance of a suspension |
| DE102019000763A1 (en) * | 2019-02-02 | 2020-08-06 | Wolfgang Krautschneider | Arrangement for the electrical characterization of biological material |
| EP3692908B1 (en) * | 2019-02-07 | 2021-08-11 | IMEC vzw | A measurement unit for measuring a bio-impedance |
| US11786694B2 (en) | 2019-05-24 | 2023-10-17 | NeuroLight, Inc. | Device, method, and app for facilitating sleep |
| US11227838B2 (en) | 2019-07-02 | 2022-01-18 | iCometrue Company Ltd. | Logic drive based on multichip package comprising standard commodity FPGA IC chip with cooperating or supporting circuits |
| US11887930B2 (en) | 2019-08-05 | 2024-01-30 | iCometrue Company Ltd. | Vertical interconnect elevator based on through silicon vias |
| US11637056B2 (en) | 2019-09-20 | 2023-04-25 | iCometrue Company Ltd. | 3D chip package based on through-silicon-via interconnection elevator |
| US11600526B2 (en) | 2020-01-22 | 2023-03-07 | iCometrue Company Ltd. | Chip package based on through-silicon-via connector and silicon interconnection bridge |
| CN111685761B (en) * | 2020-05-26 | 2022-10-11 | 复旦大学 | A Comparator-Based Time Domain Bioimpedance Detection Circuit |
| US11272854B1 (en) | 2020-09-02 | 2022-03-15 | Analog Devices International Unlimited Company | Noise cancellation in impedance measurement circuits |
| CN112401898B (en) * | 2020-11-11 | 2024-03-12 | 西安臻泰智能科技有限公司 | High-precision electroencephalogram signal acquisition method and device |
| TW202240808A (en) | 2021-01-08 | 2022-10-16 | 成真股份有限公司 | Micro heat pipes for use in integrated circuit chip package |
| US12176278B2 (en) | 2021-05-30 | 2024-12-24 | iCometrue Company Ltd. | 3D chip package based on vertical-through-via connector |
| US12551160B2 (en) * | 2021-07-22 | 2026-02-17 | Nfant Labs, Inc. | System and method for measuring human milk production |
| US12555628B2 (en) | 2021-09-24 | 2026-02-17 | iCometrue Company Ltd. | Multi-output look-up table (LUT) for use in coarse-grained field-programmable-gate-array (FPGA) integrated-circuit (IC) chip |
| US12268012B2 (en) | 2021-09-24 | 2025-04-01 | iCometrue Company Ltd. | Multi-output look-up table (LUT) for use in coarse-grained field-programmable-gate-array (FPGA) integrated-circuit (IC) chip |
| WO2024055212A1 (en) * | 2022-09-14 | 2024-03-21 | 深圳市韶音科技有限公司 | Signal measurement device |
| CN115778414B (en) * | 2022-10-12 | 2025-08-19 | 南京安科医疗科技有限公司 | Cardiac CT scanning detection method and exposure control method |
| EP4634651A1 (en) * | 2022-12-12 | 2025-10-22 | Ilmsens GmbH | Method and measuring system for performing measurements by means of impedance spectroscopy |
| CN115825788A (en) * | 2022-12-21 | 2023-03-21 | 广东电网有限责任公司 | Battery measuring system |
| CN119184660B (en) * | 2024-08-02 | 2025-10-10 | 合肥中科博谐科技有限公司 | A real-time acquisition method for multi-frequency synchronous bioelectrical impedance |
Citations (3)
| Publication number | Priority date | Publication date | Assignee | Title |
|---|---|---|---|---|
| EP2314217A1 (en) * | 2009-10-23 | 2011-04-27 | Tallinn University of Technology | Method and device for fast measurement of frequency response with scalable short chirp signals |
| DE102010039790A1 (en) * | 2010-08-26 | 2012-03-01 | Hahn-Schickard-Gesellschaft für angewandte Forschung e.V. | Apparatus for invasive characterization of biological materials, has signal generator which is designed to generate chirp signal or maximum length sequence signal, where detector is designed to detect tapped signal |
| US20150073295A1 (en) * | 2013-09-11 | 2015-03-12 | Medtronic, Inc. | Apparatus and method for simultaneous capture of biopotential and tissue impedance signals |
Family Cites Families (8)
| Publication number | Priority date | Publication date | Assignee | Title |
|---|---|---|---|---|
| US5063937A (en) * | 1990-09-12 | 1991-11-12 | Wright State University | Multiple frequency bio-impedance measurement system |
| US6745062B1 (en) * | 1998-10-05 | 2004-06-01 | Advanced Imaging Systems, Inc. | Emg electrode apparatus and positioning system |
| US7811234B2 (en) * | 2002-08-01 | 2010-10-12 | California Institute Of Technology | Remote-sensing method and device |
| JP2006507057A (en) * | 2002-11-22 | 2006-03-02 | インぺディメッド プロプライエタリー リミテッド | Multi-frequency bioimpedance measurement method |
| GB0522888D0 (en) * | 2005-11-10 | 2005-12-21 | Univ Southampton | Measurement of the electrical impedance frequency spectrum |
| US7558622B2 (en) * | 2006-05-24 | 2009-07-07 | Bao Tran | Mesh network stroke monitoring appliance |
| EP2294979B1 (en) * | 2009-09-14 | 2013-12-18 | Imec | Method and electronic medical device for simultaneously measuring an impedance and a biopotential signal |
| EP2868264A3 (en) * | 2013-10-31 | 2015-06-17 | Imec | System and method for acquisition of biopotential signals with electrode-tissue impedance measurement. |
-
2016
- 2016-08-25 US US15/247,172 patent/US11096629B2/en active Active
- 2016-09-12 EP EP16188313.7A patent/EP3141898B1/en active Active
Patent Citations (3)
| Publication number | Priority date | Publication date | Assignee | Title |
|---|---|---|---|---|
| EP2314217A1 (en) * | 2009-10-23 | 2011-04-27 | Tallinn University of Technology | Method and device for fast measurement of frequency response with scalable short chirp signals |
| DE102010039790A1 (en) * | 2010-08-26 | 2012-03-01 | Hahn-Schickard-Gesellschaft für angewandte Forschung e.V. | Apparatus for invasive characterization of biological materials, has signal generator which is designed to generate chirp signal or maximum length sequence signal, where detector is designed to detect tapped signal |
| US20150073295A1 (en) * | 2013-09-11 | 2015-03-12 | Medtronic, Inc. | Apparatus and method for simultaneous capture of biopotential and tissue impedance signals |
Non-Patent Citations (4)
| Title |
|---|
| P. HARPE ET AL.: "A 7-to-10b 0-to- 4MS/s flexible SAR ADC with 6.5-16fJ/conversion-step", DIGEST ISSCC, February 2012 (2012-02-01), pages 472 - 474, XP032154548, DOI: doi:10.1109/ISSCC.2012.6177096 |
| R. F. YAZICIOGLU; P. MERKEN ET AL.: "A 60 W 60 nV/VHz Readout Front-End for Portable Biopotential Acquisition Systems", IEEE J. SOLID-STATE CIRCUITS, May 2007 (2007-05-01), pages 1100 - 1110 |
| T. SUN; D. HOLMES ET AL.: "High speed multi-frequency impedance analysis of single particles in a microfluidic cytometer using maximum length sequences", LAB ON A CHIP, August 2007 (2007-08-01), pages 1034 - 1040 |
| VAN HELLEPUTTE NICK ET AL: "A 345 [mu]W Multi-Sensor Biomedical SoC With Bio-Impedance, 3-Channel ECG, Motion Artifact Reduction, and Integrated DSP", IEEE JOURNAL OF SOLID-STATE CIRCUITS, IEEE SERVICE CENTER, PISCATAWAY, NJ, USA, vol. 50, no. 1, 14 October 2014 (2014-10-14), pages 230 - 244, XP011568769, ISSN: 0018-9200, [retrieved on 20141224], DOI: 10.1109/JSSC.2014.2359962 * |
Cited By (4)
| Publication number | Priority date | Publication date | Assignee | Title |
|---|---|---|---|---|
| CN109381180A (en) * | 2018-12-06 | 2019-02-26 | 深圳市优创亿科技有限公司 | Detectable bio-impedance and cardiac electrical wearable device, measuring system and method |
| US12458243B2 (en) | 2021-11-10 | 2025-11-04 | Nxp B.V. | Bio-impedance measurement using voltage to current conversion |
| DE102022133018B3 (en) | 2022-12-12 | 2024-05-29 | Ilmsens Gmbh | Method and measuring system for carrying out an impedance spectroscopic measurement |
| CN118604674A (en) * | 2024-05-23 | 2024-09-06 | 国网宁夏电力有限公司电力科学研究院 | A method for measuring dual currents of transformer core and clamp grounding |
Also Published As
| Publication number | Publication date |
|---|---|
| US11096629B2 (en) | 2021-08-24 |
| US20170071552A1 (en) | 2017-03-16 |
| EP3141898B1 (en) | 2020-02-05 |
Similar Documents
| Publication | Publication Date | Title |
|---|---|---|
| EP3141898B1 (en) | A bio-impedance spectroscopy system and method for bio-impedance measurement | |
| Merletti et al. | Detection and conditioning of surface EMG signals | |
| Wu et al. | Electrical impedance tomography for biomedical applications: Circuits and systems review | |
| US20250082245A1 (en) | Method and apparatus for wide-band phase gradient signal acquisition | |
| Broman et al. | Units, terms and standards in the reporting of EMG research | |
| Merletti et al. | Technology and instrumentation for detection and conditioning of the surface electromyographic signal: state of the art | |
| US8454505B2 (en) | Method and electronic medical device for simultaneously measuring an impedance and a biopotential signal | |
| Limaye et al. | ECG noise sources and various noise removal techniques: A survey | |
| EP2294978B1 (en) | Adaptive sampling of an electrocardiogram | |
| Xu et al. | A low power configurable bio-impedance spectroscopy (BIS) ASIC with simultaneous ECG and respiration recording functionality | |
| US9622672B2 (en) | Digitally invertible universal amplifier for recording and processing of bioelectric signals | |
| Xu et al. | A frequency shaping neural recorder with 3 pF input capacitance and 11 plus 4.5 bits dynamic range | |
| CN103845051A (en) | Multi-channel ecg measurement | |
| EP3209197B1 (en) | Simultaneous impedance testing method and apparatus | |
| KR101832734B1 (en) | Improved bio-potential measurement system | |
| CN107072572A (en) | ECG electrode and the detection of lead gate oxide integrity | |
| Dabbaghian et al. | An 8-Channel ambulatory EEG recording IC with in-channel fully-analog real-time motion artifact extraction and removal | |
| CN115192182A (en) | Irreversible electroporation therapy apparatus and bioimpedance measurement method | |
| Ortengren | Noise and artefacts | |
| CN103796580B (en) | Biological signal measuring device | |
| Harrison et al. | Local field potential measurement with low-power analog integrated circuit | |
| Song et al. | A motion-artifact tracking and compensation technique for dry-contact EEG monitoring system | |
| CN118161174A (en) | Low-noise EEG acquisition system based on active electrodes | |
| Bhoi et al. | Wavelet packet based Denoising of EMG Signal | |
| Menden et al. | Bandwidth and Common Mode Optimization for Current and Voltage Sources in Bioimpedance Spectroscopy |
Legal Events
| Date | Code | Title | Description |
|---|---|---|---|
| PUAI | Public reference made under article 153(3) epc to a published international application that has entered the european phase |
Free format text: ORIGINAL CODE: 0009012 |
|
| STAA | Information on the status of an ep patent application or granted ep patent |
Free format text: STATUS: THE APPLICATION HAS BEEN PUBLISHED |
|
| AK | Designated contracting states |
Kind code of ref document: A1 Designated state(s): AL AT BE BG CH CY CZ DE DK EE ES FI FR GB GR HR HU IE IS IT LI LT LU LV MC MK MT NL NO PL PT RO RS SE SI SK SM TR |
|
| AX | Request for extension of the european patent |
Extension state: BA ME |
|
| STAA | Information on the status of an ep patent application or granted ep patent |
Free format text: STATUS: REQUEST FOR EXAMINATION WAS MADE |
|
| 17P | Request for examination filed |
Effective date: 20170911 |
|
| RBV | Designated contracting states (corrected) |
Designated state(s): AL AT BE BG CH CY CZ DE DK EE ES FI FR GB GR HR HU IE IS IT LI LT LU LV MC MK MT NL NO PL PT RO RS SE SI SK SM TR |
|
| GRAP | Despatch of communication of intention to grant a patent |
Free format text: ORIGINAL CODE: EPIDOSNIGR1 |
|
| STAA | Information on the status of an ep patent application or granted ep patent |
Free format text: STATUS: GRANT OF PATENT IS INTENDED |
|
| RIC1 | Information provided on ipc code assigned before grant |
Ipc: G01N 27/02 20060101ALI20190716BHEP Ipc: G01N 33/483 20060101AFI20190716BHEP Ipc: A61B 5/053 20060101ALI20190716BHEP Ipc: A61B 5/0428 20060101ALI20190716BHEP |
|
| INTG | Intention to grant announced |
Effective date: 20190814 |
|
| GRAS | Grant fee paid |
Free format text: ORIGINAL CODE: EPIDOSNIGR3 |
|
| GRAA | (expected) grant |
Free format text: ORIGINAL CODE: 0009210 |
|
| STAA | Information on the status of an ep patent application or granted ep patent |
Free format text: STATUS: THE PATENT HAS BEEN GRANTED |
|
| AK | Designated contracting states |
Kind code of ref document: B1 Designated state(s): AL AT BE BG CH CY CZ DE DK EE ES FI FR GB GR HR HU IE IS IT LI LT LU LV MC MK MT NL NO PL PT RO RS SE SI SK SM TR |
|
| REG | Reference to a national code |
Ref country code: GB Ref legal event code: FG4D |
|
| REG | Reference to a national code |
Ref country code: AT Ref legal event code: REF Ref document number: 1230279 Country of ref document: AT Kind code of ref document: T Effective date: 20200215 |
|
| REG | Reference to a national code |
Ref country code: DE Ref legal event code: R096 Ref document number: 602016029033 Country of ref document: DE |
|
| REG | Reference to a national code |
Ref country code: IE Ref legal event code: FG4D |
|
| REG | Reference to a national code |
Ref country code: CH Ref legal event code: EP |
|
| REG | Reference to a national code |
Ref country code: NL Ref legal event code: MP Effective date: 20200205 |
|
| PG25 | Lapsed in a contracting state [announced via postgrant information from national office to epo] |
Ref country code: RS Free format text: LAPSE BECAUSE OF FAILURE TO SUBMIT A TRANSLATION OF THE DESCRIPTION OR TO PAY THE FEE WITHIN THE PRESCRIBED TIME-LIMIT Effective date: 20200205 Ref country code: PT Free format text: LAPSE BECAUSE OF FAILURE TO SUBMIT A TRANSLATION OF THE DESCRIPTION OR TO PAY THE FEE WITHIN THE PRESCRIBED TIME-LIMIT Effective date: 20200628 Ref country code: NO Free format text: LAPSE BECAUSE OF FAILURE TO SUBMIT A TRANSLATION OF THE DESCRIPTION OR TO PAY THE FEE WITHIN THE PRESCRIBED TIME-LIMIT Effective date: 20200505 Ref country code: FI Free format text: LAPSE BECAUSE OF FAILURE TO SUBMIT A TRANSLATION OF THE DESCRIPTION OR TO PAY THE FEE WITHIN THE PRESCRIBED TIME-LIMIT Effective date: 20200205 |
|
| REG | Reference to a national code |
Ref country code: LT Ref legal event code: MG4D |
|
| PG25 | Lapsed in a contracting state [announced via postgrant information from national office to epo] |
Ref country code: SE Free format text: LAPSE BECAUSE OF FAILURE TO SUBMIT A TRANSLATION OF THE DESCRIPTION OR TO PAY THE FEE WITHIN THE PRESCRIBED TIME-LIMIT Effective date: 20200205 Ref country code: LV Free format text: LAPSE BECAUSE OF FAILURE TO SUBMIT A TRANSLATION OF THE DESCRIPTION OR TO PAY THE FEE WITHIN THE PRESCRIBED TIME-LIMIT Effective date: 20200205 Ref country code: HR Free format text: LAPSE BECAUSE OF FAILURE TO SUBMIT A TRANSLATION OF THE DESCRIPTION OR TO PAY THE FEE WITHIN THE PRESCRIBED TIME-LIMIT Effective date: 20200205 Ref country code: IS Free format text: LAPSE BECAUSE OF FAILURE TO SUBMIT A TRANSLATION OF THE DESCRIPTION OR TO PAY THE FEE WITHIN THE PRESCRIBED TIME-LIMIT Effective date: 20200605 Ref country code: GR Free format text: LAPSE BECAUSE OF FAILURE TO SUBMIT A TRANSLATION OF THE DESCRIPTION OR TO PAY THE FEE WITHIN THE PRESCRIBED TIME-LIMIT Effective date: 20200506 Ref country code: BG Free format text: LAPSE BECAUSE OF FAILURE TO SUBMIT A TRANSLATION OF THE DESCRIPTION OR TO PAY THE FEE WITHIN THE PRESCRIBED TIME-LIMIT Effective date: 20200505 |
|
| PG25 | Lapsed in a contracting state [announced via postgrant information from national office to epo] |
Ref country code: NL Free format text: LAPSE BECAUSE OF FAILURE TO SUBMIT A TRANSLATION OF THE DESCRIPTION OR TO PAY THE FEE WITHIN THE PRESCRIBED TIME-LIMIT Effective date: 20200205 |
|
| PG25 | Lapsed in a contracting state [announced via postgrant information from national office to epo] |
Ref country code: CZ Free format text: LAPSE BECAUSE OF FAILURE TO SUBMIT A TRANSLATION OF THE DESCRIPTION OR TO PAY THE FEE WITHIN THE PRESCRIBED TIME-LIMIT Effective date: 20200205 Ref country code: SK Free format text: LAPSE BECAUSE OF FAILURE TO SUBMIT A TRANSLATION OF THE DESCRIPTION OR TO PAY THE FEE WITHIN THE PRESCRIBED TIME-LIMIT Effective date: 20200205 Ref country code: RO Free format text: LAPSE BECAUSE OF FAILURE TO SUBMIT A TRANSLATION OF THE DESCRIPTION OR TO PAY THE FEE WITHIN THE PRESCRIBED TIME-LIMIT Effective date: 20200205 Ref country code: SM Free format text: LAPSE BECAUSE OF FAILURE TO SUBMIT A TRANSLATION OF THE DESCRIPTION OR TO PAY THE FEE WITHIN THE PRESCRIBED TIME-LIMIT Effective date: 20200205 Ref country code: EE Free format text: LAPSE BECAUSE OF FAILURE TO SUBMIT A TRANSLATION OF THE DESCRIPTION OR TO PAY THE FEE WITHIN THE PRESCRIBED TIME-LIMIT Effective date: 20200205 Ref country code: DK Free format text: LAPSE BECAUSE OF FAILURE TO SUBMIT A TRANSLATION OF THE DESCRIPTION OR TO PAY THE FEE WITHIN THE PRESCRIBED TIME-LIMIT Effective date: 20200205 Ref country code: LT Free format text: LAPSE BECAUSE OF FAILURE TO SUBMIT A TRANSLATION OF THE DESCRIPTION OR TO PAY THE FEE WITHIN THE PRESCRIBED TIME-LIMIT Effective date: 20200205 Ref country code: ES Free format text: LAPSE BECAUSE OF FAILURE TO SUBMIT A TRANSLATION OF THE DESCRIPTION OR TO PAY THE FEE WITHIN THE PRESCRIBED TIME-LIMIT Effective date: 20200205 |
|
| REG | Reference to a national code |
Ref country code: DE Ref legal event code: R097 Ref document number: 602016029033 Country of ref document: DE |
|
| REG | Reference to a national code |
Ref country code: AT Ref legal event code: MK05 Ref document number: 1230279 Country of ref document: AT Kind code of ref document: T Effective date: 20200205 |
|
| PLBE | No opposition filed within time limit |
Free format text: ORIGINAL CODE: 0009261 |
|
| STAA | Information on the status of an ep patent application or granted ep patent |
Free format text: STATUS: NO OPPOSITION FILED WITHIN TIME LIMIT |
|
| 26N | No opposition filed |
Effective date: 20201106 |
|
| PG25 | Lapsed in a contracting state [announced via postgrant information from national office to epo] |
Ref country code: AT Free format text: LAPSE BECAUSE OF FAILURE TO SUBMIT A TRANSLATION OF THE DESCRIPTION OR TO PAY THE FEE WITHIN THE PRESCRIBED TIME-LIMIT Effective date: 20200205 Ref country code: IT Free format text: LAPSE BECAUSE OF FAILURE TO SUBMIT A TRANSLATION OF THE DESCRIPTION OR TO PAY THE FEE WITHIN THE PRESCRIBED TIME-LIMIT Effective date: 20200205 |
|
| PG25 | Lapsed in a contracting state [announced via postgrant information from national office to epo] |
Ref country code: PL Free format text: LAPSE BECAUSE OF FAILURE TO SUBMIT A TRANSLATION OF THE DESCRIPTION OR TO PAY THE FEE WITHIN THE PRESCRIBED TIME-LIMIT Effective date: 20200205 Ref country code: SI Free format text: LAPSE BECAUSE OF FAILURE TO SUBMIT A TRANSLATION OF THE DESCRIPTION OR TO PAY THE FEE WITHIN THE PRESCRIBED TIME-LIMIT Effective date: 20200205 |
|
| PG25 | Lapsed in a contracting state [announced via postgrant information from national office to epo] |
Ref country code: MC Free format text: LAPSE BECAUSE OF FAILURE TO SUBMIT A TRANSLATION OF THE DESCRIPTION OR TO PAY THE FEE WITHIN THE PRESCRIBED TIME-LIMIT Effective date: 20200205 |
|
| REG | Reference to a national code |
Ref country code: CH Ref legal event code: PL |
|
| REG | Reference to a national code |
Ref country code: BE Ref legal event code: MM Effective date: 20200930 |
|
| PG25 | Lapsed in a contracting state [announced via postgrant information from national office to epo] |
Ref country code: LU Free format text: LAPSE BECAUSE OF NON-PAYMENT OF DUE FEES Effective date: 20200912 |
|
| PG25 | Lapsed in a contracting state [announced via postgrant information from national office to epo] |
Ref country code: LI Free format text: LAPSE BECAUSE OF NON-PAYMENT OF DUE FEES Effective date: 20200930 Ref country code: IE Free format text: LAPSE BECAUSE OF NON-PAYMENT OF DUE FEES Effective date: 20200912 Ref country code: CH Free format text: LAPSE BECAUSE OF NON-PAYMENT OF DUE FEES Effective date: 20200930 Ref country code: BE Free format text: LAPSE BECAUSE OF NON-PAYMENT OF DUE FEES Effective date: 20200930 |
|
| PG25 | Lapsed in a contracting state [announced via postgrant information from national office to epo] |
Ref country code: TR Free format text: LAPSE BECAUSE OF FAILURE TO SUBMIT A TRANSLATION OF THE DESCRIPTION OR TO PAY THE FEE WITHIN THE PRESCRIBED TIME-LIMIT Effective date: 20200205 Ref country code: MT Free format text: LAPSE BECAUSE OF FAILURE TO SUBMIT A TRANSLATION OF THE DESCRIPTION OR TO PAY THE FEE WITHIN THE PRESCRIBED TIME-LIMIT Effective date: 20200205 Ref country code: CY Free format text: LAPSE BECAUSE OF FAILURE TO SUBMIT A TRANSLATION OF THE DESCRIPTION OR TO PAY THE FEE WITHIN THE PRESCRIBED TIME-LIMIT Effective date: 20200205 |
|
| PG25 | Lapsed in a contracting state [announced via postgrant information from national office to epo] |
Ref country code: MK Free format text: LAPSE BECAUSE OF FAILURE TO SUBMIT A TRANSLATION OF THE DESCRIPTION OR TO PAY THE FEE WITHIN THE PRESCRIBED TIME-LIMIT Effective date: 20200205 Ref country code: AL Free format text: LAPSE BECAUSE OF FAILURE TO SUBMIT A TRANSLATION OF THE DESCRIPTION OR TO PAY THE FEE WITHIN THE PRESCRIBED TIME-LIMIT Effective date: 20200205 |
|
| P01 | Opt-out of the competence of the unified patent court (upc) registered |
Effective date: 20230513 |
|
| PGFP | Annual fee paid to national office [announced via postgrant information from national office to epo] |
Ref country code: DE Payment date: 20250820 Year of fee payment: 10 |
|
| PGFP | Annual fee paid to national office [announced via postgrant information from national office to epo] |
Ref country code: GB Payment date: 20250820 Year of fee payment: 10 |
|
| PGFP | Annual fee paid to national office [announced via postgrant information from national office to epo] |
Ref country code: FR Payment date: 20250820 Year of fee payment: 10 |