EP3042843A1 - Surveillance d'utilisation d'énergie d'un vaisseau maritime de surface - Google Patents
Surveillance d'utilisation d'énergie d'un vaisseau maritime de surface Download PDFInfo
- Publication number
- EP3042843A1 EP3042843A1 EP15275004.8A EP15275004A EP3042843A1 EP 3042843 A1 EP3042843 A1 EP 3042843A1 EP 15275004 A EP15275004 A EP 15275004A EP 3042843 A1 EP3042843 A1 EP 3042843A1
- Authority
- EP
- European Patent Office
- Prior art keywords
- vessel
- data
- speed
- power
- energy usage
- Prior art date
- Legal status (The legal status is an assumption and is not a legal conclusion. Google has not performed a legal analysis and makes no representation as to the accuracy of the status listed.)
- Ceased
Links
Images


Classifications
-
- G—PHYSICS
- G06—COMPUTING; CALCULATING OR COUNTING
- G06Q—INFORMATION AND COMMUNICATION TECHNOLOGY [ICT] SPECIALLY ADAPTED FOR ADMINISTRATIVE, COMMERCIAL, FINANCIAL, MANAGERIAL OR SUPERVISORY PURPOSES; SYSTEMS OR METHODS SPECIALLY ADAPTED FOR ADMINISTRATIVE, COMMERCIAL, FINANCIAL, MANAGERIAL OR SUPERVISORY PURPOSES, NOT OTHERWISE PROVIDED FOR
- G06Q50/00—Systems or methods specially adapted for specific business sectors, e.g. utilities or tourism
- G06Q50/10—Services
-
- B—PERFORMING OPERATIONS; TRANSPORTING
- B63—SHIPS OR OTHER WATERBORNE VESSELS; RELATED EQUIPMENT
- B63B—SHIPS OR OTHER WATERBORNE VESSELS; EQUIPMENT FOR SHIPPING
- B63B71/00—Designing vessels; Predicting their performance
-
- B—PERFORMING OPERATIONS; TRANSPORTING
- B63—SHIPS OR OTHER WATERBORNE VESSELS; RELATED EQUIPMENT
- B63B—SHIPS OR OTHER WATERBORNE VESSELS; EQUIPMENT FOR SHIPPING
- B63B79/00—Monitoring properties or operating parameters of vessels in operation
- B63B79/10—Monitoring properties or operating parameters of vessels in operation using sensors, e.g. pressure sensors, strain gauges or accelerometers
-
- B—PERFORMING OPERATIONS; TRANSPORTING
- B63—SHIPS OR OTHER WATERBORNE VESSELS; RELATED EQUIPMENT
- B63B—SHIPS OR OTHER WATERBORNE VESSELS; EQUIPMENT FOR SHIPPING
- B63B79/00—Monitoring properties or operating parameters of vessels in operation
- B63B79/20—Monitoring properties or operating parameters of vessels in operation using models or simulation, e.g. statistical models or stochastic models
-
- G—PHYSICS
- G06—COMPUTING; CALCULATING OR COUNTING
- G06Q—INFORMATION AND COMMUNICATION TECHNOLOGY [ICT] SPECIALLY ADAPTED FOR ADMINISTRATIVE, COMMERCIAL, FINANCIAL, MANAGERIAL OR SUPERVISORY PURPOSES; SYSTEMS OR METHODS SPECIALLY ADAPTED FOR ADMINISTRATIVE, COMMERCIAL, FINANCIAL, MANAGERIAL OR SUPERVISORY PURPOSES, NOT OTHERWISE PROVIDED FOR
- G06Q10/00—Administration; Management
- G06Q10/06—Resources, workflows, human or project management; Enterprise or organisation planning; Enterprise or organisation modelling
-
- G—PHYSICS
- G07—CHECKING-DEVICES
- G07C—TIME OR ATTENDANCE REGISTERS; REGISTERING OR INDICATING THE WORKING OF MACHINES; GENERATING RANDOM NUMBERS; VOTING OR LOTTERY APPARATUS; ARRANGEMENTS, SYSTEMS OR APPARATUS FOR CHECKING NOT PROVIDED FOR ELSEWHERE
- G07C5/00—Registering or indicating the working of vehicles
- G07C5/08—Registering or indicating performance data other than driving, working, idle, or waiting time, with or without registering driving, working, idle or waiting time
-
- B—PERFORMING OPERATIONS; TRANSPORTING
- B63—SHIPS OR OTHER WATERBORNE VESSELS; RELATED EQUIPMENT
- B63B—SHIPS OR OTHER WATERBORNE VESSELS; EQUIPMENT FOR SHIPPING
- B63B79/00—Monitoring properties or operating parameters of vessels in operation
- B63B79/40—Monitoring properties or operating parameters of vessels in operation for controlling the operation of vessels, e.g. monitoring their speed, routing or maintenance schedules
-
- G—PHYSICS
- G01—MEASURING; TESTING
- G01C—MEASURING DISTANCES, LEVELS OR BEARINGS; SURVEYING; NAVIGATION; GYROSCOPIC INSTRUMENTS; PHOTOGRAMMETRY OR VIDEOGRAMMETRY
- G01C21/00—Navigation; Navigational instruments not provided for in groups G01C1/00 - G01C19/00
- G01C21/20—Instruments for performing navigational calculations
- G01C21/203—Specially adapted for sailing ships
-
- Y—GENERAL TAGGING OF NEW TECHNOLOGICAL DEVELOPMENTS; GENERAL TAGGING OF CROSS-SECTIONAL TECHNOLOGIES SPANNING OVER SEVERAL SECTIONS OF THE IPC; TECHNICAL SUBJECTS COVERED BY FORMER USPC CROSS-REFERENCE ART COLLECTIONS [XRACs] AND DIGESTS
- Y02—TECHNOLOGIES OR APPLICATIONS FOR MITIGATION OR ADAPTATION AGAINST CLIMATE CHANGE
- Y02T—CLIMATE CHANGE MITIGATION TECHNOLOGIES RELATED TO TRANSPORTATION
- Y02T70/00—Maritime or waterways transport
- Y02T70/10—Measures concerning design or construction of watercraft hulls
Definitions
- the present invention relates to monitoring energy usage of a surface maritime vessel.
- Embodiments of the present invention are intended to address at least some of the above technical problems.
- Embodiments can provide a ship energy assessment system, which acts as a tactical decision support tool on vessels, by feeding back information on the vessel's energy and fuel consumption, endurance, the operating efficiency and how the vessels operating parameters could be adjusted to optimise efficiency.
- Embodiments can enable a crew at sea and a user ashore to increase vessel range, decrease fuel costs, minimise refuelling time and/or reduce the associated logistics supply chain by optimising energy consumption in near real time.
- Embodiments may also enable a crew at sea and ashore to maximise endurance by optimising energy consumption within a mission profile during advance planning, based on actual measured vessel performance data.
- Embodiments of the system can also allow measurement of benefits (e.g. CO 2 , SOx and NOx emissions, reduced fuel cost and increased endurance/performance) of implementing the energy saving measures over time, based on actual vessel usage profiles.
- a method of monitoring energy usage of a surface maritime vessel comprising:
- output is not necessarily displayed (immediately); for example, it may be stored and/or transferred for further use, or can comprise an electrical signal that is used to control a system or vessel component.
- the energy usage model may comprise a power vs speed curve for the vessel (calculated for sets of characteristics, such as displacement, sea state and trim).
- the characteristic data may be based on signals provided by sensors measuring power provided to at least one propulsion device of the vessel, a speed through water of the vessel and/or a draught of the vessel.
- the method may further include:
- the energy usage model may comprise a fuel consumption vs power output profile (for various temperature, pressure and/or prime mover configurations) for the vessel.
- the method may further include:
- the method may include generating or updating a said energy usage model comprising the power vs speed curve.
- This generating or updating can include steps of:
- the energy usage model may comprise an auxiliary electrical device load vs defined operating scenarios for the vessel.
- the output can include data relating to an efficiency curve that gives an indication of a speed that can result in the optimum fuel consumption for a prime mover configuration of the vessel.
- a said energy usage model may represent the vessel running using one propulsion device, such as a forward or an aft Gas Turbine (GT) alternator, and another said energy usage model may represent the vessel running using more than one propulsion device, such as a forward and an aft GT alternator for electrical propulsion, or gearbox for mechanical propulsion systems.
- the output may indicate a comparison of energy efficiency of the vessel running using the one propulsion device and running using the more than one propulsion device.
- the output can include a usage profile that gives an indication of the ship's speed, power usage and auxiliary load usage over a period of time (e.g. since the start of a mission).
- the output may be used to directly modify operating characteristics of the vessel in order to improve energy usage/efficiency, or may give an indication to a user of how to modify operating characteristics of the vessel in order to improve energy usage/efficiency.
- the energy usage model may be at least initially generated using data representing sensor readings of characteristic data taken at intervals of around 1 minute.
- the characteristic data may be based on signals provided by sensors measuring at least one from a set comprising: vessel draught; ambient air temperature; water temperature; speed through water; rudder position; forward/aft engine load or power; fuel flow rate for at least one propulsion component; shaft speed; fin angle.
- the method may further include receiving data representing external operating conditions.
- This data may also be processed in order to generate the output.
- the data representing external operating conditions may be selected from a set including: weather conditions (windage, barometric pressure, air and/or sea temperature); tidal effects; sea state; displacement changes; changes to vessel condition; fuel quality and/or vessel equipment condition.
- the method may include receiving data representing planned passage, mission profile and/or onboard electrical energy requirements. This data may also be processed in order to generate the output.
- the method may output a prediction of future performance and may perform computations that provide "what if" scenario planning.
- a system configured to monitor energy usage of a surface maritime vessel, the system comprising:
- the device configured to receive characteristic data may, in use, be in communication with a Platform Management System (PMS) or sensor data logging equipment of the vessel to receive the characteristic data.
- PMS Platform Management System
- the present invention provides a vessel including a system substantially as described herein.
- the present invention provides a vessel Platform Management System (or sensor data logging equipment) including a system substantially as described herein.
- the present invention provides a method of creating an operating characteristic profile for a vessel, the method comprising:
- the operating characteristic profile may be computed based on a frequency count of each time there is an occurrence of a predefined condition relating to the operating characteristic.
- the present invention provides a method of improving efficiency of a vessel substantially as described herein.
- the present invention provides a method of generating (or dynamically updating) an energy usage model for a vessel substantially as described herein.
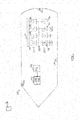
- a computing system 102 is in communication with the ship.
- the system includes a processor 102A and memory 102B and is in communication with a Platform Management System (PMS) 103 of the ship.
- the PMS is in communication with a plurality of sensors 104 of various types mounted at various locations of the vessel.
- the system 102 can also be in communication with at least one other device 106 remote from the ship.
- the communication between the various components can be implemented using any suitable wired or wireless means, e.g. a wired interface between the system 102 and the PMS 103, if the system is located onboard the ship, or satellite communication with the remote device(s) 106.
- the system can also include, or be in communication with, user interface components, such as input devices, one or more display, etc.
- user interface components such as input devices, one or more display, etc.
- at least some of the components of, or functions described as being performed by, the system 102 can be distributed across one or more computing devices, which may or may not be located on the ship.
- some embodiments of the system can communicate directly with at least one sensor (rather than via the PMS).
- the ship 100 further includes components that are used for propelling it over water and for providing electrical power to onboard appliances.
- the ship includes a forward Gas Turbine (GT) alternator 108, which can use fuel from a supply 111, and is connected, via an electrical distribution system 112, to a forward auxiliary/hotel electrical load 114 that can provide electrical power to appliances in particular zones of the vessel and major consumers.
- GT Gas Turbine
- the example ship 100 further includes a forward Diesel Generator (DG) 110 that can provide power to a forward propulsion motor 116; an aft GT alternator 118 that can provide power to aft auxiliary/hotel electrical load 120, and an aft DG 122 that can provide power to an aft propulsion motor 124.
- DG Diesel Generator
- These producer components can also use fuel from the supply 111 and are connected to their respective consumer components via the electrical distribution system 112. It will be appreciated that the illustrated components are exemplary only and in other embodiments alternative and/or additional energy producers/consumers/storage devices could be present and will require energy management.
- Embodiments of the system 102 can be configured to process data based on the measurements provided by the sensors 104 and model data representing vessel usage/activity profiles (as well as user inputs in some cases), which can be used to generate various outputs relating to the energy usage of the vessel 100.
- the output may be used to give an indication to a user of how to modify operating characteristics of the vessel in order to improve energy usage/efficiency, or may even be used to directly control such operating characteristics.
- Embodiments of the system allows energy to be managed as a finite commodity, with inputs such as planned passage and mission profile and onboard electrical energy requirements for the duration of deployment, enabling prediction of future performance, "what if" scenario planning and “benefit/penalties” of integrating future notional energy reduction measures.
- One method of obtaining the data from typical PMS and data logging systems is to set up 'trends' , where each trend can accommodate multiple signals for display and export.
- a data sample with measurements of one parameter every 10 minutes for a period of 24 hours will have a file size of approximately 12KB in .CSV format and 30KB in .xls format.
- the inventors found an issue with reading data at this frequency because the time stamp of individual measurements can vary. For example, the timing of individual readings on a sample system drifts by up to 3 seconds every reading resulting in drifting of on average 5 minutes over a 24 hour period. This is important because if the vessel is not operating in steady state conditions then parameters which are not sampled within a very short interval of one another will not be able to be related directly.
- the inventors determined that readings made within a minute had a far higher degree of correlation to the expected design line.
- the interval between readings is reduced, so that the variation in the timing of the data is reduced to 1 minute. It will be appreciated that the intervals could vary and still provide acceptable results; the variation in timing could be around 1 minute, e.g. around 45 - 75 seconds.
- FIG 2 is a data flow diagram for an example embodiment of the system 102 configured to execute software that provides functions as described herein.
- Input data may be provided by a user 202, a PMS or sensor data loggers103 and a data repository 204, which can contain data representing the models/profiles described herein.
- the user data can be used to select various interfaces, including a dash view 206, a module tab 208 or a change of operating parameter interface 210.
- Figures 9 onwards (described below) give detailed examples of user interface screens generated by an embodiment of the system.
- a core module of the software being executed by the system can cause the selected interface to be displayed 212.
- User interaction with the displayed interface can result in data being updated and called 214 for use by various modules 215A, 215B, 215C of the system (which perform functions 217A, 217B, 217C, respectively), as will be described below.
- the module 215A is designed to advise on the best optimisation of the vessel prime mover/generator configuration, or optimisation of the vessel's operation for a given prime mover configuration.
- the module 215B is focused on the display of platform usage monitoring data.
- the logic used to calculate this is a frequency count of each time there is an occurrence of a set of predefined conditions.
- the module 215C is focussed on vessel energy management, the module allows the generation of 'what if' scenarios, to highlight how 'energy saving measures', known as 'Energy Options' might affect the vessels energy footprint through life.
- modules described herein are exemplary only and in alternative embodiments, the functions performed by one or more of the modules may be omitted, performed by at least one other module (in addition to, or instead of the module, described as performing the function), and/or additional modules can be provided.
- a core module 216 of the software can receive data from a PMS 103 and provide data parameter called to the functions 217A, 217B, 217C that correspond to the modules 215A, 215B, 215C.
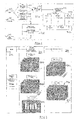
- Figure 3 shows how the exemplary data flow of Figure 2 transfers the input data into trends and algorithms which model the vessel, before generating metrics and outputs from these.
- the inputs 302 can correspond to the inputs 202, 103 and 204 of Figure 2 .
- the graphs in the middle column 304 of Figure 3 correspond to examples of the types of profiles/model data that can be generated/used, including propulsive power vs speed profiles 305A (for various displacements, sea states and/or trims); fuel consumption vs power output profiles 305B (for various temperature, pressure and/or prime mover configurations), and an auxiliary electrical device load vs defined operating scenarios profile 305C.
- the right-hand column 306 of Figure 3 represents examples of outputs that can be provided to the user, including an efficiency curves 307A that can, for example, give an indication of the speed that can result in the optimum fuel consumption for the current prime mover configuration, and usage profiles 307B that can, for example, give an indication of the ship's speed, power usage and auxiliary load usage over a period of time (e.g. since the start of a journey).
- efficiency curves 307A can, for example, give an indication of the speed that can result in the optimum fuel consumption for the current prime mover configuration
- usage profiles 307B that can, for example, give an indication of the ship's speed, power usage and auxiliary load usage over a period of time (e.g. since the start of a journey).
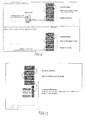
- Figure 4 is a definition diagram for the first module 215A, which is designed to advise on the optimisation of the vessel prime mover/generator configuration, or optimisation of the vessel's operation for a given prime mover/generator configuration.
- the algorithms which describe the prime mover optimisation function of the module 215A comprise a propulsive power algorithm; a vessel efficiency algorithm, and a prime mover efficiency algorithm. The flow of data and the logic steps involved in these algorithms are illustrated in Figure 4 .
- the operating draught of the vessel can be categorised. Given the maximum operating draught range of the example ship, normal operations should only see a variance of a known value and it is recommended the draught readings are categorised into 0.05m interval groups. Given a data set with all parameters (sensors) operating, separate trends can be generated for operating at different draught groups, this could allow an adjustment factor to be applied throughout the speed range for any change in draught.
- the example vessel design trim range varied between a known maximum and minimum distance. To keep the data sets suitably sized it was recommended that this be split into 6 groups covering ranges of 0.15m. The system is able to generate speed power profiles for each of these groups, and the percentage difference to the propulsive power requirements at the design draught will be applied throughout the system.
- a speed/power plot can be categorised by the difference between the maximum and minimum draught observed in each minute period, highlighting what the maximum wave height is passing by the sensor. This can be completed by using the average wave height seen by all draught sensors. The forward draught sensor experiences the greatest interaction caused by ships motions, potentially exacerbating the wave height experienced.
- the Sea States are defined by the table below: Table - Sea State Wave Height Definition Sea State Wave Height (m) 0 0 1 0-0.1 2 0.1-0.5 3 0.5-1.25 4 1.25-2.5 5 2.5-4.0 6 4.0-6.0
- the trend line for Sea State 5 appears to fall below the propulsive power required for sea states 2, 3, and 4, which remain in the order expected, with increasing power required for increasing sea state.
- the trend lines for sea states 2, 3, and 4 converge and cross, which is not the expected result. This is accounted for by the decreasing number of data points for the various sea states, at faster operating speeds.
- Embodiments of the system can provide tactical feedback to operators to allow the operator to optimise a vessels performance. In doing so, it is important to understand the effects that the rudder angle and resulting turn might have on the vessel performance, characterised by the dataset.
- the table showing percentage effect of sea state on propulsive power requirement above illustrates that, proportionally, very little time is spent at large rudder angles, highlighting the reduced requirement to optimise the vessels performance during manoeuvring.
- the propulsive power and speed trends change with the change in rudder angle, with a clear increase in propulsive power required to hold a speed with increasing rudder angle.
- embodiments of the system may only use propulsive power against speed data where the ships rudder angle is less than 5 degrees.
- the resulting steps performed by the propulsive power algorithm 406 can be summarised as: at step 408 the values of the propulsion motors' power are added together. Then, at step 410, the trend is analysed to produce a profile/graph where the Y axis represents propulsive power and the X axis represents the speed through the water. At step 412 for the trend, the LINEST CUBIC portion is used to give x coefficients. Finally, comparative analysis is performed by varying displacement, sea state and trim. Percentage multipliers for changing factors are determined at step 414. The output of the algorithm can be passed to a vessel efficiency algorithm 415.
- Vessel efficiency can be based on a combination of propulsive power and service/hotel load power and how the power to meet demand is derived (prime mover/generator configuration). Typically, the greater the service load and the slower the ship below optimum cruise speed, the less efficient the transit. Similarly, the lower the service load and the closer to the optimum cruise speed the hull is operating at, the more efficient the ship.
- Inputs relating to prime mover power 402E, fuel flow 402F and prime movers on/off state 402G are received at step 416 to calculate fuel flow against power output curves for all engine configurations. This is then passed on to the primer mover efficiency algorithm 418.
- the fuel consumption, in litres per MW/hr generated, can then be calculated.
- the resulting steps performed by the prime mover efficiency algorithm 418 can be summarised as: at step 420, analyse the trend of the profile/graph where the Y axis represents fuel use (l/m) and the X axis represents the power generated.
- the linear function is calculated using the LINEST function for each engine configuration using a suitable algorithm. This output can then be passed to the vessel efficiency algorithm 415.
- the resulting steps performed by the vessel efficiency algorithm 415 can be summarised as: at step 426, the trend for total power required is calculated as corresponding to the power at each speed plus hotel load. In the resulting graph the X axis represents speed through water and the Y axis represents total power.
- the fuel use in l/MWhr for each prime mover configuration is calculated, based on total power required at speed.
- the fuel use in l/MWhr (at each speed, 1 knot intervals) is multiplied by the total power required in order to give the fuel flow rate in l/hr.
- the fuel flow rate (at each speed, 1 knot intervals) l/hr is divided by speed, nm/hr to get fuel efficiency in l/nm.
- the X axis represents speed through water and the Y axis fuel efficiency in l/nm.
- the outputs of the vessel efficiency algorithm 415 can be used to calculate the most efficient speed (process 434). Given an input representing hotel load, this process can find the minimum value on the fuel efficiency trend for operation on 1 GT or 2 GTs and any other combination, including use of DGs, to supply the required power. Use of energy storage to source the power can also be included here.
- the outputs of the vessel efficiency algorithm 415 can also be used to calculate the optimum engine and energy storage (where fitted) configuration (process 436). Given inputs representing a required speed and a hotel load, this process can find and display the corresponding fuel efficiency in l/nm at those values when operating on 1 GT or 2 GTs.
- the outputs of processes 434 and 436 can be passed on to the core module 216 at step 438 for further processing/display in the user interface.
- the Module 215B is focused on the display of platform usage monitoring data.
- the logic used to calculate this is a frequency count of each time there is an occurrence of a set of predefined conditions discussed below.
- Figure 6 describes the flow of data through Module 215B.
- Inputs representing live PMS data 602A and from data 602B from the data repository are received 604 by the core module 216, which produces outputs 606A - 606F that can then be used by various algorithms of the module 215B.
- the module 215B can include the following algorithms: Calculate Vessel Speed Profile; Auxiliary Electrical Load Profile; Prime Mover Configuration Profile; Prime Mover Configuration by Speed Profile; Total Prime Mover Power Output.
- the total number of minutes the total auxiliary electrical load at different values in steps of 0.1 MW was counted.
- the total auxiliary load can be rounded to the nearest 0.1 MW.
- the vessels configuration was calculated, based on the power output from the two gas turbines and two diesel generators. If the power output was greater than zero for a prime mover (and its associated alternator), then it was assumed to be operating.
- the sensors providing prime mover power output values can include: Prime Mover Power; FWD Gas Turbine Alternator; AFT Gas Turbine Alternator; FWD Diesel Generator and AFT Diesel Generator.
- Outputs of processes 608, 610 and 612 can be passed to the core module 216 by process 614.
- Module 215C is focussed on vessel energy management.
- the module allows the generation of 'what if' scenarios to highlight how 'energy saving measures', known as 'Energy Options', might affect the vessel's energy footprint through life.
- This module can integrate all the other modules to deliver complete situational awareness of the total energy status of a vessel and/or fleet of vessels (in a future module). This can couple all other modules into a coherent energy/fuel management module, linked to the GUI interface.
- This approach allows energy to be managed as a finite commodity, with inputs such as planned passage and mission profile and onboard electrical energy requirements for the duration of deployment, enabling prediction of future performance - 'what if scenario planning' and 'benefit/penalties' of integrating future notional energy reduction measures.
- Module 215C can provide:
- Figure 7 is a definition diagram for Module 215C and illustrates the principles to be applied.
- the inputs for the module can include: data 702A representing vessel usage profiling from the module 215B; data 702B representing vessel and prime mover data model from module 215A, and modification data 702C for a scenario, e.g. speed usage profile modified; hotel load reduction; vessel resistance reduction (all defined for entire speed profile).
- the data 702A and 702B can be used by process 704, which calculates fuel burn components - hotel load and propulsive power.
- the data 702A and 702B can also be used by process 706, which calculates fuel burn components - hotel load and propulsive power based on prime mover optimisation.
- the data 702B and 702C can be used by process 708, which calculates fuel burn components - hotel load and propulsive power based on modified data.
- process 710 which calculates the percentage improvements.
- process 712 which calculates the relevant percentage improvements.
- the system can then be 'tasked', dynamically, to help inform on the benefits (and penalties) of applying a single or range of future energy reduction technologies.
- This approach can enable the system performance to be estimated, to eliminate effects such as 'self-cancelling' energy measures, energy measures that will not return investment in the lifetime of the vessel, energy measures that only deliver benefit at selected speeds, etc.
- Embodiments of the system may also provide the ability to "plug in” future synthetic energy saving/recovery options.
- Energy saving measures fall into the following example broad categories:
- Embodiments of the system may predominantly address the 'Behavioural' aspects, but it is possible to extend the concept to estimate the benefits and penalties of introducing 'virtual' energy reduction measures and re-calculate what 'could have been saved' had the measure been introduced at a given point in the vessels lifecycle, based on historical usage and predict what could be saved in future, using the performance trends established in module 215A.
- Figure 8 illustrates the system concept Energy Reduction Cycle, with modules 215A and 215B providing the monitoring and 'self-evaluation' aspects, to help inform future improvements and planning for implementation.
- Embodiment of the system re 'open loop' as the sensor data is not routinely collected, derivations and relationships, described earlier in this document, are largely unknown and the interactions between parameters only now being fully understood.
- Embodiments of the system including implementation of Modules 215A and 215B can manage energy and fuel usage much more accurately and perform a series of notional 'what/if scenarios', to derive the impact, for display in the Graphical User Interface (GUI).
- GUI Graphical User Interface
- 'Energy 'Options' can be described through a series of attributes, key parameters as illustrated in Figure 8A . Each attribute has an impact on overall vessel performance, such as the effect of increased displacement on power/speed, operating cost (fuel and maintenance), endurance, etc.
- Embodiments of Module 215C can calculate any improvement (in fuel consumption, emissions and operating cost), based on the vessel performance established in module 215A and 215B.
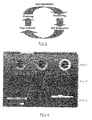
- Figures 9 onwards are screenshots from an example implementation of the system software. It will be understood that the format and type of information and user interface shown in these Figures is exemplary only and many variations are possible.
- Figure 9 shows an example "Data Readout" screen, which can display a real-time view of the ship sensor data. There may be no user interaction on this screen apart from the Info button (Area A), which provides a description of the screen.
- Area A shows the FWD & AFT Electrical Load, Power and Alternator data that is being fed into the CD and also their totals (FWD + AFT).
- Area B shows the Speed Through Water and the GT Fuel Flow Rate.
- Area C shows how the Gas Turbines (GTs) have been configured (e.g. both ON, FWD ON, etc.) Sea State, Air and Sea Temperatures, Rudder Angle and Draught measurements. (There are a number of anomalous sensor readings apparent on the example PMS, including, for example, Air temperature; Sea temperature; Port, starboard and Aft draught sensors.)
- GTs Gas Turbines
- Figure 10 shows an example "Sensors" screen, which can display an alternative real-time view of the PMS sensor data and/or allow changes to the Displacement and Trim settings.
- the user can select an alternative setting for the Displacement or Trim by pressing the arrows in Area A and selecting a preferred option from the drop down list.
- This screen shows the fidelity of the sensors. For example, red indicates that no readings were available from the PMS; amber indicates erratic or 'questionable' behaviour; and green indicates that this sensor is ok.
- Figure 11 shows an example OPS screen, which can comprise a behavioural dashboard - e.g. the instructions and key information delivered to an end user, including, for example: the current GT configuration (Area A); the actual fuel flow and speed (Area A); the relative % savings between the Live PMS data being read and the recommendations that the system is calculating in real time (Area B); recommendations about what GT configuration should follow in order to operate in the most efficient manner (Area C); recommendations about what speed the ship should follow in order to operate in the most efficient manner (Area C); the resultant GT fuel flows from following recommendations (Area C); the cumulative fuel saving (Area D) and/or the increased endurance (Area D).
- a behavioural dashboard e.g. the instructions and key information delivered to an end user, including, for example: the current GT configuration (Area A); the actual fuel flow and speed (Area A); the relative % savings between the Live PMS data being read and the recommendations that the system is calculating in real time (Area B); recommendations about what GT configuration should follow in order
- a user may be given the ability to choose between to optimisation modes by switching the dial located in Area C.
- the two optimisation choices are:
- Area A is a copy of the live sensor data being shown on the sensor readout screen.
- Area B shows the relative efficiency between the fuel flow being read from the live data and the fuel flow suggested by the chosen optimisation method.
- Area C shows the recommendations that the optimisation algorithms are making in order to drive the ship more efficiently. Boxes show speed and GT configuration choices and another box allows the user to fix the GT configuration to correspond with the GT configuration of the live data.
- the predicted fuel flow shows what the fuel flow would be if speed and configuration recommendations were enacted - it returns the lowest fuel flow point on the fuel flow curves.
- Area D shows the cumulative effect of savings - if the recommendations had been followed. In other words, it is a comparison between how the ship was driven and how the dashboard would drive the ship. This does not account for operation goals or constraints, e.g. the dashboard may recommend slowing down the ship, but this might have been unacceptable if the ship was on a time critical route and/or the increase charter costs outweigh any fuel saving, etc.
- Area D is dependent on which optimisation mode is chosen. While optimisation modes can be changed will the model is running, it is recommended a mode is initially chosen before starting the dashboard in order to see the full extent of savings.
- Figure 12 shows an example of the Detailed Analysis screen, which displays a demonstration of some of the key algorithmic outputs, adjusting in real time based on the live data being analysed. It is not intended for Ships / End User use or demonstration. Additionally, the screen also shows: the Electrical load (Total Alternator Power) requirement; the current speed through water from the PMS data; real-time (updating) graphs of Fuel flow versus speed, Propulsive Power required for speed and Fuel consumption versus power generated.
- the Electrical load Total Alternator Power
- the current speed through water from the PMS data real-time (updating) graphs of Fuel flow versus speed, Propulsive Power required for speed and Fuel consumption versus power generated.
- a user can select the tabs from Area B to choose the different graphs (Fuel flow versus speed, Propulsive Power required for speed or Fuel consumption versus Power Generated).
- a toggle scale button (Area C) is available. Pressing this button changes the scale so that the characteristic "Hockey Stick" curve can be seen more clearly. This neatly shows how different speeds or even different configurations can be selected and still have the same fuel flow rate.
- the info button (Area A) can provide a description of the screen.
- the Fuel flow Vs. Speed shows a comparison between fuel flow rates for a 1 or 2 GT operation, against the current speed through water. Curves indicate the different plots for 1GT (lower curve in the example) and 2GTs (upper curve in the example), respectively.
- the dot (below the "2.14" in the notional ship example) shows the current speed and configuration (If the dot is on the upper curve, the current GT configuration is 2GT, if on the lower curve it is 1 GT). Numbers indicate fuel flow.
- Another dot shows the alternate GT configuration, with the numbers ("1.36" in the notional ship example) indicating the alternate fuel flow. (Alternate refers to 1GT as opposed to 2GT and vice-versa). Highlighted dots (adjacent "0.15" and "0.20" in the example) indicate the lowest fuel flow on each respective curve, with their corresponding speed show in the blue boxes. Optimisation suggestions are created by using the lowest fuel flow, corresponding speed and configuration. Care should be taken to note the units used in this graph, fuel flow is in Cubes / nm.
- the purpose of the Propulsive Power Required for Speed graph is to show the propulsive electrical power that is required for the speed (read in from the sensor data) given sea state, trim and displacement, etc. A dot indicates the current speed.
- the Fuel Consumption Vs. Power Generated graph shows the power generated versus fuel consumption. Power generated refers to the total alternator power.
- the curve shows the fuel consumption versus power generation for 2 notional GTs, which adjusts in real time based on the inputs to the dashboard.
- the amber curve shows the same curve but for 1 GT.
- the dot indicates the current power generated (from the data) the amber and green figures show the fuel consumption for 1 GT & 2 GT, respectively. Another dot indicates the alternative configuration.
- Figure 13 shows an example of the "What if" screen that can provide a demonstration of how increased endurance may be visualised in a final system.
- the "Info" button provides a description of the screen.
- the screen shows an endurance envelope.
- a display of an initial envelope showing current endurance, based on an estimation of a number of variables - Sea State, Displacement, etc, can be provided.
- An alternative endurance envelope can then be overlaid - based on the fuel saved by following the recommended settings.
- Embodiments of the system can be implemented as both an 'offline' or 'online' decision making aid.
- the 'offline', or standalone, mode can offer the crew a detailed 'energy planning' aid, serving the needs of logisticians, navigation/passage and mission planners, alike.
- By knowing the energy performance of the vessel at a point in time and how to aim for the most energy efficient configuration, as well as being able to perform what/if scenario planning in real time can provide a very powerful capability - one input to the many complex decisions the crew have to make on a frequent basis. Being able to estimate if new or alternative passages is achievable is also an important capability.
- 'Economy mode' is not always to decrease speed, in some instances, for example when operating below 10 knots on 2 GTs, the recommendation may be to actually increase speed for the same fuel consumption, reaching the next waypoint ahead of schedule.
- Embodiments of the system may also be used to at least partially automate the operations of certain controller of vessel components.
- the way in which the prime movers of the vessel were operated and the available combinations determined the available data for analysis and the available options. For example, DG's were found to be predominantly used for hotel/auxiliary power generation and tended not to be used while underway for propulsion power. This usage profile was observed, captured and displayed in the system - thus, driving the prime mover logic/rule set. GTs are not be the most efficient way of operating the vessel at slow speed- where it would certainly be more efficient to use DGs for propulsion power, than operate one or two GTs. These operating procedures have been taken into account and directly influenced the Prime Mover selection ruleset within the system.
- Some embodiments can include a 'Foul Management' module which allows for the impact of fouling to be determined, as an input to the overall vessel performance profile. This can enable decisions to be made on when, for example, to run the vessel at full speed to remove any residual slime from the hull, or to set a 'trigger point' on when a hull scrub is required. Increased drag, caused by hull fouling, is a major contributing factor to increased fuel consumption. Monitoring and managing this aspect more closely in the system can provide a very early benefit in terms of savings in fuel consumption, through improved understanding of the rate of fouling and impact on fuel consumption and setting of 'threshold' points where maintenance/foul removal action is required.
- Some embodiments can include an 'Energy Usage and Endurance Planning' tool.
- a tool provides a valuable decision support tool for the crew, to estimate, using actual processed data acquired from the vessel, the effect of vessel operation on fuel consumption and remaining endurance. This can help with assessing feasibility and planning of tasking requests and planning refuelling operations, by knowing remaining endurance and setting a minimum fuel volume threshold, tracking consumption by the hour.
- This concept is illustrated in Figure 14 .
- the function allows the user to plan the speed profile of the vessel passage looking ahead (up to 72 hours in the example) and visualise the impact on fuel usage and endurance.
- Prime mover configurations can be set and, using the recommendations provided by the system, the most energy efficient configuration to achieve a given objective can be determined.
- the impact on distance travelled, fuel consumed, estimated time of arrival, cost and minimum fuel vessel stability threshold (remaining fuel volume - used as ballast) can all be visualised in one simple graphical interface.
- a Tide Adjustment Calculator (TAC) can improve the accuracy of the results, which accounts for the impact of tidal variations for the zone in which the vessel is operating.
- An implementation of the TAC adjustment is illustrated in Figure 15 .
- Combining option 4 above with the 'Energy Usage and Endurance Planning' tool, described earlier, can provide the crew with a significant enhancement to operational energy situational awareness and endurance planning.
- Such an embodiment of the system can permit the crew to ascertain the impact of their proposed speed profile for the next few days or the whole task at sea and allow what/if scenarios to be simulated on screen, ahead of actual execution. This is especially important where priorities change during execution of a passage plan.
- Embodiments of the device offer a flexible, scalable, rugged and low power solution to many different discrete input sensing requirements.
- Embodiments of the device can either be manufactured as an integral part of an electrical component to sense its state, or be added/retro-fitted onto an existing component.
- At least some embodiments of the invention may be constructed, partially or wholly, using dedicated special-purpose hardware.
- Terms such as 'component', 'module' or 'unit' used herein may include, but are not limited to, a hardware device, such as a Field Programmable Gate Array (FPGA) or Application Specific Integrated Circuit (ASIC), which performs certain tasks.
- FPGA Field Programmable Gate Array
- ASIC Application Specific Integrated Circuit
- elements of the invention may be configured to reside on an addressable storage medium and be configured to execute on one or more processors.
- functional elements of the invention may in some embodiments include, by way of example, components, such as software components, object-oriented software components, class components and task components, processes, functions, attributes, procedures, subroutines, segments of program code, drivers, firmware, microcode, circuitry, data, databases, data structures, tables, arrays, and variables.
- components such as software components, object-oriented software components, class components and task components, processes, functions, attributes, procedures, subroutines, segments of program code, drivers, firmware, microcode, circuitry, data, databases, data structures, tables, arrays, and variables.
Priority Applications (7)
| Application Number | Priority Date | Filing Date | Title |
|---|---|---|---|
| EP15275004.8A EP3042843A1 (fr) | 2015-01-09 | 2015-01-09 | Surveillance d'utilisation d'énergie d'un vaisseau maritime de surface |
| CA2973170A CA2973170C (fr) | 2015-01-09 | 2016-01-06 | Surveillance d'utilisation d'energie d'un navire maritime de surface |
| US15/542,348 US10370063B2 (en) | 2015-01-09 | 2016-01-06 | Monitoring energy usage of a surface maritime vessel |
| AU2016205934A AU2016205934B2 (en) | 2015-01-09 | 2016-01-06 | Monitoring energy usage of a surface maritime vessel |
| EP16700504.0A EP3242831A1 (fr) | 2015-01-09 | 2016-01-06 | Surveillance d'utilisation d'énergie d'un navire maritime de surface |
| PCT/GB2016/050017 WO2016110693A1 (fr) | 2015-01-09 | 2016-01-06 | Surveillance d'utilisation d'énergie d'un navire maritime de surface |
| AU2018101629A AU2018101629A4 (en) | 2015-01-09 | 2018-10-30 | Monitoring energy usage of a surface maritime vessel |
Applications Claiming Priority (1)
| Application Number | Priority Date | Filing Date | Title |
|---|---|---|---|
| EP15275004.8A EP3042843A1 (fr) | 2015-01-09 | 2015-01-09 | Surveillance d'utilisation d'énergie d'un vaisseau maritime de surface |
Publications (1)
| Publication Number | Publication Date |
|---|---|
| EP3042843A1 true EP3042843A1 (fr) | 2016-07-13 |
Family
ID=52347264
Family Applications (1)
| Application Number | Title | Priority Date | Filing Date |
|---|---|---|---|
| EP15275004.8A Ceased EP3042843A1 (fr) | 2015-01-09 | 2015-01-09 | Surveillance d'utilisation d'énergie d'un vaisseau maritime de surface |
Country Status (1)
| Country | Link |
|---|---|
| EP (1) | EP3042843A1 (fr) |
Cited By (5)
| Publication number | Priority date | Publication date | Assignee | Title |
|---|---|---|---|---|
| WO2018029397A1 (fr) * | 2016-08-09 | 2018-02-15 | Eniram Oy | Procédé et système d'optimisation de l'exploitation d'un navire |
| WO2018115569A1 (fr) * | 2016-12-22 | 2018-06-28 | Napa Oy | Procédé d'analyse d'opérations de flotte |
| US10521981B2 (en) * | 2017-06-06 | 2019-12-31 | Ge Aviation Systems Llc | Vehicle wash assessment |
| WO2020025336A1 (fr) * | 2018-07-31 | 2020-02-06 | Schottel Gmbh | Procédé d'évaluation de l'influence d'eaux peu profondes |
| CN111220813A (zh) * | 2020-01-13 | 2020-06-02 | 广州船舶及海洋工程设计研究院(中国船舶工业集团公司第六0五研究院) | 船舶的航速确定方法、续航里程确定方法、装置和系统 |
Citations (5)
| Publication number | Priority date | Publication date | Assignee | Title |
|---|---|---|---|---|
| US20090048726A1 (en) * | 2007-08-14 | 2009-02-19 | Lofall Marine Systems, Llc | Vessel performance monitoring system and method |
| EP2400271A1 (fr) * | 2010-06-24 | 2011-12-28 | Abb Oy | Procédé d'agencement pour contrôler la consommation d'énergie dans un navire |
| EP2669173A1 (fr) * | 2012-06-01 | 2013-12-04 | ABB Technology AG | Procédé et système dýévaluation de performance de bateau |
| EP2669172A1 (fr) * | 2012-06-01 | 2013-12-04 | ABB Technology AG | Procédé et système pour prédire la performance d'un navire |
| US20140336853A1 (en) * | 2013-05-10 | 2014-11-13 | ESRG Technology Group, LLC | Methods for automatically optimizing ship performance and devices thereof |
-
2015
- 2015-01-09 EP EP15275004.8A patent/EP3042843A1/fr not_active Ceased
Patent Citations (5)
| Publication number | Priority date | Publication date | Assignee | Title |
|---|---|---|---|---|
| US20090048726A1 (en) * | 2007-08-14 | 2009-02-19 | Lofall Marine Systems, Llc | Vessel performance monitoring system and method |
| EP2400271A1 (fr) * | 2010-06-24 | 2011-12-28 | Abb Oy | Procédé d'agencement pour contrôler la consommation d'énergie dans un navire |
| EP2669173A1 (fr) * | 2012-06-01 | 2013-12-04 | ABB Technology AG | Procédé et système dýévaluation de performance de bateau |
| EP2669172A1 (fr) * | 2012-06-01 | 2013-12-04 | ABB Technology AG | Procédé et système pour prédire la performance d'un navire |
| US20140336853A1 (en) * | 2013-05-10 | 2014-11-13 | ESRG Technology Group, LLC | Methods for automatically optimizing ship performance and devices thereof |
Non-Patent Citations (1)
| Title |
|---|
| RUIHUA LU ET AL: "VOYAGE OPTIMISATION: PREDICTION OF SHIP SPECIFIC FUEL CONSUMPTION FOR ENERGY EFFICIENT SHIPPING", LOW CARBON SHIPPING CONFERENCE, 10 September 2013 (2013-09-10), XP055202590, Retrieved from the Internet <URL:http://www.lowcarbonshipping.co.uk/files/ucl_admin/LCS 2013/Lu_et_al.pdf> [retrieved on 20150715] * |
Cited By (7)
| Publication number | Priority date | Publication date | Assignee | Title |
|---|---|---|---|---|
| WO2018029397A1 (fr) * | 2016-08-09 | 2018-02-15 | Eniram Oy | Procédé et système d'optimisation de l'exploitation d'un navire |
| US10501162B2 (en) | 2016-08-09 | 2019-12-10 | Eniram Oy | Method and system for optimising operation of vessel |
| US11292570B2 (en) | 2016-08-09 | 2022-04-05 | Wartsila Finland Oy | Method and system for optimizing operation of vessel |
| WO2018115569A1 (fr) * | 2016-12-22 | 2018-06-28 | Napa Oy | Procédé d'analyse d'opérations de flotte |
| US10521981B2 (en) * | 2017-06-06 | 2019-12-31 | Ge Aviation Systems Llc | Vehicle wash assessment |
| WO2020025336A1 (fr) * | 2018-07-31 | 2020-02-06 | Schottel Gmbh | Procédé d'évaluation de l'influence d'eaux peu profondes |
| CN111220813A (zh) * | 2020-01-13 | 2020-06-02 | 广州船舶及海洋工程设计研究院(中国船舶工业集团公司第六0五研究院) | 船舶的航速确定方法、续航里程确定方法、装置和系统 |
Similar Documents
| Publication | Publication Date | Title |
|---|---|---|
| AU2018101629A4 (en) | Monitoring energy usage of a surface maritime vessel | |
| EP3042843A1 (fr) | Surveillance d'utilisation d'énergie d'un vaisseau maritime de surface | |
| GB2533961A (en) | Monitoring energy usage of a surface maritime vessel | |
| JP5702466B2 (ja) | 船舶におけるエネルギー使用量の制御方法及び装置 | |
| Wang et al. | Voyage optimization combining genetic algorithm and dynamic programming for fuel/emissions reduction | |
| EP3330666A1 (fr) | Appareil de communication permettant d'adapter l'itinéraire réel d'un vaisseau | |
| WO2013178779A1 (fr) | Procédé et système de détermination d'un itinéraire pour un navire | |
| KR20150021970A (ko) | 선박의 성능을 예측하는 방법 및 시스템 | |
| JP6282569B2 (ja) | 船舶の運航支援システム及び船舶の運航支援方法 | |
| Soner et al. | Statistical modelling of ship operational performance monitoring problem | |
| AU2020218818B2 (en) | Method and system for reducing vessel fuel consumption | |
| Johansen et al. | Development and testing of a risk-based control system for autonomous ships | |
| Vettor et al. | Towards improving optimised ship weather routing | |
| Shaw et al. | Marine big data analysis of ships for the energy efficiency changes of the hull and maintenance evaluation based on the ISO 19030 standard | |
| KR101642752B1 (ko) | 선박운항정보 제공 방법, 이를 수행하는 선박운항정보 제공 서버 및 이를 저장하는 기록매체 | |
| WO2014128915A1 (fr) | Dispositif et procédé d'analyse de navigation, programme et support d'enregistrement | |
| Cha et al. | Towards a future electric ferry using optimisation-based power management strategy in fuel cell and battery vehicle application—A review | |
| CN112088122A (zh) | 船舶的实际海域推进性能评价方法、评价程序以及评价系统 | |
| Böttner | Weather routing for ships in degraded conditions | |
| Oneto et al. | Vessel monitoring and design in industry 4.0: A data driven perspective | |
| Pribyl | Autonomous vessels in the era of global environmental change | |
| Vettor et al. | A ship weather routing toll to face the challenges of an evolving maritime trade | |
| Vorkapić et al. | A framework for the application of shipboard energy efficiency monitoring, operational data prediction and reporting | |
| EP3901579B1 (fr) | Procédé d'aide à la navigation, dispositif d'aide à la navigation et programme d'aide à la navigation | |
| Durandt | Data-driven regression models for voyage cost optimisation based on the operating conditions of the SA Agulhas II |
Legal Events
| Date | Code | Title | Description |
|---|---|---|---|
| PUAI | Public reference made under article 153(3) epc to a published international application that has entered the european phase |
Free format text: ORIGINAL CODE: 0009012 |
|
| AK | Designated contracting states |
Kind code of ref document: A1 Designated state(s): AL AT BE BG CH CY CZ DE DK EE ES FI FR GB GR HR HU IE IS IT LI LT LU LV MC MK MT NL NO PL PT RO RS SE SI SK SM TR |
|
| AX | Request for extension of the european patent |
Extension state: BA ME |
|
| STAA | Information on the status of an ep patent application or granted ep patent |
Free format text: STATUS: THE APPLICATION HAS BEEN REFUSED |
|
| 18R | Application refused |
Effective date: 20160815 |