EP3003135B1 - Sévérité du risque hémodynamique basée sur la détection et la quantification du comportement de dysrythmie cardiaque en utilisant une forme d'onde de volume d'impulsion - Google Patents
Sévérité du risque hémodynamique basée sur la détection et la quantification du comportement de dysrythmie cardiaque en utilisant une forme d'onde de volume d'impulsion Download PDFInfo
- Publication number
- EP3003135B1 EP3003135B1 EP14807798.5A EP14807798A EP3003135B1 EP 3003135 B1 EP3003135 B1 EP 3003135B1 EP 14807798 A EP14807798 A EP 14807798A EP 3003135 B1 EP3003135 B1 EP 3003135B1
- Authority
- EP
- European Patent Office
- Prior art keywords
- peak
- time
- amplitude
- calculating
- computing device
- Prior art date
- Legal status (The legal status is an assumption and is not a legal conclusion. Google has not performed a legal analysis and makes no representation as to the accuracy of the status listed.)
- Active
Links
- 206010003119 arrhythmia Diseases 0.000 title claims description 44
- 238000001514 detection method Methods 0.000 title claims description 5
- 230000000004 hemodynamic effect Effects 0.000 title description 13
- 238000011002 quantification Methods 0.000 title description 2
- 239000006185 dispersion Substances 0.000 claims description 41
- 230000002547 anomalous effect Effects 0.000 claims description 18
- 230000006793 arrhythmia Effects 0.000 claims description 13
- 238000013178 mathematical model Methods 0.000 claims description 3
- 238000002847 impedance measurement Methods 0.000 claims description 2
- 238000002834 transmittance Methods 0.000 claims description 2
- 238000002604 ultrasonography Methods 0.000 claims description 2
- 238000002565 electrocardiography Methods 0.000 description 52
- 230000006399 behavior Effects 0.000 description 28
- 238000000034 method Methods 0.000 description 19
- 208000009729 Ventricular Premature Complexes Diseases 0.000 description 17
- 230000000747 cardiac effect Effects 0.000 description 16
- 230000002159 abnormal effect Effects 0.000 description 12
- 230000002861 ventricular Effects 0.000 description 10
- 238000004458 analytical method Methods 0.000 description 9
- 230000036541 health Effects 0.000 description 9
- 238000002560 therapeutic procedure Methods 0.000 description 9
- 206010047289 Ventricular extrasystoles Diseases 0.000 description 8
- 208000003734 Supraventricular Tachycardia Diseases 0.000 description 7
- 230000008602 contraction Effects 0.000 description 7
- 238000000502 dialysis Methods 0.000 description 7
- 230000002526 effect on cardiovascular system Effects 0.000 description 7
- 230000006870 function Effects 0.000 description 7
- 230000001225 therapeutic effect Effects 0.000 description 7
- 230000002763 arrhythmic effect Effects 0.000 description 5
- 239000008280 blood Substances 0.000 description 5
- 210000004369 blood Anatomy 0.000 description 5
- 230000000694 effects Effects 0.000 description 5
- 208000011316 hemodynamic instability Diseases 0.000 description 5
- 238000012544 monitoring process Methods 0.000 description 5
- 230000002107 myocardial effect Effects 0.000 description 5
- 206010003658 Atrial Fibrillation Diseases 0.000 description 4
- 238000004891 communication Methods 0.000 description 4
- 230000028161 membrane depolarization Effects 0.000 description 4
- 230000001575 pathological effect Effects 0.000 description 4
- 230000034225 regulation of ventricular cardiomyocyte membrane depolarization Effects 0.000 description 4
- 230000003068 static effect Effects 0.000 description 4
- 208000001871 Tachycardia Diseases 0.000 description 3
- 206010047281 Ventricular arrhythmia Diseases 0.000 description 3
- 230000005856 abnormality Effects 0.000 description 3
- 230000002411 adverse Effects 0.000 description 3
- 230000036772 blood pressure Effects 0.000 description 3
- 208000006218 bradycardia Diseases 0.000 description 3
- 238000004364 calculation method Methods 0.000 description 3
- 230000003247 decreasing effect Effects 0.000 description 3
- 238000002001 electrophysiology Methods 0.000 description 3
- 230000007831 electrophysiology Effects 0.000 description 3
- 230000001788 irregular Effects 0.000 description 3
- 239000000203 mixture Substances 0.000 description 3
- 208000031225 myocardial ischemia Diseases 0.000 description 3
- 230000007170 pathology Effects 0.000 description 3
- 230000006794 tachycardia Effects 0.000 description 3
- 208000003663 ventricular fibrillation Diseases 0.000 description 3
- 206010047302 ventricular tachycardia Diseases 0.000 description 3
- 206010015856 Extrasystoles Diseases 0.000 description 2
- 206010042600 Supraventricular arrhythmias Diseases 0.000 description 2
- 230000004075 alteration Effects 0.000 description 2
- 230000001746 atrial effect Effects 0.000 description 2
- 230000017531 blood circulation Effects 0.000 description 2
- 230000008859 change Effects 0.000 description 2
- 238000012512 characterization method Methods 0.000 description 2
- 238000007405 data analysis Methods 0.000 description 2
- 238000000354 decomposition reaction Methods 0.000 description 2
- 230000004064 dysfunction Effects 0.000 description 2
- 238000001631 haemodialysis Methods 0.000 description 2
- 230000000322 hemodialysis Effects 0.000 description 2
- 230000000302 ischemic effect Effects 0.000 description 2
- 238000005259 measurement Methods 0.000 description 2
- 238000012986 modification Methods 0.000 description 2
- 230000004048 modification Effects 0.000 description 2
- 238000012806 monitoring device Methods 0.000 description 2
- 210000004165 myocardium Anatomy 0.000 description 2
- 238000001208 nuclear magnetic resonance pulse sequence Methods 0.000 description 2
- 238000000718 qrs complex Methods 0.000 description 2
- 230000002336 repolarization Effects 0.000 description 2
- 230000033764 rhythmic process Effects 0.000 description 2
- 210000001013 sinoatrial node Anatomy 0.000 description 2
- 230000007704 transition Effects 0.000 description 2
- 230000000007 visual effect Effects 0.000 description 2
- 208000002102 Atrial Premature Complexes Diseases 0.000 description 1
- 206010003662 Atrial flutter Diseases 0.000 description 1
- 206010003671 Atrioventricular Block Diseases 0.000 description 1
- 208000006808 Atrioventricular Nodal Reentry Tachycardia Diseases 0.000 description 1
- 206010049765 Bradyarrhythmia Diseases 0.000 description 1
- 208000010271 Heart Block Diseases 0.000 description 1
- 206010021137 Hypovolaemia Diseases 0.000 description 1
- 206010021138 Hypovolaemic shock Diseases 0.000 description 1
- 206010033557 Palpitations Diseases 0.000 description 1
- 206010040639 Sick sinus syndrome Diseases 0.000 description 1
- 206010042602 Supraventricular extrasystoles Diseases 0.000 description 1
- 208000007502 anemia Diseases 0.000 description 1
- 238000010171 animal model Methods 0.000 description 1
- 230000003466 anti-cipated effect Effects 0.000 description 1
- QVGXLLKOCUKJST-UHFFFAOYSA-N atomic oxygen Chemical compound [O] QVGXLLKOCUKJST-UHFFFAOYSA-N 0.000 description 1
- 206010003668 atrial tachycardia Diseases 0.000 description 1
- 210000001992 atrioventricular node Anatomy 0.000 description 1
- 230000008901 benefit Effects 0.000 description 1
- 238000009529 body temperature measurement Methods 0.000 description 1
- 230000036471 bradycardia Effects 0.000 description 1
- 206010061592 cardiac fibrillation Diseases 0.000 description 1
- 230000005189 cardiac health Effects 0.000 description 1
- 210000004413 cardiac myocyte Anatomy 0.000 description 1
- 210000004027 cell Anatomy 0.000 description 1
- 239000003153 chemical reaction reagent Substances 0.000 description 1
- 210000000038 chest Anatomy 0.000 description 1
- 150000001875 compounds Chemical class 0.000 description 1
- 238000010276 construction Methods 0.000 description 1
- 238000003745 diagnosis Methods 0.000 description 1
- 238000010586 diagram Methods 0.000 description 1
- 230000009177 electrical depolarization Effects 0.000 description 1
- 238000005516 engineering process Methods 0.000 description 1
- 230000002600 fibrillogenic effect Effects 0.000 description 1
- 239000007789 gas Substances 0.000 description 1
- 210000002837 heart atrium Anatomy 0.000 description 1
- 230000004217 heart function Effects 0.000 description 1
- 238000009532 heart rate measurement Methods 0.000 description 1
- 208000004731 long QT syndrome Diseases 0.000 description 1
- 239000003607 modifier Substances 0.000 description 1
- 210000000107 myocyte Anatomy 0.000 description 1
- 239000001301 oxygen Substances 0.000 description 1
- 229910052760 oxygen Inorganic materials 0.000 description 1
- 230000036285 pathological change Effects 0.000 description 1
- 231100000915 pathological change Toxicity 0.000 description 1
- 230000037361 pathway Effects 0.000 description 1
- 230000008375 physiological alteration Effects 0.000 description 1
- 230000007084 physiological dysfunction Effects 0.000 description 1
- 230000035790 physiological processes and functions Effects 0.000 description 1
- 238000009258 post-therapy Methods 0.000 description 1
- 238000012545 processing Methods 0.000 description 1
- 230000002035 prolonged effect Effects 0.000 description 1
- 230000000541 pulsatile effect Effects 0.000 description 1
- 230000013577 regulation of ventricular cardiomyocyte membrane repolarization Effects 0.000 description 1
- 238000009531 respiratory rate measurement Methods 0.000 description 1
- 230000001020 rhythmical effect Effects 0.000 description 1
- 206010040560 shock Diseases 0.000 description 1
- 230000000638 stimulation Effects 0.000 description 1
- 230000002123 temporal effect Effects 0.000 description 1
- 238000012546 transfer Methods 0.000 description 1
- 230000001052 transient effect Effects 0.000 description 1
- 230000001960 triggered effect Effects 0.000 description 1
- 210000005166 vasculature Anatomy 0.000 description 1
- 238000009423 ventilation Methods 0.000 description 1
Images


Classifications
-
- A—HUMAN NECESSITIES
- A61—MEDICAL OR VETERINARY SCIENCE; HYGIENE
- A61B—DIAGNOSIS; SURGERY; IDENTIFICATION
- A61B5/00—Measuring for diagnostic purposes; Identification of persons
- A61B5/72—Signal processing specially adapted for physiological signals or for diagnostic purposes
- A61B5/7271—Specific aspects of physiological measurement analysis
- A61B5/7282—Event detection, e.g. detecting unique waveforms indicative of a medical condition
-
- A—HUMAN NECESSITIES
- A61—MEDICAL OR VETERINARY SCIENCE; HYGIENE
- A61B—DIAGNOSIS; SURGERY; IDENTIFICATION
- A61B5/00—Measuring for diagnostic purposes; Identification of persons
- A61B5/02—Detecting, measuring or recording pulse, heart rate, blood pressure or blood flow; Combined pulse/heart-rate/blood pressure determination; Evaluating a cardiovascular condition not otherwise provided for, e.g. using combinations of techniques provided for in this group with electrocardiography or electroauscultation; Heart catheters for measuring blood pressure
- A61B5/024—Detecting, measuring or recording pulse rate or heart rate
- A61B5/02416—Detecting, measuring or recording pulse rate or heart rate using photoplethysmograph signals, e.g. generated by infrared radiation
-
- A—HUMAN NECESSITIES
- A61—MEDICAL OR VETERINARY SCIENCE; HYGIENE
- A61B—DIAGNOSIS; SURGERY; IDENTIFICATION
- A61B5/00—Measuring for diagnostic purposes; Identification of persons
- A61B5/02—Detecting, measuring or recording pulse, heart rate, blood pressure or blood flow; Combined pulse/heart-rate/blood pressure determination; Evaluating a cardiovascular condition not otherwise provided for, e.g. using combinations of techniques provided for in this group with electrocardiography or electroauscultation; Heart catheters for measuring blood pressure
- A61B5/021—Measuring pressure in heart or blood vessels
- A61B5/02108—Measuring pressure in heart or blood vessels from analysis of pulse wave characteristics
-
- A—HUMAN NECESSITIES
- A61—MEDICAL OR VETERINARY SCIENCE; HYGIENE
- A61B—DIAGNOSIS; SURGERY; IDENTIFICATION
- A61B5/00—Measuring for diagnostic purposes; Identification of persons
- A61B5/24—Detecting, measuring or recording bioelectric or biomagnetic signals of the body or parts thereof
- A61B5/316—Modalities, i.e. specific diagnostic methods
- A61B5/318—Heart-related electrical modalities, e.g. electrocardiography [ECG]
- A61B5/346—Analysis of electrocardiograms
- A61B5/349—Detecting specific parameters of the electrocardiograph cycle
- A61B5/361—Detecting fibrillation
-
- A—HUMAN NECESSITIES
- A61—MEDICAL OR VETERINARY SCIENCE; HYGIENE
- A61B—DIAGNOSIS; SURGERY; IDENTIFICATION
- A61B5/00—Measuring for diagnostic purposes; Identification of persons
- A61B5/24—Detecting, measuring or recording bioelectric or biomagnetic signals of the body or parts thereof
- A61B5/316—Modalities, i.e. specific diagnostic methods
- A61B5/318—Heart-related electrical modalities, e.g. electrocardiography [ECG]
- A61B5/346—Analysis of electrocardiograms
- A61B5/349—Detecting specific parameters of the electrocardiograph cycle
- A61B5/363—Detecting tachycardia or bradycardia
-
- A—HUMAN NECESSITIES
- A61—MEDICAL OR VETERINARY SCIENCE; HYGIENE
- A61B—DIAGNOSIS; SURGERY; IDENTIFICATION
- A61B5/00—Measuring for diagnostic purposes; Identification of persons
- A61B5/74—Details of notification to user or communication with user or patient ; user input means
- A61B5/742—Details of notification to user or communication with user or patient ; user input means using visual displays
-
- A—HUMAN NECESSITIES
- A61—MEDICAL OR VETERINARY SCIENCE; HYGIENE
- A61B—DIAGNOSIS; SURGERY; IDENTIFICATION
- A61B8/00—Diagnosis using ultrasonic, sonic or infrasonic waves
- A61B8/02—Measuring pulse or heart rate
-
- A—HUMAN NECESSITIES
- A61—MEDICAL OR VETERINARY SCIENCE; HYGIENE
- A61B—DIAGNOSIS; SURGERY; IDENTIFICATION
- A61B8/00—Diagnosis using ultrasonic, sonic or infrasonic waves
- A61B8/52—Devices using data or image processing specially adapted for diagnosis using ultrasonic, sonic or infrasonic waves
- A61B8/5215—Devices using data or image processing specially adapted for diagnosis using ultrasonic, sonic or infrasonic waves involving processing of medical diagnostic data
- A61B8/5223—Devices using data or image processing specially adapted for diagnosis using ultrasonic, sonic or infrasonic waves involving processing of medical diagnostic data for extracting a diagnostic or physiological parameter from medical diagnostic data
Definitions
- Cardiac electrophysiology refers to the orchestration of electrical pulses that cause the myocardium to contract in a coordinated manner to efficiently pump blood into the arterial tree.
- Suboptimal physiological alterations that effect the cardiac myocyte milieu can compromise the myocyte function and adversely affect the electrical conduction tissue.
- the electrical pulse sequences of the heart may be altered leading to abnormal cardiac sinus rhythms thereby causing dysynchronous or suboptimal myocardial contractile behaviors.
- the electrical pulse sequences of the heart may be monitored using an electrocardiography (ECG) device.
- ECG electrocardiography
- An ECG device may use multiple electrodes placed across the thorax to obtain millivolt level electrical changes associated with the depolarization of the myocardium and subsequent contraction of the myocardial cells.
- Typical ECG patterns representing sequences of myocardial repolarization/depolarization events may be referred to as a PQRST ECG tracing.
- Contractile abnormalities can be characterized as irregular heartbeats or arrhythmias that may manifest as tachycardia, bradycardia, palpitations, or fibrillation. Practitioners having domain expertise in electrocardiology may be able to differentiate abnormal ECG patterns from normal ECG patterns. Practitioners may also be adept at recognizing specific types of arrhythmias via PQRST ECG tracing patterns or behaviors. These ECG patterns provide clues as to the nature or cause of the arrhythmia for purposes enabling treatment that may be part of cardiac health management. For example, arrhythmias can be used to identify numerous forms of physiological dysfunction that include thryroid dysfunction, anemia, myocardial ischemic conditions, and multiple electrical pathways that result in poor cardiac function. In these examples, the recognition of an arrhythmia serves as part of a patient assessment to either diagnose a pathology, thereby enabling its treatment, or top predict onset of a pathology, thereby enabling overall patient management.
- cardiac arrhythmias can result from myocardial ischemic conditions and result in decreased cardiac output. Decreased cardiac output may contribute to a hemodynamically unstable physiological state and predispose a patient to life threatening conditions. Therefore, a second purpose of arrhythmia detection may be to serve as part of a real-time hemodynamic monitoring tool. Integral to facilitating this clinical utility can be the ability to characterize the dysrhythmia behavior in terms of the severity of its adverse effect on cardiovascular hemodynamics. Use of physiological feedback of dysfunctional cardiac behavior in concert with other hemodynamic parameters can provide valuable information to characterize the overall physiologic behavior or state of a patient. Measures related to severity of cardiac related hemodynamic instability measures can provide valuable real-time feedback as a part of a hemodynamic monitor to manage patient stability and/or determine appropriate intervention for this purpose.
- the pulse waveform obtained from a pulse oximeter also referred to as a photoplethysmograph
- the photoplethysmograph is not capable of capturing electrophysiology signals.
- patterns based upon temporal alterations of the pulse waveform features can be used to recognize the severity of the adverse hemodynamic impact that the cardiac dysfunction exibits based upon the degree of specific waveform feature abnormality and frequency of incidence.
- the resultant clinical utility may be to provide either a standalone or component of a hemodynamic monitoring device that enables real-time feedback as a hemodynamic instability monitor based upon pre-identified photoplethysmograph pulse waveform features.
- US2001049476 discloses in a device or in a method for oscillometric measurement of the blood pressure, the pulse time differences are determined associated with the measurement of the blood pressure. Subsequent pulse time differences are stored in a storing unit and the distribution of pulse time differences is calculated in a calculating unit and compared in a comparing unit with predetermined reference values. If the distribution or the values of pulse time differences exceed a predetermined amount, an indication means is activated which indicates existence of arrhythmic activities.
- a device according to the invention is defined in independent claim 1.
- transient or prolonged myocardial ischemia may be one of the frequent causes of arrhythmias.
- myocardial ischemia, and the concomitant arrhythmias may result from hypovolemic shock such as induced during hemodialysis.
- segmental myocardial ischemia during hemodialysis may result in left ventricular regional wall motion abnormalities manifested by inconsistent left ventricular contractility patterns.
- an ECG trace may be used by a health care provider to monitor and diagnose the specific electrocardio-behavior responsible for specific arrhythimias, such a device may not provide information regarding anomalies in the hemodynamics of patient blood-flow.
- a pulse oximeter is a sensor capable of detecting the pulsatile flow of blood through the vasculature and producing a pulse waveform that can emulate an arterial pulse wave from a patient. Such a sensor can be used as a standalone monitoring device or may be readily integrated in a hemodynamic monitoring system.
- a pulse oximeter may include a photoplethysmograph.
- the pulse oximeter may not be capable of capturing cardiac electrophysiology signals.
- cardiac dysrhythmia may be deduced from alterations in normal pulse waveform patterns due to the effects of cardiac dysrhythmia on blood flow. The severity of the impact of such cardiac dysrhythmia on patient hemodynamic functions may be characterized by anomalous features in the pulse waveform patterns.
- the impact of cardiac dysrhythmia on hemodynamic functions may be characterized by specific anomalous pulse waveform features and the frequency of their occurrence.
- Methods of analyzing pulse volume waveform features derived from pulse oximeters (or similar devices) may be used by a health care provider to monitor hemodynamic instability in a patient, for example during a therapeutic procedure. Such methods may be embodied either in a standalone device or as a non-limiting component of a hemodynamic monitoring system.
- a real-time method to detect and quantify specific types of cardiac dysrhythmias by applying an algorithm-based "toolkit" to a pulse waveform captured from a photo-plethysmograph (PPG) or other source producing a pulse volume waveform.
- the toolkit may include functions to assess changes in one or more features of a patient's pulse volume waveform morphology to identify specific dysrhythmia patterns typically recognized using an ECG trace.
- Non-limiting examples of pulse waveform features may include a pulse amplitude and an inter-pulse occurrence time. In some embodiments, such features may be compared to one or more of such features maintained in one or more feature databases.
- a feature database may be derived from data obtained from a population of patients demonstrating such features.
- a feature database may be derived from one or more animal models.
- a feature database may be derived from data obtained from the same patient over time.
- a feature database may be derived from one or more mathematical models.
- dysrhythmias potentially characterizable by the disclosed method may include supraventricular arrhythmia, ventricular arrhythmia, and bradyarrhythmia.
- supraventricular arrhythmias may include, without limitation, premature atrial contraction, paroxysmal supraventricular tachycardia, bypass tract tachycardia, AV nodal reentrant tachycardia, atrial tachycardia, atrial flutter, and atrial fibrillation.
- ventricular arrhythmias may include, without limitation, premature ventricular contraction, ventricular tachycardia, ventricular fibrillation, and long QT syndrome.
- Some ventricular arrhythmias may include multi-geminal premature ventricular contraction, such as bigeminal premature ventricular contraction, trigeminal premature ventricular contraction, or quadrigeminal premature ventricular contraction. Bradyarrhythmias may include sinus node dysfunction and heart block.
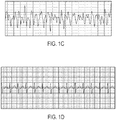
- FIGS. 1A through 1D illustrate various ECG trace patterns.
- FIG. 1A depicts a typical normal human ECG trace, illustrating features often used by health care providers to assess the nature of cardiac contractility.
- the ECG trace is frequently described in terms of the PQRST features, as indicated in FIG. 1A .
- the P feature generally corresponds to the depolarization of the atria of the heart, and is typically initiated at the sinoatrial node.
- the QRS complex typically corresponds to the ventricular depolarization, and typically is initiated at the atrioventricular node.
- the P-R time interval generally represents an electrical conduction time lag between the onset of atrial contraction and the onset of ventricular contraction.
- the Q-R time interval generally is the total time required for complete ventricular electrical depolarization and hence ventricular contraction.
- the T feature corresponds to the repolarization of the ventricular tissue
- the S-T interval is a lag time between ventricular depolarization and the onset of ventricular re-polarization.
- Other features may be found in an abnormal ECG depending on the pathology. Not shown in FIG. 1A is an R-R interval that generally corresponds to the time between successive ventricular contractions. For a normally functioning heart, the R-R interval is related to the heart rate.
- FIG. 1B illustrates an ECG trace of a premature ventricular contraction (PVC) cardiac event.
- PVC premature ventricular contraction
- three normal PQRST features 110a,b,c
- a group of sequential ventricular depolarizations 120 are illustrated. It may be noted that the ventricular contractions may be considered a group of QRS complexes without either a leading P wave (indicating atrial contraction) or following T wave (indicating complete ventricular repolarization).
- three such sequential ventricular depolarizations 120 are depicted, a condition typically termed ventricular tachycardia.
- FIG. 1C illustrates an ECG trace resulting from ventricular fibrillation.
- no normal PQRST features may be observed, and the ECG trace indicates that the ventricular tissue rapidly depolarizes without any observable rhythm.
- FIG. 1D illustrates an ECG trace related to supraventricular tachycardia.
- a generally normal but narrowed QRS feature may be observed and the R-R interval may be decreased.
- the P wave and T wave may be merged.
- the supraventricular tachycardia may be caused by a re-entrant stimulation at the sinoatrial node.
- FIG. 1D may depict such a sinoatrial re-entrant tachycardia.
- FIGS. 2A and 2B illustrate a porcine ECG tracing and corresponding pulse volume waveforms (for example, from a plethysmograph), respectively.
- the ECG tracing in FIG. 2A illustrates number of normal ECG waveforms 205 along with three abnormal ECG waveforms ( 210a, 210b, and 210c ).
- the corresponding pulse volume waveforms in FIG. 2B illustrates normal pulse volume waveforms 215 along with three abnormal pulse volume waveforms ( 220a, 220b, and 220c ).
- the structure of the abnormal pulse volume waveforms ( 220a, 220b, and 220c ) may demonstrate premature ventricular contractions that may be manifested as ectopic or missed beats. It may be appreciated that at least some abnormal ECG waveforms ( 210a, 210b, and 210c ) may present equivalent abnormal pulse volume waveforms ( 220a, 220b, and 220c ) in the pulse volume trace.
- FIG. 2C illustrates a group of normal pulse volume waveforms 215 followed by a group of abnormal pulse volume waveforms 230.
- the apparent triplet structure manifested in the abnormal pulse volume waveform 230 may demonstrate premature ventricular contractions indicating quadrigeminy.
- the pulse volume waveform trace depicted in FIG. 2C may indicate that the anomalous heart depolarizations are maintained over some period of time and may therefore represent a pathological condition.
- FIG. 2D illustrates a group of abnormal pulse volume waveforms that do not appear to show any rhythmic or amplitude regularity. Such irregular pulse volume waveforms may be an indication for atrial fibrillation.
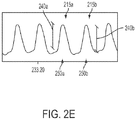
- FIG. 2E depicts an expanded view of some pulse volume waveforms illustrated in FIG. 2B . While the ECG structure may be complex, as indicated by the PQRST waveforms as depicted in FIG. 1 , pulse volume waveforms 215a,b may appear to have a simpler morphology. Such pulse volume waveforms 215a,b may generally be described as a plurality of single peaks, each of which is characterizable by a peak amplitude 240a,b (corresponding to peaks 215a and 215b, respectively) and a time of peak occurrence 250a,b (corresponding to peaks 215a and 215b, respectively).
- Additional characterizations may include a measure of peak width (such as half-width at half-maximum or full-width at half-maximum) and a measure of peak symmetry about the peak maximum.
- a pulse volume waveform peak amplitude difference may be calculated as the difference in peak amplitude between successive peaks 215a,b.
- a pulse volume waveform peak difference may be calculated as a difference between the peak amplitude 240b of pulse volume peak 215b and the peak amplitude 240a of pulse volume peak 215a.
- a pulse volume waveform time occurrence difference may be calculated as the difference in peak time occurrence between successive peaks 215a,b.
- a pulse volume waveform time occurrence difference may be calculated as a difference between the peak occurrence time 250b of pulse volume peak 215b and the peak occurrence time 240a of pulse volume peak 215a.
- FIGS. 3A and 3B depict non-limiting examples of such displays showing variations in peak amplitude differences ( FIG. 3A ) and peak time occurrence differences ( FIG. 3B ). It may be observed that significant changes in peak amplitude differences and peak time occurrence differences may occur at about the same time. However, significant changes in peak amplitude differences and peak time occurrence differences may also occur independently of each other.
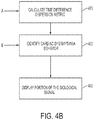
- a biological signal, emulating a plurality of arterial pulse volume waveforms, may be received 410 by a computing device from a sensor associated with a human body such as from a patient undergoing a therapeutic procedure.
- a sensor may include one or more of a plethysmograph, a transmittance photo-optic sensor, a reflective photo-optic sensor, a pressure transducer, a tonometry device, a strain gauge, an ultrasound device, an electrical impedance measurement device, and a radar device.
- the sensor may be a photoplethysmograph.
- Such sensors may be in physical contact with the patient's skin surface, within the patient, or may be placed at some distance from the patient.
- the computing device may identify 420 the occurrence of pulse volume peaks within the plurality of pulse volume waveforms.
- the computing device may identify 420 the pulse volume peaks based on maximum pulse volume peak amplitudes, minimum pulse volume amplitudes, or fitting at least a portion of one or more of the pulse volume waveforms to a mathematical model, such as a parabola.
- the computing device may identify 430 or calculate a peak amplitude value for each of the pulse volume peaks.
- the computing device may further calculate 440 a difference between peak amplitudes.
- the difference between peak amplitudes may be calculated for any two peaks, regardless of the times of their occurrences.
- the amplitude difference calculated 440 by the computing device may correspond to an amplitude difference between succeeding peaks (that is, a difference in amplitude between a first peak and a second peak occurring immediately thereafter).
- the computing device may also identify 435 the time at which each pulse volume peak occurs.
- the computing device may further calculate 445 a difference between peak time occurrences.
- the difference between peak time occurrences may be calculated for any two peaks, regardless of the times of their occurrences.
- the time occurrence difference (or time difference) calculated 445 by the computing device may correspond to a time difference between succeeding peaks (that is, a time difference between a first peak and a second peak occurring immediately thereafter).
- the computing device may compare 450 each amplitude difference with an amplitude difference threshold.
- the amplitude difference threshold may be provided to the computing device by a computing device user.
- the amplitude difference threshold may be calculated by the computing device.
- the computing device may calculate the amplitude difference threshold from an amplitude difference baseline plus an amplitude difference offset.
- the amplitude difference baseline may be calculated by the computing device from at least a portion of peak amplitude differences occurring within a data window.
- the data window may be characterized by one or more of a start time, a stop time, and a window duration. In some non-limiting examples, the data window may have a window duration of about 1 minute to about 24 hours.
- Non-limiting examples of such time window durations may include time durations of about 1 minute, about 2 minutes, about 5 minutes, about 10 minutes, about 20 minutes, about 30 minutes, about 1 hour, about 2 hours, about 5 hours, about 10 hours, about 20 hours, about 24 hours, and ranges between any two of these values including endpoints.
- Values characterizing the data window may include static values accessible by the computing device, one or more values supplied by a computing device user, or a combination thereof.
- the amplitude difference baseline may be calculated as an average of peak amplitude differences of at least a portion of peak amplitude differences occurring within the data window. In other non-limiting examples, the amplitude difference baseline may be calculated as the maximum peak amplitude difference of at least a portion of peak amplitude differences occurring within the data window.
- the data window may be chosen to include one or more pulse volume waveforms for a patient showing normative cardiac activity as determined either by the pulse volume waveforms or an ECG waveform.
- the amplitude difference offset may be calculated from the average of peak amplitude differences.
- Non-limiting examples of such amplitude difference offsets may be calculated as fractions of the amplitude difference baseline, for example the value of the average peak amplitude difference. Examples of such fractions may include 0.05, 0.1, 0.15, 0.2, 0.25, 0.3, 0.35, 0.4, 0.45, 0.5, and ranges between any two of these values including endpoints.
- the fraction used to calculate the amplitude difference offset may be derived from the variability of normative peak amplitude differences from the patient.
- the fraction used to calculate the amplitude difference offset may be derived from the variability of normative peak amplitude differences of a group of patients.
- a non-limiting range in values of the amplitude threshold may include values of about 1.05 to about 1.5 times the amplitude difference baseline. In some embodiments, the non-limiting range in values of the amplitude threshold may include values of about 1.05 to about 1.5 times the average of amplitude differences. In other embodiments, a non-limiting value of the amplitude threshold may be about 1.2 times the peak amplitude baseline.
- the computing device may compare 455 each time difference with a time difference threshold (or time threshold).
- the time threshold may be provided to the computing device by a computing device user.
- the time threshold may be calculated by the computing device.
- the computing device may calculate the time threshold from a peak time difference baseline plus a peak time difference offset.
- the peak time difference baseline may be calculated by the computing device from at least a portion of peak time differences occurring within a data window.
- the data window may be characterized by one or more of a start time, a stop time, or a window duration.
- the data window may have a window duration of about 1 minute to about 24 hours.
- Non-limiting examples of such time window durations may include time durations of about 1 minute, about 2 minutes, about 5 minutes, about 10 minutes, about 20 minutes, about 30 minutes, about 1 hour, about 2 hours, about 5 hours, about 10 hours, about 20 hours, about 24 hours, and ranges between any two of these values including endpoints.
- Values characterizing the data window may include static values accessible by the computing device, one or more values supplied by a computing device user, or a combination thereof.
- the peak time difference baseline may be calculated as the reciprocal of the patient's average normative pulse rate. In one non-limiting example, if a patient's average pulse rate is 1 bpm (1 beat per minute), the peak time difference baseline may be 1000 msec. In other non-limiting examples, the peak time difference baseline may be calculated from a histogram of a plurality of peak time differences (see below). In one non-limiting example, the peak time difference baseline may be calculated as the peak time difference having the greatest number of occurrences in the histogram. In some non-limiting examples, the plurality of peak time differences in the histogram may be chosen during a time window in which the patient demonstrates normative cardiac activity as determined either by the pulse volume waveforms or an ECG waveform.
- Non-limiting examples of such peak time difference offsets may be calculated as fractions of the peak time difference baseline, for example the value of the peak time difference having the greatest number of occurrences in the histogram. Examples of such fractions may include 0.05, 0.1, 0.15, 0.2, 0.25, 0.3, 0.35, 0.4, 0.45, 0.5, and ranges between any two of these values including endpoints.
- the fraction used to calculate the peak time difference offset may be derived from the width of a peak in the time difference histogram corresponding to the patient normative pulse rate.
- the fraction used to calculate the peak time difference offset may be derived from the variability of normative pulse rates taken from a group of patients.
- a non-limiting range in values of the time threshold may include values of about 1.05 to about 1.5 times the peak time difference baseline. In other embodiments, a non-limiting value of the time threshold may be about 1.2 times the peak time difference baseline.
- the computing device may also calculate 470 one or more time difference dispersion metrics from at least some portion of time differences.
- calculating 470 one or more time difference dispersion metrics may include calculating a histogram from at least a portion of the plurality of time differences and calculating, by the computing device, the at least one time difference dispersion metric from the histogram.
- the histogram may be calculated from peak time differences occurring within a data window.
- the data window may be characterized by one or more of a start time, a stop time, or a window duration. In some non-limiting examples, the data window may have a window duration of about 1 minute to about 24 hours.
- Non-limiting examples of such time window durations may include time durations of about 1 minute, about 2 minutes, about 5 minutes, about 10 minutes, about 20 minutes, about 30 minutes, about 1 hour, about 2 hours, about 5 hours, about 10 hours, about 20 hours, about 24 hours, and ranges between any two of these values including endpoints.
- a number of metrics may be determined to characterize features found within a histogram.
- Some non-limiting examples may include one or more of a maximum value of at least one histogram peak, a value of a width metric of the at least one histogram peak, and a histogram difference time corresponding to the maximum value of the at least one histogram peak. Any one or more of such histogram metrics may be used to calculate the one or more time difference dispersion metrics. Examples of such histograms and metrics derived therefrom are discussed in more detail with respect to FIGS. 6A-6D , disclosed below.
- each pair of pulse volume waveform peaks has an associated amplitude difference and an associated time difference.
- Criteria 460 for identifying a cardiac dysrhythmia behavior may include a requirement that the amplitude difference between a pair of pulse volume waveform peaks exceeds the amplitude threshold, and the time difference associated with the same pair of pulse volume waveform peaks exceeds the time threshold. It may be understood that an amplitude difference exceeding the amplitude threshold may be considered an anomalous amplitude difference. It may be further understood that a time difference exceeding the time threshold may be considered an anomalous time difference. Consequently, the pair of pulse volume waveform peaks giving rise to the anomalous amplitude difference and anomalous time difference may also be considered anomalous.
- Dysrhythmic behavior may be identified 480 based on the above criteria 460 along with the one or more time difference dispersion metrics.
- a pulse time difference that exceeds a histogram difference time corresponding to the time difference associated with a patient normative pulse rate may be used to identify 480 a dysrhythmia event.
- the appearance of multiple histogram peaks may be used to identify 480 a dysrhythmia event.
- a histogram peak associated with a patient normative pulse rate having a histogram peak width that exceeds the normative peak width associated with the patient normative pulse rate may be used to identify 480 a dysrhythmia event.
- the one or more time difference dispersion metrics may be used for other purposes.
- an algorithm to calculate an amplitude threshold value or a time threshold value may be chosen, by the computing device, based on the one or more time difference dispersion metrics.
- the amplitude threshold value may be calculated from an average of pulse amplitudes for one value of at least one dispersion metric.
- the amplitude threshold value may be calculated from a maximum value of pulse amplitudes for a different value of at least one dispersion metric.
- the biological signal along with any one or more of the amplitude difference, time difference, time difference histograms, or time difference dispersion metrics may be displayed 490 by the computing device.
- FIG. 5 is a block diagram of an embodiment of at least some components that may compose the computing device.
- a bus 528 may serve as the main information highway interconnecting the other illustrated components of the hardware.
- CPU 502 is the central processing unit of the system, performing calculations and logic operations required to execute at least some calculations for the method.
- Read only memory (ROM) 518 is one non-limiting example of a static or non-transitory memory device
- random access memory (RAM) 520 is one non-limiting example of a transitory or dynamic memory device.
- a controller 504 may interface the system bus 528 with one or more optional disk drives 508.
- These disk drives may include, for example, external or internal DVD drives, CD ROM drives, or hard drives.
- Program instructions for calculations or other computing device functions may be stored in the ROM 518 and/or the RAM 520.
- program instructions may be stored on one or more computer readable media such as a compact disk, a digital disk, and other recordable media.
- program instructions may be provided to the computing device via a communications signal or a carrier wave.
- pulse volume waveform data or other data used by the computing device may be stored on one or more removable memory devices that may include, as non-limiting examples, a removable disc, a removable card, a removable memory stick, a flash drive, a removable SIM chip, a writable CD-ROM or DVD disk, and/or a miniature data tape. Such devices may be used to transfer data from the computing device to another data receiving device such as a home computer.
- An optional display interface 522 may permit information from the bus 528 to be displayed on a display device 524 in audio, graphic, or alphanumeric format.
- Additional output interface devices may include a printer, a barcode printer, an LCD panel device, a touch screen device, an audio device, an LED panel, an OLED panel device, one or more individual LEDs, either as separate displays or grouped together, and a haptic device. Communication with external devices may occur using various communication ports 526.
- the computing device may also include an interface 512 which may allow for receipt of data from input devices such as a keyboard 514 or other input devices 516 such as a touch screen, a mouse, a remote control, a pointing device, a pushbutton, a haptic device, a voice recognition device, a proximity sensor, a motion detection sensor, a directional pad, and/or a joystick.
- input devices such as a keyboard 514 or other input devices 516 such as a touch screen, a mouse, a remote control, a pointing device, a pushbutton, a haptic device, a voice recognition device, a proximity sensor, a motion detection sensor, a directional pad, and/or a joystick.
- biological signals acquired by a pulse volume sensor may be communicated to the computing device via a sensor input 515 through the interface 512 to the bus 528.
- Such biological signals may be presented to the computing device as either analog signals or digital signals.
- the computing device may also include hardware components configured to convert the analog signals into digital signals.
- Non-limiting examples of such hardware components may include one or more of a sample and hold device, an analog-to-digital converter, and a voltage reference.
- Such hardware components may be present as independent devices, one or more combination devices, or one or more detachable modules that may be placed in data communication with the sensor input 515, the interface 512,or the bus 528.
- the computing device may include one or more separate digital interfaces to receive the digital biological signals.
- Such digital interfaces may include, without limitation, one or more of a parallel interface, a serial interface, an IR interface, a radio frequency interface, and a personal area network interface.
- such a computing device may receive sensor data from additional biological signal detectors including, without limitation, an ECG device, a patient temperature measurement device, a patient respiratory measurement device, and a patient heart rate measurement device.
- biological signal data from these or other biological signal detecting devices may be used as part of the method for identifying or characterizing cardiac dysrhythmia behavior.
- the computing device may also be configured to receive data from additional devices such as from one or more therapeutic devices including, for example, a dialysis device or a ventilator. Data from such therapeutic devices may be included in one or more output displays by the computing device to assist a health care professional in correlating a cardiac dysrhythmia behavior with the operation of the one or more therapeutic devices.
- the computing device may include instructions to predict possible cardiac dysrhythmia behavior based on data from the one or more therapeutic devices along with biological signal data from the one or more biological signal detecting devices.
- a time difference dispersion may be defined as the amount of variation in the time difference between the time occurrences of successive pulse waveform peaks.
- Time difference dispersion may be represented graphically in any number of formats as known to those with skill in the art.
- One example of a graphical display of dispersion may include a histogram.
- a histogram is a graph of the number of occurrences of each of a number of data values taken within a sample window.
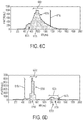
- FIGS. 6A-D depict examples of histograms displaying the dispersion of the time difference between successive pulse waveform peaks.
- FIG. 6A illustrates a histogram of time differences between successive pulse waveform peaks for a patient showing normative (typical or non-pathological) electrocardiac behavior.
- the histogram in FIG. 6A is composed of a narrow primary peak 605a centered around a primary time difference 610a of about 750 msec.
- the primary peak 605a may represent a normal pulse time (reciprocal pulse rate) corresponding to a pulse rate of about 45 bpm (beats per minute).
- the primary peak 605a may be characterized by any number of dispersion metrics including, for example, a primary time difference 610a and a primary amplitude 615a.
- the primary peak 605a may also be characterized by a primary peak width 620a.
- a histogram peak width metric may be calculated according to any method known to one skilled in the art including, without limitation, a half-width at half-maximum (HWHM) or a full-width at half-maximum (FWHM). More complex metrics for the width of the hisogram peak may be derived from a fit of the peak to a known curve (such as a Gaussian function) having known parameters associated with the curve spread (such as a Guassian function ⁇ parameter).
- HWHM half-width at half-maximum
- FWHM full-width at half-maximum
- More complex metrics for the width of the hisogram peak may be derived from a fit of the peak to a known curve (such as a Gaussian function) having known parameters associated with the curve spread (such as a Guassian function ⁇ parameter).
- FIG. 6B illustrates a histogram of time differences between successive pulse waveform peaks for a patient having multifocal premature ventricular beats.
- the histogram in FIG. 6B is composed of a symmetric primary peak 605b centered around a primary time difference 610b of about 900 msec along with two secondary peaks 607a,b centered around respective secondary time differences 612a,b of about 200 msec and about 1800 msec.
- the primary peak 605b may be characterized by any number of dispersion metrics including, for example, a primary time difference 610b and a primary amplitude 615b.
- the primary peak 605b may also be characterized by a primary peak width 620b.
- the two secondary peaks 607a,b do not appear to be symmetric based on their respective secondary peak widths 622a,b.
- the two secondary peaks 607a,b may be characterized by any number of dispersion metrics including, for example, secondary time differences 612a,b (respectively) and secondary amplitudes 617a,b (respectively).
- a histogram peak width metric associated with the primary peak width 620b may be readily described by a single value, such as HWHM or FWHM, a more complex description of a histogram peak width metric for the two secondary peaks 615b,c may be required based on the asymmetry of their respective widths 622a,b.
- FIG. 6C illustrates a histogram of time differences between successive pulse waveform peaks for a patient with atrial fibrillation showing general variability of the R-R time interval in the ECG.
- the histogram in FIG. 6C is composed of a broad asymmetric primary peak 605c having a peak amplitude 615c located at a primary time difference 610c of about 800 msec.
- the broad asymmetric primary peak 605c may be the only detectable peak in the histogram. Alternatively, the primary peak 605c may overlap to some extent a secondary peak 607c.
- the primary peak 605c may be characterized by any number of dispersion metrics including, for example, a primary time difference 610c and a primary amplitude 615c.
- FIG. 6D illustrates a histogram of time differences between successive pulse waveform peaks for a patient showing supraventricular tachycardia.
- the histogram in FIG. 6D is composed of a narrow symmetric primary peak 605d having a peak amplitude 615d located at a primary time difference 610d of about 700 msec.
- the primary peak 605d may be characterized by any number of dispersion metrics including, for example, a primary time difference 610d and a primary amplitude 615d.
- the primary peak 605d may also be characterized by a primary peak width 620d.
- At least one secondary peak 607d centered around a secondary time difference 612c of about 1300 msec may also be observed.
- the observed secondary peak 607d may be composed of two closely spaced peaks including some overlap.
- the observed secondary peak 607d may be characterized by a secondary peak amplitude 617c and secondary peak width 622c.
- More complex analyses of FIG. 6D may further include a decomposition of the observed secondary peak 607e into two overlapping peaks, each separately characterized by one or more histogram metrics.
- the histogram metrics disclosed above with respect to FIGS. 6A-6D constitute non-limiting examples, and other metrics derived from analyses of such histograms are also anticipated. Any one or more of the time difference histogram metrics may be incorporated into the method as one or more time difference dispersion metrics. Alternatively, the one or more time difference histogram metrics may be used by the computing device to calculate additional time difference dispersion metrics.
- sample histograms presented in FIGS. 6A-6D may be taken merely as representative histograms for each of the identified arrhythmic behaviors, and should not be identified as being definitively diagnostic of the identified arrhythmic behaviors.
- Alternative histograms may be obtained from patients diagnosed with any of the identified arrhythmic behaviors, and patients having arrhythmic behaviors not otherwise specified hereinabove may provide histograms similar to those depicted in FIGS. 6A-6D .
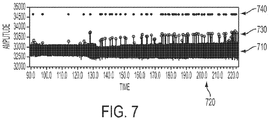
- Example 1 An Annotated Output Display of Pulse Waveform Data
- FIG. 7 illustrates an example of at least a portion of an annotated output display of porcine pulse waveform data.
- the display may be presented to a user as an updated series of static snapshots taken during successive time windows of pulse waveform data.
- the display may be a continuously scrolling display over time.
- the display may include a display of data 710 calculated from the pulse waveforms obtained by the sensor. Such displayed data 710 may include one or more of raw sensor data, filtered sensor data, and amplified sensor data.
- the output display may also include a time scale 720 to indicate times associated with features in the displayed data 710.
- the display may be annotated with any number of indicia to provide visual information to the user regarding the displayed data 710.
- Indicia may include peak indicia 730 to note the occurrence of pulse waveform peaks.
- Indicia may also include dysrhythmia indicia 740 to alert a user that of one or more coronary dysrhythmia events.
- dysrhythmia indicia 740 may also include visual cues (such as color coding or shape coding) to inform the user of the type of dysrhythmia event.
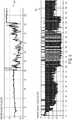
- FIG. 8A illustrates an example of the relation of a pulse volume waveform trace 810 to its associated ECG trace 820, specifically for a patient demonstrating quadrigeminy premature ventricular contractions.
- the pulse volume waveform trace 810 begins with normal pulse volume waveforms 813 that transition to quadrigeminy premature ventricular contractions 817 that are maintained for the duration of the trace.
- the ECG trace 820 taken concurrently with the pulse volume waveform trace 810, shows similar behavior. It may be observed that the ECG trace 820 begins with ECG waveforms showing normal morphology 823 that then transition to ECG waveforms showing anomalous morphologies 827.
- the time scale displays of the pulse volume waveform trace 810 and its associated ECG trace 820 are not identical, the change in the pulse volume waveform morphology occurs at the same time as the change in ECG waveform morphology. In this manner, it can be observed that the pulse volume waveforms may be used to indicate changes in cardiac contractility.
- FIG 8A Dispersion analyses of the pulse volume waveform trace 810 and ECG waveform trace 820 are also depicted in FIG 8A .
- a histogram of time differences between successive pulse volume waveforms 830 depicts a broad, symmetric central peak surrounded by two smaller and asymmetric peaks (see also FIG 6B ).
- a histogram of R-R interval times (from the ECG) 840 depicts a similar morphology as the time difference histogram of successive pulse volume waveforms 830.
- FIG. 8B illustrates an example of the relation of a pulse volume waveform trace 850 to its associated ECG trace 860, specifically for a patient demonstrating a wide variation in cardiac contractility. Both the pulse volume waveform trace 850 and the concurrently obtained ECG trace 860 depict similar irregular behavior. Dispersion analyses of the pulse volume waveform trace 850 (see also FIG. 6C ) and ECG waveform trace 860 were calculated as disclosed above. A histogram of time differences between successive pulse volume waveforms 870 and a histogram of R-R interval times (from the ECG) 880 were obtained by this method.
- Example 3 An Annotated Output Display of Patient Data of a Patient Undergoing Dialysis Therapy
- an output display may include additional annotations including, but not limited to, date and time, patient identification information, patient diagnosis information, warning indicators, arrhythmia grading indicators, and data associated with a therapeutic device if the patient is undergoing a therapeutic procedure during pulse wave monitoring.
- FIG. 9 illustrates a non-limiting example of a computing device real-time output display to indicate the status of a patient undergoing dialysis. Exemplary data presented on such a display may include patient blood pressure 910, percent changes in patient pulse rate 930, percent changes in pulse strength 940, and patient blood oxygen saturation levels 950.
- An indicator regarding patient status may also be provided to a user of the computing device.
- the warning indicator 920 may be triggered if any data associated with patient status, including data associated with pulse waveform peak amplitude differences, pulse waveform peak time differences, and one or more time difference dispersion metrics meet one or more warning criteria.
- Such warning criteria may be based, for example, on one or more arrhythmia grading systems. Exemplary arrhythmia grading systems may include the Lown grading system, the Bigger grading system, the Morganroth grading system, or any combination thereof.
- the warning criteria may be used by the health care provider as an indicator of patient hemodynamic instability or the potential onset of such instability. The health care provider may then assess the usefulness of continuing the therapeutic procedure or stopping it depending on the hemodynamic instability risk of the procedure to the patient.
- Additional metrics associated with patient status such as metrics associated with patient ventilation and patient blood chemistry (for example, additional blood gas metrics) may also be displayed.
- such displays may be presented in real time by scrolling the data presented on the display.
- Such a patient status display may also permit a health care provider and system user to display selected data presented during defined time windows.
- time windows may include an entire therapeutic session, a portion of a therapeutic session, or a time window including pre-therapy time, therapy time, and post therapy time.
- a display window may display data generally over any time interval, including, without limitation, a time window for intervals of about 1 minute to about 24 hours.
- time window intervals may include time intervals of about 1 minute, about 2 minutes, about 5 minutes, about 10 minutes, about 20 minutes, about 30 minutes, about 1 hour, about 2 hours, about 5 hours, about 10 hours, about 20 hours, about 24 hours, and ranges between any two of these values including endpoints.
- anomalous changes in pulse rate 930 may be observed during the dialysis session between about 100 minutes and about 200 minutes of the dialysis procedure. Such changes may indicate a pre-pathological or pathological change in patient status as a result of a therapeutic procedure, such as due to hypovolemia during dialysis. It is noted that warning events are displayed in the alarm indicator 920 trace during this same time period. A health care provider may wish to obtain further information regarding the patient's status during this time window, especially with respect to baseline patient status.
- the health care professional may wish to observe the pulse volume waveform during a period of patient normative (that is, typical or non-pathological) cardiovascular behavior 970a and the pulse volume waveform during a period of patient anomalous cardiovascular behavior 970b to better characterize the anomaly.
- a pulse volume waveform trace may be displayed for a 1 minute window starting at time point 40 during a period of patient normative cardiovascular behavior 970a.
- An additional pulse volume waveform trace may be displayed for a 1 minute window starting at time point 193 during a period of patient anomalous cardiovascular behavior 970b.
- Both normative and anomalous pulse volume waveforms may be analyzed for metrics distinguishing the anomalous behavior from the normative behavior.
- One non-limiting method to analyze the pulse volume waveforms may include a dispersion analysis of the pulse volume peak occurrence time differences.
- a non-limiting example of such a dispersion analysis may include a histogram over a time window of differences in pulse volume occurrence times.
- a non-limiting example of a histogram of differences in pulse volume occurrence times during a period of normative cardiovascular behavior 960a may show normative features such as a narrow symmetrical peak at the reciprocal of the patient heart rate.
- a non-limiting example of a histogram of differences in pulse volume occurrence times during a period of anomalous cardiovascular behavior 960b may show anomalous features such as asymmetric peaks, well resolved multiple peaks, and center difference time values outside the normative patient values.
- a user may control the display of patient status information provided by the computing device, such as a display of status data, types of data analysis results, and annotations of data analysis results.
- a drop-down menu may be used by a user to indicate which types of information, analyses, and annotations may be displayed.
Claims (15)
- Dispositif informatique destiné à identifier une dysrythmie cardiaque, le dispositif comprenant des moyens (502, 504, 508, 512, 514, 515, 516, 518, 520, 522, 524, 526, 528) pour effectuer les étapes suivantes :recevoir (410) un signal biologique émulant une onde de pouls artériel provenant d'un capteur associé à un corps humain ;identifier une pluralité de pics de signal (420) dans le signal biologique ;identifier une amplitude de crète (430) pour chacun de la pluralité de pics de signal ;identifier un temps d'apparition (435) pour chacun de la pluralité de pics de signal ;calculer une pluralité de différences d'amplitude (440), chaque différence d'amplitude de la pluralité de différences d'amplitude étant calculée à partir d'une première amplitude de crète d'un premier pic et d'une seconde amplitude de crète d'un second pic ;calculer une pluralité de différences temporelles (445), dans lequel chaque différence temporelle de la pluralité de différences temporelles est calculée à partir d'une première occurrence temporelle du premier pic et d'une seconde occurrence temporelle du second pic ;calculer au moins une mesure de dispersion de différence de temps à partir de la pluralité de différences de temps (470), en calculant un histogramme à partir d'au moins une partie de la pluralité de différences de temps et calculant au moins une mesure de dispersion de différence de temps caractérisant un pic apparaissant dans l'histogramme autour d'une différence de temps primaire de la pluralité de différences de temps ; etidentifier (480) une dysrythmie cardiaque du signal biologique à partir de la métrique de dispersion de la différence de temps en réponse à au moins une différence d'amplitude anormale calculée à partir d'une paire de pics dépassant un seuil d'amplitude (450) et au moins une différence de temps anormale calculée à partir de ladite paire de pics dépassant un seuil de temps (455).
- Dispositif selon la revendication 1, dans lequel le capteur est un ou plusieurs capteurs de détection de volume pulsé, un photopléthysmographe, un pléthysmographe, un capteur photo-optique à transmittance, un capteur photo-optique réfléchissant, un transducteur de pression, un dispositif de tonométrie, une jauge de contrainte, un appareil à ultrasons, un appareil de mesure de l'impédance électrique et un appareil radar.
- Dispositif selon la revendication 1, dans lequel l'identification d'une pluralité de pics de signal comprend l'ajustement d'au moins une partie du signal biologique à un modèle mathématique.
- Dispositif selon la revendication 1, configuré en outre pour calculer le seuil d'amplitude de la manière suivante :calculer, par le dispositif informatique, une ligne de base de différence d'amplitude à partir d'au moins une partie des différences d'amplitude de pic se produisant dans une fenêtre de données ; etajouter, par le dispositif informatique, un décalage de différence d'amplitude à la ligne de base de différence d'amplitude pour produire le seuil d'amplitude.
- Dispositif selon la revendication 4, dans lequel le calcul de la ligne de base de différence d'amplitude comprend l'un des éléments suivants :le calcul, par le dispositif informatique, d'une moyenne des différences d'amplitude de pic d'au moins une partie des différences d'amplitude de pic se produisant dans la fenêtre de données ; etle calcul, à l'aide du dispositif informatique, d'une différence d'amplitude de crête maximale d'au moins une partie des différences d'amplitude de crête se produisant dans la fenêtre de données.
- Dispositif selon la revendication 4, configuré en outre pour sélectionner, par le dispositif informatique, un algorithme pour calculer le seuil d'amplitude sur la base d'une valeur d'au moins une métrique de dispersion de différence de temps.
- Dispositif selon la revendication 1, configuré en outre pour calculer le seuil de temps de la manière suivante :calculer, par le dispositif informatique, une ligne de base de différence de temps de pointe à partir d'au moins une partie des différences de temps de pointe apparaissant dans une fenêtre de données, le calcul de la ligne de base de différence de temps de pic comprenant le calcul, par le dispositif informatique, d'une moyenne de l'inverse du pouls normalisé dérivé du corps humain ; etajouter, par le dispositif informatique, un décalage de différence de temps de crête à la ligne de base de différence de temps de crête pour produire le seuil de temps.
- Dispositif selon la revendication 1, configuré en outre pour calculer au moins une métrique de dispersion de décalage temporel par :le calcul, par le dispositif informatique, d'un histogramme à partir d'au moins une partie de la pluralité de différences temporelles qui se produisent dans une fenêtre de données ; etle calcul, à l'aide du dispositif informatique, d'au moins une métrique de dispersion de décalage temporel à partir de l'histogramme.
- Dispositif selon la revendication 8, dans lequel au moins une métrique de dispersion de décalage temporel comprend une ou plusieurs valeurs parmi une valeur maximale d'au moins un pic d'histogramme, une valeur d'une métrique de largeur de l'au moins un pic d'histogramme et un temps de différence d'histogramme correspondant à la valeur maximale de l'au moins un pic de l'histogramme.
- Dispositif selon la revendication 1, dans lequel l'identification d'un type de dysrythmie cardiaque comprend la classification d'un type de dysrythmie cardiaque selon un système de classification d'arythmie qui comprend un ou plusieurs systèmes parmi un système de classification de Lown, un système de classification de Bigger, un système de classification de Morganroth, ou une combinaison de ceux-ci.
- Dispositif selon la revendication 1, configuré en outre pour afficher, par le dispositif informatique sur un dispositif de sortie, une représentation d'une partie du signal biologique avec au moins une annotation identifiant le comportement de dysrythmie cardiaque.
- Dispositif selon la revendication 11, dans lequel l'affichage de la représentation de la partie du signal biologique comprend la mise à jour de la représentation de la partie du signal biologique dans le temps.
- Dispositif selon la revendication 11, dans lequel l'annotation est un indicateur d'arythmie.
- Dispositif selon la revendication 11, dans lequel l'annotation est un indicateur d'un ou de plusieurs critères provenant d'un système de classement de Lown, d'un système de classement de Bigger, d'un système de classement de Morganroth ou d'une combinaison de ceux-ci.
- Dispositif selon la revendication 1, configuré en outre pour émettre, par le dispositif informatique, un avertissement à un utilisateur si le comportement de dysrythmie cardiaque indique un état émergent associé au corps humain.
Applications Claiming Priority (2)
| Application Number | Priority Date | Filing Date | Title |
|---|---|---|---|
| US201361830821P | 2013-06-04 | 2013-06-04 | |
| PCT/US2014/040890 WO2014197582A1 (fr) | 2013-06-04 | 2014-06-04 | Sévérité du risque hémodynamique basée sur la détection et la quantification du comportement de dysrythmie cardiaque en utilisant une forme d'onde de volume d'impulsion |
Publications (3)
| Publication Number | Publication Date |
|---|---|
| EP3003135A1 EP3003135A1 (fr) | 2016-04-13 |
| EP3003135A4 EP3003135A4 (fr) | 2017-02-15 |
| EP3003135B1 true EP3003135B1 (fr) | 2019-07-24 |
Family
ID=51985891
Family Applications (1)
| Application Number | Title | Priority Date | Filing Date |
|---|---|---|---|
| EP14807798.5A Active EP3003135B1 (fr) | 2013-06-04 | 2014-06-04 | Sévérité du risque hémodynamique basée sur la détection et la quantification du comportement de dysrythmie cardiaque en utilisant une forme d'onde de volume d'impulsion |
Country Status (5)
| Country | Link |
|---|---|
| US (1) | US10390767B2 (fr) |
| EP (1) | EP3003135B1 (fr) |
| AU (1) | AU2014274953A1 (fr) |
| CA (1) | CA2914666C (fr) |
| WO (1) | WO2014197582A1 (fr) |
Families Citing this family (4)
| Publication number | Priority date | Publication date | Assignee | Title |
|---|---|---|---|---|
| US9538930B2 (en) * | 2014-06-05 | 2017-01-10 | Guangren CHEN | Linear multi-domain electrocardiogram |
| US9545203B2 (en) * | 2014-06-05 | 2017-01-17 | Guangren Chen | Systems and methods for cardiomyocyte conduction speed mapping |
| US9953041B2 (en) * | 2014-09-12 | 2018-04-24 | Verily Life Sciences Llc | Long-term data storage service for wearable device data |
| KR102254326B1 (ko) * | 2018-01-02 | 2021-05-20 | 한양대학교 산학협력단 | Uwb 레이더를 이용하는 부정맥 진단 방법 및 장치 |
Family Cites Families (61)
| Publication number | Priority date | Publication date | Assignee | Title |
|---|---|---|---|---|
| US4450527A (en) | 1982-06-29 | 1984-05-22 | Bomed Medical Mfg. Ltd. | Noninvasive continuous cardiac output monitor |
| US5206807A (en) | 1989-02-16 | 1993-04-27 | Air-Shields, Inc. | Neonatal cardiorespirograph incorporating multi-variable display and memory |
| MX9702434A (es) | 1991-03-07 | 1998-05-31 | Masimo Corp | Aparato de procesamiento de señales. |
| US5292339A (en) | 1991-06-14 | 1994-03-08 | Telectronics Pacing Systems, Inc. | Implantable pacemaker/cardioverter/defibrillator device and method incorporating multiple bradycardia support pacing rates |
| US5370122A (en) | 1992-11-18 | 1994-12-06 | Kunig; Horst E. | Method and apparatus for measuring myocardial impairment, dysfunctions, sufficiency, and insufficiency |
| US5836884A (en) | 1993-12-17 | 1998-11-17 | Pulse Metric, Inc. | Method for diagnosing, monitoring and treating hypertension and other cardiac problems |
| US5590649A (en) | 1994-04-15 | 1997-01-07 | Vital Insite, Inc. | Apparatus and method for measuring an induced perturbation to determine blood pressure |
| US6126595A (en) | 1995-05-12 | 2000-10-03 | Seiko Epson Corporation | Device for diagnosing physiological state and device for controlling the same |
| US5900433A (en) | 1995-06-23 | 1999-05-04 | Cormedics Corp. | Vascular treatment method and apparatus |
| US5853364A (en) | 1995-08-07 | 1998-12-29 | Nellcor Puritan Bennett, Inc. | Method and apparatus for estimating physiological parameters using model-based adaptive filtering |
| IL115538A (en) | 1995-10-06 | 2000-10-31 | Pyrotec Ltd | Method and system for determination of the pressure-volume relationship of the heart |
| US5810011A (en) | 1996-02-27 | 1998-09-22 | Kunig; Sabine Vivian | Method and apparatus for measuring myocardial impairment and dysfunctions from efficiency and performance diagrams |
| US5860918A (en) | 1996-11-22 | 1999-01-19 | Hewlett-Packard Company | Representation of a review of a patent's physiological parameters |
| US5865756A (en) | 1997-06-06 | 1999-02-02 | Southwest Research Institute | System and method for identifying and correcting abnormal oscillometric pulse waves |
| JP3114142B2 (ja) * | 1998-05-28 | 2000-12-04 | マイクロライフ システムズ エージー | 血圧の測定と不整脈の検出とを同時に行うための装置 |
| US6463311B1 (en) | 1998-12-30 | 2002-10-08 | Masimo Corporation | Plethysmograph pulse recognition processor |
| US6112115A (en) | 1999-03-09 | 2000-08-29 | Feldman; Marc D. | Method and apparatus for determining cardiac performance in a patient |
| US6315735B1 (en) | 1999-03-31 | 2001-11-13 | Pulsion Medical Systems Ag | Devices for in-vivo determination of the compliance function and the systemic blood flow of a living being |
| JP2000333911A (ja) | 1999-05-25 | 2000-12-05 | Nippon Colin Co Ltd | 心機能監視装置 |
| US6339716B1 (en) | 1999-09-24 | 2002-01-15 | Bioenergy Inc. | Method for determining viability of a myocardial segment |
| US20040039419A1 (en) | 1999-09-30 | 2004-02-26 | Stickney Ronald E. | Apparatus, software, and methods for cardiac pulse detection using a piezoelectric sensor |
| NZ518142A (en) | 1999-10-07 | 2003-11-28 | Alexander K | Optical determination of blood characteristics accounting for heart/limb relative height |
| AUPQ420599A0 (en) | 1999-11-24 | 1999-12-16 | Duncan Campbell Patents Pty Ltd | Method and apparatus for determining cardiac output or total peripheral resistance |
| US20010034488A1 (en) | 2000-02-09 | 2001-10-25 | Shal Policker | Method and system of automated hemodynamical detection of arrhythmias |
| US6371922B1 (en) | 2000-04-07 | 2002-04-16 | Cardiac Pacemakers, Inc. | Method for measuring baroreflex sensitivity and therapy optimization in heart failure patients |
| US6287608B1 (en) | 2000-04-11 | 2001-09-11 | Intellicardia, Inc. | Method and apparatus for treatment of congestive heart failure by improving perfusion of the kidney by infusion of a vasodilator |
| AU2001288989A1 (en) | 2000-09-08 | 2002-03-22 | Wireless Medical, Inc. | Cardiopulmonary monitoring |
| US7778711B2 (en) | 2001-08-31 | 2010-08-17 | Bio Control Medical (B.C.M.) Ltd. | Reduction of heart rate variability by parasympathetic stimulation |
| US6575912B1 (en) | 2001-10-16 | 2003-06-10 | Pacesetter, Inc. | Assessing heart failure status using morphology of a signal representative of arterial pulse pressure |
| US20040039273A1 (en) | 2002-02-22 | 2004-02-26 | Terry Alvin Mark | Cepstral domain pulse oximetry |
| US6776764B2 (en) | 2002-03-01 | 2004-08-17 | University Of Pittsburgh Of The Commonwealth System Of Higher Education | Use of aortic pulse pressure and flow in bedside hemodynamic management |
| US20070225614A1 (en) | 2004-05-26 | 2007-09-27 | Endothelix, Inc. | Method and apparatus for determining vascular health conditions |
| US8157731B2 (en) | 2002-10-09 | 2012-04-17 | Bodymedia, Inc. | Method and apparatus for auto journaling of continuous or discrete body states utilizing physiological and/or contextual parameters |
| EP1601287B1 (fr) | 2003-03-12 | 2012-12-19 | Yale University | Evaluation d'une réduction du volume sanguin sur la base de l'analyse de signaux cardiovasculaires |
| EP1606758B1 (fr) | 2003-03-21 | 2015-11-18 | Welch Allyn, Inc. | Systeme de surveillance physiologique d'etat personnel |
| US7330750B2 (en) | 2003-04-25 | 2008-02-12 | Instrumentarium Corp. | Estimation of cardiac death risk |
| US8403865B2 (en) | 2004-02-05 | 2013-03-26 | Earlysense Ltd. | Prediction and monitoring of clinical episodes |
| FR2868936B1 (fr) | 2004-04-16 | 2006-08-18 | Centre Nat Rech Scient Cnrse | Procede d'obtention de parametres hemodynamiques derives d'un signal de pression arterielle. |
| US7324848B1 (en) | 2004-07-19 | 2008-01-29 | Pacesetter, Inc. | Reducing data acquisition, power and processing for photoplethysmography and other applications |
| US20060293384A1 (en) | 2004-10-16 | 2006-12-28 | Whewell Christopher J | Isethionyl nitrates and compounds thereof |
| US7578793B2 (en) * | 2004-11-22 | 2009-08-25 | Widemed Ltd. | Sleep staging based on cardio-respiratory signals |
| US8423108B2 (en) | 2005-03-24 | 2013-04-16 | Intelomed, Inc. | Device and system that identifies cardiovascular insufficiency |
| WO2006102677A1 (fr) | 2005-03-24 | 2006-09-28 | University Of Pittsburgh - Of The Commonwealth System Of Higher Education | Dispositif et systeme d'identification d'insuffisance cardio-vasculaire |
| JP4752673B2 (ja) | 2005-10-06 | 2011-08-17 | コニカミノルタセンシング株式会社 | 脈波データ解析方法、システム、プログラム |
| US8818496B2 (en) * | 2005-10-14 | 2014-08-26 | Medicalgorithmics Ltd. | Systems for safe and remote outpatient ECG monitoring |
| US20070092632A1 (en) * | 2005-10-21 | 2007-04-26 | Stan Kubow | Ultra high pressure modified proteins and uses thereof |
| US7846106B2 (en) * | 2006-04-26 | 2010-12-07 | The General Electric Company | Atrial fibrillation detection using SPO2 |
| EP2111152A2 (fr) | 2007-01-10 | 2009-10-28 | Starr Life Sciences Corporation | Techniques pour dériver avec précision des paramètres physiologiques d'un sujet à partir de mesures photopléthysmographiques |
| US20090093687A1 (en) * | 2007-03-08 | 2009-04-09 | Telfort Valery G | Systems and methods for determining a physiological condition using an acoustic monitor |
| US8052611B2 (en) | 2007-03-14 | 2011-11-08 | Cardiac Pacemakers, Inc. | Method and apparatus for management of heart failure hospitalization |
| US7806832B2 (en) | 2007-04-30 | 2010-10-05 | The General Electric Company | False positive reduction in SPO2 atrial fibrillation detection using average heart rate and NIBP |
| US8585607B2 (en) * | 2007-05-02 | 2013-11-19 | Earlysense Ltd. | Monitoring, predicting and treating clinical episodes |
| US9549678B2 (en) | 2008-07-08 | 2017-01-24 | The Johns Hopkins University | Non-invasive methods and systems for assessing cardiac filling pressure |
| JP5336803B2 (ja) | 2008-09-26 | 2013-11-06 | 株式会社東芝 | 脈波計測装置 |
| JP5718946B2 (ja) | 2010-02-26 | 2015-05-13 | シーユー メディカル システムズ,インク | 心臓不整脈診断装置 |
| US8442624B2 (en) * | 2010-05-12 | 2013-05-14 | Siemens Medical Solutions Usa, Inc. | System for cardiac medical condition detection |
| US9002440B2 (en) | 2010-07-08 | 2015-04-07 | Intelomed, Inc. | System and method for characterizing circulatory blood flow |
| WO2012006520A1 (fr) | 2010-07-08 | 2012-01-12 | Intelomed, Inc. | Système et procédé de caractérisation de flux sanguin circulatoire |
| US8831713B2 (en) | 2010-07-29 | 2014-09-09 | Medtronic, Inc. | Prevention of false asystole or bradycardia detection |
| US8880576B2 (en) * | 2011-09-23 | 2014-11-04 | Nellcor Puritan Bennett Ireland | Systems and methods for determining respiration information from a photoplethysmograph |
| EP2967502A4 (fr) | 2013-03-15 | 2016-11-16 | Intelomed Inc | Système et procédé de caractérisation de flux sanguin circulant |
-
2014
- 2014-06-04 CA CA2914666A patent/CA2914666C/fr active Active
- 2014-06-04 US US14/295,856 patent/US10390767B2/en active Active
- 2014-06-04 WO PCT/US2014/040890 patent/WO2014197582A1/fr active Application Filing
- 2014-06-04 EP EP14807798.5A patent/EP3003135B1/fr active Active
- 2014-06-04 AU AU2014274953A patent/AU2014274953A1/en not_active Abandoned
Non-Patent Citations (1)
| Title |
|---|
| None * |
Also Published As
| Publication number | Publication date |
|---|---|
| CA2914666A1 (fr) | 2014-12-11 |
| EP3003135A4 (fr) | 2017-02-15 |
| CA2914666C (fr) | 2022-11-15 |
| US20140357995A1 (en) | 2014-12-04 |
| AU2014274953A1 (en) | 2016-01-21 |
| EP3003135A1 (fr) | 2016-04-13 |
| US10390767B2 (en) | 2019-08-27 |
| WO2014197582A1 (fr) | 2014-12-11 |
Similar Documents
| Publication | Publication Date | Title |
|---|---|---|
| US20200187806A1 (en) | Methods And Systems For Predicting Hypovolemic Hypotensive Conditions Resulting From Bradycardia Behavior Using A Pulse Volume Waveform | |
| US11647939B2 (en) | System and method for facilitating a cardiac rhythm disorder diagnosis with the aid of a digital computer | |
| Malik et al. | Prognostic value of heart rate variability after myocardial infarction. A comparison of different data-processing methods | |
| Staniczenko et al. | Rapidly detecting disorder in rhythmic biological signals: A spectral entropy measure to identify cardiac arrhythmias | |
| EP3003135B1 (fr) | Sévérité du risque hémodynamique basée sur la détection et la quantification du comportement de dysrythmie cardiaque en utilisant une forme d'onde de volume d'impulsion | |
| CA2978636C (fr) | Agencement d'affichage pour le diagnostic de troubles de rythme cardiaque | |
| Oliver et al. | Detection of premature ventricular contractions with a clinical system for monitoring electrocardiographic rhythms | |
| Tuboly et al. | Atrial fibrillation detection with and without atrial activity analysis using lead-I mobile ECG technology | |
| US20180184931A1 (en) | Automated ECG Analysis and Diagnosis System | |
| US8457724B2 (en) | System for heart performance characterization and abnormality detection | |
| US20220202344A1 (en) | Apparatus and Method for Electrocardiogram (ECG) Signal Analysis and Heart Block Detection | |
| US10729351B1 (en) | Artificial intelligence (AI) electrocardiogram (ECG) | |
| Hermawan et al. | Development of ECG signal interpretation software on Android 2.2 | |
| JP2020517337A (ja) | アーチファクト耐性脈拍変動測定 | |
| CN109328029B (zh) | 生命体征数据统计系统和监护仪 | |
| Jindal et al. | MATLAB based GUI for ECG arrhythmia detection using Pan-Tompkin algorithm | |
| Jelinek et al. | Multiscale renyi entropy and cardiac autonomic neuropathy | |
| Saadi et al. | Heart rhythm analysis using ECG recorded with a novel sternum based patch technology-A pilot study | |
| Manukova et al. | An Approach to Evaluation of Clinically Healthy People by Preventive Cardio Control | |
| US9538930B2 (en) | Linear multi-domain electrocardiogram | |
| US9192315B2 (en) | Patient signal analysis and characterization based on late potentials | |
| Sun et al. | A screening system for myocardial ischemia based on pathophysiological vectorcardiogram | |
| Ernst et al. | Methodological issues | |
| Emdin et al. | Electrocardiographic and signal monitoring in ischaemic heart disease: state of the art and perspective | |
| Sharma et al. | Designing a simple toolbox for the early detection of arrhythmia, using advanced virtual instrumentation |
Legal Events
| Date | Code | Title | Description |
|---|---|---|---|
| PUAI | Public reference made under article 153(3) epc to a published international application that has entered the european phase |
Free format text: ORIGINAL CODE: 0009012 |
|
| 17P | Request for examination filed |
Effective date: 20151223 |
|
| AK | Designated contracting states |
Kind code of ref document: A1 Designated state(s): AL AT BE BG CH CY CZ DE DK EE ES FI FR GB GR HR HU IE IS IT LI LT LU LV MC MK MT NL NO PL PT RO RS SE SI SK SM TR |
|
| AX | Request for extension of the european patent |
Extension state: BA ME |
|
| RAP1 | Party data changed (applicant data changed or rights of an application transferred) |
Owner name: INTELOMED, INC |
|
| DAX | Request for extension of the european patent (deleted) | ||
| A4 | Supplementary search report drawn up and despatched |
Effective date: 20170113 |
|
| RIC1 | Information provided on ipc code assigned before grant |
Ipc: A61B 5/024 20060101AFI20170109BHEP Ipc: A61B 8/08 20060101ALN20170109BHEP Ipc: A61B 8/02 20060101ALN20170109BHEP Ipc: A61B 5/021 20060101ALN20170109BHEP |
|
| REG | Reference to a national code |
Ref country code: DE Ref legal event code: R079 Ref document number: 602014050554 Country of ref document: DE Free format text: PREVIOUS MAIN CLASS: A61B0005024500 Ipc: A61B0005024000 |
|
| RIC1 | Information provided on ipc code assigned before grant |
Ipc: A61B 5/046 20060101ALN20181212BHEP Ipc: A61B 5/024 20060101AFI20181212BHEP Ipc: A61B 8/08 20060101ALN20181212BHEP Ipc: A61B 5/0464 20060101ALN20181212BHEP Ipc: A61B 5/021 20060101ALN20181212BHEP Ipc: A61B 8/02 20060101ALN20181212BHEP |
|
| GRAP | Despatch of communication of intention to grant a patent |
Free format text: ORIGINAL CODE: EPIDOSNIGR1 |
|
| STAA | Information on the status of an ep patent application or granted ep patent |
Free format text: STATUS: GRANT OF PATENT IS INTENDED |
|
| RIC1 | Information provided on ipc code assigned before grant |
Ipc: A61B 5/0464 20060101ALN20181220BHEP Ipc: A61B 5/046 20060101ALN20181220BHEP Ipc: A61B 8/02 20060101ALN20181220BHEP Ipc: A61B 5/024 20060101AFI20181220BHEP Ipc: A61B 5/021 20060101ALN20181220BHEP Ipc: A61B 8/08 20060101ALN20181220BHEP |
|
| INTG | Intention to grant announced |
Effective date: 20190122 |
|
| GRAS | Grant fee paid |
Free format text: ORIGINAL CODE: EPIDOSNIGR3 |
|
| GRAA | (expected) grant |
Free format text: ORIGINAL CODE: 0009210 |
|
| STAA | Information on the status of an ep patent application or granted ep patent |
Free format text: STATUS: THE PATENT HAS BEEN GRANTED |
|
| AK | Designated contracting states |
Kind code of ref document: B1 Designated state(s): AL AT BE BG CH CY CZ DE DK EE ES FI FR GB GR HR HU IE IS IT LI LT LU LV MC MK MT NL NO PL PT RO RS SE SI SK SM TR |
|
| REG | Reference to a national code |
Ref country code: GB Ref legal event code: FG4D |
|
| REG | Reference to a national code |
Ref country code: CH Ref legal event code: EP |
|
| REG | Reference to a national code |
Ref country code: DE Ref legal event code: R096 Ref document number: 602014050554 Country of ref document: DE |
|
| REG | Reference to a national code |
Ref country code: AT Ref legal event code: REF Ref document number: 1157189 Country of ref document: AT Kind code of ref document: T Effective date: 20190815 |
|
| REG | Reference to a national code |
Ref country code: IE Ref legal event code: FG4D |
|
| REG | Reference to a national code |
Ref country code: NL Ref legal event code: MP Effective date: 20190724 |
|
| REG | Reference to a national code |
Ref country code: LT Ref legal event code: MG4D |
|
| REG | Reference to a national code |
Ref country code: AT Ref legal event code: MK05 Ref document number: 1157189 Country of ref document: AT Kind code of ref document: T Effective date: 20190724 |
|
| PG25 | Lapsed in a contracting state [announced via postgrant information from national office to epo] |
Ref country code: SE Free format text: LAPSE BECAUSE OF FAILURE TO SUBMIT A TRANSLATION OF THE DESCRIPTION OR TO PAY THE FEE WITHIN THE PRESCRIBED TIME-LIMIT Effective date: 20190724 Ref country code: NL Free format text: LAPSE BECAUSE OF FAILURE TO SUBMIT A TRANSLATION OF THE DESCRIPTION OR TO PAY THE FEE WITHIN THE PRESCRIBED TIME-LIMIT Effective date: 20190724 Ref country code: PT Free format text: LAPSE BECAUSE OF FAILURE TO SUBMIT A TRANSLATION OF THE DESCRIPTION OR TO PAY THE FEE WITHIN THE PRESCRIBED TIME-LIMIT Effective date: 20191125 Ref country code: BG Free format text: LAPSE BECAUSE OF FAILURE TO SUBMIT A TRANSLATION OF THE DESCRIPTION OR TO PAY THE FEE WITHIN THE PRESCRIBED TIME-LIMIT Effective date: 20191024 Ref country code: AT Free format text: LAPSE BECAUSE OF FAILURE TO SUBMIT A TRANSLATION OF THE DESCRIPTION OR TO PAY THE FEE WITHIN THE PRESCRIBED TIME-LIMIT Effective date: 20190724 Ref country code: NO Free format text: LAPSE BECAUSE OF FAILURE TO SUBMIT A TRANSLATION OF THE DESCRIPTION OR TO PAY THE FEE WITHIN THE PRESCRIBED TIME-LIMIT Effective date: 20191024 Ref country code: FI Free format text: LAPSE BECAUSE OF FAILURE TO SUBMIT A TRANSLATION OF THE DESCRIPTION OR TO PAY THE FEE WITHIN THE PRESCRIBED TIME-LIMIT Effective date: 20190724 Ref country code: HR Free format text: LAPSE BECAUSE OF FAILURE TO SUBMIT A TRANSLATION OF THE DESCRIPTION OR TO PAY THE FEE WITHIN THE PRESCRIBED TIME-LIMIT Effective date: 20190724 Ref country code: LT Free format text: LAPSE BECAUSE OF FAILURE TO SUBMIT A TRANSLATION OF THE DESCRIPTION OR TO PAY THE FEE WITHIN THE PRESCRIBED TIME-LIMIT Effective date: 20190724 |
|
| PG25 | Lapsed in a contracting state [announced via postgrant information from national office to epo] |
Ref country code: ES Free format text: LAPSE BECAUSE OF FAILURE TO SUBMIT A TRANSLATION OF THE DESCRIPTION OR TO PAY THE FEE WITHIN THE PRESCRIBED TIME-LIMIT Effective date: 20190724 Ref country code: GR Free format text: LAPSE BECAUSE OF FAILURE TO SUBMIT A TRANSLATION OF THE DESCRIPTION OR TO PAY THE FEE WITHIN THE PRESCRIBED TIME-LIMIT Effective date: 20191025 Ref country code: IS Free format text: LAPSE BECAUSE OF FAILURE TO SUBMIT A TRANSLATION OF THE DESCRIPTION OR TO PAY THE FEE WITHIN THE PRESCRIBED TIME-LIMIT Effective date: 20191124 Ref country code: RS Free format text: LAPSE BECAUSE OF FAILURE TO SUBMIT A TRANSLATION OF THE DESCRIPTION OR TO PAY THE FEE WITHIN THE PRESCRIBED TIME-LIMIT Effective date: 20190724 Ref country code: LV Free format text: LAPSE BECAUSE OF FAILURE TO SUBMIT A TRANSLATION OF THE DESCRIPTION OR TO PAY THE FEE WITHIN THE PRESCRIBED TIME-LIMIT Effective date: 20190724 Ref country code: AL Free format text: LAPSE BECAUSE OF FAILURE TO SUBMIT A TRANSLATION OF THE DESCRIPTION OR TO PAY THE FEE WITHIN THE PRESCRIBED TIME-LIMIT Effective date: 20190724 |
|
| PG25 | Lapsed in a contracting state [announced via postgrant information from national office to epo] |
Ref country code: TR Free format text: LAPSE BECAUSE OF FAILURE TO SUBMIT A TRANSLATION OF THE DESCRIPTION OR TO PAY THE FEE WITHIN THE PRESCRIBED TIME-LIMIT Effective date: 20190724 |
|
| PG25 | Lapsed in a contracting state [announced via postgrant information from national office to epo] |
Ref country code: EE Free format text: LAPSE BECAUSE OF FAILURE TO SUBMIT A TRANSLATION OF THE DESCRIPTION OR TO PAY THE FEE WITHIN THE PRESCRIBED TIME-LIMIT Effective date: 20190724 Ref country code: PL Free format text: LAPSE BECAUSE OF FAILURE TO SUBMIT A TRANSLATION OF THE DESCRIPTION OR TO PAY THE FEE WITHIN THE PRESCRIBED TIME-LIMIT Effective date: 20190724 Ref country code: DK Free format text: LAPSE BECAUSE OF FAILURE TO SUBMIT A TRANSLATION OF THE DESCRIPTION OR TO PAY THE FEE WITHIN THE PRESCRIBED TIME-LIMIT Effective date: 20190724 Ref country code: IT Free format text: LAPSE BECAUSE OF FAILURE TO SUBMIT A TRANSLATION OF THE DESCRIPTION OR TO PAY THE FEE WITHIN THE PRESCRIBED TIME-LIMIT Effective date: 20190724 Ref country code: RO Free format text: LAPSE BECAUSE OF FAILURE TO SUBMIT A TRANSLATION OF THE DESCRIPTION OR TO PAY THE FEE WITHIN THE PRESCRIBED TIME-LIMIT Effective date: 20190724 |
|
| PG25 | Lapsed in a contracting state [announced via postgrant information from national office to epo] |
Ref country code: CZ Free format text: LAPSE BECAUSE OF FAILURE TO SUBMIT A TRANSLATION OF THE DESCRIPTION OR TO PAY THE FEE WITHIN THE PRESCRIBED TIME-LIMIT Effective date: 20190724 Ref country code: SK Free format text: LAPSE BECAUSE OF FAILURE TO SUBMIT A TRANSLATION OF THE DESCRIPTION OR TO PAY THE FEE WITHIN THE PRESCRIBED TIME-LIMIT Effective date: 20190724 Ref country code: SM Free format text: LAPSE BECAUSE OF FAILURE TO SUBMIT A TRANSLATION OF THE DESCRIPTION OR TO PAY THE FEE WITHIN THE PRESCRIBED TIME-LIMIT Effective date: 20190724 Ref country code: IS Free format text: LAPSE BECAUSE OF FAILURE TO SUBMIT A TRANSLATION OF THE DESCRIPTION OR TO PAY THE FEE WITHIN THE PRESCRIBED TIME-LIMIT Effective date: 20200224 |
|
| REG | Reference to a national code |
Ref country code: DE Ref legal event code: R097 Ref document number: 602014050554 Country of ref document: DE |
|
| PLBE | No opposition filed within time limit |
Free format text: ORIGINAL CODE: 0009261 |
|
| STAA | Information on the status of an ep patent application or granted ep patent |
Free format text: STATUS: NO OPPOSITION FILED WITHIN TIME LIMIT |
|
| PG2D | Information on lapse in contracting state deleted |
Ref country code: IS |
|
| 26N | No opposition filed |
Effective date: 20200603 |
|
| PG25 | Lapsed in a contracting state [announced via postgrant information from national office to epo] |
Ref country code: SI Free format text: LAPSE BECAUSE OF FAILURE TO SUBMIT A TRANSLATION OF THE DESCRIPTION OR TO PAY THE FEE WITHIN THE PRESCRIBED TIME-LIMIT Effective date: 20190724 |
|
| PG25 | Lapsed in a contracting state [announced via postgrant information from national office to epo] |
Ref country code: MC Free format text: LAPSE BECAUSE OF FAILURE TO SUBMIT A TRANSLATION OF THE DESCRIPTION OR TO PAY THE FEE WITHIN THE PRESCRIBED TIME-LIMIT Effective date: 20190724 |
|
| REG | Reference to a national code |
Ref country code: CH Ref legal event code: PL |
|
| PG25 | Lapsed in a contracting state [announced via postgrant information from national office to epo] |
Ref country code: LU Free format text: LAPSE BECAUSE OF NON-PAYMENT OF DUE FEES Effective date: 20200604 |
|
| REG | Reference to a national code |
Ref country code: BE Ref legal event code: MM Effective date: 20200630 |
|
| PG25 | Lapsed in a contracting state [announced via postgrant information from national office to epo] |
Ref country code: CH Free format text: LAPSE BECAUSE OF NON-PAYMENT OF DUE FEES Effective date: 20200630 Ref country code: IE Free format text: LAPSE BECAUSE OF NON-PAYMENT OF DUE FEES Effective date: 20200604 Ref country code: LI Free format text: LAPSE BECAUSE OF NON-PAYMENT OF DUE FEES Effective date: 20200630 |
|
| PG25 | Lapsed in a contracting state [announced via postgrant information from national office to epo] |
Ref country code: BE Free format text: LAPSE BECAUSE OF NON-PAYMENT OF DUE FEES Effective date: 20200630 |
|
| PG25 | Lapsed in a contracting state [announced via postgrant information from national office to epo] |
Ref country code: MT Free format text: LAPSE BECAUSE OF FAILURE TO SUBMIT A TRANSLATION OF THE DESCRIPTION OR TO PAY THE FEE WITHIN THE PRESCRIBED TIME-LIMIT Effective date: 20190724 Ref country code: CY Free format text: LAPSE BECAUSE OF FAILURE TO SUBMIT A TRANSLATION OF THE DESCRIPTION OR TO PAY THE FEE WITHIN THE PRESCRIBED TIME-LIMIT Effective date: 20190724 |
|
| PG25 | Lapsed in a contracting state [announced via postgrant information from national office to epo] |
Ref country code: MK Free format text: LAPSE BECAUSE OF FAILURE TO SUBMIT A TRANSLATION OF THE DESCRIPTION OR TO PAY THE FEE WITHIN THE PRESCRIBED TIME-LIMIT Effective date: 20190724 |
|
| P01 | Opt-out of the competence of the unified patent court (upc) registered |
Effective date: 20230530 |
|
| PGFP | Annual fee paid to national office [announced via postgrant information from national office to epo] |
Ref country code: GB Payment date: 20231108 Year of fee payment: 10 |
|
| PGFP | Annual fee paid to national office [announced via postgrant information from national office to epo] |
Ref country code: FR Payment date: 20231108 Year of fee payment: 10 Ref country code: DE Payment date: 20231108 Year of fee payment: 10 |