EP3002581A1 - Method for determining abnormality in particle analyzer and particle analyzer - Google Patents
Method for determining abnormality in particle analyzer and particle analyzer Download PDFInfo
- Publication number
- EP3002581A1 EP3002581A1 EP15187626.5A EP15187626A EP3002581A1 EP 3002581 A1 EP3002581 A1 EP 3002581A1 EP 15187626 A EP15187626 A EP 15187626A EP 3002581 A1 EP3002581 A1 EP 3002581A1
- Authority
- EP
- European Patent Office
- Prior art keywords
- management value
- abnormality
- value
- control particles
- management
- Prior art date
- Legal status (The legal status is an assumption and is not a legal conclusion. Google has not performed a legal analysis and makes no representation as to the accuracy of the status listed.)
- Granted
Links
Images





Classifications
-
- G—PHYSICS
- G01—MEASURING; TESTING
- G01N—INVESTIGATING OR ANALYSING MATERIALS BY DETERMINING THEIR CHEMICAL OR PHYSICAL PROPERTIES
- G01N21/00—Investigating or analysing materials by the use of optical means, i.e. using sub-millimetre waves, infrared, visible or ultraviolet light
- G01N21/62—Systems in which the material investigated is excited whereby it emits light or causes a change in wavelength of the incident light
- G01N21/63—Systems in which the material investigated is excited whereby it emits light or causes a change in wavelength of the incident light optically excited
- G01N21/64—Fluorescence; Phosphorescence
- G01N21/6428—Measuring fluorescence of fluorescent products of reactions or of fluorochrome labelled reactive substances, e.g. measuring quenching effects, using measuring "optrodes"
-
- G—PHYSICS
- G01—MEASURING; TESTING
- G01N—INVESTIGATING OR ANALYSING MATERIALS BY DETERMINING THEIR CHEMICAL OR PHYSICAL PROPERTIES
- G01N15/00—Investigating characteristics of particles; Investigating permeability, pore-volume or surface-area of porous materials
- G01N15/10—Investigating individual particles
- G01N15/1012—Calibrating particle analysers; References therefor
-
- G—PHYSICS
- G01—MEASURING; TESTING
- G01N—INVESTIGATING OR ANALYSING MATERIALS BY DETERMINING THEIR CHEMICAL OR PHYSICAL PROPERTIES
- G01N15/00—Investigating characteristics of particles; Investigating permeability, pore-volume or surface-area of porous materials
- G01N15/10—Investigating individual particles
- G01N15/14—Optical investigation techniques, e.g. flow cytometry
- G01N15/1425—Optical investigation techniques, e.g. flow cytometry using an analyser being characterised by its control arrangement
-
- G—PHYSICS
- G01—MEASURING; TESTING
- G01N—INVESTIGATING OR ANALYSING MATERIALS BY DETERMINING THEIR CHEMICAL OR PHYSICAL PROPERTIES
- G01N15/00—Investigating characteristics of particles; Investigating permeability, pore-volume or surface-area of porous materials
- G01N15/10—Investigating individual particles
- G01N15/14—Optical investigation techniques, e.g. flow cytometry
- G01N15/1429—Signal processing
-
- G—PHYSICS
- G01—MEASURING; TESTING
- G01N—INVESTIGATING OR ANALYSING MATERIALS BY DETERMINING THEIR CHEMICAL OR PHYSICAL PROPERTIES
- G01N15/00—Investigating characteristics of particles; Investigating permeability, pore-volume or surface-area of porous materials
- G01N15/10—Investigating individual particles
- G01N15/14—Optical investigation techniques, e.g. flow cytometry
- G01N15/1456—Optical investigation techniques, e.g. flow cytometry without spatial resolution of the texture or inner structure of the particle, e.g. processing of pulse signals
- G01N15/1459—Optical investigation techniques, e.g. flow cytometry without spatial resolution of the texture or inner structure of the particle, e.g. processing of pulse signals the analysis being performed on a sample stream
-
- G—PHYSICS
- G01—MEASURING; TESTING
- G01N—INVESTIGATING OR ANALYSING MATERIALS BY DETERMINING THEIR CHEMICAL OR PHYSICAL PROPERTIES
- G01N35/00—Automatic analysis not limited to methods or materials provided for in any single one of groups G01N1/00 - G01N33/00; Handling materials therefor
- G01N35/00584—Control arrangements for automatic analysers
- G01N35/00594—Quality control, including calibration or testing of components of the analyser
- G01N35/00613—Quality control
- G01N35/00623—Quality control of instruments
-
- G—PHYSICS
- G01—MEASURING; TESTING
- G01N—INVESTIGATING OR ANALYSING MATERIALS BY DETERMINING THEIR CHEMICAL OR PHYSICAL PROPERTIES
- G01N15/00—Investigating characteristics of particles; Investigating permeability, pore-volume or surface-area of porous materials
- G01N15/10—Investigating individual particles
- G01N15/1012—Calibrating particle analysers; References therefor
- G01N2015/1014—Constitution of reference particles
-
- G—PHYSICS
- G01—MEASURING; TESTING
- G01N—INVESTIGATING OR ANALYSING MATERIALS BY DETERMINING THEIR CHEMICAL OR PHYSICAL PROPERTIES
- G01N15/00—Investigating characteristics of particles; Investigating permeability, pore-volume or surface-area of porous materials
- G01N15/10—Investigating individual particles
- G01N2015/1026—Recognising analyser failures, e.g. bubbles; Quality control for particle analysers
-
- G—PHYSICS
- G01—MEASURING; TESTING
- G01N—INVESTIGATING OR ANALYSING MATERIALS BY DETERMINING THEIR CHEMICAL OR PHYSICAL PROPERTIES
- G01N15/00—Investigating characteristics of particles; Investigating permeability, pore-volume or surface-area of porous materials
- G01N15/10—Investigating individual particles
- G01N15/14—Optical investigation techniques, e.g. flow cytometry
- G01N2015/1402—Data analysis by thresholding or gating operations performed on the acquired signals or stored data
-
- G—PHYSICS
- G01—MEASURING; TESTING
- G01N—INVESTIGATING OR ANALYSING MATERIALS BY DETERMINING THEIR CHEMICAL OR PHYSICAL PROPERTIES
- G01N21/00—Investigating or analysing materials by the use of optical means, i.e. using sub-millimetre waves, infrared, visible or ultraviolet light
- G01N21/62—Systems in which the material investigated is excited whereby it emits light or causes a change in wavelength of the incident light
- G01N21/63—Systems in which the material investigated is excited whereby it emits light or causes a change in wavelength of the incident light optically excited
- G01N21/64—Fluorescence; Phosphorescence
- G01N21/6428—Measuring fluorescence of fluorescent products of reactions or of fluorochrome labelled reactive substances, e.g. measuring quenching effects, using measuring "optrodes"
- G01N2021/6439—Measuring fluorescence of fluorescent products of reactions or of fluorochrome labelled reactive substances, e.g. measuring quenching effects, using measuring "optrodes" with indicators, stains, dyes, tags, labels, marks
Definitions
- the present invention relates to a method for determining abnormality in a particle analyzer and a particle analyzer.
- particle analyzers which analyze particles by detecting fluorescence generated from the particles.
- a particle analyzer mixes a sample containing particles with a fluorescent dye to prepare a measurement specimen, and causes the prepared measurement specimen to flow in a flow cell.
- the particle analyzer irradiates the flow of the measurement specimen with light, to detect fluorescence generated from each particle. Based on signals obtained through this detection, the particles are classified.
- quality control using a quality control standard material is performed.
- the place of the abnormality occurring in the particle analyzer is determined by use of a quality control substance which contains: first standard particles to be fluorescence-stained by a first fluorescent dye; and second standard particles which contain a second fluorescent dye in advance and which are substantially not to be stained by the first fluorescent dye.
- a quality control substance which contains: first standard particles to be fluorescence-stained by a first fluorescent dye; and second standard particles which contain a second fluorescent dye in advance and which are substantially not to be stained by the first fluorescent dye.
- a first aspect of the present invention relates to a method for determining abnormality in a particle analyzer.
- the method includes: staining first control particles but not staining second control particles which emit fluorescence; irradiating with light the first control particles and the second control particles flowing in a flow cell, and detecting fluorescence from the first control particles and the second control particles; obtaining a first management value indicating a detection result of the fluorescence emitted from the first control particles and a second management value indicating a detection result of the fluorescence emitted from the second control particles; and determining abnormality in the staining step, based on a value calculated from the first management value and the second management value or a ratio between the first management value and the second management value.
- a second aspect of the present invention relates to a particle analyzer including: a specimen preparation unit configured to mix a specimen and a reagent which contains a fluorescent dye; an optical detection unit configured to cause the mixture prepared by the specimen preparation unit to flow in a flow cell, configured to irradiate with light the mixture flowing in the flow cell, and configured to detect light generated from the mixture as a result of the irradiation; and an analysis unit configured to analyze characteristic of light detected by the optical detection unit.
- the analysis unit is configured to cause the specimen preparation unit to mix the reagent, first control particles which are to be stained by the fluorescent dye, and second control particles which are not to be stained by the fluorescent dye and which emit fluorescence, to prepare a mixture, cause the optical detection unit: to cause the mixture to flow in the flow cell; to irradiate with light the first control particles and the second control particles flowing in the flow cell; and to detect fluorescence from the first control particles and the second control particles, obtain a first management value indicating a detection result of the fluorescence emitted from the first control particles and a second management value indicating a detection result of the fluorescence emitted from the second control particles, and determine abnormality in staining performed in the specimen preparation unit, based on a value calculated from the first management value and the second management value or a ratio between the first management value and the second management value.
- Embodiments 1 and 2 below are applied to an apparatus whose analysis target is uterine cervix cells and which obtains information regarding canceration of the cells.
- the analysis target may be buccal cells, epithelial cells of the bladder, the pharynx, or the like, or epithelial cells of organs.
- a particle analyzer 10 includes a transfer unit 20, a pretreatment unit 30, a specimen preparation unit 40, an optical detection unit 50, an analysis unit 60, an output unit 70, and an input unit 80.
- the particle analyzer 10 has a normal mode and a quality control mode as operation modes.
- the particle analyzer 10 analyzes a sample 11 in the normal mode.
- the sample 11 is a clinical sample which is collected from the uterine cervix of a subject, and contains epithelial cells of the uterine cervix.
- the particle analyzer 10 performs quality control by use of first control particles 12a and second control particles 12b.
- the sample 11 is a liquid in which cells are suspended in a preservative liquid whose principal component is alcohol.
- the sample 11 is contained in a sample container.
- the alcohol is methanol.
- the transfer unit 20 aspirates the sample 11, dispenses the aspirated sample 11 into a cuvette not shown, and transfers the cuvette.
- the pretreatment unit 30 disperses, with ultrasonic waves, aggregated cells contained in the sample 11 dispensed in the cuvette. Further, the pretreatment unit 30 replaces the preservative liquid suspending the cells contained in the sample 11, with a diluent. The pretreatment unit 30 removes contaminant from the sample 11 and concentrates the sample 11.
- the specimen preparation unit 40 mixes reagents 41 and 42 and the sample 11 having been subjected to the processing by the pretreatment unit 30, to prepare a mixture.
- the reagent 41 contains a fluorescent dye.
- the fluorescent dye contained in the reagent 41 is a nucleic acid staining dye. Nucleic acid in each cell contained in the sample 11 is stained by the reagent 41.
- the nucleic acid staining dye is a fluorescent dye which emits fluorescence by binding to nucleic acid.
- An example of the nucleic acid fluorescent dye is propidium iodide, ethidium bromide, ethidium-acridine heterodimer, ethidium diazide, ethidium homodimer-1, ethidium homodimer-2, ethidium monoazide, trimethylenebis[[3-[[4-[[(3-methyl benzothiazole-3-ium)-2-yl]methylene]-1,4-dihydroquinoline]-1-yl]propyl]dimethylaminium] tetraiodide, 4-[(3-methylbenzothiazole-2(3H)-ylidene)methyl]-1-[3-(trimethylaminio)propyl]quinolinium diiodide, N,N,N',N'-tetramethyl-N,N'-bis[3-
- the reagent 42 contains an RNA remover for removing RNA contained in the sample 11.
- the sample 11 sometimes contains RNA in the cells. Since the reagent 41 is a nucleic acid staining dye, there are cases where the reagent 41 stains RNA contained in the sample 11. When RNA is stained, RNA-derived fluorescence is added to DNA-derived fluorescence to be detected, causing increased background, which is not preferable. Such RNA is degraded by the reagent 42.
- the optical detection unit 50 includes a flow cytometer.
- the optical detection unit 50 causes the mixture prepared by the specimen preparation unit 40 to flow in a flow cell 50a.
- the optical detection unit 50 irradiates with light the mixture flowing in the flow cell 50a.
- the optical detection unit 50 detects light emitted from the mixture.
- the optical detection unit 50 includes the flow cell 50a, a light source 51, a condenser lens group 52, a condenser lens 53, an optical detector 54, a condenser lens 55, an optical detector 56, and a signal processing circuit 57.
- the light source 51 emits a laser beam.
- the condenser lens group 52 is composed of a plurality of lenses.
- the condenser lens group 52 condenses the laser beam on the mixture flowing in the flow cell 50a. Accordingly, from the particles in the mixture, forward scattered light and fluorescence are generated. Forward scattered light reflects the size of each particle, and fluorescence reflects the degree of staining of the particle.
- the condenser lens 53 condenses forward scattered light.
- the optical detector 54 receives forward scattered light.
- the optical detector 54 is a photodiode.
- the optical detector 54 outputs an electric signal corresponding to the received forward scattered light, i.e., a forward scattered light signal.
- the condenser lens 55 condenses fluorescence.
- the optical detector 56 receives fluorescence.
- the optical detector 56 is a photomultiplier.
- the optical detector 56 outputs an electric signal corresponding to the received fluorescence, i.e., a fluorescence signal.
- the signal processing circuit 57 performs predetermined signal processing on signals outputted from the optical detectors 54 and 56, to obtain waveforms corresponding to the forward scattered light signal and the fluorescence signal, respectively.
- the signal processing circuit 57 calculates a plurality of characteristic parameters such as the peak value, the width, and the area, from each obtained waveform.
- the peak value is the maximum value of the waveform.
- the width is the width of the portion, of the waveform, that is greater than a predetermined threshold.
- the area is the area of the portion surrounded by the waveform and line segments which are extended downwardly from the points where a predetermined threshold crosses the waveform.
- the signal processing circuit 57 outputs characteristic parameters of each light of each particle, to the analysis unit 60.
- the analysis unit 60 includes a CPU. As indicated by dotted lines, the analysis unit 60 controls the transfer unit 20, the pretreatment unit 30, the specimen preparation unit 40, and the optical detection unit 50.
- the analysis unit 60 stores, in a storage 60a, characteristic parameters of each light of each particle outputted from the signal processing circuit 57.
- the analysis unit 60 analyzes characteristics of each light based on the characteristic parameters of each light of each particle, to obtain an analysis result.
- the analysis result includes information regarding canceration, and the like.
- the analysis unit 60 displays the analysis result on the output unit 70.
- the analysis unit 60 receives instructions from an operator via the input unit 80.
- the output unit 70 is a display.
- the input unit 80 is a mouse and/or a key board.
- the first control particles 12a are particles to be stained by the fluorescent dye of the reagent 41.
- the second control particles 12b are particles which are substantially not stained by the fluorescent dye of the reagent 41, and which emit fluorescence by containing a fluorescent dye in advance.
- the first control particles 12a are selected from the group consisting of: cells, polyacrylamide particles, hydrophilic vinyl polymer particles, latex particles, and silica particles. Preferably, the first control particles 12a are cells.
- the second control particles 12b are fluorescent latex particles.
- the second control particles 12b emit fluorescence more intense than that emitted by the first control particles 12a. More specifically, the second control particles 12b emit fluorescence more intense than that emitted by the first control particles 12a which have been stained under an appropriate condition by use of the reagents 41 and 42. Thus, based on the difference between the fluorescence intensities, the first control particles 12a can be distinguished from the second control particles 12b.
- the first control particles 12a and the second control particles 12b are contained in containers, respectively.
- the transfer unit 20 aspirates the first control particles 12a and the second control particles 12b, dispenses them into cuvettes not shown, and transfers the cuvettes.
- the pretreatment unit 30 is not used in the quality control mode.
- the specimen preparation unit 40 mixes the first control particles 12a, the second control particles 12b, and the reagents 41 and 42, to prepare a mixture. Accordingly, the first control particles 12a are stained by the reagent 41.
- the first control particles 12a contain RNA in the specimen. This is for determining whether the reagent 42 containing the RNA remover is properly acting or not.
- the optical detection unit 50 causes the mixture prepared by the specimen preparation unit 40 to flow in the flow cell 50a.
- the optical detection unit 50 irradiates with light the first control particles 12a and the second control particles 12b flowing in the flow cell 50a.
- the optical detection unit 50 detects light emitted from each of the first control particles 12a and the second control particles 12b.
- the signal processing circuit 57 of the optical detection unit 50 outputs, to the analysis unit 60, characteristic parameters of each light of each particle.
- the analysis unit 60 stores, in the storage 60a, the characteristic parameters of each light of each particle outputted from the signal processing circuit 57.
- the analysis unit 60 Based on the characteristic parameters of each light of each particle, the analysis unit 60 obtains a first management value, a second management value, and a third management value.
- the first management value and the second management value represent detection results of fluorescence emitted from the first control particles 12a and the second control particles 12b, respectively.
- the third management value is a value calculated from the first management value and the second management value.
- the analysis unit 60 determines detection abnormality, i.e., abnormality in the optical detection unit 50.
- the analysis unit 60 determines staining abnormality, i.e., abnormality in staining performed in the specimen preparation unit 40. When there are detection abnormality and staining abnormality, the analysis unit 60 outputs notifications of the respective detection abnormality and staining abnormality via the output unit 70. How to determine detection abnormality and staining abnormality will be described later with reference to flow charts.
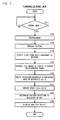
- step S101 upon activation of the particle analyzer 10, in step S101, the analysis unit 60 determines whether the operation mode has been set to the normal mode via the input unit 80 by an operator. When having determined as YES in step S101, then in step S102, the analysis unit 60 causes the pretreatment unit 30 to perform pretreatment on the sample 11 as described above. In step S103, the analysis unit 60 causes the specimen preparation unit 40 to mix the reagents 41 and 42 and the sample 11 having been subjected to the processing by the pretreatment unit 30, to prepare a mixture.
- step S104 the analysis unit 60 causes the optical detection unit 50: to cause the mixture to flow in the flow cell 50a; to irradiate with light the mixture flowing in the flow cell 50a; and to detect light generated from the mixture as a result of the irradiation.
- the analysis unit 60 stores, in the storage 60a, characteristic parameters of each light generated from each cell contained in the mixture.
- step S105 based on the characteristic parameters of each light of each particle stored in the storage 60a, the analysis unit 60 extracts cells whose N/C ratio is within a predetermined range from among all the cells contained in the mixture.
- the analysis unit 60 obtains the N/C ratio.
- the analysis unit 60 may calculate the C/N ratio, and may extracts cells whose C/N ratio is within a predetermined range.
- step S106 and S107 the analysis unit 60 performs analysis based on the amount of DNA of each of cells contained in the sample 11 as described below.
- the analysis unit 60 creates a histogram regarding the amount of DNA of the cells extracted in step S105. Specifically, the analysis unit 60 creates a histogram whose two axes represent the area of waveform of fluorescence signal and the number of cells. The area of the waveform of a fluorescence signal (hereinafter, referred to as "fluorescence area”) corresponds to the amount of DNA of the cell.
- step S107 the analysis unit 60 analyses the fluorescence areas of the cells contained in the sample 11, to obtain the ratio of cells each containing a predetermined amount or more of DNA (hereinafter, referred to as "target cell ratio"). Specifically, based on the histogram created in step S106, the analysis unit 60 calculates "the number of cells each having a fluorescence area greater than or equal to a predetermined threshold / the number of cells each having a fluorescence area less than the predetermined threshold", to obtain a target cell ratio.
- the target cell ratio is obtained by creating a histogram in step S106, but it is not necessary to actually create a histogram. That is, the target cell ratio may be obtained through data processing based on the cells extracted in step S105. Similarly, also in step S204 in FIG. 4 , a first measurement value and a second measurement value may be obtained through data processing without creating a histogram.
- step S108 based on the target cell ratio obtained in step S107, the analysis unit 60 determines whether retesting is necessary or not. When the target cell ratio is greater than or equal to a predetermined value, the analysis unit 60 determines that retesting is necessary. When the target cell ratio is less than the predetermined value, the analysis unit 60 determines that retesting is not necessary. In step S 109, the analysis unit 60 displays, on the output unit 70, the target cell ratio and the determination result indicating whether retesting is necessary or not, as the analysis result.
- the reagent 41 and the reagent 42 may deteriorate due to storage condition and use condition.
- nucleic acid is not sufficiently stained. This may case the distribution of the histogram to be shifted toward the low value side.
- the reagent 42 is deteriorated, RNA is not sufficiently removed, and background of fluorescence is increased. This may cause the distribution of the histogram to be shifted toward the high value side. Either case could have unfavorable influence on accurate analysis of the amount of DNA.
- quality management of the reagents 41 and 42 is important, and further, it is important to determine staining abnormality in the specimen preparation unit 40 in the quality control mode.
- the analysis unit 60 determines whether the operation mode has been set to the quality control mode via the input unit 80 by the operator. When having determined as YES in step S201, then, in step S202, the analysis unit 60 causes the specimen preparation unit 40 to mix the reagents 41 and 42, the first control particles 12a, and the second control particles 12b, to prepare a mixture. In step S203, the analysis unit 60 causes the optical detection unit 50: to cause the mixture to flow in the flow cell 50a; to irradiate with light the first control particles 12a and the second control particles 12b flowing in the flow cell 50a; and to detect fluorescence from the first control particles 12a and the second control particles 12b. The analysis unit 60 stores, in the storage 60a, characteristic parameters of each light generated from the first control particles 12a and characteristic parameters of each light generated from the second control particles 12b.
- step S204 the analysis unit 60 obtains a first measurement value and a second measurement value. Specifically, first, based on the difference in fluorescence intensities, the analysis unit 60 classifies data of each particle stored in the storage 60a, as either the first control particle 12a or the second control particle 12b. As described above, the second control particles 12b emit fluorescence more intense than that emitted by the first control particles 12a. Therefore, based on the difference in fluorescence intensities, classification between the first control particles 12a and the second control particles 12b can be performed.
- the analysis unit 60 creates a histogram regarding the fluorescence area generated from each particle.
- the analysis unit 60 obtains a representative value in the histogram as shown in FIG. 5A .
- the representative value is the most frequent value, i.e., the fluorescence area which appears most frequently in the histogram regarding the fluorescence area.
- the representative value may be an average value or a median.
- the analysis unit 60 sets the representative value obtained based on the histogram of the first control particles 12a, as the first measurement value.
- the analysis unit 60 sets the representative value obtained based on the histogram of the second control particles 12b, as the second measurement value.
- step S205 based on a predetermined number of times of measurements, the analysis unit 60 determines whether the quality control measurement has ended.
- the analysis unit 60 repeats the processes of steps S202 to S204 n times.
- the analysis unit 60 obtains a first measurement value and a second measurement value in each of the first to n-th measurements as shown in FIG. 5B .
- the number n is set to 1 or 2, for example.
- the reagents 41 and 42, the first control particles 12a, and the second control particles 12b are mixed together to prepare a mixture.
- a mixture of the first control particles 12a and a mixture of the second control particles 12b may be separately prepared.
- the processes of steps S202 to S205 are replaced with steps S221 to S228, as shown in FIG. 6 .
- step S221 the analysis unit 60 causes the specimen preparation unit 40 to mix the reagents 41 and 42 and the first control particles 12a, to prepare a mixture.
- step S222 the analysis unit 60 causes the optical detection unit 50: to cause the mixture to flow in the flow cell 50a; to irradiate with light the first control particles 12a flowing in the flow cell 50a; and to detect fluorescence from the first control particles 12a.
- step S223 the analysis unit 60 obtains a first measurement value, as in step S204 above.
- the analysis unit 60 repeats the processes of S221 to S223 the predetermined number of times, to obtain the first measurement values the predetermined number of times.
- the analysis unit 60 obtains a first management value, a second management value, and a third management value.
- the first management value is the average of the first measurement values obtained in step S204.
- the first management value is obtained by Expression (11) below.
- the second management value is the average of the second measurement values obtained in step S204.
- the second management value is obtained by Expression (12) below.
- the third management value is a value calculated from the first management value and the second management value.
- the third management value is a value of the ratio of the first management value to the second management value.
- the third management value is obtained by Expression (13) below.
- Third management value first management value / second management value
- the second management value is a value obtained based on fluorescence generated from the second control particles 12b which are substantially not stained by the reagent 41 and which contain a fluorescent dye in advance.
- the second management value reflects the state of the optical detection unit 50.
- the first management value is a value that also reflects the state (such as reagent deterioration) of the staining step in addition to the state of the optical detection unit 50.
- the first management value can be considered as the product of the second management value representing the state of the optical detection unit 50 and the value representing the state of the staining step. Therefore, the third management value obtained by dividing the first management value by the second management value reflects the state of the staining step.
- the third management value may be a value obtained by squaring the first management value/the second management value.
- the third management value may be a value obtained by adding a constant to the first management value/the second management value, subtracting a constant from the first management value/the second management value, multiplying the first management value/the second management value with a constant, or dividing the first management value/the second management value by a constant.
- the third management value may be the second management value/the first management value.
- the third management value may be a value of a log of the first management value/the second management value.
- the third management value may be obtained by (V11 + V12 + ... + V1n) / (V21 + V22 + ... + V2n), without using the first management value and the second management value.
- the third management value may not be a value based on the ratio between the first management value and the second management value. For example, the ratio of the first management value to a target value 1 of the first management value (first management value/target value 1) and the ratio of the second management value to a target value 2 of the second management value (second management value/target value 2) are calculated, and then, the difference between these ratios may be used as the third management value.
- step S207 based on the second management value and the third management value, the analysis unit 60 performs the processes of abnormality determinations shown in FIGS. 7A and 7B in parallel.
- step S401 the analysis unit 60 determines whether the second management value is within a reference range.
- the reference range of the second management value is defined by a lower limit threshold Sh21 and an upper limit threshold Sh22.
- the lower limit threshold Sh21 and the upper limit threshold Sh22 are stored in the storage 60a.
- step S411 the analysis unit 60 determines whether the third management value is within a reference range.
- the reference range of the third management value is defined by a lower limit threshold Sh31 and an upper limit threshold Sh32.
- the lower limit threshold Sh31 and the upper limit threshold Sh32 are stored in the storage 60a.
- the analysis unit 60 determines that there is no staining abnormality.
- the analysis unit 60 determines that there is staining abnormality.
- the staining abnormality determination may be a process shown in FIG. 8A , instead of the process shown in FIG. 7B .
- determination of staining abnormality is performed based on the ratio between the first management value and the second management value.
- step S421 is added before step S411, and step S411 is replaced with step S422.
- step S421 the analysis unit 60 plots a point based on the obtained first management value and second management value, on a coordinate space having axes which represent first management value and second management value. In the coordinate space, a normal range is set as indicated by diagonal lines in FIG. 8B .
- the analysis unit 60 has the normal range stored in the storage 60a in advance.
- step S422 the analysis unit 60 determines whether the plotted point is in the normal range. When having determined as YES in step S422, then, in step S412, the analysis unit 60 determines that there is no staining abnormality. When having determined as NO in step S422, then, in step S413, the analysis unit 60 determines that there is staining abnormality.
- step S421 a point based on the first management value and the second management value is plotted on the coordinate space, but it is not necessary to actually create the coordinate space and plot the point. That is, instead of creating the coordinate space, plotting the point, and determining whether the plotted point is within the normal range, whether the point based on the first management value and the second management value is within the normal range may be determined by data processing.
- the process of abnormality determination is performed in accordance with separate flow charts as shown in FIGS. 7A and 7B .
- the flow charts shown in FIGS. 7A and 7B may be combined into one flow chart, and in accordance with the one flow chart, a process of determining system abnormality, a process of determining detection abnormality, and a process of determining staining abnormality may be performed.
- step S208 the analysis unit 60 determines the presence/absence of detection abnormality based on the result of the process shown in FIG 7A .
- steps S209 and S210 the analysis unit 60 determines the presence/absence of staining abnormality based on the result of the process shown in FIG. 7B .
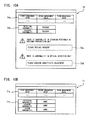
- the analysis unit 60 displays a screen 71 as shown in FIG. 9A on the output unit 70.
- the screen 71 includes lists 71a and 71b showing quality control results.
- the list 71a displays the first to third management values in the form of a list.
- the list 71b displays, as a quality control abnormality determination result, the presence/absence of detection abnormality and the presence/absence of staining abnormality in the form of a list.
- the analysis unit 60 displays a screen 72 as shown in FIG. 9B on the output unit 70.
- the screen 72 includes lists 72a and 72b similar to the lists 71a and 71b shown in FIG. 9A . Further, the screen 72 includes a region 72c and a message "There is abnormality in staining performed in the specimen preparation unit". In the region 72c, "Please replace reagent” as a message for urging replacement of the reagent 41, 42 is displayed. The message displayed in the region 72c may be "Please confirm the state of reagent", or "Please contact a service person".
- the operator can know that there is abnormality in staining performed in the specimen preparation unit 40.
- the operator can smoothly and quickly take measures for eliminating the staining abnormality.
- the operator can smoothly and quickly eliminate the staining abnormality.
- step S213 the analysis unit 60 prohibits measurement on the sample 11 in the normal mode. Accordingly, the processes of step S102 and thereafter in FIG. 3 are not started. Therefore, it is possible to prevent measurement on the sample 11 from being mistakenly performed in the normal mode, and thus it is possible to prevent an analysis result of low accuracy from being obtained.
- step S212 the process of the quality control mode shown in FIG. 4 is performed again after the operator or a service person has taken measures. At this time, when having determined as NO in step S208 and having determined as NO in step S209, the analysis unit 60 cancels the prohibition of measurement on the sample 11.
- the analysis unit 60 displays a screen 73 as shown in FIG. 9C on the output unit 70. Then, in step S213, the analysis unit 60 prohibits measurement on the sample 11 in the normal mode.
- the screen 73 includes lists 73a and 73b similar to the lists 71a and 71b shown in FIG. 9A . Further, the screen 73 includes a region 73c and a message "There is abnormality in the optical detection unit". In the region 73c, "Please execute sensitivity adjustment.” is displayed as a message for urging taking measures. The message displayed in the region 73c may be "Please contact a service person".
- the operator can know that there is abnormality in the optical detection unit 50.
- the operator can smoothly and quickly take measures for eliminating the detection abnormality.
- the operator can smoothly and quickly eliminate the detection abnormality.
- the analysis unit 60 displays a screen 74 as shown in FIG. 10A on the output unit 70. Then, in step S213, the analysis unit 60 prohibits measurement on the sample 11 in the normal mode.
- the screen 74 includes lists 74a and 74b similar to the lists 71 a and 71b shown in FIG. 9A . Further, similarly to the screen 72 in FIG. 9B , the screen 74 includes a message and a region 74c. Further, similarly to the screen 73 in FIG. 9C , the screen 74 includes a message and a region 74d.
- step S215 even in the case where there is abnormality in both the optical detection unit 50 and the specimen preparation unit 40, notifications of detection abnormality and reagent abnormality are individually and assuredly made. Accordingly, the operator can smoothly and quickly take measures for eliminating the abnormalities, and thus, the operator can smoothly and quickly eliminate the detection abnormality and the reagent abnormality.
- FIG. 10B shows another example of the screen 71 showing a quality control result.
- the list 71b displays the presence/absence of system abnormality.
- System abnormality is an integrated result of the determination on detection abnormality and the determination on staining abnormality. Therefore, when abnormality is determined to be present in either detection or staining, the list 71b displays "System abnormality: present". When there is abnormality in neither detection nor staining, the list 71b displays "System abnormality: none". It should be noted that system abnormality may be determined depending on whether the first management value is within its reference range.
- the analysis unit 60 may store the obtained third management value in the storage 60a. In this case, by observing the change in the third management value over time, it is possible to predict deterioration of the reagents 41 and 42, and to predict replacing time of the reagents 41 and 42.
- Embodiment 2 the configuration of the particle analyzer 10 is the same as that in Embodiment 1, and only the process of staining abnormality determination is different from that in Embodiment 1, as described below.
- step S441 the analysis unit 60 determines whether the third management value is greater than a threshold Sh32. When having determined as NO in step S441, then, in step S442, the analysis unit 60 determines whether the third management value is smaller than a threshold Sh31.
- step S443 the analysis unit 60 determines that there is no staining abnormality.
- step S444 the analysis unit 60 determines that there is abnormality in the reagent 41.
- step S445 the analysis unit 60 determines that there is abnormality in the reagent 42.
- the analysis unit 60 may perform the determination in steps S441 and S442 by use of the coordinate space shown in FIG. 8B .
- a message urging replacement of the reagent is displayed in a later stage of step S212, S215 in FIG. 4 .
- the analysis unit 60 displays a screen 75 shown in FIG. 11B on the output unit 70.
- the analysis unit 60 displays a screen 76 shown in FIG. 11C on the output unit 70.
- the case where it is determined that there is staining abnormality in the process of the staining abnormality determination in Embodiment 1 shown in FIG. 7B includes a case where the reagent 41 containing the fluorescent dye has been deteriorated and a case where the reagent 42 containing the RNA remover has been deteriorated.
- the reagent 41 has been deteriorated
- staining of the first control particles 12a becomes insufficient, and thus, fluorescence generated from the first control particles 12a become weak, causing a decreased third management value.
- the reagent 42 has been deteriorated, removal of free RNA becomes insufficient, and thus, background of fluorescence is increased, causing an increased third management value.
- Embodiment 2 as in Embodiment 1, it is possible to determine that there is staining abnormality, and further, it is possible to know which of the reagents 41 and 42 should be replaced.
- the first control particles 12a, the second control particles 12b, the reagent 41, and the reagent 42 used in the experiment were as follows.
- the first control particles 12a were prepared as follows. C33A cells (HTB-31) obtained from American Type Culture Collection were suspended in PreservCyt (registered trademark) of Hologic Inc. and left still for 24 hours. Then, the mixture was centrifuged to remove the supernatant. The resultant mixture was suspended in pH7.5, 10 mM Tris hydrochloric acid aqueous solution. This final mixture was used as the first control particles 12a. As the second control particles 12b, AlignFlow Plus Flow Cytometry Alignment Beads (A-7303) of Life Technologies Inc. diluted by pH7.5, 10mM Tris hydrochloric acid aqueous solution were used.
- reagent 41 propidium iodide (PI) of Sigma-Aldrich Co. LLC. diluted by ethylene glycol was used.
- the reagent 41 was prepared in two types. That is, after the reagents 41 were prepared, one was stored with light blocked and the other was stored under exposure to light. Thus, the reagent 41 stored with light blocked, and the reagent 41 stored under exposure to light to be deteriorated were used as the reagent 41.
- RNaseA Cat. R4642
- the reagent 41 being a stain liquid and sensitivity abnormality in the optical detection unit 50
- the reagent 41 and the voltage applied to the optical detector 56 which detects fluorescence were changed in accordance with the following three conditions.
- Condition 1 the reagent 41 was the one stored under exposure to light; and the voltage applied to the optical detector 56 was 251 V, which was an appropriate voltage.
- Condition 2 the reagent 41 was the one stored under exposure to light; and the voltage applied to the optical detector 56 was 255 V.
- Condition 3 the reagent 41 was the one stored with light blocked; and the voltage applied to the optical detector 56 was 253 V.
- step S221 in FIG. 6 the reagent 42 and a diluent were added to the first control particles 12a, and the mixture was left still at 37°C for 10 minutes. Then, the reagent 41 was added thereto, and the resultant mixture was left still at 37°C for 2 minutes. In this manner, a mixture of the first control particles 12a was prepared.
- step S222 in FIG. 6 by use of the particle analyzer 10 shown in FIG. 1 , fluorescence signals from the mixture were obtained. Steps S221 to S223 were repeated twice, to obtain a first measurement value of the first round, and a first measurement value of the second round.
- step S225 of FIG. 6 a diluent was added to the second control particles 12b, to prepare the second control particles 12b.
- step S226 in FIG. 6 by use of the particle analyzer 10 as in step S222, fluorescence signals from the second control particles 12b were obtained. Steps S225 to S227 were repeated twice, to obtain a second measurement value of the first round and a second measurement value of the second round.
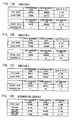
- the first measurement values and the second measurement values obtained under Conditions 1 to 3 are shown in the upper tables in FIGS. 12A to 12C . It should be noted that, in FIGS. 12A to 12C , the value of the ratio of each first measurement value to its corresponding second measurement value is shown as a reference.
- step S206 in FIG. 4 as described above, first to third management values were obtained. That is, the first to third management values were obtained with n set at 2 in Expressions (11) to (13). The first to third management values under Conditions 1 to 3 are shown in the lower tables in FIGS. 12A to 12C .
- the upper limit thresholds and the lower limit thresholds used in determination on the first to third management values were set as shown in FIG. 12D .
- Each lower limit threshold was a target value from which a value corresponding to its tolerance was subtracted, and each upper limit threshold was a target value to which a value corresponding to its tolerance was added.
- system abnormality determination was performed by use of the same technique as that of U.S. Patent Application Publication No. 2007/013906 . That is, when the first management value was greater than or equal to its lower limit threshold, and was smaller than or equal to its upper limit threshold, it was determined that there was no system abnormality. When the first management value was smaller than its lower limit threshold, or was greater than its upper limit threshold, it was determined that there was system abnormality.
- Determination results of the first to third management values under Conditions 1 to 3 are shown in the lower tables in FIGS. 12A to 12C .
- determination becomes "G”.
- determination becomes "NG”.
- the third management value was smaller than its lower limit threshold, and the determination on the third management value was "NG".
- the second management value was greater than its upper limit threshold, and the determination on the second management value was "NG”.
- the third management value representing the staining state is obtained separately from the first management value, whereby it is possible to find abnormality in the staining step which was not grasped conventionally.
- the operator can perform maintenance such that appropriate DNA amount analysis can be performed.
- the technique of U.S. Patent Application Publication No. 2007/013906 does not provide indices for determining a case where the second management value indicates abnormality, i.e., a case there is abnormality in the optical detection unit, and further, for determining whether there is abnormality also in the staining step.
- the operator performs reagent replacement in addition to sensitivity adjustment of the optical detection unit.
- whether the abnormality requires reagent replacement is unknown.
Landscapes
- Chemical & Material Sciences (AREA)
- Health & Medical Sciences (AREA)
- Immunology (AREA)
- Physics & Mathematics (AREA)
- Analytical Chemistry (AREA)
- General Health & Medical Sciences (AREA)
- Pathology (AREA)
- Life Sciences & Earth Sciences (AREA)
- General Physics & Mathematics (AREA)
- Biochemistry (AREA)
- Engineering & Computer Science (AREA)
- Dispersion Chemistry (AREA)
- Quality & Reliability (AREA)
- Chemical Kinetics & Catalysis (AREA)
- Nuclear Medicine, Radiotherapy & Molecular Imaging (AREA)
- Optics & Photonics (AREA)
- Signal Processing (AREA)
- Investigating, Analyzing Materials By Fluorescence Or Luminescence (AREA)
- Investigating Or Analysing Biological Materials (AREA)
Description
- The present invention relates to a method for determining abnormality in a particle analyzer and a particle analyzer.
- There are particle analyzers which analyze particles by detecting fluorescence generated from the particles. Such a particle analyzer mixes a sample containing particles with a fluorescent dye to prepare a measurement specimen, and causes the prepared measurement specimen to flow in a flow cell. The particle analyzer irradiates the flow of the measurement specimen with light, to detect fluorescence generated from each particle. Based on signals obtained through this detection, the particles are classified. In such a particle analyzer, in order to obtain an accurate measurement result, quality control using a quality control standard material is performed.
- With the technique according to
U.S. Patent Application Publication No. 2007/013906 , the place of the abnormality occurring in the particle analyzer is determined by use of a quality control substance which contains: first standard particles to be fluorescence-stained by a first fluorescent dye; and second standard particles which contain a second fluorescent dye in advance and which are substantially not to be stained by the first fluorescent dye. When the measurement result of the second standard particles is outside a reference range, it is determined that abnormality is in the fluorescence detector. In the case where the measurement result of the second standard particle is within the reference range, when the measurement result of the first standard particle is outside a reference range, it is determined that abnormality is in the specimen preparation mechanism. In the case where the measurement result of the first standard particle is smaller than its reference range, and the measurement result of the second standard particle is greater than its reference range, it is determined that abnormality is in the specimen preparation mechanism and in the fluorescence detector. - The scope of the present invention is defined solely by the appended claims, and is not affected to any degree by the statements within this summary.
- With the technique according to
U.S. Patent Application Publication No. 2007/013906 , there are cases whether abnormality is in the staining step or not cannot be discerned. - A first aspect of the present invention relates to a method for determining abnormality in a particle analyzer. The method includes: staining first control particles but not staining second control particles which emit fluorescence; irradiating with light the first control particles and the second control particles flowing in a flow cell, and detecting fluorescence from the first control particles and the second control particles; obtaining a first management value indicating a detection result of the fluorescence emitted from the first control particles and a second management value indicating a detection result of the fluorescence emitted from the second control particles; and determining abnormality in the staining step, based on a value calculated from the first management value and the second management value or a ratio between the first management value and the second management value.
- A second aspect of the present invention relates to a particle analyzer including: a specimen preparation unit configured to mix a specimen and a reagent which contains a fluorescent dye; an optical detection unit configured to cause the mixture prepared by the specimen preparation unit to flow in a flow cell, configured to irradiate with light the mixture flowing in the flow cell, and configured to detect light generated from the mixture as a result of the irradiation; and an analysis unit configured to analyze characteristic of light detected by the optical detection unit. When a quality control mode is set, the analysis unit is configured to cause the specimen preparation unit to mix the reagent, first control particles which are to be stained by the fluorescent dye, and second control particles which are not to be stained by the fluorescent dye and which emit fluorescence, to prepare a mixture, cause the optical detection unit: to cause the mixture to flow in the flow cell; to irradiate with light the first control particles and the second control particles flowing in the flow cell; and to detect fluorescence from the first control particles and the second control particles, obtain a first management value indicating a detection result of the fluorescence emitted from the first control particles and a second management value indicating a detection result of the fluorescence emitted from the second control particles, and determine abnormality in staining performed in the specimen preparation unit, based on a value calculated from the first management value and the second management value or a ratio between the first management value and the second management value.
- The effects and the significance of the present invention will be further clarified by the description of the embodiments below. However, the embodiments below are merely examples for implementing the present invention, and the present invention is not limited to the embodiments below by any degree.
-
-
FIG. 1 is a block diagram showing a configuration of a particle analyzer according toEmbodiment 1; -
FIG. 2A is a schematic diagram showing a configuration of an optical detection unit according toEmbodiment 1; -
FIG. 2B is a schematic diagram showing a characteristic parameter according toEmbodiment 1; -
FIG. 2C is a schematic diagram showing a characteristic parameter according toEmbodiment 1; -
FIG. 2D is a schematic diagram showing a characteristic parameter according toEmbodiment 1; -
FIG. 3 is a flow chart showing a process performed by the particle analyzer in a normal mode according toEmbodiment 1; -
FIG. 4 is a flow chart showing a process performed by the particle analyzer in a quality control mode according toEmbodiment 1; -
FIG. 5A is a schematic diagram showing a histogram regarding the area of the waveform of a fluorescence signal generated from each particle according toEmbodiment 1; -
FIG. 5B shows first measurement value and second measurement value according toEmbodiment 1; -
FIG. 6 is a modification of the flow chart showing a process performed by the particle analyzer in the quality control mode according toEmbodiment 1; -
FIG. 7A is a flow chart showing detection abnormality determination according toEmbodiment 1; -
FIG. 7B is a flow chart showing staining abnormality determination according toEmbodiment 1; -
FIG. 7C shows lower limit thresholds and upper limit thresholds to be used in determination according toEmbodiment 1; -
FIG. 8A is a modification of the flow chart showing the staining abnormality determination according toEmbodiment 1; -
FIG. 8B shows a normal range to be used in the staining abnormality determination according to the modification; -
FIG. 9A shows a screen to be displayed on an output unit according toEmbodiment 1; -
FIG. 9B shows a screen to be displayed on the output unit according toEmbodiment 1; -
FIG. 9C shows a screen to be displayed on the output unit according toEmbodiment 1; -
FIG. 10A shows a screen to be displayed on the output unit according toEmbodiment 1; -
FIG. 10B shows a modification of the screen to be displayed on the output unit according toEmbodiment 1; -
FIG. 11 A is a flow chart showing staining abnormality determination according toEmbodiment 2; -
FIG. 11 B shows a screen to be displayed on the output unit according toEmbodiment 2; -
FIG. 11C shows a screen to be displayed on the output unit according toEmbodiment 2; -
FIG. 12A shows first measurement value, second measurement value, first management value, second management value, and third management value obtained underCondition 1 as well as determination result, in an experiment according toEmbodiment 1; -
FIG. 12B shows first measurement value, second measurement value, first management value, second management value, and third management value obtained underCondition 2 as well as determination result, in an experiment according toEmbodiment 1; -
FIG. 12C shows first measurement value, second measurement value, first management value, second management value, and third management value obtained underCondition 3 as well as determination result, in an experiment according toEmbodiment 1; and -
FIG. 12D shows lower limit thresholds and upper limit thresholds used in the determination made in the experiment according toEmbodiment 1. - Embodiments 1 and 2 below are applied to an apparatus whose analysis target is uterine cervix cells and which obtains information regarding canceration of the cells. The analysis target may be buccal cells, epithelial cells of the bladder, the pharynx, or the like, or epithelial cells of organs.
- As shown in
FIG. 1 , aparticle analyzer 10 includes atransfer unit 20, apretreatment unit 30, aspecimen preparation unit 40, anoptical detection unit 50, ananalysis unit 60, anoutput unit 70, and aninput unit 80. Theparticle analyzer 10 has a normal mode and a quality control mode as operation modes. Theparticle analyzer 10 analyzes asample 11 in the normal mode. Thesample 11 is a clinical sample which is collected from the uterine cervix of a subject, and contains epithelial cells of the uterine cervix. In the quality control mode, theparticle analyzer 10 performs quality control by use offirst control particles 12a andsecond control particles 12b. - First, a case where the operation mode is the normal mode will be described. The
sample 11 is a liquid in which cells are suspended in a preservative liquid whose principal component is alcohol. Thesample 11 is contained in a sample container. Preferably, the alcohol is methanol. Thetransfer unit 20 aspirates thesample 11, dispenses the aspiratedsample 11 into a cuvette not shown, and transfers the cuvette. Thepretreatment unit 30 disperses, with ultrasonic waves, aggregated cells contained in thesample 11 dispensed in the cuvette. Further, thepretreatment unit 30 replaces the preservative liquid suspending the cells contained in thesample 11, with a diluent. Thepretreatment unit 30 removes contaminant from thesample 11 and concentrates thesample 11. - The
specimen preparation unit 40 mixesreagents sample 11 having been subjected to the processing by thepretreatment unit 30, to prepare a mixture. Thereagent 41 contains a fluorescent dye. The fluorescent dye contained in thereagent 41 is a nucleic acid staining dye. Nucleic acid in each cell contained in thesample 11 is stained by thereagent 41. - It is sufficient that the nucleic acid staining dye is a fluorescent dye which emits fluorescence by binding to nucleic acid. An example of the nucleic acid fluorescent dye is propidium iodide, ethidium bromide, ethidium-acridine heterodimer, ethidium diazide, ethidium homodimer-1, ethidium homodimer-2, ethidium monoazide, trimethylenebis[[3-[[4-[[(3-methyl benzothiazole-3-ium)-2-yl]methylene]-1,4-dihydroquinoline]-1-yl]propyl]dimethylaminium] tetraiodide, 4-[(3-methylbenzothiazole-2(3H)-ylidene)methyl]-1-[3-(trimethylaminio)propyl]quinolinium diiodide, N,N,N',N'-tetramethyl-N,N'-bis[3-[4-[3-[(3-methylbenzothiazole-3-ium)-2-yl]-2-propenylidene]-1,4-dihydroquinoline-1-yl]propyl]-1,3-propanediaminium tetraiodide, or 2-[3-[[1-[3-(trimethylaminio)propyl]-1,4-dihydroquinoline]-4-ylidene]-1-propenyl]-3-methylbenzothiazol-3-ium diiodide.
- The
reagent 42 contains an RNA remover for removing RNA contained in thesample 11. Thesample 11 sometimes contains RNA in the cells. Since thereagent 41 is a nucleic acid staining dye, there are cases where thereagent 41 stains RNA contained in thesample 11. When RNA is stained, RNA-derived fluorescence is added to DNA-derived fluorescence to be detected, causing increased background, which is not preferable. Such RNA is degraded by thereagent 42. - The
optical detection unit 50 includes a flow cytometer. Theoptical detection unit 50 causes the mixture prepared by thespecimen preparation unit 40 to flow in aflow cell 50a. Theoptical detection unit 50 irradiates with light the mixture flowing in theflow cell 50a. Theoptical detection unit 50 detects light emitted from the mixture. - As shown in
FIG. 2A , theoptical detection unit 50 includes theflow cell 50a, alight source 51, acondenser lens group 52, acondenser lens 53, anoptical detector 54, acondenser lens 55, anoptical detector 56, and asignal processing circuit 57. - The
light source 51 emits a laser beam. Thecondenser lens group 52 is composed of a plurality of lenses. Thecondenser lens group 52 condenses the laser beam on the mixture flowing in theflow cell 50a. Accordingly, from the particles in the mixture, forward scattered light and fluorescence are generated. Forward scattered light reflects the size of each particle, and fluorescence reflects the degree of staining of the particle. - The
condenser lens 53 condenses forward scattered light. Theoptical detector 54 receives forward scattered light. Theoptical detector 54 is a photodiode. Theoptical detector 54 outputs an electric signal corresponding to the received forward scattered light, i.e., a forward scattered light signal. Thecondenser lens 55 condenses fluorescence. Theoptical detector 56 receives fluorescence. Theoptical detector 56 is a photomultiplier. Theoptical detector 56 outputs an electric signal corresponding to the received fluorescence, i.e., a fluorescence signal. - The
signal processing circuit 57 performs predetermined signal processing on signals outputted from theoptical detectors signal processing circuit 57 calculates a plurality of characteristic parameters such as the peak value, the width, and the area, from each obtained waveform. As shown inFIG. 2B , the peak value is the maximum value of the waveform. As shown inFIG. 2C , the width is the width of the portion, of the waveform, that is greater than a predetermined threshold. As shown inFIG. 2D , the area is the area of the portion surrounded by the waveform and line segments which are extended downwardly from the points where a predetermined threshold crosses the waveform. Thesignal processing circuit 57 outputs characteristic parameters of each light of each particle, to theanalysis unit 60. - With reference back to
FIG. 1 , theanalysis unit 60 includes a CPU. As indicated by dotted lines, theanalysis unit 60 controls thetransfer unit 20, thepretreatment unit 30, thespecimen preparation unit 40, and theoptical detection unit 50. Theanalysis unit 60 stores, in astorage 60a, characteristic parameters of each light of each particle outputted from thesignal processing circuit 57. Theanalysis unit 60 analyzes characteristics of each light based on the characteristic parameters of each light of each particle, to obtain an analysis result. The analysis result includes information regarding canceration, and the like. Theanalysis unit 60 displays the analysis result on theoutput unit 70. Theanalysis unit 60 receives instructions from an operator via theinput unit 80. Theoutput unit 70 is a display. Theinput unit 80 is a mouse and/or a key board. - Next, a case where the operation mode is the quality control mode will be described. The
first control particles 12a are particles to be stained by the fluorescent dye of thereagent 41. Thesecond control particles 12b are particles which are substantially not stained by the fluorescent dye of thereagent 41, and which emit fluorescence by containing a fluorescent dye in advance. - The
first control particles 12a are selected from the group consisting of: cells, polyacrylamide particles, hydrophilic vinyl polymer particles, latex particles, and silica particles. Preferably, thefirst control particles 12a are cells. - The
second control particles 12b are fluorescent latex particles. Thesecond control particles 12b emit fluorescence more intense than that emitted by thefirst control particles 12a. More specifically, thesecond control particles 12b emit fluorescence more intense than that emitted by thefirst control particles 12a which have been stained under an appropriate condition by use of thereagents first control particles 12a can be distinguished from thesecond control particles 12b. - The
first control particles 12a and thesecond control particles 12b are contained in containers, respectively. Thetransfer unit 20 aspirates thefirst control particles 12a and thesecond control particles 12b, dispenses them into cuvettes not shown, and transfers the cuvettes. Thepretreatment unit 30 is not used in the quality control mode. Thespecimen preparation unit 40 mixes thefirst control particles 12a, thesecond control particles 12b, and thereagents first control particles 12a are stained by thereagent 41. - The
first control particles 12a contain RNA in the specimen. This is for determining whether thereagent 42 containing the RNA remover is properly acting or not. - As in the normal mode, the
optical detection unit 50 causes the mixture prepared by thespecimen preparation unit 40 to flow in theflow cell 50a. Theoptical detection unit 50 irradiates with light thefirst control particles 12a and thesecond control particles 12b flowing in theflow cell 50a. Theoptical detection unit 50 detects light emitted from each of thefirst control particles 12a and thesecond control particles 12b. Thesignal processing circuit 57 of theoptical detection unit 50 outputs, to theanalysis unit 60, characteristic parameters of each light of each particle. Theanalysis unit 60 stores, in thestorage 60a, the characteristic parameters of each light of each particle outputted from thesignal processing circuit 57. - Based on the characteristic parameters of each light of each particle, the
analysis unit 60 obtains a first management value, a second management value, and a third management value. The first management value and the second management value represent detection results of fluorescence emitted from thefirst control particles 12a and thesecond control particles 12b, respectively. The third management value is a value calculated from the first management value and the second management value. Based on the second management value, theanalysis unit 60 determines detection abnormality, i.e., abnormality in theoptical detection unit 50. Based on the third management value, theanalysis unit 60 determines staining abnormality, i.e., abnormality in staining performed in thespecimen preparation unit 40. When there are detection abnormality and staining abnormality, theanalysis unit 60 outputs notifications of the respective detection abnormality and staining abnormality via theoutput unit 70. How to determine detection abnormality and staining abnormality will be described later with reference to flow charts. - Next, the process performed by the
particle analyzer 10 in the normal mode will be described with reference to the flow chart shown inFIG. 3 . - As shown in
FIG. 3 , upon activation of theparticle analyzer 10, in step S101, theanalysis unit 60 determines whether the operation mode has been set to the normal mode via theinput unit 80 by an operator. When having determined as YES in step S101, then in step S102, theanalysis unit 60 causes thepretreatment unit 30 to perform pretreatment on thesample 11 as described above. In step S103, theanalysis unit 60 causes thespecimen preparation unit 40 to mix thereagents sample 11 having been subjected to the processing by thepretreatment unit 30, to prepare a mixture. In step S104, theanalysis unit 60 causes the optical detection unit 50: to cause the mixture to flow in theflow cell 50a; to irradiate with light the mixture flowing in theflow cell 50a; and to detect light generated from the mixture as a result of the irradiation. Theanalysis unit 60 stores, in thestorage 60a, characteristic parameters of each light generated from each cell contained in the mixture. - In step S105, based on the characteristic parameters of each light of each particle stored in the
storage 60a, theanalysis unit 60 extracts cells whose N/C ratio is within a predetermined range from among all the cells contained in the mixture. By calculating "the width of the waveform of a fluorescence signal / the width of the waveform of a forward scattered light signal", theanalysis unit 60 obtains the N/C ratio. Instead of the N/C ratio, theanalysis unit 60 may calculate the C/N ratio, and may extracts cells whose C/N ratio is within a predetermined range. - Next, in step S106 and S107, the
analysis unit 60 performs analysis based on the amount of DNA of each of cells contained in thesample 11 as described below. In step S106, theanalysis unit 60 creates a histogram regarding the amount of DNA of the cells extracted in step S105. Specifically, theanalysis unit 60 creates a histogram whose two axes represent the area of waveform of fluorescence signal and the number of cells. The area of the waveform of a fluorescence signal (hereinafter, referred to as "fluorescence area") corresponds to the amount of DNA of the cell. In step S107, theanalysis unit 60 analyses the fluorescence areas of the cells contained in thesample 11, to obtain the ratio of cells each containing a predetermined amount or more of DNA (hereinafter, referred to as "target cell ratio"). Specifically, based on the histogram created in step S106, theanalysis unit 60 calculates "the number of cells each having a fluorescence area greater than or equal to a predetermined threshold / the number of cells each having a fluorescence area less than the predetermined threshold", to obtain a target cell ratio. - Here, for convenience of explanation, the target cell ratio is obtained by creating a histogram in step S106, but it is not necessary to actually create a histogram. That is, the target cell ratio may be obtained through data processing based on the cells extracted in step S105. Similarly, also in step S204 in
FIG. 4 , a first measurement value and a second measurement value may be obtained through data processing without creating a histogram. - In step S108, based on the target cell ratio obtained in step S107, the
analysis unit 60 determines whether retesting is necessary or not. When the target cell ratio is greater than or equal to a predetermined value, theanalysis unit 60 determines that retesting is necessary. When the target cell ratio is less than the predetermined value, theanalysis unit 60 determines that retesting is not necessary. Instep S 109, theanalysis unit 60 displays, on theoutput unit 70, the target cell ratio and the determination result indicating whether retesting is necessary or not, as the analysis result. - In the
particle analyzer 10 which performs analysis based on the amount of DNA, staining of nucleic acid by thereagent 41 and reduced background by thereagent 42 have direct influence on the shape of the histogram regarding the amount of DNA. Thereagent 41 and thereagent 42 may deteriorate due to storage condition and use condition. When thereagent 41 is deteriorated, nucleic acid is not sufficiently stained. This may case the distribution of the histogram to be shifted toward the low value side. When thereagent 42 is deteriorated, RNA is not sufficiently removed, and background of fluorescence is increased. This may cause the distribution of the histogram to be shifted toward the high value side. Either case could have unfavorable influence on accurate analysis of the amount of DNA. - Therefore, quality management of the
reagents specimen preparation unit 40 in the quality control mode. - Next, the process performed by the
particle analyzer 10 in the quality control mode will be described with reference to the flow chart shown inFIG. 4 . - As shown in
FIG. 4 , upon activation of theparticle analyzer 10, in step S201, theanalysis unit 60 determines whether the operation mode has been set to the quality control mode via theinput unit 80 by the operator. When having determined as YES in step S201, then, in step S202, theanalysis unit 60 causes thespecimen preparation unit 40 to mix thereagents first control particles 12a, and thesecond control particles 12b, to prepare a mixture. In step S203, theanalysis unit 60 causes the optical detection unit 50: to cause the mixture to flow in theflow cell 50a; to irradiate with light thefirst control particles 12a and thesecond control particles 12b flowing in theflow cell 50a; and to detect fluorescence from thefirst control particles 12a and thesecond control particles 12b. Theanalysis unit 60 stores, in thestorage 60a, characteristic parameters of each light generated from thefirst control particles 12a and characteristic parameters of each light generated from thesecond control particles 12b. - In step S204, the
analysis unit 60 obtains a first measurement value and a second measurement value. Specifically, first, based on the difference in fluorescence intensities, theanalysis unit 60 classifies data of each particle stored in thestorage 60a, as either thefirst control particle 12a or thesecond control particle 12b. As described above, thesecond control particles 12b emit fluorescence more intense than that emitted by thefirst control particles 12a. Therefore, based on the difference in fluorescence intensities, classification between thefirst control particles 12a and thesecond control particles 12b can be performed. - Next, with respect to each type of the
first control particles 12a and thesecond control particles 12b, as shown inFIG. 5A , theanalysis unit 60 creates a histogram regarding the fluorescence area generated from each particle. Theanalysis unit 60 obtains a representative value in the histogram as shown inFIG. 5A . The representative value is the most frequent value, i.e., the fluorescence area which appears most frequently in the histogram regarding the fluorescence area. The representative value may be an average value or a median. Theanalysis unit 60 sets the representative value obtained based on the histogram of thefirst control particles 12a, as the first measurement value. Theanalysis unit 60 sets the representative value obtained based on the histogram of thesecond control particles 12b, as the second measurement value. - In step S205, based on a predetermined number of times of measurements, the
analysis unit 60 determines whether the quality control measurement has ended. When it is assumed that the predetermined number of times of measurements is n, theanalysis unit 60 repeats the processes of steps S202 to S204 n times. When it is assumed that the n-th first measurement value is V1n and the n-th second measurement value is V2n, theanalysis unit 60 obtains a first measurement value and a second measurement value in each of the first to n-th measurements as shown inFIG. 5B . The number n is set to 1 or 2, for example. - In the above procedure, the
reagents first control particles 12a, and thesecond control particles 12b are mixed together to prepare a mixture. However, instead of this, a mixture of thefirst control particles 12a and a mixture of thesecond control particles 12b may be separately prepared. In this case, the processes of steps S202 to S205 are replaced with steps S221 to S228, as shown inFIG. 6 . - As shown in
FIG. 6 , in step S221, theanalysis unit 60 causes thespecimen preparation unit 40 to mix thereagents first control particles 12a, to prepare a mixture. In step S222, theanalysis unit 60 causes the optical detection unit 50: to cause the mixture to flow in theflow cell 50a; to irradiate with light thefirst control particles 12a flowing in theflow cell 50a; and to detect fluorescence from thefirst control particles 12a. In step S223, theanalysis unit 60 obtains a first measurement value, as in step S204 above. In accordance with the determination in step S224, theanalysis unit 60 repeats the processes of S221 to S223 the predetermined number of times, to obtain the first measurement values the predetermined number of times. - Next, in steps S225 to S228, as in steps S221 to S224, the
analysis unit 60 obtains the second measurement values the predetermined number of times. Also through steps S221 to S228 inFIG. 6 , as in steps S202 to S205 inFIG. 4 , the first measurement values and the second measurement values are obtained as shown inFIG. 5B . - With reference back to
FIG. 4 , in step S206, theanalysis unit 60 obtains a first management value, a second management value, and a third management value. The first management value is the average of the first measurement values obtained in step S204. The first management value is obtained by Expression (11) below. The second management value is the average of the second measurement values obtained in step S204. The second management value is obtained by Expression (12) below. The third management value is a value calculated from the first management value and the second management value. Preferably, the third management value is a value of the ratio of the first management value to the second management value. The third management value is obtained by Expression (13) below.


- The second management value is a value obtained based on fluorescence generated from the
second control particles 12b which are substantially not stained by thereagent 41 and which contain a fluorescent dye in advance. Thus, the second management value reflects the state of theoptical detection unit 50. In contrast, the first management value is a value that also reflects the state (such as reagent deterioration) of the staining step in addition to the state of theoptical detection unit 50. The first management value can be considered as the product of the second management value representing the state of theoptical detection unit 50 and the value representing the state of the staining step. Therefore, the third management value obtained by dividing the first management value by the second management value reflects the state of the staining step. - The third management value may be a value obtained by squaring the first management value/the second management value. The third management value may be a value obtained by adding a constant to the first management value/the second management value, subtracting a constant from the first management value/the second management value, multiplying the first management value/the second management value with a constant, or dividing the first management value/the second management value by a constant. The third management value may be the second management value/the first management value. The third management value may be a value of a log of the first management value/the second management value. The third management value may be obtained by (V11 + V12 + ... + V1n) / (V21 + V22 + ... + V2n), without using the first management value and the second management value. The third management value may not be a value based on the ratio between the first management value and the second management value. For example, the ratio of the first management value to a
target value 1 of the first management value (first management value/target value 1) and the ratio of the second management value to atarget value 2 of the second management value (second management value/target value 2) are calculated, and then, the difference between these ratios may be used as the third management value. - In step S207, based on the second management value and the third management value, the
analysis unit 60 performs the processes of abnormality determinations shown inFIGS. 7A and 7B in parallel. - As shown in
FIG. 7A , in step S401, theanalysis unit 60 determines whether the second management value is within a reference range. As shown inFIG. 7C , the reference range of the second management value is defined by a lower limit threshold Sh21 and an upper limit threshold Sh22. The lower limit threshold Sh21 and the upper limit threshold Sh22 are stored in thestorage 60a. When having determined as YES in step S401, then, in step S402, theanalysis unit 60 determines that there is no detection abnormality. When having determined as NO in step S401, then, in step S403, theanalysis unit 60 determines that there is detection abnormality. - As shown in
FIG. 7B , in step S411, theanalysis unit 60 determines whether the third management value is within a reference range. As shown inFIG. 7C , the reference range of the third management value is defined by a lower limit threshold Sh31 and an upper limit threshold Sh32. The lower limit threshold Sh31 and the upper limit threshold Sh32 are stored in thestorage 60a. When having determined as YES in step S411, then, in step S412, theanalysis unit 60 determines that there is no staining abnormality. When having determined as NO in step S411, then, in step S413, theanalysis unit 60 determines that there is staining abnormality. - The staining abnormality determination may be a process shown in
FIG. 8A , instead of the process shown inFIG. 7B . In this case, as shown below, determination of staining abnormality is performed based on the ratio between the first management value and the second management value. Thus, there is no need to obtain the third management value in step S206 inFIG. 4 . Compared with the process theFIG. 7B , in the process shown inFIG. 8A , step S421 is added before step S411, and step S411 is replaced with step S422. - As shown in
FIG. 8A , in step S421, theanalysis unit 60 plots a point based on the obtained first management value and second management value, on a coordinate space having axes which represent first management value and second management value. In the coordinate space, a normal range is set as indicated by diagonal lines inFIG. 8B . Theanalysis unit 60 has the normal range stored in thestorage 60a in advance. In step S422, theanalysis unit 60 determines whether the plotted point is in the normal range. When having determined as YES in step S422, then, in step S412, theanalysis unit 60 determines that there is no staining abnormality. When having determined as NO in step S422, then, in step S413, theanalysis unit 60 determines that there is staining abnormality. - Here, for convenience of explanation, in step S421, a point based on the first management value and the second management value is plotted on the coordinate space, but it is not necessary to actually create the coordinate space and plot the point. That is, instead of creating the coordinate space, plotting the point, and determining whether the plotted point is within the normal range, whether the point based on the first management value and the second management value is within the normal range may be determined by data processing.
- The process of abnormality determination is performed in accordance with separate flow charts as shown in
FIGS. 7A and 7B . However, the flow charts shown inFIGS. 7A and 7B may be combined into one flow chart, and in accordance with the one flow chart, a process of determining system abnormality, a process of determining detection abnormality, and a process of determining staining abnormality may be performed. - With reference back to
FIG. 4 , when all the processes of abnormality determination shown inFIGS. 7A and 7B have ended, then, in step S208, theanalysis unit 60 determines the presence/absence of detection abnormality based on the result of the process shown inFIG 7A . In steps S209 and S210, theanalysis unit 60 determines the presence/absence of staining abnormality based on the result of the process shown inFIG. 7B . - When having determined as NO in step S208 and having determined as NO in step S209, then, in step S211, the
analysis unit 60 displays ascreen 71 as shown inFIG. 9A on theoutput unit 70. Thescreen 71 includeslists list 71a displays the first to third management values in the form of a list. Thelist 71b displays, as a quality control abnormality determination result, the presence/absence of detection abnormality and the presence/absence of staining abnormality in the form of a list. - When having determined as NO in step S208 and having determined as YES in step S209, then, in step S212, the
analysis unit 60 displays ascreen 72 as shown inFIG. 9B on theoutput unit 70. Thescreen 72 includeslists lists FIG. 9A . Further, thescreen 72 includes aregion 72c and a message "There is abnormality in staining performed in the specimen preparation unit". In theregion 72c, "Please replace reagent" as a message for urging replacement of thereagent region 72c may be "Please confirm the state of reagent", or "Please contact a service person". By referring to thescreen 72, the operator can know that there is abnormality in staining performed in thespecimen preparation unit 40. By referring to theregion 72c, the operator can smoothly and quickly take measures for eliminating the staining abnormality. Thus, the operator can smoothly and quickly eliminate the staining abnormality. - In step S213, the
analysis unit 60 prohibits measurement on thesample 11 in the normal mode. Accordingly, the processes of step S102 and thereafter inFIG. 3 are not started. Therefore, it is possible to prevent measurement on thesample 11 from being mistakenly performed in the normal mode, and thus it is possible to prevent an analysis result of low accuracy from being obtained. In the case where measurement on thesample 11 has been prohibited in step S212, the process of the quality control mode shown inFIG. 4 is performed again after the operator or a service person has taken measures. At this time, when having determined as NO in step S208 and having determined as NO in step S209, theanalysis unit 60 cancels the prohibition of measurement on thesample 11. - When having determined as YES in step S208 and having determined as NO in step S210, then, in step S214, the
analysis unit 60 displays ascreen 73 as shown inFIG. 9C on theoutput unit 70. Then, in step S213, theanalysis unit 60 prohibits measurement on thesample 11 in the normal mode. Thescreen 73 includeslists lists FIG. 9A . Further, thescreen 73 includes aregion 73c and a message "There is abnormality in the optical detection unit". In theregion 73c, "Please execute sensitivity adjustment." is displayed as a message for urging taking measures. The message displayed in theregion 73c may be "Please contact a service person". By referring to thescreen 73, the operator can know that there is abnormality in theoptical detection unit 50. By referring to theregion 73c, the operator can smoothly and quickly take measures for eliminating the detection abnormality. Thus, the operator can smoothly and quickly eliminate the detection abnormality. - When having determined as YES in step S208 and having determined as YES in step S210, then, in step S215, the
analysis unit 60 displays ascreen 74 as shown inFIG. 10A on theoutput unit 70. Then, in step S213, theanalysis unit 60 prohibits measurement on thesample 11 in the normal mode. Thescreen 74 includeslists lists FIG. 9A . Further, similarly to thescreen 72 inFIG. 9B , thescreen 74 includes a message and aregion 74c. Further, similarly to thescreen 73 inFIG. 9C , thescreen 74 includes a message and aregion 74d. - In step S215, even in the case where there is abnormality in both the
optical detection unit 50 and thespecimen preparation unit 40, notifications of detection abnormality and reagent abnormality are individually and assuredly made. Accordingly, the operator can smoothly and quickly take measures for eliminating the abnormalities, and thus, the operator can smoothly and quickly eliminate the detection abnormality and the reagent abnormality. -
FIG. 10B shows another example of thescreen 71 showing a quality control result. On thescreen 71 shown inFIG. 10B , thelist 71b displays the presence/absence of system abnormality. System abnormality is an integrated result of the determination on detection abnormality and the determination on staining abnormality. Therefore, when abnormality is determined to be present in either detection or staining, thelist 71b displays "System abnormality: present". When there is abnormality in neither detection nor staining, thelist 71b displays "System abnormality: none". It should be noted that system abnormality may be determined depending on whether the first management value is within its reference range. - Every time the
analysis unit 60 obtains a third management value in the quality control mode, theanalysis unit 60 may store the obtained third management value in thestorage 60a. In this case, by observing the change in the third management value over time, it is possible to predict deterioration of thereagents reagents - In
Embodiment 2, the configuration of theparticle analyzer 10 is the same as that inEmbodiment 1, and only the process of staining abnormality determination is different from that inEmbodiment 1, as described below. - As shown in
FIG. 11A , in step S441, theanalysis unit 60 determines whether the third management value is greater than a threshold Sh32. When having determined as NO in step S441, then, in step S442, theanalysis unit 60 determines whether the third management value is smaller than a threshold Sh31. - When having determined as NO in step S441 and having determined as NO in step S442, then, in step S443, the
analysis unit 60 determines that there is no staining abnormality. When having determined as NO in step S441 and having determined as YES in step S442, then, in step S444, theanalysis unit 60 determines that there is abnormality in thereagent 41. When having determined as YES in step S441, then in step S445, theanalysis unit 60 determines that there is abnormality in thereagent 42. Theanalysis unit 60 may perform the determination in steps S441 and S442 by use of the coordinate space shown inFIG. 8B . - When it has been determined that there is abnormality in a reagent in step S444, S445, a message urging replacement of the reagent is displayed in a later stage of step S212, S215 in
FIG. 4 . Specifically, when having determined that there is abnormality in thereagent 41 in step S444, theanalysis unit 60 displays ascreen 75 shown inFIG. 11B on theoutput unit 70. When having determined that there is abnormality in thereagent 42 in step S445, theanalysis unit 60 displays ascreen 76 shown inFIG. 11C on theoutput unit 70. - Here, the case where it is determined that there is staining abnormality in the process of the staining abnormality determination in
Embodiment 1 shown inFIG. 7B includes a case where thereagent 41 containing the fluorescent dye has been deteriorated and a case where thereagent 42 containing the RNA remover has been deteriorated. In the case where thereagent 41 has been deteriorated, staining of thefirst control particles 12a becomes insufficient, and thus, fluorescence generated from thefirst control particles 12a become weak, causing a decreased third management value. In the case where thereagent 42 has been deteriorated, removal of free RNA becomes insufficient, and thus, background of fluorescence is increased, causing an increased third management value. Therefore, by comparing the third management value with the lower limit threshold Sh31, it is possible to determine that there is abnormality in thereagent 41. By comparing the third management value with the upper limit threshold Sh32, it is possible to determine that there is abnormality in thereagent 42. - Thus, according to
Embodiment 2, as inEmbodiment 1, it is possible to determine that there is staining abnormality, and further, it is possible to know which of thereagents - Next, an experiment actually conducted regarding abnormality determination will be described.
- The
first control particles 12a, thesecond control particles 12b, thereagent 41, and thereagent 42 used in the experiment were as follows. - The
first control particles 12a were prepared as follows. C33A cells (HTB-31) obtained from American Type Culture Collection were suspended in PreservCyt (registered trademark) of Hologic Inc. and left still for 24 hours. Then, the mixture was centrifuged to remove the supernatant. The resultant mixture was suspended in pH7.5, 10 mM Tris hydrochloric acid aqueous solution. This final mixture was used as thefirst control particles 12a. As thesecond control particles 12b, AlignFlow Plus Flow Cytometry Alignment Beads (A-7303) of Life Technologies Inc. diluted by pH7.5, 10mM Tris hydrochloric acid aqueous solution were used. - As the
reagent 41, propidium iodide (PI) of Sigma-Aldrich Co. LLC. diluted by ethylene glycol was used. Thereagent 41 was prepared in two types. That is, after thereagents 41 were prepared, one was stored with light blocked and the other was stored under exposure to light. Thus, thereagent 41 stored with light blocked, and thereagent 41 stored under exposure to light to be deteriorated were used as thereagent 41. As thereagent 42, RNaseA (Cat. R4642) of Sigma-Aldrich Co. LLC. diluted by pH7.5, 10 mM Tris hydrochloric acid aqueous solution was used. - In the experiment, in order to reproduce abnormality in the
reagent 41 being a stain liquid and sensitivity abnormality in theoptical detection unit 50, thereagent 41 and the voltage applied to theoptical detector 56 which detects fluorescence were changed in accordance with the following three conditions. - Condition 1: the
reagent 41 was the one stored under exposure to light; and the voltage applied to theoptical detector 56 was 251 V, which was an appropriate voltage. - Condition 2: the
reagent 41 was the one stored under exposure to light; and the voltage applied to theoptical detector 56 was 255 V. - Condition 3: the
reagent 41 was the one stored with light blocked; and the voltage applied to theoptical detector 56 was 253 V. - In the experiment, measurement regarding the
first control particles 12a and measurement regarding thesecond control particles 12b were separately performed. That is, in the flow chart shown inFIG. 4 , steps S202 to S205 were replaced with step S221 to S228 inFIG. 6 . The following explanation will be given with reference to the flow charts inFIG. 4 andFIG. 6 as appropriate. - In step S221 in
FIG. 6 , thereagent 42 and a diluent were added to thefirst control particles 12a, and the mixture was left still at 37°C for 10 minutes. Then, thereagent 41 was added thereto, and the resultant mixture was left still at 37°C for 2 minutes. In this manner, a mixture of thefirst control particles 12a was prepared. In step S222 inFIG. 6 , by use of theparticle analyzer 10 shown inFIG. 1 , fluorescence signals from the mixture were obtained. Steps S221 to S223 were repeated twice, to obtain a first measurement value of the first round, and a first measurement value of the second round. - Next, in step S225 of
FIG. 6 , a diluent was added to thesecond control particles 12b, to prepare thesecond control particles 12b. In step S226 inFIG. 6 , by use of theparticle analyzer 10 as in step S222, fluorescence signals from thesecond control particles 12b were obtained. Steps S225 to S227 were repeated twice, to obtain a second measurement value of the first round and a second measurement value of the second round. - The first measurement values and the second measurement values obtained under
Conditions 1 to 3 are shown in the upper tables inFIGS. 12A to 12C . It should be noted that, inFIGS. 12A to 12C , the value of the ratio of each first measurement value to its corresponding second measurement value is shown as a reference. - Next, in step S206 in
FIG. 4 , as described above, first to third management values were obtained. That is, the first to third management values were obtained with n set at 2 in Expressions (11) to (13). The first to third management values underConditions 1 to 3 are shown in the lower tables inFIGS. 12A to 12C . - The upper limit thresholds and the lower limit thresholds used in determination on the first to third management values were set as shown in
FIG. 12D . Each lower limit threshold was a target value from which a value corresponding to its tolerance was subtracted, and each upper limit threshold was a target value to which a value corresponding to its tolerance was added. - Next, system abnormality determination, detection abnormality determination, and staining abnormality determination were performed. The detection abnormality determination and the staining abnormality determination were performed in accordance with the processes shown in
FIGS. 7A and 7B . In order to compare with the technique ofU.S. Patent Application Publication No. 2007/013906 , system abnormality was determined by use of the same technique as that ofU.S. Patent Application Publication No. 2007/013906 . That is, when the first management value was greater than or equal to its lower limit threshold, and was smaller than or equal to its upper limit threshold, it was determined that there was no system abnormality. When the first management value was smaller than its lower limit threshold, or was greater than its upper limit threshold, it was determined that there was system abnormality. Determination results of the first to third management values underConditions 1 to 3 are shown in the lower tables inFIGS. 12A to 12C . In the lower tables inFIGS. 12A to 12C , in the case where a management value is greater than or equal to its lower limit threshold, and is smaller than or equal to its upper limit threshold, determination becomes "G". When a management value is smaller than its lower limit threshold, or is greater than its upper limit threshold, determination becomes "NG". - As shown in the lower tables in
FIGS. 12A to 12C , in the case of using thereagent 41 which was intentionally deteriorated by being stored under exposure to light, that is, in the case ofConditions optical detector 56 was intentionally increased, that is in the case ofConditions - The experiment above has revealed that, under
Condition 1 using thereagent 41 stored under exposure to light, even though the determinations on the first management value and the second management value were both "G", i.e., there was no abnormality in the system and the detection, the determination on the third management value was "NG", i.e., there was abnormality in staining. This abnormality is the one that cannot be found by the technique ofU.S. Patent Application Publication No. 2007/013906 which focuses only on the amount of fluorescence of thefirst control particles 12a (first management value) and the amount of fluorescence of thesecond control particles 12b (second management value). - In this point, according to the techniques in
Embodiments - In
Conditions Condition 2 using thereagent 41 stored under exposure to light, the determination on the third management value was "NG", i.e., that there was abnormality in staining was shown. UnderCondition 3 using thereagent 41 stored with light blocked, the determination on the third management value was "G", i.e., that there was no abnormality in staining was shown. The difference in the determination betweenCondition 2 andCondition 3 cannot be found either, by the technique ofU.S. Patent Application Publication No. 2007/013906 which focuses only on the amount of fluorescence of thefirst control particles 12a (first management value) and the amount of fluorescence of thesecond control particles 12b (second management value). - The technique of
U.S. Patent Application Publication No. 2007/013906 does not provide indices for determining a case where the second management value indicates abnormality, i.e., a case there is abnormality in the optical detection unit, and further, for determining whether there is abnormality also in the staining step. In the case where there is abnormality in both of the optical detection unit and the staining step, the operator performs reagent replacement in addition to sensitivity adjustment of the optical detection unit. However, with the conventional technique, whether the abnormality requires reagent replacement is unknown. - In this point, according to the techniques of
Embodiments Embodiments optical detection unit 50 and thespecimen preparation unit 40, it is possible to individually and assuredly make notifications of the detection abnormality and the reagent abnormality.
Claims (15)
- A method for determining abnormality in a particle analyzer, the method comprising:staining first control particles but not staining second control particles which emit fluorescence;irradiating with light the first control particles and the second control particles flowing in a flow cell, and detecting fluorescence from the first control particles and the second control particles;obtaining a first management value indicating a detection result of the fluorescence emitted from the first control particles and a second management value indicating a detection result of the fluorescence emitted from the second control particles; anddetermining abnormality in the staining step, based on a value calculated from the first management value and the second management value or a ratio between the first management value and the second management value.
- The method for determining abnormality of claim 1, further comprising
determining abnormality in the detecting step based on the second management value. - The method for determining abnormality of claim 1 or 2, further comprising
prohibiting measurement on a clinical sample by the particle analyzer in a case where the second management value indicates abnormality and in a case where the ratio or the value calculated from the first management value and the second management value indicates abnormality. - The method for determining abnormality of claim 3, further comprising
outputting a message urging replacement of a reagent in a case where the ratio or the value calculated from the first management value and the second management value indicates abnormality. - The method for determining abnormality of any one of claims 1 to 4, further comprising
outputting, in a form of a list, an abnormality determination result based on the second management value and an abnormality determination result based on the ratio or the value calculated from the first management value and the second management value. - The method for determining abnormality of any one of claims 1 to 5, wherein
the first control particles are selected from cells, polyacrylamide particles, hydrophilic vinyl polymer particles, latex particles, and silica particles. - The method for determining abnormality of any one of claims 1 to 6, wherein
the first control particles are cells, and
in the staining step, nuclei of the cells are stained. - The method for determining abnormality of claim 7, wherein
in the staining step, RNA is removed from the cells. - The method for determining abnormality of claim 8, wherein in the determining step,
in a case where the value calculated from the first management value and the second management value is smaller than a lower limit threshold of a reference range, it is determined that there is abnormality in the reagent, and
in a case where the value calculated from the first management value and the second management value is greater than an upper limit threshold of the reference range, it is determined that there is abnormality in the RNA remover. - The method for determining abnormality of any one of claims 1 to 9, wherein
in the determining step, a third management value is calculated based on the first management value and the second management value, and in accordance with whether the calculated third management value is outside a reference range or not, abnormality in the staining step is determined. - The method for determining abnormality of any one of claims 1 to 10, further comprising
outputting notification of abnormality in the staining step, in a case where a combination of the first management value and the second management value obtained from the first control particles and the second control particles is not within a normal range. - The method for determining abnormality of any one of claims 1 to 11, wherein
the particle analyzer analyzes an amount of DNA of each of cells contained in a sample. - The method for determining abnormality of any one of claims 1 to 12, wherein
the particle analyzer analyzes an amount of DNA of each of cells contained in a sample to obtain a ratio of cells each containing a predetermined amount or more of DNA. - The method for determining abnormality of any one of claims 1 to 13, wherein
the first management value is a value based on a representative value of a numerical value obtained from waveforms of fluorescence signals of the respective first control particles, and
the second management value is a value based on a representative value of a numerical value obtained from waveforms of fluorescence signals of the respective second control particles. - A particle analyzer comprising:a specimen preparation unit configured to mix a specimen and a reagent which contains a fluorescent dye;an optical detection unit configured to cause the mixture prepared by the specimen preparation unit to flow in a flow cell, configured to irradiate with light the mixture flowing in the flow cell, and configured to detect light generated from the mixture as a result of the irradiation; andan analysis unit configured to analyze characteristic of light detected by the optical detection unit, whereinwhen a quality control mode is set, the analysis unit is configured tocause the specimen preparation unit to mix the reagent, first control particles which are to be stained by the fluorescent dye, and second control particles which are not to be stained by the fluorescent dye and which emit fluorescence, to prepare a mixture,cause the optical detection unit: to cause the mixture to flow in the flow cell; to irradiate with light the first control particles and the second control particles flowing in the flow cell; and to detect fluorescence from the first control particles and the second control particles,obtain a first management value indicating a detection result of the fluorescence emitted from the first control particles and a second management value indicating a detection result of the fluorescence emitted from the second control particles, anddetermine abnormality in staining performed in the specimen preparation unit, based on a value calculated from the first management value and the second management value or a ratio between the first management value and the second management value.
Applications Claiming Priority (1)
| Application Number | Priority Date | Filing Date | Title |
|---|---|---|---|
| JP2014202184A JP6342285B2 (en) | 2014-09-30 | 2014-09-30 | Abnormality determination method in particle analyzer, accuracy management method in analyzer, and particle analyzer |
Publications (2)
| Publication Number | Publication Date |
|---|---|
| EP3002581A1 true EP3002581A1 (en) | 2016-04-06 |
| EP3002581B1 EP3002581B1 (en) | 2019-01-16 |
Family
ID=54256553
Family Applications (1)
| Application Number | Title | Priority Date | Filing Date |
|---|---|---|---|
| EP15187626.5A Active EP3002581B1 (en) | 2014-09-30 | 2015-09-30 | Method for determining abnormality in particle analyzer and particle analyzer |
Country Status (4)
| Country | Link |
|---|---|
| US (1) | US10151696B2 (en) |
| EP (1) | EP3002581B1 (en) |
| JP (1) | JP6342285B2 (en) |
| CN (1) | CN105466840B (en) |
Cited By (3)
| Publication number | Priority date | Publication date | Assignee | Title |
|---|---|---|---|---|
| EP3629002A1 (en) * | 2018-09-28 | 2020-04-01 | Sysmex Corporation | Measurement apparatus and quality control method |
| EP3699574A1 (en) * | 2019-02-20 | 2020-08-26 | Sysmex Corporation | Measurement success/failure determination method and sample measurement device |
| EP4492043A4 (en) * | 2022-03-10 | 2025-06-11 | Sony Group Corporation | INFORMATION PROCESSING DEVICE AND INFORMATION PROCESSING SYSTEM |
Families Citing this family (5)
| Publication number | Priority date | Publication date | Assignee | Title |
|---|---|---|---|---|
| JP7012731B2 (en) * | 2016-10-25 | 2022-02-14 | アボット・ラボラトリーズ | Evaluation and control of reagents in automatic slide preparation |
| JP7271092B2 (en) * | 2018-05-25 | 2023-05-11 | シスメックス株式会社 | Reagent selection support device, cell analysis system, reagent selection support method, computer program and storage medium |
| CN109030801B (en) * | 2018-06-02 | 2021-08-20 | 宏葵生物(中国)股份有限公司 | Automatic biochemical analyzer for clinical samples |
| JP2021124397A (en) * | 2020-02-05 | 2021-08-30 | 日本光電工業株式会社 | Particle analysis method and particle analyzer |
| CN114624166A (en) * | 2022-03-11 | 2022-06-14 | 青岛瑞斯凯尔生物科技有限公司 | Control system and method of flow cytometer |
Citations (2)
| Publication number | Priority date | Publication date | Assignee | Title |
|---|---|---|---|---|
| US20070013906A1 (en) | 2005-07-12 | 2007-01-18 | Sysmex Corporation | Standard material for particle analyzer |
| EP2698622A2 (en) * | 2012-08-16 | 2014-02-19 | Sysmex Corporation | A cell analyzer and cell analyzing method |
Family Cites Families (12)
| Publication number | Priority date | Publication date | Assignee | Title |
|---|---|---|---|---|
| US5093234A (en) * | 1984-12-24 | 1992-03-03 | Caribbean Microparticles Corporation | Method of aligning, compensating, and calibrating a flow cytometer for analysis of samples, and microbead standards kit therefor |
| JPH09274035A (en) * | 1996-04-03 | 1997-10-21 | Toa Medical Electronics Co Ltd | Control substance and its staining method |
| JP4953710B2 (en) * | 2005-07-12 | 2012-06-13 | シスメックス株式会社 | Reference material for urine sediment analyzer |
| CN101349644B (en) * | 2007-07-20 | 2012-06-27 | 深圳迈瑞生物医疗电子股份有限公司 | Leukocytes classification agent and use method thereof |
| JP2009058233A (en) * | 2007-08-29 | 2009-03-19 | Nagasaki Prefecture | Method for determining contamination level of bathing facility, method for determining microbicidal effect of microbicide in bathtub water and method for controlling water quality of bathtub water |
| JP5380026B2 (en) | 2008-09-24 | 2014-01-08 | シスメックス株式会社 | Sample imaging device |
| JP5426181B2 (en) | 2009-01-21 | 2014-02-26 | シスメックス株式会社 | Specimen processing system, cell image classification apparatus, and specimen processing method |
| JP5658501B2 (en) | 2010-07-27 | 2015-01-28 | シスメックス株式会社 | SAMPLE ANALYSIS SYSTEM, SAMPLE ANALYSIS DEVICE, MANAGEMENT DEVICE, AND SAMPLE ANALYSIS DEVICE MANAGEMENT METHOD |
| US8715572B2 (en) * | 2011-05-19 | 2014-05-06 | Abbott Laboratories | Method and apparatus for detection, analysis, and collection of rare cellular events |
| TWI588258B (en) * | 2011-11-17 | 2017-06-21 | 國立交通大學 | A separation method of the labeled cells and uses thereof |
| JP5870851B2 (en) * | 2012-05-29 | 2016-03-01 | ソニー株式会社 | Information processing apparatus, information processing method, and program |
| JP5947630B2 (en) * | 2012-06-15 | 2016-07-06 | 日本光電工業株式会社 | Cell analysis apparatus and analysis method |
-
2014
- 2014-09-30 JP JP2014202184A patent/JP6342285B2/en active Active
-
2015
- 2015-09-29 CN CN201510631184.6A patent/CN105466840B/en active Active
- 2015-09-29 US US14/869,156 patent/US10151696B2/en active Active
- 2015-09-30 EP EP15187626.5A patent/EP3002581B1/en active Active
Patent Citations (2)
| Publication number | Priority date | Publication date | Assignee | Title |
|---|---|---|---|---|
| US20070013906A1 (en) | 2005-07-12 | 2007-01-18 | Sysmex Corporation | Standard material for particle analyzer |
| EP2698622A2 (en) * | 2012-08-16 | 2014-02-19 | Sysmex Corporation | A cell analyzer and cell analyzing method |
Cited By (4)
| Publication number | Priority date | Publication date | Assignee | Title |
|---|---|---|---|---|
| EP3629002A1 (en) * | 2018-09-28 | 2020-04-01 | Sysmex Corporation | Measurement apparatus and quality control method |
| US12228491B2 (en) | 2018-09-28 | 2025-02-18 | Sysmex Corporation | Measurement apparatus and quality control method |
| EP3699574A1 (en) * | 2019-02-20 | 2020-08-26 | Sysmex Corporation | Measurement success/failure determination method and sample measurement device |
| EP4492043A4 (en) * | 2022-03-10 | 2025-06-11 | Sony Group Corporation | INFORMATION PROCESSING DEVICE AND INFORMATION PROCESSING SYSTEM |
Also Published As
| Publication number | Publication date |
|---|---|
| CN105466840B (en) | 2019-11-12 |
| JP6342285B2 (en) | 2018-06-13 |
| CN105466840A (en) | 2016-04-06 |
| US10151696B2 (en) | 2018-12-11 |
| EP3002581B1 (en) | 2019-01-16 |
| JP2016070833A (en) | 2016-05-09 |
| US20160091428A1 (en) | 2016-03-31 |
Similar Documents
| Publication | Publication Date | Title |
|---|---|---|
| EP3002581B1 (en) | Method for determining abnormality in particle analyzer and particle analyzer | |
| US12287319B2 (en) | Methods and systems for determining platelet concentration | |
| JP5323829B2 (en) | Cell identification and sorting method and apparatus | |
| JP4101994B2 (en) | Particle analyzer and automatic particle analysis method | |
| US8538119B2 (en) | Particle image analysis method and apparatus | |
| EP1865303A1 (en) | Method of discriminating cancer and atypical cells and cell analyzer | |
| JP7291337B2 (en) | Bone marrow fluid analysis method, sample analyzer and computer program | |
| US7008792B2 (en) | Method of measurement of nucleated red blood cells | |
| Huppertsberg et al. | Validation of an FT-IR microscopy method for the determination of microplastic particles in surface waters | |
| EP2957889B1 (en) | Blood analyzer, blood analyzing method, and blood analyzing program | |
| US7208319B2 (en) | Method of measurement of nucleated red blood cells | |
| CN107655865B (en) | Blood analysis device and blood analysis method | |
| CN103364322B (en) | Canceration information provider unit, control system and information providing method | |
| CN105986003A (en) | White blood cell count method, white blood cell count device and cell analyzer | |
| JP3642658B2 (en) | Urine component analyzer and analysis method | |
| EP3136080B1 (en) | Urine sample analyzer and urine sample analyzing method | |
| US9664669B2 (en) | Urine specimen analyzing method, urine analyzer and non-transitory computer-readable storage medium | |
| CN119715317A (en) | Nucleated red blood cell detection equipment, analysis method, analysis device and storage medium |
Legal Events
| Date | Code | Title | Description |
|---|---|---|---|
| PUAI | Public reference made under article 153(3) epc to a published international application that has entered the european phase |
Free format text: ORIGINAL CODE: 0009012 |
|
| AK | Designated contracting states |
Kind code of ref document: A1 Designated state(s): AL AT BE BG CH CY CZ DE DK EE ES FI FR GB GR HR HU IE IS IT LI LT LU LV MC MK MT NL NO PL PT RO RS SE SI SK SM TR |
|
| AX | Request for extension of the european patent |
Extension state: BA ME |
|
| 17P | Request for examination filed |
Effective date: 20160324 |
|
| RBV | Designated contracting states (corrected) |
Designated state(s): AL AT BE BG CH CY CZ DE DK EE ES FI FR GB GR HR HU IE IS IT LI LT LU LV MC MK MT NL NO PL PT RO RS SE SI SK SM TR |
|
| STAA | Information on the status of an ep patent application or granted ep patent |
Free format text: STATUS: EXAMINATION IS IN PROGRESS |
|
| 17Q | First examination report despatched |
Effective date: 20180309 |
|
| GRAP | Despatch of communication of intention to grant a patent |
Free format text: ORIGINAL CODE: EPIDOSNIGR1 |
|
| STAA | Information on the status of an ep patent application or granted ep patent |
Free format text: STATUS: GRANT OF PATENT IS INTENDED |
|
| INTG | Intention to grant announced |
Effective date: 20180911 |
|
| GRAS | Grant fee paid |
Free format text: ORIGINAL CODE: EPIDOSNIGR3 |
|
| GRAA | (expected) grant |
Free format text: ORIGINAL CODE: 0009210 |
|
| STAA | Information on the status of an ep patent application or granted ep patent |
Free format text: STATUS: THE PATENT HAS BEEN GRANTED |
|
| AK | Designated contracting states |
Kind code of ref document: B1 Designated state(s): AL AT BE BG CH CY CZ DE DK EE ES FI FR GB GR HR HU IE IS IT LI LT LU LV MC MK MT NL NO PL PT RO RS SE SI SK SM TR |
|
| REG | Reference to a national code |
Ref country code: GB Ref legal event code: FG4D |
|
| REG | Reference to a national code |
Ref country code: CH Ref legal event code: EP |
|
| REG | Reference to a national code |
Ref country code: IE Ref legal event code: FG4D |
|
| REG | Reference to a national code |
Ref country code: DE Ref legal event code: R096 Ref document number: 602015023537 Country of ref document: DE |
|
| REG | Reference to a national code |
Ref country code: AT Ref legal event code: REF Ref document number: 1090058 Country of ref document: AT Kind code of ref document: T Effective date: 20190215 |
|
| REG | Reference to a national code |
Ref country code: NL Ref legal event code: MP Effective date: 20190116 |
|
| REG | Reference to a national code |
Ref country code: LT Ref legal event code: MG4D |
|
| PG25 | Lapsed in a contracting state [announced via postgrant information from national office to epo] |
Ref country code: NL Free format text: LAPSE BECAUSE OF FAILURE TO SUBMIT A TRANSLATION OF THE DESCRIPTION OR TO PAY THE FEE WITHIN THE PRESCRIBED TIME-LIMIT Effective date: 20190116 |
|
| REG | Reference to a national code |
Ref country code: AT Ref legal event code: MK05 Ref document number: 1090058 Country of ref document: AT Kind code of ref document: T Effective date: 20190116 |
|
| PG25 | Lapsed in a contracting state [announced via postgrant information from national office to epo] |
Ref country code: LT Free format text: LAPSE BECAUSE OF FAILURE TO SUBMIT A TRANSLATION OF THE DESCRIPTION OR TO PAY THE FEE WITHIN THE PRESCRIBED TIME-LIMIT Effective date: 20190116 Ref country code: NO Free format text: LAPSE BECAUSE OF FAILURE TO SUBMIT A TRANSLATION OF THE DESCRIPTION OR TO PAY THE FEE WITHIN THE PRESCRIBED TIME-LIMIT Effective date: 20190416 Ref country code: FI Free format text: LAPSE BECAUSE OF FAILURE TO SUBMIT A TRANSLATION OF THE DESCRIPTION OR TO PAY THE FEE WITHIN THE PRESCRIBED TIME-LIMIT Effective date: 20190116 Ref country code: SE Free format text: LAPSE BECAUSE OF FAILURE TO SUBMIT A TRANSLATION OF THE DESCRIPTION OR TO PAY THE FEE WITHIN THE PRESCRIBED TIME-LIMIT Effective date: 20190116 Ref country code: PL Free format text: LAPSE BECAUSE OF FAILURE TO SUBMIT A TRANSLATION OF THE DESCRIPTION OR TO PAY THE FEE WITHIN THE PRESCRIBED TIME-LIMIT Effective date: 20190116 Ref country code: PT Free format text: LAPSE BECAUSE OF FAILURE TO SUBMIT A TRANSLATION OF THE DESCRIPTION OR TO PAY THE FEE WITHIN THE PRESCRIBED TIME-LIMIT Effective date: 20190516 Ref country code: ES Free format text: LAPSE BECAUSE OF FAILURE TO SUBMIT A TRANSLATION OF THE DESCRIPTION OR TO PAY THE FEE WITHIN THE PRESCRIBED TIME-LIMIT Effective date: 20190116 |
|
| PG25 | Lapsed in a contracting state [announced via postgrant information from national office to epo] |
Ref country code: RS Free format text: LAPSE BECAUSE OF FAILURE TO SUBMIT A TRANSLATION OF THE DESCRIPTION OR TO PAY THE FEE WITHIN THE PRESCRIBED TIME-LIMIT Effective date: 20190116 Ref country code: BG Free format text: LAPSE BECAUSE OF FAILURE TO SUBMIT A TRANSLATION OF THE DESCRIPTION OR TO PAY THE FEE WITHIN THE PRESCRIBED TIME-LIMIT Effective date: 20190416 Ref country code: IS Free format text: LAPSE BECAUSE OF FAILURE TO SUBMIT A TRANSLATION OF THE DESCRIPTION OR TO PAY THE FEE WITHIN THE PRESCRIBED TIME-LIMIT Effective date: 20190516 Ref country code: LV Free format text: LAPSE BECAUSE OF FAILURE TO SUBMIT A TRANSLATION OF THE DESCRIPTION OR TO PAY THE FEE WITHIN THE PRESCRIBED TIME-LIMIT Effective date: 20190116 Ref country code: GR Free format text: LAPSE BECAUSE OF FAILURE TO SUBMIT A TRANSLATION OF THE DESCRIPTION OR TO PAY THE FEE WITHIN THE PRESCRIBED TIME-LIMIT Effective date: 20190417 Ref country code: HR Free format text: LAPSE BECAUSE OF FAILURE TO SUBMIT A TRANSLATION OF THE DESCRIPTION OR TO PAY THE FEE WITHIN THE PRESCRIBED TIME-LIMIT Effective date: 20190116 |
|
| REG | Reference to a national code |
Ref country code: DE Ref legal event code: R097 Ref document number: 602015023537 Country of ref document: DE |
|
| PG25 | Lapsed in a contracting state [announced via postgrant information from national office to epo] |
Ref country code: AT Free format text: LAPSE BECAUSE OF FAILURE TO SUBMIT A TRANSLATION OF THE DESCRIPTION OR TO PAY THE FEE WITHIN THE PRESCRIBED TIME-LIMIT Effective date: 20190116 Ref country code: DK Free format text: LAPSE BECAUSE OF FAILURE TO SUBMIT A TRANSLATION OF THE DESCRIPTION OR TO PAY THE FEE WITHIN THE PRESCRIBED TIME-LIMIT Effective date: 20190116 Ref country code: AL Free format text: LAPSE BECAUSE OF FAILURE TO SUBMIT A TRANSLATION OF THE DESCRIPTION OR TO PAY THE FEE WITHIN THE PRESCRIBED TIME-LIMIT Effective date: 20190116 Ref country code: SK Free format text: LAPSE BECAUSE OF FAILURE TO SUBMIT A TRANSLATION OF THE DESCRIPTION OR TO PAY THE FEE WITHIN THE PRESCRIBED TIME-LIMIT Effective date: 20190116 Ref country code: IT Free format text: LAPSE BECAUSE OF FAILURE TO SUBMIT A TRANSLATION OF THE DESCRIPTION OR TO PAY THE FEE WITHIN THE PRESCRIBED TIME-LIMIT Effective date: 20190116 Ref country code: EE Free format text: LAPSE BECAUSE OF FAILURE TO SUBMIT A TRANSLATION OF THE DESCRIPTION OR TO PAY THE FEE WITHIN THE PRESCRIBED TIME-LIMIT Effective date: 20190116 Ref country code: RO Free format text: LAPSE BECAUSE OF FAILURE TO SUBMIT A TRANSLATION OF THE DESCRIPTION OR TO PAY THE FEE WITHIN THE PRESCRIBED TIME-LIMIT Effective date: 20190116 Ref country code: CZ Free format text: LAPSE BECAUSE OF FAILURE TO SUBMIT A TRANSLATION OF THE DESCRIPTION OR TO PAY THE FEE WITHIN THE PRESCRIBED TIME-LIMIT Effective date: 20190116 |
|
| PLBE | No opposition filed within time limit |
Free format text: ORIGINAL CODE: 0009261 |
|
| STAA | Information on the status of an ep patent application or granted ep patent |
Free format text: STATUS: NO OPPOSITION FILED WITHIN TIME LIMIT |
|
| PG25 | Lapsed in a contracting state [announced via postgrant information from national office to epo] |
Ref country code: SM Free format text: LAPSE BECAUSE OF FAILURE TO SUBMIT A TRANSLATION OF THE DESCRIPTION OR TO PAY THE FEE WITHIN THE PRESCRIBED TIME-LIMIT Effective date: 20190116 |
|
| 26N | No opposition filed |
Effective date: 20191017 |
|
| PG25 | Lapsed in a contracting state [announced via postgrant information from national office to epo] |
Ref country code: SI Free format text: LAPSE BECAUSE OF FAILURE TO SUBMIT A TRANSLATION OF THE DESCRIPTION OR TO PAY THE FEE WITHIN THE PRESCRIBED TIME-LIMIT Effective date: 20190116 |
|
| PG25 | Lapsed in a contracting state [announced via postgrant information from national office to epo] |
Ref country code: TR Free format text: LAPSE BECAUSE OF FAILURE TO SUBMIT A TRANSLATION OF THE DESCRIPTION OR TO PAY THE FEE WITHIN THE PRESCRIBED TIME-LIMIT Effective date: 20190116 |
|
| PG25 | Lapsed in a contracting state [announced via postgrant information from national office to epo] |
Ref country code: MC Free format text: LAPSE BECAUSE OF FAILURE TO SUBMIT A TRANSLATION OF THE DESCRIPTION OR TO PAY THE FEE WITHIN THE PRESCRIBED TIME-LIMIT Effective date: 20190116 |
|
| REG | Reference to a national code |
Ref country code: CH Ref legal event code: PL |
|
| PG25 | Lapsed in a contracting state [announced via postgrant information from national office to epo] |
Ref country code: LI Free format text: LAPSE BECAUSE OF NON-PAYMENT OF DUE FEES Effective date: 20190930 Ref country code: CH Free format text: LAPSE BECAUSE OF NON-PAYMENT OF DUE FEES Effective date: 20190930 Ref country code: IE Free format text: LAPSE BECAUSE OF NON-PAYMENT OF DUE FEES Effective date: 20190930 Ref country code: LU Free format text: LAPSE BECAUSE OF NON-PAYMENT OF DUE FEES Effective date: 20190930 |
|
| REG | Reference to a national code |
Ref country code: BE Ref legal event code: MM Effective date: 20190930 |
|
| PG25 | Lapsed in a contracting state [announced via postgrant information from national office to epo] |
Ref country code: BE Free format text: LAPSE BECAUSE OF NON-PAYMENT OF DUE FEES Effective date: 20190930 |
|
| GBPC | Gb: european patent ceased through non-payment of renewal fee |
Effective date: 20190930 |
|
| PG25 | Lapsed in a contracting state [announced via postgrant information from national office to epo] |
Ref country code: FR Free format text: LAPSE BECAUSE OF NON-PAYMENT OF DUE FEES Effective date: 20190930 Ref country code: GB Free format text: LAPSE BECAUSE OF NON-PAYMENT OF DUE FEES Effective date: 20190930 |
|
| PG25 | Lapsed in a contracting state [announced via postgrant information from national office to epo] |
Ref country code: CY Free format text: LAPSE BECAUSE OF FAILURE TO SUBMIT A TRANSLATION OF THE DESCRIPTION OR TO PAY THE FEE WITHIN THE PRESCRIBED TIME-LIMIT Effective date: 20190116 |
|
| PG25 | Lapsed in a contracting state [announced via postgrant information from national office to epo] |
Ref country code: MT Free format text: LAPSE BECAUSE OF FAILURE TO SUBMIT A TRANSLATION OF THE DESCRIPTION OR TO PAY THE FEE WITHIN THE PRESCRIBED TIME-LIMIT Effective date: 20190116 Ref country code: HU Free format text: LAPSE BECAUSE OF FAILURE TO SUBMIT A TRANSLATION OF THE DESCRIPTION OR TO PAY THE FEE WITHIN THE PRESCRIBED TIME-LIMIT; INVALID AB INITIO Effective date: 20150930 |
|
| PG25 | Lapsed in a contracting state [announced via postgrant information from national office to epo] |
Ref country code: MK Free format text: LAPSE BECAUSE OF FAILURE TO SUBMIT A TRANSLATION OF THE DESCRIPTION OR TO PAY THE FEE WITHIN THE PRESCRIBED TIME-LIMIT Effective date: 20190116 |
|
| PGFP | Annual fee paid to national office [announced via postgrant information from national office to epo] |
Ref country code: DE Payment date: 20250805 Year of fee payment: 11 |