EP2932267B1 - Recognition of cellular target binding by a bioactive agent using intracellular bioluminescence resonance energy transfer - Google Patents
Recognition of cellular target binding by a bioactive agent using intracellular bioluminescence resonance energy transfer Download PDFInfo
- Publication number
- EP2932267B1 EP2932267B1 EP13861977.0A EP13861977A EP2932267B1 EP 2932267 B1 EP2932267 B1 EP 2932267B1 EP 13861977 A EP13861977 A EP 13861977A EP 2932267 B1 EP2932267 B1 EP 2932267B1
- Authority
- EP
- European Patent Office
- Prior art keywords
- bioactive agent
- bret
- examples
- nanoluc
- binding
- Prior art date
- Legal status (The legal status is an assumption and is not a legal conclusion. Google has not performed a legal analysis and makes no representation as to the accuracy of the status listed.)
- Active
Links
- FBMMJGMMRSAFIV-UHFFFAOYSA-O CN(C)C(CC1O2)=CC=C1C(c(cc(cc1)C(NCc(cc3)ccc3NC(CCCCCCC(NO)=O)=O)=O)c1C(O)=O)=C(C=C1)C2=CC1=[N+](C)C Chemical compound CN(C)C(CC1O2)=CC=C1C(c(cc(cc1)C(NCc(cc3)ccc3NC(CCCCCCC(NO)=O)=O)=O)c1C(O)=O)=C(C=C1)C2=CC1=[N+](C)C FBMMJGMMRSAFIV-UHFFFAOYSA-O 0.000 description 1
Images


Classifications
-
- G—PHYSICS
- G01—MEASURING; TESTING
- G01N—INVESTIGATING OR ANALYSING MATERIALS BY DETERMINING THEIR CHEMICAL OR PHYSICAL PROPERTIES
- G01N33/00—Investigating or analysing materials by specific methods not covered by groups G01N1/00 - G01N31/00
- G01N33/48—Biological material, e.g. blood, urine; Haemocytometers
- G01N33/50—Chemical analysis of biological material, e.g. blood, urine; Testing involving biospecific ligand binding methods; Immunological testing
- G01N33/58—Chemical analysis of biological material, e.g. blood, urine; Testing involving biospecific ligand binding methods; Immunological testing involving labelled substances
- G01N33/582—Chemical analysis of biological material, e.g. blood, urine; Testing involving biospecific ligand binding methods; Immunological testing involving labelled substances with fluorescent label
-
- C—CHEMISTRY; METALLURGY
- C12—BIOCHEMISTRY; BEER; SPIRITS; WINE; VINEGAR; MICROBIOLOGY; ENZYMOLOGY; MUTATION OR GENETIC ENGINEERING
- C12N—MICROORGANISMS OR ENZYMES; COMPOSITIONS THEREOF; PROPAGATING, PRESERVING, OR MAINTAINING MICROORGANISMS; MUTATION OR GENETIC ENGINEERING; CULTURE MEDIA
- C12N15/00—Mutation or genetic engineering; DNA or RNA concerning genetic engineering, vectors, e.g. plasmids, or their isolation, preparation or purification; Use of hosts therefor
- C12N15/09—Recombinant DNA-technology
- C12N15/11—DNA or RNA fragments; Modified forms thereof; Non-coding nucleic acids having a biological activity
- C12N15/62—DNA sequences coding for fusion proteins
-
- C—CHEMISTRY; METALLURGY
- C12—BIOCHEMISTRY; BEER; SPIRITS; WINE; VINEGAR; MICROBIOLOGY; ENZYMOLOGY; MUTATION OR GENETIC ENGINEERING
- C12N—MICROORGANISMS OR ENZYMES; COMPOSITIONS THEREOF; PROPAGATING, PRESERVING, OR MAINTAINING MICROORGANISMS; MUTATION OR GENETIC ENGINEERING; CULTURE MEDIA
- C12N5/00—Undifferentiated human, animal or plant cells, e.g. cell lines; Tissues; Cultivation or maintenance thereof; Culture media therefor
- C12N5/10—Cells modified by introduction of foreign genetic material
-
- C—CHEMISTRY; METALLURGY
- C12—BIOCHEMISTRY; BEER; SPIRITS; WINE; VINEGAR; MICROBIOLOGY; ENZYMOLOGY; MUTATION OR GENETIC ENGINEERING
- C12Q—MEASURING OR TESTING PROCESSES INVOLVING ENZYMES, NUCLEIC ACIDS OR MICROORGANISMS; COMPOSITIONS OR TEST PAPERS THEREFOR; PROCESSES OF PREPARING SUCH COMPOSITIONS; CONDITION-RESPONSIVE CONTROL IN MICROBIOLOGICAL OR ENZYMOLOGICAL PROCESSES
- C12Q1/00—Measuring or testing processes involving enzymes, nucleic acids or microorganisms; Compositions therefor; Processes of preparing such compositions
- C12Q1/66—Measuring or testing processes involving enzymes, nucleic acids or microorganisms; Compositions therefor; Processes of preparing such compositions involving luciferase
-
- C—CHEMISTRY; METALLURGY
- C40—COMBINATORIAL TECHNOLOGY
- C40B—COMBINATORIAL CHEMISTRY; LIBRARIES, e.g. CHEMICAL LIBRARIES
- C40B40/00—Libraries per se, e.g. arrays, mixtures
- C40B40/04—Libraries containing only organic compounds
-
- C—CHEMISTRY; METALLURGY
- C40—COMBINATORIAL TECHNOLOGY
- C40B—COMBINATORIAL CHEMISTRY; LIBRARIES, e.g. CHEMICAL LIBRARIES
- C40B40/00—Libraries per se, e.g. arrays, mixtures
- C40B40/04—Libraries containing only organic compounds
- C40B40/10—Libraries containing peptides or polypeptides, or derivatives thereof
-
- G—PHYSICS
- G01—MEASURING; TESTING
- G01N—INVESTIGATING OR ANALYSING MATERIALS BY DETERMINING THEIR CHEMICAL OR PHYSICAL PROPERTIES
- G01N21/00—Investigating or analysing materials by the use of optical means, i.e. using sub-millimetre waves, infrared, visible or ultraviolet light
- G01N21/62—Systems in which the material investigated is excited whereby it emits light or causes a change in wavelength of the incident light
- G01N21/63—Systems in which the material investigated is excited whereby it emits light or causes a change in wavelength of the incident light optically excited
- G01N21/64—Fluorescence; Phosphorescence
- G01N21/6486—Measuring fluorescence of biological material, e.g. DNA, RNA, cells
-
- G—PHYSICS
- G01—MEASURING; TESTING
- G01N—INVESTIGATING OR ANALYSING MATERIALS BY DETERMINING THEIR CHEMICAL OR PHYSICAL PROPERTIES
- G01N33/00—Investigating or analysing materials by specific methods not covered by groups G01N1/00 - G01N31/00
- G01N33/48—Biological material, e.g. blood, urine; Haemocytometers
- G01N33/50—Chemical analysis of biological material, e.g. blood, urine; Testing involving biospecific ligand binding methods; Immunological testing
- G01N33/5005—Chemical analysis of biological material, e.g. blood, urine; Testing involving biospecific ligand binding methods; Immunological testing involving human or animal cells
- G01N33/5008—Chemical analysis of biological material, e.g. blood, urine; Testing involving biospecific ligand binding methods; Immunological testing involving human or animal cells for testing or evaluating the effect of chemical or biological compounds, e.g. drugs, cosmetics
- G01N33/502—Chemical analysis of biological material, e.g. blood, urine; Testing involving biospecific ligand binding methods; Immunological testing involving human or animal cells for testing or evaluating the effect of chemical or biological compounds, e.g. drugs, cosmetics for testing non-proliferative effects
-
- G—PHYSICS
- G01—MEASURING; TESTING
- G01N—INVESTIGATING OR ANALYSING MATERIALS BY DETERMINING THEIR CHEMICAL OR PHYSICAL PROPERTIES
- G01N33/00—Investigating or analysing materials by specific methods not covered by groups G01N1/00 - G01N31/00
- G01N33/48—Biological material, e.g. blood, urine; Haemocytometers
- G01N33/50—Chemical analysis of biological material, e.g. blood, urine; Testing involving biospecific ligand binding methods; Immunological testing
- G01N33/53—Immunoassay; Biospecific binding assay; Materials therefor
- G01N33/536—Immunoassay; Biospecific binding assay; Materials therefor with immune complex formed in liquid phase
- G01N33/542—Immunoassay; Biospecific binding assay; Materials therefor with immune complex formed in liquid phase with steric inhibition or signal modification, e.g. fluorescent quenching
-
- C—CHEMISTRY; METALLURGY
- C07—ORGANIC CHEMISTRY
- C07K—PEPTIDES
- C07K2319/00—Fusion polypeptide
- C07K2319/60—Fusion polypeptide containing spectroscopic/fluorescent detection, e.g. green fluorescent protein [GFP]
Definitions
- the present invention provides compositions and methods for detection and analysis of intracellular binding of a bioactive agent to a cellular target.
- bioactive agents tethered to fluorophores cellular targets fused to bioluminescent reporters, or portions, components, or subunits of bioluminescent reporters, and methods of detecting and analyzing the interaction of bioactive agents with cellular targets therewith.
- Phenotypic-based screening with a small molecule library plays an important role in the drug discovery field.
- compound libraries without prior knowledge of their underlying cellular targets, are screened for their ability to elicit a phenotypic response, e.g., mitigate disease symptoms. While this approach can be used to identify bioactive agents, e.g., small molecules, that are able to modulate cellular physiology, determining the biological relevant targets of these small molecule hits is a major technical challenge.
- small molecules promoting some desirable phenotypic responses may pose in vivo liabilities due to off-target interactions. In order to predict drug selectivity and minimize potential side effects, it is important to also identify off-target interactions (e.g., lower affinity).
- Contributing factors to this failures include: compounds binding multiple targets with low to moderate affinity with these relative weak interactions difficult to detect; lack of robust, straightforward, unbiased technologies to characterize the detected interactions; inability to perform target isolation within the native cellular environment upon which interactions may depend; limited information provided about the binding potency of targets in the cell; and high background of false positive interactions due to non-specific binding to the solid support or functionalized small molecule.
- WO 2004/034054 A2 discloses an improved BRET assay, wherein the BRET signal is enhanced and/or prolonged.
- the improved BRET assay comprises the steps of i) adding a substrate to a cell comprising GPCR-Rluc fusion protein and a beta -arrestin-GFP fusion protein, wherein the (beta-arrestin is mutated, ii) adding a ligand to obtain, if possible, a GPCR-Rluc/(beta-arrestin-GFP complex, and iii) measuring a BRET signal to obtain a BRET ratio, wherein the improvement leads to an increased BRET ratio compared with the ratios obtained by use of the same process employing a beta-arrestin-GFP fusion protein wherein the beta-arrestin is the wild type beta-arrestin, or employing a 13-arrestin-GFP fusion protein, wherein the (beta-arrestin is a beta-arrestin specifically mutated so that it
- WO 2006/086883 A1 relates to novel biosensors that are based on bioluminescence resonance energy transfer (BRET). These biosensors may be used to monitor rapid interaction and conformational changes within G protein-coupled receptor/G protein complexes and, in this way, reflect the activation status of the receptor.
- the biosensors may be used as a highly sensitive and quantitative assay for the identification of ligands (agonists, antagonists, inverse agonists, partial agonists, etc.) targeting G protein-coupled receptors (GPCRs) as well as for the analysis of the activation status of these receptors.
- GPCRs G protein-coupled receptors
- multiplexing different biosensors within receptors/G protein complexes allows for mapping ligand textures.
- the biosensors permit the direct, real-time examination of interactions between receptors and G protein in their natural environment, the living cell.
- WO 2013/078244 A1 provides novel fluorescent dyes and kits containing the same, which are useful for labeling a wide variety of biomolecules, cells and microorganisms, and also provides various methods of using the fluorescent dyes for research and development, forensic identification, environmental studies, diagnosis, prognosis and/or treatment of disease conditions.
- US 2006/211045 A1 provides a library comprising a plurality of tagged non-peptide ligands of formula I (LigJ L ) m L(J T Tag) m (J T L(J L Lig) m ) p including and salts thereof comprising one or a plurality of same or different ligand moieties Lig each linked to a one or a plurality of same or different tag moieties Tag via same or different linker moieties L and same or different linking site or linking functionality JT and JL wherein Lig comprises a GPCR ligand, an inhibitor of an intracellular enzyme or a substrate or inhibitor of a drug transporter; L is a single bond or is any linking moiety selected from a heteroatom such as N, O, S, P, branched or straight chain saturated or unsaturated, optionally heteroatom containing, C1-600 hydrocarbyl and combinations thereof, which may be monomeric, oligomeric having oligomeric repeat of 2 to 30 or polymeric having polymeric repeat in excess
- the present disclosure provides BRET assay systems comprising: (a) a bioactive agent tethered to a chromophore (e.g., fluorophore); (b) a cellular target fused to a bioluminescent reporter; and (c) a substrate for the bioluminescent reporter.
- the bioactive agent is a small molecule.
- the bioactive agent is an inhibitor of protein function, e.g., an enzyme inhibitor or a receptor inhibitor.
- the chromophore is a fluorophore.
- the fluorophore is a carboxy rhodamine analog.
- the bioluminescent reporter comprises a polypeptide with at least 70% sequence identity (e.g., 75% identity... 80% identity... 85% identity... 90% identity, 95% identity... 98% identity... 99% identity) with SEQ ID NO: 1.
- (b) is a cellular target fused to a portion, or subunit, or component of a bioluminescent reporter.
- (b) is a cellular target fused to a polypeptide that requires interaction with another polypeptide to produce luminescence.
- (a) and (b) are within a cell.
- (b) is expressed intracellularly as a fusion protein with a protein of interest, e.g., cellular target.
- the cellular target is composed of more than one component, subunit or polypeptide, e.g., the cellular target is a protein complex.
- the bioluminescent reporter is composed of more than one component, subunit or polypeptide, e.g., the bioluminescent reporter is a protein complex.
- (a) is added extracellularly and enters the cell. In some examples, (a) is present both within a cell and in the medium surrounding the cell. In some examples, (a) is present both bound to a cell and in the medium surrounding the cell.
- the amount of (a) present in the surrounding medium is significantly greater than the amount in the cell or bound to the cell, e.g., greater by at least 2 fold, at least 5 fold, 10 fold, 30 fold, or 100 fold.
- the cellular target is a binding partner of the bioactive agent.
- the emission spectrum of the bioluminescent reporter overlaps with the absorption spectrum of a fluorophore.
- conversion of the substrate to a reaction product by the bioluminescent reporter results in excitation of a fluorophore by BRET and light emission from a fluorophore.
- (a) is one of a library of agents or compounds tethered to a chromophore. In some embodiments, (a) is one of a library of agents or compounds tethered to fluorophores. In some embodiments, (b) is one of a plurality of potential cellular targets fused to a bioluminescent reporter. In some examples, (b) is a library of cells expressing one of a plurality of potential cellular targets fused to a bioluminescent reporter.
- the present invention provides methods of detecting, analyzing, characterizing, etc. the binding of a bioactive agent to a cellular target.
- the cellular target may be the primary drug target.
- the cellular target is an off-target liability that may cause undesirable side effects in vivo.
- binding by the bioactive agent to the cellular target may have no discernible biological effect.
- the present disclosure provides cells comprising one or more of (e.g., each of) (a) a bioactive agent tethered to a chromophore (e.g., fluorophore); (b) a cellular target fused to a bioluminescent reporter; and (c) a substrate for the bioluminescent reporter.
- the binding of a bioactive agent to a cellular target is non-covalent.
- the chromophore is a fluorophore.
- the present invention provides methods for detection of an interaction between a bioactive agent and a cellular target comprising: (a) expressing in a cell a fusion of said cellular target and a bioluminescent reporter that emits energy at a first wavelength (e.g., range of wavelengths, spectral distribution, etc.); (b) contacting said cell with said bioactive agent tethered to a fluorophore, wherein said fluorophore accepts energy at said first wavelength and emits energy at a second wavelength (e.g., range of wavelengths, spectral distribution, etc.); (c) contacting said cell with a substrate for said bioluminescent reporter; (d) detecting energy at said second wavelength, wherein the presence of said energy at said second wavelength indicates the interaction of said bioactive agent with said cellular target.
- a first wavelength e.g.
- the present disclosure also provides methods for detection of an interaction between a bioactive agent and a cellular target comprising: (a) providing a fusion of said cellular target and a bioluminescent reporter; (b) contacting said fusion with said bioactive agent tethered to a chromophore (e.g., fluorophore); (c) contacting said fusion with a substrate for said reporter; (d) detecting a change in the spectral distribution of emitted light relative to said fusion contacted with said substrate in the absence of said chromophore.
- a chromophore e.g., fluorophore
- the present disclosure provides a method for detection of an interaction of a second bioactive agent and a cellular target comprising: (a) providing a fusion of said cellular target and a bioluminescent reporter; (b) contacting said fusion with both a first bioactive agent tethered to a chromophore (e.g., fluorophore) and with said second bioactive agent; (c) contacting said fusion with a substrate for said reporter; (d) detecting a change in the spectral distribution of emitted light relative to said fusion contacted with said first bioactive agent and said substrate in the absence of said second bioactive agent.
- a chromophore e.g., fluorophore
- the change in spectral distribution of emitted light is caused by displacement of said first bioactive agent by said second bioactive agent. In some examples, said displacement is competitive displacement. In some examples, the change in spectral distribution of emitted light is used to estimate binding affinity of the bioactive agent to cellular target. In some examples, said second bioactive agent is one of a plurality of bioactive agents. In some examples, the change in spectral distribution of emitted light is used to estimate the relative binding affinity of a plurality of bioactive agents to a cellular target. In some examples, said first and said second bioactive agents are synthetic molecules. In some examples, said cellular targets are in living cells, permeabilized cells or cell lysates.
- the change in the spectral distribution of emitted light is determined by measuring the ratio of light intensity at two different wavelengths, or two different ranges of wavelengths. In some examples, the change in spectral distribution over time is detected. In some examples, the chromophore is a fluorophore.
- a BRET assay system comprising: (a) a bioactive agent tethered to a fluorophore; (b) a first interaction partner fused to a structurally complementary peptide of a bioluminescent reporter; (c) a second interaction partner fused to a structurally complementary polypeptide of a bioluminescent reporter; and (d) a substrate for the bioluminescent reporter, wherein the first and second interaction partners interact to form an interaction complex, and wherein the first interaction partner, second interaction partner, and/or interaction complex are binding partners for the bioactive agent.
- the first interaction partner and the second interaction partner are proteins or polypeptides that interact to form a protein complex.
- the first interaction partner and the second interaction partner are brought together by the interaction of the structurally complementary polypeptides.
- the structurally complementary polypeptides are brought together by the interaction of first interaction partner and the second interaction partner.
- the interaction of the first interaction partner and the second interaction partner is determined by an increase in luminescence.
- the first and second interaction partners form the interaction complex in the presence or absence of the bioactive agent.
- the interaction complex is a binding partner for the bioactive agent, but neither the first or second interaction partners alone are binding partners for the bioactive agent.
- one of the interaction partners, but not the other is a binding partner for the bioactive agent.
- interaction complex formation requires binding of the bioactive agent to an interaction partner.
- interaction complex formation is independent of binding of the bioactive agent.
- BRET assay systems comprising: (a) a bioactive agent tethered to a fluorophore; (b) a cellular target fused to a structurally complementary peptide of a bioluminescent reporter; (c) a structurally complementary polypeptide of a bioluminescent reporter; and (d) a substrate for the bioluminescent reporter.
- the complementary peptide and polypeptide of the bioluminescent reporter associate to form active bioluminescent reporter enzyme.
- conversion of the substrate to a reaction product by the bioluminescent reporter enzyme results in excitation of the fluorophore by BRET and fluorescence emission from the fluorophore.
- an assay system comprising: (a) a bioactive agent tethered to a fluorophore; (b) a first binding partner fused to a complementary peptide of a bioluminescent reporter; (c) a second binding partner fused to a complementary polypeptide of a bioluminescent reporter; and (c) a substrate for the bioluminescent reporter.
- the complementary peptide and polypeptide of the bioluminescent reporter associate to form active bioluminescent reporter enzyme.
- the bioactive agent when the first and second binding partners interact, the bioactive agent binds to the interacting partners and association of the complementary peptide and polypeptide occurs, conversion of the substrate to a reaction product by the bioluminescent reporter enzyme results in excitation of the fluorophore by BRET and fluorescence emission from the fluorophore.
- the bioactive agent is tethered to a fluorescence or luminescence quencher (e.g., Dabcyl).
- a fluorescence or luminescence quencher e.g., Dabcyl
- titration of the untethered bioactive agent produces a gain in signal.
- imaging e.g., BRET imaging, via charge couple device camera, etc.
- imaging e.g., BRET imaging, via charge couple device camera, etc.
- location e.g., intracellular, extracellular, etc.
- BRET signals resulting from the presence and/or interactions of system components (e.g., bioactive agent, cellular target, etc.).
- systems and methods described herein are useful for the measurement of intracellular selectivity and affinity of a bioactive agent against a panel of putative cellular targets.
- the effect on BRET is monitored as the bioactive agent/cellular target complex is competitively disrupted.
- affinities are inferred by the IC50 value generated via competitive disruption.
- the affinities of inhibitors to individual domains of a cellular target are determined via genetic fusion of a bioluminescent reporter to a segregated domain of the cellular target.
- the present invention provides compositions and methods for detection and analysis of intracellular binding of a bioactive agent to a cellular target.
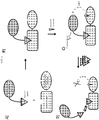
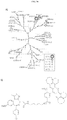
- a bioactive agent tethered to a chromophore, e.g., fluorophores, potential cellular targets fused to bioluminescent reporter proteins and methods of detecting and analyzing the interaction of bioactive agents with cellular targets therewith (See Figure 1 ).
- the interaction of a first entity (e.g., bioactive agent) and a second entity (e.g., cellular target) is detected, characterized, quantified, analyzed, etc. through the detection/measurement of a signal produced by signal transfer (e.g., transfer of energy (e.g., fluorescence, light energy, resonance, by BRET, etc.)) between a third entity (e.g., fluorophore) connected, fused, tethered, linked, etc. to the first entity and a fourth entity (e.g., bioluminescent reporter protein) connected, fused, tethered, linked, etc. to the second entity.
- signal transfer e.g., transfer of energy (e.g., fluorescence, light energy, resonance, by BRET, etc.)
- a third entity e.g., fluorophore
- a fourth entity e.g., bioluminescent reporter protein
- the interaction and/or binding of the first and second entities bring the third and fourth entities into close enough proximity to allow signal transfer (e.g., energy transfer) from one to another.
- the fourth entity e.g., bioluminescent reporter protein
- the third entity e.g., fluorophore
- the third entity e.g., fluorophore
- detection of the energy emitted from the third entity e.g., light at the emission maximum of the third entity
- the fourth entity e.g., bioluminescent reporter
- the duration, kinetics, affinity, strength, and/or specificity, of the binding of the first and second entities is detected, measured, quantified, determined, interrogated, etc. based on measurement of the signal output of the fourth entity (e.g., bioluminescent reporter protein) under various conditions.
- a cellular target fused to a bioluminescent reporter protein and a bioactive agent tethered to a chromophore, e.g., fluorophore, are provided (e.g., intracellularly, extracellularly, in lysate, in vitro, etc.).
- a bioactive agent tethered to a chromophore e.g., fluorophore
- Substrate for the bioluminescent reporter protein is added to the system.
- the bioluminescent reporter protein and chromophore e.g., fluorophore
- the bioluminescent reporter protein and chromophore are brought into close enough proximity for BRET to occur, and a detectable signal to be emitted from the chromophore (e.g., fluorophore).
- a complementary peptide and polypeptide that can interact are used.
- a complementary peptide is fused to a first interaction partner and a complementary polypeptide is fused to a second interaction partner.
- the first and second interaction partners form a complex (e.g., by binding to each other).
- the first and second interaction partners form an interaction complex when one or both interacts with a bioactive agent.
- the first and second interaction partners form an interaction complex in the presence or absence of a bioactive agent.
- formation of the interaction complex brings the complementary peptide and polypeptide together to form the bioluminescent reporter.
- formation of the bioluminescent reporter allows detection of formation of the interaction complex.
- a fluorophore is tethered to the bioactive agent.
- energy is transferred from the bioluminescent reporter to the fluorophore when the interaction complex is formed and the bioactive agent is bound to one of the interaction partners or the interaction complex.
- the fluorophore allows detection or measurement of the interaction of the first and second interaction partners.
- the fluorophore allows detection or measurement of the binding of the bioactive agent to its binding partner (e.g., the first interaction partner, the second interaction partner, and/or the interaction complex).
- a complementary peptide of a bioluminescent reporter is fused to a target of interest.
- a complementary polypeptide and a bioactive agent tethered to a fluorophore are provided to detect or measure the interaction of the bioactive agent to the target of interest.
- the complementary peptide of a bioluminescent reporter is fused to a target of interest, a complementary polypeptide of the bioluminescent reporter protein and a bioactive agent tethered to a fluorophore is applied to detecting proximity of the fluorescently labeled ligand, e.g., a bioactive agent, to protein complexes (e.g.
- the cellular target and bioluminescent reporter fusion is expressed in cells in which an assay is to be performed. In some examples, the fusion is expressed at or near the native abundance for the cellular target.
- the fluorophore-tethered bioactive agent is added extracellularly (e.g., added to the culture medium) and enters the cell via diffusion, active transport, passive transport, endocytosis, or any suitable mechanism. In some examples, varying amount of fluorophore-tethered bioactive agent is added to the cells to assay binding kinetics, assay binding affinity, provide sufficient signal, etc.
- the present invention provides compositions, methods, and systems for detection of intracellular interactions between a bioactive agent and cellular target (e.g., known or unknown).
- a fusion of a bioluminescent reporter and a cellular target are expressed within a cell.
- the bioactive agent, tethered to a fluorophore is introduced to the cell (e.g., conjugate of fluorophore and bioactive agent is cell permeable, the cell is permeablized, etc.).
- a substrate for the bioluminescent reporter protein is added to the cell prior, concurrently or subsequent to the addition of the bioactive agent.
- Detection of a fluorescent signal from the fluorophore indicates an intracellular interaction (e.g., binding) between the bioactive agent and cellular target.
- a cellular target fused to a bioluminescent reporter is expressed at a natural cellular abundance (e.g., relative to the native cellular target, or at a level appropriate for proper biological function of the fused target).
- interaction of a bioactive agent with a cellular target is detected intracellularly.
- characteristics of the interaction between the bioactive agent and cellular target are interrogated by altering the cellular conditions or the conditions of the system.
- a competitive binder of the cellular target e.g., untethered bioactive agent
- a library of bioluminescent reporter protein-tagged cellular targets is provided (e.g., in solution, in a lysate, immobilized on a surface, expressed within a cell, etc.).
- a bioactive agent is provided which lacks a known cellular target or where knowledge of the cellular target is uncertain or incomplete. The cellular target of a bioactive agent is determined by adding the bioactive agent to the library and determining which cellular-target fusion produces BRET induced fluorescence of the bioactive agent-tethered fluorophore.
- the library of bioluminescent reporter-tagged cellular targets is provided as a collection of nucleic acids or vectors comprising nucleic acids (e.g., plasmids, BacMam viruses, Lentiviruses, etc.) encoding the protein fusions.
- bioluminescent reporter protein-tagged cellular targets are expressed within cells.
- the library of bioluminescent reporter-tagged cellular targets is provided by translating nucleic acids in cell-free translation reactions.
- a library of cellular target fusions, or cells expressing cellular target fusions are provided in a microplate format.
- bioactive agent e.g., one identified through a phenotypic assay or screen
- the entire library of cellular targets can be interrogated (e.g., in solution, in lysates, intracellularly, etc.) in a high-throughput manner.
- bioluminescent reporter-tagged cellular targets are immobilized on a solid surface to create a protein array.
- cellular targets are also expressed as fusions with a tag or coupled to a protein (e.g., HALOTAG, Promega) that allows for the proteins to be covalently immobilized on a solid surface (e.g., a surface displaying appropriate ligands (e.g., HALOTAG Ligand)).
- a library of potential bioactive agents e.g., hit compounds or drug-like small molecules
- the system e.g., array
- any pairs capable of producing BRET are identified.
- cellular targets for all or a portion of a library of bioactive agents are unknown.
- compositions, methods, and systems herein provide a conjugate of a bioactive agent and an energy acceptor (e.g., fluorophore, chromophore).
- a bioactive agent is any small molecule (e.g., > 2000 daltons, >1000 daltons, >500 daltons, etc.), macromolecule, synthetic molecule or molecular complex capable of interacting with the biology of a cell.
- an energy acceptor is an entity capable of generating, exhibiting, and/or emitting a signal (e.g., light, heat, chemical reaction, fluorescence, resonance energy, etc.) when triggered by energy absorption (e.g., resonance energy transfer).
- a bioactive agent and energy acceptor e.g., fluorophore, chromophore
- any suitable structure or mechanism e.g., expressed as a fusion construct (e.g., with or without peptide linker), chemically linked (e.g., directly or indirectly), enzymatically linked, linked by a linker (e.g., peptide, nucleic acid, polymer, ester linkage, PEG linker, carbon chain, etc.)).
- the conjugate of a bioactive agent and an energy acceptor is produced by non-natural chemical synthesis (e.g., a purposeful execution of chemical reactions not present in natural cells).
- the type of linkage should not be viewed as limiting.
- bioactive agent refers generally to any physiologically or pharmacologically active substance or a substance suitable for detection.
- a bioactive agent is a potential therapeutic compound (e.g., small molecule, peptide, nucleic acid, etc.), or drug-like molecule.
- the bioactive agent is produced by non-natural chemical synthesis (e.g., a purposeful execution of chemical reactions not present in natural cells). Bioactive agents for use in embodiments described herein are not limited by size or structure.
- libraries of bioactive agents are provided.
- systems, methods, and compositions are provided for screening libraries of bioactive agents.
- means of identifying the bioactive agent in a library responsible for producing, eliciting, inducing, etc. phenotypic effect and/or activity are also disclosed herein.
- means of identifying the cellular target of a bioactive agent e.g., a bioactive agent responsible for the phenotypic effect and/or activity).
- an energy acceptor refers to any small molecule (e.g., chromophore), macromolecule (e.g., autofluorescent protein, phycobiliproteins, nanoparticle, surface, etc.), or molecular complex that produces a readily detectable signal in response to energy absorption (e.g., resonance energy transfer).
- an energy acceptor is a fluorophore or other detectable chromophore.
- Suitable fluorophores include, but are not limited to: xanthene derivatives (e.g., fluorescein, rhodamine, Oregon green, eosin, Texas red, etc.), cyanine derivatives (e.g., cyanine, indocarbocyanine, oxacarbocyanine, thiacarbocyanine, merocyanine, etc.), naphthalene derivatives (e.g., dansyl and prodan derivatives), oxadiazole derivatives (e.g., pyridyloxazole, nitrobenzoxadiazole, benzoxadiazole, etc.), pyrene derivatives (e.g., cascade blue), oxazine derivatives (e.g., Nile red, Nile blue, cresyl violet, oxazine 170, etc.), acridine derivatives (e.g., proflavin, acridine orange, acrid
- a fluorophore is a rhodamine analog (e.g., carboxy rhodamine analog), such as those described in WO2013/078244 .
- rhodamine analog e.g., carboxy rhodamine analog
- Some such fluorophores are described herein in Example 8.
- BRET efficiency is significantly enhanced by the technical features of rhodamine analog (e.g., carboxy rhodamine analog) as an energy acceptor compared to other fluorophores.
- the left shifted EC50 and reduced nonspecific background of these dyes is advantageous for use in some embodiments.
- TOM and “NonChloroTOM” (or “NCT”) refer to the same type of fluorophore and are used interchangeably throughout the application.
- compositions, methods, and systems herein provide a fusion of a cellular target and a bioluminescent reporter protein (e.g., luciferase).
- a cellular target and bioluminescent reporter protein are fused, tethered, connected, etc. by any suitable structure or mechanism (e.g., expressed as a fusion construct (e.g., with or without peptide linker), chemically linked (e.g., through covalent or non-covalent bonds), enzymatically linked, linked by a linker (e.g., peptide, nucleic acid, other polymer (e.g., ester linkage, PEG linker, carbon chain, etc.)).
- a linker e.g., peptide, nucleic acid, other polymer (e.g., ester linkage, PEG linker, carbon chain, etc.
- an amino acid chain (e.g., 3-100 amino acids) is used to connect the cellular target and a bioluminescent reporter protein.
- the structure and/or function of neither the cellular target nor the bioluminescent reporter are impacted (e.g., significantly impacted) by fusion or the presence of the linker.
- a linker allows fusion without loss of activity or one or both of the elements.
- an amino acid linker properly spaces and/or orients the bioluminescent reported for energy transfer with the fluorophore.
- a cellular target comprises any suitable binding/interaction partner (e.g., receptor, enzyme, protein complex) for a bioactive agent (e.g., small molecule, protein, nucleic acid, lipid, etc.).
- a bioactive agent e.g., small molecule, protein, nucleic acid, lipid, etc.
- a cellular target is a protein or protein complex that binds to or otherwise interacts with (e.g., has a binding affinity to) a bioactive agent.
- a cellular target is a receptor protein or an enzyme that binds to or otherwise interacts with (e.g., has a binding affinity to) a small molecule bioactive agent.
- cellular targets may include nucleic acids (e.g., DNA or RNA), polysaccaharides or a complex comprising any of these with polypeptides.
- a cellular target is a G-protein coupled receptor or a protein kinase.
- the bioluminescent reporter is a luciferase.
- a luciferase is selected from those found in Gaussia, Coleoptera, (e.g., fireflies), Renilla, Vargula, Oplophorus, Aequoria, mutants thereof, portions thereof, variants thereof, and any other luciferase enzymes suitable for the systems and methods described herein.
- the bioluminescent reporter protein is a modified, enhanced luciferase enzyme from Oplophorus (e.g., NANOLUC enzyme from Promega Corporation, SEQ ID NO: 1, or a sequence with at least 70% identity (e.g., >70%, >80%, >90%, >95%) thereto).
- Oplophorus e.g., NANOLUC enzyme from Promega Corporation, SEQ ID NO: 1, or a sequence with at least 70% identity (e.g., >70%, >80%, >90%, >95%) thereto).
- the bioluminescent reporter protein is a thermostable Photuris pennsylvanica luciferase or a sequence with at least 70% identity (e.g., >70%, >80%, >90%, >95%) thereto).
- Exemplary bioluminescent reporters are described, for example, in U.S. Pat. App. No. 2010/0281552 and U.S. Pat. App. No. 2012/0174242
- the bioluminescent reporter protein comprises NANOLUC (See U.S. Pat. App. Nos. 2010/0281552 and 2012/0174242 ).
- the bioluminescent reporter protein comprises a polypeptide with at least 70% identity (e.g., >70%, >80%, >90%, >95%) to SEQ ID NO: 1 that retains bioluminescent characteristics.
- the use of the NANOLUC enzyme, or a variant thereof provides features (e.g., signal intensity, brightness, high light output, narrow spectrum, etc.) that enable the use of the BRET assays described herein.
- the high light output of NANOLUC enables the low concentration (e.g., ⁇ 1 ⁇ M, ⁇ 100 nM, ⁇ 10 nm, ⁇ 1 nm, etc.) of assay components, e.g., DNA encoding NANOLUC, useful to carry out assays under physiologically relevant conditions.
- NANOLUC enables the use of BRET in characterizing cellular targets identified in a phenotypic screen.
- a substrate for the bioluminescent reporter protein converts the substrate into a reaction product and releases light energy as a by-product.
- the substrate is a substrate for a luciferase enzyme.
- the substrate is a structural variant or derivative of coelenterazine (e.g., furimazine).
- the substrate is a substrate for a modified, enhanced luciferase enzyme from Oplophorus, e.g., NANOLUC enzyme from Promega Corporation (e.g., SEQ ID NO: 1).
- a pro-substrate for the bioluminescent reporter protein which produces a substrate through a chemical or physical process (e.g., hydrolysis, enzymatic reaction, photo-cleavage, etc.).
- the pro-substrate comprises coelenterazine, a coelenterazine derivative, a structural or functional equivalent of coelenterazine, a molecule substantially equivalent to coelenterazine (e.g., structurally and/or functionally), or molecule functionally or structurally similar to coelenterazine.
- the bioluminescent reporter protein converts the coelenterazine, coelenterazine derivative, structural or functional equivalent of coelenterazine, or substantial equivalent to coelenterazine into coelenteramide, a coelenteramide derivative, a structural or functional equivalent of coelenteramide, or a substantial equivalent to coelenteramide and releases light energy as a by-product.
- fluorophore and bioluminescent reporter are selected that exhibit sufficient overlap of emission (e.g., of bioluminescent reporter) and excitation (e.g., of fluorophore) spectra to provide efficient energy transfer between the two (e.g., by non-radiative dipole-dipole coupling).
- the peak emission of the bioluminescent reporter is substantially separated from the peak emission of the fluorophore, for example by at least 80 nm, 100 nm, 120 nm, 140 nm, etc., in wavelength.
- the Forster distance of the fluorophore and bioluminescent reporter pair is small (e.g., ⁇ 20 nm, ⁇ 10 nm, ⁇ 5 nm, ⁇ 3 nm, etc.).
- the short Forster distance results in the requirement that the fluorophore and bioluminescent reporter must be brought into very close proximity for energy transfer to occur. Therefore, the short Forster distance reduces aberrant and/or background signal (e.g., created by diffusing fluorophore and/or reporter).
- a fluorophore and bioluminescent reporter pair are selected that are sufficiently bright to allow detection of the transferred signal at a native abundance (or near native abundance) of the protein of interest and/or the cellular target fused to the bioluminescent reporter.
- either the selected fluorophore or bioluminescent reporter produce insufficient energy (light) emission
- either the fusion of the cellular target and bioluminescent reporter will need to be overexpressed (e.g., beyond native abundance, beyond a biologically relevant level, etc.), and/or the amount of fluorophore-tethered bioactive agent will have to be increased (e.g., to a potentially toxic level, beyond a physiologically relevant level, above the amount when kinetic experiments can be performed, etc.).
- sufficient brightness of the bioluminescent reporter and fluorophore allows detection of bioactive agent and cellular target interaction at a range of concentrations and ratios.
- compositions, methods, and systems are provided for identification of the cellular targets of hit compounds emerging from a phenotypic assay or phenotypic screen.
- "hit compounds" tethered to fluorophores are used to identify cellular targets, through their linkage to a bioluminescence reporter protein (e.g., binding of bioactive agent to cellular target results in BRET between bioluminescence reporter protein and fluorophore).
- a bioluminescence reporter protein e.g., binding of bioactive agent to cellular target results in BRET between bioluminescence reporter protein and fluorophore.
- the interaction partner e.g., cellular target for that bioactive agent in unknown or is uncertain.
- a bioactive agent tethered to a fluorophore is able to regenerate a phenotype, thereby validating that tethering the bioactive agent to the fluorophore (or the cellular target to the bioluminescent reporter) does not affect the cellular binding patterns and/or disrupt its biological activity.
- the use of a library of cellular targets, each fused to bioluminescent reporter protein e.g., NANOLUC
- detection method provides a greater degree of sensitivity or specificity.
- target identification through linkage to a bioluminescence reporter protein enables detection through energy transfer, even when binding of the target is inefficient or incomplete.
- binding of a bioactive agent e.g., small molecule
- binding of a bioactive agent e.g., small molecule
- BRET allows for analysis of the hit compound's binding affinity in live cells using competitive displacement of a fluorescent tracer (e.g., fluorophore) that binds to the same site on the cellular target.
- systems and methods described herein provide the ability to use two distinct methods for target identification, thus providing higher stringency for identifying cellular targets, complementary methods addressing limitations with other approaches (e.g., BRET provides the advantage of maintaining the bioactive agent in equilibrium with the target throughout the experiment).
- Some embodiments described herein find use in drug discovery, drug validation, drug target discovery, or drug target validation.
- the binding interaction between a bioactive agent e.g., drug-like small molecule
- a cellular target can be detected, validated, and/or characterized.
- the relative binding affinity of bioactive agents for a cellular target e.g., in solution, in a lysate, on a surface, in a cell, etc.
- bioactive agent e.g., drug-like small molecule
- the relative binding affinity of bioactive agents for a cellular target can be determined by their ability to displace a bioactive agent that has been tethered to a fluorophore.
- higher binding affinity of a first bioactive agent relative to a second bioactive agent is indicated by requiring a lower concentration of the first bioactive agent to displace a tethered bioactive agent relative to the second bioactive agent.
- Displacement of the tethered bioactive agent is determined by the loss or reduction of energy transfer from the bioluminescent reporter protein fused to a cellular target.
- the concentration of bioactive agent needed to displace a tethered bioactive agent is used to estimate the binding EC50 or the inhibition constant (Ki) for bioactive agent.
- the development of new or modified bioactive agents is guided by their ability to displace one or more bioactive agents, each tethered to a fluorophore, from one or more cellular targets, each fused to a bioluminescent reporter protein.
- a collection of compounds which may have unknown binding affinity to a cellular target may be screened for their ability to bind the target fused to a bioluminescent protein by determining their ability to displace a bioactive agent tethered to a fluorophore.
- compounds may be screened for their ability to bind a first cellular target preferentially relative to a second cellular target by their ability to displace a first tethered bioactive agent from the first cellular target relative to a second tethered bioactive agent from the second bioactive target.
- the first and second tethered bioactive agents are the same.
- systems and methods described herein provide the ability to determine the affinity of a bioactive agent (e.g., hit compound, research lead, lead compound, etc.) for wild-type and mutant version(s) of a cellular target, e.g., target protein.
- a bioactive agent e.g., hit compound, research lead, lead compound, etc.
- characterization of the affinity and selectivity of the fluorescently-labeled bioactive agent (e.g., drug) to a disease-relevant mutant protein may be performed in cells.
- Such systems and methods may be useful to identify bioactive agent(s) (e.g., drug) that selectively bind a wild-type or mutant protein differentially.
- bioactive agents may also bind to unexpected and/or unintended cellular targets (off targets).
- off targets In some cases, off target binding of a bioactive agent is responsible for a portion of the therapeutic and/or adverse effects associated with administration of the bioactive agent.
- systems and methods described herein provide the ability to identify off targets of a bioactive agent. Understanding the identity and extent of off-target bioactive agent binding provides valuable information regarding the pharmacology of the agent.
- systems and methods described herein provide the ability to estimate the binding characteristics of a bioactive agent tethered with a fluorophore to a cellular target fused to a bioluminescent reporter (e.g., EC50, Kd, binding rate, environmental influences, etc.)
- the binding characteristics are correlated to biochemical, physical, or phenotypic characteristics related to the cellular target.
- the kinetic profile of the formation or dissolution of the BRET complex can be used to infer association or dissociation rates of untethered bioactive agents. In some examples, these association/dissociation rates can be used to estimate drug residence times for individual targets within intact cells.
- systems and methods are useful in thermodynamic molecular mechanism of action (MMOA) studies on entropic vs. enthalpic interactions.
- displacement of the tethered bioactive agent by a separate agent may occur through separate sites on the cellular target.
- the binding characteristics of the tethered bioactive agent may be used to determine the influence of post-translational modification (e.g., cleavage, phosphorylation, methylation, acetylation, lipidation, etc.), intracellular translocation (e.g., movement to a nucleus, mitochondria, membrane, etc.), or protein interaction (e.g., interactions with other proteins, nucleic acids, lipids, etc.) on the cellular target.
- post-translational modification e.g., cleavage, phosphorylation, methylation, acetylation, lipidation, etc.
- intracellular translocation e.g., movement to a nucleus, mitochondria, membrane, etc.
- protein interaction e.
- An example is determining the binding characteristics of an antibody to a cellular target by its influence on the binding characteristics of the tethered bioactive agent.
- the binding characteristics of the tethered bioactive agent may be used to determine the influence of chemical modifications or transformation of the bioactive agent or the tethered fluorophore (e.g., intracellular metabolism, change in ionic state, etc.).
- the cellular target may comprise more than one molecular component.
- the target may comprise more than one polypeptide, and may further comprise other natural or synthetic molecules (e.g., prosthetic groups, cofactors, metabolites, nucleic acids, lipids, carbohydrates, etc.).
- a bioactive agent tethered to a fluorophore binds to a first molecular component, and a bioluminescent reporter is fused to a second molecular component, so that a signal from the tethered bioactive agent is produced when bound to the first molecular component and the first molecular component is in close proximity to the second molecular component.
- a priori knowledge of the existence of an interaction between a bioactive agent and cellular target is not needed to practice the invention.
- detection and/or characterization of an unknown or previously unidentified interaction by energy transfer is provided.
- Advantages of the systems, compositions, and methods described herein, over other methods of target discovery may include: a broad range of possible bioactive agent concentrations because (in some examples) it need not be expressed within cells (e.g., allows for addition of enough acceptor fluorophore to generate detectable signal), natural protein concentration of cellular target (e.g., no need for overexpression to gain enough signal for detection), signal detectable on a plate reader (e.g., high throughput detection, no imaging necessary), detection of interactions within a cell, etc.
- bioactive agents e.g., hit compounds
- a fluorescent energy acceptor dye e.g., NANOLUC-fused
- the binding of the modified agent to its luciferase-fused (e.g., NANOLUC-fused) cellular target results in energy transfer from NANOLUC to the acceptor dye.
- NANOLUC-fused luciferase-fused
- the labeled bioactive agent remains in equilibrium with the cellular target throughout the experiment allowing detection of targets that interact with the hit compounds with low affinity.
- BRET enables measurements of binding affinity in living cells by the competitive displacement of a fluorescent tracer designed for the same binding site.
- NANOLUC is significantly brighter than other luciferases commonly used for BRET, thereby allowing energy transfer to be quantitated at lower expression levels which are more suitable for maintaining relevant biology within a cell.
- the narrow emission spectrum of NANOLUC increases the dynamic range by reducing spectral cross-over in the acceptor channel.
- the dynamic range can be further increased by using long-wavelength acceptors that emit in the near-red region of the spectrum (600 to 650 nm).
- rhodamine analogs e.g., carboxy rhodamine analog
- WO2013/078244 delivers an optimal dynamic range for use with NANOLUC and/or in the BRET applications described herein.
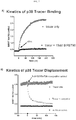
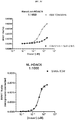
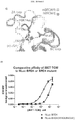
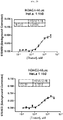
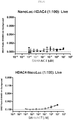
- HEK293 cells were transfected using FuGene HD (Promega Corp.) with plasmid DNA encoding a NanoLuc-HDAC6 fusion protein.
- NanoLuc-HDAC6 DNA was diluted 1:1000 with a promoterless carrier DNA (pGEM3Z) to yield a final concentration of 50ng/well total DNA in 96-well plate format (at a seeding density of 20,000 cells/well). Twenty-four hours post-transfection, cells were then incubated with serially-diluted tracer in the presence or absence of a molar excess of unlabeled SAHA (as a specificity control).
- furimazine (a coelenterazine derivative substrate for NanoLuc; Promega Corp.) was added at a concentration of 20uM, and BRET was quantified on a Varioskan luminometer.
- the specific BRET signal was calculated by subtracting the non-specific signal (in the presence of unlabeled SAHA) from the signal generated from the SAHA tracer alone.
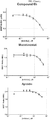
- results in Figure 2 demonstrate that the SAHA-TOM (PBI-4968) conjugate/tracer generated a superior, specific BRET signal compared to SAHA-TMR (PBI-4967) and also generated a left-shifted EC 50 value for binding within living cells.
- the benefit of the PBI-4968 TOM dye over other commonly used fluorophores can be applied to competitive binding assays or target identification (chemical proteomics) screening using NANOLUC fusion protein libraries.
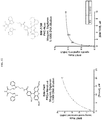
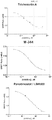
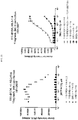
- HEK293 cells were transfected with DNA encoding NanoLuc-HDAC6 at a 1:1000 dilution with carrier DNA as previously described. Twenty-four hours post-transfection, cells were incubated with serially-diluted natural pro-drug, FK-228; in the presence of a fixed concentration (1uM) of SAHA-TOM (PBI-4968) conjugate. For comparison, a biochemical, activity-based HDAC6 assay was run in parallel. Briefly, a 3-fold serial dilution of FK-228 (Selleckchem catalog # S3020) was performed at 100X in 100% DMSO in wells of a 96-well plate.
- HDAC-GloTM I/II Final Detection Reagent (Promega Corp.) was added to all wells (20 ⁇ L final assay volume), and luminescence was measured after a10 minute incubation at room temperature. For all test conditions, the final concentration of HDAC-GloTM I/II substrate was 50 ⁇ M. The data was plotted (sigmoidal dose response - variable slope) using PrismTM software from GraphPad (no DTT: closed circles; 0.25 mM DTT: open squares).
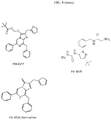
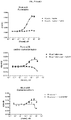
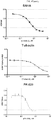
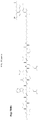
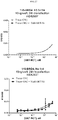
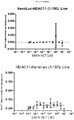
- HEK293 cells were transfected with DNA encoding PKCalpha (PKCa)-NanoLuc or NanoLuc-PKCalpha at a 1:1000 dilution of DNA with promoterless carrier DNA as described previously. Twenty-four hours post-transfection, cells were treated with or without digitonin to a final concentration of 50ug/mL. Cells were then treated with serially-diluted a staurosporine-PBI-dye conjugate (PBI-5129; See Figure 8 ). Cells were co-incubated in the presence or absence of 5uM unconjugated staurosporine as a specificity control for binding. Following two hours of equilibration with a tracer, furimazine was added to a final concentration of 20uM, and BRET ratios were measured on a Varioskan luminometer ( Figures 5A and 5B ).
- Figure 5A-C demonstrate the ability to use permeabilization agent to potentiate the entry of impermeable drug tracers and applied to BRET-based chemical proteomics screens of NanoLucTM fusion protein libraries.
- HEK293 cells were transfected with DNA encoding a NanoLuc-p38 fusion protein (to a final concentration of 50ng/well DNA in 96-well format). Twenty-four hours post-transfection, cells were treated with serially diluted BIRB-796 or PBI-4835 in the presence of 0.5uM PBI-4838 (BIRB conjugate derivative; see, e.g., WO2013/078244 . After two hours of equilibration, furimazine was added to a concentration of 20uM, and BRET was measured on a Varioskan luminometer.
- Figure 6 demonstrates that the dose-response BRET curves support the higher known affinity of BIRB-796 over PBI-4835 ("BIRB Derivative").
- BIRB Derivative The ability to measure the relative affinities of unlabeled drugs can be applied to HTS screens, lead optimization or chemical proteomics applications.
- similar experiments are configured to characterize optimized hit compounds from high-throughput chemical screens (e.g., compounds with lower IC50 values for tracer displacement would indicate higher binding efficiency to the target of interest).
- HEK293 cells were transfected with DNA encoding a NanoLuc-p38 fusion (to a final concentration of 50ng/well DNA in 96-well format). Twenty-four hours post-transfection, cells were pretreated for 2 hours with protected furimazine (PBI-4378; See Figure 8 ) to a final concentration of 20uM. BRET was measured over time on a Varioskan luminometer set to 37°C. After a short pre-read, cells were stimulated with varying concentrations of PBI-4838 (in the presence or absence of 1uM BIRB796 as a specificity control). Dose and time-dependent increases in BRET were then monitored kinetically over 4 hours.
- transfected cells were pretreated with both 20uM PBI-4377 and 1uM PBI-4838 to generate a steady BRET signal. After a short pre-read, cells were stimulated with 1uM unlabeled BIRB-796, and competitive displacement was monitored by BRET in real-time.
- the following example relates to the use of specific NANOLUC substrates (SEE FIG. 8 ) or enzyme components to discriminate the subcellular localization of a drug binding event using BRET.
- NANOLUC complementary NANOLUC enzyme polypeptides or peptide
- the small signal peptide is genetically tethered to a cell surface receptor.
- the donor signal is isolated to the extracellular space. This signal isolation increases the signal/background generated in various BRET applications including drug tracer binding/displacement.
- full length NANOLUC protein fusions are utilized if impermeable NANOLUC substrate is applied.
- Staurosporine p-nitrophenylcarbamate (3 mg, 4.8 umol) was dissolved in 0.5 mL of DMF and treated with excess cadaverine. The reaction was warmed in a 70°C oil bath for 2 h, then diluted with H 2 O, acidified with formic acid, and subjected to preparative HPLC eluting with 25%->75% MeCN in 10 mM aqueous NH 4 OAc. The appropriate fractions were lyophilized to afford a slightly yellow solid. Calcd for M+H: 595.3; found 595.5
- Staurosporine 5-aminopentylcarboxamide (5 mg, 8.4 umol) was dissolved in 1 mL DMF and treated with triethylamine and TOM 6-SE (4 mg, 6 umol). The reaction was monitored by analytical HPLC. Upon completion of the reaction, MeCN and H 2 O were added, and the TEA was neutralized by addition of a small amount of AcOH. Preparative HPLC (25%->100% MeOH in 10 mM NH4OAc) and subsequent concentration yielded 1.8 mg of a dark blue solid. Calcd for M+H: 1139.5; found 1139.8.
- TOM 6-carboxylic acid (26 mg, 46 umol) was stirred in 1 mL of DMF with 2 equiv of triethylamine and treated with TSTU (17 mg, 56.5 umol, 1.2 equiv), and the reaction was monitored by HPLC. After 40 min, the reaction was added to a solution of cadaverine (94 mg, 0.92 mmol, 20 equiv) in 0.5 mL DMF and stirred for 20 min. The reaction was then neutralized by addition of TFA and diluted with MeCN and water. Preparative HPLC (25->100% MeCN in 0.1 % aqueous TFA) and subsequent lyophilization afforded the desired product as a purple solid. LCMS: Calcd for ((M+2H)/2) 324.4; found 324.3.
- HEK293 cells were transfected with plasmid DNA encoding NanoLuc-p38alpha or Renilla Luc-p38alpha using Fugene HD(Promega Corporation) at a 3:1 lipid:DNA ratio and seeded into 96-well plates at a density of 20,000 cells per well (to yield 50ng/well of DNA). 24h post-transfection, cell medium was replaced with serum-free medium (Opti-MEM) and incubated with serially-diluted PBI-4838 (BIRB796 derivative conjugated to TOM dye) in the presence/absence of BIRB796 at 1uM. Cells were incubated at 37°C for two hours. To the NanoLuc-expressing samples, furimazine was added to a final concentration of 20uM.
- Figure 9 demonstrates that both Renilla luciferase and NanoLuc luciferase can be used in the method of the present invention.
- HEK293 cells were transfected with plasmid DNA encoding NanoLuc-p38alpha using Fugene HD and seeded into 96-well plates (to yield 50ng/well of DNA). 24h post-transfection, cell medium was replaced with serum-free medium (Opti-MEM) and incubated with serially-diluted PBI-4838 (BIRB796 derivative conjugated to TOM dye) or PBI-4836 (BIRB derivative conjugated to TMR dye) in the presence/absence of BIRB796 at 1uM. Cells were incubated at 37°C for two hours. To the NanoLuc-expressing samples, furimazine was added to a final concentration of 20uM. BRET was then measured on a Varioskan luminometer equipped with 450nm bandpass and 630nm longpass filters. The BRET ratio was determined by dividing the signal in the 630 channel by the signal in the 450 channel.
- Figure 11 demonstrates another example of the increased potency of the TOM adduct over the TMR adduct for binding to a target protein in a cell-based format.
- Dose-response curves for NanoLuc-p38alpha binding indicate an EC50 of 38nM for the BIRB-TOM conjugate, compared to an EC50 of 450nM for the BIRB-TMR conjugate.
- the reported affinity of BIRB-TOM is more consistent with literature reports compared to the BIRB-TMR ( Chem Biol Drug Des 2009; 74: 547-559 ).
- HEK293 cells were transfected with plasmid DNA encoding PKCalpha-NanoLuc (diluted 1:1000 into pGEM3Z carrier DNA) using Fugene HD and seeded into 96-well plates (to yield 50ng/well of total DNA). 24h post-transfection, cell medium was replaced with serum-free medium (Opti-MEM) and incubated with serially-diluted PBI-5075 (BIM conjugated to TOM dye) or PBI-5051 (BIM conjugated to TMR dye) in the presence/absence of staurosporine at 5uM. Cells were incubated at 37°C for two hours. To the NanoLuc-expressing samples, furimazine was added to a final concentration of 20uM.
- BRET was then measured on a Varioskan luminometer equipped with 450nm bandpass and 630nm longpass filters. The BRET ratio was determined by dividing the signal in the 630 channel by the signal in the 450 channel. To determine specific BRET signals, the BRET ratio at each concentration of tracer + unlabeled staurosporine was subtracted from the BRET ratio at each concentration of tracer without unlabeled staurosporine.
- Figure 12 demonstrates another example of the increased potency of the TOM adduct over the TMR adduct for binding to a target protein in a permeabilized cell format.
- Dose-response curves for PKCalpha-NanoLuc binding indicate an EC50 of 483nM for the BIM-TOM conjugate, compared to dramatically right-shifted potency for the BIM-TMR conjugate.
- the reported affinity of BIM-TOM is more consistent with literature reports compared to the BIM-TMR ( J Biol Chem. 1991 Aug 25; 266(24):15771-81 .).
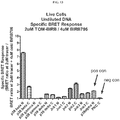
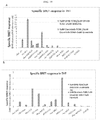
- the following example serves to demonstrate the ability to profile the selectivity of a drug tracer against a panel of putative targets within a given phylogenetic target family. Similar experimental configurations may be used to identify the target of fluorescently labeled drugs using BRET in cells. This configuration may lead to the identification of the primary drug target, as well as off-target interactors. Engagement of multiple targets may be indicative of drug promiscuity and potential drug side effects. This example serves to demonstrate the ability to measure both primary, as well s secondary target interactions via BRET.
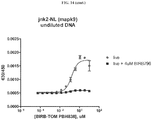
- HEK293 cells were transfected with plasmid DNA encoding N or C-terminal NanoLuc fusions to various members of the MAPK pathway (Jnk1, Jnk2, Jnk3, p38alpha, p38beta, p38gamma, p38 delta, or PKCalpha or MAPK 8, 9, 10, 14, 11, 12, or 13, PKCalpha respectively) using Fugene HD (Promega Corporation) at a 3:1 lipid:DNA ratio and seeded into 96-well plates at a density of 20,000 cells per well (yield 50ng/well of DNA).
- Fugene HD Promega Corporation
- Figure 13 indicates selectivity of PBI-4838 to Jnk2, p38beta and p38alpha, consistent with literature reports.
- P38alpha is recognized as the primary target of BIRB796.
- interactions with targets such as Jnk2 and p38beta could indicate potential off-target liabilities.
- PKCalpha-NanoLuc fusion combined with PBI-4838 showed relatively little specific BRET signal owing to poor affinity of BIRB796 toward this target.
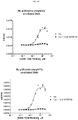
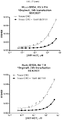
- the following example serves to demonstrate the ability to profile the affinity of a drug tracer against a panel of putative targets within a given phylogenetic target family. Similar experimental configurations may be used to characterize the affinity of the fluorescently labeled drug to a given target using BRET in cells.
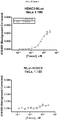
- HEK293 cells were transfected with plasmid DNA encoding NanoLuc-p38alpha, NanoLuc-p38beta, Jnk2-NanoLuc, PKCalpha-NanoLuc, or NanoLuc-HDAC6 using Fugene HD (Promega Corporation) at a 3:1 lipid:DNA ratio and seeded into 96-well plates at a density of 20,000 cells per well (yield 50ng/well of DNA). Twenty-four hours post-transfection, cell medium was replaced with serum-free medium (Opti-MEM) and incubated with serially-diluted PBI-4838 in the presence or absence of BIRB796 at 4uM. Cells were incubated at 37°C for two hours.
- Fugene HD Promega Corporation
- transfected cells were treated with serially-diluted BIRB796 in the presence of 1uM PBI-4838.
- furimazine was added to a final concentration of 20uM.
- BRET was then measured on a Varioskan luminometer equipped with 450nm bandpass and 630nm longpass filters. The BRET ratio was determined by dividing the signal in the 630 channel by the signal in the 450 channel.
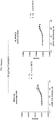
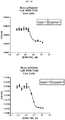
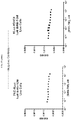
- Figures 14 and 15 demonstrate the apparent affinity of PBI-4838 to Jnk2, p38beta, and p38alpha.
- PKCalpha and HDAC6 showed relatively little specific BRET signal owing to poor affinity of PBI-4838 to these targets.
- the high affinity of BIRB796 toward Jnk2, p38alpha, and p38beta is demonstrated by competitive displacement in cells. Similar experiments could be configured to rank-order the affinity of drug tracers to a given set of targets (by an increase in BRET) or unmodified drugs (by competitive displacement). As indicated above, high-affinity interactions with targets such as Jnk2 and p38beta could indicate potential off-target liabilities.
- the following example serves to demonstrate the ability to measure the relative affinity of a drug tracer to a wild-type versus mutant target protein.
- affinity of a fluorescently-labeled iBET compound small-molecule inhibitor that binds BRD4 preventing its interaction with acetylated histones
- BRD4 Bromodomain-containing protein 4
- Similar experimental configurations may be used to characterize the affinity and selectivity of the fluorescently-labeled drug to a disease-relevant mutant protein in cells. Such experiments may be useful to identify drugs that selectively bind to wild-type or mutant proteins differentially.
- HEK293 cells were transfected with plasmid DNA encoding NanoLuc-BRD4 or NanoLuc-BRD4 (N140A/N433A) using Fugene HD (Promega Corporation) at a 3:1 lipid:DNA ratio and seeded into 96-well plates at a density of 20,000 cells per well (yield 50ng/well of DNA). Twenty-four hours post-transfection, cell medium was replaced with serum-free medium (Opti-MEM) and incubated with serially-diluted PBI-4966 (iBET conjugated to TOM dye) in the presence/absence of iBET at 10uM. Cells were incubated at 37°C for two hours.
- Opti-MEM serum-free medium
- PBI-4966 iBET conjugated to TOM dye
- Figure 16 indicates relative affinities of PBI-4966 to wild-type BRD4 versus the mutant BRD4. As expected, a right-shifted potency is observed with the mutant BRD4 indicating a lowered affinity for PBI-4966. Similar experiments could be configured to rank the order of the affinity of drug tracers to disease-relevant mutants of a target. This principle could be expanded to measuring relative affinities of drugs toward wild-type or mutant proteins by competitive tracer displacement. Since increased BRET signal is only indicative of binding to the NanoLuc fusion, this method enables measurements of target engagement amidst a complex mixture of similar antigens present in the assay sample. These antigens could include targets of similar properties, but non-identical to the target of interest (for instance, to discriminate heterologous vs. endogenous analyte or mutant vs. wt. analyte, etc.).
- the following example demonstrates that the method of the present invention can be used to screen compound panels to determine target engagement.
- This screening method could be expanded to larger compound libraries (e.g. LOPAC) as well.
- HEK293 cells were transfected with NanoLuc-HDAC6 DNA using Fugene HD and seeded into wells of a 96-well plate.
- NanoLuc-HDAC6 DNA was diluted with promoterless carrier DNA (pGEM3Z). The final DNA concentration/well remained 50ng/well; however the NanoLuc-HDAC6 DNA was diluted 1:1000 (at a seeding density of 20,000 cells/well in 96-well format).
- SEE Figure 17 serially-diluted inhibitors
- furimazine was added to 20uM, and BRET detected on a Varioskan luminometer.
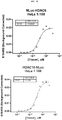
- HEK293 cells were transfected with plasmid DNA encoding CDK2-NanoLuc (diluted 1:100 into pGEM3Z carrier DNA) using Fugene HD (Promega Corporation) at a 3:1 lipid:DNA ratio and seeded into wells of 96-well plates at a density of 20,000 cells per well (yield 50ng/well of total DNA). Twenty-four hours post-transfection, cell medium was replaced with serum-free medium (Opti-MEM) and incubated with serially-diluted PBI-5077 (purvalanol B conjugated to TOM dye) in the presence/absence of Purvalanol B at 10uM. Cells were incubated at 37°C for two hours.
- Opti-MEM serum-free medium
- PBI-5077 purvalanol B conjugated to TOM dye
- This example supports use of fluorophore tracers in medium for monitoring drug/target interactions via BRET.
- BRET fluorophore tracers
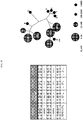
- the following example demonstrates the ability to generate NanoLuc fusion arrays using cell-free expression and measure drug binding and relative affinity by BRET.
- a panel of 11 kinases including putative targets of BIRB796 (such as members of the MAPK and Jnk families), putative targets of Dasatinib (such as Src and LCK) as well as an irrelevant HDAC6 negative control was expressed in TnT® T7 Quick Coupled Reticulocyte Transcription/Translation System (Promega Corporation) as recommended by the manufacturer to create an array with 23 different NanoLuc fusions.
- Each TNT® reaction was diluted 1:100 in PBS and plated in replicates into wells of 96-well plates.
- the NanoLuc fusion array was screened with 2 different TOM-drug tracer (BIRB-TOM; PBI-4838 and Dasatinib-TOM; PBI-5170 ) in the presence and absence of excess relevant free drug.
- BIRB-TOM TOM-drug tracer
- 4 replicas with 1uM Dasatinib-TOM/ 4 replicates with 1uM Dasatinib-TOM+5uM Dasatinib were performed.
- the reactions were incubated with constant mixing for 2h at room temperature.
- BRET was then measured on a Varioskan luminometer equipped with 450nm bandpass and 610nm longpass filters. The BRET ratio was determined by dividing the signal in the 610 channel by the signal in the 450 channel. To determine response ratios, the BRET values with tracer alone were divided by the BRET values with tracer + unmodified.
- the BIRB-TOM hits were further analyzed for binding affinity to the BIRB-TOM tracer and competitive displacement of the BIRB TOM Tracer with the BIRB796.
- Binding affinity experiments to the BIRB-TOM tracer were preformed by incubating 3 replicates of the diluted TNT reactions with serially-diluted BIRB-TOM tracer in the presence/absence of BIRB796 at 10uM. Reactions were incubated at room temperature with constant mixing for two hours and after adding furimazine to a final concentration of 20uM analyzed as described above.
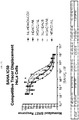
- the following example demonstrates that high affinity interaction with the drug tracer with optimal signal to background is achieved when the expression of the NanoLuc fusion is close to endogenous level.
- a 1:1000 dilution of the NanoLuc HDAC6 DNA with a carrier DNA was required to achieve a high affinity interaction.
- the expression of serial dilutions of the NanoLuc HDAC6 DNA was compared to the expression of the endogenous HDAC6 using western blot analysis.
- HEK293 cells were seeded into wells of 6-well plates at 2.5x10 5 cells/well and transfected with PEI with varying amounts of NanoLuc HDAC6 DNA.
- the NanoLuc HDAC6 DNA was diluted with a non-expressing carrier DNA (pCI neo). The final concentration of DNA remained 2ug/well while the NanoLuc HDAC6 DNA was diluted 1:0, 1:10, 1:100,1:1000 and 1:10000.
- the control was un-transfected cells. 24 hours post transfection, the media was removed, and cells washed with PBS and lysed for 10 min with 400ul of mammalian lysis buffer (Promega) +1:50 RQ1 DNase (Promega) +1x RQ1 buffer.
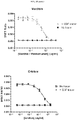
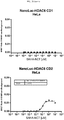
- TAMRA-epidermal growth factor (TMR-EGF; Life Technologies) was applied in a cellular BRET assay using a stable cell line expressing a NanoLuc-EGFR (Her1) fusion protein.
- TMR-EGF TAMRA-epidermal growth factor
- the BRET signal generated between TMR-EGF and NanoLuc-EGFR can be inhibited upon treatment with therapeutic antibodies known to interfere with binding of EGF.
- a HEK293 stable cell line was generated by transfection of pF5 NanoLuc-EGFR plasmid DNA (Promega Corp.) and FuGene HD (Promega Corp.). After transfection, the stable cell line was generated by G418 selection, followed by limited dilution cloning. Clonally-derived cells expressing NanoLuc-EGFR were seeded into 96-well plates at a density of 20,000 cells per well. 20 hours after seeding, medium was replaced with serum-free OptiMEM and cells were serum starved. After starvation, cells were treated with serially-diluted TMR-EGF (Life Technologies).
- furimazine (a coelenterazine derivative substrate for NanoLuc; Promega Corp.) was added at a concentration of 20uM, and BRET was quantified on a Varioskan luminometer.
- antibody-mediated displacement of TMR-EGF was measured by pretreating cells with Vectibix, Erbitux, or Herceptin (negative control) prior to stimulation with TMR-EGF (10ng/mL final concentration).
- Results in Figure 20 demonstrate that the BRET can be used to quantify binding of fluorescent cytokines to cell surface receptors tethered to NanoLuc. Furthermore, the affinities of therapeutic antibodies capable of inhibiting cytokine binding can be measured by competitive displacement of the fluorescent cytokine. Vectibix and Erbitux were capable of inhibiting the binding of TMR-EGF to NanoLuc-EGFR, whereas Herceptin (a Her2 binder with negligible affinity to Her1) was incapable of inhibiting TMR-EGF binding. This example demonstrates that the binding of a fluorescent cytokine to a known high-affinity target can be quantified by BRET, in a format that can be readily reconfigured to monitor binding of therapeutic antibodies (e.g.
- the present disclosure enables the detection/measurement of three moieties coming together: (1) A peptide of a bioluminescent reporter protein and (2) a polypeptide of a bioluminescent reporter protein which interact through structural complementation to form a complex, and (3) a fluorescent third moiety (e.g., fluorescent small molecule).
- a fluorescent third moiety e.g., fluorescent small molecule
- This example demonstrates energy transfer from a bioluminescent complex formed from a structurally complementary peptide (SEQ ID NO: 6) and polypeptide (SEQ ID NO: 7), which form a bioluminescent complex.
- a fluorescent dye was attached to the complementary peptide sequence.
- a fluorescent protein could be fused (e.g., a fusion protein) with a peptide or polypeptide (e.g., created from a genetic construct).
- E. coli clarified lysate expressing the complementary polypeptide sequence was prepared (poly lysate). 40uL of the poly lysate was mixed with 10uL of complementary peptide (pep) or fluorescently-labeled complementary peptide (pep-TMR) and incubated for 10min at RT. 50uL 100uM substrate for the complex (furimazine) in 50mM HEPES pH 7.4 was added and incubated for 30min at RT. Luminescence was measured over 400-700nm on TECAN M1000.
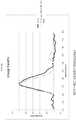
- Figure 21 illustrates very efficient energy transfer from the Poly/Pep complex (donor) to TMR (acceptor), and the corresponding red shift in the wavelength of light being emitted.
- B) This example demonstrates using BRET in detection, such as detecting small molecule concentration or enzymatic activity. Because energy transfer is strongly dependent on distance, the magnitude of energy transfer can often be related to the conformation of the system. For instance, insertion of a polypeptide that chelates calcium can be used to measure calcium concentration through modulation of energy transfer.
- An enzyme that also changes the distance, either through causing a conformational change of the sensor as above or through cleavage of the sensor from the fluorescent moiety, can be measured through a system as described herein.
- One structurally complementary member of a complex is bound to a fluorescent moiety which transfers its energy when the structurally complementary peptide and polypeptide of a bioluminescent reporter protein interact.
- a fluorescent moiety which transfers its energy when the structurally complementary peptide and polypeptide of a bioluminescent reporter protein interact.
- a linker e.g., DEVD Caspase-3 cleavage site.
- a complementary polypeptide (SEQ ID NO: 8) and NL-HT (NanoLuc fused to HaloTag) were purified.
- 20uL of 8pM NL-HT was mixed with 20uL of 100nM PBI-3781 (See, e.g., WO2013/078244 ) and incubated for 10min at RT.
- 40uL NanoGlo+100uM furimazine was added, and luminescence measured over 300-800nm on TECAN M1000.
- 20uL of 33ng/uL of a complementary polypeptide (SEQ ID NO: 6) was mixed with 20uL of ⁇ 500uM PBI-5074 (fluorescent dye-linker-complementary peptide).
- 40uL NanoGlo+100uM furimazine was added, and luminescence measured over 300-800nm on TECAN M1000.
- Figure 22 illustrates energy transfer from the complementary peptide/polypeptide complex (donor) to the TOM-dye of PBI-5074 (acceptor), and the corresponding red shift in the wavelength of light being emitted.
- the energy transfer with a structurally complementary pair of a bioluminescent reporter protein can also be used to measure three molecules interacting.
- One example is a GPCR fused to a complementary polypeptide of a bioluminescent reporter protein and a GPCR interacting protein fused with a complementary peptide of the bioluminescent reporter protein that form a bioluminescent complex when they interact. This allows measurement of the binary interaction. If a small molecule GPCR ligand bearing a fluorescent moiety for energy transfer interacts with the complex, energy transfer occurs. Therefore, the binary protein-protein interaction and the ternary drug-protein-protein interaction are measured in the same experiment. Also, the fluorescent molecule only causes a signal when interacting with the protein pair, which removes any signal from the ligand interacting with an inactive protein ( Figure 23 ).
- the donor is comprised of two complementary subunits, an 1 IS polypeptide and a PEP-80 peptide.
- the 1 IS polypeptide was genetically tethered to the N-terminus of BRD4, and the fusion protein expressed in HEK293 cells. Luminescence was generated from the fusion protein only in the presence of both furimazine () and the PEP-80 complementary polypeptide ( Figure 24A ).
- HEK293 cells were transfected with 11S-BRD4 DNA using Fugene HD and seeded in a 96-well plate format.
- 11S-BRD4 DNA was diluted with promoterless carrier DNA (pGEM3Z). The final DNA concentration/well remained 50ng/well; however the 11 S-BRD4 DNA was diluted 1:10 (at a seeding density of 20,000 cells/well in 96-well format). Twenty hours post-transfection, cells were lysed in OptiMEM + 50ug/mL digitonin in the presence of absence of 1uM PEP-80 peptide.
- the concept illustrated by this example can be applied to detecting proximity of a fluorescently labeled ligand to protein complexes (e.g. detecting ligand binding selectively to heterodimeric or homodimeric receptors) by linking members of the complex to components of a multicomponent luminescent donor. This application could be thus used to monitor target engagement within disease-relevant protein complexes.
- the donor is comprised of two subunits, an 1 IS peptide and a 114 peptide.
- the 1 IS peptide was genetically tethered to the N-terminus of BRD4, and the 114 peptide was genetically tethered to the C-terminus of Histone H3.3.
- These fusion proteins were simultaneously expressed in HEK293 cells. Luminescence was generated from the fusion protein only in the presence of both fusion constructs ( Figure 26A ).
- HEK293 cells were transfected using Fugene HD with BRD4 DNA fusion constructs +/-Histone H3.3 DNA fusion constructs and seeded in a 96-well plate format.
- the reporter constructs were diluted with promoterless carrier DNA (pGEM3Z). The final DNA concentration/well remained 50ng/well; however each DNA expression construct was diluted 1:10 (at a seeding density of 20,000 cells/well in 96-well format).
- Twenty hours post-transfection cells were treated with serially-diluted iBET-NCT (PBI-4966) in the presence or absence of 10uM iBET 151 as a specificity control.
- transfected cells were treated with serially diluted iBET-151 in the presence of a fixed concentration (2uM) of iBET-NCT/PBI-4966 tracer. After 1 hour of incubation, furimazine was added to 10uM, and BRET detected on a Varioskan luminometer.
- the concept illustrated by this example can be applied to detecting proximity of a fluorescently-labeled ligand to protein complexes (e.g., detecting ligand binding selectively to heterodimeric or homodimeric receptors) by linking members of the complex to components of a multicomponent luminescent donor.
- This application could be used to monitor target engagement within protein complexes.
- this technique could enable the identification or characterization of compounds selective to disease-relevant intracellular protein complexes.
- HDACs 1-11 non-sirtuin histone deacetylases 1-11.
- Cells were transfected by diluting each DNA construct at a mass ratio of 1:100 into pGEM3Z carrier DNA and forming lipid DNA complexes using Fugene HD (Promega Corporation) at a 3:1 lipid:DNA ratio.
- Transfected cells were then seeded into 96-well plates at a density of 20,000 cells per well (total yield 50ng/well of DNA).
- the following example serves to demonstrate the ability to measure the binding of a compound to an intracellular target with single cell resolution by using BRET imaging.
- This example shows the binding of SAHA and its fluorescent derivative , SAHA-NCT (PBI-4968) to NanoLuc-HDAC6 and HDAC10-NanoLuc in living cells.
- HeLa cells were transfected with plasmid DNA encoding NanoLuc fusions with HDAC6 and HDAC10 respectively.
- Cells were transfected by diluting each DNA construct at a mass ratio of 1:100 into pGEM3Z carrier DNA and forming lipid DNA complexes by adding Fugene HD (Promega Corporation) at a 3:1 lipid:DNA ratio.
- the transfection complex was mixed with a cell suspension (1e5 cells per ml) followed by plating into glass-bottom 35 mm dishes at a density of 200,000 cells per dish (total yield 50ng/well of DNA).
- the results demonstrate the cellular uptake and specific binding of PBI-4968 as well as SAHA to different members of the HDAC family (HDAC6 and 10) on a single cell level.
- the results suggest that the degree of uptake and/or binding varies considerably with in a cell population.
- the image based BRET assay format enables the analysis of target specific compound binding on a single cell level to determine differences based on cell type, cell density, cell cycle status and other physiological parameters that require single cell resolution for analysis.
Landscapes
- Health & Medical Sciences (AREA)
- Life Sciences & Earth Sciences (AREA)
- Engineering & Computer Science (AREA)
- Immunology (AREA)
- Chemical & Material Sciences (AREA)
- Biomedical Technology (AREA)
- Molecular Biology (AREA)
- Urology & Nephrology (AREA)
- Hematology (AREA)
- Biochemistry (AREA)
- Biotechnology (AREA)
- General Health & Medical Sciences (AREA)
- Physics & Mathematics (AREA)
- Microbiology (AREA)
- Analytical Chemistry (AREA)
- Medicinal Chemistry (AREA)
- Organic Chemistry (AREA)
- General Physics & Mathematics (AREA)
- Cell Biology (AREA)
- Pathology (AREA)
- Food Science & Technology (AREA)
- Genetics & Genomics (AREA)
- Bioinformatics & Cheminformatics (AREA)
- Zoology (AREA)
- Wood Science & Technology (AREA)
- General Engineering & Computer Science (AREA)
- Toxicology (AREA)
- Tropical Medicine & Parasitology (AREA)
- Chemical Kinetics & Catalysis (AREA)
- Biophysics (AREA)
- General Chemical & Material Sciences (AREA)
- Proteomics, Peptides & Aminoacids (AREA)
- Plant Pathology (AREA)
- Nuclear Medicine, Radiotherapy & Molecular Imaging (AREA)
- Measuring Or Testing Involving Enzymes Or Micro-Organisms (AREA)
- Investigating Or Analysing Materials By The Use Of Chemical Reactions (AREA)
- Micro-Organisms Or Cultivation Processes Thereof (AREA)
- Peptides Or Proteins (AREA)
- Investigating, Analyzing Materials By Fluorescence Or Luminescence (AREA)
- Investigating Or Analysing Biological Materials (AREA)
Description
- The present invention provides compositions and methods for detection and analysis of intracellular binding of a bioactive agent to a cellular target. In particular, provided herein are bioactive agents tethered to fluorophores, cellular targets fused to bioluminescent reporters, or portions, components, or subunits of bioluminescent reporters, and methods of detecting and analyzing the interaction of bioactive agents with cellular targets therewith.
- The interaction of molecular species with cellular targets is critically important in understanding cellular physiology and developing therapeutic interventions, such as new synthetic drugs and biopharmaceuticals. Methods are needed for accurately and efficiently determining target engagement, particularly within living cells where these interactions mediate their phenotypic responses. The ability to affectively interrogate target engagement has broad implications to the discovery process, ranging from high-throughput screening, optimization of screening hit into drug leads, and the discovery and characterization of therapeutically relevant cellular targets.
- Phenotypic-based screening with a small molecule library plays an important role in the drug discovery field. Using such screening approaches, compound libraries, without prior knowledge of their underlying cellular targets, are screened for their ability to elicit a phenotypic response, e.g., mitigate disease symptoms. While this approach can be used to identify bioactive agents, e.g., small molecules, that are able to modulate cellular physiology, determining the biological relevant targets of these small molecule hits is a major technical challenge. In addition, small molecules promoting some desirable phenotypic responses may pose in vivo liabilities due to off-target interactions. In order to predict drug selectivity and minimize potential side effects, it is important to also identify off-target interactions (e.g., lower affinity). Most methods used today for identifying the targets of bioactive agents rely on the enrichment of these targets from complex cellular lysate using "bi-functionalized" compounds that contain a selective moiety (e.g., the bioactive agent or related compound) and a sorting moiety (e.g., affinity tag or solid support). As the enrichment is based on the binding properties of the compounds, where the inherent affinity of these compounds for their target is insufficient, compound analogs are designed to covalently bind to the target (e.g., photo-crosslink). By either approach, the efficacy and specificity of target isolation is essential, and the failure rate of these methods is high. Failure of these approaches can be due to insufficient capture of the target or high background due to non-specific capture. Contributing factors to this failures include: compounds binding multiple targets with low to moderate affinity with these relative weak interactions difficult to detect; lack of robust, straightforward, unbiased technologies to characterize the detected interactions; inability to perform target isolation within the native cellular environment upon which interactions may depend; limited information provided about the binding potency of targets in the cell; and high background of false positive interactions due to non-specific binding to the solid support or functionalized small molecule.
-
WO 2004/034054 A2 discloses an improved BRET assay, wherein the BRET signal is enhanced and/or prolonged. The improved BRET assay comprises the steps of i) adding a substrate to a cell comprising GPCR-Rluc fusion protein and a beta -arrestin-GFP fusion protein, wherein the (beta-arrestin is mutated, ii) adding a ligand to obtain, if possible, a GPCR-Rluc/(beta-arrestin-GFP complex, and iii) measuring a BRET signal to obtain a BRET ratio, wherein the improvement leads to an increased BRET ratio compared with the ratios obtained by use of the same process employing a beta-arrestin-GFP fusion protein wherein the beta-arrestin is the wild type beta-arrestin, or employing a 13-arrestin-GFP fusion protein, wherein the (beta-arrestin is a beta-arrestin specifically mutated so that it acts on the receptor independent of the receptors phosphorylation state. The disclosure further relates to a stable substrate solution for use in an improved BRET assay. -
WO 2006/086883 A1 relates to novel biosensors that are based on bioluminescence resonance energy transfer (BRET). These biosensors may be used to monitor rapid interaction and conformational changes within G protein-coupled receptor/G protein complexes and, in this way, reflect the activation status of the receptor. Advantageously, the biosensors may be used as a highly sensitive and quantitative assay for the identification of ligands (agonists, antagonists, inverse agonists, partial agonists, etc.) targeting G protein-coupled receptors (GPCRs) as well as for the analysis of the activation status of these receptors. Moreover, multiplexing different biosensors within receptors/G protein complexes allows for mapping ligand textures. Additionally, the biosensors permit the direct, real-time examination of interactions between receptors and G protein in their natural environment, the living cell. -
WO 2013/078244 A1 provides novel fluorescent dyes and kits containing the same, which are useful for labeling a wide variety of biomolecules, cells and microorganisms, and also provides various methods of using the fluorescent dyes for research and development, forensic identification, environmental studies, diagnosis, prognosis and/or treatment of disease conditions. -
US 2006/211045 A1 provides a library comprising a plurality of tagged non-peptide ligands of formula I (LigJL)mL(JTTag)m(JTL(JLLig)m)p including and salts thereof comprising one or a plurality of same or different ligand moieties Lig each linked to a one or a plurality of same or different tag moieties Tag via same or different linker moieties L and same or different linking site or linking functionality JT and JL wherein Lig comprises a GPCR ligand, an inhibitor of an intracellular enzyme or a substrate or inhibitor of a drug transporter; L is a single bond or is any linking moiety selected from a heteroatom such as N, O, S, P, branched or straight chain saturated or unsaturated, optionally heteroatom containing, C1-600 hydrocarbyl and combinations thereof, which may be monomeric, oligomeric having oligomeric repeat of 2 to 30 or polymeric having polymeric repeat in excess of 30 up to 300; Tag is any known or novel tagging substrate; m are each independently selected from a whole number integer from 1 to 3; p is 0 to 3 characterised in that linking is at same or different linking sites in compounds comprising different Lig, JL, L JT and/or -Tag and is at different linking sites in compounds comprising same Lig, JL, L JT and/or -Tag; process for the preparation thereof; process for the preparation of a library compound of formula I or a precursor of formula IV; method for selecting a compound of formula I from a library thereof; compound of formula I associated with information relating to its pharmacological properties; a novel compound of formula I or precursor of formula IV; uses thereof; methods for binding or inhibition therewith; use of a fluorescent target therewith; a modified cell surface GPCR and cells expressing the same; and a kit comprising a compound of formula I and a target therefor. - The invention is as defined in the accompanying claims. Also disclosed herein, the present disclosure provides BRET assay systems comprising: (a) a bioactive agent tethered to a chromophore (e.g., fluorophore); (b) a cellular target fused to a bioluminescent reporter; and (c) a substrate for the bioluminescent reporter. In some embodiments, the bioactive agent is a small molecule. In some examples, the bioactive agent is an inhibitor of protein function, e.g., an enzyme inhibitor or a receptor inhibitor. In some embodiments, the chromophore is a fluorophore. In some embodiments, the fluorophore is a carboxy rhodamine analog. In some embodiments, the bioluminescent reporter comprises a polypeptide with at least 70% sequence identity (e.g., 75% identity... 80% identity... 85% identity... 90% identity, 95% identity... 98% identity... 99% identity) with SEQ ID NO: 1. In some examples, (b) is a cellular target fused to a portion, or subunit, or component of a bioluminescent reporter. In some examples, (b) is a cellular target fused to a polypeptide that requires interaction with another polypeptide to produce luminescence. In some embodiments, (a) and (b) are within a cell. In some embodiments, (b) is expressed intracellularly as a fusion protein with a protein of interest, e.g., cellular target. In some examples, the cellular target is composed of more than one component, subunit or polypeptide, e.g., the cellular target is a protein complex. In some examples, the bioluminescent reporter is composed of more than one component, subunit or polypeptide, e.g., the bioluminescent reporter is a protein complex. In some embodiments, (a) is added extracellularly and enters the cell. In some examples, (a) is present both within a cell and in the medium surrounding the cell. In some examples, (a) is present both bound to a cell and in the medium surrounding the cell. In some embodiments, the amount of (a) present in the surrounding medium is significantly greater than the amount in the cell or bound to the cell, e.g., greater by at least 2 fold, at least 5 fold, 10 fold, 30 fold, or 100 fold. In some examples, the cellular target is a binding partner of the bioactive agent. In some embodiments, the emission spectrum of the bioluminescent reporter overlaps with the absorption spectrum of a fluorophore. In some embodiments, upon binding of the bioactive agent to the cellular target, conversion of the substrate to a reaction product by the bioluminescent reporter results in excitation of a fluorophore by BRET and light emission from a fluorophore. In some embodiments, (a) is one of a library of agents or compounds tethered to a chromophore. In some embodiments, (a) is one of a library of agents or compounds tethered to fluorophores. In some embodiments, (b) is one of a plurality of potential cellular targets fused to a bioluminescent reporter. In some examples, (b) is a library of cells expressing one of a plurality of potential cellular targets fused to a bioluminescent reporter.
- In some embodiments, the present invention provides methods of detecting, analyzing, characterizing, etc. the binding of a bioactive agent to a cellular target. In some examples, the cellular target may be the primary drug target. In some examples, the cellular target is an off-target liability that may cause undesirable side effects in vivo. In some examples, binding by the bioactive agent to the cellular target may have no discernible biological effect. In some examples, the present disclosure provides cells comprising one or more of (e.g., each of) (a) a bioactive agent tethered to a chromophore (e.g., fluorophore); (b) a cellular target fused to a bioluminescent reporter; and (c) a substrate for the bioluminescent reporter. In some examples, the binding of a bioactive agent to a cellular target is non-covalent. In some examples, the chromophore is a fluorophore. In some embodiments, the present invention provides methods for detection of an interaction between a bioactive agent and a cellular target comprising: (a) expressing in a cell a fusion of said cellular target and a bioluminescent reporter that emits energy at a first wavelength (e.g., range of wavelengths, spectral distribution, etc.); (b) contacting said cell with said bioactive agent tethered to a fluorophore, wherein said fluorophore accepts energy at said first wavelength and emits energy at a second wavelength (e.g., range of wavelengths, spectral distribution, etc.); (c) contacting said cell with a substrate for said bioluminescent reporter; (d) detecting energy at said second wavelength, wherein the presence of said energy at said second wavelength indicates the interaction of said bioactive agent with said cellular target. The present disclosure also provides methods for detection of an interaction between a bioactive agent and a cellular target comprising: (a) providing a fusion of said cellular target and a bioluminescent reporter; (b) contacting said fusion with said bioactive agent tethered to a chromophore (e.g., fluorophore); (c) contacting said fusion with a substrate for said reporter; (d) detecting a change in the spectral distribution of emitted light relative to said fusion contacted with said substrate in the absence of said chromophore. In some examples, the present disclosure provides a method for detection of an interaction of a second bioactive agent and a cellular target comprising: (a) providing a fusion of said cellular target and a bioluminescent reporter; (b) contacting said fusion with both a first bioactive agent tethered to a chromophore (e.g., fluorophore) and with said second bioactive agent; (c) contacting said fusion with a substrate for said reporter; (d) detecting a change in the spectral distribution of emitted light relative to said fusion contacted with said first bioactive agent and said substrate in the absence of said second bioactive agent. In some examples, the change in spectral distribution of emitted light is caused by displacement of said first bioactive agent by said second bioactive agent. In some examples, said displacement is competitive displacement. In some examples, the change in spectral distribution of emitted light is used to estimate binding affinity of the bioactive agent to cellular target. In some examples, said second bioactive agent is one of a plurality of bioactive agents. In some examples, the change in spectral distribution of emitted light is used to estimate the relative binding affinity of a plurality of bioactive agents to a cellular target. In some examples, said first and said second bioactive agents are synthetic molecules. In some examples, said cellular targets are in living cells, permeabilized cells or cell lysates. In some examples, the change in the spectral distribution of emitted light is determined by measuring the ratio of light intensity at two different wavelengths, or two different ranges of wavelengths. In some examples, the change in spectral distribution over time is detected. In some examples, the chromophore is a fluorophore.
- Also disclosed herein is a BRET assay system comprising: (a) a bioactive agent tethered to a fluorophore; (b) a first interaction partner fused to a structurally complementary peptide of a bioluminescent reporter; (c) a second interaction partner fused to a structurally complementary polypeptide of a bioluminescent reporter; and (d) a substrate for the bioluminescent reporter, wherein the first and second interaction partners interact to form an interaction complex, and wherein the first interaction partner, second interaction partner, and/or interaction complex are binding partners for the bioactive agent. In some examples, the first interaction partner and the second interaction partner are proteins or polypeptides that interact to form a protein complex. In some examples, the first interaction partner and the second interaction partner are brought together by the interaction of the structurally complementary polypeptides. In some examples, the structurally complementary polypeptides are brought together by the interaction of first interaction partner and the second interaction partner. In some examples, the interaction of the first interaction partner and the second interaction partner is determined by an increase in luminescence. In some examples, the first and second interaction partners form the interaction complex in the presence or absence of the bioactive agent. In some examples, the interaction complex is a binding partner for the bioactive agent, but neither the first or second interaction partners alone are binding partners for the bioactive agent. In some examples, one of the interaction partners, but not the other is a binding partner for the bioactive agent. In some examples, interaction complex formation requires binding of the bioactive agent to an interaction partner. In some examples, interaction complex formation is independent of binding of the bioactive agent. Also disclosed herein are BRET assay systems comprising: (a) a bioactive agent tethered to a fluorophore; (b) a cellular target fused to a structurally complementary peptide of a bioluminescent reporter; (c) a structurally complementary polypeptide of a bioluminescent reporter; and (d) a substrate for the bioluminescent reporter. In some examples, the complementary peptide and polypeptide of the bioluminescent reporter associate to form active bioluminescent reporter enzyme. In some examples, upon binding of the bioactive agent to the cellular target and association of the complementary peptide and polypeptide, conversion of the substrate to a reaction product by the bioluminescent reporter enzyme results in excitation of the fluorophore by BRET and fluorescence emission from the fluorophore.
- Also disclosed herein is an assay system comprising: (a) a bioactive agent tethered to a fluorophore; (b) a first binding partner fused to a complementary peptide of a bioluminescent reporter; (c) a second binding partner fused to a complementary polypeptide of a bioluminescent reporter; and (c) a substrate for the bioluminescent reporter. In some examples, the complementary peptide and polypeptide of the bioluminescent reporter associate to form active bioluminescent reporter enzyme. In some examples, when the first and second binding partners interact, the bioactive agent binds to the interacting partners and association of the complementary peptide and polypeptide occurs, conversion of the substrate to a reaction product by the bioluminescent reporter enzyme results in excitation of the fluorophore by BRET and fluorescence emission from the fluorophore.
- In some examples, the bioactive agent is tethered to a fluorescence or luminescence quencher (e.g., Dabcyl). In such examples, titration of the untethered bioactive agent produces a gain in signal.
- Also disclosed herein is imaging (e.g., BRET imaging, via charge couple device camera, etc.) of any of the systems described herein to confirm and/or identify the location (e.g., intracellular, extracellular, etc.) of fluorescence and/or BRET signals resulting from the presence and/or interactions of system components (e.g., bioactive agent, cellular target, etc.).
- In some examples systems and methods described herein (See, e.g., Example 23 for an exemplary embodiment) are useful for the measurement of intracellular selectivity and affinity of a bioactive agent against a panel of putative cellular targets. In some examples, the effect on BRET is monitored as the bioactive agent/cellular target complex is competitively disrupted. In some examples, affinities are inferred by the IC50 value generated via competitive disruption. In some examples, the affinities of inhibitors to individual domains of a cellular target are determined via genetic fusion of a bioluminescent reporter to a segregated domain of the cellular target.
-
-
Figure 1 shows a schematic representation of an embodiment of the present invention: (A) fluorophore-tethered bioactive agent and bioluminescent-reporter-tethered cellular target; (B) binding of bioactive agent to cellular target; (C) addition of reporter substrate results in BRET; and (D) displacement by excess untethered bioactive agent results in loss of BRET and fluorescence. -
Figure 2 shows graphs comparing the BRET profiles of two different fluorophore-SAHA derivatives as BRET acceptors for NANOLUC-HDAC6 fusions in live cells. -
Figure 3 shows graphs depicting the effect of dilution of expression on assay performance. The first graph demonstrates the effect of lowered expression on the BRET assay window using competitive displacement of fluorophore-tethered SAHA from NANOLUC-fused HDAC6. The second graph shows the effect of lowered expression on both BRET assay window, as well as observed compound potency (EC50) for a drug tracer binding to NanoLuc-Histamine HI receptor. -
Figure 4 shows graphs demonstrating the requirement of the cellular milieu for pro-drug processing. -
Figure 5 shows graphs demonstrating the ability to use permeabilization agents to potentiate the entry of impermeable drug tracers. -
Figure 6 shows a graph depicting competitive displacement of fluorophore-tethered BIRB-derivative from NANOLUC-fused p38. -
Figure 7 shows graphs depicting measurement of the kinetics of fluorophore-tethered BIRB derivative from NANOLUC-fused p38. -
Figure 8 shows exemplary fluorophore-tethered bioactive agents and other compounds that find use in embodiments described herein. -
Figure 9 shows a comparison of p38 fusions with Renilla luciferase and NanoLuc luciferase within an embodiment described herein. -
Figure 10 shows that high affinity interaction with a drug tracer with optimal signal to background is achieved when expression of the NANOLUC fusion is close to endogenous level. -
Figure 11 shows dose-response curves for NanoLuc-p38alpha binding to a BIRB-TOM conjugate compared to a BIRB-TMR conjugate. -
Figure 12 shows dose-response curves for PKCalpha-NanoLuc binding to a BIM-TOM conjugate compared to a BIM-TMR conjugate. -
Figure 13 shows a graph depicting detection of specific BRET response in live cells. -
Figure 14 shows affinity of PBI-4838 to Jnk2, p38beta, and p38alpha. -
Figure 15 shows affinity of PBI-4838 to Jnk2, p38beta, and p38alpha. -
Figure 16 shows relative affinities of PBI-4966 to wild-type BRD4 versus the mutant BRD4. -
Figure 17 shows structurally-distinct compounds can be identified by competitive displacement of drug tracers using the method of the present invention. -
Figure 18 shows the ability to monitor drug/target interactions using fluorophore drug conjugate in cells. -
Figure 19 shows graphs depicting a specific BRET response in TNT. -
Figure 20 shows graphs depicting measurement of binding of fluorescently-labeled cytokines to NanoLuc-EGFR. Affinities of the therapeutic antibodies, Vectibix, Erbitux and Herceptin, are also demonstrated by competitive displacement of the cytokine. -
Figure 21 contains wavelength scans for a complementary polypeptide (SEQ ID NO: 5) complemented with either a complementary peptide alone (SEQ ID NO: 4) or the complementary peptide (SEQ ID NO: 4) conjugated to TMR demonstrating efficient energy transfer. -
Figure 22 contains wavelength scans for NanoLuc fused to HaloTag (NL-HT) and a complementary polypeptide (SEQ ID NO: 6) complemented with a complementary peptide linked to a fluorescent Non-ChloroTOM (NCT) dye (PBI-5074). -
Figure 23 shows a schematic of a tertiary interaction wherein the energy transfer with a complex of a structurally complementary peptide and polypeptide of a bioluminescent protein can also be used to measure interaction of interaction partners. In the schematic, a GPCR (first interaction partner) fused to a complementary polypeptide of a bioluminescent protein and a GPCR interacting protein (second interaction partner) fused to a complementary peptide of a bioluminescent protein form a bioluminescent complex when they interact (to form an interaction complex)t. This allows measurement of the binary interaction. If a small molecule GPCR ligand bearing a fluorescent moiety for energy transfer interacts with this system, energy transfer occurs. Therefore, the binary protein-protein interaction and the ternary drug-protein-protein interaction can be measured in the same experiment. -
Figure 24 shows graphs demonstrating that BRET data between a cellularly expressed fusion of 11S peptide and BRD4 and exogenously added NCT conjugated to BRD4 ligand is dependent upon the presence of PEP-80 (the structural complement to 11S); (A) donor intensity, (B) acceptor intensity. -
Figure 25 shows graphs demonstrating that BRET data between a cellularly expressed fusion of 11S peptide and BRD4 and exogenously added NCT conjugated to iBET is dependent upon the presence of PEP-80 (the structural complement to 11S); (A) 1µM PEP-80, (B) no PEP-80 control. -
Figure 26 shows BRET signals (acceptor and donor intensities) dependent on facilitated 11S-BRD4/114-Histone H3.3 complex. -
Figure 27 shows that a fluorescent BRD4 ligand (iBET-NCT/PBI-4966) can displace the 11S-BRD4/114-Histone H3.3 complex. -
Figure 28 shows non-fluorescent iBET-151 IC50 competitive displacement of the 11S-BRD4/114-Histone H3.3 complex. -
Figure 29 shows that Class I HDACs (HDAC1, 2, 3, and 8) generate specific BRET signals with SAHA-TOM, as predicted based on the reported affinity and selectivity of SAHA to these individual targets. -
Figure 30 shows that Class IIb HDACs (HDAC6 and 10), as well as segregated domains of HDAC6, generate specific BRET with SAHA-TOM, as predicted based on the reported affinity and selectivity of SAHA to these individual targets. -
Figure 31 shows that Class IIa HDACs do not generate significant BRET with SAHA-TOM, as predicted based on the reported selectivity of SAHA to Class I and IIb HDACs. -
Figure 32 shows competitive displacement results of SAHA against individual HDAC-NanoLuc fusions complexed with SAHA-TOM, as determined via BRET. From these concentration response curves, IC-50 values can be calculated, as shown in table next to the graph. -
Figure 33 (left) shows a conversion between IC-50 value and Ki value for individual HDAC-NanoLuc fusions, as determined via BRET. The Cheng-Prusoff equation was used for this conversion.Figure 33 (right) shows a diagram representing relative affinities of SAHA against individual HDAC/NanoLuc fusion proteins, as determined via BRET. -
Figure 34 shows BRET imaging of intracellular HDAC10-NLuc / PBI-4968 +/- SAHA complexes in the presence or absence of SAHA as a specificity control. -
Figure 35 shows BRET imaging of intracellular NLuc-HDAC6 / PBI-4968 +/- SAHA complexes in the presence or absence of SAHA as a specificity control. -
Figure 36 shows dot plot analysis of SAHA binding intracellular SAHA-TOM (PBI-4968) BRET imaging experiments with HDAC10 and HDAC6. - The present invention provides compositions and methods for detection and analysis of intracellular binding of a bioactive agent to a cellular target. In particular, provided herein are bioactive agents tethered to a chromophore, e.g., fluorophores, potential cellular targets fused to bioluminescent reporter proteins and methods of detecting and analyzing the interaction of bioactive agents with cellular targets therewith (See
Figure 1 ). - The interaction of a first entity (e.g., bioactive agent) and a second entity (e.g., cellular target) is detected, characterized, quantified, analyzed, etc. through the detection/measurement of a signal produced by signal transfer (e.g., transfer of energy (e.g., fluorescence, light energy, resonance, by BRET, etc.)) between a third entity (e.g., fluorophore) connected, fused, tethered, linked, etc. to the first entity and a fourth entity (e.g., bioluminescent reporter protein) connected, fused, tethered, linked, etc. to the second entity. The interaction and/or binding of the first and second entities bring the third and fourth entities into close enough proximity to allow signal transfer (e.g., energy transfer) from one to another. In some examples, the fourth entity (e.g., bioluminescent reporter protein) emits energy (e.g., upon interaction with its substrate), and that emitted energy is absorbed by the third entity (e.g., fluorophore), causing the third entity to emit measurably different energy form the fourth entity (e.g., light at a different wavelength). In such examples, detection of the energy emitted from the third entity (e.g., light at the emission maximum of the third entity) upon addition to the system of the substrate for the fourth entity (e.g., bioluminescent reporter) indicates interaction of the first and second entities. In some examples, the duration, kinetics, affinity, strength, and/or specificity, of the binding of the first and second entities is detected, measured, quantified, determined, interrogated, etc. based on measurement of the signal output of the fourth entity (e.g., bioluminescent reporter protein) under various conditions.
- In various examples, a cellular target fused to a bioluminescent reporter protein and a bioactive agent tethered to a chromophore, e.g., fluorophore, are provided (e.g., intracellularly, extracellularly, in lysate, in vitro, etc.). Substrate for the bioluminescent reporter protein is added to the system. If an interaction has occurred (e.g., binding) between the bioactive agent and the cellular target, the bioluminescent reporter protein and chromophore (e.g., fluorophore) are brought into close enough proximity for BRET to occur, and a detectable signal to be emitted from the chromophore (e.g., fluorophore).
- In some examples, a complementary peptide and polypeptide that can interact (e.g., form a complex) to form a bioluminescent reporter protein (or protein complex) are used. In some examples, a complementary peptide is fused to a first interaction partner and a complementary polypeptide is fused to a second interaction partner. In some examples, the first and second interaction partners form a complex (e.g., by binding to each other). In some examples, the first and second interaction partners form an interaction complex when one or both interacts with a bioactive agent. In some examples, the first and second interaction partners form an interaction complex in the presence or absence of a bioactive agent. In some examples, formation of the interaction complex brings the complementary peptide and polypeptide together to form the bioluminescent reporter. In some examples, formation of the bioluminescent reporter allows detection of formation of the interaction complex. In some examples, a fluorophore is tethered to the bioactive agent. In some examples, energy is transferred from the bioluminescent reporter to the fluorophore when the interaction complex is formed and the bioactive agent is bound to one of the interaction partners or the interaction complex. In some examples, the fluorophore allows detection or measurement of the interaction of the first and second interaction partners. In some examples, the fluorophore allows detection or measurement of the binding of the bioactive agent to its binding partner (e.g., the first interaction partner, the second interaction partner, and/or the interaction complex).
- In some examples, a complementary peptide of a bioluminescent reporter is fused to a target of interest. A complementary polypeptide and a bioactive agent tethered to a fluorophore are provided to detect or measure the interaction of the bioactive agent to the target of interest. In some examples, the complementary peptide of a bioluminescent reporter is fused to a target of interest, a complementary polypeptide of the bioluminescent reporter protein and a bioactive agent tethered to a fluorophore is applied to detecting proximity of the fluorescently labeled ligand, e.g., a bioactive agent, to protein complexes (e.g. detecting ligand binding selectively to heterodimeric or homodimeric receptors) by linking members of the complex to components of a multicomponent luminescent donor. This application could be thus used to monitor target engagement within protein complexes that may have a role in disease pathology.
- In some examples, the cellular target and bioluminescent reporter fusion is expressed in cells in which an assay is to be performed. In some examples, the fusion is expressed at or near the native abundance for the cellular target. In some examples, the fluorophore-tethered bioactive agent is added extracellularly (e.g., added to the culture medium) and enters the cell via diffusion, active transport, passive transport, endocytosis, or any suitable mechanism. In some examples, varying amount of fluorophore-tethered bioactive agent is added to the cells to assay binding kinetics, assay binding affinity, provide sufficient signal, etc.
- In certain embodiments, the present invention provides compositions, methods, and systems for detection of intracellular interactions between a bioactive agent and cellular target (e.g., known or unknown). In some embodiments, a fusion of a bioluminescent reporter and a cellular target are expressed within a cell. The bioactive agent, tethered to a fluorophore, is introduced to the cell (e.g., conjugate of fluorophore and bioactive agent is cell permeable, the cell is permeablized, etc.). A substrate for the bioluminescent reporter protein is added to the cell prior, concurrently or subsequent to the addition of the bioactive agent. Detection of a fluorescent signal from the fluorophore (as the result of BRET) indicates an intracellular interaction (e.g., binding) between the bioactive agent and cellular target. In some examples, a cellular target fused to a bioluminescent reporter is expressed at a natural cellular abundance (e.g., relative to the native cellular target, or at a level appropriate for proper biological function of the fused target). In some examples, interaction of a bioactive agent with a cellular target is detected intracellularly.
- In some examples, characteristics of the interaction between the bioactive agent and cellular target are interrogated by altering the cellular conditions or the conditions of the system. For example, a competitive binder of the cellular target (e.g., untethered bioactive agent) is added to the cell to compete with the fluorophore-tethered bioactive agent.
- In some examples, a library of bioluminescent reporter protein-tagged cellular targets is provided (e.g., in solution, in a lysate, immobilized on a surface, expressed within a cell, etc.). In some examples, a bioactive agent is provided which lacks a known cellular target or where knowledge of the cellular target is uncertain or incomplete. The cellular target of a bioactive agent is determined by adding the bioactive agent to the library and determining which cellular-target fusion produces BRET induced fluorescence of the bioactive agent-tethered fluorophore. In some examples, the library of bioluminescent reporter-tagged cellular targets is provided as a collection of nucleic acids or vectors comprising nucleic acids (e.g., plasmids, BacMam viruses, Lentiviruses, etc.) encoding the protein fusions. In some embodiments, bioluminescent reporter protein-tagged cellular targets are expressed within cells. In some examples, the library of bioluminescent reporter-tagged cellular targets is provided by translating nucleic acids in cell-free translation reactions. In some examples, a library of cellular target fusions, or cells expressing cellular target fusions, are provided in a microplate format. In such examples, the interaction of a bioactive agent (e.g., one identified through a phenotypic assay or screen) with the entire library of cellular targets can be interrogated (e.g., in solution, in lysates, intracellularly, etc.) in a high-throughput manner. In some examples, bioluminescent reporter-tagged cellular targets are immobilized on a solid surface to create a protein array. For example, in addition to the bioluminescent reporter, cellular targets are also expressed as fusions with a tag or coupled to a protein (e.g., HALOTAG, Promega) that allows for the proteins to be covalently immobilized on a solid surface (e.g., a surface displaying appropriate ligands (e.g., HALOTAG Ligand)). In certain embodiments, a library of potential bioactive agents (e.g., hit compounds or drug-like small molecules) is added to the system (e.g., array) and any pairs capable of producing BRET are identified. In some examples, cellular targets for all or a portion of a library of bioactive agents are unknown.
- In certain examples, compositions, methods, and systems herein provide a conjugate of a bioactive agent and an energy acceptor (e.g., fluorophore, chromophore). In some examples, a bioactive agent is any small molecule (e.g., > 2000 daltons, >1000 daltons, >500 daltons, etc.), macromolecule, synthetic molecule or molecular complex capable of interacting with the biology of a cell. In some examples, an energy acceptor is an entity capable of generating, exhibiting, and/or emitting a signal (e.g., light, heat, chemical reaction, fluorescence, resonance energy, etc.) when triggered by energy absorption (e.g., resonance energy transfer). In some examples, a bioactive agent and energy acceptor (e.g., fluorophore, chromophore) are fused, tethered, connected, etc., by any suitable structure or mechanism (e.g., expressed as a fusion construct (e.g., with or without peptide linker), chemically linked (e.g., directly or indirectly), enzymatically linked, linked by a linker (e.g., peptide, nucleic acid, polymer, ester linkage, PEG linker, carbon chain, etc.)). In some embodiments, the conjugate of a bioactive agent and an energy acceptor (e.g., bioactive agent tethered to a fluorophore) is produced by non-natural chemical synthesis (e.g., a purposeful execution of chemical reactions not present in natural cells). The type of linkage should not be viewed as limiting.
- As used herein, the term "bioactive agent" refers generally to any physiologically or pharmacologically active substance or a substance suitable for detection. In some examples, a bioactive agent is a potential therapeutic compound (e.g., small molecule, peptide, nucleic acid, etc.), or drug-like molecule. In some examples, the bioactive agent is produced by non-natural chemical synthesis (e.g., a purposeful execution of chemical reactions not present in natural cells). Bioactive agents for use in embodiments described herein are not limited by size or structure.
- In certain embodiments, libraries of bioactive agents (e.g., >10 agents, >50 agents, >100 agents, >500 agents, >1000 agents, >5000 agents, >10,000 agents, >50,000 agents, etc.) are provided. In some embodiments, systems, methods, and compositions are provided for screening libraries of bioactive agents. Also disclosed herein are means of identifying the bioactive agent in a library responsible for producing, eliciting, inducing, etc. phenotypic effect and/or activity. Also disclosed herein are means of identifying the cellular target of a bioactive agent (e.g., a bioactive agent responsible for the phenotypic effect and/or activity).
- As used herein, the term "energy acceptor" refers to any small molecule (e.g., chromophore), macromolecule (e.g., autofluorescent protein, phycobiliproteins, nanoparticle, surface, etc.), or molecular complex that produces a readily detectable signal in response to energy absorption (e.g., resonance energy transfer). In certain examples, an energy acceptor is a fluorophore or other detectable chromophore. Suitable fluorophores include, but are not limited to: xanthene derivatives (e.g., fluorescein, rhodamine, Oregon green, eosin, Texas red, etc.), cyanine derivatives (e.g., cyanine, indocarbocyanine, oxacarbocyanine, thiacarbocyanine, merocyanine, etc.), naphthalene derivatives (e.g., dansyl and prodan derivatives), oxadiazole derivatives (e.g., pyridyloxazole, nitrobenzoxadiazole, benzoxadiazole, etc.), pyrene derivatives (e.g., cascade blue), oxazine derivatives (e.g., Nile red, Nile blue, cresyl violet, oxazine 170, etc.), acridine derivatives (e.g., proflavin, acridine orange, acridine yellow, etc.), arylmethine derivatives (e.g., auramine, crystal violet, malachite green, etc.), tetrapyrrole derivatives (e.g., porphin, phtalocyanine, bilirubin, etc.), CF dye (Biotium), BODIPY (Invitrogen), ALEXA FLuoR (Invitrogen), DYLIGHT FLUOR (Thermo Scientific, Pierce), ATTO and TRACY (Sigma Aldrich), FluoProbes (Interchim), DY and MEGASTOKES (Dyomics), SULFO CY dyes (CYANDYE, LLC), SETAU AND SQUARE DYES (SETA BioMedicals), QUASAR and CAL FLUOR dyes (Biosearch Technologies), SURELIGHT DYES (APC, RPE, PerCP, Phycobilisomes)(Columbia Biosciences), APC, APCXL, RPE, BPE (Phyco-Biotech), autofluorescent proteins (e.g., YFP, RFP, mCherry, mKate), quantum dot nanocrystals, etc. In some embodiments, a fluorophore is a rhodamine analog (e.g., carboxy rhodamine analog), such as those described in
WO2013/078244 . Some such fluorophores are described herein in Example 8. In some examples, BRET efficiency is significantly enhanced by the technical features of rhodamine analog (e.g., carboxy rhodamine analog) as an energy acceptor compared to other fluorophores. For example, the left shifted EC50 and reduced nonspecific background of these dyes is advantageous for use in some embodiments. - As used herein, the terms "TOM" and "NonChloroTOM" (or "NCT") refer to the same type of fluorophore and are used interchangeably throughout the application.
- In certain examples, compositions, methods, and systems herein provide a fusion of a cellular target and a bioluminescent reporter protein (e.g., luciferase). In some examples, a cellular target and bioluminescent reporter protein are fused, tethered, connected, etc. by any suitable structure or mechanism (e.g., expressed as a fusion construct (e.g., with or without peptide linker), chemically linked (e.g., through covalent or non-covalent bonds), enzymatically linked, linked by a linker (e.g., peptide, nucleic acid, other polymer (e.g., ester linkage, PEG linker, carbon chain, etc.)). In some examples, an amino acid chain (e.g., 3-100 amino acids) is used to connect the cellular target and a bioluminescent reporter protein. In some examples, the structure and/or function of neither the cellular target nor the bioluminescent reporter are impacted (e.g., significantly impacted) by fusion or the presence of the linker. In certain examples, a linker allows fusion without loss of activity or one or both of the elements. In other examples, an amino acid linker properly spaces and/or orients the bioluminescent reported for energy transfer with the fluorophore.
- In some examples, a cellular target comprises any suitable binding/interaction partner (e.g., receptor, enzyme, protein complex) for a bioactive agent (e.g., small molecule, protein, nucleic acid, lipid, etc.). However, in some examples, knowledge of the interaction between a cellular target and bioactive agent is not required to practice the invention. In particular examples, a cellular target is a protein or protein complex that binds to or otherwise interacts with (e.g., has a binding affinity to) a bioactive agent. In more particular examples, a cellular target is a receptor protein or an enzyme that binds to or otherwise interacts with (e.g., has a binding affinity to) a small molecule bioactive agent. The present disclosure is not limited by the identity, type, or class of cellular targets. In certain examples, libraries of hundreds, thousands, tens of thousands, more different cellular targets find use in the present invention. Examples of cellular targets may include nucleic acids (e.g., DNA or RNA), polysaccaharides or a complex comprising any of these with polypeptides. In some embodiments, a cellular target is a G-protein coupled receptor or a protein kinase.
- In certain embodiments, the bioluminescent reporter is a luciferase. In some embodiments, a luciferase is selected from those found in Gaussia, Coleoptera, (e.g., fireflies), Renilla, Vargula, Oplophorus, Aequoria, mutants thereof, portions thereof, variants thereof, and any other luciferase enzymes suitable for the systems and methods described herein. In some embodiments, the bioluminescent reporter protein is a modified, enhanced luciferase enzyme from Oplophorus (e.g., NANOLUC enzyme from Promega Corporation, SEQ ID NO: 1, or a sequence with at least 70% identity (e.g., >70%, >80%, >90%, >95%) thereto). In some embodiments, the bioluminescent reporter protein is a thermostable Photuris pennsylvanica luciferase or a sequence with at least 70% identity (e.g., >70%, >80%, >90%, >95%) thereto). Exemplary bioluminescent reporters are described, for example, in
U.S. Pat. App. No. 2010/0281552 andU.S. Pat. App. No. 2012/0174242 . - In some embodiments, the bioluminescent reporter protein comprises NANOLUC (See
U.S. Pat. App. Nos. 2010/0281552 and2012/0174242 ). In some embodiments, the bioluminescent reporter protein comprises a polypeptide with at least 70% identity (e.g., >70%, >80%, >90%, >95%) to SEQ ID NO: 1 that retains bioluminescent characteristics. In certain examples, the use of the NANOLUC enzyme, or a variant thereof, provides features (e.g., signal intensity, brightness, high light output, narrow spectrum, etc.) that enable the use of the BRET assays described herein. In some examples, the high light output of NANOLUC enables the low concentration (e.g., <1 µM, <100 nM, <10 nm, <1 nm, etc.) of assay components, e.g., DNA encoding NANOLUC, useful to carry out assays under physiologically relevant conditions. In some examples, NANOLUC enables the use of BRET in characterizing cellular targets identified in a phenotypic screen. - In some examples, a substrate for the bioluminescent reporter protein is provided. In some examples, the bioluminescent reporter protein converts the substrate into a reaction product and releases light energy as a by-product. In some examples, the substrate is a substrate for a luciferase enzyme. In some examples, the substrate is a structural variant or derivative of coelenterazine (e.g., furimazine). In some examples, the substrate is a substrate for a modified, enhanced luciferase enzyme from Oplophorus, e.g., NANOLUC enzyme from Promega Corporation (e.g., SEQ ID NO: 1). In some examples, a pro-substrate for the bioluminescent reporter protein is provided, which produces a substrate through a chemical or physical process (e.g., hydrolysis, enzymatic reaction, photo-cleavage, etc.). In some examples, the pro-substrate comprises coelenterazine, a coelenterazine derivative, a structural or functional equivalent of coelenterazine, a molecule substantially equivalent to coelenterazine (e.g., structurally and/or functionally), or molecule functionally or structurally similar to coelenterazine. In some examples, the bioluminescent reporter protein converts the coelenterazine, coelenterazine derivative, structural or functional equivalent of coelenterazine, or substantial equivalent to coelenterazine into coelenteramide, a coelenteramide derivative, a structural or functional equivalent of coelenteramide, or a substantial equivalent to coelenteramide and releases light energy as a by-product.
- In some embodiments, fluorophore and bioluminescent reporter are selected that exhibit sufficient overlap of emission (e.g., of bioluminescent reporter) and excitation (e.g., of fluorophore) spectra to provide efficient energy transfer between the two (e.g., by non-radiative dipole-dipole coupling). In some examples, the peak emission of the bioluminescent reporter is substantially separated from the peak emission of the fluorophore, for example by at least 80 nm, 100 nm, 120 nm, 140 nm, etc., in wavelength. In particular examples, the Forster distance of the fluorophore and bioluminescent reporter pair is small (e.g., <20 nm, <10 nm, <5 nm, <3 nm, etc.). In such examples, the short Forster distance results in the requirement that the fluorophore and bioluminescent reporter must be brought into very close proximity for energy transfer to occur. Therefore, the short Forster distance reduces aberrant and/or background signal (e.g., created by diffusing fluorophore and/or reporter).
- In certain examples, a fluorophore and bioluminescent reporter pair are selected that are sufficiently bright to allow detection of the transferred signal at a native abundance (or near native abundance) of the protein of interest and/or the cellular target fused to the bioluminescent reporter. In some examples, should either the selected fluorophore or bioluminescent reporter produce insufficient energy (light) emission, either the fusion of the cellular target and bioluminescent reporter will need to be overexpressed (e.g., beyond native abundance, beyond a biologically relevant level, etc.), and/or the amount of fluorophore-tethered bioactive agent will have to be increased (e.g., to a potentially toxic level, beyond a physiologically relevant level, above the amount when kinetic experiments can be performed, etc.). In some examples, sufficient brightness of the bioluminescent reporter and fluorophore allows detection of bioactive agent and cellular target interaction at a range of concentrations and ratios.
- In some examples, compositions, methods, and systems are provided for identification of the cellular targets of hit compounds emerging from a phenotypic assay or phenotypic screen. In some examples, following identification of bioactive agents capable of eliciting a phenotype, "hit compounds" tethered to fluorophores are used to identify cellular targets, through their linkage to a bioluminescence reporter protein (e.g., binding of bioactive agent to cellular target results in BRET between bioluminescence reporter protein and fluorophore). In such examples, although a phenotype has been associated with a particular bioactive agent, the interaction partner (e.g., cellular target) for that bioactive agent in unknown or is uncertain. In some examples, a bioactive agent tethered to a fluorophore is able to regenerate a phenotype, thereby validating that tethering the bioactive agent to the fluorophore (or the cellular target to the bioluminescent reporter) does not affect the cellular binding patterns and/or disrupt its biological activity. In some examples, the use of a library of cellular targets, each fused to bioluminescent reporter protein (e.g., NANOLUC), provides less interference due to poor solubility or low native abundance of the cellular target compared to other detection methods (e.g., mass spectrometry analysis). In some examples, such a detection method provides a greater degree of sensitivity or specificity. In some examples, target identification through linkage to a bioluminescence reporter protein enables detection through energy transfer, even when binding of the target is inefficient or incomplete. In some embodiments, binding of a bioactive agent (e.g., small molecule) to a cellular target is characterized using a competitive binding assay (SEE
Figure 1C and ID). In some examples, BRET allows for analysis of the hit compound's binding affinity in live cells using competitive displacement of a fluorescent tracer (e.g., fluorophore) that binds to the same site on the cellular target. In some examples, systems and methods described herein provide the ability to use two distinct methods for target identification, thus providing higher stringency for identifying cellular targets, complementary methods addressing limitations with other approaches (e.g., BRET provides the advantage of maintaining the bioactive agent in equilibrium with the target throughout the experiment). - Some embodiments described herein find use in drug discovery, drug validation, drug target discovery, or drug target validation. In certain examples, the binding interaction between a bioactive agent (e.g., drug-like small molecule) and a cellular target can be detected, validated, and/or characterized. In some examples, the relative binding affinity of bioactive agents for a cellular target (e.g., in solution, in a lysate, on a surface, in a cell, etc.), can be determined by their ability to displace a bioactive agent that has been tethered to a fluorophore. Specifically, higher binding affinity of a first bioactive agent relative to a second bioactive agent is indicated by requiring a lower concentration of the first bioactive agent to displace a tethered bioactive agent relative to the second bioactive agent. Displacement of the tethered bioactive agent is determined by the loss or reduction of energy transfer from the bioluminescent reporter protein fused to a cellular target. In some examples, the concentration of bioactive agent needed to displace a tethered bioactive agent is used to estimate the binding EC50 or the inhibition constant (Ki) for bioactive agent. In some examples, the development of new or modified bioactive agents is guided by their ability to displace one or more bioactive agents, each tethered to a fluorophore, from one or more cellular targets, each fused to a bioluminescent reporter protein.
- In some examples, a collection of compounds which may have unknown binding affinity to a cellular target may be screened for their ability to bind the target fused to a bioluminescent protein by determining their ability to displace a bioactive agent tethered to a fluorophore. In some examples, compounds may be screened for their ability to bind a first cellular target preferentially relative to a second cellular target by their ability to displace a first tethered bioactive agent from the first cellular target relative to a second tethered bioactive agent from the second bioactive target. In some examples, the first and second tethered bioactive agents are the same.
- In some examples, systems and methods described herein provide the ability to determine the affinity of a bioactive agent (e.g., hit compound, research lead, lead compound, etc.) for wild-type and mutant version(s) of a cellular target, e.g., target protein. In some examples, characterization of the affinity and selectivity of the fluorescently-labeled bioactive agent (e.g., drug) to a disease-relevant mutant protein may be performed in cells. Such systems and methods may be useful to identify bioactive agent(s) (e.g., drug) that selectively bind a wild-type or mutant protein differentially.
- In addition to primary targets, intended targets, and/or known targets, bioactive agents (e.g., hit compounds) may also bind to unexpected and/or unintended cellular targets (off targets). In some cases, off target binding of a bioactive agent is responsible for a portion of the therapeutic and/or adverse effects associated with administration of the bioactive agent. In some examples, systems and methods described herein provide the ability to identify off targets of a bioactive agent. Understanding the identity and extent of off-target bioactive agent binding provides valuable information regarding the pharmacology of the agent.
- In some examples, systems and methods described herein provide the ability to estimate the binding characteristics of a bioactive agent tethered with a fluorophore to a cellular target fused to a bioluminescent reporter (e.g., EC50, Kd, binding rate, environmental influences, etc.) In some examples, the binding characteristics are correlated to biochemical, physical, or phenotypic characteristics related to the cellular target. In some examples, the kinetic profile of the formation or dissolution of the BRET complex can be used to infer association or dissociation rates of untethered bioactive agents. In some examples, these association/dissociation rates can be used to estimate drug residence times for individual targets within intact cells. In some examples, systems and methods are useful in thermodynamic molecular mechanism of action (MMOA) studies on entropic vs. enthalpic interactions. In some examples, displacement of the tethered bioactive agent by a separate agent may occur through separate sites on the cellular target. In some examples, the binding characteristics of the tethered bioactive agent may be used to determine the influence of post-translational modification (e.g., cleavage, phosphorylation, methylation, acetylation, lipidation, etc.), intracellular translocation (e.g., movement to a nucleus, mitochondria, membrane, etc.), or protein interaction (e.g., interactions with other proteins, nucleic acids, lipids, etc.) on the cellular target. An example is determining the binding characteristics of an antibody to a cellular target by its influence on the binding characteristics of the tethered bioactive agent. In some examples, the binding characteristics of the tethered bioactive agent may be used to determine the influence of chemical modifications or transformation of the bioactive agent or the tethered fluorophore (e.g., intracellular metabolism, change in ionic state, etc.).
- In some examples, the cellular target may comprise more than one molecular component. For example, the target may comprise more than one polypeptide, and may further comprise other natural or synthetic molecules (e.g., prosthetic groups, cofactors, metabolites, nucleic acids, lipids, carbohydrates, etc.). In some examples, a bioactive agent tethered to a fluorophore binds to a first molecular component, and a bioluminescent reporter is fused to a second molecular component, so that a signal from the tethered bioactive agent is produced when bound to the first molecular component and the first molecular component is in close proximity to the second molecular component.
- A priori knowledge of the existence of an interaction between a bioactive agent and cellular target is not needed to practice the invention. In some examples, detection and/or characterization of an unknown or previously unidentified interaction by energy transfer is provided. Advantages of the systems, compositions, and methods described herein, over other methods of target discovery may include: a broad range of possible bioactive agent concentrations because (in some examples) it need not be expressed within cells (e.g., allows for addition of enough acceptor fluorophore to generate detectable signal), natural protein concentration of cellular target (e.g., no need for overexpression to gain enough signal for detection), signal detectable on a plate reader (e.g., high throughput detection, no imaging necessary), detection of interactions within a cell, etc.
- In some examples, bioactive agents (e.g., hit compounds) are conjugated to a fluorescent energy acceptor dye, and therefore the binding of the modified agent to its luciferase-fused (e.g., NANOLUC-fused) cellular target results in energy transfer from NANOLUC to the acceptor dye. Such a system provides a homogenous assay that can be performed in living cells. In some examples, the labeled bioactive agent remains in equilibrium with the cellular target throughout the experiment allowing detection of targets that interact with the hit compounds with low affinity. In some examples, BRET enables measurements of binding affinity in living cells by the competitive displacement of a fluorescent tracer designed for the same binding site.
- In some examples, BRET efficiency is significantly enhanced by the technical features of NANOLUC as an energy donor compared to other luciferases. For example, NANOLUC is significantly brighter than other luciferases commonly used for BRET, thereby allowing energy transfer to be quantitated at lower expression levels which are more suitable for maintaining relevant biology within a cell. In some examples, the narrow emission spectrum of NANOLUC increases the dynamic range by reducing spectral cross-over in the acceptor channel. In some examples, the dynamic range can be further increased by using long-wavelength acceptors that emit in the near-red region of the spectrum (600 to 650 nm). In some examples, evaluation of multiple dye ligands during development of embodiments of the present invention revealed that rhodamine analogs (e.g., carboxy rhodamine analog), such as those described in
WO2013/078244 , delivers an optimal dynamic range for use with NANOLUC and/or in the BRET applications described herein. - Experiments were conducted during development of embodiments of the present invention to demonstrate the improved performance of PBI tracer conjugates and compared to conjugates with standard dyes for drug tracer applications. In this example, conjugates of suberoylanilide hydroxamic acid (SAHA), an inhibitor of histone deacetylase 6 (HDAC6), and a PBI dye (SAHA-TOM (PBI-4968); See
Figure 8 ) or standard dye (SAHA-TAMRA (PBI-4967); SeeFigure 8 ) were utilized in an intracellular BRET assay using a NanoLuc-HDAC fusion protein (SEQ ID NO: 3). - HEK293 cells were transfected using FuGene HD (Promega Corp.) with plasmid DNA encoding a NanoLuc-HDAC6 fusion protein. NanoLuc-HDAC6 DNA was diluted 1:1000 with a promoterless carrier DNA (pGEM3Z) to yield a final concentration of 50ng/well total DNA in 96-well plate format (at a seeding density of 20,000 cells/well). Twenty-four hours post-transfection, cells were then incubated with serially-diluted tracer in the presence or absence of a molar excess of unlabeled SAHA (as a specificity control). Following equilibration with the drug tracers, furimazine (a coelenterazine derivative substrate for NanoLuc; Promega Corp.) was added at a concentration of 20uM, and BRET was quantified on a Varioskan luminometer. The specific BRET signal was calculated by subtracting the non-specific signal (in the presence of unlabeled SAHA) from the signal generated from the SAHA tracer alone.
- Results in
Figure 2 demonstrate that the SAHA-TOM (PBI-4968) conjugate/tracer generated a superior, specific BRET signal compared to SAHA-TMR (PBI-4967) and also generated a left-shifted EC50 value for binding within living cells. As a drug conjugate for BRET applications, the benefit of the PBI-4968 TOM dye over other commonly used fluorophores can be applied to competitive binding assays or target identification (chemical proteomics) screening using NANOLUC fusion protein libraries. - While this example demonstrates the binding of a drug tracer to a known high-affinity target, in other embodiments such a tracer is combined with a library of NANOLUC fusion proteins to profile relative drug affinities and specificities across target families. In such examples, profiling efforts aide in identification of drugs with promiscuous binding profiles, which may correlate with undesirable drug side effects in vivo.
- Experiments were conducted during development of embodiments of the present invention to demonstrate the unexpected benefit of low expression levels of NanoLuc for BRET applications.
- A) HEK293 cells were transfected using Fugene HD with varying amounts of NanoLuc-HDAC6 DNA and seeded in a 96-well plate format. For the transfection, NanoLuc-HDAC6 DNA was diluted with promoterless carrier DNA (pGEM3Z). The final DNA concentration/well remained 50ng/well; however the NanoLuc-HDAC6 DNA was diluted 1:10, 1:100, and 1:1000 (at a seeding density of 20,000 cells/well in 96-well format). Twenty-four hours post-transfection, cells were treated with serially-diluted SAHA in the presence of a fixed concentration (1uM) of SAHA-TOM (PBI-4968; See
Figure 8 ) conjugate. After two hours of incubation, furimazine was added to 20uM, and BRET detected on a Varioskan luminometer. The results inFigure 3 demonstrate that an unexpectedly high dilution of DNA encoding the NanoLuc fusion was required to achieve proper signal to background for BRET applications. - B) DNA encoding a NanoLuc-Histamine HI (GPCR) fusion protein was transfected into HEK293 cells using varying amounts of DNA ranging from undiluted to 1:10,000 (diluted with promoterless carrier DNA (pGEM3Z as described above) to maintain a constant amount of DNA/transfection as described above). Twenty-four hours post-transfection, cells were treated with serially-diluted with mepyramine-bodipy-633 (CellAura) and equilibrated for 2 hours. Cells were then treated with furimazine to a concentration of 20uM, and BRET detected on a Varioskan luminometer.
- The results in
Figure 3B indicate that a large dilution of DNA encoding the NanoLuc fusion was required to generate a high affinity interaction with optimal signal-to-background. The ability to dilute NanoLuc fusion proteins to exceedingly low levels is beneficial in various BRET applications, including competitive binding assays or target identification (chemical proteomics) screening of NanoLuc fusion proteins. - Experiments were conducted during development of embodiments of the present invention to demonstrate the predictive value of intracellular BRET measurement for quantifying the binding of pro-drugs compared to traditional biochemical (activity-based) formats. The example includes the natural pro-drug, FK228, which requires the reducing environment of the cell cytoplasm to become activated and capable of binding to HDAC6.
- HEK293 cells were transfected with DNA encoding NanoLuc-HDAC6 at a 1:1000 dilution with carrier DNA as previously described. Twenty-four hours post-transfection, cells were incubated with serially-diluted natural pro-drug, FK-228; in the presence of a fixed concentration (1uM) of SAHA-TOM (PBI-4968) conjugate. For comparison, a biochemical, activity-based HDAC6 assay was run in parallel. Briefly, a 3-fold serial dilution of FK-228 (Selleckchem catalog # S3020) was performed at 100X in 100% DMSO in wells of a 96-well plate. A 5 µL aliquot of this 100X/100% DMSO titration series was added to 245 µL of HDAC-Glo™ I/II assay buffer alone (Promega Corp.) or 245 µL of HDAC-Glo™ I/II assay buffer supplemented with 2X (0.5mM) DTT to make a 2X/2% DMSO master intermediate titration series of FK-228 in wells of a 96-well plate. From this master intermediate titration series, 5 µL replicates were transferred to wells of a white 384-well assay plate (Corning 3673). A 5 µL addition of 2X (2nM) HDAC 6 (BPS Bioscience catalog # 50006) was added to all wells for a final concentration of InM HDAC6/well. The 10µL enzyme/inhibitor mixes was allowed to pre-incubate for 45 minutes at room temperature. An equal volume (10 µL) of HDAC-Glo™ I/II Final Detection Reagent (Promega Corp.) was added to all wells (20 µL final assay volume), and luminescence was measured after a10 minute incubation at room temperature. For all test conditions, the final concentration of HDAC-Glo™ I/II substrate was 50 µM. The data was plotted (sigmoidal dose response - variable slope) using Prism™ software from GraphPad (no DTT: closed circles; 0.25 mM DTT: open squares).
- The results in
Figures 4A and 4B indicate the requirement of the cellular milieu for measuring binding of pro-drugs that must be processed by the cell to become activated. - Experiments were conducted during development of embodiments of the present invention to demonstrate the use of permeabilization agents to introduce impermeable drug tracers to cells.
- HEK293 cells were transfected with DNA encoding PKCalpha (PKCa)-NanoLuc or NanoLuc-PKCalpha at a 1:1000 dilution of DNA with promoterless carrier DNA as described previously. Twenty-four hours post-transfection, cells were treated with or without digitonin to a final concentration of 50ug/mL. Cells were then treated with serially-diluted a staurosporine-PBI-dye conjugate (PBI-5129; See
Figure 8 ). Cells were co-incubated in the presence or absence of 5uM unconjugated staurosporine as a specificity control for binding. Following two hours of equilibration with a tracer, furimazine was added to a final concentration of 20uM, and BRET ratios were measured on a Varioskan luminometer (Figures 5A and 5B ). - In a second experiment, identically-transfected PKCa-NanoLuc cells were treated with serially diluted digitonin prior to treatment with a fixed concentration of staurosporine-TOM (PBI-5129; See
Figure 8 ) tracer (5uM final concentration) in the presence or absence of 5uM unlabeled staurosporine (specificity control) (Figures 5C ). -
Figure 5A-C demonstrate the ability to use permeabilization agent to potentiate the entry of impermeable drug tracers and applied to BRET-based chemical proteomics screens of NanoLuc™ fusion protein libraries. - Experiments were conducted during development of embodiments of the present invention to demonstrate the use of NanoLuc/BRET to measure relative drug affinities in living cells. In some examples, similar experiments are configured to optimize leads from high-throughput chemical screens.
- HEK293 cells were transfected with DNA encoding a NanoLuc-p38 fusion protein (to a final concentration of 50ng/well DNA in 96-well format). Twenty-four hours post-transfection, cells were treated with serially diluted BIRB-796 or PBI-4835 in the presence of 0.5uM PBI-4838 (BIRB conjugate derivative; see, e.g.,
WO2013/078244 .
-
Figure 6 demonstrates that the dose-response BRET curves support the higher known affinity of BIRB-796 over PBI-4835 ("BIRB Derivative"). The ability to measure the relative affinities of unlabeled drugs can be applied to HTS screens, lead optimization or chemical proteomics applications. In some embodiments, similar experiments are configured to characterize optimized hit compounds from high-throughput chemical screens (e.g., compounds with lower IC50 values for tracer displacement would indicate higher binding efficiency to the target of interest). - Experiments were conducted during development of embodiments of the present invention to demonstrate the use of NanoLuc/BRET to monitor the kinetics of drug binding in living cells. In some examples, similar experiments are configured to optimize leads from high-throughput chemical screens.
- HEK293 cells were transfected with DNA encoding a NanoLuc-p38 fusion (to a final concentration of 50ng/well DNA in 96-well format). Twenty-four hours post-transfection, cells were pretreated for 2 hours with protected furimazine (PBI-4378; See
Figure 8 ) to a final concentration of 20uM. BRET was measured over time on a Varioskan luminometer set to 37°C. After a short pre-read, cells were stimulated with varying concentrations of PBI-4838 (in the presence or absence of 1uM BIRB796 as a specificity control). Dose and time-dependent increases in BRET were then monitored kinetically over 4 hours. - In a separate experiment, transfected cells were pretreated with both 20uM PBI-4377 and 1uM PBI-4838 to generate a steady BRET signal.

- The results in
Figure 7A-B support use of BRET for kinetic measurements of target engagement in living cells. Such formats can be exploited for HTS or chemical proteomics screening of NanoLuc fusion proteins in live cells. In some examples, similar experiments are configured to characterize optimized lead compounds from high-throughput chemical screens (e.g., compounds with altered kinetics of association or dissociation to the target of interest). In addition to providing a measure of relative compound affinities, such kinetic BRET measurements could enable quantitative assessments of target residence time biochemically or within intact cells - The following example relates to the use of specific NANOLUC substrates (SEE
FIG. 8 ) or enzyme components to discriminate the subcellular localization of a drug binding event using BRET. - The physical separation of complementary NANOLUC enzyme polypeptides or peptide allows the isolation of NANOLUC (donor) signal to the extracellular space. For example, the small signal peptide is genetically tethered to a cell surface receptor. Upon exogenous addition of the large signal polypeptide to the cell medium, the donor signal is isolated to the extracellular space. This signal isolation increases the signal/background generated in various BRET applications including drug tracer binding/displacement.
- In some examples, full length NANOLUC protein fusions are utilized if impermeable NANOLUC substrate is applied.
- The following provides synthesis schemes for exemplary compounds that find use in embodiments of the present invention.
- 7-Trityloxycarbamoyl heptanoic acid (200 mg, 463 umol) was combined with 4-[(N-Boc)aminomethyl]aniline (113 mg, 510 umol), HBTU (352 mg, 927 umol) and triethylamine (194 uL, 1.4 mmol) in 3 mL of DMF. The reaction was stirred overnight, then adsorbed onto Celite, and the product was obtained by column chromatography eluting with a gradient of 0->100% EtOAc in heptanes. Calcd for M+H: 635.3; found 635.9
- Suberoyl(4-[(N-Boc)aminomethyl]anilide) hydroxamic acid (286 mg, 450 mmol) was dissolved in 2 mL of DCM to which was added 0.25 mL of TIS. Trifluoroacetic acid (0.9 mL) was then added, and the reaction was stirred for 30 min. Solvents were removed under reduced pressure, and the crude reaction product could be purified by preparative HPLC or used without further purification.
-

- Suberoyl[4-(aminomethyl)anilide] hydroxamic acid crude reaction product (27 mg) was combined with 4 mg (7.6 umol) of tetramethylrhodamine6-succinimidyl ester in 1 mL of DMF with 5 drops of TEA. After 30 min, the reaction was diluted with H2O and MeCN, and the product was isolated by preparative HPLC (5->60% MeCN in 0.1% aqueous TFA). Lyophilization of the appropriate fractions yielded the desired product as a magenta solid. Calcd for H+H: 706.3; found 706.6.
-

- Suberoyl[4-(aminomethyl)anilide] hydroxamic acid crude reaction product (8 mg) was combined with 5 mg (7.6 umol) of TOM 6-succinimidyl ester in 0.8 mL of DMF with 3 drops of TEA. After 30 min, the reaction was diluted with H2O and MeCN, and the product was isolated by preparative HPLC (5->60% MeCN in 0.1% aqueous TFA). Lyophilization of the appropriate fractions yielded the desired product. Calcd for M+H: 838.4; found 838.7
- Staurosporine p-nitrophenylcarbamate (3 mg, 4.8 umol) was dissolved in 0.5 mL of DMF and treated with excess cadaverine. The reaction was warmed in a 70°C oil bath for 2 h, then diluted with H2O, acidified with formic acid, and subjected to preparative HPLC eluting with 25%->75% MeCN in 10 mM aqueous NH4OAc. The appropriate fractions were lyophilized to afford a slightly yellow solid. Calcd for M+H: 595.3; found 595.5
-

- Staurosporine 5-aminopentylcarboxamide (5 mg, 8.4 umol) was dissolved in 1 mL DMF and treated with triethylamine and TOM 6-SE (4 mg, 6 umol). The reaction was monitored by analytical HPLC. Upon completion of the reaction, MeCN and H2O were added, and the TEA was neutralized by addition of a small amount of AcOH. Preparative HPLC (25%->100% MeOH in 10 mM NH4OAc) and subsequent concentration yielded 1.8 mg of a dark blue solid. Calcd for M+H: 1139.5; found 1139.8.
-

- TOM 6-carboxylic acid (26 mg, 46 umol) was stirred in 1 mL of DMF with 2 equiv of triethylamine and treated with TSTU (17 mg, 56.5 umol, 1.2 equiv), and the reaction was monitored by HPLC. After 40 min, the reaction was added to a solution of cadaverine (94 mg, 0.92 mmol, 20 equiv) in 0.5 mL DMF and stirred for 20 min. The reaction was then neutralized by addition of TFA and diluted with MeCN and water. Preparative HPLC (25->100% MeCN in 0.1 % aqueous TFA) and subsequent lyophilization afforded the desired product as a purple solid. LCMS: Calcd for ((M+2H)/2) 324.4; found 324.3.
-

- Dasatinib (25 mg, 51 umol) was combined with p-nitrophenyl chloroformate (14 mg, 69 umol, 1.36 equiv) and 30 uL TEA in 0.9 mL of 2:1 DMF:THF. The reaction was stirred overnight and then 35 mg additional p-nitrophenyl chloroformate added. After stirring for an additional 24 h, ½ the volume of the reaction was added to a solution of 7 mg (10 umol) of TOM-pentylamine in 0.5 mL of DMF and 30 uL TEA. The reaction was then stirred for 1 h, followed by dilution with MeCN and water and purification by preparative HPLC. Lyophilization afforded the desired product as a purple solid. MS: Calcd for ((M+2H)/2) 580.8; found 581.0.
-

- Purvalanol (10 mg, 23 umol) was stirred in 1 mL of DMF with 20 mg of TEA (198 umol) and treated with 7.7 mg (25.4 umol, 1.1 equiv) of TSTU. After 30 min, the reaction was diluted with Et2O and ½ of the total reaction volume was added to a vial containing 6 mg (9 umol) of TOM (5-aminopentyl)-6-carboxamide. The reaction was stirred for 3 h, and the volatile organics were removed under reduced pressure. The resulting DMF solution was diluted with water and MeCN and acidified with TFA, then the product was isolated by preparative HPLC (25->100% MeCN in 0.1% aqueous TFA) and subsequent lyophilization to yield 3.5 mg of a purple solid. MS: Calcd for M+H: 1061.5, found 1061.6.
- HEK293 cells were transfected with plasmid DNA encoding NanoLuc-p38alpha or Renilla Luc-p38alpha using Fugene HD(Promega Corporation) at a 3:1 lipid:DNA ratio and seeded into 96-well plates at a density of 20,000 cells per well (to yield 50ng/well of DNA). 24h post-transfection, cell medium was replaced with serum-free medium (Opti-MEM) and incubated with serially-diluted PBI-4838 (BIRB796 derivative conjugated to TOM dye) in the presence/absence of BIRB796 at 1uM. Cells were incubated at 37°C for two hours. To the NanoLuc-expressing samples, furimazine was added to a final concentration of 20uM. To the Renilla Luc-expressing samples, native coelenterazine was added to a final concentration of 20uM. BRET was then measured on a Varioskan luminometer equipped with 450nm bandpass and 630nm longpass filters. The BRET ratio was determined by dividing the signal in the 630 channel by the signal in the 450 channel.
-
Figure 9 demonstrates that both Renilla luciferase and NanoLuc luciferase can be used in the method of the present invention. Upon treatment of cells expressing NanoLuc-p38alpha or Renilla Luc-p38alpha with serially-diluted PBI-4838, a dose-dependent increase in BRET is observed. Saturating concentrations of unlabeled BIRB-796 are able to block this BRET signal, indicating specificity of binding using either luciferase fusion to p38alpha. - As described above, HEK293 cells were transfected with plasmid DNA encoding NanoLuc-p38alpha using Fugene HD and seeded into 96-well plates (to yield 50ng/well of DNA). 24h post-transfection, cell medium was replaced with serum-free medium (Opti-MEM) and incubated with serially-diluted PBI-4838 (BIRB796 derivative conjugated to TOM dye) or PBI-4836 (BIRB derivative conjugated to TMR dye) in the presence/absence of BIRB796 at 1uM. Cells were incubated at 37°C for two hours. To the NanoLuc-expressing samples, furimazine was added to a final concentration of 20uM. BRET was then measured on a Varioskan luminometer equipped with 450nm bandpass and 630nm longpass filters. The BRET ratio was determined by dividing the signal in the 630 channel by the signal in the 450 channel.
-
Figure 11 demonstrates another example of the increased potency of the TOM adduct over the TMR adduct for binding to a target protein in a cell-based format. Dose-response curves for NanoLuc-p38alpha binding indicate an EC50 of 38nM for the BIRB-TOM conjugate, compared to an EC50 of 450nM for the BIRB-TMR conjugate. The reported affinity of BIRB-TOM is more consistent with literature reports compared to the BIRB-TMR (Chem Biol Drug Des 2009; 74: 547-559). - As described above, HEK293 cells were transfected with plasmid DNA encoding PKCalpha-NanoLuc (diluted 1:1000 into pGEM3Z carrier DNA) using Fugene HD and seeded into 96-well plates (to yield 50ng/well of total DNA). 24h post-transfection, cell medium was replaced with serum-free medium (Opti-MEM) and incubated with serially-diluted PBI-5075 (BIM conjugated to TOM dye) or PBI-5051 (BIM conjugated to TMR dye) in the presence/absence of staurosporine at 5uM. Cells were incubated at 37°C for two hours. To the NanoLuc-expressing samples, furimazine was added to a final concentration of 20uM. BRET was then measured on a Varioskan luminometer equipped with 450nm bandpass and 630nm longpass filters. The BRET ratio was determined by dividing the signal in the 630 channel by the signal in the 450 channel. To determine specific BRET signals, the BRET ratio at each concentration of tracer + unlabeled staurosporine was subtracted from the BRET ratio at each concentration of tracer without unlabeled staurosporine.
-
Figure 12 demonstrates another example of the increased potency of the TOM adduct over the TMR adduct for binding to a target protein in a permeabilized cell format. Dose-response curves for PKCalpha-NanoLuc binding indicate an EC50 of 483nM for the BIM-TOM conjugate, compared to dramatically right-shifted potency for the BIM-TMR conjugate. The reported affinity of BIM-TOM is more consistent with literature reports compared to the BIM-TMR (J Biol Chem. 1991 .). - The following example serves to demonstrate the ability to profile the selectivity of a drug tracer against a panel of putative targets within a given phylogenetic target family. Similar experimental configurations may be used to identify the target of fluorescently labeled drugs using BRET in cells. This configuration may lead to the identification of the primary drug target, as well as off-target interactors. Engagement of multiple targets may be indicative of drug promiscuity and potential drug side effects. This example serves to demonstrate the ability to measure both primary, as well s secondary target interactions via BRET.
- HEK293 cells were transfected with plasmid DNA encoding N or C-terminal NanoLuc fusions to various members of the MAPK pathway (Jnk1, Jnk2, Jnk3, p38alpha, p38beta, p38gamma, p38 delta, or PKCalpha or
MAPK -
Figure 13 indicates selectivity of PBI-4838 to Jnk2, p38beta and p38alpha, consistent with literature reports. P38alpha is recognized as the primary target of BIRB796. However, interactions with targets such as Jnk2 and p38beta could indicate potential off-target liabilities. As expected, PKCalpha-NanoLuc fusion combined with PBI-4838 showed relatively little specific BRET signal owing to poor affinity of BIRB796 toward this target. - The following example serves to demonstrate the ability to profile the affinity of a drug tracer against a panel of putative targets within a given phylogenetic target family. Similar experimental configurations may be used to characterize the affinity of the fluorescently labeled drug to a given target using BRET in cells.
- HEK293 cells were transfected with plasmid DNA encoding NanoLuc-p38alpha, NanoLuc-p38beta, Jnk2-NanoLuc, PKCalpha-NanoLuc, or NanoLuc-HDAC6 using Fugene HD (Promega Corporation) at a 3:1 lipid:DNA ratio and seeded into 96-well plates at a density of 20,000 cells per well (yield 50ng/well of DNA). Twenty-four hours post-transfection, cell medium was replaced with serum-free medium (Opti-MEM) and incubated with serially-diluted PBI-4838 in the presence or absence of BIRB796 at 4uM. Cells were incubated at 37°C for two hours. To a separate set of samples, transfected cells were treated with serially-diluted BIRB796 in the presence of 1uM PBI-4838. To the NanoLuc-expressing samples, furimazine was added to a final concentration of 20uM. BRET was then measured on a Varioskan luminometer equipped with 450nm bandpass and 630nm longpass filters. The BRET ratio was determined by dividing the signal in the 630 channel by the signal in the 450 channel.
-
Figures 14 and15 demonstrate the apparent affinity of PBI-4838 to Jnk2, p38beta, and p38alpha. As expected, PKCalpha and HDAC6 showed relatively little specific BRET signal owing to poor affinity of PBI-4838 to these targets. Furthermore, the high affinity of BIRB796 toward Jnk2, p38alpha, and p38beta is demonstrated by competitive displacement in cells. Similar experiments could be configured to rank-order the affinity of drug tracers to a given set of targets (by an increase in BRET) or unmodified drugs (by competitive displacement). As indicated above, high-affinity interactions with targets such as Jnk2 and p38beta could indicate potential off-target liabilities. - The following example serves to demonstrate the ability to measure the relative affinity of a drug tracer to a wild-type versus mutant target protein. In this example, the affinity of a fluorescently-labeled iBET compound (small-molecule inhibitor that binds BRD4 preventing its interaction with acetylated histones) was determined for wild-type and mutant version (N140A/N433A; lacks full binding capacity to iBET) of BRD4 (Bromodomain-containing protein 4). Similar experimental configurations may be used to characterize the affinity and selectivity of the fluorescently-labeled drug to a disease-relevant mutant protein in cells. Such experiments may be useful to identify drugs that selectively bind to wild-type or mutant proteins differentially.
- HEK293 cells were transfected with plasmid DNA encoding NanoLuc-BRD4 or NanoLuc-BRD4 (N140A/N433A) using Fugene HD (Promega Corporation) at a 3:1 lipid:DNA ratio and seeded into 96-well plates at a density of 20,000 cells per well (yield 50ng/well of DNA). Twenty-four hours post-transfection, cell medium was replaced with serum-free medium (Opti-MEM) and incubated with serially-diluted PBI-4966 (iBET conjugated to TOM dye) in the presence/absence of iBET at 10uM. Cells were incubated at 37°C for two hours. To the NanoLuc-expressing samples, furimazine was added to a final concentration of 20uM. BRET was then measured on a Varioskan luminometer equipped with 450nm bandpass and 630nm longpass filters. The BRET ratio was determined by dividing the signal in the 630 channel by the signal in the 450 channel.
-
Figure 16 indicates relative affinities of PBI-4966 to wild-type BRD4 versus the mutant BRD4. As expected, a right-shifted potency is observed with the mutant BRD4 indicating a lowered affinity for PBI-4966. Similar experiments could be configured to rank the order of the affinity of drug tracers to disease-relevant mutants of a target. This principle could be expanded to measuring relative affinities of drugs toward wild-type or mutant proteins by competitive tracer displacement. Since increased BRET signal is only indicative of binding to the NanoLuc fusion, this method enables measurements of target engagement amidst a complex mixture of similar antigens present in the assay sample. These antigens could include targets of similar properties, but non-identical to the target of interest (for instance, to discriminate heterologous vs. endogenous analyte or mutant vs. wt. analyte, etc.). - The following example demonstrates that the method of the present invention can be used to screen compound panels to determine target engagement. This screening method could be expanded to larger compound libraries (e.g. LOPAC) as well.
- HEK293 cells were transfected with NanoLuc-HDAC6 DNA using Fugene HD and seeded into wells of a 96-well plate. For the transfection, NanoLuc-HDAC6 DNA was diluted with promoterless carrier DNA (pGEM3Z). The final DNA concentration/well remained 50ng/well; however the NanoLuc-HDAC6 DNA was diluted 1:1000 (at a seeding density of 20,000 cells/well in 96-well format). Twenty-four hours post-transfection, cells were treated with serially-diluted inhibitors (SEE
Figure 17 ) in the presence of a fixed concentration (1uM) of SAHA-TOM conjugate (PBI-4968). After two hours of incubation, furimazine was added to 20uM, and BRET detected on a Varioskan luminometer. - The results in
Figure 17 demonstrate that structurally-distinct compounds can be identified by competitive displacement of drug tracers using the method of the present invention. Furthermore, relative potency of various compound classes can be confirmed. The results indicate little/no binding efficiency of apicidin to HDAC6 compared to high binding efficiency of panabinostat or SAHA to HDAC6. This is consistent with literature reports using orthogonal assay formats. This screening method could be expanded to include high-throughput screening of large chemical libraries to identify/characterize new chemical matter with inhibitory potential against a given target. - It is commonly accepted that a high degree of non-specific BRET occurs in medium containing a luciferase in the presence of a fluorophore of significant spectral overlap (Couturier 2012). This has been described as a liability to using BRET for high-throughput chemical screens. The following example serves to demonstrate the ability to monitor drug/target interactions using fluorophore-drug conjugates in the presence of a luciferase, NanoLuc, in medium at concentration ranges commonly recognized as problematic for BRET.
- HEK293 cells were transfected with plasmid DNA encoding CDK2-NanoLuc (diluted 1:100 into pGEM3Z carrier DNA) using Fugene HD (Promega Corporation) at a 3:1 lipid:DNA ratio and seeded into wells of 96-well plates at a density of 20,000 cells per well (yield 50ng/well of total DNA). Twenty-four hours post-transfection, cell medium was replaced with serum-free medium (Opti-MEM) and incubated with serially-diluted PBI-5077 (purvalanol B conjugated to TOM dye) in the presence/absence of Purvalanol B at 10uM. Cells were incubated at 37°C for two hours.
- To the NanoLuc-expressing samples, furimazine was added to a final concentration of 20uM. BRET was then measured on a Varioskan luminometer equipped with 450nm bandpass and 630nm longpass filters. The BRET ratio was determined by dividing the signal in the 630 channel by the signal in the 450 channel (
Figure 18 ). - This example supports use of fluorophore tracers in medium for monitoring drug/target interactions via BRET. By co-incubating the sample (+ drug tracer) with purvalonol B (unmodified drug), the non-specific BRET signal between the NanoLuc and the tracer can be measured. Over the tracer concentration range tested, this background BRET signal was low. These results demonstrate that specific binding between the drug tracer and the NanoLuc-target fusion can be monitored in cell medium despite significant spectral overlap between the NanoLuc (donor) and fluorophore (acceptor).
- The following example demonstrates the ability to generate NanoLuc fusion arrays using cell-free expression and measure drug binding and relative affinity by BRET.
- A panel of 11 kinases (N- and C- terminal NanoLuc fusions) including putative targets of BIRB796 (such as members of the MAPK and Jnk families), putative targets of Dasatinib (such as Src and LCK) as well as an irrelevant HDAC6 negative control was expressed in TnT® T7 Quick Coupled Reticulocyte Transcription/Translation System (Promega Corporation) as recommended by the manufacturer to create an array with 23 different NanoLuc fusions. Each TNT® reaction was diluted 1:100 in PBS and plated in replicates into wells of 96-well plates. The NanoLuc fusion array was screened with 2 different TOM-drug tracer (BIRB-TOM;PBI-4838 and Dasatinib-TOM; PBI-5170) in the presence and absence of excess relevant free drug. For each TNT® reaction, 4 replicates with 2uM BIRB TOM/4 replicates with 2uM BIRB-TOM +4uM BIRB796 (total of 2x 96-well plates) and 4 replicas with 1uM Dasatinib-TOM/ 4 replicates with 1uM Dasatinib-TOM+5uM Dasatinib (total of 2x 96-well plates) were performed. The reactions were incubated with constant mixing for 2h at room temperature. Following the incubation, furimazine was added to a final concentration of 20uM. BRET was then measured on a Varioskan luminometer equipped with 450nm bandpass and 610nm longpass filters. The BRET ratio was determined by dividing the signal in the 610 channel by the signal in the 450 channel. To determine response ratios, the BRET values with tracer alone were divided by the BRET values with tracer + unmodified.
- The results (
Figure 19 ) demonstrate selectivity of the BIRB-TOM tracer to JNk2, JNk3, MAPK14, MAPK11 and MAPK13 as well as selectivity of the Dasatinib-TOM tracer to ABL1, Src, LCK, MEK5, MAPK11 and MAPK14 consistent with literature reports. These results demonstrate the ability to profile the drug tracer's against a panel of putative targets expressed in cell free expression system and to identify hits. This no wash protein NanoLuc fusion array configuration may lead to the identification of the primary drug target, as well as off-target interactors. - Following the above screen, the BIRB-TOM hits were further analyzed for binding affinity to the BIRB-TOM tracer and competitive displacement of the BIRB TOM Tracer with the BIRB796. Binding affinity experiments to the BIRB-TOM tracer were preformed by incubating 3 replicates of the diluted TNT reactions with serially-diluted BIRB-TOM tracer in the presence/absence of BIRB796 at 10uM. Reactions were incubated at room temperature with constant mixing for two hours and after adding furimazine to a final concentration of 20uM analyzed as described above. Competitive displacement experiments were preformed by incubating 3 replicates of the diluted TNT reactions with serially-diluted BIRB796 in the presence of BIRB-TOM tracer at 2uM. Reactions were incubated at room temperature with constant mixing for two hours and after adding furimazine to a final concentration of 20uM analyzed as described above. The competitive displacement experiments results in
Figure 19 indicates that BIRB796 had highest affinity to MAPK14 and Jnk2 with lower affinity to MAPK11, MAPK13, and Jnk3. Consistent with literature reports, BIRB796 binds efficiently to MAPK14, but also engages other MAPK and Jnk family members indicating off-target liabilities for BIRB-796. These results demonstrate that hits expressed in cell free expression systems and identified in the protein array screen can be further analyzed by BRET for binding affinity to the drug. Furthermore thee results supports the use of cell-free expression systems to generate NanoLuc protein fusions as suitable analytes for target engagement applications. - The following example demonstrates that high affinity interaction with the drug tracer with optimal signal to background is achieved when the expression of the NanoLuc fusion is close to endogenous level. As previously described, it was demonstrated that a 1:1000 dilution of the NanoLuc HDAC6 DNA with a carrier DNA was required to achieve a high affinity interaction. In this example, the expression of serial dilutions of the NanoLuc HDAC6 DNA was compared to the expression of the endogenous HDAC6 using western blot analysis.
- HEK293 cells were seeded into wells of 6-well plates at 2.5x10⁵ cells/well and transfected with PEI with varying amounts of NanoLuc HDAC6 DNA. The NanoLuc HDAC6 DNA was diluted with a non-expressing carrier DNA (pCI neo). The final concentration of DNA remained 2ug/well while the NanoLuc HDAC6 DNA was diluted 1:0, 1:10, 1:100,1:1000 and 1:10000. The control was un-transfected cells. 24 hours post transfection, the media was removed, and cells washed with PBS and lysed for 10 min with 400ul of mammalian lysis buffer (Promega) +1:50 RQ1 DNase (Promega) +1x RQ1 buffer. Following lysis, 133ul of 4X SDS-loading buffer was added to each well, and the cell lysates were collected, analyzed on a SDS-PAGE gel and electro-transferred onto a PVDF membrane (Invitrogen). The membrane was blocked for 1 hour with 5 % BSA (Promega) in TBS buffer and probed overnight at 40C with 1:500 dilution of HDAC6 antibody (Millipore) in TBS supplemented with 0.1% tween (TBST). After 3 x washes in TBST, the membrane was incubated with Anti-Rabbit HRP antibody (Jackson) in TBST for 1 hour, then washed 5 x with TBST and 1 x with TBS. The membrane was then incubated for 1min with the ECL substrate from Promega and scanned on the Image Quant LAS4000 (GE). The results (
Figure 10 ) indicate that dilution of 1:1000 of the NanoLuc HDAC6 DNA results with expression level that is similar to the expression level of endogenous HDAC6. This is the same dilution that provided the high affinity interaction with the drug tracer with optimal signal to background. - Experiments were conducted during development of embodiments of the present invention to demonstrate the ability to measure the relative affinities of therapeutic antibodies against a cell surface receptor by competitive displacement of a fluorescently-labeled cytokine. In this example, commercially-available TAMRA-epidermal growth factor (TMR-EGF; Life Technologies) was applied in a cellular BRET assay using a stable cell line expressing a NanoLuc-EGFR (Her1) fusion protein. The BRET signal generated between TMR-EGF and NanoLuc-EGFR can be inhibited upon treatment with therapeutic antibodies known to interfere with binding of EGF.
- A HEK293 stable cell line was generated by transfection of pF5 NanoLuc-EGFR plasmid DNA (Promega Corp.) and FuGene HD (Promega Corp.). After transfection, the stable cell line was generated by G418 selection, followed by limited dilution cloning. Clonally-derived cells expressing NanoLuc-EGFR were seeded into 96-well plates at a density of 20,000 cells per well. 20 hours after seeding, medium was replaced with serum-free OptiMEM and cells were serum starved. After starvation, cells were treated with serially-diluted TMR-EGF (Life Technologies). Following equilibration with the TMR-EGF, furimazine (a coelenterazine derivative substrate for NanoLuc; Promega Corp.) was added at a concentration of 20uM, and BRET was quantified on a Varioskan luminometer. In subsequent experiments, antibody-mediated displacement of TMR-EGF was measured by pretreating cells with Vectibix, Erbitux, or Herceptin (negative control) prior to stimulation with TMR-EGF (10ng/mL final concentration).
- Results in
Figure 20 demonstrate that the BRET can be used to quantify binding of fluorescent cytokines to cell surface receptors tethered to NanoLuc. Furthermore, the affinities of therapeutic antibodies capable of inhibiting cytokine binding can be measured by competitive displacement of the fluorescent cytokine. Vectibix and Erbitux were capable of inhibiting the binding of TMR-EGF to NanoLuc-EGFR, whereas Herceptin (a Her2 binder with negligible affinity to Her1) was incapable of inhibiting TMR-EGF binding. This example demonstrates that the binding of a fluorescent cytokine to a known high-affinity target can be quantified by BRET, in a format that can be readily reconfigured to monitor binding of therapeutic antibodies (e.g. Vectibix, Erbitux, etc.) or other binders (e.g. cytokine biologics) by competitive displacement of the fluorescent cytokine. This demonstrates the ability to use BRET as a technique to measure the relative potencies of biologic drugs in a cellular format. - In some examples, the present disclosure enables the detection/measurement of three moieties coming together: (1) A peptide of a bioluminescent reporter protein and (2) a polypeptide of a bioluminescent reporter protein which interact through structural complementation to form a complex, and (3) a fluorescent third moiety (e.g., fluorescent small molecule).
- A) This example demonstrates energy transfer from a bioluminescent complex formed from a structurally complementary peptide (SEQ ID NO: 6) and polypeptide (SEQ ID NO: 7), which form a bioluminescent complex. A fluorescent dye was attached to the complementary peptide sequence. Alternatively, a fluorescent protein could be fused (e.g., a fusion protein) with a peptide or polypeptide (e.g., created from a genetic construct).
- E. coli clarified lysate expressing the complementary polypeptide sequence was prepared (poly lysate). 40uL of the poly lysate was mixed with 10uL of complementary peptide (pep) or fluorescently-labeled complementary peptide (pep-TMR) and incubated for 10min at RT. 50uL 100uM substrate for the complex (furimazine) in 50mM HEPES pH 7.4 was added and incubated for 30min at RT. Luminescence was measured over 400-700nm on TECAN M1000.
-
Figure 21 illustrates very efficient energy transfer from the Poly/Pep complex (donor) to TMR (acceptor), and the corresponding red shift in the wavelength of light being emitted. - B) This example demonstrates using BRET in detection, such as detecting small molecule concentration or enzymatic activity. Because energy transfer is strongly dependent on distance, the magnitude of energy transfer can often be related to the conformation of the system. For instance, insertion of a polypeptide that chelates calcium can be used to measure calcium concentration through modulation of energy transfer.
- An enzyme that also changes the distance, either through causing a conformational change of the sensor as above or through cleavage of the sensor from the fluorescent moiety, can be measured through a system as described herein. One structurally complementary member of a complex is bound to a fluorescent moiety which transfers its energy when the structurally complementary peptide and polypeptide of a bioluminescent reporter protein interact. One example of this is a peptide sensor that has been made wherein the peptide is conjugated to a fluorescent dye via a linker (e.g., DEVD Caspase-3 cleavage site). When exposed to the complementary polypeptide, energy transfer is observed. When exposed to Caspase-3, the fluorescent moiety is released from the complex, and energy transfer is eliminated but luminescence at 460nm remains.
- A complementary polypeptide (SEQ ID NO: 8) and NL-HT (NanoLuc fused to HaloTag) were purified. 20uL of 8pM NL-HT was mixed with 20uL of 100nM PBI-3781 (See, e.g.,
WO2013/078244 ) and incubated for 10min at RT. 40uL NanoGlo+100uM furimazine was added, and luminescence measured over 300-800nm on TECAN M1000. 20uL of 33ng/uL of a complementary polypeptide (SEQ ID NO: 6) was mixed with 20uL of ∼500uM PBI-5074 (fluorescent dye-linker-complementary peptide). 40uL NanoGlo+100uM furimazine was added, and luminescence measured over 300-800nm on TECAN M1000. -
Figure 22 illustrates energy transfer from the complementary peptide/polypeptide complex (donor) to the TOM-dye of PBI-5074 (acceptor), and the corresponding red shift in the wavelength of light being emitted. - The energy transfer with a structurally complementary pair of a bioluminescent reporter protein can also be used to measure three molecules interacting. One example is a GPCR fused to a complementary polypeptide of a bioluminescent reporter protein and a GPCR interacting protein fused with a complementary peptide of the bioluminescent reporter protein that form a bioluminescent complex when they interact. This allows measurement of the binary interaction. If a small molecule GPCR ligand bearing a fluorescent moiety for energy transfer interacts with the complex, energy transfer occurs. Therefore, the binary protein-protein interaction and the ternary drug-protein-protein interaction are measured in the same experiment. Also, the fluorescent molecule only causes a signal when interacting with the protein pair, which removes any signal from the ligand interacting with an inactive protein (
Figure 23 ). - The following example demonstrates that ligand-receptor interactions can be monitored via energy transfer from a multi-component luminescent donor, where light emission requires simultaneous presence of the donor components. In this example, the donor is comprised of two complementary subunits, an 1 IS polypeptide and a PEP-80 peptide. The 1 IS polypeptide was genetically tethered to the N-terminus of BRD4, and the fusion protein expressed in HEK293 cells. Luminescence was generated from the fusion protein only in the presence of both furimazine () and the PEP-80 complementary polypeptide (
Figure 24A ). Cell lysates incubated with furimazine alone (no Pep-80 peptide) did not generate significant donor signal or acceptor signal (Figures 24A ,25A ). When a solution of fluorescent BRD4 ligand (iBET-NCT) was applied, dose-dependent BRET signal was generated only in the presence of the PEP-80 peptide (Figure 24B ,25A, 25B ). Furthermore, this BRET signal could be diminished through competitive binding of by a non-fluorescent BRD4 ligand demonstrating signal specificity (Figure 25A ). - HEK293 cells were transfected with 11S-BRD4 DNA using Fugene HD and seeded in a 96-well plate format. For the transfection, 11S-BRD4 DNA was diluted with promoterless carrier DNA (pGEM3Z). The final DNA concentration/well remained 50ng/well; however the 11 S-BRD4 DNA was diluted 1:10 (at a seeding density of 20,000 cells/well in 96-well format). Twenty hours post-transfection, cells were lysed in OptiMEM + 50ug/mL digitonin in the presence of absence of 1uM PEP-80 peptide. Cells were then treated with serially-diluted iBET-NCT (PBI-4966) in the presence of or absence of 10uM iBET as a specificity control. After 1 hour of incubation, furimazine was added to 10uM, and BRET detected on a Varioskan luminometer.
- The concept illustrated by this example can be applied to detecting proximity of a fluorescently labeled ligand to protein complexes (e.g. detecting ligand binding selectively to heterodimeric or homodimeric receptors) by linking members of the complex to components of a multicomponent luminescent donor. This application could be thus used to monitor target engagement within disease-relevant protein complexes.
- Experiments were conducted during development of embodiments of the present invention to demonstrate that intracellular ligand-receptor interactions can be monitored via energy transfer from a protein complex, where light emission requires proximity of the luminescent donor components, facilitated by the interaction between to proteins. In this example, the donor is comprised of two subunits, an 1 IS peptide and a 114 peptide. The 1 IS peptide was genetically tethered to the N-terminus of BRD4, and the 114 peptide was genetically tethered to the C-terminus of Histone H3.3. These fusion proteins were simultaneously expressed in HEK293 cells. Luminescence was generated from the fusion protein only in the presence of both fusion constructs (
Figure 26A ). Cells expressing 11 S-BRD4 alone, H3.3-114 alone or various control constructs did not generate significant donor signal or acceptor signal (Figures 26 ). When a solution of fluorescent BRD4 ligand (iBET-NCT/PBI-4966) was applied, dose-dependent acceptor signal was generated only in samples co-transfected with 11S-BRD4 and Histone H3.3-114 (Figure 27 ). When expressed as a BRET ratio (610/450), specific BRET was observed only from a facilitated complex of the 11S and 114 subunits and iBET-NCT or NANOLUC-BRD4 and iBET-NCT. Furthermore, this BRET signal was diminished in a dose-dependent manner through competitive binding of a non-fluorescent BRD4 ligand (IBET 151) demonstrating signal specificity (Figure 28 ). - HEK293 cells were transfected using Fugene HD with BRD4 DNA fusion constructs +/-Histone H3.3 DNA fusion constructs and seeded in a 96-well plate format. For the transfection, the reporter constructs were diluted with promoterless carrier DNA (pGEM3Z). The final DNA concentration/well remained 50ng/well; however each DNA expression construct was diluted 1:10 (at a seeding density of 20,000 cells/well in 96-well format). Twenty hours post-transfection, cells were treated with serially-diluted iBET-NCT (PBI-4966) in the presence or absence of
10uM iBET 151 as a specificity control. To determine if iBET-151 could compete with iBET-NCT tracer in a dose-dependent manner, transfected cells were treated with serially diluted iBET-151 in the presence of a fixed concentration (2uM) of iBET-NCT/PBI-4966 tracer. After 1 hour of incubation, furimazine was added to 10uM, and BRET detected on a Varioskan luminometer. - The concept illustrated by this example can be applied to detecting proximity of a fluorescently-labeled ligand to protein complexes (e.g., detecting ligand binding selectively to heterodimeric or homodimeric receptors) by linking members of the complex to components of a multicomponent luminescent donor. This application could be used to monitor target engagement within protein complexes. Moreover, this technique could enable the identification or characterization of compounds selective to disease-relevant intracellular protein complexes.
- Experiments were conducted during development of embodiments of the present invention to demonstrate the ability to profile the intracellular selectivity and affinity of a drug against a panel of putative targets within a given phylogenetic target family using BRET. In this example, engagement of Vorinostat (SAHA) is profiled over the entire panel of Class I/II/IV (non-sirtuin) HDACs within cells. First, the fluorescent SAHA derivative (SAHA-NCT) is profiled against various NANOLUC/HDAC fusions using BRET. Once energy transfer is confirmed between individual NANOLUC/HDAC fusions and the SAHA tracer, affinity of SAHA is determined by competitive disruption of each energy transfer complex. Affinities can then be inferred by the IC50 value generated in each experiment. Furthermore, the affinities of inhibitors to individual domains can be determined via genetic fusion of NANOLUC to the segregated domain of the target protein.
- Determination of SAHA tracer affinities to individual HDACs within cells. HeLa cells were transfected with plasmid DNA encoding NANOLUC fusions with the entire family of non-sirtuin histone deacetylases (HDACs 1-11). Cells were transfected by diluting each DNA construct at a mass ratio of 1:100 into pGEM3Z carrier DNA and forming lipid DNA complexes using Fugene HD (Promega Corporation) at a 3:1 lipid:DNA ratio. Transfected cells were then seeded into 96-well plates at a density of 20,000 cells per well (total yield 50ng/well of DNA). Twenty-four hours post-transfection, cell medium was replaced with serum-free medium (Opti-MEM) and incubated with serially-diluted PBI-4968 in the presence or absence of SAHA at 20uM (the latter samples used to quantify non-specific BRET). Cells were incubated at 37°C for two hours. To the NANOLUC-expressing samples, furimazine was added to a final concentration of 10uM. BRET was then measured on a BMG Clariostar luminometer equipped with 450nm bandpass and 610nm longpass filters. The BRET ratio was determined by dividing the signal in the 630 channel by the signal in the 450 channel. To determine specific, background corrected BRET values, the nonspecific BRET values at each concentration of tracer were subtracted from BRET values with tracer alone.
- The following example serves to demonstrate the ability to measure the binding of a compound to an intracellular target with single cell resolution by using BRET imaging. This example shows the binding of SAHA and its fluorescent derivative , SAHA-NCT (PBI-4968) to NanoLuc-HDAC6 and HDAC10-NanoLuc in living cells.
- Measurement of SAHA and SAHA-NCT binding to HDAC6 and HDAC10 in living cells by BRET imaging. HeLa cells were transfected with plasmid DNA encoding NanoLuc fusions with HDAC6 and HDAC10 respectively. Cells were transfected by diluting each DNA construct at a mass ratio of 1:100 into pGEM3Z carrier DNA and forming lipid DNA complexes by adding Fugene HD (Promega Corporation) at a 3:1 lipid:DNA ratio. The transfection complex was mixed with a cell suspension (1e5 cells per ml) followed by plating into glass-bottom 35 mm dishes at a density of 200,000 cells per dish (total yield 50ng/well of DNA). Twenty-four hours post-transfection, cell medium was replaced with serum-free medium (Opti-MEM) and incubated with 2 mM PBI-4968 in the presence or absence of SAHA at 10 mM. Cells were incubated at 37°C for two hours. To the NanoLuc-expressing samples, furimazine was added to a final concentration of 10uM. The samples were imaged using an Olympus LV200 Bioluminescent Microscope. In order to measure the binding and displacement of PBI-4968 to either NanoLuc-HDAC6 or HDAC10-Nanoluc by BRET, sequential images were acquired using a 495 shortpass and a 590 nm longpass filter respectively (
Figure 34 and35 ) . Image sections representing individual cells were quantitatively analyzed using the image analysis program ImageJ. The BRET ratio was determined by dividing the value obtained for the 590 channel by the value of the 450 channel. A minimum of 100 individual cells was analyzed for each sample. All data are summarized in a dot plot format (Figure 36 ). Specific binding of SAHA and SAHA-NCT was demonstrated by comparative analysis of BRET values obtained from three different samples: - Sample 1 - negative control (untreated),
- Sample2 - positive control (2 mM PBI-4968),
- Sample 3 - Tracer displacement (2 mM PBI-4968 + 10 mM SAHA)
- The results demonstrate the cellular uptake and specific binding of PBI-4968 as well as SAHA to different members of the HDAC family (HDAC6 and 10) on a single cell level. The results suggest that the degree of uptake and/or binding varies considerably with in a cell population. The image based BRET assay format enables the analysis of target specific compound binding on a single cell level to determine differences based on cell type, cell density, cell cycle status and other physiological parameters that require single cell resolution for analysis.
- Although the invention has been described in connection with specific preferred embodiments, it should be understood that the invention as claimed should not be unduly limited to such specific embodiments. Indeed, various modifications of the described modes for carrying out the invention that are obvious to those skilled in the relevant fields are intended to be within the scope of the following claims.
-
- <110> Hitko, Carolyn W.
Kirkland, Thomas
Machleidt, Thomas
Ohana, Rachel Friedman
Robers, Matt
Wood, Keith - <120> Recognition of Cellular Target Binding by a Bioactive Agent Using Intracellular Bioluminescence Resonance Energy Transfer
- <130> PRMG-33031/US-3/PRO
- <160> 8
- <170> PatentIn version 3.5
- <210> 1
<211> 169
<212> PRT
<213> Oplophorus gracilirostris - <400> 1


- <210> 2
<211> 513
<212> DNA
<213> Artificial Sequence - <220>
<223> Synthetic - <400> 2

- <210> 3
<211> 8414
<212> DNA
<213> Artificial Sequence - <220>
<223> Synthetic - <400> 3


- <210> 4
<211> 4185
<212> DNA
<213> Artificial Sequence - <220>
<223> Synthetic - <400> 4


- <210> 5
<211> 1394
<212> PRT
<213> Artificial Sequence - <220>
<223> Synthetic - <400> 5


- <210> 6
<211> 14
<212> PRT
<213> Artificial Sequence - <220>
<223> Synthetic - <400> 6

- <210> 7
<211> 159
<212> PRT
<213> Artificial Sequence - <220>
<223> Synthetic - <400> 7


- <210> 8
<211> 477
<212> DNA
<213> Artificial Sequence - <220>
<223> Synthetic - <400> 8

Claims (11)
- An assay system comprising:(a) a library of bioactive agents, each of which is tethered to a fluorophore;(b) a cellular target fused to a bioluminescent reporter, wherein the cellular target is a binding partner of at least one of the bioactive agents; and(c) a substrate for the bioluminescent reporterwherein the emission spectrum of the bioluminescent reporter overlaps with the absorption spectrum of the fluorophores; and wherein the bioactive agent is a small molecule.
- An assay system comprising:(a) a bioactive agent tethered to a fluorophore;(b) a plurality of cellular targets each of which is fused to a bioluminescent reporter, wherein at least one of the cellular targets is a binding partner of the bioactive agent; and(c) a substrate for the bioluminescent reporterswherein the emission spectrum of the bioluminescent reporters overlaps with the absorption spectrum of the fluorophore; and wherein the bioactive agent is a small molecule.
- The system of claim 1 or 2, wherein the fluorophore is a carboxy rhodamine analog.
- The system of claim 1 or 2, wherein the bioluminescent reporter comprises a polypeptide with at least 70% sequence identity with SEQ ID NO.: 1.
- The system of claim 1 or 2, wherein (a) and (b) are within a cell.
- The system of claim 5, wherein (b) is expressed intracellularly as a fusion.
- The system of claim 5, wherein (a) is added extracellularly and enters the cell.
- The system of claim 1 or 2, wherein upon binding of the bioactive agent to the cellular target, conversion of the substrate to a reaction product by the bioluminescent reporter results in excitation of the fluorophore by BRET and fluorescence emission from the fluorophore.
- The system of claim 1 or 2, wherein the bioactive agent or the bioactive agent tethered to a fluorophore is produced by non-natural chemical synthesis.
- A method of detecting the binding of a bioactive agent to a cellular target comprising the system of one of claims 1-9; wherein the bioactive agent is a small molecule.
- A cell comprising the systems of one of claims 1-9.
Priority Applications (2)
| Application Number | Priority Date | Filing Date | Title |
|---|---|---|---|
| PL13861977T PL2932267T3 (en) | 2012-12-12 | 2013-12-12 | Recognition of cellular target binding by a bioactive agent using intracellular bioluminescence resonance energy transfer |
| EP20169678.8A EP3712154A1 (en) | 2012-12-12 | 2013-12-12 | Recognition of cellular target binding by a bioactive agent using intracellular bioluminescence resonance energy transfer |
Applications Claiming Priority (4)
| Application Number | Priority Date | Filing Date | Title |
|---|---|---|---|
| US201261736429P | 2012-12-12 | 2012-12-12 | |
| US201361794461P | 2013-03-15 | 2013-03-15 | |
| US201361880048P | 2013-09-19 | 2013-09-19 | |
| PCT/US2013/074765 WO2014093677A1 (en) | 2012-12-12 | 2013-12-12 | Recognition of cellular target binding by a bioactive agent using intracellular bioluminescence resonance energy transfer |
Related Child Applications (1)
| Application Number | Title | Priority Date | Filing Date |
|---|---|---|---|
| EP20169678.8A Division EP3712154A1 (en) | 2012-12-12 | 2013-12-12 | Recognition of cellular target binding by a bioactive agent using intracellular bioluminescence resonance energy transfer |
Publications (3)
| Publication Number | Publication Date |
|---|---|
| EP2932267A1 EP2932267A1 (en) | 2015-10-21 |
| EP2932267A4 EP2932267A4 (en) | 2016-06-22 |
| EP2932267B1 true EP2932267B1 (en) | 2020-05-06 |
Family
ID=50934963
Family Applications (2)
| Application Number | Title | Priority Date | Filing Date |
|---|---|---|---|
| EP20169678.8A Pending EP3712154A1 (en) | 2012-12-12 | 2013-12-12 | Recognition of cellular target binding by a bioactive agent using intracellular bioluminescence resonance energy transfer |
| EP13861977.0A Active EP2932267B1 (en) | 2012-12-12 | 2013-12-12 | Recognition of cellular target binding by a bioactive agent using intracellular bioluminescence resonance energy transfer |
Family Applications Before (1)
| Application Number | Title | Priority Date | Filing Date |
|---|---|---|---|
| EP20169678.8A Pending EP3712154A1 (en) | 2012-12-12 | 2013-12-12 | Recognition of cellular target binding by a bioactive agent using intracellular bioluminescence resonance energy transfer |
Country Status (13)
| Country | Link |
|---|---|
| US (1) | US10024862B2 (en) |
| EP (2) | EP3712154A1 (en) |
| JP (4) | JP6751294B2 (en) |
| KR (2) | KR102292431B1 (en) |
| CN (2) | CN104871001B (en) |
| AU (1) | AU2013359166B2 (en) |
| BR (1) | BR112015013710B1 (en) |
| CA (2) | CA3174484A1 (en) |
| DK (1) | DK2932267T3 (en) |
| ES (1) | ES2803503T3 (en) |
| PL (1) | PL2932267T3 (en) |
| SG (1) | SG11201504525VA (en) |
| WO (1) | WO2014093677A1 (en) |
Families Citing this family (34)
| Publication number | Priority date | Publication date | Assignee | Title |
|---|---|---|---|---|
| US8524457B2 (en) | 2009-09-22 | 2013-09-03 | William Patterson | Method for the selection of specific affinity binders by homogeneous noncompetitive assay |
| BR112015013710B1 (en) * | 2012-12-12 | 2022-08-09 | Promega Corporation | IN VITRO METHODS TO DETECT AN INTERACTION BETWEEN A BIOACTIVE AGENT AND A CELLULAR TARGET |
| US10067149B2 (en) * | 2012-12-12 | 2018-09-04 | Promega Corporation | Recognition of cellular target binding by a bioactive agent using intracellular bioluminescence resonance energy transfer |
| AU2014236949C1 (en) | 2013-03-15 | 2018-11-29 | Promega Corporation | Activation of bioluminescence by structural complementation |
| CN104225611B (en) * | 2013-06-18 | 2017-06-30 | 天津键凯科技有限公司 | The conjugate of Dasatinib and non-linear configurations polyethylene glycol |
| EP4219736A1 (en) * | 2014-09-12 | 2023-08-02 | Promega Corporation | Internal protein tags |
| US11365402B2 (en) | 2014-09-12 | 2022-06-21 | Promega Corporation | Internal protein tags |
| EP3254113B1 (en) | 2015-02-05 | 2024-10-09 | Promega Corporation | Luciferase-based thermal shift assays |
| CA3018253A1 (en) * | 2016-03-31 | 2017-10-05 | University Of Southern California | A highly sensitive and specific luciferase based reporter assay for antigen detection |
| CN109690316A (en) * | 2016-05-31 | 2019-04-26 | 王帅 | Methods for determining the persistence of ligand-target protein interactions in cells |
| EP4144738A1 (en) * | 2016-11-01 | 2023-03-08 | Promega Corporation | Coelenterazine analogues tethered to energy acceptors |
| JP7014437B2 (en) * | 2017-01-27 | 2022-02-01 | 国立大学法人大阪大学 | Method for detecting biological substances, chemiluminescence indicator used for it |
| US11619628B2 (en) * | 2017-02-03 | 2023-04-04 | Osaka University | Device and determination system using same |
| EP3803401A4 (en) | 2018-05-30 | 2022-02-23 | Promega Corporation | Broad-spectrum kinase binding agents |
| CN112513188B (en) | 2018-08-23 | 2024-01-26 | 普洛麦格公司 | coelenterazine analogs |
| WO2020048607A1 (en) | 2018-09-07 | 2020-03-12 | Université Libre de Bruxelles | Srsf2 as rna epigenetic factor |
| US11175228B2 (en) | 2018-11-28 | 2021-11-16 | Promega Corporation | Reactive peptide labeling |
| WO2020191339A1 (en) | 2019-03-20 | 2020-09-24 | Promega Corporation | Photoaffinity probes |
| EP3953374A4 (en) * | 2019-04-10 | 2023-06-07 | Promega Corporation | COMPOSITIONS AND METHODS FOR DETECTING ANALYTES USING BIOLUMINESCENCE |
| CN112147114B (en) * | 2019-06-27 | 2024-06-25 | 成都先导药物开发股份有限公司 | A method for determining the interaction of a compound with a target in living cells using a fluorescently labeled compound |
| JP7745550B2 (en) | 2019-12-10 | 2025-09-29 | プロメガ コーポレイション | Bioluminescence detection composition and bioluminescence detection method using multifunctional probes |
| WO2022047186A1 (en) | 2020-08-28 | 2022-03-03 | Promega Corporation | Target engagement assay for ras proteins |
| CN115161296B (en) * | 2021-04-01 | 2024-08-13 | 深圳华大生命科学研究院 | Mutant of spiny shrimp luciferase Nluc and application thereof |
| CN114394970B (en) * | 2022-01-05 | 2023-06-06 | 山东大学 | A kind of ester Furimazine derivative and its preparation method and application |
| CN114813706B (en) * | 2022-06-29 | 2022-12-13 | 国科大杭州高等研究院 | Blood cell hyperspectral optical tweezers capture energy resonance transfer analyzer |
| US20240150363A1 (en) | 2022-10-14 | 2024-05-09 | Promega Corporation | Coelenterazine analogues |
| CN116354927B (en) * | 2023-02-21 | 2025-02-07 | 杭州医学院 | HDAC degradation agent with alkane or fatty acid as connecting chain and preparation method and application thereof |
| AU2024265176A1 (en) * | 2023-05-04 | 2025-12-11 | Promega Corporation | Complementation-based tags and reporters for dual-modality labeling |
| KR20250004513A (en) | 2023-06-29 | 2025-01-08 | 부산대학교 산학협력단 | BRET-based RAB11A activation biosensor and cell line comprising the same |
| CN117330755B (en) * | 2023-08-25 | 2024-03-26 | 广东省农业科学院农业生物基因研究中心 | Method for quantitatively detecting DNA-protein interaction based on enzyme-catalyzed biological fluorescence |
| KR102802452B1 (en) | 2023-11-07 | 2025-05-08 | 대한민국 | Method for confirming foot-and-mouth disease virus infection using a cell line expressing the LgBiT protein and a foot-and-mouth disease virus expressing the HiBiT protein |
| US20250206747A1 (en) | 2023-12-20 | 2025-06-26 | Promega Corporation | Coelenterazine analogues |
| GB202410534D0 (en) | 2024-07-18 | 2024-09-04 | Nrg Therapeutics Ltd | Novel method and uses |
| CN119709661B (en) * | 2024-12-30 | 2025-10-10 | 佰翱得(无锡)新药开发有限公司 | A luciferase OLuc mutant and its application |
Family Cites Families (21)
| Publication number | Priority date | Publication date | Assignee | Title |
|---|---|---|---|---|
| US5928888A (en) * | 1996-09-26 | 1999-07-27 | Aurora Biosciences Corporation | Methods and compositions for sensitive and rapid, functional identification of genomic polynucleotides and secondary screening capabilities |
| AU4254299A (en) | 1998-06-16 | 2000-01-05 | Biosignal Packard Inc. | A bioluminescence resonance energy transfer (bret) system and its use |
| EP1295121B1 (en) | 1999-12-22 | 2006-03-08 | PerkinElmer BioSignal Inc. | A bioluminescence resonance energy transfer (bret) system with broad spectral resolution between donor and acceptor emission wavelengths and its use |
| EP2085781B2 (en) | 2000-10-06 | 2020-03-11 | Life Technologies Corporation | Transfectable micelles containing semiconductor nanocrystals |
| DE10058091A1 (en) * | 2000-11-23 | 2002-06-06 | Bayer Ag | Isolated Luciferases Lu164, LuAL and Lu22, and their use |
| WO2004034054A2 (en) | 2002-10-11 | 2004-04-22 | 7Tm Pharma A/S | Method for enhancing and prolonging the bioluminescence resonance energy transfer (bret) signal in a bret assay and a substrate solution for use in a bret assay |
| GB0307559D0 (en) * | 2003-04-02 | 2003-05-07 | Univ Nottingham | Fluorescently tagged ligands |
| CN100473988C (en) * | 2004-07-08 | 2009-04-01 | 厦门大学 | Protein composition possessing fluorescent resonance energy transfer characteristics and use thereof |
| US9029097B2 (en) * | 2005-02-16 | 2015-05-12 | Universite De Montreal | Biosensors for monitoring receptor-mediated G-protein activation |
| GB0625678D0 (en) * | 2006-12-21 | 2007-01-31 | Lux Biotechnology Ltd | Composition and method for detection of demineralisation |
| WO2008109463A2 (en) * | 2007-03-02 | 2008-09-12 | University Of Massachusetts | Red-shifted luciferase |
| EP2006686A1 (en) * | 2007-06-22 | 2008-12-24 | Institut Pasteur | Method for screening for selective modulator of the NF-kB pathway activation |
| US20090253131A1 (en) * | 2007-11-05 | 2009-10-08 | Promega Corporation | Hybrid fusion reporter and uses thereof |
| CA2747244A1 (en) * | 2008-12-12 | 2010-06-17 | University Of Florida Research Foundation, Inc. | Cell-based detection of apf through its interaction with ckap4 for diagnosis of interstitial cystitis |
| WO2010127368A1 (en) | 2009-05-01 | 2010-11-04 | Promega Corporation | Synthetic oplophorus luciferases with enhanced light output |
| US8263350B2 (en) * | 2009-06-29 | 2012-09-11 | The University Of Chicago | Molecular affinity clamp technology and uses thereof |
| SG10202103336SA (en) * | 2010-11-02 | 2021-04-29 | Promega Corp | Novel coelenterazine substrates and methods of use |
| EP2782916B1 (en) * | 2011-11-21 | 2018-02-28 | Promega Corporation | Carboxy x rhodamine analogs |
| CN102798717B (en) * | 2012-06-15 | 2014-11-26 | 杭州师范大学 | A kind of detection method of O6-methylguanine-DNA methyltransferase activity |
| US10067149B2 (en) | 2012-12-12 | 2018-09-04 | Promega Corporation | Recognition of cellular target binding by a bioactive agent using intracellular bioluminescence resonance energy transfer |
| BR112015013710B1 (en) | 2012-12-12 | 2022-08-09 | Promega Corporation | IN VITRO METHODS TO DETECT AN INTERACTION BETWEEN A BIOACTIVE AGENT AND A CELLULAR TARGET |
-
2013
- 2013-12-12 BR BR112015013710-5A patent/BR112015013710B1/en active IP Right Grant
- 2013-12-12 EP EP20169678.8A patent/EP3712154A1/en active Pending
- 2013-12-12 KR KR1020207024622A patent/KR102292431B1/en active Active
- 2013-12-12 KR KR1020157018230A patent/KR102150479B1/en active Active
- 2013-12-12 ES ES13861977T patent/ES2803503T3/en active Active
- 2013-12-12 DK DK13861977.0T patent/DK2932267T3/en active
- 2013-12-12 AU AU2013359166A patent/AU2013359166B2/en active Active
- 2013-12-12 US US14/104,860 patent/US10024862B2/en active Active
- 2013-12-12 CN CN201380064252.4A patent/CN104871001B/en active Active
- 2013-12-12 JP JP2015547562A patent/JP6751294B2/en active Active
- 2013-12-12 SG SG11201504525VA patent/SG11201504525VA/en unknown
- 2013-12-12 PL PL13861977T patent/PL2932267T3/en unknown
- 2013-12-12 WO PCT/US2013/074765 patent/WO2014093677A1/en not_active Ceased
- 2013-12-12 CN CN201810902469.2A patent/CN109612981B/en active Active
- 2013-12-12 CA CA3174484A patent/CA3174484A1/en active Pending
- 2013-12-12 CA CA2894435A patent/CA2894435A1/en active Pending
- 2013-12-12 EP EP13861977.0A patent/EP2932267B1/en active Active
-
2019
- 2019-01-21 JP JP2019007974A patent/JP7092691B2/en active Active
-
2022
- 2022-02-14 JP JP2022020320A patent/JP7393451B2/en active Active
-
2023
- 2023-08-22 JP JP2023134744A patent/JP7676487B2/en active Active
Non-Patent Citations (1)
| Title |
|---|
| None * |
Also Published As
| Publication number | Publication date |
|---|---|
| US10024862B2 (en) | 2018-07-17 |
| PL2932267T3 (en) | 2020-10-19 |
| JP2019071899A (en) | 2019-05-16 |
| SG11201504525VA (en) | 2015-07-30 |
| KR20200104928A (en) | 2020-09-04 |
| BR112015013710B1 (en) | 2022-08-09 |
| KR20150094696A (en) | 2015-08-19 |
| AU2013359166A1 (en) | 2015-07-09 |
| EP3712154A1 (en) | 2020-09-23 |
| KR102150479B1 (en) | 2020-09-01 |
| WO2014093677A1 (en) | 2014-06-19 |
| JP7092691B2 (en) | 2022-06-28 |
| EP2932267A1 (en) | 2015-10-21 |
| US20140194307A1 (en) | 2014-07-10 |
| KR102292431B1 (en) | 2021-08-20 |
| JP7393451B2 (en) | 2023-12-06 |
| DK2932267T3 (en) | 2020-07-20 |
| ES2803503T3 (en) | 2021-01-27 |
| AU2013359166B2 (en) | 2019-09-19 |
| CN104871001A (en) | 2015-08-26 |
| BR112015013710A2 (en) | 2018-11-21 |
| JP2016500263A (en) | 2016-01-12 |
| JP2023179413A (en) | 2023-12-19 |
| CA3174484A1 (en) | 2014-06-19 |
| CN104871001B (en) | 2018-09-11 |
| EP2932267A4 (en) | 2016-06-22 |
| CN109612981A (en) | 2019-04-12 |
| CA2894435A1 (en) | 2014-06-19 |
| JP7676487B2 (en) | 2025-05-14 |
| CN109612981B (en) | 2022-05-13 |
| JP6751294B2 (en) | 2020-09-02 |
| JP2022078077A (en) | 2022-05-24 |
Similar Documents
| Publication | Publication Date | Title |
|---|---|---|
| EP2932267B1 (en) | Recognition of cellular target binding by a bioactive agent using intracellular bioluminescence resonance energy transfer | |
| US20230417778A1 (en) | Recognition of cellular target binding by a bioactive agent using intracellular bioluminescence resonance energy transfer | |
| Giuliano et al. | Fluorescent-protein biosensors: new tools for drug discovery | |
| Böhme et al. | Illuminating the life of GPCRs | |
| JP2020097597A (en) | Activation of bioluminescence by structural complementation | |
| AU2010224363A1 (en) | Protein fragment complementation assays for high-throughput and high-content screening | |
| EP1668161A2 (en) | Fragment complementation assays for g-protein-coupled receptors and their signaling pathways | |
| Wolf et al. | Strategies for site‐specific labeling of receptor proteins on the surfaces of living cells by using genetically encoded peptide tags | |
| US8470523B2 (en) | Method for detecting intracellular interaction between biomolecules | |
| US20210382054A1 (en) | Methods for screening ubiquitin ligase agonists | |
| Sakamoto et al. | Construction of ligand assay systems by protein-based semisynthetic biosensors | |
| US9915650B2 (en) | Method of detection of cAMP and cGMP via a fluorophore and dequencher complex | |
| Yamaura et al. | Construction of Protein-Based Biosensors Using Ligand-Directed Chemistry for Detecting Analyte Binding | |
| Nesakumar et al. | Development of Ligand Assay Systems Using Semisynthetic Biosensors Based on Protein | |
| Sharma et al. | Protein Labelling for Molecular Recognition and Application | |
| WO2024151471A1 (en) | High-throughput assay based on ligand-biased structural dynamics response | |
| EP1936377B1 (en) | Method for detection of cAMP and cGMP |
Legal Events
| Date | Code | Title | Description |
|---|---|---|---|
| PUAI | Public reference made under article 153(3) epc to a published international application that has entered the european phase |
Free format text: ORIGINAL CODE: 0009012 |
|
| 17P | Request for examination filed |
Effective date: 20150707 |
|
| AK | Designated contracting states |
Kind code of ref document: A1 Designated state(s): AL AT BE BG CH CY CZ DE DK EE ES FI FR GB GR HR HU IE IS IT LI LT LU LV MC MK MT NL NO PL PT RO RS SE SI SK SM TR |
|
| AX | Request for extension of the european patent |
Extension state: BA ME |
|
| DAX | Request for extension of the european patent (deleted) | ||
| REG | Reference to a national code |
Ref country code: DE Ref legal event code: R079 Ref document number: 602013068924 Country of ref document: DE Free format text: PREVIOUS MAIN CLASS: G01N0033520000 Ipc: C07D0491220000 |
|
| A4 | Supplementary search report drawn up and despatched |
Effective date: 20160520 |
|
| RIC1 | Information provided on ipc code assigned before grant |
Ipc: C07D 491/22 20060101AFI20160513BHEP Ipc: C07D 491/147 20060101ALI20160513BHEP Ipc: C12N 15/62 20060101ALI20160513BHEP Ipc: C12Q 1/66 20060101ALI20160513BHEP Ipc: G01N 33/50 20060101ALI20160513BHEP Ipc: C12N 9/02 20060101ALI20160513BHEP Ipc: C40B 40/04 20060101ALI20160513BHEP Ipc: C40B 40/10 20060101ALI20160513BHEP Ipc: C12N 5/10 20060101ALI20160513BHEP |
|
| STAA | Information on the status of an ep patent application or granted ep patent |
Free format text: STATUS: EXAMINATION IS IN PROGRESS |
|
| 17Q | First examination report despatched |
Effective date: 20170330 |
|
| GRAP | Despatch of communication of intention to grant a patent |
Free format text: ORIGINAL CODE: EPIDOSNIGR1 |
|
| STAA | Information on the status of an ep patent application or granted ep patent |
Free format text: STATUS: GRANT OF PATENT IS INTENDED |
|
| INTG | Intention to grant announced |
Effective date: 20191210 |
|
| GRAS | Grant fee paid |
Free format text: ORIGINAL CODE: EPIDOSNIGR3 |
|
| GRAA | (expected) grant |
Free format text: ORIGINAL CODE: 0009210 |
|
| STAA | Information on the status of an ep patent application or granted ep patent |
Free format text: STATUS: THE PATENT HAS BEEN GRANTED |
|
| AK | Designated contracting states |
Kind code of ref document: B1 Designated state(s): AL AT BE BG CH CY CZ DE DK EE ES FI FR GB GR HR HU IE IS IT LI LT LU LV MC MK MT NL NO PL PT RO RS SE SI SK SM TR |
|
| REG | Reference to a national code |
Ref country code: GB Ref legal event code: FG4D |
|
| REG | Reference to a national code |
Ref country code: CH Ref legal event code: EP Ref country code: AT Ref legal event code: REF Ref document number: 1266548 Country of ref document: AT Kind code of ref document: T Effective date: 20200515 |
|
| REG | Reference to a national code |
Ref country code: IE Ref legal event code: FG4D |
|
| REG | Reference to a national code |
Ref country code: DE Ref legal event code: R096 Ref document number: 602013068924 Country of ref document: DE |
|
| REG | Reference to a national code |
Ref country code: CH Ref legal event code: NV Representative=s name: ISLER AND PEDRAZZINI AG, CH |
|
| REG | Reference to a national code |
Ref country code: DK Ref legal event code: T3 Effective date: 20200715 |
|
| REG | Reference to a national code |
Ref country code: FI Ref legal event code: FGE |
|
| REG | Reference to a national code |
Ref country code: SE Ref legal event code: TRGR |
|
| REG | Reference to a national code |
Ref country code: NL Ref legal event code: FP |
|
| REG | Reference to a national code |
Ref country code: NO Ref legal event code: T2 Effective date: 20200506 |
|
| REG | Reference to a national code |
Ref country code: LT Ref legal event code: MG4D |
|
| PG25 | Lapsed in a contracting state [announced via postgrant information from national office to epo] |
Ref country code: IS Free format text: LAPSE BECAUSE OF FAILURE TO SUBMIT A TRANSLATION OF THE DESCRIPTION OR TO PAY THE FEE WITHIN THE PRESCRIBED TIME-LIMIT Effective date: 20200906 Ref country code: PT Free format text: LAPSE BECAUSE OF FAILURE TO SUBMIT A TRANSLATION OF THE DESCRIPTION OR TO PAY THE FEE WITHIN THE PRESCRIBED TIME-LIMIT Effective date: 20200907 Ref country code: LT Free format text: LAPSE BECAUSE OF FAILURE TO SUBMIT A TRANSLATION OF THE DESCRIPTION OR TO PAY THE FEE WITHIN THE PRESCRIBED TIME-LIMIT Effective date: 20200506 Ref country code: GR Free format text: LAPSE BECAUSE OF FAILURE TO SUBMIT A TRANSLATION OF THE DESCRIPTION OR TO PAY THE FEE WITHIN THE PRESCRIBED TIME-LIMIT Effective date: 20200807 |
|
| PG25 | Lapsed in a contracting state [announced via postgrant information from national office to epo] |
Ref country code: BG Free format text: LAPSE BECAUSE OF FAILURE TO SUBMIT A TRANSLATION OF THE DESCRIPTION OR TO PAY THE FEE WITHIN THE PRESCRIBED TIME-LIMIT Effective date: 20200806 Ref country code: RS Free format text: LAPSE BECAUSE OF FAILURE TO SUBMIT A TRANSLATION OF THE DESCRIPTION OR TO PAY THE FEE WITHIN THE PRESCRIBED TIME-LIMIT Effective date: 20200506 Ref country code: LV Free format text: LAPSE BECAUSE OF FAILURE TO SUBMIT A TRANSLATION OF THE DESCRIPTION OR TO PAY THE FEE WITHIN THE PRESCRIBED TIME-LIMIT Effective date: 20200506 Ref country code: HR Free format text: LAPSE BECAUSE OF FAILURE TO SUBMIT A TRANSLATION OF THE DESCRIPTION OR TO PAY THE FEE WITHIN THE PRESCRIBED TIME-LIMIT Effective date: 20200506 |
|
| PG25 | Lapsed in a contracting state [announced via postgrant information from national office to epo] |
Ref country code: AL Free format text: LAPSE BECAUSE OF FAILURE TO SUBMIT A TRANSLATION OF THE DESCRIPTION OR TO PAY THE FEE WITHIN THE PRESCRIBED TIME-LIMIT Effective date: 20200506 |
|
| REG | Reference to a national code |
Ref country code: ES Ref legal event code: FG2A Ref document number: 2803503 Country of ref document: ES Kind code of ref document: T3 Effective date: 20210127 |
|
| PG25 | Lapsed in a contracting state [announced via postgrant information from national office to epo] |
Ref country code: EE Free format text: LAPSE BECAUSE OF FAILURE TO SUBMIT A TRANSLATION OF THE DESCRIPTION OR TO PAY THE FEE WITHIN THE PRESCRIBED TIME-LIMIT Effective date: 20200506 Ref country code: SM Free format text: LAPSE BECAUSE OF FAILURE TO SUBMIT A TRANSLATION OF THE DESCRIPTION OR TO PAY THE FEE WITHIN THE PRESCRIBED TIME-LIMIT Effective date: 20200506 Ref country code: RO Free format text: LAPSE BECAUSE OF FAILURE TO SUBMIT A TRANSLATION OF THE DESCRIPTION OR TO PAY THE FEE WITHIN THE PRESCRIBED TIME-LIMIT Effective date: 20200506 Ref country code: CZ Free format text: LAPSE BECAUSE OF FAILURE TO SUBMIT A TRANSLATION OF THE DESCRIPTION OR TO PAY THE FEE WITHIN THE PRESCRIBED TIME-LIMIT Effective date: 20200506 |
|
| REG | Reference to a national code |
Ref country code: DE Ref legal event code: R097 Ref document number: 602013068924 Country of ref document: DE |
|
| PG25 | Lapsed in a contracting state [announced via postgrant information from national office to epo] |
Ref country code: SK Free format text: LAPSE BECAUSE OF FAILURE TO SUBMIT A TRANSLATION OF THE DESCRIPTION OR TO PAY THE FEE WITHIN THE PRESCRIBED TIME-LIMIT Effective date: 20200506 |
|
| PLBE | No opposition filed within time limit |
Free format text: ORIGINAL CODE: 0009261 |
|
| STAA | Information on the status of an ep patent application or granted ep patent |
Free format text: STATUS: NO OPPOSITION FILED WITHIN TIME LIMIT |
|
| 26N | No opposition filed |
Effective date: 20210209 |
|
| REG | Reference to a national code |
Ref country code: AT Ref legal event code: UEP Ref document number: 1266548 Country of ref document: AT Kind code of ref document: T Effective date: 20200506 |
|
| PG25 | Lapsed in a contracting state [announced via postgrant information from national office to epo] |
Ref country code: SI Free format text: LAPSE BECAUSE OF FAILURE TO SUBMIT A TRANSLATION OF THE DESCRIPTION OR TO PAY THE FEE WITHIN THE PRESCRIBED TIME-LIMIT Effective date: 20200506 |
|
| PG25 | Lapsed in a contracting state [announced via postgrant information from national office to epo] |
Ref country code: MC Free format text: LAPSE BECAUSE OF FAILURE TO SUBMIT A TRANSLATION OF THE DESCRIPTION OR TO PAY THE FEE WITHIN THE PRESCRIBED TIME-LIMIT Effective date: 20200506 |
|
| PG25 | Lapsed in a contracting state [announced via postgrant information from national office to epo] |
Ref country code: LU Free format text: LAPSE BECAUSE OF NON-PAYMENT OF DUE FEES Effective date: 20201212 Ref country code: IE Free format text: LAPSE BECAUSE OF NON-PAYMENT OF DUE FEES Effective date: 20201212 |
|
| PG25 | Lapsed in a contracting state [announced via postgrant information from national office to epo] |
Ref country code: TR Free format text: LAPSE BECAUSE OF FAILURE TO SUBMIT A TRANSLATION OF THE DESCRIPTION OR TO PAY THE FEE WITHIN THE PRESCRIBED TIME-LIMIT Effective date: 20200506 Ref country code: MT Free format text: LAPSE BECAUSE OF FAILURE TO SUBMIT A TRANSLATION OF THE DESCRIPTION OR TO PAY THE FEE WITHIN THE PRESCRIBED TIME-LIMIT Effective date: 20200506 Ref country code: CY Free format text: LAPSE BECAUSE OF FAILURE TO SUBMIT A TRANSLATION OF THE DESCRIPTION OR TO PAY THE FEE WITHIN THE PRESCRIBED TIME-LIMIT Effective date: 20200506 |
|
| PG25 | Lapsed in a contracting state [announced via postgrant information from national office to epo] |
Ref country code: MK Free format text: LAPSE BECAUSE OF FAILURE TO SUBMIT A TRANSLATION OF THE DESCRIPTION OR TO PAY THE FEE WITHIN THE PRESCRIBED TIME-LIMIT Effective date: 20200506 |
|
| PGFP | Annual fee paid to national office [announced via postgrant information from national office to epo] |
Ref country code: DE Payment date: 20241227 Year of fee payment: 12 |
|
| PGFP | Annual fee paid to national office [announced via postgrant information from national office to epo] |
Ref country code: ES Payment date: 20250102 Year of fee payment: 12 |
|
| PGFP | Annual fee paid to national office [announced via postgrant information from national office to epo] |
Ref country code: CH Payment date: 20250108 Year of fee payment: 12 |
|
| REG | Reference to a national code |
Ref country code: CH Ref legal event code: U11 Free format text: ST27 STATUS EVENT CODE: U-0-0-U10-U11 (AS PROVIDED BY THE NATIONAL OFFICE) Effective date: 20260101 |
|
| PGFP | Annual fee paid to national office [announced via postgrant information from national office to epo] |
Ref country code: GB Payment date: 20251229 Year of fee payment: 13 |
|
| PGFP | Annual fee paid to national office [announced via postgrant information from national office to epo] |
Ref country code: NO Payment date: 20251231 Year of fee payment: 13 |
|
| PGFP | Annual fee paid to national office [announced via postgrant information from national office to epo] |
Ref country code: AT Payment date: 20251230 Year of fee payment: 13 |
|
| PGFP | Annual fee paid to national office [announced via postgrant information from national office to epo] |
Ref country code: IT Payment date: 20251219 Year of fee payment: 13 Ref country code: FI Payment date: 20251226 Year of fee payment: 13 Ref country code: DK Payment date: 20251226 Year of fee payment: 13 |
|
| PGFP | Annual fee paid to national office [announced via postgrant information from national office to epo] |
Ref country code: NL Payment date: 20251226 Year of fee payment: 13 Ref country code: FR Payment date: 20251226 Year of fee payment: 13 |
|
| PGFP | Annual fee paid to national office [announced via postgrant information from national office to epo] |
Ref country code: BE Payment date: 20251229 Year of fee payment: 13 |
|
| PGFP | Annual fee paid to national office [announced via postgrant information from national office to epo] |
Ref country code: SE Payment date: 20251227 Year of fee payment: 13 |
|
| PGFP | Annual fee paid to national office [announced via postgrant information from national office to epo] |
Ref country code: PL Payment date: 20251119 Year of fee payment: 13 |