EP2914101B1 - Animal model for type 2 diabetes and obesity - Google Patents
Animal model for type 2 diabetes and obesity Download PDFInfo
- Publication number
- EP2914101B1 EP2914101B1 EP13785854.4A EP13785854A EP2914101B1 EP 2914101 B1 EP2914101 B1 EP 2914101B1 EP 13785854 A EP13785854 A EP 13785854A EP 2914101 B1 EP2914101 B1 EP 2914101B1
- Authority
- EP
- European Patent Office
- Prior art keywords
- lsd1
- mice
- cells
- obesity
- ctrl
- Prior art date
- Legal status (The legal status is an assumption and is not a legal conclusion. Google has not performed a legal analysis and makes no representation as to the accuracy of the status listed.)
- Active
Links
- 208000008589 Obesity Diseases 0.000 title claims description 73
- 235000020824 obesity Nutrition 0.000 title claims description 73
- 208000001072 type 2 diabetes mellitus Diseases 0.000 title claims description 37
- 238000010171 animal model Methods 0.000 title claims description 9
- 108090000623 proteins and genes Proteins 0.000 claims description 180
- 230000009261 transgenic effect Effects 0.000 claims description 91
- 230000014509 gene expression Effects 0.000 claims description 88
- 210000000593 adipose tissue white Anatomy 0.000 claims description 78
- 210000000577 adipose tissue Anatomy 0.000 claims description 51
- 150000001875 compounds Chemical class 0.000 claims description 49
- 241000124008 Mammalia Species 0.000 claims description 48
- 230000004069 differentiation Effects 0.000 claims description 45
- 235000009200 high fat diet Nutrition 0.000 claims description 44
- 238000000034 method Methods 0.000 claims description 36
- 208000037265 diseases, disorders, signs and symptoms Diseases 0.000 claims description 33
- 241000282414 Homo sapiens Species 0.000 claims description 31
- 238000012360 testing method Methods 0.000 claims description 30
- 101001050886 Homo sapiens Lysine-specific histone demethylase 1A Proteins 0.000 claims description 29
- 210000001519 tissue Anatomy 0.000 claims description 29
- 230000002829 reductive effect Effects 0.000 claims description 25
- 230000000694 effects Effects 0.000 claims description 24
- 108700028369 Alleles Proteins 0.000 claims description 21
- 206010022489 Insulin Resistance Diseases 0.000 claims description 18
- 150000007523 nucleic acids Chemical class 0.000 claims description 18
- 102000039446 nucleic acids Human genes 0.000 claims description 15
- 108020004707 nucleic acids Proteins 0.000 claims description 15
- 241000283984 Rodentia Species 0.000 claims description 12
- 238000012217 deletion Methods 0.000 claims description 11
- 230000037430 deletion Effects 0.000 claims description 11
- 210000004185 liver Anatomy 0.000 claims description 10
- 208000004930 Fatty Liver Diseases 0.000 claims description 8
- 206010019708 Hepatic steatosis Diseases 0.000 claims description 8
- 230000005856 abnormality Effects 0.000 claims description 8
- 230000002124 endocrine Effects 0.000 claims description 8
- 208000010706 fatty liver disease Diseases 0.000 claims description 8
- 208000008338 non-alcoholic fatty liver disease Diseases 0.000 claims description 8
- 230000002265 prevention Effects 0.000 claims description 8
- 231100000240 steatosis hepatitis Toxicity 0.000 claims description 8
- 208000014902 triglyceride storage disease Diseases 0.000 claims description 8
- 239000003550 marker Substances 0.000 claims description 7
- 210000003205 muscle Anatomy 0.000 claims description 7
- 230000000977 initiatory effect Effects 0.000 claims description 5
- 208000002705 Glucose Intolerance Diseases 0.000 claims description 4
- 206010018429 Glucose tolerance impaired Diseases 0.000 claims description 4
- 238000012423 maintenance Methods 0.000 claims description 4
- 208000024891 symptom Diseases 0.000 claims description 4
- 238000012239 gene modification Methods 0.000 claims description 3
- 230000005017 genetic modification Effects 0.000 claims description 3
- 235000013617 genetically modified food Nutrition 0.000 claims description 3
- 102100024985 Lysine-specific histone demethylase 1A Human genes 0.000 claims 5
- 241000699670 Mus sp. Species 0.000 description 204
- 210000004027 cell Anatomy 0.000 description 178
- 241001465754 Metazoa Species 0.000 description 82
- 210000001789 adipocyte Anatomy 0.000 description 60
- 238000004458 analytical method Methods 0.000 description 50
- 210000003486 adipose tissue brown Anatomy 0.000 description 46
- 102000004169 proteins and genes Human genes 0.000 description 44
- 235000018102 proteins Nutrition 0.000 description 42
- 230000001965 increasing effect Effects 0.000 description 38
- 101150006407 NRF1 gene Proteins 0.000 description 37
- 108700019146 Transgenes Proteins 0.000 description 36
- 230000011759 adipose tissue development Effects 0.000 description 30
- 208000035475 disorder Diseases 0.000 description 27
- 230000001590 oxidative effect Effects 0.000 description 27
- 101150022052 UCP1 gene Proteins 0.000 description 25
- 102000045213 human KDM1A Human genes 0.000 description 24
- 230000002293 adipogenic effect Effects 0.000 description 21
- 108020004414 DNA Proteins 0.000 description 20
- 108020004999 messenger RNA Proteins 0.000 description 19
- WQZGKKKJIJFFOK-GASJEMHNSA-N Glucose Natural products OC[C@H]1OC(O)[C@H](O)[C@@H](O)[C@@H]1O WQZGKKKJIJFFOK-GASJEMHNSA-N 0.000 description 18
- 241000699660 Mus musculus Species 0.000 description 18
- 239000008103 glucose Substances 0.000 description 18
- 101100455523 Drosophila melanogaster Lsd-1 gene Proteins 0.000 description 17
- 230000003247 decreasing effect Effects 0.000 description 17
- 238000011830 transgenic mouse model Methods 0.000 description 17
- 238000001262 western blot Methods 0.000 description 17
- 230000002438 mitochondrial effect Effects 0.000 description 16
- 230000037361 pathway Effects 0.000 description 15
- 239000012190 activator Substances 0.000 description 14
- HVYWMOMLDIMFJA-DPAQBDIFSA-N cholesterol Chemical compound C1C=C2C[C@@H](O)CC[C@]2(C)[C@@H]2[C@@H]1[C@@H]1CC[C@H]([C@H](C)CCCC(C)C)[C@@]1(C)CC2 HVYWMOMLDIMFJA-DPAQBDIFSA-N 0.000 description 14
- 102000040945 Transcription factor Human genes 0.000 description 13
- 108091023040 Transcription factor Proteins 0.000 description 13
- 230000015572 biosynthetic process Effects 0.000 description 13
- NOESYZHRGYRDHS-UHFFFAOYSA-N insulin Chemical compound N1C(=O)C(NC(=O)C(CCC(N)=O)NC(=O)C(CCC(O)=O)NC(=O)C(C(C)C)NC(=O)C(NC(=O)CN)C(C)CC)CSSCC(C(NC(CO)C(=O)NC(CC(C)C)C(=O)NC(CC=2C=CC(O)=CC=2)C(=O)NC(CCC(N)=O)C(=O)NC(CC(C)C)C(=O)NC(CCC(O)=O)C(=O)NC(CC(N)=O)C(=O)NC(CC=2C=CC(O)=CC=2)C(=O)NC(CSSCC(NC(=O)C(C(C)C)NC(=O)C(CC(C)C)NC(=O)C(CC=2C=CC(O)=CC=2)NC(=O)C(CC(C)C)NC(=O)C(C)NC(=O)C(CCC(O)=O)NC(=O)C(C(C)C)NC(=O)C(CC(C)C)NC(=O)C(CC=2NC=NC=2)NC(=O)C(CO)NC(=O)CNC2=O)C(=O)NCC(=O)NC(CCC(O)=O)C(=O)NC(CCCNC(N)=N)C(=O)NCC(=O)NC(CC=3C=CC=CC=3)C(=O)NC(CC=3C=CC=CC=3)C(=O)NC(CC=3C=CC(O)=CC=3)C(=O)NC(C(C)O)C(=O)N3C(CCC3)C(=O)NC(CCCCN)C(=O)NC(C)C(O)=O)C(=O)NC(CC(N)=O)C(O)=O)=O)NC(=O)C(C(C)CC)NC(=O)C(CO)NC(=O)C(C(C)O)NC(=O)C1CSSCC2NC(=O)C(CC(C)C)NC(=O)C(NC(=O)C(CCC(N)=O)NC(=O)C(CC(N)=O)NC(=O)C(NC(=O)C(N)CC=1C=CC=CC=1)C(C)C)CC1=CN=CN1 NOESYZHRGYRDHS-UHFFFAOYSA-N 0.000 description 13
- 238000011068 loading method Methods 0.000 description 13
- 101150097636 LSD1 gene Proteins 0.000 description 12
- 108020004459 Small interfering RNA Proteins 0.000 description 12
- 235000021588 free fatty acids Nutrition 0.000 description 12
- 210000004602 germ cell Anatomy 0.000 description 12
- 238000000338 in vitro Methods 0.000 description 12
- 239000004055 small Interfering RNA Substances 0.000 description 12
- 241000699666 Mus <mouse, genus> Species 0.000 description 11
- 239000004098 Tetracycline Substances 0.000 description 11
- 238000001727 in vivo Methods 0.000 description 11
- 210000001161 mammalian embryo Anatomy 0.000 description 11
- 238000004519 manufacturing process Methods 0.000 description 11
- 239000013612 plasmid Substances 0.000 description 11
- 239000002243 precursor Substances 0.000 description 11
- 229930101283 tetracycline Natural products 0.000 description 11
- 229960002180 tetracycline Drugs 0.000 description 11
- 235000019364 tetracycline Nutrition 0.000 description 11
- 150000003522 tetracyclines Chemical class 0.000 description 11
- 108091003079 Bovine Serum Albumin Proteins 0.000 description 10
- 108091028043 Nucleic acid sequence Proteins 0.000 description 10
- 208000036815 beta tubulin Diseases 0.000 description 10
- 230000037396 body weight Effects 0.000 description 10
- 239000012091 fetal bovine serum Substances 0.000 description 10
- 230000006698 induction Effects 0.000 description 10
- 230000001939 inductive effect Effects 0.000 description 10
- 239000000203 mixture Substances 0.000 description 10
- 238000007254 oxidation reaction Methods 0.000 description 10
- 238000003559 RNA-seq method Methods 0.000 description 9
- 102000004243 Tubulin Human genes 0.000 description 9
- 108090000704 Tubulin Proteins 0.000 description 9
- 230000027455 binding Effects 0.000 description 9
- 238000010586 diagram Methods 0.000 description 9
- 229940011871 estrogen Drugs 0.000 description 9
- 239000000262 estrogen Substances 0.000 description 9
- 235000012631 food intake Nutrition 0.000 description 9
- 230000037353 metabolic pathway Effects 0.000 description 9
- 230000010627 oxidative phosphorylation Effects 0.000 description 9
- 239000013598 vector Substances 0.000 description 9
- 239000003981 vehicle Substances 0.000 description 9
- 102100022900 Actin, cytoplasmic 1 Human genes 0.000 description 8
- 108010085238 Actins Proteins 0.000 description 8
- 102000002322 Egg Proteins Human genes 0.000 description 8
- 108010000912 Egg Proteins Proteins 0.000 description 8
- 102000010029 Homer Scaffolding Proteins Human genes 0.000 description 8
- 210000004369 blood Anatomy 0.000 description 8
- 239000008280 blood Substances 0.000 description 8
- 230000008859 change Effects 0.000 description 8
- 230000006870 function Effects 0.000 description 8
- 238000007490 hematoxylin and eosin (H&E) staining Methods 0.000 description 8
- 210000003470 mitochondria Anatomy 0.000 description 8
- 210000004681 ovum Anatomy 0.000 description 8
- 108091026890 Coding region Proteins 0.000 description 7
- 108010077223 Homer Scaffolding Proteins Proteins 0.000 description 7
- 102100038380 Myogenic factor 5 Human genes 0.000 description 7
- 101710099061 Myogenic factor 5 Proteins 0.000 description 7
- 230000003213 activating effect Effects 0.000 description 7
- 230000018109 developmental process Effects 0.000 description 7
- 235000005911 diet Nutrition 0.000 description 7
- 230000037213 diet Effects 0.000 description 7
- 235000014113 dietary fatty acids Nutrition 0.000 description 7
- 229930195729 fatty acid Natural products 0.000 description 7
- 239000000194 fatty acid Substances 0.000 description 7
- 150000004665 fatty acids Chemical class 0.000 description 7
- 230000002503 metabolic effect Effects 0.000 description 7
- 108090000765 processed proteins & peptides Proteins 0.000 description 7
- 230000000241 respiratory effect Effects 0.000 description 7
- 210000002966 serum Anatomy 0.000 description 7
- 230000011664 signaling Effects 0.000 description 7
- 238000010186 staining Methods 0.000 description 7
- 230000003612 virological effect Effects 0.000 description 7
- 210000000636 white adipocyte Anatomy 0.000 description 7
- 102000004877 Insulin Human genes 0.000 description 6
- 108090001061 Insulin Proteins 0.000 description 6
- 102000007330 LDL Lipoproteins Human genes 0.000 description 6
- 108010007622 LDL Lipoproteins Proteins 0.000 description 6
- WQZGKKKJIJFFOK-VFUOTHLCSA-N beta-D-glucose Chemical compound OC[C@H]1O[C@@H](O)[C@H](O)[C@@H](O)[C@@H]1O WQZGKKKJIJFFOK-VFUOTHLCSA-N 0.000 description 6
- 210000001593 brown adipocyte Anatomy 0.000 description 6
- 238000011161 development Methods 0.000 description 6
- 201000010063 epididymitis Diseases 0.000 description 6
- 239000000284 extract Substances 0.000 description 6
- 230000034659 glycolysis Effects 0.000 description 6
- 239000003112 inhibitor Substances 0.000 description 6
- 229940125396 insulin Drugs 0.000 description 6
- 230000010354 integration Effects 0.000 description 6
- 239000002773 nucleotide Substances 0.000 description 6
- 125000003729 nucleotide group Chemical group 0.000 description 6
- 239000013641 positive control Substances 0.000 description 6
- 210000002027 skeletal muscle Anatomy 0.000 description 6
- 230000004102 tricarboxylic acid cycle Effects 0.000 description 6
- UFTFJSFQGQCHQW-UHFFFAOYSA-N triformin Chemical compound O=COCC(OC=O)COC=O UFTFJSFQGQCHQW-UHFFFAOYSA-N 0.000 description 6
- 108091032973 (ribonucleotides)n+m Proteins 0.000 description 5
- CURLTUGMZLYLDI-UHFFFAOYSA-N Carbon dioxide Chemical compound O=C=O CURLTUGMZLYLDI-UHFFFAOYSA-N 0.000 description 5
- 238000001353 Chip-sequencing Methods 0.000 description 5
- 239000006144 Dulbecco’s modified Eagle's medium Substances 0.000 description 5
- 108010001515 Galectin 4 Proteins 0.000 description 5
- 102100039556 Galectin-4 Human genes 0.000 description 5
- 238000011529 RT qPCR Methods 0.000 description 5
- 101150080431 Tfam gene Proteins 0.000 description 5
- 241000700605 Viruses Species 0.000 description 5
- 239000000048 adrenergic agonist Substances 0.000 description 5
- 235000012000 cholesterol Nutrition 0.000 description 5
- 239000012634 fragment Substances 0.000 description 5
- 230000002068 genetic effect Effects 0.000 description 5
- 230000012010 growth Effects 0.000 description 5
- 230000002401 inhibitory effect Effects 0.000 description 5
- 238000007912 intraperitoneal administration Methods 0.000 description 5
- 150000002632 lipids Chemical class 0.000 description 5
- 235000018977 lysine Nutrition 0.000 description 5
- 239000002609 medium Substances 0.000 description 5
- 230000004060 metabolic process Effects 0.000 description 5
- 230000008437 mitochondrial biogenesis Effects 0.000 description 5
- 230000004783 oxidative metabolism Effects 0.000 description 5
- 102000004196 processed proteins & peptides Human genes 0.000 description 5
- 230000001105 regulatory effect Effects 0.000 description 5
- 230000004044 response Effects 0.000 description 5
- IJGRMHOSHXDMSA-UHFFFAOYSA-N Atomic nitrogen Chemical compound N#N IJGRMHOSHXDMSA-UHFFFAOYSA-N 0.000 description 4
- 206010006895 Cachexia Diseases 0.000 description 4
- 102000004190 Enzymes Human genes 0.000 description 4
- 108090000790 Enzymes Proteins 0.000 description 4
- 101150018889 FABP4 gene Proteins 0.000 description 4
- 108010033040 Histones Proteins 0.000 description 4
- 239000004472 Lysine Substances 0.000 description 4
- KDXKERNSBIXSRK-UHFFFAOYSA-N Lysine Natural products NCCCCC(N)C(O)=O KDXKERNSBIXSRK-UHFFFAOYSA-N 0.000 description 4
- 102000007474 Multiprotein Complexes Human genes 0.000 description 4
- 108010085220 Multiprotein Complexes Proteins 0.000 description 4
- 241000283973 Oryctolagus cuniculus Species 0.000 description 4
- 101100321932 Rattus norvegicus Prkaa2 gene Proteins 0.000 description 4
- FAPWRFPIFSIZLT-UHFFFAOYSA-M Sodium chloride Chemical compound [Na+].[Cl-] FAPWRFPIFSIZLT-UHFFFAOYSA-M 0.000 description 4
- NKANXQFJJICGDU-QPLCGJKRSA-N Tamoxifen Chemical compound C=1C=CC=CC=1C(/CC)=C(C=1C=CC(OCCN(C)C)=CC=1)/C1=CC=CC=C1 NKANXQFJJICGDU-QPLCGJKRSA-N 0.000 description 4
- 208000010399 Wasting Syndrome Diseases 0.000 description 4
- 230000009471 action Effects 0.000 description 4
- 208000022531 anorexia Diseases 0.000 description 4
- 210000001109 blastomere Anatomy 0.000 description 4
- 229910002092 carbon dioxide Inorganic materials 0.000 description 4
- 239000001569 carbon dioxide Substances 0.000 description 4
- 230000000453 cell autonomous effect Effects 0.000 description 4
- 238000010367 cloning Methods 0.000 description 4
- 206010061428 decreased appetite Diseases 0.000 description 4
- 230000007613 environmental effect Effects 0.000 description 4
- 238000002474 experimental method Methods 0.000 description 4
- 235000019625 fat content Nutrition 0.000 description 4
- 230000004190 glucose uptake Effects 0.000 description 4
- 238000010185 immunofluorescence analysis Methods 0.000 description 4
- 230000011987 methylation Effects 0.000 description 4
- 238000007069 methylation reaction Methods 0.000 description 4
- 230000005787 mitochondrial ATP synthesis coupled electron transport Effects 0.000 description 4
- 230000008811 mitochondrial respiratory chain Effects 0.000 description 4
- 102000040430 polynucleotide Human genes 0.000 description 4
- 108091033319 polynucleotide Proteins 0.000 description 4
- 239000002157 polynucleotide Substances 0.000 description 4
- 229920001184 polypeptide Polymers 0.000 description 4
- 210000000229 preadipocyte Anatomy 0.000 description 4
- RXWNCPJZOCPEPQ-NVWDDTSBSA-N puromycin Chemical compound C1=CC(OC)=CC=C1C[C@H](N)C(=O)N[C@H]1[C@@H](O)[C@H](N2C3=NC=NC(=C3N=C2)N(C)C)O[C@@H]1CO RXWNCPJZOCPEPQ-NVWDDTSBSA-N 0.000 description 4
- 238000003757 reverse transcription PCR Methods 0.000 description 4
- 239000000523 sample Substances 0.000 description 4
- 210000001082 somatic cell Anatomy 0.000 description 4
- 230000000392 somatic effect Effects 0.000 description 4
- 239000000126 substance Substances 0.000 description 4
- 238000013518 transcription Methods 0.000 description 4
- 230000035897 transcription Effects 0.000 description 4
- 238000001890 transfection Methods 0.000 description 4
- 230000002792 vascular Effects 0.000 description 4
- 101150058502 Acaca gene Proteins 0.000 description 3
- 102100032187 Androgen receptor Human genes 0.000 description 3
- 101100477411 Dictyostelium discoideum set1 gene Proteins 0.000 description 3
- 101150003888 FASN gene Proteins 0.000 description 3
- 108010023302 HDL Cholesterol Proteins 0.000 description 3
- 108010010234 HDL Lipoproteins Proteins 0.000 description 3
- 102000015779 HDL Lipoproteins Human genes 0.000 description 3
- 102100033636 Histone H3.2 Human genes 0.000 description 3
- 101000615488 Homo sapiens Methyl-CpG-binding domain protein 2 Proteins 0.000 description 3
- 102100021299 Methyl-CpG-binding domain protein 2 Human genes 0.000 description 3
- 108020005196 Mitochondrial DNA Proteins 0.000 description 3
- 108091093105 Nuclear DNA Proteins 0.000 description 3
- 108091034117 Oligonucleotide Proteins 0.000 description 3
- 101150000187 PTGS2 gene Proteins 0.000 description 3
- 229920004890 Triton X-100 Polymers 0.000 description 3
- 230000004913 activation Effects 0.000 description 3
- 108010080146 androgen receptors Proteins 0.000 description 3
- 230000002146 bilateral effect Effects 0.000 description 3
- 230000033228 biological regulation Effects 0.000 description 3
- 239000007978 cacodylate buffer Substances 0.000 description 3
- 150000001720 carbohydrates Chemical class 0.000 description 3
- 230000003197 catalytic effect Effects 0.000 description 3
- 238000006243 chemical reaction Methods 0.000 description 3
- 239000002299 complementary DNA Substances 0.000 description 3
- 230000001419 dependent effect Effects 0.000 description 3
- 230000002074 deregulated effect Effects 0.000 description 3
- 238000001514 detection method Methods 0.000 description 3
- 210000002308 embryonic cell Anatomy 0.000 description 3
- 230000002255 enzymatic effect Effects 0.000 description 3
- 238000001943 fluorescence-activated cell sorting Methods 0.000 description 3
- 230000037406 food intake Effects 0.000 description 3
- 238000007446 glucose tolerance test Methods 0.000 description 3
- ZDXPYRJPNDTMRX-UHFFFAOYSA-N glutamine Natural products OC(=O)C(N)CCC(N)=O ZDXPYRJPNDTMRX-UHFFFAOYSA-N 0.000 description 3
- 239000001963 growth medium Substances 0.000 description 3
- 230000001771 impaired effect Effects 0.000 description 3
- 239000000411 inducer Substances 0.000 description 3
- 238000003780 insertion Methods 0.000 description 3
- 230000037431 insertion Effects 0.000 description 3
- 230000004807 localization Effects 0.000 description 3
- 208000030159 metabolic disease Diseases 0.000 description 3
- 238000000520 microinjection Methods 0.000 description 3
- 230000004898 mitochondrial function Effects 0.000 description 3
- 230000036284 oxygen consumption Effects 0.000 description 3
- 230000029279 positive regulation of transcription, DNA-dependent Effects 0.000 description 3
- 238000002360 preparation method Methods 0.000 description 3
- 230000005855 radiation Effects 0.000 description 3
- 230000006798 recombination Effects 0.000 description 3
- 238000005215 recombination Methods 0.000 description 3
- 241000894007 species Species 0.000 description 3
- 230000004584 weight gain Effects 0.000 description 3
- 235000019786 weight gain Nutrition 0.000 description 3
- WZUVPPKBWHMQCE-XJKSGUPXSA-N (+)-haematoxylin Chemical compound C12=CC(O)=C(O)C=C2C[C@]2(O)[C@H]1C1=CC=C(O)C(O)=C1OC2 WZUVPPKBWHMQCE-XJKSGUPXSA-N 0.000 description 2
- SGKRLCUYIXIAHR-AKNGSSGZSA-N (4s,4ar,5s,5ar,6r,12ar)-4-(dimethylamino)-1,5,10,11,12a-pentahydroxy-6-methyl-3,12-dioxo-4a,5,5a,6-tetrahydro-4h-tetracene-2-carboxamide Chemical compound C1=CC=C2[C@H](C)[C@@H]([C@H](O)[C@@H]3[C@](C(O)=C(C(N)=O)C(=O)[C@H]3N(C)C)(O)C3=O)C3=C(O)C2=C1O SGKRLCUYIXIAHR-AKNGSSGZSA-N 0.000 description 2
- VOXZDWNPVJITMN-ZBRFXRBCSA-N 17β-estradiol Chemical compound OC1=CC=C2[C@H]3CC[C@](C)([C@H](CC4)O)[C@@H]4[C@@H]3CCC2=C1 VOXZDWNPVJITMN-ZBRFXRBCSA-N 0.000 description 2
- FWBHETKCLVMNFS-UHFFFAOYSA-N 4',6-Diamino-2-phenylindol Chemical compound C1=CC(C(=N)N)=CC=C1C1=CC2=CC=C(C(N)=N)C=C2N1 FWBHETKCLVMNFS-UHFFFAOYSA-N 0.000 description 2
- UGTJLJZQQFGTJD-UHFFFAOYSA-N Carbonylcyanide-3-chlorophenylhydrazone Chemical compound ClC1=CC=CC(NN=C(C#N)C#N)=C1 UGTJLJZQQFGTJD-UHFFFAOYSA-N 0.000 description 2
- 238000010196 ChIP-seq analysis Methods 0.000 description 2
- 101150011389 Chpt1 gene Proteins 0.000 description 2
- 101150073133 Cpt1a gene Proteins 0.000 description 2
- 208000030814 Eating disease Diseases 0.000 description 2
- 241000196324 Embryophyta Species 0.000 description 2
- 102100038595 Estrogen receptor Human genes 0.000 description 2
- 208000019454 Feeding and Eating disease Diseases 0.000 description 2
- WSFSSNUMVMOOMR-UHFFFAOYSA-N Formaldehyde Chemical compound O=C WSFSSNUMVMOOMR-UHFFFAOYSA-N 0.000 description 2
- WZUVPPKBWHMQCE-UHFFFAOYSA-N Haematoxylin Natural products C12=CC(O)=C(O)C=C2CC2(O)C1C1=CC=C(O)C(O)=C1OC2 WZUVPPKBWHMQCE-UHFFFAOYSA-N 0.000 description 2
- 108010068250 Herpes Simplex Virus Protein Vmw65 Proteins 0.000 description 2
- 241000282412 Homo Species 0.000 description 2
- 206010020772 Hypertension Diseases 0.000 description 2
- 241000713666 Lentivirus Species 0.000 description 2
- 229940123628 Lysine (K)-specific demethylase 1A inhibitor Drugs 0.000 description 2
- 101100220687 Mus musculus Cidea gene Proteins 0.000 description 2
- 101100225058 Mus musculus Ear2 gene Proteins 0.000 description 2
- 102000006746 NADH Dehydrogenase Human genes 0.000 description 2
- 108010086428 NADH Dehydrogenase Proteins 0.000 description 2
- 238000005481 NMR spectroscopy Methods 0.000 description 2
- 206010028980 Neoplasm Diseases 0.000 description 2
- 101150003469 Nr2f6 gene Proteins 0.000 description 2
- YASAKCUCGLMORW-UHFFFAOYSA-N Rosiglitazone Chemical compound C=1C=CC=NC=1N(C)CCOC(C=C1)=CC=C1CC1SC(=O)NC1=O YASAKCUCGLMORW-UHFFFAOYSA-N 0.000 description 2
- 108700009124 Transcription Initiation Site Proteins 0.000 description 2
- 101150076688 UCP2 gene Proteins 0.000 description 2
- 101150016260 UCP3 gene Proteins 0.000 description 2
- JLCPHMBAVCMARE-UHFFFAOYSA-N [3-[[3-[[3-[[3-[[3-[[3-[[3-[[3-[[3-[[3-[[3-[[5-(2-amino-6-oxo-1H-purin-9-yl)-3-[[3-[[3-[[3-[[3-[[3-[[5-(2-amino-6-oxo-1H-purin-9-yl)-3-[[5-(2-amino-6-oxo-1H-purin-9-yl)-3-hydroxyoxolan-2-yl]methoxy-hydroxyphosphoryl]oxyoxolan-2-yl]methoxy-hydroxyphosphoryl]oxy-5-(5-methyl-2,4-dioxopyrimidin-1-yl)oxolan-2-yl]methoxy-hydroxyphosphoryl]oxy-5-(6-aminopurin-9-yl)oxolan-2-yl]methoxy-hydroxyphosphoryl]oxy-5-(6-aminopurin-9-yl)oxolan-2-yl]methoxy-hydroxyphosphoryl]oxy-5-(6-aminopurin-9-yl)oxolan-2-yl]methoxy-hydroxyphosphoryl]oxy-5-(6-aminopurin-9-yl)oxolan-2-yl]methoxy-hydroxyphosphoryl]oxyoxolan-2-yl]methoxy-hydroxyphosphoryl]oxy-5-(5-methyl-2,4-dioxopyrimidin-1-yl)oxolan-2-yl]methoxy-hydroxyphosphoryl]oxy-5-(4-amino-2-oxopyrimidin-1-yl)oxolan-2-yl]methoxy-hydroxyphosphoryl]oxy-5-(5-methyl-2,4-dioxopyrimidin-1-yl)oxolan-2-yl]methoxy-hydroxyphosphoryl]oxy-5-(5-methyl-2,4-dioxopyrimidin-1-yl)oxolan-2-yl]methoxy-hydroxyphosphoryl]oxy-5-(6-aminopurin-9-yl)oxolan-2-yl]methoxy-hydroxyphosphoryl]oxy-5-(6-aminopurin-9-yl)oxolan-2-yl]methoxy-hydroxyphosphoryl]oxy-5-(4-amino-2-oxopyrimidin-1-yl)oxolan-2-yl]methoxy-hydroxyphosphoryl]oxy-5-(4-amino-2-oxopyrimidin-1-yl)oxolan-2-yl]methoxy-hydroxyphosphoryl]oxy-5-(4-amino-2-oxopyrimidin-1-yl)oxolan-2-yl]methoxy-hydroxyphosphoryl]oxy-5-(6-aminopurin-9-yl)oxolan-2-yl]methoxy-hydroxyphosphoryl]oxy-5-(4-amino-2-oxopyrimidin-1-yl)oxolan-2-yl]methyl [5-(6-aminopurin-9-yl)-2-(hydroxymethyl)oxolan-3-yl] hydrogen phosphate Polymers Cc1cn(C2CC(OP(O)(=O)OCC3OC(CC3OP(O)(=O)OCC3OC(CC3O)n3cnc4c3nc(N)[nH]c4=O)n3cnc4c3nc(N)[nH]c4=O)C(COP(O)(=O)OC3CC(OC3COP(O)(=O)OC3CC(OC3COP(O)(=O)OC3CC(OC3COP(O)(=O)OC3CC(OC3COP(O)(=O)OC3CC(OC3COP(O)(=O)OC3CC(OC3COP(O)(=O)OC3CC(OC3COP(O)(=O)OC3CC(OC3COP(O)(=O)OC3CC(OC3COP(O)(=O)OC3CC(OC3COP(O)(=O)OC3CC(OC3COP(O)(=O)OC3CC(OC3COP(O)(=O)OC3CC(OC3COP(O)(=O)OC3CC(OC3COP(O)(=O)OC3CC(OC3COP(O)(=O)OC3CC(OC3COP(O)(=O)OC3CC(OC3CO)n3cnc4c(N)ncnc34)n3ccc(N)nc3=O)n3cnc4c(N)ncnc34)n3ccc(N)nc3=O)n3ccc(N)nc3=O)n3ccc(N)nc3=O)n3cnc4c(N)ncnc34)n3cnc4c(N)ncnc34)n3cc(C)c(=O)[nH]c3=O)n3cc(C)c(=O)[nH]c3=O)n3ccc(N)nc3=O)n3cc(C)c(=O)[nH]c3=O)n3cnc4c3nc(N)[nH]c4=O)n3cnc4c(N)ncnc34)n3cnc4c(N)ncnc34)n3cnc4c(N)ncnc34)n3cnc4c(N)ncnc34)O2)c(=O)[nH]c1=O JLCPHMBAVCMARE-UHFFFAOYSA-N 0.000 description 2
- 230000004075 alteration Effects 0.000 description 2
- 150000001413 amino acids Chemical group 0.000 description 2
- 230000004596 appetite loss Effects 0.000 description 2
- 210000004507 artificial chromosome Anatomy 0.000 description 2
- 238000003556 assay Methods 0.000 description 2
- 230000008901 benefit Effects 0.000 description 2
- 238000002306 biochemical method Methods 0.000 description 2
- 230000004071 biological effect Effects 0.000 description 2
- 210000002459 blastocyst Anatomy 0.000 description 2
- 238000009395 breeding Methods 0.000 description 2
- 230000001488 breeding effect Effects 0.000 description 2
- -1 but not limited to Chemical class 0.000 description 2
- 201000011510 cancer Diseases 0.000 description 2
- 230000015556 catabolic process Effects 0.000 description 2
- 238000004113 cell culture Methods 0.000 description 2
- 230000024245 cell differentiation Effects 0.000 description 2
- 230000032823 cell division Effects 0.000 description 2
- 239000003795 chemical substances by application Substances 0.000 description 2
- 238000002487 chromatin immunoprecipitation Methods 0.000 description 2
- 230000002950 deficient Effects 0.000 description 2
- 238000006731 degradation reaction Methods 0.000 description 2
- 230000009274 differential gene expression Effects 0.000 description 2
- 235000014632 disordered eating Nutrition 0.000 description 2
- 238000009826 distribution Methods 0.000 description 2
- 239000003937 drug carrier Substances 0.000 description 2
- 230000004064 dysfunction Effects 0.000 description 2
- 230000027721 electron transport chain Effects 0.000 description 2
- 239000003623 enhancer Substances 0.000 description 2
- YQGOJNYOYNNSMM-UHFFFAOYSA-N eosin Chemical compound [Na+].OC(=O)C1=CC=CC=C1C1=C2C=C(Br)C(=O)C(Br)=C2OC2=C(Br)C(O)=C(Br)C=C21 YQGOJNYOYNNSMM-UHFFFAOYSA-N 0.000 description 2
- 235000020776 essential amino acid Nutrition 0.000 description 2
- 239000003797 essential amino acid Substances 0.000 description 2
- 108010038795 estrogen receptors Proteins 0.000 description 2
- 238000000605 extraction Methods 0.000 description 2
- 239000007850 fluorescent dye Substances 0.000 description 2
- 238000009472 formulation Methods 0.000 description 2
- 239000000446 fuel Substances 0.000 description 2
- 230000002538 fungal effect Effects 0.000 description 2
- 230000009368 gene silencing by RNA Effects 0.000 description 2
- 238000003018 immunoassay Methods 0.000 description 2
- 238000010166 immunofluorescence Methods 0.000 description 2
- 230000001976 improved effect Effects 0.000 description 2
- 208000015181 infectious disease Diseases 0.000 description 2
- 238000002347 injection Methods 0.000 description 2
- 239000007924 injection Substances 0.000 description 2
- 238000007689 inspection Methods 0.000 description 2
- 239000012212 insulator Substances 0.000 description 2
- 239000007788 liquid Substances 0.000 description 2
- 208000019017 loss of appetite Diseases 0.000 description 2
- 235000021266 loss of appetite Nutrition 0.000 description 2
- 210000004962 mammalian cell Anatomy 0.000 description 2
- 230000001404 mediated effect Effects 0.000 description 2
- 210000004379 membrane Anatomy 0.000 description 2
- 239000012528 membrane Substances 0.000 description 2
- 210000001700 mitochondrial membrane Anatomy 0.000 description 2
- 230000004048 modification Effects 0.000 description 2
- 238000012986 modification Methods 0.000 description 2
- 229930014626 natural product Natural products 0.000 description 2
- 239000013642 negative control Substances 0.000 description 2
- 229910052757 nitrogen Inorganic materials 0.000 description 2
- 230000002018 overexpression Effects 0.000 description 2
- 230000003647 oxidation Effects 0.000 description 2
- 239000012188 paraffin wax Substances 0.000 description 2
- 239000008188 pellet Substances 0.000 description 2
- 230000002028 premature Effects 0.000 description 2
- 229950010131 puromycin Drugs 0.000 description 2
- 210000003314 quadriceps muscle Anatomy 0.000 description 2
- 238000003753 real-time PCR Methods 0.000 description 2
- 230000009467 reduction Effects 0.000 description 2
- 230000029058 respiratory gaseous exchange Effects 0.000 description 2
- 208000001076 sarcopenia Diseases 0.000 description 2
- 239000000243 solution Substances 0.000 description 2
- 230000008925 spontaneous activity Effects 0.000 description 2
- 230000000638 stimulation Effects 0.000 description 2
- 230000004083 survival effect Effects 0.000 description 2
- 238000003786 synthesis reaction Methods 0.000 description 2
- 230000009885 systemic effect Effects 0.000 description 2
- 229960001603 tamoxifen Drugs 0.000 description 2
- 230000008685 targeting Effects 0.000 description 2
- 230000035924 thermogenesis Effects 0.000 description 2
- 230000008467 tissue growth Effects 0.000 description 2
- 230000002103 transcriptional effect Effects 0.000 description 2
- 230000037426 transcriptional repression Effects 0.000 description 2
- 230000009466 transformation Effects 0.000 description 2
- 150000003626 triacylglycerols Chemical class 0.000 description 2
- 239000013603 viral vector Substances 0.000 description 2
- XLYOFNOQVPJJNP-UHFFFAOYSA-N water Substances O XLYOFNOQVPJJNP-UHFFFAOYSA-N 0.000 description 2
- QKNYBSVHEMOAJP-UHFFFAOYSA-N 2-amino-2-(hydroxymethyl)propane-1,3-diol;hydron;chloride Chemical compound Cl.OCC(N)(CO)CO QKNYBSVHEMOAJP-UHFFFAOYSA-N 0.000 description 1
- JNLCUVJKTXKKSG-UHFFFAOYSA-N 2-hydroxypropane-1,2,3-tricarboxylic acid;lead Chemical compound [Pb].OC(=O)CC(O)(C(O)=O)CC(O)=O JNLCUVJKTXKKSG-UHFFFAOYSA-N 0.000 description 1
- APIXJSLKIYYUKG-UHFFFAOYSA-N 3 Isobutyl 1 methylxanthine Chemical compound O=C1N(C)C(=O)N(CC(C)C)C2=C1N=CN2 APIXJSLKIYYUKG-UHFFFAOYSA-N 0.000 description 1
- 108020005345 3' Untranslated Regions Proteins 0.000 description 1
- DODQJNMQWMSYGS-QPLCGJKRSA-N 4-[(z)-1-[4-[2-(dimethylamino)ethoxy]phenyl]-1-phenylbut-1-en-2-yl]phenol Chemical compound C=1C=C(O)C=CC=1C(/CC)=C(C=1C=CC(OCCN(C)C)=CC=1)/C1=CC=CC=C1 DODQJNMQWMSYGS-QPLCGJKRSA-N 0.000 description 1
- 102100022089 Acyl-[acyl-carrier-protein] hydrolase Human genes 0.000 description 1
- 102000002281 Adenylate kinase Human genes 0.000 description 1
- 108020000543 Adenylate kinase Proteins 0.000 description 1
- 235000002198 Annona diversifolia Nutrition 0.000 description 1
- 201000001321 Bardet-Biedl syndrome Diseases 0.000 description 1
- 241000283690 Bos taurus Species 0.000 description 1
- 241000282832 Camelidae Species 0.000 description 1
- 241000282472 Canis lupus familiaris Species 0.000 description 1
- 241000283707 Capra Species 0.000 description 1
- 241000700198 Cavia Species 0.000 description 1
- 108010077544 Chromatin Proteins 0.000 description 1
- 108010051219 Cre recombinase Proteins 0.000 description 1
- 102000000634 Cytochrome c oxidase subunit IV Human genes 0.000 description 1
- 108090000365 Cytochrome-c oxidases Proteins 0.000 description 1
- 102000053602 DNA Human genes 0.000 description 1
- 230000004568 DNA-binding Effects 0.000 description 1
- 108090000204 Dipeptidase 1 Proteins 0.000 description 1
- 208000016546 Distal 16p11.2 microdeletion syndrome Diseases 0.000 description 1
- 208000032928 Dyslipidaemia Diseases 0.000 description 1
- KCXVZYZYPLLWCC-UHFFFAOYSA-N EDTA Chemical compound OC(=O)CN(CC(O)=O)CCN(CC(O)=O)CC(O)=O KCXVZYZYPLLWCC-UHFFFAOYSA-N 0.000 description 1
- 239000006145 Eagle's minimal essential medium Substances 0.000 description 1
- 102000015782 Electron Transport Complex III Human genes 0.000 description 1
- 108010024882 Electron Transport Complex III Proteins 0.000 description 1
- 101100480757 Emericella nidulans (strain FGSC A4 / ATCC 38163 / CBS 112.46 / NRRL 194 / M139) tbpA gene Proteins 0.000 description 1
- 108010067770 Endopeptidase K Proteins 0.000 description 1
- 241000283086 Equidae Species 0.000 description 1
- 241000588724 Escherichia coli Species 0.000 description 1
- LFQSCWFLJHTTHZ-UHFFFAOYSA-N Ethanol Chemical compound CCO LFQSCWFLJHTTHZ-UHFFFAOYSA-N 0.000 description 1
- 108010039731 Fatty Acid Synthases Proteins 0.000 description 1
- SXRSQZLOMIGNAQ-UHFFFAOYSA-N Glutaraldehyde Chemical compound O=CCCCC=O SXRSQZLOMIGNAQ-UHFFFAOYSA-N 0.000 description 1
- 102100021519 Hemoglobin subunit beta Human genes 0.000 description 1
- 108091005904 Hemoglobin subunit beta Proteins 0.000 description 1
- 102000008157 Histone Demethylases Human genes 0.000 description 1
- 108010074870 Histone Demethylases Proteins 0.000 description 1
- 101000882584 Homo sapiens Estrogen receptor Proteins 0.000 description 1
- 108010001336 Horseradish Peroxidase Proteins 0.000 description 1
- 101150003028 Hprt1 gene Proteins 0.000 description 1
- 206010020710 Hyperphagia Diseases 0.000 description 1
- 206010020880 Hypertrophy Diseases 0.000 description 1
- 201000001431 Hyperuricemia Diseases 0.000 description 1
- 102100034343 Integrase Human genes 0.000 description 1
- 241001633663 Iris pseudacorus Species 0.000 description 1
- ZDXPYRJPNDTMRX-VKHMYHEASA-N L-glutamine Chemical compound OC(=O)[C@@H](N)CCC(N)=O ZDXPYRJPNDTMRX-VKHMYHEASA-N 0.000 description 1
- 241000282838 Lama Species 0.000 description 1
- 206010056715 Laurence-Moon-Bardet-Biedl syndrome Diseases 0.000 description 1
- 108091026898 Leader sequence (mRNA) Proteins 0.000 description 1
- 208000017170 Lipid metabolism disease Diseases 0.000 description 1
- 206010024612 Lipoma Diseases 0.000 description 1
- 108060001084 Luciferase Proteins 0.000 description 1
- 239000005089 Luciferase Substances 0.000 description 1
- 208000002720 Malnutrition Diseases 0.000 description 1
- 108010050258 Mitochondrial Uncoupling Proteins Proteins 0.000 description 1
- 102100029820 Mitochondrial brown fat uncoupling protein 1 Human genes 0.000 description 1
- 241001529936 Murinae Species 0.000 description 1
- 206010028289 Muscle atrophy Diseases 0.000 description 1
- 108010020197 Myogenic Regulatory Factor 5 Proteins 0.000 description 1
- 108010026113 NADH Tetrazolium Reductase Proteins 0.000 description 1
- 239000000020 Nitrocellulose Substances 0.000 description 1
- 102000004316 Oxidoreductases Human genes 0.000 description 1
- 108090000854 Oxidoreductases Proteins 0.000 description 1
- 238000009004 PCR Kit Methods 0.000 description 1
- 238000012408 PCR amplification Methods 0.000 description 1
- 101150023417 PPARG gene Proteins 0.000 description 1
- 229930040373 Paraformaldehyde Natural products 0.000 description 1
- 241001494479 Pecora Species 0.000 description 1
- 206010036049 Polycystic ovaries Diseases 0.000 description 1
- 108010005991 Pork Regular Insulin Proteins 0.000 description 1
- GOOHAUXETOMSMM-UHFFFAOYSA-N Propylene oxide Chemical compound CC1CO1 GOOHAUXETOMSMM-UHFFFAOYSA-N 0.000 description 1
- 229940124158 Protease/peptidase inhibitor Drugs 0.000 description 1
- 239000012083 RIPA buffer Substances 0.000 description 1
- 238000012228 RNA interference-mediated gene silencing Methods 0.000 description 1
- 239000013614 RNA sample Substances 0.000 description 1
- 108010092799 RNA-directed DNA polymerase Proteins 0.000 description 1
- 108091030071 RNAI Proteins 0.000 description 1
- 241000700159 Rattus Species 0.000 description 1
- 108010091086 Recombinases Proteins 0.000 description 1
- 102000018120 Recombinases Human genes 0.000 description 1
- 108700008625 Reporter Genes Proteins 0.000 description 1
- 240000004808 Saccharomyces cerevisiae Species 0.000 description 1
- 229920002684 Sepharose Polymers 0.000 description 1
- 241000700584 Simplexvirus Species 0.000 description 1
- 238000000692 Student's t-test Methods 0.000 description 1
- 102000019259 Succinate Dehydrogenase Human genes 0.000 description 1
- 108010012901 Succinate Dehydrogenase Proteins 0.000 description 1
- 229930006000 Sucrose Natural products 0.000 description 1
- CZMRCDWAGMRECN-UGDNZRGBSA-N Sucrose Chemical compound O[C@H]1[C@H](O)[C@@H](CO)O[C@@]1(CO)O[C@@H]1[C@H](O)[C@@H](O)[C@H](O)[C@@H](CO)O1 CZMRCDWAGMRECN-UGDNZRGBSA-N 0.000 description 1
- 241000282887 Suidae Species 0.000 description 1
- 108700026226 TATA Box Proteins 0.000 description 1
- 108091036066 Three prime untranslated region Proteins 0.000 description 1
- 102400000062 Transcription factor NRF1 Human genes 0.000 description 1
- 101800000160 Transcription factor NRF1 Proteins 0.000 description 1
- 239000007983 Tris buffer Substances 0.000 description 1
- 108090000631 Trypsin Proteins 0.000 description 1
- 102000004142 Trypsin Human genes 0.000 description 1
- COQLPRJCUIATTQ-UHFFFAOYSA-N Uranyl acetate Chemical compound O.O.O=[U]=O.CC(O)=O.CC(O)=O COQLPRJCUIATTQ-UHFFFAOYSA-N 0.000 description 1
- 102000013814 Wnt Human genes 0.000 description 1
- 108050003627 Wnt Proteins 0.000 description 1
- 210000000683 abdominal cavity Anatomy 0.000 description 1
- 230000003187 abdominal effect Effects 0.000 description 1
- 201000010272 acanthosis nigricans Diseases 0.000 description 1
- 230000001800 adrenalinergic effect Effects 0.000 description 1
- 230000002411 adverse Effects 0.000 description 1
- 230000000692 anti-sense effect Effects 0.000 description 1
- 239000000427 antigen Substances 0.000 description 1
- 108091007433 antigens Proteins 0.000 description 1
- 102000036639 antigens Human genes 0.000 description 1
- 239000012736 aqueous medium Substances 0.000 description 1
- 230000003416 augmentation Effects 0.000 description 1
- 230000001580 bacterial effect Effects 0.000 description 1
- 230000004888 barrier function Effects 0.000 description 1
- 102000006635 beta-lactamase Human genes 0.000 description 1
- 238000004166 bioassay Methods 0.000 description 1
- 239000013060 biological fluid Substances 0.000 description 1
- 238000010170 biological method Methods 0.000 description 1
- 230000005540 biological transmission Effects 0.000 description 1
- 238000001574 biopsy Methods 0.000 description 1
- 210000004952 blastocoel Anatomy 0.000 description 1
- 230000008499 blood brain barrier function Effects 0.000 description 1
- 210000001218 blood-brain barrier Anatomy 0.000 description 1
- 210000001124 body fluid Anatomy 0.000 description 1
- 239000010839 body fluid Substances 0.000 description 1
- 230000036760 body temperature Effects 0.000 description 1
- 238000009529 body temperature measurement Methods 0.000 description 1
- 210000004556 brain Anatomy 0.000 description 1
- 235000010633 broth Nutrition 0.000 description 1
- 239000003153 chemical reaction reagent Substances 0.000 description 1
- YTRQFSDWAXHJCC-UHFFFAOYSA-N chloroform;phenol Chemical compound ClC(Cl)Cl.OC1=CC=CC=C1 YTRQFSDWAXHJCC-UHFFFAOYSA-N 0.000 description 1
- 210000003483 chromatin Anatomy 0.000 description 1
- 230000002759 chromosomal effect Effects 0.000 description 1
- 238000000749 co-immunoprecipitation Methods 0.000 description 1
- 230000003081 coactivator Effects 0.000 description 1
- 230000008645 cold stress Effects 0.000 description 1
- 239000000039 congener Substances 0.000 description 1
- 230000001276 controlling effect Effects 0.000 description 1
- 238000007796 conventional method Methods 0.000 description 1
- 238000009402 cross-breeding Methods 0.000 description 1
- 239000003145 cytotoxic factor Substances 0.000 description 1
- 238000007405 data analysis Methods 0.000 description 1
- 230000007123 defense Effects 0.000 description 1
- 230000018044 dehydration Effects 0.000 description 1
- 238000006297 dehydration reaction Methods 0.000 description 1
- 230000017858 demethylation Effects 0.000 description 1
- 238000010520 demethylation reaction Methods 0.000 description 1
- 229960003964 deoxycholic acid Drugs 0.000 description 1
- KXGVEGMKQFWNSR-LLQZFEROSA-N deoxycholic acid Chemical compound C([C@H]1CC2)[C@H](O)CC[C@]1(C)[C@@H]1[C@@H]2[C@@H]2CC[C@H]([C@@H](CCC(O)=O)C)[C@@]2(C)[C@@H](O)C1 KXGVEGMKQFWNSR-LLQZFEROSA-N 0.000 description 1
- UREBDLICKHMUKA-CXSFZGCWSA-N dexamethasone Chemical compound C1CC2=CC(=O)C=C[C@]2(C)[C@]2(F)[C@@H]1[C@@H]1C[C@@H](C)[C@@](C(=O)CO)(O)[C@@]1(C)C[C@@H]2O UREBDLICKHMUKA-CXSFZGCWSA-N 0.000 description 1
- 229960003957 dexamethasone Drugs 0.000 description 1
- 125000000118 dimethyl group Chemical group [H]C([H])([H])* 0.000 description 1
- 201000010099 disease Diseases 0.000 description 1
- 238000009509 drug development Methods 0.000 description 1
- 238000007876 drug discovery Methods 0.000 description 1
- 238000001378 electrochemiluminescence detection Methods 0.000 description 1
- 210000001671 embryonic stem cell Anatomy 0.000 description 1
- 210000002257 embryonic structure Anatomy 0.000 description 1
- 238000005265 energy consumption Methods 0.000 description 1
- 230000006571 energy metabolism pathway Effects 0.000 description 1
- 238000005516 engineering process Methods 0.000 description 1
- 210000000918 epididymis Anatomy 0.000 description 1
- 229960005309 estradiol Drugs 0.000 description 1
- 239000003687 estradiol congener Substances 0.000 description 1
- 210000003527 eukaryotic cell Anatomy 0.000 description 1
- 210000003414 extremity Anatomy 0.000 description 1
- 210000003195 fascia Anatomy 0.000 description 1
- 230000004151 fermentation Effects 0.000 description 1
- 238000000855 fermentation Methods 0.000 description 1
- 238000000684 flow cytometry Methods 0.000 description 1
- 235000013305 food Nutrition 0.000 description 1
- 238000005194 fractionation Methods 0.000 description 1
- 230000037433 frameshift Effects 0.000 description 1
- 230000004927 fusion Effects 0.000 description 1
- 239000000499 gel Substances 0.000 description 1
- 238000010353 genetic engineering Methods 0.000 description 1
- 238000003205 genotyping method Methods 0.000 description 1
- 230000004110 gluconeogenesis Effects 0.000 description 1
- 125000002791 glucosyl group Chemical group C1([C@H](O)[C@@H](O)[C@H](O)[C@H](O1)CO)* 0.000 description 1
- 230000036541 health Effects 0.000 description 1
- 230000001744 histochemical effect Effects 0.000 description 1
- 229940088597 hormone Drugs 0.000 description 1
- 239000005556 hormone Substances 0.000 description 1
- 238000009396 hybridization Methods 0.000 description 1
- 201000001421 hyperglycemia Diseases 0.000 description 1
- 230000002631 hypothermal effect Effects 0.000 description 1
- 230000000729 hypotrophic effect Effects 0.000 description 1
- 238000003384 imaging method Methods 0.000 description 1
- 238000007654 immersion Methods 0.000 description 1
- 238000003125 immunofluorescent labeling Methods 0.000 description 1
- 238000011534 incubation Methods 0.000 description 1
- 238000001802 infusion Methods 0.000 description 1
- 230000003993 interaction Effects 0.000 description 1
- 230000002452 interceptive effect Effects 0.000 description 1
- 238000001990 intravenous administration Methods 0.000 description 1
- 230000005865 ionizing radiation Effects 0.000 description 1
- 210000003734 kidney Anatomy 0.000 description 1
- 238000011813 knockout mouse model Methods 0.000 description 1
- 239000003446 ligand Substances 0.000 description 1
- 230000000670 limiting effect Effects 0.000 description 1
- 230000006372 lipid accumulation Effects 0.000 description 1
- 210000003141 lower extremity Anatomy 0.000 description 1
- 230000006216 lysine-methylation Effects 0.000 description 1
- 150000002669 lysines Chemical class 0.000 description 1
- 230000003211 malignant effect Effects 0.000 description 1
- 230000001071 malnutrition Effects 0.000 description 1
- 235000000824 malnutrition Nutrition 0.000 description 1
- 230000035800 maturation Effects 0.000 description 1
- 238000005259 measurement Methods 0.000 description 1
- 230000003818 metabolic dysfunction Effects 0.000 description 1
- 125000002496 methyl group Chemical group [H]C([H])([H])* 0.000 description 1
- 230000006677 mitochondrial metabolism Effects 0.000 description 1
- 230000006540 mitochondrial respiration Effects 0.000 description 1
- 230000030544 mitochondrion distribution Effects 0.000 description 1
- 238000010369 molecular cloning Methods 0.000 description 1
- 201000000585 muscular atrophy Diseases 0.000 description 1
- 230000035772 mutation Effects 0.000 description 1
- 229930027945 nicotinamide-adenine dinucleotide Natural products 0.000 description 1
- BOPGDPNILDQYTO-NNYOXOHSSA-N nicotinamide-adenine dinucleotide Chemical compound C1=CCC(C(=O)N)=CN1[C@H]1[C@H](O)[C@H](O)[C@@H](COP(O)(=O)OP(O)(=O)OC[C@@H]2[C@H]([C@@H](O)[C@@H](O2)N2C3=NC=NC(N)=C3N=C2)O)O1 BOPGDPNILDQYTO-NNYOXOHSSA-N 0.000 description 1
- JPXMTWWFLBLUCD-UHFFFAOYSA-N nitro blue tetrazolium(2+) Chemical compound COC1=CC(C=2C=C(OC)C(=CC=2)[N+]=2N(N=C(N=2)C=2C=CC=CC=2)C=2C=CC(=CC=2)[N+]([O-])=O)=CC=C1[N+]1=NC(C=2C=CC=CC=2)=NN1C1=CC=C([N+]([O-])=O)C=C1 JPXMTWWFLBLUCD-UHFFFAOYSA-N 0.000 description 1
- 229920001220 nitrocellulos Polymers 0.000 description 1
- 238000010606 normalization Methods 0.000 description 1
- 102000027507 nuclear receptors type II Human genes 0.000 description 1
- 108091008686 nuclear receptors type II Proteins 0.000 description 1
- 238000007899 nucleic acid hybridization Methods 0.000 description 1
- 210000004940 nucleus Anatomy 0.000 description 1
- 208000015380 nutritional deficiency disease Diseases 0.000 description 1
- 108010007425 oligomycin sensitivity conferring protein Proteins 0.000 description 1
- 210000000287 oocyte Anatomy 0.000 description 1
- 210000000056 organ Anatomy 0.000 description 1
- 229910000489 osmium tetroxide Inorganic materials 0.000 description 1
- 229920002866 paraformaldehyde Polymers 0.000 description 1
- 238000003068 pathway analysis Methods 0.000 description 1
- 239000000137 peptide hydrolase inhibitor Substances 0.000 description 1
- 210000004303 peritoneum Anatomy 0.000 description 1
- 239000008194 pharmaceutical composition Substances 0.000 description 1
- 230000037081 physical activity Effects 0.000 description 1
- 238000000053 physical method Methods 0.000 description 1
- 230000035790 physiological processes and functions Effects 0.000 description 1
- 230000006461 physiological response Effects 0.000 description 1
- 229920002401 polyacrylamide Polymers 0.000 description 1
- 201000010065 polycystic ovary syndrome Diseases 0.000 description 1
- 230000004481 post-translational protein modification Effects 0.000 description 1
- 229940124606 potential therapeutic agent Drugs 0.000 description 1
- 230000003389 potentiating effect Effects 0.000 description 1
- 230000000750 progressive effect Effects 0.000 description 1
- 210000001236 prokaryotic cell Anatomy 0.000 description 1
- 230000001737 promoting effect Effects 0.000 description 1
- 230000001902 propagating effect Effects 0.000 description 1
- 238000011002 quantification Methods 0.000 description 1
- 230000022532 regulation of transcription, DNA-dependent Effects 0.000 description 1
- 230000008844 regulatory mechanism Effects 0.000 description 1
- 238000009877 rendering Methods 0.000 description 1
- 230000010076 replication Effects 0.000 description 1
- 230000000754 repressing effect Effects 0.000 description 1
- 230000027272 reproductive process Effects 0.000 description 1
- 238000011160 research Methods 0.000 description 1
- 230000035806 respiratory chain Effects 0.000 description 1
- 229960004586 rosiglitazone Drugs 0.000 description 1
- 230000000276 sedentary effect Effects 0.000 description 1
- 238000012163 sequencing technique Methods 0.000 description 1
- 230000014639 sexual reproduction Effects 0.000 description 1
- 230000007781 signaling event Effects 0.000 description 1
- 239000002356 single layer Substances 0.000 description 1
- 150000003384 small molecules Chemical class 0.000 description 1
- 239000011780 sodium chloride Substances 0.000 description 1
- 238000003153 stable transfection Methods 0.000 description 1
- 238000010561 standard procedure Methods 0.000 description 1
- 238000007920 subcutaneous administration Methods 0.000 description 1
- 239000000758 substrate Substances 0.000 description 1
- 239000005720 sucrose Substances 0.000 description 1
- 208000011580 syndromic disease Diseases 0.000 description 1
- 101150023847 tbp gene Proteins 0.000 description 1
- 101150020633 tbp-1 gene Proteins 0.000 description 1
- 230000002123 temporal effect Effects 0.000 description 1
- 108700020534 tetracycline resistance-encoding transposon repressor Proteins 0.000 description 1
- 238000011285 therapeutic regimen Methods 0.000 description 1
- 238000006257 total synthesis reaction Methods 0.000 description 1
- 108091006106 transcriptional activators Proteins 0.000 description 1
- 238000011222 transcriptome analysis Methods 0.000 description 1
- 238000012546 transfer Methods 0.000 description 1
- 238000003146 transient transfection Methods 0.000 description 1
- 238000013519 translation Methods 0.000 description 1
- LENZDBCJOHFCAS-UHFFFAOYSA-N tris Chemical compound OCC(N)(CO)CO LENZDBCJOHFCAS-UHFFFAOYSA-N 0.000 description 1
- 239000012588 trypsin Substances 0.000 description 1
- 241000701161 unidentified adenovirus Species 0.000 description 1
- 241001529453 unidentified herpesvirus Species 0.000 description 1
- 241001430294 unidentified retrovirus Species 0.000 description 1
- 230000003827 upregulation Effects 0.000 description 1
- 238000011144 upstream manufacturing Methods 0.000 description 1
- 210000003462 vein Anatomy 0.000 description 1
- 230000009278 visceral effect Effects 0.000 description 1
- 230000003442 weekly effect Effects 0.000 description 1
- 210000004340 zona pellucida Anatomy 0.000 description 1
Images


Classifications
-
- A—HUMAN NECESSITIES
- A01—AGRICULTURE; FORESTRY; ANIMAL HUSBANDRY; HUNTING; TRAPPING; FISHING
- A01K—ANIMAL HUSBANDRY; AVICULTURE; APICULTURE; PISCICULTURE; FISHING; REARING OR BREEDING ANIMALS, NOT OTHERWISE PROVIDED FOR; NEW BREEDS OF ANIMALS
- A01K67/00—Rearing or breeding animals, not otherwise provided for; New or modified breeds of animals
- A01K67/027—New or modified breeds of vertebrates
- A01K67/0275—Genetically modified vertebrates, e.g. transgenic
- A01K67/0276—Knock-out vertebrates
-
- A—HUMAN NECESSITIES
- A01—AGRICULTURE; FORESTRY; ANIMAL HUSBANDRY; HUNTING; TRAPPING; FISHING
- A01K—ANIMAL HUSBANDRY; AVICULTURE; APICULTURE; PISCICULTURE; FISHING; REARING OR BREEDING ANIMALS, NOT OTHERWISE PROVIDED FOR; NEW BREEDS OF ANIMALS
- A01K67/00—Rearing or breeding animals, not otherwise provided for; New or modified breeds of animals
- A01K67/027—New or modified breeds of vertebrates
- A01K67/0275—Genetically modified vertebrates, e.g. transgenic
- A01K67/0278—Knock-in vertebrates, e.g. humanised vertebrates
-
- C—CHEMISTRY; METALLURGY
- C12—BIOCHEMISTRY; BEER; SPIRITS; WINE; VINEGAR; MICROBIOLOGY; ENZYMOLOGY; MUTATION OR GENETIC ENGINEERING
- C12N—MICROORGANISMS OR ENZYMES; COMPOSITIONS THEREOF; PROPAGATING, PRESERVING, OR MAINTAINING MICROORGANISMS; MUTATION OR GENETIC ENGINEERING; CULTURE MEDIA
- C12N15/00—Mutation or genetic engineering; DNA or RNA concerning genetic engineering, vectors, e.g. plasmids, or their isolation, preparation or purification; Use of hosts therefor
- C12N15/09—Recombinant DNA-technology
- C12N15/11—DNA or RNA fragments; Modified forms thereof; Non-coding nucleic acids having a biological activity
- C12N15/113—Non-coding nucleic acids modulating the expression of genes, e.g. antisense oligonucleotides; Antisense DNA or RNA; Triplex- forming oligonucleotides; Catalytic nucleic acids, e.g. ribozymes; Nucleic acids used in co-suppression or gene silencing
- C12N15/1137—Non-coding nucleic acids modulating the expression of genes, e.g. antisense oligonucleotides; Antisense DNA or RNA; Triplex- forming oligonucleotides; Catalytic nucleic acids, e.g. ribozymes; Nucleic acids used in co-suppression or gene silencing against enzymes
-
- C—CHEMISTRY; METALLURGY
- C12—BIOCHEMISTRY; BEER; SPIRITS; WINE; VINEGAR; MICROBIOLOGY; ENZYMOLOGY; MUTATION OR GENETIC ENGINEERING
- C12N—MICROORGANISMS OR ENZYMES; COMPOSITIONS THEREOF; PROPAGATING, PRESERVING, OR MAINTAINING MICROORGANISMS; MUTATION OR GENETIC ENGINEERING; CULTURE MEDIA
- C12N9/00—Enzymes; Proenzymes; Compositions thereof; Processes for preparing, activating, inhibiting, separating or purifying enzymes
- C12N9/0004—Oxidoreductases (1.)
-
- A—HUMAN NECESSITIES
- A01—AGRICULTURE; FORESTRY; ANIMAL HUSBANDRY; HUNTING; TRAPPING; FISHING
- A01K—ANIMAL HUSBANDRY; AVICULTURE; APICULTURE; PISCICULTURE; FISHING; REARING OR BREEDING ANIMALS, NOT OTHERWISE PROVIDED FOR; NEW BREEDS OF ANIMALS
- A01K2207/00—Modified animals
- A01K2207/15—Humanized animals
-
- A—HUMAN NECESSITIES
- A01—AGRICULTURE; FORESTRY; ANIMAL HUSBANDRY; HUNTING; TRAPPING; FISHING
- A01K—ANIMAL HUSBANDRY; AVICULTURE; APICULTURE; PISCICULTURE; FISHING; REARING OR BREEDING ANIMALS, NOT OTHERWISE PROVIDED FOR; NEW BREEDS OF ANIMALS
- A01K2207/00—Modified animals
- A01K2207/25—Animals on a special diet
-
- A—HUMAN NECESSITIES
- A01—AGRICULTURE; FORESTRY; ANIMAL HUSBANDRY; HUNTING; TRAPPING; FISHING
- A01K—ANIMAL HUSBANDRY; AVICULTURE; APICULTURE; PISCICULTURE; FISHING; REARING OR BREEDING ANIMALS, NOT OTHERWISE PROVIDED FOR; NEW BREEDS OF ANIMALS
- A01K2217/00—Genetically modified animals
- A01K2217/07—Animals genetically altered by homologous recombination
- A01K2217/072—Animals genetically altered by homologous recombination maintaining or altering function, i.e. knock in
-
- A—HUMAN NECESSITIES
- A01—AGRICULTURE; FORESTRY; ANIMAL HUSBANDRY; HUNTING; TRAPPING; FISHING
- A01K—ANIMAL HUSBANDRY; AVICULTURE; APICULTURE; PISCICULTURE; FISHING; REARING OR BREEDING ANIMALS, NOT OTHERWISE PROVIDED FOR; NEW BREEDS OF ANIMALS
- A01K2217/00—Genetically modified animals
- A01K2217/07—Animals genetically altered by homologous recombination
- A01K2217/075—Animals genetically altered by homologous recombination inducing loss of function, i.e. knock out
- A01K2217/077—Animals genetically altered by homologous recombination inducing loss of function, i.e. knock out heterozygous knock out animals displaying phenotype
-
- A—HUMAN NECESSITIES
- A01—AGRICULTURE; FORESTRY; ANIMAL HUSBANDRY; HUNTING; TRAPPING; FISHING
- A01K—ANIMAL HUSBANDRY; AVICULTURE; APICULTURE; PISCICULTURE; FISHING; REARING OR BREEDING ANIMALS, NOT OTHERWISE PROVIDED FOR; NEW BREEDS OF ANIMALS
- A01K2227/00—Animals characterised by species
- A01K2227/10—Mammal
- A01K2227/105—Murine
-
- A—HUMAN NECESSITIES
- A01—AGRICULTURE; FORESTRY; ANIMAL HUSBANDRY; HUNTING; TRAPPING; FISHING
- A01K—ANIMAL HUSBANDRY; AVICULTURE; APICULTURE; PISCICULTURE; FISHING; REARING OR BREEDING ANIMALS, NOT OTHERWISE PROVIDED FOR; NEW BREEDS OF ANIMALS
- A01K2267/00—Animals characterised by purpose
- A01K2267/03—Animal model, e.g. for test or diseases
- A01K2267/035—Animal model for multifactorial diseases
- A01K2267/0362—Animal model for lipid/glucose metabolism, e.g. obesity, type-2 diabetes
-
- C—CHEMISTRY; METALLURGY
- C12—BIOCHEMISTRY; BEER; SPIRITS; WINE; VINEGAR; MICROBIOLOGY; ENZYMOLOGY; MUTATION OR GENETIC ENGINEERING
- C12N—MICROORGANISMS OR ENZYMES; COMPOSITIONS THEREOF; PROPAGATING, PRESERVING, OR MAINTAINING MICROORGANISMS; MUTATION OR GENETIC ENGINEERING; CULTURE MEDIA
- C12N2310/00—Structure or type of the nucleic acid
- C12N2310/10—Type of nucleic acid
- C12N2310/14—Type of nucleic acid interfering nucleic acids [NA]
Definitions
- the present invention relates to the use of a genetically modified non-human mammal as an animal model for obesity and obesity-related disorders, wherein the modified non-human mammal (i) is heterozygous for the disruption of the gene encoding LSD1 or (ii) has a deletion of the gene encoding LSD1, said deletion being limited to adipose tissue, wherein said obesity-related disorder is selected from the group consisting of insulin resistance, type II diabetes, fatty liver, non-alcoholic fatty liver disease, endocrine abnormalities and triglyceride storage disease .
- the invention further pertains to a method for identifying a compound useful in the treatment and/or prevention of obesity or an obesity-related disorder.
- adipose tissue is an important regulator of energy balance (Langin, 2010).
- WAT white adipose tissue
- BAT brown adipose tissue
- Unilocular WAT is highly adapted to store excess energy in the form of triglycerides and is mainly located in the abdominal and subcutaneous areas.
- brown adipocytes being derived from Myf5-positive and white adipocytes derived from Myf5-negative cells, respectively (Seale et al., 2008).
- Myf5 myogenic factor 5
- brown adipocytes being derived from Myf5-positive and white adipocytes derived from Myf5-negative cells, respectively.
- appearance of brown fat-like cells has been observed in mouse WAT (Himms-Hagen et al., 1994; Himms-Hagen et al., 2000; Young et al., 1984).
- These brown fat-like cells are called beige or brite cells.
- beige fat cells are not derived from Myf5-expressing precursors (Seale et al., 2008), raising questions about their origin. It has been speculated that beige cells might originate from differentiation of a specific pool of precursor cells already present in WAT (Seale et al., 2011; Wu et al., 2012). Alternatively, beige fat cells could arise from direct conversion of white adipocytes (Granneman et al., 2005; Himms-Hagen et al., 2000; Loncar, 1991).
- Lysine-specific demethylase 1 (LSD1), the first histone lysine demethylase described, is an amine oxidase that mediates histone demethylation via a FAD-dependent oxidative reaction.
- LSD1 selectively removes mono- and dimethyl groups from H3K4 or H3K9, thereby causing either repression or activation of gene transcription (Garcia-Bassets et al., 2007; Lee et al., 2005; Metzger et al., 2010; Metzger et al., 2005; Shi et al., 2004; Wang et al., 2009a; Wang et al., 2009b) (Zhu Ms).
- Hino et al. observe upregulation of LSD1 protein levels in mice on a high fat diet.
- their ex vivo experiments with adipocytes from mice on a high fat diet suggest that energy expenditure genes are upregulated upon knockdown of LSD1. This teaches away from the present invention.
- mice and other non-human mammals having a reduced expression of Lsd1 are valuable tools for studying established and potential agents to treat type 2 diabetes and related diseases such as or insulin resistance and obesity.
- the present invention therefore relates to the subject matter defined in items (1) to (8).
- the present invention relates to an animal model for obesity and obesity-related disorders.
- a first aspect of this embodiment of the invention is the use of a modified non-human mammal as an animal model for obesity or obesity-related disorders, wherein the modified non-human mammal (i) is heterozygous for the disruption of the gene encoding LSD1 or (ii) has a deletion of the gene encoding LSD1, said deletion being limited to adipose tissue, said obesity-related disorder being selected from the group consisting of insulin resistance, type II diabetes, fatty liver, non-alcoholic fatty liver disease, endocrine abnormalities and triglyceride storage disease .
- the modified non-human mammal may be a genetically modified non-human animal, preferably it is a transgenic non-human mammal.
- the mammals in accordance with this embodiment have a reduced amount of LSD1 in at least one tissue. These mammals typically exhibit a reduced expression of LSD1 in one or more tissues. The reduced expression may or may not affect all tissues of the mammal.
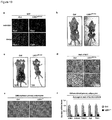
- the amount of LSD1 protein or Lsd1 mRNA is reduced in fat tissue, e.g. in BAT and/or WAT.
- an animal model for metabolic disorders including, but not limited to, eating disorders, body weight disorders, cachexia, anorexia, sarcopenia and wasting syndrome or disease.
- This disclosure includes the use of a non-human transgenic animal whose genome comprises a stably integrated transgenic nucleotide sequence encoding Lysine-specific Demethylase 1 (LSD1) operably linked to a promoter for studying metabolism and/or as an animal model for metabolic disorders.
- LSD1 Lysine-specific Demethylase 1
- the animals in accordance with this disclosure have an increased amount of LSD1 in at least one tissue. These animals typically overexpress LSD1 in at least one tissue. The overexpression may or may not affect all tissues of the animal.
- the amount of LSD1 protein or Lsd1 mRNA is increased in fat tissue, e.g. in BAT and/or WAT.
- the reduced expression and the increased expression (overexpression), respectively, is relative to a control animal.
- the control animal may be a wild type animal which is substantially identical to the modified or transgenic animal/mammal, except for the genetic manipulation.
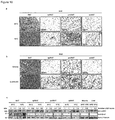
- the amount of LSD1 may be determined at the protein level, e.g. by immunoassays using antibodies against LSD1.
- the expression level of Lsd1 may be determined by quantitative RT-PCR, detecting the amount of Lsd1 mRNA.
- the amount of LSD1 protein, or the amount of Lsd1 mRNA may be reduced relative to the control animal by at least 10%, preferably by at least 20%, more preferably by at least 30%, more preferably by at least 40%, e.g. by about 50%.
- the amount of LSD1 protein, or the amount of Lsd1 mRNA may be reduced relative to the control animal by 10% to 90%, preferably by 20% to 80%, more preferably by 30% to 70%, more preferably by 40% to 60%.
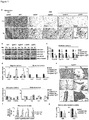
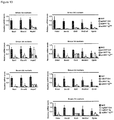
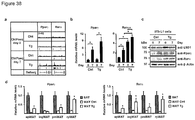
- the protein and/or mRNA levels of Prdm16, Pgc-1 ⁇ and Ucp1 are reduced, e.g. by at least 10%, more preferably by at least 25%, most preferably by at least about 50%, relative to a control animal.
- Body fat mass in these mammals may be increased by about 10% relative to a control animal, in particular after high fat diet.
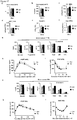
- Blood glucose levels in these mammals may be increased by about 10% to about 50%, or by about 20% to about 40%, relative to a control animal.
- the mammals of the first embodiment typically exhibit reduced insulin sensitivity and glucose uptake relative to a control animal, wherein insulin sensitivity and glucose uptake may be determined according to the tests described in the Examples hereinbelow.
- the amount of LSD1 protein, or the amount of Lsd1 mRNA may be increased relative to the control animal by at least 10%, preferably by at least 25%, more preferably by at least 50%, more preferably by at least 75%, e.g. by about 100%.
- the amount of LSD1 protein, or the amount of Lsd1 mRNA may be increased relative to the control animal by 10% to 1000%, preferably by 25% to 500%, more preferably by 50% to 200%, more preferably by 75% to 150%.
- the phrase "LSD1 protein” includes endogenous and exogenous LSD1 protein.
- the phrase "Lsd1 mRNA" includes endogenous and exogenous Lsd1 mRNA.
- the transgenic non-human mammal preferably is a rodent, such as a mouse. Suitable mammals are available, or easily generated, using conventional methods, in a variety of genera, including rodents (e.g., rats), rabbits, guinea pigs, dogs, goats, sheep, cows, horses, pigs, llamas, camels or the like. Preferably, the non-human transgenic mammal is a transgenic mouse.
- rodents e.g., rats
- rabbits e.g., guinea pigs, dogs, goats, sheep, cows, horses, pigs, llamas, camels or the like.
- the non-human transgenic mammal is a transgenic mouse.
- progenitor animal The animal from which the progeny animal is descended is referred to as "progenitor animal".
- Progeny of a progenitor mammal are any animals which are descended from the progenitor as a result of sexual reproduction or cloning of the progenitor, and which have inherited genetic material from the progenitor.
- cloning refers to production of genetically identical offspring from DNA or a cell(s) of the progenitor animal.
- development of an animal from a cell or cells (embryonic cells, for example), or development of a cell or cells into an animal, refers to the developmental process that includes growth, division and differentiation of a fertilized egg or embryonic cells (and their progeny) to form an embryo, and birth and development of that embryonic animal into an adult animal.
- transgenic embryo can develop into a transgenic mammal of the invention.
- a transgenic ovum can be fertilized to create a transgenic embryo that develops into a transgenic mammal of the invention.
- a transgenic sperm can be used to fertilize an ovum to create a transgenic embryo that develops into a transgenic mammal of the invention.
- a transgenic cell can be used to clone a transgenic mammal of the invention.
- a "transgenic non-human mammal” is a non-human mammal into which an exogenous recombinant construct has been introduced, or its progeny. Such a mammal may have developed from (a) embryonic cells into which the construct has been directly introduced or (b) progeny cells of (a).
- an "exogenous construct” is a nucleic acid that is artificially introduced, or was originally artificially introduced, into an animal. The term “artificial introduction” excludes introduction of a construct into an animal through normal reproductive processes (such as by cross breeding).
- animals that have been produced by transfer of an exogenous construct through the breeding of a mammal comprising the construct are considered to "comprise the exogenous construct.”
- Such animals are progeny of animals into which the exogenous construct has been introduced.
- the transgenic non-human mammal contains a disruption in an endogenous LSD1 gene such that at least one allele of the LSD1 gene is non-functional or does not express a functional LSD1, wherein the disruption is an insertion of a transgene into the endogenous LSD1 gene.
- the disruption can be, for example, an insertion, missense, frameshift, or deletion mutation.
- the disruption can also alter a promoter, enhancer, or splice site.
- the disruption can be insertion of a transgene.
- the transgene optionally encodes a selectable marker, such as, for example a LacZ reporter gene operably linked to a LSD1 promoter.
- the provided non-human mammals are preferably heterozygous for LSD1.
- heterozygous means that the animal has a disruption in one allele (i.e., endogenous gene) while the second allele is unaffected (i.e., does not contain a disruption).
- the genome of the mammal comprises a disruption of only one allele of the gene encoding LSD1.
- An example of this embodiment is the Lsd+/- mouse described in the Examples.
- non-human transgenic animal e.g., a rodent, preferably a mouse
- a non-human transgenic animal e.g., a rodent, preferably a mouse
- the mouse according to this disclosure will overexpress LSD1 (see, for example, the LSD1-overexpressing mice described in the Examples).
- the non-human transgenic animal is preferably one whose somatic and germ cells comprise at least one genomically integrated copy of a recombinant construct (a recombinant construct comprising a sequence encoding LSD, preferably hLSD1), or an active fragment or variant thereof, which sequence is operably linked to an expression control sequence.
- the disclosed transgene construct can also be assembled as an artificial chromosome, which does not integrate into the genome but which is maintained and inherited substantially stably in the animal. Artificial chromosomes of more than 200 kb can be used for this purpose.
- the present disclosure is also directed to the creation of transgenic mice in whose tissue specific expression of the hLSD1 transgene is driven by a tissue specific promoter, as is discussed more extensively below.
- transgenic gamete including a transgenic ovum or sperm cell, a transgenic embryo, and any other type of transgenic cell or cluster of cells, whether haploid, diploid, or of higher zygosity having at least one disruption in the LSD1 gene.
- embryo includes a fertilized ovum or egg (i.e., a zygote) as well as later multicellular developmental stages of the organism.
- the disruption referred to above is preferably in the animal's somatic and germ cells.
- transgenic mammal that preferably comprise a disruption of at least one allele of the LSD1 gene, and transgenic mammals derived from a transgenic ovum, sperm, embryo or other cell.
- the transgenic mammal may be sterile although, preferably, it is fertile. Further disclosed herein is a cell line derived from a transgenic embryo or other transgenic cell, which contains a disruption of at least one allele of the LSD1 gene. Methods of isolating such cells and propagating them are known to those of skill in the art.
- the transgenic non-human mammals of the invention are produced by introducing transgenes into the germline of the non-human mammal.
- Embryonal target cells at various developmental stages are used to introduce the transgenes. Different methods are used depending on the stage of development of the embryonal target cell(s). Such methods include, but are not limited to, microinjection of zygotes, viral integration, and transformation of embryonic stem cells as described below.
- Microinjection of zygotes is the preferred method for incorporating transgenes into animal genomes.
- a zygote which is a fertilized ovum that has not undergone pronuclei fusion or subsequent cell division, is the preferred target cell for microinjection of transgenic DNA sequences.
- the murine male pronucleus reaches a size of approximately 20 micrometers in diameter, a feature which allows for the reproducible injection of 1-2 picoliters of a solution containing transgenic DNA sequences.
- the use of a zygote for introduction of transgenes has the advantage that, in most cases, the injected transgenic DNA sequences will be incorporated into the host animal's genome before the first cell division. Brinster et al., Proc. Natl. Acad. Sci. USA 82:4438 (1985 ). As a consequence, all cells of the resultant transgenic animals (founder animals) stably carry an incorporated transgene at a particular genetic locus.
- Viral integration can also be used to introduce the transgenes into an animal.
- the developing embryos are cultured in vitro to the blastocyte developmental stage.
- the blastomeres may be infected with appropriate retroviruses. Jaenich, Proc. Natl. Acad. Sci. USA 73:1260 . Infection of the blastomeres is enhanced by enzymatic removal of the zona pellucida.
- Transgenes are introduced via viral vectors which are typically replication-defective but which remain competent for integration of viral-associated DNA sequences, including transgenic DNA sequences linked to such viral sequences, into the host animal's genome. Transfection is easily and efficiently obtained by culture of blastomeres on a monolayer of cells producing the transgene-containing viral vector.
- infection may be performed using cells at a later developmental stage, such as blastocoeles.
- most transgenic founder animals produced by viral integration will be mosaics for the transgenic allele; that is, the transgene is incorporated into only a subset of all the cells that form the transgenic founder animals.
- multiple viral integration events may occur in a single founder animal, generating multiple transgenic alleles which will segregate in future generations of offspring.
- Introduction of transgenes into germline cells by this method is possible but probably occurs at a low frequency.
- offspring may be produced in which the transgenic allele is present in all of the animal's cells, i.e., in both somatic and germline cells.
- Embryonic stem (ES) cells can also serve as target cells for introduction of the transgenes into animals.
- ES cells are obtained from pre-implantation embryos that are cultured in vitro. Evans et al., Nature 292:154 (1981 ).
- ES cells that have been transformed with a transgene can be combined with an animal blastocyst, after which the ES cells colonize the embryo and contribute to the germline of the resulting animal.
- offspring may be produced in which the transgenic allele is present in all of the animal's cells, i.e., in both somatic and germline cells.
- the transgenic nucleic acid may be stably integrated into germ line cells and transmitted to offspring of the transgenic animal as Mendelian loci.
- Other transgenic techniques result in mosaic transgenic animals, in which some cells carry the transgenes and other cells do not.
- mosaic transgenic animals in which germ line cells do not carry the transgenes transmission of the transgenes to offspring does not occur. Nevertheless, mosaic transgenic animals are capable of demonstrating phenotypes associated with the transgenes.
- animals of the transgenic maintenance line are crossed with animals having a genetic background in which expression of the transgene results in symptoms of obesity or obesity-related disorders.
- Offspring that have inherited the transgenic nucleic acids are distinguished from littermates that have not inherited transgenic nucleic acids by analysis of genetic material from the offspring for the presence of nucleic acid sequences derived from the transgenic nucleic acids. For example, biological fluids that contain polypeptides uniquely encoded by the transgenic nucleic acids may be immunoassayed for the presence of the polypeptides.
- a simpler and more reliable means of identifying transgenic offspring comprises obtaining a tissue sample from an extremity of an animal, such as, for example, a tail, and analyzing the sample for the presence of nucleic acid sequences corresponding to the DNA sequence of a unique portion or portions of the transgenic nucleic acids.
- the presence of such nucleic acid sequences may be determined by, e.g., hybridization ("Southern") analysis with DNA sequences corresponding to unique portions of the transgene, analysis of the products of PCR reactions using DNA sequences in a sample as substrates, oligonucleotides derived from the transgene's DNA sequence, and the like.
- polynucleotide is interchangeable with “nucleic acid.”
- a polynucleotide may be recombinant, natural, or synthetic or semi-synthetic, or any combination thereof.
- Polynucleotides may be RNA, PNA, LNA, or DNA, or combinations thereof.
- the terms peptide, polypeptide and protein are also interchangeable.
- a “recombinant construct” (also referred to herein as a “construct” for short) or a “transgene” of "transgenic nucleic acid” which is used to generate a transgenic animal of the above disclosure is a polynucleotide which comprises a sequence encoding LSD1 (preferably hLSD1), or an active fragment or variant thereof, which is operably linked to an expression control sequence.
- the coding sequence comprises LSD1 exon sequences, although it may optionally include intron sequences which are either derived from an hLSD1 genomic DNA or DNA of an unrelated chromosomal gene.
- the recombinant construct may comprise a sequence encoding mLSD1 or at least a biologically active fragment thereof.
- the recombinant construct comprises a sequence encoding human LSD1 (hLSD1) or a biologically active fragment thereof.
- the amino acid sequences of hLSD1 and mLSD1 are shown in SEQ ID NO:3 and 5, respectively.
- the nucleotide sequence encoding mLSD1 is shown in SEQ ID NO:4.
- the nucleotide sequence encoding hLSD1 is shown in SEQ ID NO:1.
- the hLSD1 cDNA sequence including 5'- and 3'-untranslated regions is shown in SEQ ID NO:2.
- the nucleotide sequence of an exemplary recombinant construct is shown in SEQ ID NO:6.
- the amino acid sequence encoded by this construct is shown in SEQ ID NO:7.
- tissue-specific expression of the transgene in the transgenic animal the coding sequence must be operably linked to an expression control sequence that drives expression specifically in that tissue.
- Suitable tissue-specific expression control sequences include the following: MMTV-LTR (for mammary-specific expression), etc.
- An inducible promoter is one which, in response to the presence of an inducer, is activated.
- a coding sequence driven by an inducible promoter can be turned on or off by providing or withdrawing the inducer.
- a promoter may be homologous, derived from the same species as the coding sequence.
- the promoter is heterologous, that is, derived from another species, or even from a virus.
- hLSD1 constructs may be operably linked to an inducible or repressible control elements. An repressible system, described by Gossen, M.
- tetracycline-resistance operon encoded in Tn10 of E. coli.
- the tet repressor is fused with the activating domain of Herpes simplex virus VP16 to generate a tetracycline-controlled transactivator.
- Such a transactivator is used to stimulate transcription from a promoter sequence, such as the CMV promoter IE.
- a gene controlled by a promoter acting under the influence of the tetracycline-controlled transactivator can be constitutively expressed and turned off by using an effective concentration of tetracycline. Such a system can regulate a gene over about five orders of magnitude.
- the tetracycline-repressible system functions in vivo in mice, where tetracycline administration via the diet is used to keep the expression of the inducible gene off. Tetracycline analogs which cross the blood-brain barrier can be used if gene activity is desired in the brain.
- Two steps of transfection may be used to produce the appropriate system.
- a first transfection is used to isolate clones expressing the transactivator. The best clones are identified by testing each in a transient transfection assay for the ability to express a marker gene, such as an estrogen-dependent luciferase.
- the second transfection involves the hLSD1 coding sequence under control of an inducible promoter into a transactivator-containing clone.
- One strategy involves first isolating a stable cell line expressing the inducible hLSD1 protein or peptide by cotransfection of both plasmids into appropriate target cells. After selection, for example with G418, clones showing estrogen-dependent expression of hLSD1 may be detected by an immunoassay or biological assay.
- the plasmids are preferably linearized and cotransfected into cells in the presence of mammalian high molecular weight DNA as a carrier.
- the hLSD1 DNA molecule is placed under the control of a promoter subject to regulation by a tetracycline-controlled transactivator.
- a construct in a single vector or preferably two vector form
- target cells whether embryonic, adult normal or tumor, either in vitro or in vivo.
- tetracycline is withheld so that the hLSD1 DNA is expressed.
- tetracycline or an active congener of tetracycline is administered locally to the cells transfected with the constructs.
- Effective systemic doses (oral or parenteral) of tetracycline are in the range of about 0.1 mg to 1 g per day.
- the transactivator is maintained in the "on" position by withholding tetracycline.
- Gal-ER consists of the DNA-binding domain of the yeast Gal4 protein fused to the hormone-binding domain of the human ER and hence exclusively regulates a transfected coding sequence under the control of a Gal4-responsive promoter in mammalian cells.
- This system includes a synthetic Gal4-responsive promoter which consists of four Gal4-binding sites, an inverted CCAAT element, a TATA box, and the adenovirus major late initiation region.
- This promoter shows extremely low basal activity in the absence of, and high inducibility in the presence of, ligand-activated Gal-ER.
- the transcription factor Gal-ER is rendered more potent and less susceptible to cell type-specific variation by fusing the strong activating domain of the herpesvirus protein VP16 onto its C-terminus.
- Gal-ER-VP16 may induce the Gal4-responsive promoter at least 100-fold in transfected cells.
- the Gal-ER induction system is a powerful genetic switch for regulating heterologous genes.
- An effective dose of an estrogen is a dose which would trigger the expression of an hLSD1-encoding nucleic acid to produce hLSD1 and promote growth of hLSD1-expressing adipose cells.
- doses can be ascertained by one skilled in the art.
- doses in the range of about 0.05 to 100 mg/kg of an estrogen are used in a single dose or in multiple doses over a period of about one week days to about 6 months, or even longer.
- Estrogen analogues which are capable of specifically activating the exogenous transactivator while having fewer biological effects and side effects are preferred.
- Ionizing radiation has been used to activate the transcription of exogenous genes, for example, encoding a cytotoxic protein TNF-I ( Weichselbaum, R R et al., Int J Radiation Oncology Biol Phys 24:565-67 (1992 ))
- This may be accomplished through the use of radiation-responsive elements distal to the transcription start site of such genes. See, for example, Hallahan, D et al., Proc Natl Acad Sci USA 88:2152-20 (1991 ); Datta, R et al., Proc Natl Acad Sci USA 89:10149-53 (1992 ); Weichselbaum et al., supra; Hallahan, D E et al.
- the expression control sequence (either a ubiquitously acting expression control sequence or a tissue-specific one) is expressed in a regulatable fashion, meaning that it is preferably a component of any of a number of well-known regulatable expression systems.
- the transgenic mammal does not comprise additional transgenic sequences.
- the transgenic construct present in the transgenic animal is the only transgenic construct present in the mammal.
- the transgenic mammal preferably does not comprise further genetic germ line modifications other than that described hereinabove.
- the genetic background of the transgenic mammal of the invention is 'wild type' except for the genetic modifications described hereinabove. This embodiment is preferred, as it allows studying the effect of any methods interfering with the action of LSD1.
- Also disclosed herein is a method for identifying a compound which inhibits the growth of adipose tissue, comprising (a) administering a test compound to a transgenic animal according to the present invention and (b) determining the effect of the test compound on the growth or survival of the adipocytes or adipose tissue in said transgenic animal, thereby identifying a compound that inhibits the growth of adipose tissue.
- Another aspect of this invention is a method for identifying a compound which is useful in the treatment and/or prevention of obesity or an obesity-related disorder, comprising (a) administering a test compound to a transgenic mammal according to the first embodiment of the present invention and (b) determining the effect of the test compound on the initiation, maintenance, or progression of at least one obesity-related parameter in said transgenic mammal, , thereby identifying a compound that inhibits obesity or an obesity-related disorder; wherein said obesity-related disorder is selected from the group consisting of insulin resistance, type II diabetes, fatty liver, non-alcoholic fatty liver disease, endocrine abnormalities and triglyceride storage disease; and wherein said obesity-related parameter is selected from the group consisting of the mass of white adipose tissue, the total mass of adipose tissue, glucose intolerance, and expression of a adipose tissue differentiation marker.
- the methods may comprise the steps (i) administering a test compound to a transgenic mammal according to the present invention, (ii) administering the same test compound to a control animal, and (iii) determining the effect of the test compound on the transgenic mammal as compared to said control animal.
- the control animal is preferably an animal of the same species as the transgenic mammal.
- the control animal does not show reduced or increased expression of LSD1 or only to a significantly lower degree, relative to a wild type animal.
- the control animal does not carry the transgenic nucleotide sequence present in the test animal of step (i).
- control animal is also carrying the same transgenic nucleotide sequence as the transgenic animal used in step (i) but there is no or only a slight reduction or increase in expression. This can be achieved by the use of inducible transgene constructs, see supra.
- the methods of analysis include but are not limited to determining the body weight, adipose tissue mass, adipose tissue size, presence of WAT markers, number of adipocytes, presence of lipomas, survival rate and the like, e.g. by histological methods and/or biochemical methods.
- a particularly preferred parameter is glucose tolerance.
- the test compound may be selected as a compound which is useful in the treatment of obesity or an obesity-related disorder if there is a significant difference in at least one of the obesity-related parameters tested, for example when the parameter (e.g. adipose tissue mass, adipose tissue size, presence of WAT markers, number of adipocytesetc.) in the transgenic test animal used in step (i) is significantly reduced (e.g. by at least 10%, preferably by at least 25%, more preferably by at least 50%) relative to that of the control animal.
- the parameter e.g. adipose tissue mass, adipose tissue size, presence of WAT markers, number of adipocytesetc.
- the test compound may be selected as a compound which is useful in the treatment of obesity or an obesity-related disorder if blood glucose levels are reduced by the test compound, or if insulin sensitivity and/or glucose uptake are significantly increased.
- the compound may be selected if any one the the target genes of LSD1 (e.g. Nrf1, Prdm16 and Pgc-1 ⁇ ) is upregulated by the test compound, e.g. by at least about 10% or at least about 25%, or at least about 50%, or at least about 100%.
- the quantitation is preferably done via RT-PCR.
- the compound may be selected if any one the the target genes of LSD1 is downregulated by the test compound, e.g. by at least about 10% or at least about 25%, or at least about 50%.
- the quantitation is preferably done via RT-PCR.
- the compounds used as test compounds may be modulators of the LSD1 gene, of the LSD1 protein, or of any target gene of LSD1.
- Modulators include activators and inhibitors.
- the modulators are preferably activators of the LSD1 protein or activators of the LSD1 gene (see infra ).
- a LSD1 modulator for use in the treatment and/or prevention of type 2 diabetes, obesity or an obesity-related disorder.
- a method of treating type 2 diabetes, obesity or an obesity-related disorder comprising administering to an individual in need thereof, a pharmaceutically effective amount of a LSD1 modulator.
- Obesity-related disorders include, but are not limited to, insulin resistance, hypertension, hyperuricemia, fatty liver, non-alcoholic fatty liver disease, polycystic ovarian syndrome, acanthosis nigricans, hyperphagia, endocrine abnormalities, triglyceride storage disease, Bardet-Biedl syndrome, and Lawrence-Moon syndrome.
- the disorder is type II diabetes.
- the obesity-related disorder is not hypertension.
- An LSD1 activator to be used in accordance with this invention is a compound capable of increasing the amount of LSD1 mRNA or LSD1 protein in a cell and/or activating at least one function or activity of the LSD1 gene or the LSD1 protein.
- These functions include (1) the ability of LSD1 to interact with androgen receptor,(2) the ability of LSD1 to assemble with other proteins, in particular transcription factors into protein complexes, and (3) the catalytic activity of LSD1.
- the protein complexes may be important for transcriptional activation.
- An LSD1 inhibitor is a compound capable of reducing the amount of LSD1 mRNA or LSD1 protein in a cell and/or inhibiting at least one function of the LSD1 gene or the LSD1 protein. These functions include (1) the ability of LSD1 to interact with androgen receptor,(2) the ability of LSD1 to assemble with other proteins, in particular transcription factors into protein complexes, and (3) the catalytic activity of LSD1.
- the protein complexes may be important for transcriptional activation.
- the LSD1 modulator to be used in accordance with this invention may be a compound capable of activating or inhibiting expression of the LSD1 gene in a cell.
- Various methods for activating or inhibiting expression of genes in a cell are known to one of skill in the art (e.g. RNA interference or antisense technology).
- the LSD1 modulator is capable of modulating the interaction of LSD1 protein with the androgen receptor.
- activators include "small molecules,” also referred to herein as “compounds,” which are isolated from natural sources or made synthetically. In general, such molecules may be identified from large libraries of natural products or synthetic (or semi-synthetic) extracts or chemical libraries according to methods known in the art. Those skilled in the field of drug discovery and development will understand that the precise source of test extracts or compounds is not critical to the methods of the invention. Accordingly, virtually any number of chemical extracts or compounds can be used in the methods described herein.
- the types of extracts or compounds that may be tested include plant, fungal, prokaryotic or eukaryotic cell or organism-based extracts, fermentation broths, and synthetic compounds including modifications of existing compounds. Numerous methods are also available for generating random or directed synthesis (e.g., semi-synthesis or total synthesis) of any number of chemical compounds, including, but not limited to, saccharides, lipids, peptides, polypeptides and nucleic acids and derivatives thereof. Synthetic compound libraries are commercially available.
- the LSD1 modulator may modulate (promote or inhibit) the stability the the LSD1 protein or Lsd1 mRNA.
- the LSD1 modulator may modulate (promote or inhibit) degradation of LSD1 protein or Lsd1 mRNA.
- the pathways leading to degradation of LSD1 protein or Lsd1 mRNA in the cells may be inhibited, thus leading to an increased amount of LSD1 protein or Lsd1 mRNA in the cells.
- the LSD1 modulator may modulate (promote or inhibit) the translation efficiency of the Lsd1 gene.
- libraries of natural compounds in the form of bacterial, fungal, plant, and animal extracts are commercially available from a number of sources.
- natural and synthetically produced libraries can be generated according to methods known in the art, e.g., by standard extraction and fractionation methods.
- any library or compound may readily be modified using standard chemical, physical, or biochemical methods.
- Another class of agents that can be screened are antibodies, in particular monoclonal antibodies.
- LSD1 activators are preferably useful in the treatment and/or prevention of obesity or an obesity-related disorders.
- LSD1 inhibitors may be useful in the treatment and/or prevention of metabolic disorders such as eating disorders, body weight disorders, cachexia, anorexia, sarcopenia and wasting syndrome or disease.
- Cachexia refers to a state of general ill health and malnutrition. It is often associated with and induced by malignant cancer, and is characterized by loss of appetite, lass of body mass, especially lean body mass, and muscle wasting.
- Anorexia refers simply to a loss of appetite, whether brought on by medical or psychological factors. Anorexia is often closely associated with, and generally contributes to, the cachexia seen in patients with advanced cancers.
- Target genes of LSD1 include, but are not limited to, Nrf1, Prdm16 and Pgc-1 ⁇ .
- the modulator of a target gene of LSD1 is an activator of the target gene. In another embodiment, the modulator of a target gene of LSD1 is an inhibitor of the target gene. In another embodiment, the modulator of a target gene of LSD1 is an activator of Nrf1. In another embodiment, the modulator of a target gene of LSD1 is an activator of Prdm16. In another embodiment, the modulator of a target gene of LSD1 is an activator of Pgc-1 ⁇ . In another embodiment, the modulator of a target gene of LSD1 is an inhibitor of Nrf1.
- the modulator of a target gene of LSD1 is an inhibitor of Prdm16. In another embodiment, the modulator of a target gene of LSD1 is an inhibitor of Pgc-1 ⁇ .
- an activator is capable of increasing the expression of the target gene, or activating a function of the gene product of said target gene.
- an inhibitor is capable of inhibiting the expression of the target gene, or inhibiting a function of the gene product of said target gene.
- the above-mentioned modulators are useful in the treatment and/or prevention of type 2 diabetes, obesity and/or related disorders.
- LSD1 modulators can be used alone or in combination with other compounds and therapeutic regimens to inhibit obesity or obesity-related disorders or obesity-related symptoms.
- an effective amount of the activator will be determined by the existence, nature, and extent of any adverse side-effects that accompany the administration of the composition; the LD 50 of the composition; and the side-effects of the composition at various concentrations.
- the amount of the composition administered will range from about 0.01 to about 20 mg per kg, more typically about 0.05 to about 15 mg per kg, even more typically about 0.1 to about 10 mg per kg body weight.
- the activator can be administered, for example, by intravenous infusion, orally, intraperitoneally, or subcutaneously. Oral administration is the preferred method of administration.
- the formulations of compounds can be presented in unit-dose or multidose sealed containers, such as ampoules and vials.
- the LSD1 activators are typically formulated with a pharmaceutically acceptable carrier before administration to an individual or subject.
- Pharmaceutically acceptable carriers are determined, in part, by the particular composition being administered, as well as by the particular method used to administer the composition. Accordingly, there are a wide variety of suitable formulations of pharmaceutical compositions (see, e.g., Remington's Pharmaceutical Sciences, 17th ed., 1989 ).
- LSD1 promotes formation of functional beige fat (reference example)
- transgenic mice ubiquitously expressing human LSD1 under the control of the Rosa26 promoter ( FIG. 7a ).
- Macroscopic inspection revealed intense browning of white fat pads of Tg mice ( Fig. 1a ).
- Detailed histological analyses showed the presence of multilocular brown or beige fat islets in all types of WAT [i.e. epididymal (ep), inguinal (ing), perimuscular (pm), and retroperitoneal (rp) WAT], whereas the morphology of interscapular BAT was not altered ( Fig. 1a ).
- WAT epididymal
- ing inguinal
- pm perimuscular
- rp retroperitoneal
- rp retroperitoneal
- Western blot, qRT-PCR, and immunofluorescence analyses confirmed elevated LSD1 levels in WAT and BAT of Tg compared to control mice ( Fig. 1b , and Fig. 7b-d ).
- the gene expression profile identifies the LSD1-induced adipocytes as beige fat cells.
- LSD1 Tg mice show limited weight gain and improved glucose tolerance and insulin sensitivity in response to a high-fat diet (reference example)
- Tg mice on regular diet (RD) or high-fat diet (HFD) to metabolic analyses.
- RD regular diet
- HFD high-fat diet
- Tg mice and their control littermates did not display any notable differences in total body weight or in the weight of specific tissues and had a similar food intake ( Fig. 16a-c ).
- Fig. 16d body composition analyses assessed by quantitative Nuclear Magnetic Resonance Spectroscopy (qNMR) after 15 weeks of HFD showed that Tg animals had accumulated less fat, resulting in a higher lean/fat mass ratio compared to control mice ( Fig. 16e ).
- Tg mice on HFD displayed decreased blood glucose levels ( Fig. 17g ), associated with improved glucose tolerance relative to control mice ( Fig. 17h ).
- Tg mice were also more insulin sensitive, as determined by insulin sensitive test ( Fig. 17i ), showing that Tg mice are more resistant to HFD-induced type-2 diabetes.
- Fig. 17j-l The blood content in triglycerides, free fatty acids (FFA), and cholesterol was not altered in both RD- and HFD-fed animals ( Fig. 17g,j ).
- LSD1 levels results in raised energy expenditure, which counteracts HFD-induced obesity and type-2 diabetes associated dysfunction.
- LSD1 levels are regulated by environmental cues
- Adipocyte precursors of the stromal-vascular fraction (SVF) from control and LSD1 Rosa26 - CreERT mice were isolated, treated with Tx for 5 days, and then induced to undergo adipogenesis.
- LSD1 -deficient cells of the SVF neither expressed markers of mature adipocytes nor accumulated lipid droplets, which is accordance with the absence of WAT in LSD1 aP2-Cre mice. While the phenotype of these mice requires more detailed future analyses, a likely explanation for the complete absence of WAT in LSD1 aP2 - Cre mice is an essential role of LSD1 in adipocyte differentiation. Together, our data provide in vivo evidence for an essential and cell autonomous function of LSD1 in the control of white adipogenesis.
- LSD1 +/- mice are prone to obesity and type-2 diabetes
- LSD1 is a cell-autonomous regulator of adipogenesis
- adipocyte precursors from the SVF of LSD1 +/- mice were analysed.
- primary adipocytes from LSD1 +/- mice carried increased lipid content compared to control ( Fig. 24a ).
- LSD1 +/- adipocytes expressed increased levels ot general adipogenic and white tat-selective markers ( Fig. 24b ) and expression of genes involved in thermogenesis, including Prdm16 and Ucp1 was reduced in LSD1 +/- adipocytes ( Fig. 24b ).
- adipocyte precursors from the SVF of Tg and control mice were induced to undergo adipogenesis.
- Tg and control adipocyte cultures expressed equivalent levels of general adipogenic, white fat-selective, and brown fat-selective markers ( Fig. 24c ).
- elevated levels of LSD1 in primary Tg adipocyte induced expression of genes involved in oxidative metabolism, including Prdm16, Pgc-1 ⁇ , and Ucp1, and beige fat-selective markers ( Fig. 4a ).
- LSD1 regulates oxidative capacities of adipocytes and beige adipogenesis in a cell-autonomous manner.
- Tg cell lines showed slightly decreased transcript levels of white adipocyte-selective markers and similar transcript levels of general adipogenic markers ( Fig. 25d,e ).
- oxidative and beige fat-selective markers were not altered in C3H-10T1/2(Tg Mut )-derived adipocytes expressing the catalytically inactive LSD1 mutant ( Fig. 25b ).
- LSD1 ind lentivirus driving doxycyclin-inducible expression of LSD1
- LSD1 expression was induced at days 3 or 7 of differentiation. While we observed a strong increase in LSD1 levels upon doxycyclin treatment ( Fig. 27a ), transcript levels of oxidative markers such as Prdm16, Pgc-1 ⁇ , and Ucp1, adipogenic, white fat-selective, and beige fat-selective markers ( Fig. 27 ) were not affected by LSD1 induction. These data show that LSD1 does not induce the beige fat programme once adipogenesis has been initiated. Thus, LSD1 appears to act at an early time point by triggering the commitment of adipocyte precursors towards the beige lineage.
- LSD1 targets genes that induce the beige fat programme and account for beige adipocyte metabolism
- Beige adipogenesis requires induction of adipogenic factors and activation of specific gene sets facilitating thermogenesis and energy consumption.
- LSD1 massive parallel sequencing
- RNA-seq global transcriptome analysis
- AMP kinase also referred to as Prka
- Active Ampk phosphorylates Acaca, which in turn activates Cpt1, the rate-limiting enzyme of ⁇ -oxidation, and positively regulates Pgc-1 ⁇ expression.
- Pgc-1 ⁇ and Pgc-1 ⁇ act as key regulators of oxidative metabolism, promoting ⁇ -oxidation, glycolysis, and TCA cycle.
- Pgc-1 ⁇ also serves as a coactivator for Nrf1, a key player in the transcriptional control of nuclear genes required for respiration, mitochondrial DNA transcription and replication via Tfam.
- LSD1 is present at the promoter of ⁇ 90 % of Ampk subunits (Table 1), as well as at the promoter of Acaca, Pgc-1 ⁇ , Pgc-1 ⁇ , Nrf1, and Tfam ( Fig. 30b ).
- RNA-seq results and independent qRT-PCR analyses showed that expression of these genes is increased in 3T3-L1(Tg) compared to 3T3-L1(Ctrl) cells at day 7 ( Fig.
- LSD1 occupies and positively regulates the genes required for uncoupled respiration ( Ucp2 and Ucp 3) ( Fig. 31e ), which contributes to increased heat production by mitochondria.
- Pathway total number of genes encoding pathway proteins, promoter occupancy by LSD1 in 3T3-L1(Ctrl) and 3T3-L1(Tg) cells at day 0, and average logarithmic fold change (FC) of differential gene expression between 3T3-L1(Tg) and 3T3-L1(Ctrl) cells at day 7 of differentiation.
- FC logarithmic fold change
- LSD1 regulates mitochondrial functions through Nrf1
- Nrf1 genes occupied by Nrf1 at days 0 and 7, and LSD1 at day 7 revealed a robust overlap, i.e. 736 out of 914 (81 %) genes ( Fig. 6e ). This finding suggests that LSD1 and Nrf1 coordinately control gene expression during 3T3-L1 cell differentiation. Pathway analyses for this common gene set (736 genes) revealed "electron transport chain” and "oxidative phosphorylation" among the top scoring clusters as exemplified by components of the mitochondrial electron transport chain ( Fig. 32 ). Of note, we also identified the Nrf1 gene among the prominent LSD1 targets ( Fig. 30b ).
- RNA-seq, qRT-PCR, and Western blot analyses showed increased Nrf1 transcript and protein levels in differentiated 3T3-L1(Tg) cells and beige fat of Tg mice ( Figs. 31a-c ). In contrast, Nrf1 levels were not altered in skeletal muscle and liver of Tg mice ( Fig. 33 ). Short interfering RNA (siRNA)-mediated knockdown of Nrf1 in 3T3-L1(Tg) cells significantly decreased expression of Prdm16, Pgc-1 ⁇ , and Ucp1, as well as representative genes of the mitochondrial electron transport chain ( Fig. 34 ). Together, these data suggest that LSD1 promotes mitochondrial respiratory properties of fat cells, at least in part, by induction of and in cooperation with Nrf1.
- LSD1 regulates beige adipogenesis through C/ebp ⁇ and Ppar ⁇ /Rxr ⁇
- HOMER motif searches revealed a significant enrichment of C/ebp ⁇ , Ppary, and Rxr binding sites for 3T3-L1(Tg) cells at day 7, whereas for 3T3-L1(Ctrl) cells these binding sites were not identified among the top scoring motifs ( Fig. 6a ). Since C/ebp ⁇ and Ppary, in cooperation with Prdm16 or Pgc-1 ⁇ , have been shown to promote the browning of fat cells 16,20 , this observation suggested that in 3T3-L1(Tg) cells LSD1 acts in cooperation with C/ebp ⁇ and Ppar ⁇ /Rxr ⁇ to regulate early and late phases of beige adipogenesis, respectively.
- C / ebp ⁇ , C / ebp ⁇ , and C / ebp ⁇ are direct LSD1 target genes, and LSD1 upregulates expression of C / ebp ⁇ at day 7, and C / ebp ⁇ at days 0 and 7 of 3T3-L1 cell differentiation ( Fig. 35c ).
- LSD1 upregulates expression of C / ebp ⁇ at day 7, and C / ebp ⁇ at days 0 and 7 of 3T3-L1 cell differentiation
- Fig. 35c 3T3-L1 cell differentiation
- RNAi-mediated knockdown of C / ebp ⁇ in 3T3-L1(Tg) cells significantly decreased expression of the beige-selective gene programme ( Fig. 36 ) demonstrating that C/ebp ⁇ , at least in part, mediates LSD1-controlled beige adipogenesis.
- C/ebp ⁇ and C/ebp ⁇ also promote expression of Ppar ⁇ 44 .
- Ppar ⁇ /Rxr heterodimers act as a transcriptional activator of numerous adipocyte-specific genes 45 .
- ChIP-seq analysis of Ppar ⁇ and Rxr ⁇ in 3T3-L1 cells 46 confirmed that at day 0 only a minimal fraction (0.5 %) of LSD1 target genes is cooccupied by Ppar ⁇ /Rxr ⁇ ( Fig. 37a ). However, at day 7, Ppar ⁇ /Rxr ⁇ occupy 1831 out of 6904 (27 %) of LSD1 target genes ( Fig. 6g ). These 1831 common target genes define "adipogenesis" ( Fig.
- mice All mice were housed in the pathogen-free barrier facility of the University Medical Center Freiburg in accordance with institutional guidelines and approved by the regional board. Mice were maintained in a temperature- and humidity-controlled animal facility with a 12-hour light/dark cycle, free access to water, and a standard rodent chow (Kliba, breeding, 3807).
- the high-fat diet (HFD) study was carried out with a chow containing 4.056 kcal/kg (fat: 1.600 kcal/kg and sucrose: 1.600 kcal/kg; Research Diets). HFD was given to mice at 5 weeks of age. Mice were analysed at 25 weeks of age.
- mice were maintained at 10 °C with a 12 hour light/dark cycle, free access to water, and a standard rodent chow. Animals were killed by cervical dislocation, tissues were immediately collected, weighted, frozen in liquid nitrogen or processed for further analyses. Nomenclature for dissected adipose depots was used according to Seale et al. 17 .
- Epididymidal WAT epWAT
- Inguinal WAT ingWAT: bilateral superficial inguinal depots between the skin and muscle fascia just anterior to the lower segment of the hind limbs.
- Perimuscular WAT (pmWAT): depots located on the upper part of the quadriceps muscle.
- Retroperitoneal WAT rpWAT
- Retroperitoneal WAT (rpWAT): bilateral depots in abdominal cavity behind the peritoneum on the dorsal side of the kidney.
- Interscapular BAT (BAT): most prominent depot of brown adipocytes in rodents, found between the scapulae.
- Tg mice or inactive mutant transgenic (Tg Mut ) mice the complete human wild type or K661A/W751A/Y761S mutated LSD1 cDNA was cloned 3' to the Rosa26 promoter/enhancer ( Figs. 7a and 10a , respectively).
- Tg and Tg Mut mice were generated by pronuclear injection into fertilized FVB oocytes. For analyses wild-type littermates were used as controls. Mice were genotyped by PCR amplification of genomic DNA extracted from tail biopsies using the DirectPCR extraction kit (Viagen) with primers for detection of the transgene Rosa26- LSD1 or Rosa26- LSD1 Mut (Table 2).
- LSD1 tm1Schüle The targeting strategy for the conditional deletion of the first exon of LSD1 (LSD1 tm1Schüle ) is available upon request.
- conditional LSD1 mice were crossed to either Rosa26-Cre (Tg/0) transgenic mice that ubiquitously express the Cre recombinase 49 ( Fig. 20a ), aP2-Cre mice 38 to selectively ablate LSD1 in adipose tissue, or Rosa26-CreERT (Tg/0) transgenic mice, which mediates tamoxifen-inducible Cre recombination ( LSD1 Rosa26 - CreERT ) 40 .
- Mice were maintained on a mixed C57/BI6NCrl;129S2/Sv background. Homozygous conditional mice were used as controls. Mice were genotyped with primers for detection of the conditional LSD1 and the deleted alleles (Table 2).
- mice Tissues obtained from mice were immediately frozen in liquid nitrogen. The activities of the respiratory chain enzyme complex II (Sdh) and complex IV (Cox) were determined as described 50 .
- Blood was collected from retro orbital sinus after a 6 hr fast that started at the beginning of the light cycle. Serum glucose, cholesterol, triglyceride, and free fatty acid levels were analysed as described 51 .
- Intraperitoneal glucose tolerance test IPGTT
- IPIST insulin sensitivity test
- Tissues were fixed in 10 % buffered formalin and embedded in paraffin.
- 5 ⁇ m paraffin sections were deparaffinised, rehydrated, boiled in antigen unmasking solution (Vector laboratories, H-3300) for 10 min, cooled to room temperature, washed 3 times with PBS, 0.1 % Triton-X100 for 5 min, incubated for 1 h in 5 % FBS (Gibco, 10270-106) in PBS, 0.1 % Triton-X100, followed by overnight incubation at 4°C with anti-LSD1 1 (1/1000), anti-Myf5 (Santa Cruz, C-20, sc-302, 1/500), anti-Prdm16 (abcam, ab118573, 1/500), or anti-Ucp1 (abcam, ab10983, 1/200) antibody.
- RNA samples were sequenced by the standard Illumina protocol to create raw sequence files (.fastq files). We aligned these reads to the mm10 build of the mouse genome using TopHat version 2 54 . The aligned reads were counted with the homer software (analyze RNA) and DEG's were identified using EdgeR 55 and DESeq version 1.8.3 56 .
- Fat tissues were grounded in RIPA buffer [50 mM Tris pH 7.5, 1 % NP40, 0.5 % sodium deoxycholate, 0.1 % SDS, 150 mM NaCl, 5 mM EDTA, and protease inhibitor cocktail (45 ⁇ g/ml, Roche, 11 873 580 001)] at 4 °C.
- Homogenates were separated in 10 % polyacrylamide gels and blotted to Hybond nitrocellulose membranes (GE Healthcare).
- Membranes were decorated using following antibodies: anti-LSD1 1 (1/1000), anti-Prdm16 (abcam, ab118573, 1/500), anti-Pgc-1 (Santa-Cruz, H300, sc-13067, 1/1000), anti-Nrf1 (abcam, ab55744, 1/1000), anti-Ucp1 (abcam, ab10983, 1/1000), anti-Klhl13 (Santa-Cruz, H-286, sc-99119, 1/500), Fabp4 (Santa-Cruz, sc-18661, 1/2000), anti-Flag (Sigma, F3165, 1/500), anti-Ear2 (Proteintech, 60117-2-Ig, 1/400), anti-C/ebp ⁇ (Santa-Cruz, sc-746, 1/500), anti-Ppary (AbD Serotec, AHP1461, 1/500), anti-Rxra (
- ChIP sequencing (ChIP-seq)
- Chromatin immunoprecipitation experiments were performed using anti-LSD1 (20752, Schüle laboratory) or anti-Nrfl (abcam, ab55744, lot GR 95770-1) antibodies, on protein A-Sepharose 4B (GE Healthcare) essentially as described 57 .
- Libraries were prepared from immunoprecipitated DNA according to standard methods. ChlP-seq libraries were sequenced using a HiSeq 2000 (Illumina) and mapped to the mm10 reference genome using bowtie 2 58 . Data were further analysed using the peak finding algorithm MACS 1.41 59 using input as control. All peaks with FDR greater than 1 % were excluded from further analysis.
- the uniquely mapped reads were used to generate the genome-wide intensity profiles, which were visualized using the IGV genome browser 60 .
- HOMER 42 was used to annotate peaks, to calculate overlaps between different peak files, and for motif searches.
- the genomic features promoter, exon, intron, 3' UTR, and intergenic regions
- Refseq Genes annotated by HOMER were further used for a pathway analysis 42 .
- Previously reported ChIP-seq results for C/ebp ⁇ (GSE27826) 43 , Ppar ⁇ , and Rxr ⁇ (GSE13511) 46 were used for analysis.
- Fat pads were digested overnight with Proteinase K and DNA was extracted with phenolchloroform. Mitochondrial and nuclear DNA was amplified by quantitative PCR using Cox2 and Fasn primers (Table 3), respectively.
- plasmids were used: pLenti4_Flag_HA_Puro, pLenti4_Flag_HA_Puro_LSD1, pRTS_Puro_GW, pRTS_Puro_GW-Flag_LSD1, pRTS_Puro_GW_Flag_LSD1-K661A-W751A-Y761S, pSlik-Neo, and pSlik-Neo_Flag-HA_LSD1.
- Plasmids were obtained by Gateway LRII cloning in pLenti4 vector (Invitrogen) or in a puromycin-selectable and doxycycline-inducible pRTS plasmid 61 modified to contain a Gateway cassette, V5, and His tags. Cloning details can be obtained upon request.
- Primary white fat stromal vascular and mature fat cells were fractionated according to published methods 62,63 .
- Primary SV cells were cultured in DMEM/F12 containing 10% fetal bovine serum (FBS).
- FBS fetal bovine serum
- primary cells were treated with 4-hydroxy-tamoxifen (Sigma) at 0.2 ⁇ M.
- Mouse 3T3-L1 and C3H-10T1/2 preadipocytes were maintained in Dulbecco's modified Eagle's medium (DMEM) or Eagle's minimal essential medium (EMEM), respectively, supplemented with 10 % FBS and glutamine.
- DMEM Dulbecco's modified Eagle's medium
- EMEM Eagle's minimal essential medium
- Differentiation of primary SV cells, 3T3-L1, and C3H-10T1/2 was induced by treatment of confluent cells (designated day 0) with an adipogenic mixture consisting of 10 ⁇ g/ml insulin (Gibco), 1 ⁇ M dexamethasone (Calbiochem), 10 ⁇ M rosiglitazone (Cayman) and 500 ⁇ M isobutylmethylxanthine (Serva) in the presence of 10 % FBS.
- the differentiation medium was replaced 3 days later (day 3) with medium supplemented with 10 % FBS and 10 ⁇ g/ml insulin for 2 days. Subsequently, the cells were cultured in the same medium for 2 more days (day 7).
- 3T3-L1 cells were stained with fluorescent dye JC-1 (Invitrogen) followed by flow cytometric analysis. Following trypsin treatment, cells were exposed to 20 ⁇ g/ml of JC-1 in culture medium for 15 min at 37 °C and suspended in PBS for fluorescence-activated cell sorting (FACS) analysis. Green and red fluorescent signals corresponding to mitochondrial mass (FL-1) and mitochondrial membrane potential (FL-2), respectively, were detected using a FACS Canto cytometer (Becton Dickinson). 293FT cells were cultured in DMEM supplemented with 10 % FBS, non-essential amino-acids (Gibco) and glutamine (Gibco). Viral production was performed as described 1 .
- FACS fluorescence-activated cell sorting
- 3T3-L1 cells were infected with pLenti4_Flag_HA_Puro, pLenti4_Flag_HA_Puro_LSD1, pSlik-Neo, or pSlik-Neo_Flag-HA_LSD1 virus and subsequently selected in medium containing 1 ⁇ M puromycin (Sigma).
- Stable transfection of C3H-10T1/2 with pRTS_Puro_GW, pRTS_Puro_GW-Flag_LSD1, or pRTS_Puro_GW-Flag_LSD1-K661A-W751A-Y761S was carried out in 6-well plates.
Landscapes
- Life Sciences & Earth Sciences (AREA)
- Health & Medical Sciences (AREA)
- Engineering & Computer Science (AREA)
- Zoology (AREA)
- Genetics & Genomics (AREA)
- Chemical & Material Sciences (AREA)
- Biotechnology (AREA)
- Environmental Sciences (AREA)
- General Health & Medical Sciences (AREA)
- Organic Chemistry (AREA)
- Bioinformatics & Cheminformatics (AREA)
- Wood Science & Technology (AREA)
- Biomedical Technology (AREA)
- General Engineering & Computer Science (AREA)
- Molecular Biology (AREA)
- Veterinary Medicine (AREA)
- Animal Behavior & Ethology (AREA)
- Animal Husbandry (AREA)
- Biodiversity & Conservation Biology (AREA)
- Biochemistry (AREA)
- Microbiology (AREA)
- Medicinal Chemistry (AREA)
- Virology (AREA)
- Physics & Mathematics (AREA)
- Biophysics (AREA)
- Plant Pathology (AREA)
- Micro-Organisms Or Cultivation Processes Thereof (AREA)
- Measuring Or Testing Involving Enzymes Or Micro-Organisms (AREA)
- Investigating Or Analysing Biological Materials (AREA)
- Medicines That Contain Protein Lipid Enzymes And Other Medicines (AREA)
Description
- The present invention relates to the use of a genetically modified non-human mammal as an animal model for obesity and obesity-related disorders, wherein the modified non-human mammal (i) is heterozygous for the disruption of the gene encoding LSD1 or (ii) has a deletion of the gene encoding LSD1, said deletion being limited to adipose tissue, wherein said obesity-related disorder is selected from the group consisting of insulin resistance, type II diabetes, fatty liver, non-alcoholic fatty liver disease, endocrine abnormalities and triglyceride storage disease . The invention further pertains to a method for identifying a compound useful in the treatment and/or prevention of obesity or an obesity-related disorder.
- In industrialized countries, characterized by a sedentary lifestyle and high-caloric diet, energy balance is often deregulated leading to the development of obesity, dyslipidemia, hyperglycemia, and insulin resistance (
type 2 diabetes). Among other organs, adipose tissue is an important regulator of energy balance (Langin, 2010). There are two major types of adipose tissue in mammals, white adipose tissue (WAT) and brown adipose tissue (BAT), which are present in different compartments and show distinct metabolic characteristics. Unilocular WAT is highly adapted to store excess energy in the form of triglycerides and is mainly located in the abdominal and subcutaneous areas. Conversely, multilocular cells from BAT, which are mainly located in the interscapular area (iBAT), oxidize chemical energy to produce heat as a defense against hypothermia and obesity (Himms-Hagen, 1990; Langin, 2010). Fatty acid oxidation and heat production by brown adipocytes is due to the intense metabolic activity of mitochondria, which express uncoupling protein 1 (Ucp1) (Ricquier and Bouillaud, 2000). WAT and BAT have long been assumed to have the same embryonic origin. However, recent evidence suggests that brown and white adipocytes are derived from two different precursors (Seale et al., 2008). - These precursors can be discriminated by the presence or absence of the transcription factor myogenic factor 5 (Myf5), with brown adipocytes being derived from Myf5-positive and white adipocytes derived from Myf5-negative cells, respectively (Seale et al., 2008). In response to environmental cues such as cold or treatment with β3-adrenergic agonists, appearance of brown fat-like cells has been observed in mouse WAT (Himms-Hagen et al., 1994; Himms-Hagen et al., 2000; Young et al., 1984). These brown fat-like cells are called beige or brite cells. Interestingly, these beige fat cells are not derived from Myf5-expressing precursors (Seale et al., 2008), raising questions about their origin. It has been speculated that beige cells might originate from differentiation of a specific pool of precursor cells already present in WAT (Seale et al., 2011; Wu et al., 2012). Alternatively, beige fat cells could arise from direct conversion of white adipocytes (Granneman et al., 2005; Himms-Hagen et al., 2000; Loncar, 1991). Recently, Wu and colleagues proposed that beige cells exhibit a gene expression pattern distinct from either white or brown fat and that previously identified brown fat deposits in adult humans are indeed composed of beige adipocytes (Wu et al., 2012). However, it is neither known whether beige adipocytes constitute metabolically active fat cell nor are the transcriptional cascades that control the transformation of white to beige adipose tissues have been determined so far.
- Over the last decade, evidence accumulated that epigenetics contribute to regulation of adipogenesis. In particular, posttranslational modifications of histone H3 lysines have been linked to either transcriptional activation or repression, depending on the modified residue. Methylation of
lysine 4 in histone H3 (H3K4) correlates with gene activation, whereas methylation oflysine 9 or 27 in histone H3 (H3K9 or H3K27, respectively) is associated with transcriptional repression. As an example illustrating the key role of lysine methylation in adipocyte differentiation, it was reported that H3K4 methylation was required for Pparg and C/ebpa expression and thus positively regulates adipogenesis (Cho et al., 2009). In contrast, methylation of H3K27 by the methytransferase Ezh2 promotes adipogenesis by repressing the Wnt signaling (Wang et al., 2010). Lysine-specific demethylase 1 (LSD1), the first histone lysine demethylase described, is an amine oxidase that mediates histone demethylation via a FAD-dependent oxidative reaction. It has been shown that LSD1 selectively removes mono- and dimethyl groups from H3K4 or H3K9, thereby causing either repression or activation of gene transcription (Garcia-Bassets et al., 2007; Lee et al., 2005; Metzger et al., 2010; Metzger et al., 2005; Shi et al., 2004; Wang et al., 2009a; Wang et al., 2009b) (Zhu Ms). Recent in vitro studies suggest that LSD1 might play a role during fat cells differentiation in vitro (Hino et al., 2012). Hino et al. observe upregulation of LSD1 protein levels in mice on a high fat diet. In addition, their ex vivo experiments with adipocytes from mice on a high fat diet suggest that energy expenditure genes are upregulated upon knockdown of LSD1. This teaches away from the present invention. - The inventors of this application have shown that heterozygous mice in which one allele of the LSD1 gene has been disrupted and which show reduced expression of Lsd1 are prone to obesity and
type 2 diabetes. These mice and other non-human mammals having a reduced expression of Lsd1 are valuable tools for studying established and potential agents to treattype 2 diabetes and related diseases such as or insulin resistance and obesity. - The present invention therefore relates to the subject matter defined in items (1) to (8).
- (1) The use of a modified non-human mammal as an animal model for obesity or obesity-related disorders, wherein the modified non-human mammal (i) is heterozygous for the disruption of the gene encoding LSD1 or (ii) has a deletion of the gene encoding LSD1, said deletion being limited to adipose tissue, wherein said obesity-related disorder is selected from the group consisting of insulin resistance, type II diabetes, fatty liver, non-alcoholic fatty liver disease, endocrine abnormalities and triglyceride storage disease .
- (2) The use of item (1), wherein the genetically modified non-human mammal has a nucleic acid inserted in its genome, wherein the presence of the inserted nucleic acid in the genome of the mammal results in reduced expression of LSD1.
- (3) The use of item (1) or (2), wherein said genetic modification is a disruption of an allele of the endogenous gene encoding LSD1.
- (4) The use of any one of the preceding items, wherein the amount of LSD1 is reduced in tissue of said mammal, preferably in adipose, liver or muscle of said mammal.
- (5) The use of any one of the preceding items, wherein said mammal develops obesity after high fat diet.
- (6) The use of any one of the preceding items, wherein said mammal has at least one symptom of
type 2 diabetes. - (7) The use of any one of the preceding items, wherein the mammal is a rodent, preferably a mouse.
- (8) A method for identifying a compound useful in the treatment and/or prevention of obesity or an obesity-related disorder, comprising (a) administering a test compound to a transgenic mammal or rodent as defined in any one of items (1) to (7), and (b) determining the effect of the test compound on the initiation, maintenance, or progression of at least one obesity-related parameter in said transgenic mammal or rodent, thereby identifying a compound that inhibits obesity or an obesity-related disorder,
wherein said obesity-related disorder is selected from the group consisting of insulin resistance, type II diabetes, fatty liver, non-alcoholic fatty liver disease, endocrine abnormalities and triglyceride storage disease;
and wherein said obesity-related parameter is selected from the group consisting of the mass of white adipose tissue, the total mass of adipose tissue, glucose intolerance, and expression of a adipose tissue differentiation marker. - In a first embodiment, the present invention relates to an animal model for obesity and obesity-related disorders. A first aspect of this embodiment of the invention is the use of a modified non-human mammal as an animal model for obesity or obesity-related disorders, wherein the modified non-human mammal (i) is heterozygous for the disruption of the gene encoding LSD1 or (ii) has a deletion of the gene encoding LSD1, said deletion being limited to adipose tissue, said obesity-related disorder being selected from the group consisting of insulin resistance, type II diabetes, fatty liver, non-alcoholic fatty liver disease, endocrine abnormalities and triglyceride storage disease . The modified non-human mammal may be a genetically modified non-human animal, preferably it is a transgenic non-human mammal. The mammals, in accordance with this embodiment have a reduced amount of LSD1 in at least one tissue. These mammals typically exhibit a reduced expression of LSD1 in one or more tissues. The reduced expression may or may not affect all tissues of the mammal. Preferably, the amount of LSD1 protein or Lsd1 mRNA is reduced in fat tissue, e.g. in BAT and/or WAT.
- Moreover, disclosed herein is an animal model for metabolic disorders including, but not limited to, eating disorders, body weight disorders, cachexia, anorexia, sarcopenia and wasting syndrome or disease. This disclosure includes the use of a non-human transgenic animal whose genome comprises a stably integrated transgenic nucleotide sequence encoding Lysine-specific Demethylase 1 (LSD1) operably linked to a promoter for studying metabolism and/or as an animal model for metabolic disorders. The animals in accordance with this disclosure have an increased amount of LSD1 in at least one tissue. These animals typically overexpress LSD1 in at least one tissue. The overexpression may or may not affect all tissues of the animal. Preferably, the amount of LSD1 protein or Lsd1 mRNA is increased in fat tissue, e.g. in BAT and/or WAT.
- In both the inventive embodiment and the disclosure, the reduced expression and the increased expression (overexpression), respectively, is relative to a control animal. The control animal may be a wild type animal which is substantially identical to the modified or transgenic animal/mammal, except for the genetic manipulation. The amount of LSD1 may be determined at the protein level, e.g. by immunoassays using antibodies against LSD1. The expression level of Lsd1 may be determined by quantitative RT-PCR, detecting the amount of Lsd1 mRNA.
- In the first embodiment, the amount of LSD1 protein, or the amount of Lsd1 mRNA may be reduced relative to the control animal by at least 10%, preferably by at least 20%, more preferably by at least 30%, more preferably by at least 40%, e.g. by about 50%. For example, the amount of LSD1 protein, or the amount of Lsd1 mRNA may be reduced relative to the control animal by 10% to 90%, preferably by 20% to 80%, more preferably by 30% to 70%, more preferably by 40% to 60%.
- In the mammals of the first embodiment the protein and/or mRNA levels of Prdm16, Pgc-1α and Ucp1 are reduced, e.g. by at least 10%, more preferably by at least 25%, most preferably by at least about 50%, relative to a control animal. Body fat mass in these mammals may be increased by about 10% relative to a control animal, in particular after high fat diet. Blood glucose levels in these mammals may be increased by about 10% to about 50%, or by about 20% to about 40%, relative to a control animal. Moreover, the mammals of the first embodiment typically exhibit reduced insulin sensitivity and glucose uptake relative to a control animal, wherein insulin sensitivity and glucose uptake may be determined according to the tests described in the Examples hereinbelow.
- In the disclosure, the amount of LSD1 protein, or the amount of Lsd1 mRNA may be increased relative to the control animal by at least 10%, preferably by at least 25%, more preferably by at least 50%, more preferably by at least 75%, e.g. by about 100%. For example, the amount of LSD1 protein, or the amount of Lsd1 mRNA may be increased relative to the control animal by 10% to 1000%, preferably by 25% to 500%, more preferably by 50% to 200%, more preferably by 75% to 150%. In this disclosure the phrase "LSD1 protein" includes endogenous and exogenous LSD1 protein. The phrase "Lsd1 mRNA" includes endogenous and exogenous Lsd1 mRNA.
- The transgenic non-human mammal preferably is a rodent, such as a mouse. Suitable mammals are available, or easily generated, using conventional methods, in a variety of genera, including rodents (e.g., rats), rabbits, guinea pigs, dogs, goats, sheep, cows, horses, pigs, llamas, camels or the like. Preferably, the non-human transgenic mammal is a transgenic mouse.
- The animal from which the progeny animal is descended is referred to as "progenitor animal". "Progeny" of a progenitor mammal are any animals which are descended from the progenitor as a result of sexual reproduction or cloning of the progenitor, and which have inherited genetic material from the progenitor. In this context, cloning refers to production of genetically identical offspring from DNA or a cell(s) of the progenitor animal. As used herein, "development of an animal" from a cell or cells (embryonic cells, for example), or development of a cell or cells into an animal, refers to the developmental process that includes growth, division and differentiation of a fertilized egg or embryonic cells (and their progeny) to form an embryo, and birth and development of that embryonic animal into an adult animal.
- An animal is "derived from" a transgenic ovum, sperm cell, embryo or other cell if the transgenic ovum, sperm cell, embryo or other cell contributes DNA to the animal's genomic DNA. For example, a transgenic embryo can develop into a transgenic mammal of the invention. A transgenic ovum can be fertilized to create a transgenic embryo that develops into a transgenic mammal of the invention. A transgenic sperm can be used to fertilize an ovum to create a transgenic embryo that develops into a transgenic mammal of the invention. A transgenic cell can be used to clone a transgenic mammal of the invention.
- As used herein, a "transgenic non-human mammal" is a non-human mammal into which an exogenous recombinant construct has been introduced, or its progeny. Such a mammal may have developed from (a) embryonic cells into which the construct has been directly introduced or (b) progeny cells of (a). As used herein, an "exogenous construct" is a nucleic acid that is artificially introduced, or was originally artificially introduced, into an animal. The term "artificial introduction" excludes introduction of a construct into an animal through normal reproductive processes (such as by cross breeding). However, animals that have been produced by transfer of an exogenous construct through the breeding of a mammal comprising the construct (into whom the construct was originally "artificially introduced") are considered to "comprise the exogenous construct." Such animals are progeny of animals into which the exogenous construct has been introduced.
- In accordance with the first embodiment, the transgenic non-human mammal contains a disruption in an endogenous LSD1 gene such that at least one allele of the LSD1 gene is non-functional or does not express a functional LSD1, wherein the disruption is an insertion of a transgene into the endogenous LSD1 gene. The disruption can be, for example, an insertion, missense, frameshift, or deletion mutation. The disruption can also alter a promoter, enhancer, or splice site. The disruption can be insertion of a transgene. The transgene optionally encodes a selectable marker, such as, for example a LacZ reporter gene operably linked to a LSD1 promoter. The provided non-human mammals are preferably heterozygous for LSD1. As used herein, the term heterozygous means that the animal has a disruption in one allele (i.e., endogenous gene) while the second allele is unaffected (i.e., does not contain a disruption). In a most preferred embodiment, the genome of the mammal comprises a disruption of only one allele of the gene encoding LSD1. An example of this embodiment is the Lsd+/- mouse described in the Examples.
- Also disclosed herein is a non-human transgenic animal (e.g., a rodent, preferably a mouse) whose genome comprises a DNA sequence encoding hLSD1, or encoding a biologically active fragment or variant thereof, which is operably linked to an expression control sequence. Typically, the mouse according to this disclosure will overexpress LSD1 (see, for example, the LSD1-overexpressing mice described in the Examples). In this disclosure, the non-human transgenic animal is preferably one whose somatic and germ cells comprise at least one genomically integrated copy of a recombinant construct (a recombinant construct comprising a sequence encoding LSD, preferably hLSD1), or an active fragment or variant thereof, which sequence is operably linked to an expression control sequence. Alternatively, the disclosed transgene construct can also be assembled as an artificial chromosome, which does not integrate into the genome but which is maintained and inherited substantially stably in the animal. Artificial chromosomes of more than 200 kb can be used for this purpose. The present disclosure is also directed to the creation of transgenic mice in whose tissue specific expression of the hLSD1 transgene is driven by a tissue specific promoter, as is discussed more extensively below.
- Also disclosed herein is a transgenic gamete, including a transgenic ovum or sperm cell, a transgenic embryo, and any other type of transgenic cell or cluster of cells, whether haploid, diploid, or of higher zygosity having at least one disruption in the LSD1 gene.
- As used herein, the term "embryo" includes a fertilized ovum or egg (i.e., a zygote) as well as later multicellular developmental stages of the organism. The disruption referred to above is preferably in the animal's somatic and germ cells.
- Also included herein are progeny of the transgenic mammal that preferably comprise a disruption of at least one allele of the LSD1 gene, and transgenic mammals derived from a transgenic ovum, sperm, embryo or other cell.
- The transgenic mammal may be sterile although, preferably, it is fertile. Further disclosed herein is a cell line derived from a transgenic embryo or other transgenic cell, which contains a disruption of at least one allele of the LSD1 gene. Methods of isolating such cells and propagating them are known to those of skill in the art.
- The transgenic non-human mammals of the invention are produced by introducing transgenes into the germline of the non-human mammal. Embryonal target cells at various developmental stages are used to introduce the transgenes. Different methods are used depending on the stage of development of the embryonal target cell(s). Such methods include, but are not limited to, microinjection of zygotes, viral integration, and transformation of embryonic stem cells as described below.
- Microinjection of zygotes is the preferred method for incorporating transgenes into animal genomes. A zygote, which is a fertilized ovum that has not undergone pronuclei fusion or subsequent cell division, is the preferred target cell for microinjection of transgenic DNA sequences. The murine male pronucleus reaches a size of approximately 20 micrometers in diameter, a feature which allows for the reproducible injection of 1-2 picoliters of a solution containing transgenic DNA sequences. The use of a zygote for introduction of transgenes has the advantage that, in most cases, the injected transgenic DNA sequences will be incorporated into the host animal's genome before the first cell division. Brinster et al., Proc. Natl. Acad. Sci. USA 82:4438 (1985). As a consequence, all cells of the resultant transgenic animals (founder animals) stably carry an incorporated transgene at a particular genetic locus.
- Viral integration can also be used to introduce the transgenes into an animal. The developing embryos are cultured in vitro to the blastocyte developmental stage. The blastomeres may be infected with appropriate retroviruses. Jaenich, Proc. Natl. Acad. Sci. USA 73:1260. Infection of the blastomeres is enhanced by enzymatic removal of the zona pellucida. Transgenes are introduced via viral vectors which are typically replication-defective but which remain competent for integration of viral-associated DNA sequences, including transgenic DNA sequences linked to such viral sequences, into the host animal's genome. Transfection is easily and efficiently obtained by culture of blastomeres on a monolayer of cells producing the transgene-containing viral vector. Alternatively, infection may be performed using cells at a later developmental stage, such as blastocoeles. In any event, most transgenic founder animals produced by viral integration will be mosaics for the transgenic allele; that is, the transgene is incorporated into only a subset of all the cells that form the transgenic founder animals. Moreover, multiple viral integration events may occur in a single founder animal, generating multiple transgenic alleles which will segregate in future generations of offspring. Introduction of transgenes into germline cells by this method is possible but probably occurs at a low frequency. However, once a transgene has been introduced into germline cells by this method, offspring may be produced in which the transgenic allele is present in all of the animal's cells, i.e., in both somatic and germline cells.
- Embryonic stem (ES) cells can also serve as target cells for introduction of the transgenes into animals. ES cells are obtained from pre-implantation embryos that are cultured in vitro. Evans et al., Nature 292:154 (1981). ES cells that have been transformed with a transgene can be combined with an animal blastocyst, after which the ES cells colonize the embryo and contribute to the germline of the resulting animal. Once a transgene has been introduced into germline cells by this method, offspring may be produced in which the transgenic allele is present in all of the animal's cells, i.e., in both somatic and germline cells.
- The transgenic nucleic acid may be stably integrated into germ line cells and transmitted to offspring of the transgenic animal as Mendelian loci. Other transgenic techniques result in mosaic transgenic animals, in which some cells carry the transgenes and other cells do not. In mosaic transgenic animals in which germ line cells do not carry the transgenes, transmission of the transgenes to offspring does not occur. Nevertheless, mosaic transgenic animals are capable of demonstrating phenotypes associated with the transgenes.
- In practicing the invention, animals of the transgenic maintenance line are crossed with animals having a genetic background in which expression of the transgene results in symptoms of obesity or obesity-related disorders. Offspring that have inherited the transgenic nucleic acids are distinguished from littermates that have not inherited transgenic nucleic acids by analysis of genetic material from the offspring for the presence of nucleic acid sequences derived from the transgenic nucleic acids. For example, biological fluids that contain polypeptides uniquely encoded by the transgenic nucleic acids may be immunoassayed for the presence of the polypeptides. A simpler and more reliable means of identifying transgenic offspring comprises obtaining a tissue sample from an extremity of an animal, such as, for example, a tail, and analyzing the sample for the presence of nucleic acid sequences corresponding to the DNA sequence of a unique portion or portions of the transgenic nucleic acids. The presence of such nucleic acid sequences may be determined by, e.g., hybridization ("Southern") analysis with DNA sequences corresponding to unique portions of the transgene, analysis of the products of PCR reactions using DNA sequences in a sample as substrates, oligonucleotides derived from the transgene's DNA sequence, and the like.
- As used herein, the term "polynucleotide" is interchangeable with "nucleic acid." A polynucleotide may be recombinant, natural, or synthetic or semi-synthetic, or any combination thereof. Polynucleotides may be RNA, PNA, LNA, or DNA, or combinations thereof. As used herein, the terms peptide, polypeptide and protein are also interchangeable.
- A "recombinant construct" (also referred to herein as a "construct" for short) or a "transgene" of "transgenic nucleic acid" which is used to generate a transgenic animal of the above disclosure is a polynucleotide which comprises a sequence encoding LSD1 (preferably hLSD1), or an active fragment or variant thereof, which is operably linked to an expression control sequence. The coding sequence comprises LSD1 exon sequences, although it may optionally include intron sequences which are either derived from an hLSD1 genomic DNA or DNA of an unrelated chromosomal gene. The recombinant construct may comprise a sequence encoding mLSD1 or at least a biologically active fragment thereof. Preferably, the recombinant construct comprises a sequence encoding human LSD1 (hLSD1) or a biologically active fragment thereof. The amino acid sequences of hLSD1 and mLSD1 are shown in SEQ ID NO:3 and 5, respectively. The nucleotide sequence encoding mLSD1 is shown in SEQ ID NO:4. The nucleotide sequence encoding hLSD1 is shown in SEQ ID NO:1. The hLSD1 cDNA sequence including 5'- and 3'-untranslated regions is shown in SEQ ID NO:2. The nucleotide sequence of an exemplary recombinant construct is shown in SEQ ID NO:6. The amino acid sequence encoded by this construct is shown in SEQ ID NO:7.
- For tissue-specific expression of the transgene in the transgenic animal, the coding sequence must be operably linked to an expression control sequence that drives expression specifically in that tissue. Suitable tissue-specific expression control sequences include the following: MMTV-LTR (for mammary-specific expression), etc.
- An inducible promoter is one which, in response to the presence of an inducer, is activated. Hence, a coding sequence driven by an inducible promoter can be turned on or off by providing or withdrawing the inducer. A promoter may be homologous, derived from the same species as the coding sequence. Preferably, the promoter is heterologous, that is, derived from another species, or even from a virus. hLSD1 constructs may be operably linked to an inducible or repressible control elements. An repressible system, described by Gossen, M. et al., Proc Natl Acad Sci USA 89:5547-51 (1992), is based on the use of control elements of the tetracycline-resistance operon encoded in Tn10 of E. coli. The tet repressor is fused with the activating domain of Herpes simplex virus VP16 to generate a tetracycline-controlled transactivator. Such a transactivator is used to stimulate transcription from a promoter sequence, such as the CMV promoter IE.
- A gene controlled by a promoter acting under the influence of the tetracycline-controlled transactivator can be constitutively expressed and turned off by using an effective concentration of tetracycline. Such a system can regulate a gene over about five orders of magnitude. The tetracycline-repressible system functions in vivo in mice, where tetracycline administration via the diet is used to keep the expression of the inducible gene off. Tetracycline analogs which cross the blood-brain barrier can be used if gene activity is desired in the brain.
- Two steps of transfection may be used to produce the appropriate system. A first transfection is used to isolate clones expressing the transactivator. The best clones are identified by testing each in a transient transfection assay for the ability to express a marker gene, such as an estrogen-dependent luciferase. The second transfection involves the hLSD1 coding sequence under control of an inducible promoter into a transactivator-containing clone. One strategy involves first isolating a stable cell line expressing the inducible hLSD1 protein or peptide by cotransfection of both plasmids into appropriate target cells. After selection, for example with G418, clones showing estrogen-dependent expression of hLSD1 may be detected by an immunoassay or biological assay. To increase the rate of plasmid integration and to stabilize the integrated plasmids in the host genome, the plasmids are preferably linearized and cotransfected into cells in the presence of mammalian high molecular weight DNA as a carrier.
- The relative advantages of a two vector system, as described above, over a single vector system involving a larger plasmid is that in a two vector system, multiple copies of the reporter plasmid (encoding the gene of interest) may be needed to obtain a detectable biological effect in a cell, while one or only a few copies of the transactivator-carrying plasmid may suffice.
- According to the above disclosure, the hLSD1 DNA molecule is placed under the control of a promoter subject to regulation by a tetracycline-controlled transactivator. Such a construct (in a single vector or preferably two vector form) is delivered into target cells, whether embryonic, adult normal or tumor, either in vitro or in vivo. To express the hLSD1, tetracycline is withheld so that the hLSD1 DNA is expressed. To prevent the action of the hLSD1, for example, locally, tetracycline or an active congener of tetracycline is administered locally to the cells transfected with the constructs. Effective systemic doses (oral or parenteral) of tetracycline are in the range of about 0.1 mg to 1 g per day. In a preferred embodiment, the transactivator is maintained in the "on" position by withholding tetracycline.
- An estrogen-inducible system described by Braselmann, S. et al. Proc Natl Acad Sci USA (1993) 90:1657-61, is based on the fact that most mammalian cells neither express any Gal4-like activity nor endogenous estrogen receptor (ER), thus rendering estrogen an inert signal for them. The authors developed a selective induction system based on the estrogen-regulatable transcription factor Gal-ER. Gal-ER consists of the DNA-binding domain of the yeast Gal4 protein fused to the hormone-binding domain of the human ER and hence exclusively regulates a transfected coding sequence under the control of a Gal4-responsive promoter in mammalian cells. This system includes a synthetic Gal4-responsive promoter which consists of four Gal4-binding sites, an inverted CCAAT element, a TATA box, and the adenovirus major late initiation region. This promoter shows extremely low basal activity in the absence of, and high inducibility in the presence of, ligand-activated Gal-ER. The transcription factor Gal-ER is rendered more potent and less susceptible to cell type-specific variation by fusing the strong activating domain of the herpesvirus protein VP16 onto its C-terminus. In response to estrogen, e.g., 17-β estradiol, Gal-ER-VP16 may induce the Gal4-responsive promoter at least 100-fold in transfected cells. Thus, the Gal-ER induction system is a powerful genetic switch for regulating heterologous genes. For induction of expression of the DNA molecules in an estrogen inducible system in an animal, local or systemic treatment with estrogen would be required. An effective dose of an estrogen is a dose which would trigger the expression of an hLSD1-encoding nucleic acid to produce hLSD1 and promote growth of hLSD1-expressing adipose cells. Such doses can be ascertained by one skilled in the art. Preferably, doses in the range of about 0.05 to 100 mg/kg of an estrogen are used in a single dose or in multiple doses over a period of about one week days to about 6 months, or even longer. Forms and preparations of estrogen and their usage in animals, particularly in humans, are well-known in the art. Estrogen analogues which are capable of specifically activating the exogenous transactivator while having fewer biological effects and side effects are preferred.
- Ionizing radiation has been used to activate the transcription of exogenous genes, for example, encoding a cytotoxic protein TNF-I (Weichselbaum, R R et al., Int J Radiation Oncology Biol Phys 24:565-67 (1992)) This may be accomplished through the use of radiation-responsive elements distal to the transcription start site of such genes. See, for example, Hallahan, D et al., Proc Natl Acad Sci USA 88:2152-20 (1991); Datta, R et al., Proc Natl Acad Sci USA 89:10149-53 (1992); Weichselbaum et al., supra; Hallahan, D E et al. J Biol Chem 268:4903-07 (1993); Weichselbaum, R R et al., Intl J Radiation Oncology Bio. Phys 30:229-34 (1994); Hallahan, D E et al. Nature Med 1:786-91 (1995). Thus, also disclosed herein are methods for the spatial and temporal control of gene expression with such radiation-inducible promoters to activate hLSD1. The hLSD1 coding sequence is placed in a vector under control of a radiation-inducible promoter.
- In a preferred embodiment of the above disclosure, the expression control sequence (either a ubiquitously acting expression control sequence or a tissue-specific one) is expressed in a regulatable fashion, meaning that it is preferably a component of any of a number of well-known regulatable expression systems.
- Methods of making recombinant constructs are conventional. Such methods, as well as many other molecular biological methods used in conjunction with the present invention, are discussed, e.g., in Sambrook, et al. (1989), Molecular Cloning, a Laboratory Manual, Cold Harbor Laboratory Press, Cold Spring Harbor, N.Y.; Ausubel et al. (1995). Current Protocols in Molecular Biology, N.Y., John Wiley & Sons; Davis et al. (1986), Basic Methods in Molecular Biology, Elsevier Sciences Publishing, Inc., New York; Hames et al. (1985), Nucleic Acid Hybridization, IL Press; Dracopoli et al. Current Protocols in Human Genetics, John Wiley & Sons, Inc.; and Coligan et al. Current Protocols in Protein Science, John Wiley & Sons, Inc. See, also, the Examples herein.
- In a specific embodiment of this invention, the transgenic mammal does not comprise additional transgenic sequences. This means that the transgenic construct present in the transgenic animal is the only transgenic construct present in the mammal. The transgenic mammal preferably does not comprise further genetic germ line modifications other than that described hereinabove. The genetic background of the transgenic mammal of the invention is 'wild type' except for the genetic modifications described hereinabove. This embodiment is preferred, as it allows studying the effect of any methods interfering with the action of LSD1.
- Also disclosed herein is a method for identifying a compound which inhibits the growth of adipose tissue, comprising (a) administering a test compound to a transgenic animal according to the present invention and (b) determining the effect of the test compound on the growth or survival of the adipocytes or adipose tissue in said transgenic animal, thereby identifying a compound that inhibits the growth of adipose tissue.
- Another aspect of this invention is a method for identifying a compound which is useful in the treatment and/or prevention of obesity or an obesity-related disorder, comprising (a) administering a test compound to a transgenic mammal according to the first embodiment of the present invention and (b) determining the effect of the test compound on the initiation, maintenance, or progression of at least one obesity-related parameter in said transgenic mammal, , thereby identifying a compound that inhibits obesity or an obesity-related disorder; wherein said obesity-related disorder is selected from the group consisting of insulin resistance, type II diabetes, fatty liver, non-alcoholic fatty liver disease, endocrine abnormalities and triglyceride storage disease; and wherein said obesity-related parameter is selected from the group consisting of the mass of white adipose tissue, the total mass of adipose tissue, glucose intolerance, and expression of a adipose tissue differentiation marker.
- The methods may comprise the steps (i) administering a test compound to a transgenic mammal according to the present invention, (ii) administering the same test compound to a control animal, and (iii) determining the effect of the test compound on the transgenic mammal as compared to said control animal. The control animal is preferably an animal of the same species as the transgenic mammal. The control animal does not show reduced or increased expression of LSD1 or only to a significantly lower degree, relative to a wild type animal. In one embodiment, the control animal does not carry the transgenic nucleotide sequence present in the test animal of step (i). In another embodiment, the control animal is also carrying the same transgenic nucleotide sequence as the transgenic animal used in step (i) but there is no or only a slight reduction or increase in expression. This can be achieved by the use of inducible transgene constructs, see supra.
- The methods of analysis include but are not limited to determining the body weight, adipose tissue mass, adipose tissue size, presence of WAT markers, number of adipocytes, presence of lipomas, survival rate and the like, e.g. by histological methods and/or biochemical methods. A particularly preferred parameter is glucose tolerance.
- The test compound may be selected as a compound which is useful in the treatment of obesity or an obesity-related disorder if there is a significant difference in at least one of the obesity-related parameters tested, for example when the parameter (e.g. adipose tissue mass, adipose tissue size, presence of WAT markers, number of adipocytesetc.) in the transgenic test animal used in step (i) is significantly reduced (e.g. by at least 10%, preferably by at least 25%, more preferably by at least 50%) relative to that of the control animal.
- The test compound may be selected as a compound which is useful in the treatment of obesity or an obesity-related disorder if blood glucose levels are reduced by the test compound, or if insulin sensitivity and/or glucose uptake are significantly increased.
- The compound may be selected if any one the the target genes of LSD1 (e.g. Nrf1, Prdm16 and Pgc-1α) is upregulated by the test compound, e.g. by at least about 10% or at least about 25%, or at least about 50%, or at least about 100%. The quantitation is preferably done via RT-PCR.
- In another embodiment, the compound may be selected if any one the the target genes of LSD1 is downregulated by the test compound, e.g. by at least about 10% or at least about 25%, or at least about 50%. The quantitation is preferably done via RT-PCR.
- The compounds used as test compounds may be modulators of the LSD1 gene, of the LSD1 protein, or of any target gene of LSD1. Modulators include activators and inhibitors. The modulators are preferably activators of the LSD1 protein or activators of the LSD1 gene (see infra).
- Further disclosed herein is a method for identifying a compound which inhibits adipose cell or tissue growth, the method comprising
- providing a cell expressing LSD1
- contacting the cell with a test compound
- determining the amount of LSD1 protein or LSD1 mRNA expressed by the cell
- selecting the test compound as a compound which inhibits adipose cell or tissue growth if the amount of LSD1 protein or LSD1 mRNA expressed by the cell is greater than that expressed by a control cell.
- Further disclosed herein is a LSD1 modulator for use in the treatment and/or prevention of
type 2 diabetes, obesity or an obesity-related disorder. Further disclosed herein is a method of treatingtype 2 diabetes, obesity or an obesity-related disorder, comprising administering to an individual in need thereof, a pharmaceutically effective amount of a LSD1 modulator. Obesity-related disorders include, but are not limited to, insulin resistance, hypertension, hyperuricemia, fatty liver, non-alcoholic fatty liver disease, polycystic ovarian syndrome, acanthosis nigricans, hyperphagia, endocrine abnormalities, triglyceride storage disease, Bardet-Biedl syndrome, and Lawrence-Moon syndrome. Preferably, the disorder is type II diabetes. In certain embodiments, the obesity-related disorder is not hypertension. - An LSD1 activator to be used in accordance with this invention is a compound capable of increasing the amount of LSD1 mRNA or LSD1 protein in a cell and/or activating at least one function or activity of the LSD1 gene or the LSD1 protein. These functions include (1) the ability of LSD1 to interact with androgen receptor,(2) the ability of LSD1 to assemble with other proteins, in particular transcription factors into protein complexes, and (3) the catalytic activity of LSD1. The protein complexes may be important for transcriptional activation.
- An LSD1 inhibitor is a compound capable of reducing the amount of LSD1 mRNA or LSD1 protein in a cell and/or inhibiting at least one function of the LSD1 gene or the LSD1 protein. These functions include (1) the ability of LSD1 to interact with androgen receptor,(2) the ability of LSD1 to assemble with other proteins, in particular transcription factors into protein complexes, and (3) the catalytic activity of LSD1. The protein complexes may be important for transcriptional activation.
- The LSD1 modulator to be used in accordance with this invention may be a compound capable of activating or inhibiting expression of the LSD1 gene in a cell. Various methods for activating or inhibiting expression of genes in a cell are known to one of skill in the art (e.g. RNA interference or antisense technology).
- In another embodiment the invention, the LSD1 modulator is capable of modulating the interaction of LSD1 protein with the androgen receptor. Such activators include "small molecules," also referred to herein as "compounds," which are isolated from natural sources or made synthetically. In general, such molecules may be identified from large libraries of natural products or synthetic (or semi-synthetic) extracts or chemical libraries according to methods known in the art. Those skilled in the field of drug discovery and development will understand that the precise source of test extracts or compounds is not critical to the methods of the invention. Accordingly, virtually any number of chemical extracts or compounds can be used in the methods described herein. The types of extracts or compounds that may be tested include plant, fungal, prokaryotic or eukaryotic cell or organism-based extracts, fermentation broths, and synthetic compounds including modifications of existing compounds. Numerous methods are also available for generating random or directed synthesis (e.g., semi-synthesis or total synthesis) of any number of chemical compounds, including, but not limited to, saccharides, lipids, peptides, polypeptides and nucleic acids and derivatives thereof. Synthetic compound libraries are commercially available.
- In yet another embodiment, the LSD1 modulator may modulate (promote or inhibit) the stability the the LSD1 protein or Lsd1 mRNA.
- In yet another embodiment, the LSD1 modulator may modulate (promote or inhibit) degradation of LSD1 protein or Lsd1 mRNA. For example, the pathways leading to degradation of LSD1 protein or Lsd1 mRNA in the cells may be inhibited, thus leading to an increased amount of LSD1 protein or Lsd1 mRNA in the cells.
- In yet another embodiment, the LSD1 modulator may modulate (promote or inhibit) the translation efficiency of the Lsd1 gene.
- Alternatively, libraries of natural compounds in the form of bacterial, fungal, plant, and animal extracts are commercially available from a number of sources. In addition, natural and synthetically produced libraries can be generated according to methods known in the art, e.g., by standard extraction and fractionation methods. Furthermore any library or compound may readily be modified using standard chemical, physical, or biochemical methods.
- Another class of agents that can be screened are antibodies, in particular monoclonal antibodies.
- The LSD1 activators are preferably useful in the treatment and/or prevention of obesity or an obesity-related disorders. LSD1 inhibitors may be useful in the treatment and/or prevention of metabolic disorders such as eating disorders, body weight disorders, cachexia, anorexia, sarcopenia and wasting syndrome or disease.
- "Cachexia" refers to a state of general ill health and malnutrition. It is often associated with and induced by malignant cancer, and is characterized by loss of appetite, lass of body mass, especially lean body mass, and muscle wasting.
- "Anorexia" refers simply to a loss of appetite, whether brought on by medical or psychological factors. Anorexia is often closely associated with, and generally contributes to, the cachexia seen in patients with advanced cancers.
- Target genes of LSD1 include, but are not limited to, Nrf1, Prdm16 and Pgc-1α.
- In one embodiment, the modulator of a target gene of LSD1 is an activator of the target gene.
In another embodiment, the modulator of a target gene of LSD1 is an inhibitor of the target gene.
In another embodiment, the modulator of a target gene of LSD1 is an activator of Nrf1.
In another embodiment, the modulator of a target gene of LSD1 is an activator of Prdm16.
In another embodiment, the modulator of a target gene of LSD1 is an activator of Pgc-1α.
In another embodiment, the modulator of a target gene of LSD1 is an inhibitor of Nrf1. - In another embodiment, the modulator of a target gene of LSD1 is an inhibitor of Prdm16. In another embodiment, the modulator of a target gene of LSD1 is an inhibitor of Pgc-1α.
- Preferably, an activator is capable of increasing the expression of the target gene, or activating a function of the gene product of said target gene. Typically, an inhibitor is capable of inhibiting the expression of the target gene, or inhibiting a function of the gene product of said target gene.
- The above-mentioned modulators are useful in the treatment and/or prevention of
type 2 diabetes, obesity and/or related disorders. - One of skill in the art will appreciate that the LSD1 modulators can be used alone or in combination with other compounds and therapeutic regimens to inhibit obesity or obesity-related disorders or obesity-related symptoms.
- An effective amount of the activator will be determined by the existence, nature, and extent of any adverse side-effects that accompany the administration of the composition; the LD50 of the composition; and the side-effects of the composition at various concentrations. Typically, the amount of the composition administered will range from about 0.01 to about 20 mg per kg, more typically about 0.05 to about 15 mg per kg, even more typically about 0.1 to about 10 mg per kg body weight.
- The activator can be administered, for example, by intravenous infusion, orally, intraperitoneally, or subcutaneously. Oral administration is the preferred method of administration. The formulations of compounds can be presented in unit-dose or multidose sealed containers, such as ampoules and vials.
- The LSD1 activators are typically formulated with a pharmaceutically acceptable carrier before administration to an individual or subject. Pharmaceutically acceptable carriers are determined, in part, by the particular composition being administered, as well as by the particular method used to administer the composition. Accordingly, there are a wide variety of suitable formulations of pharmaceutical compositions (see, e.g., Remington's Pharmaceutical Sciences, 17th ed., 1989).
-
-
Figure 1 . Expression of LSD1 in transgenic mice induces the formation of functional beige fat in white adipose tissue, a, Macroscopic view of epididymal fat and haematoxylin and eosin staining (H&E) of interscapular brown adipose tissue (BAT), epididymal (epWAT), inguinal (ingWAT), perimuscular (pmWAT), and retroperitoneal (rpWAT) white adipose tissue of control (Ctrl) and LSD1 transgenic (Tg) mice. Black arrows indicate beige fat islets. b, Western blot analyses of LSD1, Prdm16, Ucp1, and Klhl13 in the indicated adipose tissues of Ctrl and Tg mice. β-Tubulin was used as a loading control. c, d, Relative transcript levels of the indicated (c) oxidative, (d) beige fat-selective, brown fat-selective, adipogenic, and white fat-selective markers in ingWAT of Ctrl, Tg, and transgenic mice expressing enzymatically inactive LSD1 mutant (TgMut). e, Ultrastructure analysis of ingWAT of Ctrl and Tg mice. Black arrows indicate mitochondria. LV: lipid vesicle. Magnified regions are delimited by squares. f, Density of mitochondria determined from ultrastructure analysis of indicated adipose tissues of Ctrl and Tg mice. g, Determination of Sdh (mitochondrial respiratory chain complex II) and Cox (mitochondrial respiratory chain complex IV) activities in pmWAT of Ctrl and Tg mice. BAT of Ctrl mice was used as a positive control. a-d, n=10 mice. e-g, n=5 mice. Standard deviation represents + SEM, *p<0.05. -
Figure 2 . LSD1 is induced in white fat pads after cold exposure or β3-adrenergic treatment of mice. a, (left panel) Western blot analysis showing LSD1 in ingWAT of mice on regular diet (RD) or high-fat diet (HFD). β-Tubulin was used as a loading control. (right panel) Amount of LSD1 protein relative to β-Tubulin. b, c, H&E staining of ingWAT of mice (b) maintained at either 24 or 10 °C, or (c) treated with vehicle or the β3-adrenergic agonist CL316,243. Black arrows show beige fat islets. d, e, (left panels) Western blot analysis of LSD1 and Ucp1 in ingWAT of mice (d) maintained at either 24 or 10 °C, or (e) treated with vehicle or CL316,243. β-Tubulin was used as a loading control. (right panels) Amount of LSD1 protein relative to β-Tubulin. Standard deviation represents + SEM (n=10 mice), ***p<0.001. -
Figure 3 . β3-adrenergic signalling promotes the beige fat programme through LSD1. LSD1 +/- mice are prone to obesity and type-2 diabetes due to decreased oxidative capacities in adipose tissue, a, Western blot analysis of LSD1 and Ucp1 in ingWAT of control (Ctrl) and heterozygous LSD1 (LSD1 +/-) mice treated with vehicle (-) or CL316,243 (+). β-Actin was used as a loading control. b, Immunofluorescent staining of LSD1 (yellow arrows, left panel) and H&E staining (right panel) of ingWAT of Ctrl and LSD1 +/- mice treated with vehicle or CL316,243. Black arrows indicate beige fat islets. c, Relative transcript levels of the indicated genes in ingWAT of Ctrl and LSD1 +/- mice treated with vehicle or CL316,243. d, Relative body weight of Ctrl and LSD1 +/- mice fed a HFD. e, Western blot analysis showing LSD1 and Ucp1 in ingWAT of Ctrl and LSD1 +/- mice fed a HFD. β-Tubulin was used as a loading control. f, H&E staining of ingWAT of Ctrl and LSD1 +/- mice fed a HFD. g, h, Intraperitoneal insulin sensitive test (g, IPIST), and intraperitoneal glucose tolerance test (h, IPGTT) of Ctrl and LSD1 +/- mice fed a HFD. Standard deviation represents + SEM (n=6 mice), *: p<0.05. -
Figure 4 . LSD1 promotes the formation of functional beige adipocytes in vitro. a, Relative transcript levels of the indicated oxidative and beige fat-selective markers in in vitro differentiated primary adipocytes isolated from stromal-vascular fraction of control (Ctrl) and LSD1 transgenic (Tg) mice. b, Relative transcript levels of the indicated oxidative and beige fat-selective markers in undifferentiated (day 0) and differentiated (day 7) control (Ctrl) and LSD1 overexpressing (Tg) 3T3-L1 cells. c, Mitochondrial activity in 3T3-L1(Ctrl) and 3T3-L1(Tg) cells atday 7 reflected by red fluorescent JC-1 aggregates (FL-2). Black curves represent the background staining (CCCP). Numbers in red show the percentage of cells with increased mitochondrial activity. Standard deviation represents + SEM (n=6), * p<0.05, ***p<0.001. -
Figure 5 . LSD1 positively regulates multiple metabolic pathways to promote beige fat formation. a, b, Pie charts displaying genomic distribution of LSD1 peaks in (a) control (Ctrl) and (b) LSD1 overexpressing (Tg) 3T3-L1 cells determined by ChIP-seq analysis. c, d, Venn diagram showing the number of genes with LSD1 peaks at promoters in (c) 3T3-L1 (Ctrl) cells atdays day 7 and 3T3-L1(Tg) cells atday 0 of differentiation. e, f, Venn diagram showing the number of genes with LSD1 peaks at promoters and differentially regulated genes deduced from RNA-seq data in 3T3-L1 (Ctrl) and 3T3-L1(Tg) cells at (e)day 0 and (f)day 7 of differentiation. -
Figure 6 . LSD1 controls beige fat formation through Nrf1, C/ebpβ and Ppary/Rxrα. a, HOMER motif analyses of LSD1 ChIP-seq data unravel Nrf1, C/ebpβ, Ppary, and Rxr binding sites among the top scoring motifs. ND: motif not determined by HOMER. b, Pie charts displaying genomic distribution of Nrf1 peaks in 3T3-L1 cells atdays days days days -
Figure 7 . Expression of LSD1 in transgenic mice promotes the formation of functional beige fat in white adipose tissue, a, Schematic representation of the Rosa26-LSD1 transgene. Arrows indicate the location of primers used to characterize the LSD1 allele. b, QRT-PCR analyses of total LSD1 (human and mouse) levels in interscapular brown adipose tissue (BAT), epididymal (epWAT), inguinal (ingWAT), perimuscular (pmWAT), and retroperitoneal (rpWAT) white adipose tissue of control (Ctrl) and transgenic (Tg) mice. c, Western blot analyses of Ear2 and Fabp4 in the indicated adipose tissues of Ctrl and Tg mice. Flag antibody was used to detect expression of the LSD1 transgene. β-Actin served as a loading control. d, Immunofluorescence analysis of LSD1 (yellow) in the indicated adipose tissues of Ctrl and Tg mice. Rabbit IgG was used as a negative control. e, Immunofluorescence analysis of Prdm16 and Ucp1 (yellow arrows) in ingWAT and of Myf5 in ingWAT and BAT of Ctrl and Tg mice. Rabbit IgG was used as a negative control. n=10 mice. Standard deviation represents + SEM, *p<0.05. -
Figure 8 . Expression of LSD1 in transgenic mice promotes oxidative capacities in white adipose tissue. Relative transcript levels of oxidative markers in the indicated adipose tissues of control (Ctrl), transgenic (Tg), and transgenic mice expressing enzymatic inactive LSD1 (TgMut). BAT of Ctrl mice was used as a control. n=10 mice. Standard deviation represents + SEM, *p<0.05 between Ctrl and Tg WAT. -
Figure 9 . Expression of LSD1 in transgenic mice does not promote oxidative capacities in brown adipose tissue, skeletal muscle, and liver. Relative transcript levels of oxidative markers in the indicated tissues of control (Ctrl) and transgenic (Tg) mice. n=10 mice. Standard deviation represents + SEM. ND: Not detected. -
Figure 10 . Expression of enzymatic inactive LSD1 in transgenic mice does not promote the formation of functional beige fat in white adipose tissue. a, Schematic representation of the Rosa26-LSD1Mut transgene. Arrows indicate the location of primers used to characterize the LSD1Mut allele. b, Macroscopic view of epididymal fat and haematoxylin and eosin staining (H&E) of BAT, epWAT, ingWAT, pmWAT, and rpWAT of Ctrl and TgMut mice. c, Western blot analyses of LSD1, Prdm16, Ucp1, Klhl13, Ear2, and Fabp4 in the indicated adipose tissues of Ctrl and TgMut mice. Flag antibody was used to detect expression of the LSD1Mut transgene. β-Tubulin served as a loading control. -
Figure 11 . Expression of LSD1 in transgenic mice promotes beige fat-selective markers in white adipose tissue. Relative transcript levels of beige fat-selective markers in the indicated adipose tissues of Ctrl, Tg, and TgMut mice. n=10 mice. Standard deviation represents + SEM, *p<0.05 between Ctrl and Tg WAT. -
Figure 12 . Expression of LSD1 in transgenic mice does not foster the beige fat-selective gene programme in brown adipose tissue, skeletal muscle, and liver. Relative transcript levels of beige fat-selective markers in the indicated tissues of Ctrl and Tg mice. n=10 mice. Standard deviation represents + SEM. ND: Not detected. -
Figure 13 . Expression of LSD1 in transgenic mice does not promote brown fat-selective markers in white adipose tissue. Relative transcript levels of brown fat-selective markers in the indicated adipose tissues of Ctrl, Tg, and TgMut mice. BAT of Ctrl mice was used as a control. n=10 mice. Standard deviation represents + SEM, *p<0.05 between Ctrl and Tg WAT. -
Figure 14 . Expression of LSD1 in transgenic mice does not alter white adipogenesis in white adipose tissue. a,b, Relative transcript levels of adipogenic (a), and white fat-selective (b) markers in the indicated adipose tissues of Ctrl, Tg, and TgMut mice. BAT of Ctrl mice was used as a control for adipogenic markers. n=10 mice. Standard deviation represents + SEM. -
Figure 15 . Expression of LSD1 in transgenic mice promotes mitochondrial biogenesis in white adipose tissue. a, Distribution of mitochondria size determined from ultrastructure analysis. b, Ratio of mitochondrial to nuclear DNA content assessed by quantitative PCR of the mitochondrial-encoded Cox2 and the nuclear-encoded Fasn gene in the indicated adipose tissues of Ctrl and Tg mice. c, Determination of Sdh (mitochondrial respiratory chain complex II) and Cox (mitochondrial respiratory chain complex IV) activities in rpWAT of Ctrl and Tg mice. BAT of Ctrl mice was used as a positive control. n=5 mice. Standard deviation represents + SEM, *p<0.05. -
Figure 16 . LSD1 Tg mice display limited weight gain in response to a high-fat diet. a, Body weight of Ctrl and Tg mice fed a regular diet (RD). b, Weight of the indicated tissues of Ctrl and Tg mice fed a RD. c, Food consumption of Ctrl and Tg mice fed a RD. d, Body weight of Ctrl and Tg mice fed a high-fat diet (HFD). e, Fat, lean, and free body fluid (FBF) content of Ctrl and Tg mice fed a HFD. f, Weight of the indicated tissues of Ctrl and Tg mice fed a HFD. g, H&E staining of indicated adipose tissues of Ctrl and Tg mice fed a HFD. h, Western blot analyses of LSD1, Ucp1, and Fabp4 in the indicated adipose tissues of Ctrl and Tg mice fed a RD or HFD. β-Tubulin was used as a loading control. n=10 mice. Standard deviation represents + SEM, *p<0.05. -
Figure 17 . LSD1 Tg mice are more resistant to high-fat diet-induced obesity and type-2 diabetes. a-h, (a) Food consumption, (b) spontaneous activity, (c) VO2, (d) VCO2, (e) respiratory quotient (RQ), (f) heat production, (g) serum glucose, triglyceride, free fatty acid (FFA), and cholesterol (Total: total cholesterol, HDL: high density lipoprotein, and LDL: low density lipoprotein) levels of Ctrl and Tg mice fed a HFD. h,i, Intraperitoneal glucose tolerance test (h, IPGTT), and intraperitoneal insulin sensitive test (i, IPIST) of Ctrl and Tg mice fed a HFD. j, Serum glucose, triglyceride, free fatty acid (FFA), and cholesterol (Total: total cholesterol, HDL: high density lipoprotein, and LDL: low density lipoprotein) levels of Ctrl and Tg mice fed a RD. k,l, (k) IPGTT and (l) IPIST of Ctrl and Tg mice fed a RD. n=10 mice. Standard deviation represents + SEM, *p<0.05. -
Figure 18 . LSD1 is induced in white fat pads after cold exposure or β3-adrenergic treatment of mice. a,b, H&E staining of indicated adipose tissues of mice (a) maintained at either 24 or 10 °C, or (b) treated with vehicle or the β3-adrenergic agonist CL316,243. Black arrows show beige fat islets. c, Western blot analysis of LSD1 and Ucp1 in the indicated tissues of mice maintained at 24 or 10 °C. Indicated LSD1 levels were normalized to β-Tubulin. -
Figure 19 . Fat-specific deletion of LSD1 impairs WAT adipogenesis. a, Immunofluorescence analysis of LSD1 (red) in interscapular brown adipose tissue (BAT) of control (Ctrl) and LSD1 aP2-Cre mice. Nuclei were counterstained with DAPI. b-d, Macroscopic view of (b) epWAT and (c) BAT of Ctrl and LSD1 aP2-Cre mice. Fat depots are indicated by arrow heads (d) H&E staining of BAT of Ctrl and LSD1 aP2-Cre mice. e, Microscopic view of stromal vascular fraction of fat from Ctrl and LSD1 mice treated for five days with tamoxifen and differentiated into adipocytes. Magnification: 200 x. f, Relative transcript levels of LSD1 and the indicated adipogenic and white fat-selective markers in differentiated Ctrl and LSD1-/- primary adipocytes. a-d, n=6; e,f, n=5. Standard deviation represents + SEM, **p<0.01. -
Figure 20 . β3-adrenergic signalling is impaired in LSD1+/- mice. a, Schematic representation of the Rosa26-Cre transgene and the floxed L2 LSD1 allele. Arrows indicate the locations of primers used to characterize the different alleles. Yellow flags show LoxP sites. b, Relative LSD1 transcript levels in the indicated adipose tissues of control (Ctrl) and heterozygous LSD1 (LSD1 +/-) mice treated with vehicle or CL316,243. c, H&E staining of indicated adipose tissues of Ctrl and LSD1 +1- mice treated with vehicle or CL316,243. Black arrows indicate beige fat islets. b and c, n=5 mice. Standard deviation represents + SEM, *p<0.05. -
Figure 21 . β3-adrenergic signalling promotes the beige fat programme through LSD1. Relative transcript levels of (a) oxidative, (b) adipogenic, (c) white, and (d) beige fat-selective markers in the indicated adipose tissues of Ctrl and LSD1 +/- mice treated with vehicle or CL316,243. n=10 mice. Standard deviation represents + SEM, *p<0.05. -
Figure 22 . LSD1 +/- mice are prone to obesity due to decreased oxidative capacities in adipose tissue. a-e, (a) Food consumption, (b) fat, lean, and FBF content, (c) H&E staining of indicated adipose tissues, (d) histochemical staining of NADH dehydrogenase activity in gastrocnemius muscle, (e) spontaneous activity of Ctrl and LSD1 +/- mice fed a HFD. n=6 mice. Standard deviation represents + SEM, *p<0.05. -
Figure 23 . LSD1 +/- mice are prone to obesity and type-2 diabetes. a-e, (a) VO2, (b) VCO2, (c) respiratory quotient (RQ), (d) heat production, (e) serum glucose, triglyceride, levels, free fatty acid (FFA), and cholesterol (Total: total cholesterol, HDL: high density lipoprotein, and LDL: low density lipoprotein) levels of Ctrl and LSD1 +/- mice fed a HFD. f,g, (f) IPIST and (g) IPGTT of Ctrl and LSD1 +/- mice fed a RD. h, Serum glucose, triglyceride, levels, FFA, and cholesterol levels of Ctrl and LSD1 +/- mice fed a RD. n=6 mice. Standard deviation represents + SEM, *p<0.05. -
Figure 24 . LSD1 is essential to maintain oxidative capacities of adipocytes. a, Microscopic view of primary adipocytes isolated from the stromal vascular fraction of fat from Ctrl and LSD1 +/- mice and differentiated in vitro. Magnification: 200 x. b, Relative transcript levels of the indicated adipogenic, white fat-selective, and oxidative markers in differentiated Ctrl and LSD1 +/- primary adipocytes. c, Preadipocytes isolated from the stromal vascular fraction from Ctrl and Tg LSD1 mice were differentiated in vitro. Relative transcript levels of the indicated adipogenic, white, and brown fat-selective markers in differentiated Ctrl and Tg primary adipocytes. Standard deviation represents + SEM (n=5), *p<0.05, **p<0.01, ***p<0.001. -
Figure 25 . LSD1 promotes the formation of functional beige adipocytes in vitro. a, Western blot analysis of LSD1 in undifferentiated (day 0) and differentiated (day 7) control (Ctrl) 3T3-L1 and LSD1 overexpressing (Tg) cells. Flag antibody was used to detect expression of the transgene. β-Actin served as a loading control. b, Relative transcript levels of LSD1, oxidative, and beige fat-selective markers in differentiated C3H-10T1/2 control (Ctrl), LSD1 (Tg), or inactive LSD1 (TgMut) overexpressing cells. c, Relative transcript levels of oxidative markers in 3T3-L1(Ctrl) and 3T3-L1(Tg) cells atdays days -
Figure 26 . LSD1 promotes mitochondrial biogenesis and function. a,b, (a) Relative mitochondrial activity determined by red fluorescence intensity of JC-1 aggregates (FL-2) and (b) relative mitochondrial mass determined by green fluorescence intensity of JC-1 aggregates (FL-1) in 3T3-L1(Ctrl) and 3T3-L1(Tg) cells atday 7 of differentiation. Samples treated with the mitochondrial membrane potential disrupter CCCP represent background staining. c, Ratio of mitochondrial activity (FL-2) relative to mitochondrial mass (FL-1) in 3T3-L1(Ctrl) and 3T3-L1(Tg) cells atday 7 of differentiation. Standard deviation represents + SEM (n=6), ***p<0.001. -
Figure 27 . LSD1 does not promote transdifferentiation of white adipocytes. Relative transcript levels of (a) LSD1 and oxidative, (b) adipogenic, (c) white fat-selective, and (d) beige fat-selective markers in 3T3-L1 cells infected with either control virus (Ctrl) or virus expressing LSD1 upon doxycyclin (dox) treatment (LSD1ind). Time points of dox treatment are indicated by +. Standard deviation represents + SEM (n=6), **p<0.01, ***p<0.001. -
Figure 28 . LSD1 promotes oxidative metabolic pathways. a,b, Venn diagram depicting the number of genes with LSD1 peaks at promoters in 3T3-L1(Ctrl) and 3T3-L1(Tg) cells at (a)day 0 and (b)day 7 of differentiation. c-e, Enriched pathways obtained from GOterm analyses for the indicated sets of genes. f, Venn diagram depicting the number of genes with LSD1 peaks at promoters in 3T3-L1(Ctrl) and 3T3-L1(Tg) cells atdays day 7 of differentiation, g, Enriched pathways obtained from a GOterm analysis for the indicated sets of genes. -
Figure 29 . LSD1 promotes mitochondrial functions. a, Localization of LSD1 at promoters of Cpt1 and Cpt2 in 3T3-L1(Ctrl) and 3T3-L1(Tg) cells atday 0. Differential expression of the indicated genes between 3T3-L1(Tg) and 3T3-L1(Ctrl) cells atdays days days -
Figure 30 . LSD1 fosters oxidative metabolism. a, Modified "energy metabolism pathway" from Hood et al64. b, Localization of LSD1 at promoters of Acaca, Pgc-1α, Pgc-1β, Nrf1, and Tfam in 3T3-L1(Ctrl) and 3T3-L1(Tg) cells atday 0. Differential expression of the indicated genes between 3T3-L1(Tg) and 3T3-L1(Ctrl) cells atdays -
Figure 31 . LSD1 induces expression of Nrf1, Tfam, and Ucp. a, (left panel) Relative transcript levels of Nrf1 in 3T3-L1(Ctrl) and 3T3-L1(Tg) cells atdays days day 0, and differential expression of the Ucp genes between 3T3-L1(Tg) and 3T3-L1(Ctrl) cells atdays -
Figure 32 . LSD1 and Nrf1 control the OXPHOS gene programme. Overlap of LSD1 and Nrf1 peaks at promoters of representative mitochondrial electron transport chain (complex I-V) genes in 3T3-L1 cells at indicated time points of differentiation, and differential expression of the representatives between 3T3-L1(Tg) and 3T3-L1(Ctrl) cells atdays -
Figure 33 . Tissue-specific action of LSD1. a,b, Relative transcript levels of the indicated genes in (a) quadriceps muscle and (b) liver of Ctrl and Tg mice. n=10 mice. Standard deviation represents + SEM, *p<0.05. -
Figure 34 . LSD1 and Nrf1 control the OXPHOS gene programme. Relative transcript levels of the indicated genes in 3T3-L1(Tg) cells atdays -
Figure 35 . Genome-wide binding pattern of LSD1 and C/ebpβ. a, Venn diagram showing the number of genes occupied by LSD1 or C/ebpβ in 3T3-L1(Ctrl) cells atday 0. b, Enriched pathways identified by a GOterm analysis of the common target genes atday 3 of differentiation c, LSD1 occupancy of the indicated C/ebp promoters in 3T3-L1(Ctrl) and 3T3-L1(Tg) cells atday 0 of differentiation, and differential expression of the indicated C/ebp genes between 3T3-L1(Tg) and 3T3-L1(Ctrl) cells atdays -
Figure 36 . LSD1 controls beige adipogenesis via C/ebpβ. Relative transcript levels of the indicated genes in 3T3-L1(Tg) cells atdays -
Figure 37 . a, Genome-wide binding pattern of LSD1, Pparγ, and Rxrα. Venn diagram showing the number of genes occupied by LSD1, Pparγ, and Rxrα in 3T3-L1 cells atday 0. b, Enriched pathways identified by a GOterm analysis of the common target genes in 3T3-L1 cells atday 7 of differentiation. c, Overlap of LSD1, Pparγ, and Rxrα peaks at promoters of representative genes of fatty acid β-oxidation at indicated days of differentiation in 3T3-L1 cells, and differential expression of representative between 3T3-L1(Tg) and 3T3-L1(Ctrl) cells atdays -
Figure 38 . Control of gene expression by LSD1. a, LSD1 occupancy of Ppary and Rxrα promoters in 3T3-L1(Ctrl) and 3T3-L1(Tg) cells atdays -
Figure 39 . LSD1 controls beige adipogenesis. LSD1 levels are regulated by environmental cues. LSD1 levels are increased by cold exposure or β3-adrenergic stimulation and decreased on a HFD. During early phase of differentiation, LSD1 controls adipogenesis via cooperation with C/ebpβ. C/ebpβ in concert with Prdm16 induces the beige fat programme. In cooperation with Nrf1 and Pgc-1α, LSD1 promotes mitochondrial biogenesis and OXPHOS. LSD1 reinforces adipogenesis via Pparγ/Rxrα/Pgc-1α by positively regulating metabolism (glycolysis, TCA cycle, and β-oxidation). -
Figure 40 . LSD1 occupancy of the indicated promoters of beige adipogenesis inducers in 3T3-L1(Ctrl) and 3T3-L1(Tg) cells atdays days - To investigate physiological functions of LSD1 in vivo, we analysed transgenic (Tg) mice ubiquitously expressing human LSD1 under the control of the Rosa26 promoter (
Fig. 7a ). Macroscopic inspection revealed intense browning of white fat pads of Tg mice (Fig. 1a ). Detailed histological analyses showed the presence of multilocular brown or beige fat islets in all types of WAT [i.e. epididymal (ep), inguinal (ing), perimuscular (pm), and retroperitoneal (rp) WAT], whereas the morphology of interscapular BAT was not altered (Fig. 1a ). Western blot, qRT-PCR, and immunofluorescence analyses confirmed elevated LSD1 levels in WAT and BAT of Tg compared to control mice (Fig. 1b , andFig. 7b-d ). - Consistent with the appearance of brown or beige adipocytes in WAT of Tg mice, analyses of transcript and protein levels revealed significantly increased expression of Prdm16, Pgc-1α, Ucp1, and several genes involved in oxidative metabolism (
Fig. 1b,c , andFigs. 7e , and8 ). Of note, elevated amounts of LSD1 did not result in altered transcript levels of Prdm16, Pgc-1α, Ucp1, and oxidative markers in BAT and the metabolically active tissues muscle and liver, thus uncovering selective action of LSD1 in WAT (Fig. 9 ). Importantly, Tg mice expressing a catalytic inactive mutant of LSD1 (TgMut,Fig. 10a )36 show normal appearance of WAT, no signs of browning and unaltered expression of Prdm16, Pgc-1α, Ucp1, and oxidative markers (Fig. 1c , andFigs. 8 and10b,c ), demonstrating that the demethylase activity is essential for the LSD1-induced phenotype. - Next, we screened WAT of Tg mice for the presence of Myf5, a marker of brown adipocyte precursors20. Since we did not observe Myf5-positive preadipocytes (
Fig. 7e ), we hypothesised that the islets emerged from a non-Myf5 lineage and thus might represent beige fat cells. Consequently, we compared the expression pattern of beige, brown, and white fat-selective marker genes in Tg and control mice. The expression of beige fat-selective markers was significantly upregulated in white fat pads of Tg mice (Fig. 1b,d , andFigs. 7c and11 ), whereas no alterations in the metabolically active tissues BAT, muscle, and liver (Fig. 12 ), or in WAT of TgMut mice (Fig. 1d , andFigs. 10c and11 ) were observed. Furthermore, the levels of brown fat-selective, adipogenic, and white fat-selective markers were not altered in WAT of Tg mice (Fig. 1d andFigs. 6c ,13 , and14 ). Thus, the gene expression profile identifies the LSD1-induced adipocytes as beige fat cells. - Ultrastructure analyses revealed an increased number of hypotrophic lipid droplets (
Fig. 1e ), as well as dramatically elevated mitochondria size and number (Fig. 1e,f , andFig. 15a ) in beige adipocytes of Tg mice. These findings were corroborated by an increased ratio between mitochondrial cytochrome C oxidase 2 (Cox2) DNA and nuclear fatty acid synthase (Fasn) DNA (Fig. 15b ). In addition, determination of the activities of succinate dehydrogenase (Sdh, mitochondria complex II) and Cox (mitochondria complex IV), two key enzymes of oxidative phosphorylation (OXPHOS), revealed a significantly increased mitochondrial oxidative capacity in WAT of Tg mice (Fig. 1g andFig. 15c ). Together, our observations demonstrate that elevated expression of enzymatically active LSD1 results in the formation of thermogenically active beige fat islets in WAT. - To investigate whether the presence of beige fat has physiological consequences, we subjected Tg mice on regular diet (RD) or high-fat diet (HFD) to metabolic analyses. On RD, Tg mice and their control littermates did not display any notable differences in total body weight or in the weight of specific tissues and had a similar food intake (
Fig. 16a-c ). In contrast, during HFD feeding Tg mice gained significantly less weight (∼20 %) than their control littermates (Fig. 16d ). Body composition analyses assessed by quantitative Nuclear Magnetic Resonance Spectroscopy (qNMR) after 15 weeks of HFD showed that Tg animals had accumulated less fat, resulting in a higher lean/fat mass ratio compared to control mice (Fig. 16e ). These data were corroborated by a decreased epWAT mass (Fig. 16f ). In accordance, histological analyses revealed adipocyte hypotrophy as well as the presence of beige fat cells and increased Ucp1 levels in Tg mice (Fig. 16g,h ). The limited weight gain of Tg mice was not associated with decreased food intake (Fig. 17a ) or altered physical activity (Fig. 17b ). However, we observed higher energy expenditure (determined by oxygen consumption, VO2) in Tg mice (Fig. 17c ). CO2 production (VCO2) was not altered, resulting in a decreased respiratory quotient (RQ, VCO2/VO2 ratio), demonstrating a shift in fuel consumption from carbohydrate to fatty acid usage (Fig. 17d,e ). Calorimetric parameters deduced from these analyses indicated that heat production was increased in Tg mice fed a HFD (Fig. 17f ). Taken together, these data show that Tg mice are less susceptible to obesity on HFD due to increased energy expenditure. - Diet-induced obesity is frequently associated with glucose intolerance and progressive metabolic dysfunction37. Notably, Tg mice on HFD displayed decreased blood glucose levels (
Fig. 17g ), associated with improved glucose tolerance relative to control mice (Fig. 17h ). Tg mice were also more insulin sensitive, as determined by insulin sensitive test (Fig. 17i ), showing that Tg mice are more resistant to HFD-induced type-2 diabetes. These effects were not observed in cohorts on RD (Fig. 17j-l ). The blood content in triglycerides, free fatty acids (FFA), and cholesterol was not altered in both RD- and HFD-fed animals (Fig. 17g,j ). In summary, these observations demonstrate that increased LSD1 levels results in raised energy expenditure, which counteracts HFD-induced obesity and type-2 diabetes associated dysfunction. - Interestingly, LSD1 protein levels decreased upon HFD in control mice (
Fig. 2a ), suggesting the existence of regulatory mechanisms controlling physiological amounts of LSD1. Thus, we asked whether other extracellular cues might affect LSD1 levels in wild-type mice. Since cold exposure or treatment of mice with the β3-adrenergic agonist CL316,243 have previously been shown to promote beige fat formation in WAT19,20,32, we analysed whether protein levels of LSD1 in WAT of mice respond to these stimuli. In both experimental settings, we observed the appearance of multilocular beige adipocytes together with increased LSD1 protein levels in WAT (Fig. 2b-e andFig. 18a-c ), which was not observed in the other metabolically active tissues BAT, muscle, and liver (Fig. 18c ). These in vivo data reveal an increase in the amount of LSD1 in WAT as physiological response to environmental challenges such as cold stress or β3-adrenergic stimulation. - Our results suggest that elevated levels of LSD1 initiate a transcriptional cascade that induces the formation of functional beige adipocytes in WAT, which implies that β3-adrenergic signalling should not efficiently induce beige fat islets in mice lacking or expressing reduced levels of endogenous LSD1. Since ubiquitous LSD1-deficient mice die before day E7.5 of embryonic development3-6, we engineered a conditional LSD1 allele by flanking
exon 1 with loxP sites and deleted LSD1 by crossing mice harbouring the conditional allele to the well-described aP2-Cre deleter strain38, which mediates Cre recombination specifically in WAT and BAT (LSD1aP2-Cre ,Fig. 19a ). Of importance for this study, Cre activity is not restricted to mature adipocytes, but has been observed in white and brown adipocyte precursors39. LSD1 aP2-Cre mice show a complete absence of white fat pads (Fig. 19b ), while BAT is developed, but displays low lipid accumulation (Fig. 19c,d ). To demonstrate that the absence of WAT in LSD1aP2-Cre mice is due to cell autonomy of LSD1, we crossed mice harbouring the conditional LSD1 allele to the Rosa26-CreERT deleter strain40, which allows tamoxifen (Tx)-inducible Cre recombination (LSD1 Rosa26-CreERT ). Adipocyte precursors of the stromal-vascular fraction (SVF) from control and LSD1 Rosa26-CreERT mice were isolated, treated with Tx for 5 days, and then induced to undergo adipogenesis. As shown inFig. 19e,f , LSD1-deficient cells of the SVF neither expressed markers of mature adipocytes nor accumulated lipid droplets, which is accordance with the absence of WAT in LSD1aP2-Cre mice. While the phenotype of these mice requires more detailed future analyses, a likely explanation for the complete absence of WAT in LSD1 aP2-Cre mice is an essential role of LSD1 in adipocyte differentiation. Together, our data provide in vivo evidence for an essential and cell autonomous function of LSD1 in the control of white adipogenesis. - However, neither ubiquitous nor adipose-specific LSD1 knockout mice were suitable models to validate our hypothesis that β3-adrenergic signalling should not efficiently induce beige fat islets in mice having reduced levels of LSD1. Therefore, we chose heterozygous mice (LSD1 +/-) (
Fig. 20a ), in which LSD1 mRNA and protein levels are significantly reduced in WAT and BAT (Fig. 3a-c andFig. 20b ). Compared to control mice, no apparent difference is observed in the morphology of white fat pads of LSD1 +/- mice (Fig. 3b andFig. 20c ). Transcript levels of the oxidative markers Cidea, Prdm16, Pgc-1α, and Ucp1 are significantly reduced in fat pads of LSD1 +/- mice (Fig. 3c andFig. 21a ), whereas adipogenic and white fat-selective markers are not affected (Fig. 21b,c ). - Importantly, treatment of LSD1 +/- mice with the β3-selective adrenergic agonist CL316,243 results in fewer clusters of beige fat cells in WAT compared to control mice (
Fig. 3b andFig. 20c ). Accordingly, qRT-PCR analyses show that treatment of control mice with CL316,243 significantly increases expression of Cidea, Prdm16, Pgc-1α, and Ucp1 as well as that of beige fat-selective markers in WAT, whereas adrenergic induction is impaired in LSD1 +/- mice (Fig. 3c andFig. 21a,d ). In comparison, expression of white fat-selective and adipogenic markers is not significantly affected (Fig. 21b,c ). These in vivo results demonstrate that reduction of LSD1 strongly impedes the efficient induction of the beige fat programme by β3-adrenergic signalling, thus establishing LSD1 as an important mediator of this pathway. - Our data led us to the question whether LSD1 +/- mice possess decreased metabolic activities compared to control mice and are prone to obesity and type-2 diabetes when challenged with HFD. Upon HFD, LSD1 +/- mice gained substantially more weight than their age-matched control littermates (
Fig. 3d ) despite similar food intake (Fig. 22a ). Consistent with the reduced LSD1 protein levels, Ucp1 protein levels were decreased in LSD1 +/- mice (Fig. 3e ). qNMR analyses revealed that the body fat content was 16 % higher in LSD1 +/- mice than in control littermates (Fig. 22b ). In agreement with these results, histological analyses revealed adipocyte hypertrophy (Fig. 3f andFig. 22c ). Increased body fat mass was neither due to altered muscle oxidative capacities as shown by assaying NADH dehydrogenase activity in gastrocnemius muscle nor to decreased mobility (Fig. 22d,e ). Energy expenditure assessed by oxygen consumption (VO2) (Fig. 23a ) as well as CO2 production (VCO2) (Fig. 23b ) was decreased in LSD1 +/- mice leading to a higher respiratory quotient (RQ) (Fig. 23c ). This reveals a shift in fuel consumption from fatty acid to carbohydrate usage. Calorimetric parameters deduced from these analyses indicated that heat production was lower in LSD1 +/- mice fed a HFD (Fig. 23d ). Blood glucose, triglyceride, and free fatty acid (FFA) levels were higher in LSD1 +/- than in control mice upon HFD, whereas cholesterol levels were similar (Fig. 23e ). Importantly, insulin sensitivity and glucose uptake were significantly reduced in LSD1 +/- mice (Fig. 3g,h ), indicating that LSD1 +/- mice are prone to type-2 diabetes. Of note, we did not observe such alterations in mice fed a RD (Fig. 23f-h ). In summary, the in vivo analyses of LSD1 +/- mice demonstrate that decreased LSD1 levels lead to altered metabolic capacities resulting in increased susceptibility to obesity and type-2 diabetes. - To determine whether decreased oxidative capacities observed in WAT of LSD1 +/- mice are due to cell-autonomous dysfunctions of the fat tissue, we analysed adipocyte precursors from the SVF of LSD1 +/- and control mice. Upon differentiation, primary adipocytes from LSD1 +/- mice carried increased lipid content compared to control (
Fig. 24a ). In accordance with this observation, LSD1 +/- adipocytes expressed increased levels ot general adipogenic and white tat-selective markers (Fig. 24b ) and expression of genes involved in thermogenesis, including Prdm16 and Ucp1 was reduced in LSD1 +/- adipocytes (Fig. 24b ). - Similarly, to investigate cell autonomy of beige fat formation in Tg mice, adipocyte precursors from the SVF of Tg and control mice were induced to undergo adipogenesis. Tg and control adipocyte cultures expressed equivalent levels of general adipogenic, white fat-selective, and brown fat-selective markers (
Fig. 24c ). In contrast, elevated levels of LSD1 in primary Tg adipocyte induced expression of genes involved in oxidative metabolism, including Prdm16, Pgc-1α, and Ucp1, and beige fat-selective markers (Fig. 4a ). Taken together, these data demonstrate that LSD1 regulates oxidative capacities of adipocytes and beige adipogenesis in a cell-autonomous manner. - To establish a cell culture model for mechanistic studies, we transduced C3H-10T1/2 mouse mesenchymal cells and 3T3-L1 preadipocytes with lentivirus driving constitutive expression of LSD1 (Tg), LSD1 inactive mutant (TgMut), or empty control virus (Ctrl) (
Fig. 25a,b ). Expression levels of genes involved in oxidative metabolism such as Prdm16, Pgc-1α, and Ucp1 and of beige fat-selective markers were increased upon differentiation of 3T3-L1(Tg) and C3H-10T1/2(Tg) compared to Ctrl cells (Fig. 4b andFig. 25b,c ). Vice versa, both Tg cell lines showed slightly decreased transcript levels of white adipocyte-selective markers and similar transcript levels of general adipogenic markers (Fig. 25d,e ). In agreement with the in vivo data, oxidative and beige fat-selective markers were not altered in C3H-10T1/2(TgMut)-derived adipocytes expressing the catalytically inactive LSD1 mutant (Fig. 25b ). - Analysis of the oxidative capacities of differentiated 3T3-L1(Tg) and 3T3-L1(Ctrl) cells by staining with the fluorescent dye JC-1 revealed that 3T3-L1(Tg) cells exhibit a significantly increased respiratory activity indicated by red fluorescence (
Fig. 4c andFig. 26a ). More intense green fluorescence revealed an augmentation in mitochondrial mass (Fig. 26b ). The increased ratio between red and green fluorescence (FL-2/FL-1) in adipocytes derived from 3T3-L1(Tg) cells demonstrated an enhanced mitochondrial activity (Fig. 26c ). Thus, consistent with our observations in mice and primary adipocytes from the SVF, increased LSD1 expression suffices to induce the beige fat programme in vitro. Consequently, we used 3T3-L1 and C3H-10T1/2 cells for further mechanistic studies. - To determine whether LSD1 promotes the beige fat programme via commitment of white adipocyte precursors or transdifferentiation of mature adipocytes, we transduced 3T3-L1 cells with lentivirus driving doxycyclin-inducible expression of LSD1 (LSD1ind). LSD1 expression was induced at
days Fig. 27a ), transcript levels of oxidative markers such as Prdm16, Pgc-1α, and Ucp1, adipogenic, white fat-selective, and beige fat-selective markers (Fig. 27 ) were not affected by LSD1 induction. These data show that LSD1 does not induce the beige fat programme once adipogenesis has been initiated. Thus, LSD1 appears to act at an early time point by triggering the commitment of adipocyte precursors towards the beige lineage. - Beige adipogenesis requires induction of adipogenic factors and activation of specific gene sets facilitating thermogenesis and energy consumption. To identify LSD1 direct target genes that mediate induction of the beige fat programme and account for beige adipocyte metabolism, we combined chromatin immunoprecipitation followed by massive parallel sequencing (ChlP-seq) and global transcriptome analysis (RNA-seq) of 3T3-L1(Tg) and 3T3-L1(Ctrl) cells at
days - In ChlP-seq analyses, 3024 high-confidence LSD1 peaks [false discovery rate (FDR) less than 1 %] were identified at
day 0 in 3T3-L1(Ctrl) cells, with the majority (87 %) located at the promoter (defined as ± 2000 bp around the transcription start site) of 2607 genes (Fig. 5a andFig. 28a ). Atday 7, we identified 8303 LSD1 peaks, of which 85 % are located at the promoter of 6904 genes (Fig. 5a andFig. 28b ). In 3T3-L1(Tg) cells, the number of LSD1 peaks atday 0 reached 13997, with 60 % located at the promoter of 8145 genes (Fig. 5b andFig. 28a ), while atday Fig. 5b andFig. 28b ). - The comparison of genes with LSD1 promoter occupancy in 3T3L1(Ctrl) cells showed that the vast majority [2233 out of 2607 (86 %)] of genes bound at
day 0 is still occupied at day 7 (Fig. 5c ). On the other hand, 4671 out of 6904 genes (68 %) are associated with LSD1 atday 7 only. Importantly, the comparison with 3T3-L1(Tg) cells revealed that most of the genes occupied in 3T3-L1(Ctrl) cells atday 7 are already associated with LSD1 in 3T3-L1(Tg) cells at day 0 [5689 out of 6904 genes (82 %)] (Fig. 5d ). Thus, promoter occupancy by LSD1 in undifferentiated 3T3-L1(Tg) cells atday 0 resembles that in differentiated 3T3-L1(Ctrl) cells atday 7. - Next, we established differential gene expression patterns for 3T3-L1(Tg) and 3T3-L1(Ctrl) cells at
days day 0, our RNA-seq analyses revealed 1929 genes differentially expressed between 3T3-L1(Tg) and 3T3-L1(Ctrl) cells (Fig. 5e ) [p-value < 10-5 andlogarithm base 2 of fold change (FC) < 0.7 or > 1.4]. Out of these, 1068 genes were found in the intersection between differentially expressed and LSD1-occupied genes in 3T3-L1(Tg) cells at day 0 (Fig. 5e ). Pathway analyses for the 1929 differentially expressed and the 1068 genes in the intersection revealed "adipogenesis" as significantly enriched cluster (Fig. 28c ). While 3T3-L1(Tg) cells might be committed to become beige adipocytes due to these differentially expressed genes, they are apparently not sufficient to induce adipocyte maturation, for which additional adipogenic stimuli are required. - At
day 7, the number of genes differentially expressed between 3T3-L1(Tg) and 3T3-L1(Ctrl) cells increases to 5765 (Fig. 5f ). In the intersection between these differentially expressed and LSD1-occupied genes in 3T3-L1(Tg) cells, 4091 genes were found. Importantly, pathway analyses for the 5765 differentially expressed and the 4091 intersection genes unravelled the major metabolic pathways "electron transport chain", "oxidative phosphorylation", "tricarboxylic acid (TCA) cycle", "glycolysis and gluconeogenesis", and "fatty acid beta oxidation" in addition to "adipogenesis" (Fig. 28d,e ). Furthermore, the intersection between LSD1 promoter occupancy in 3T3-L1(Ctrl) cells atday 7, 3T3-L1(Tg) cells atday 0, and differentially expressed genes atday 7 revealed that 2406 genes with premature promoter occupancy atday 0 are indeed deregulated in differentiated 3T3-L1(Tg) cells (Fig. 28f ). Pathway analyses confirmed that these genes account for metabolic properties of 3T3-L1(Tg) cells (Fig. 28g ). Together, we conclude that increased LSD1 levels result in premature chromatin occupancy, which upon adipogenic stimuli causes deregulated gene expression accounting for differentiation and metabolic properties of beige adipocytes. - A detailed inspection of the identified metabolic pathways uncovered that in 3T3-L1(Tg) cells LSD1 occupies and positively regulates the expression of most genes involved in oxidative phosphorylation (84/92 genes), TCA cycle (10/12 genes)41, fatty acid β-oxidation (3/4 rate limiting Cpt enzymes, and 22/35 genes of β-oxidation), and glycolysis (17/21 genes) (
Fig. 29a and Table 1). Consistently, expression of representatives of these pathways is increased in C3H-10T1/2(Tg) and 3T3-L1(Tg) cells and in beige fat of Tg mice in vivo (Figs. 8 ,25b ,c , and29b-d ). - Next, we asked whether known upstream regulators of the identified metabolic pathways are also targeted by LSD1. A central player in the initiation of signalling events is AMP kinase (Ampk, also referred to as Prka) (schematically depicted in
Fig. 30a ). Active Ampk phosphorylates Acaca, which in turn activates Cpt1, the rate-limiting enzyme of β-oxidation, and positively regulates Pgc-1α expression. Pgc-1α and Pgc-1β act as key regulators of oxidative metabolism, promoting β-oxidation, glycolysis, and TCA cycle. Pgc-1α also serves as a coactivator for Nrf1, a key player in the transcriptional control of nuclear genes required for respiration, mitochondrial DNA transcription and replication via Tfam. Importantly, in 3T3-L1(Tg) cells LSD1 is present at the promoter of ∼90 % of Ampk subunits (Table 1), as well as at the promoter of Acaca, Pgc-1α, Pgc-1β, Nrf1, and Tfam (Fig. 30b ). In all cases, our RNA-seq results and independent qRT-PCR analyses showed that expression of these genes is increased in 3T3-L1(Tg) compared to 3T3-L1(Ctrl) cells at day 7 (Fig. 4b andFigs. 25c ,30b , and31a,b,d ) as well as in beige fat of Tg mice (Figs. 1c ,4a andFigs. 8 ,31a,c,d ). Furthermore, LSD1 occupies and positively regulates the genes required for uncoupled respiration (Ucp2 and Ucp3) (Fig. 31e ), which contributes to increased heat production by mitochondria. Taken together, our ChlP-seq, RNA-seq, and qRT-PCR analyses demonstrate that increased LSD1 levels regulate gene programmes essential for mitochondrial biogenesis and metabolic pathways thereby accounting, at least in part for, the phenotype of 3T3-L1(Tg) cells in vitro and beige adipocytes of Tg mice in vivo.Table 1. Regulation of metabolic pathways by LSD1. Pathway, total number of genes encoding pathway proteins, promoter occupancy by LSD1 in 3T3-L1(Ctrl) and 3T3-L1(Tg) cells at day 0, and average logarithmic fold change (FC) of differential gene expression between 3T3-L1(Tg) and 3T3-L1(Ctrl) cells atday 7 of differentiation.Pathway Total genes Gene promoters occupied by LSD1 Average FC day 73T3-L1(ctrl) cells day 03T3-L1(Tg) cells day 0Ampk (Prka) sub-units 8 3 (37.5 %) 7 (87.5 %) 2.0 β-oxidation 35 7 (20.0 %) 22 (62.9 %) 2.7 Glycolysis 21 5 (23.8 %) 17 (81.0 %) 2.1 TCA cycle 12 2 (16.7 %) 10 (83.3 %) 2.6 Complex I 41 9 (22.0 %) 38 (92.7 %) 2.9 Complex II 4 1 (25.0 %) 3 (75.0 %) 2.9 Complex III 9 2 (22.2 %) 9 (100. %) 3.3 Complex IV 21 6 (28.6 %) 18 (85.7 %) 2.4 Complex V 17 3 (17.6 %) 16 (94.1 %) 2.4 OXPHOS (Complexes I-V) 92 21 (22.8 %) 84 (91.3 %) 2.7 - To identify transcription factors that cooperate with LSD1 in the control of beige adipogenesis and beige adipocyte metabolism, we performed HOMER motif searches42. These analyses revealed that in 3T3-L1(Ctrl) cells at
day 7 and in 3T3-L1(Tg) cells atdays Fig. 6a ). To investigate whether LSD1 and Nrf1 coordinately control gene expression, we first established by ChlP-seq the genome-wide binding pattern of Nrf1 in 3T3-L1 cells atdays day 0, we identified 2078 peaks (Fig. 6b ), with the majority (67 %) found at the promoter of 1383 genes (Fig. 6c ). Atday Fig. 6b ) with 91 % located at the promoter of 1485 genes (Fig. 6c ). 914 genes with Nrf1 peaks at the promoter were found in the intersection betweendays 0 and 7 (Fig. 6c ). Whereas only 427 out of 1383 (31 %) gene promoters bound by Nrf1 are cooccupied by LSD1 at day 0 (Fig. 6d ), the majority (1178 out of 1485, 79 %) is bound by LSD1 at day 7 (Fig. 6d ). The intersection of genes occupied by Nrf1 atdays day 7 revealed a robust overlap, i.e. 736 out of 914 (81 %) genes (Fig. 6e ). This finding suggests that LSD1 and Nrf1 coordinately control gene expression during 3T3-L1 cell differentiation. Pathway analyses for this common gene set (736 genes) revealed "electron transport chain" and "oxidative phosphorylation" among the top scoring clusters as exemplified by components of the mitochondrial electron transport chain (Fig. 32 ). Of note, we also identified the Nrf1 gene among the prominent LSD1 targets (Fig. 30b ). RNA-seq, qRT-PCR, and Western blot analyses showed increased Nrf1 transcript and protein levels in differentiated 3T3-L1(Tg) cells and beige fat of Tg mice (Figs. 31a-c ). In contrast, Nrf1 levels were not altered in skeletal muscle and liver of Tg mice (Fig. 33 ). Short interfering RNA (siRNA)-mediated knockdown of Nrf1 in 3T3-L1(Tg) cells significantly decreased expression of Prdm16, Pgc-1α, and Ucp1, as well as representative genes of the mitochondrial electron transport chain (Fig. 34 ). Together, these data suggest that LSD1 promotes mitochondrial respiratory properties of fat cells, at least in part, by induction of and in cooperation with Nrf1. - HOMER motif searches revealed a significant enrichment of C/ebpβ, Ppary, and Rxr binding sites for 3T3-L1(Tg) cells at
day 7, whereas for 3T3-L1(Ctrl) cells these binding sites were not identified among the top scoring motifs (Fig. 6a ). Since C/ebpβ and Ppary, in cooperation with Prdm16 or Pgc-1α, have been shown to promote the browning of fat cells16,20, this observation suggested that in 3T3-L1(Tg) cells LSD1 acts in cooperation with C/ebpβ and Pparγ/Rxrα to regulate early and late phases of beige adipogenesis, respectively. Indeed, previously reported C/ebpβ ChlP-seq data43 from 3T3-L1 cells illustrated that atday Fig. 35a ), whereas atday Fig. 6f ). Pathway analyses of the common target genes atday 3 of differentiation suggested that LSD1 and C/ebpβ control adipogenesis as well as main metabolic pathways (Fig. 35b ). As shown by ChIP-seq and RNA-seq analyses, C/ebpα, C/ebpβ, and C/ebpδ are direct LSD1 target genes, and LSD1 upregulates expression of C/ebpα atday 7, and C/ebpβ atdays Fig. 35c ). These data were corroborated in both, differentiated 3T3-L1(Tg) cells and beige fat of Tg mice (Fig. 35d-f ). In contrast, C/ebp transcript levels were neither altered in skeletal muscle nor in liver of Tg mice (Fig. 33 ). Finally, RNAi-mediated knockdown of C/ebpβ in 3T3-L1(Tg) cells significantly decreased expression of the beige-selective gene programme (Fig. 36 ) demonstrating that C/ebpβ, at least in part, mediates LSD1-controlled beige adipogenesis. - C/ebpβ and C/ebpδ also promote expression of Pparγ 44. Pparγ/Rxr heterodimers act as a transcriptional activator of numerous adipocyte-specific genes45. ChIP-seq analysis of Pparγ and Rxrα in 3T3-L1 cells46 confirmed that at
day 0 only a minimal fraction (0.5 %) of LSD1 target genes is cooccupied by Pparγ/Rxrα (Fig. 37a ). However, atday 7, Pparγ/Rxrα occupy 1831 out of 6904 (27 %) of LSD1 target genes (Fig. 6g ). These 1831 common target genes define "adipogenesis" (Fig. 37b ) in addition to the main metabolic pathway clusters, as exemplified by representative genes of fatty acid β-oxidation (Fig. 37c ), demonstrating that LSD1 in concert with Pparγ/Rxrα controls late adipogenesis. Furthermore, LSD1 binds to the Pparγ and Rxrα gene promoter (Fig. 38a ) and induces expression of Pparγ and Rxrα in 3T3-L1(Tg) cells and beige fat of Tg mice (Fig. 38b-d ). - In summary, our data show that LSD1 controls beige adipogenesis by increasing mitochondrial biogenesis and respiration via Nrf1, inducing early adipogenesis through C/ebpβ, and enforcing late adipogenesis by Pparγ/Rxr (
Fig. 39 ). - All mice were housed in the pathogen-free barrier facility of the University Medical Center Freiburg in accordance with institutional guidelines and approved by the regional board. Mice were maintained in a temperature- and humidity-controlled animal facility with a 12-hour light/dark cycle, free access to water, and a standard rodent chow (Kliba, breeding, 3807). The high-fat diet (HFD) study was carried out with a chow containing 4.056 kcal/kg (fat: 1.600 kcal/kg and sucrose: 1.600 kcal/kg; Research Diets). HFD was given to mice at 5 weeks of age. Mice were analysed at 25 weeks of age. For cold exposure experiments, mice were maintained at 10 °C with a 12 hour light/dark cycle, free access to water, and a standard rodent chow. Animals were killed by cervical dislocation, tissues were immediately collected, weighted, frozen in liquid nitrogen or processed for further analyses. Nomenclature for dissected adipose depots was used according to Seale et al.17. Epididymidal WAT (epWAT): prominent bilateral intra-abdominal visceral depots in male mice attached to the epididymis. Inguinal WAT (ingWAT): bilateral superficial inguinal depots between the skin and muscle fascia just anterior to the lower segment of the hind limbs. Perimuscular WAT (pmWAT): depots located on the upper part of the quadriceps muscle. Retroperitoneal WAT (rpWAT): bilateral depots in abdominal cavity behind the peritoneum on the dorsal side of the kidney. Interscapular BAT (BAT): most prominent depot of brown adipocytes in rodents, found between the scapulae. In vivo experiments including food consumption, serum analysis, glucose tolerance and insulin sensitivity tests, temperature measurements, body lean and fat contents, and energy expenditure were described48. CL316,243 (Sigma-Aldrich) was injected intraperitoneally at 1 mg/kg.
- To generate transgenic (Tg) mice or inactive mutant transgenic (TgMut) mice, the complete human wild type or K661A/W751A/Y761S mutated LSD1 cDNA was cloned 3' to the Rosa26 promoter/enhancer (
Figs. 7a and10a , respectively). Tg and TgMut mice were generated by pronuclear injection into fertilized FVB oocytes. For analyses wild-type littermates were used as controls. Mice were genotyped by PCR amplification of genomic DNA extracted from tail biopsies using the DirectPCR extraction kit (Viagen) with primers for detection of the transgene Rosa26-LSD1 or Rosa26-LSD1Mut (Table 2).Table 2 Primers used for genotyping Gene Sense Primer 5'-3' Rosa26-LSD1 fw AATGCCTTCGAATTCAGCAC Rosa26-LSD1 rev CCTTGTCATCGTCGTCCTTG Rosa26-LSD1Mut fw TCTTCTTTGCGGGAGAACAT Rosa26-LSD1Mut rev CGCCTCTAGCTCACATGCTT LSD1 WT/L2 fw CCTCAGTAGGCCTGGTTTGT LSD1 WT/L2 rev TTGGTTTTGGTTGACCCTTC LSD1 L- fw CCGTGGAAATTCGTGCACTC LSD1 L- rev GCAGGCGGTTTGAAATGTATTC Cre fw TTCCCGCAGAACCTGAAGATGTTCG Cre rev GGGTGTTATAAGCAATCCCCAGAAATGC - The targeting strategy for the conditional deletion of the first exon of LSD1 (LSD1tm1Schüle) is available upon request. To delete LSD1, conditional LSD1 mice were crossed to either Rosa26-Cre(Tg/0) transgenic mice that ubiquitously express the Cre recombinase49 (
Fig. 20a ), aP2-Cre mice38 to selectively ablate LSD1 in adipose tissue, or Rosa26-CreERT(Tg/0) transgenic mice, which mediates tamoxifen-inducible Cre recombination (LSD1 Rosa26-CreERT )40 . Mice were maintained on a mixed C57/BI6NCrl;129S2/Sv background. Homozygous conditional mice were used as controls. Mice were genotyped with primers for detection of the conditional LSD1 and the deleted alleles (Table 2). - Tissues obtained from mice were immediately frozen in liquid nitrogen. The activities of the respiratory chain enzyme complex II (Sdh) and complex IV (Cox) were determined as described50.
- Mice were individually housed. Food pellets (150 g) were delivered and weighed after 1 week. Weekly food consumption was calculated by subtracting the final from the initial pellet weight.
- Blood was collected from retro orbital sinus after a 6 hr fast that started at the beginning of the light cycle. Serum glucose, cholesterol, triglyceride, and free fatty acid levels were analysed as described51.
- Intraperitoneal glucose tolerance test (IPGTT) and insulin sensitivity test (IPIST) were performed with mice fed a RD or a HFD after 6 h or 16 h of fasting, respectively. For IPGTT, following measurement of the basal glucose level (time 0), mice were intraperitoneally injected with 20 % glucose in sterile saline solution (0.9 % NaCl) at a dose of 2 g glucose/kg body weight. Blood was collected from the tail vein after 15, 30, 45, 60, 90, and 120 min for glucose determination. For IPIST, mice were intraperitoneally injected with porcine insulin (0.5 U/kg; Sigma). Blood was collected at 15, 30, 60, and 90 min.
- Body lean and fat content were recorded in anaesthetized mice by quantitative nuclear magnetic resonance (qNMR, PIXIMUS, GE Medical Systems) according to the manufacturer's instructions.
- Total activity, oxygen consumption (O2) and carbon dioxide (CO2) production were measured with a LabMaster (TSE systems) at 26 min intervals for 24 h. VO2 and VCO2 values were normalized to body mass. The respiratory quotient (RQ) corresponds to VCO2/VO2. Heat (Cal/h) was calculated using the formula: Heat (H) = (Caloric Value x VO2 x 0.001) / body weight x 0.75; (Caloric Value = 3.815 + 1.232 x RQ). Body temperature was measured with a rectal probe linked to a digital thermometer (Bioseb).
- Tissues were fixed in 10 % buffered formalin and embedded in paraffin. For immunofluorescence analyses, 5 µm paraffin sections were deparaffinised, rehydrated, boiled in antigen unmasking solution (Vector laboratories, H-3300) for 10 min, cooled to room temperature, washed 3 times with PBS, 0.1 % Triton-X100 for 5 min, incubated for 1 h in 5 % FBS (Gibco, 10270-106) in PBS, 0.1 % Triton-X100, followed by overnight incubation at 4°C with anti-LSD11 (1/1000), anti-Myf5 (Santa Cruz, C-20, sc-302, 1/500), anti-Prdm16 (abcam, ab118573, 1/500), or anti-Ucp1 (abcam, ab10983, 1/200) antibody. Slides were then incubated with secondary antibody conjugated to Alexa546 (Invitrogen, 1/400) and mounted in aqueous medium (Fluoromount-G, SouthernBiotech, 0100-01) with DAPI (Sigma, D-9542, 1/1000). Between each step, sections were washed with PBS, 0.1 % Triton-X100.
- For NADH-tetrazolium reductase activity staining, 10 µm cryosections were incubated in 0.2 M Tris-HCl pH 7.4, containing 1.5 mM NADH (Roche) and 1.5 mM nitrobluetetrazolium (Sigma) for 15 min at 55°C, dehydrated, and mounted52.
- For ultrastructural analyses samples were fixed by immersion in 2.5 % glutaraldehyde and 2.5 % paraformaldehyde in cacodylate buffer (0.1 M, pH 7.4), washed in cacodylate buffer for 30 min and kept at 4 °C. Post-fixation was performed with 1 % osmium tetraoxide in 0.1 M cacodylate buffer for 1 h at 4 °C and dehydration through graded alcohol (50, 70, 90 and 100 %) and propylene oxide for 30 min each. Samples were embedded in Epon 812. Ultrathin sections were cut at 70 nm and contrasted with uranyl acetate and lead citrate and examined at 70 kV with a Morgagni 268D electron microscope. Images were captured digitally by a Mega View III camera (Soft Imaging System). Mitochondria number and cross section areas were determined with the Image J software (NIH).
- RNA was isolated with TRIzol Reagent (Invitrogen). Two micrograms of RNA were converted to cDNA with SuperScript II reverse transcriptase (Invitrogen) and polyT oligonucleotides according to the supplier's protocol. Quantitative RT-PCR was performed using the Abgene SYBR Green PCR kit (Invitrogen) according to the supplier's protocol. Data were analysed using the standard curve method53. 36b4, Hprt, Tbp, or β-actin were used for normalization. Primer sequences are given in Table 3.
- RNA samples were sequenced by the standard Illumina protocol to create raw sequence files (.fastq files). We aligned these reads to the mm10 build of the mouse genome using
TopHat version 2 54. The aligned reads were counted with the homer software (analyze RNA) and DEG's were identified using EdgeR55 and DESeq version 1.8.3 56. - Experiments were performed as described1. Fat tissues were grounded in RIPA buffer [50 mM Tris pH 7.5, 1 % NP40, 0.5 % sodium deoxycholate, 0.1 % SDS, 150 mM NaCl, 5 mM EDTA, and protease inhibitor cocktail (45 µg/ml, Roche, 11 873 580 001)] at 4 °C. Homogenates were separated in 10 % polyacrylamide gels and blotted to Hybond nitrocellulose membranes (GE Healthcare). Membranes were decorated using following antibodies: anti-LSD11 (1/1000), anti-Prdm16 (abcam, ab118573, 1/500), anti-Pgc-1 (Santa-Cruz, H300, sc-13067, 1/1000), anti-Nrf1 (abcam, ab55744, 1/1000), anti-Ucp1 (abcam, ab10983, 1/1000), anti-Klhl13 (Santa-Cruz, H-286, sc-99119, 1/500), Fabp4 (Santa-Cruz, sc-18661, 1/2000), anti-Flag (Sigma, F3165, 1/500), anti-Ear2 (Proteintech, 60117-2-Ig, 1/400), anti-C/ebpβ (Santa-Cruz, sc-746, 1/500), anti-Ppary (AbD Serotec, AHP1461, 1/500), anti-Rxra (Santa-Cruz, sc-553, 1/500), anti-β-Tubulin (Sigma, T6074, 1/10000), or anti-β-Actin (Sigma, A1978, 1/10000). Secondary antibodies conjugated to horseradish peroxidase (GE Healthcare) were detected using an enhanced chemiluminescence detection system (GE Healthcare). Protein levels were quantified using the Chemi Capt software (Peqlab).
- Chromatin immunoprecipitation experiments were performed using anti-LSD1 (20752, Schüle laboratory) or anti-Nrfl (abcam, ab55744, lot GR 95770-1) antibodies, on protein A-Sepharose 4B (GE Healthcare) essentially as described57. Libraries were prepared from immunoprecipitated DNA according to standard methods. ChlP-seq libraries were sequenced using a HiSeq 2000 (Illumina) and mapped to the mm10 reference
genome using bowtie 2 58. Data were further analysed using the peak finding algorithm MACS 1.41 59 using input as control. All peaks with FDR greater than 1 % were excluded from further analysis. The uniquely mapped reads were used to generate the genome-wide intensity profiles, which were visualized using the IGV genome browser60. HOMER42 was used to annotate peaks, to calculate overlaps between different peak files, and for motif searches. The genomic features (promoter, exon, intron, 3' UTR, and intergenic regions) were defined and calculated using Refseq and HOMER. Genes annotated by HOMER were further used for a pathway analysis42. Previously reported ChIP-seq results for C/ebpβ (GSE27826)43, Pparγ, and Rxrα (GSE13511)46 were used for analysis. - Fat pads were digested overnight with Proteinase K and DNA was extracted with phenolchloroform. Mitochondrial and nuclear DNA was amplified by quantitative PCR using Cox2 and Fasn primers (Table 3), respectively.
- The following plasmids were used: pLenti4_Flag_HA_Puro, pLenti4_Flag_HA_Puro_LSD1, pRTS_Puro_GW, pRTS_Puro_GW-Flag_LSD1, pRTS_Puro_GW_Flag_LSD1-K661A-W751A-Y761S, pSlik-Neo, and pSlik-Neo_Flag-HA_LSD1. Plasmids were obtained by Gateway LRII cloning in pLenti4 vector (Invitrogen) or in a puromycin-selectable and doxycycline-inducible pRTS plasmid61 modified to contain a Gateway cassette, V5, and His tags. Cloning details can be obtained upon request.
- Primary white fat stromal vascular and mature fat cells were fractionated according to published methods62,63. Primary SV cells were cultured in DMEM/F12 containing 10% fetal bovine serum (FBS). For induction of CreERT recombinase, primary cells were treated with 4-hydroxy-tamoxifen (Sigma) at 0.2µM. Mouse 3T3-L1 and C3H-10T1/2 preadipocytes were maintained in Dulbecco's modified Eagle's medium (DMEM) or Eagle's minimal essential medium (EMEM), respectively, supplemented with 10 % FBS and glutamine. Differentiation of primary SV cells, 3T3-L1, and C3H-10T1/2 was induced by treatment of confluent cells (designated day 0) with an adipogenic mixture consisting of 10 µg/ml insulin (Gibco), 1 µM dexamethasone (Calbiochem), 10 µM rosiglitazone (Cayman) and 500 µM isobutylmethylxanthine (Serva) in the presence of 10 % FBS. The differentiation medium was replaced 3 days later (day 3) with medium supplemented with 10 % FBS and 10 µg/ml insulin for 2 days. Subsequently, the cells were cultured in the same medium for 2 more days (day 7). For the determination of mitochondrial metabolism 3T3-L1 cells were stained with fluorescent dye JC-1 (Invitrogen) followed by flow cytometric analysis. Following trypsin treatment, cells were exposed to 20 µg/ml of JC-1 in culture medium for 15 min at 37 °C and suspended in PBS for fluorescence-activated cell sorting (FACS) analysis. Green and red fluorescent signals corresponding to mitochondrial mass (FL-1) and mitochondrial membrane potential (FL-2), respectively, were detected using a FACS Canto cytometer (Becton Dickinson). 293FT cells were cultured in DMEM supplemented with 10 % FBS, non-essential amino-acids (Gibco) and glutamine (Gibco). Viral production was performed as described1. 3T3-L1 cells were infected with pLenti4_Flag_HA_Puro, pLenti4_Flag_HA_Puro_LSD1, pSlik-Neo, or pSlik-Neo_Flag-HA_LSD1 virus and subsequently selected in medium containing 1 µM puromycin (Sigma). Stable transfection of C3H-10T1/2 with pRTS_Puro_GW, pRTS_Puro_GW-Flag_LSD1, or pRTS_Puro_GW-Flag_LSD1-K661A-W751A-Y761S was carried out in 6-well plates. Briefly, at 50-70 % confluence cell medium was changed for growth medium (DMEM, 10 % FBS, non-essential amino-acids and glutamine) for 3 h. Cells were then transfected with Fugene® HD (Roche) and 750 ng of DNA in growth medium without FBS for 5 h at 37 °C. FBS was then adjusted at 10 % and cells were selected using 0.5 µM puromycin (Sigma). 3T3-L1 cells were transfected with 1 µM siRNA against Nrf1 or unrelated control (Invitrogen) using DharmaFECT 1 (Thermo Scientific) according to the manufacturer's instructions. siRNA oligonucleotide sequences were as follows:
- Nrf1 siRNA sense: 5'-UAUGGUAGCCAUGUGUUCAGUUUGG-3'
- Control-Nrf1 siRNA sense: 5'-UAUUUGGAUGUACCUGUGGACUUGG-3'
- C/ebpβ siRNA sense: 5'-CCAAGAUGCGCAACCUGGAGACGCA-3'
- Control-C/ebpp siRNA sense: 5'-CCAGUACGCCAAGUCGAGCAAGGCA-3'
- Data are represented as mean + standard error of the mean (SEM). Significance (except
Fig. 6a ) was calculated by a two-tailed Student's t test.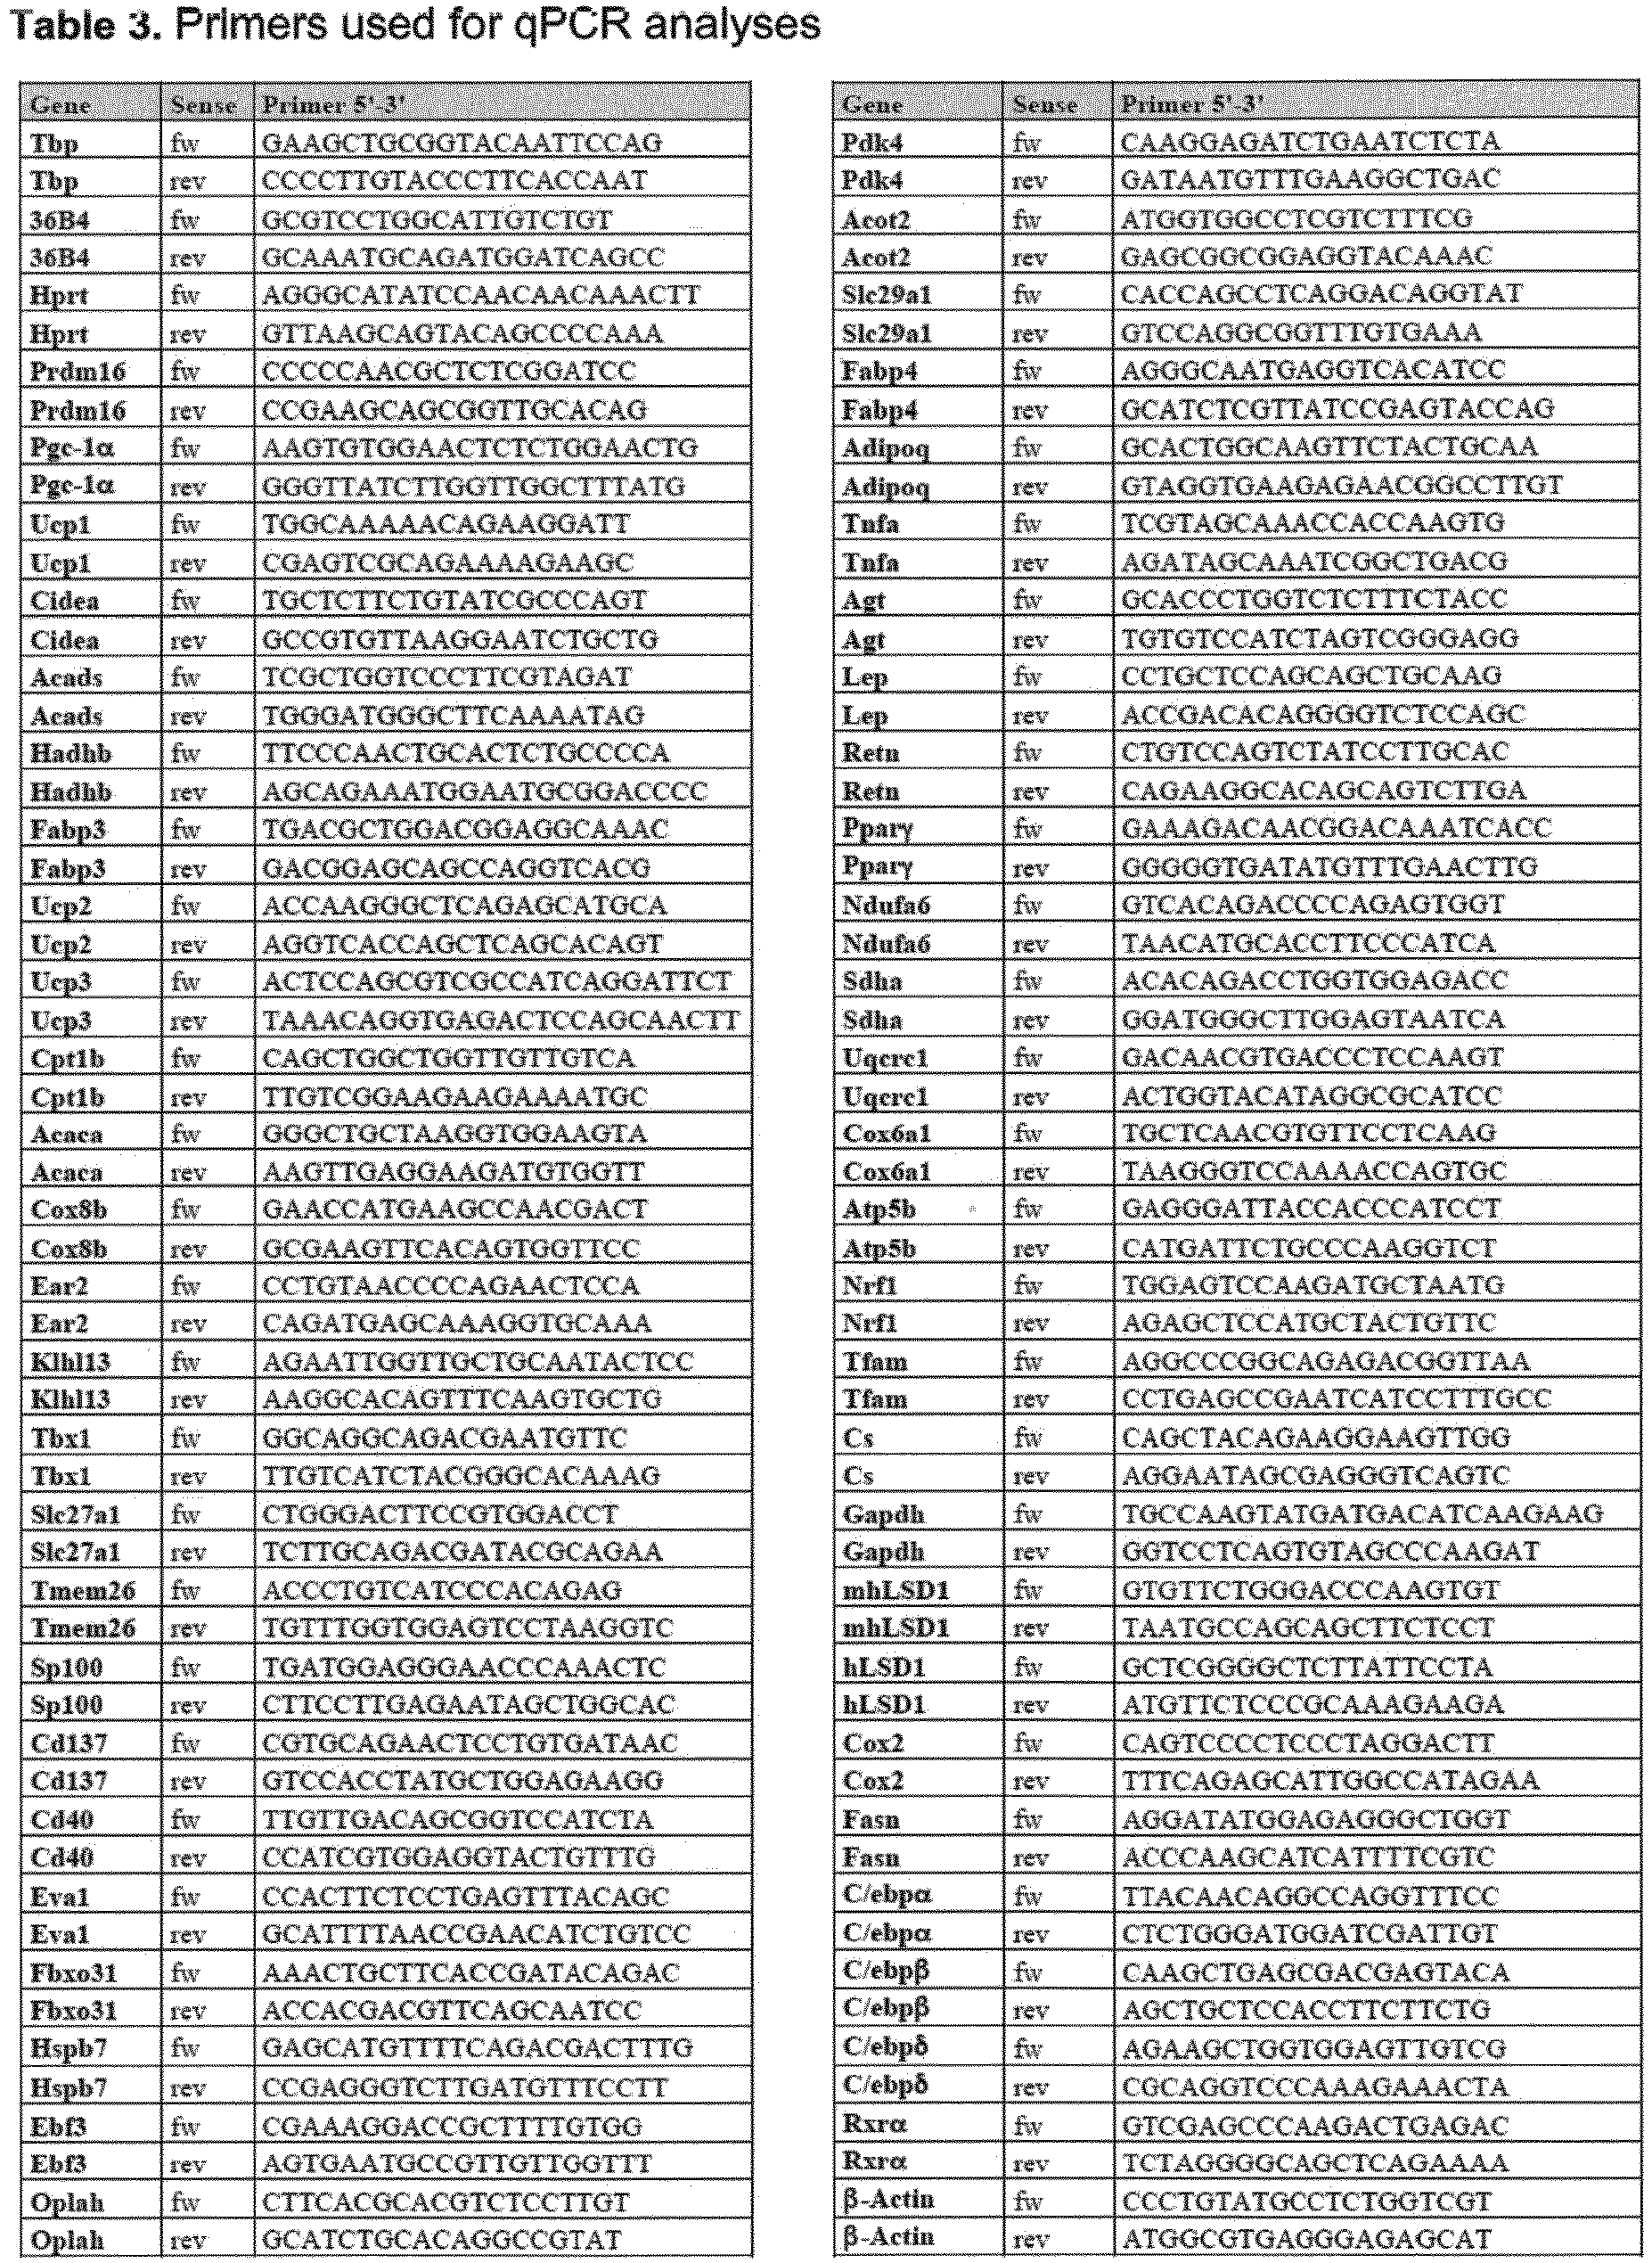
-
- 1. Metzger, E., et al. LSD1 demethylates repressive histone marks to promote androgen-receptor-dependent transcription. Nature 437, 436-439 (2005).
- 2. Shi, Y., et al. Histone demethylation mediated by the nuclear amine oxidase homolog LSD1. Cell 119, 941-953 (2004).
- 3. Wang, J., et al. The lysine demethylase LSD1 (KDM1) is required for maintenance of global DNA methylation. Nat Genet 41, 125-129 (2009).
- 4. Wang, J., et al. Opposing LSD1 complexes function in developmental gene activation and repression programmes. Nature 446, 882-887 (2007).
- 5. Foster, C.T., et al. Lysine-).
- 6. Macfarlan, T.S., et al. Endogenous retroviruses and neighboring genes are coordinately repressed by LSD1/KDM1A. ).
- 7. Chen, Y., Jie, W., Yan, W., Zhou, K. & Xiao, Y. Lysine-specific histone demethylase 1 (LSD1): A potential molecular target for tumor therapy. Crit Rev Eukaryot Gene Expr 22, 53-59 (2012).
- 8. Wang, Y., et al. LSD1 is a subunit of the NuRD complex and targets the metastasis programs in breast cancer. Cell 138, 660-672 (2009).
- 9. Musri, M.M., et al. Histone demethylase LSD1 regulates adipogenesis. J Biol Chem 285, 30034-30041 (2010).
- 10. Hino, S., et al. FAD-dependent lysine-specific demethylase-1 regulates cellular energy expenditure. ).
- 11. Langin, D. Recruitment of brown fat and conversion of white into brown adipocytes: strategies to fight the metabolic complications of obesity? Biochim Biophys Acta 1801, 372-376 (2010).
- 12. Matthias, A., Jacobsson, A., Cannon, B. & Nedergaard, J. The bioenergetics of brown fat mitochondria from UCP1-ablated mice. Ucp1 is not involved in fatty acid-induced de-energization ("uncoupling"). ).
- 13. Monemdjou, S., Kozak, L.P. & Harper, M.E. Mitochondrial proton leak in brown adipose tissue mitochondria of Ucp1-deficient mice is GDP insensitive. Am J Physiol 276, E1073-1082 (1999).
- 14. Himms-Hagen, J. Brown adipose tissue thermogenesis: interdisciplinary studies. ).
- 15. Fisher, F.M., et al. FGF21 regulates PGC-1alpha and browning of white adipose tissues in adaptive thermogenesis. Genes Dev 26, 271-281 (2012).
- 16. Kajimura, S., Seale, P. & Spiegelman, B.M. Transcriptional control of brown fat development. Cell Metab 11, 257-262 (2010).
- 17. Seale, P., et al. Prdm16 determines the thermogenic program of subcutaneous white adipose tissue in mice. J Clin Invest 121, 96-105 (2011).
- 18. Petrovic, N., et al. Chronic peroxisome proliferator-activated receptor gamma (PPARgamma) activation of epididymally derived white adipocyte cultures reveals a population of thermogenically competent, UCP1-containing adipocytes molecularly distinct from classic brown adipocytes. J Biol Chem 285, 7153-7164 (2010).
- 19. Wu, J., et al. Beige adipocytes are a distinct type of thermogenic fat cell in mouse and human. ).
- 20. Seale, P., et al. PRDM16 controls a brown fat/skeletal muscle switch. Nature 454, 961-967 (2008).
- 21. Cristancho, A.G. & Lazar, M.A. Forming functional fat: a growing understanding of adipocyte differentiation. Nat Rev ).
- 22. Stephens, J.M. The fat controller: adipocyte development. ).
- 23. Wu, J., Cohen, P. & Spiegelman, B.M. Adaptive thermogenesis in adipocytes: is beige the new brown? Genes Dev 27, 234-250 (2013).
- 24. Mazzucotelli, A., et al. The transcriptional coactivator peroxisome proliferator activated receptor (PPAR)gamma coactivator-1 alpha and the nuclear receptor PPAR alpha control the expression of glycerol kinase and metabolism genes independently of PPAR gamma activation in human white adipocytes. Diabetes 56, 2467-2475 (2007).
- 25. Tiraby, C., et al. Acquirement of brown fat cell features by human white adipocytes. J Biol Chem 278, 33370-33376 (2003).
- 26. Puigserver, P., et al. A cold-inducible coactivator of nuclear receptors linked to adaptive thermogenesis. Cell 92, 829-839 (1998).
- 27. Scarpulla, R.C. Transcriptional paradigms in mammalian mitochondrial biogenesis and function. Physiol Rev 88, 611-638 (2008).
- 28. Puigserver, P. & Spiegelman, B.M. Peroxisome proliferator-activated receptor-).
- 29. Wu, Z., et al. Mechanisms controlling mitochondrial biogenesis and respiration through the thermogenic coactivator PGC-1. ).
- 30. Koh, E.H., et al. Essential role of mitochondrial function in adiponectin synthesis in adipocytes. Diabetes 56, 2973-2981 (2007).
- 31. Auffret, J., et al. Beige differentiation of adipose depots in mice lacking prolactin receptor protects against high-fat-diet-induced obesity. FASEB J 26, 3728-3737 (2012).
- 32. Vegiopoulos, A., et al. Cyclooxygenase-2 controls energy homeostasis in mice by de novo recruitment of brown adipocytes. Science 328, 1158-1161 (2010).
- 33. Yadav, H., et al. Protection from obesity and diabetes by blockade of TGF-beta/Smad3 signaling. ).
- 34. Beranger, G.E., et al. In vitro brown and "brite"/"beige" adipogenesis: Human cellular models and molecular aspects. Biochim Biophys Acta (2012).
- 35. Gesta, S., Tseng, Y.H. & Kahn, C.R. Developmental origin of fat: tracking obesity to its source. Cell 131, 242-256 (2007).
- 36. Metzger, E., et al. Phosphorylation of histone H3T6 by PKCbeta(I) controls demethylation at histone H3K4. Nature 464, 792-796 (2010).
- 37. Rosen, E.D. & Spiegelman, B.M. Adipocytes as regulators of energy balance and glucose homeostasis. Nature 444, 847-853 (2006).
- 38. He, W., et al. Adipose-specific peroxisome proliferator-activated receptor gamma knockout causes insulin resistance in fat and liver but not in muscle. Proc Natl ).
- 39. Shan, T., Liu, W. & Kuang, S. Fatty ).
- 40. Vooijs, M., Jonkers, J. & Berns, A. A highly efficient ligand-regulated Cre recombinase mouse line shows that LoxP recombination is position dependent. ).
- 41. Kanehisa, M., Goto, S., Sato, Y., Furumichi, M. & Tanabe, M. KEGG for integration and interpretation of large-scale molecular data sets. ).
- 42. Heinz, S., et al. Simple combinations of lineage-determining transcription factors prime cis-regulatory elements required for macrophage and B cell identities. Mol Cell 38, 576-589 (2010).
- 43. Siersbaek, R., et al. Extensive chromatin remodelling and establishment of transcription factor 'hotspots' during early adipogenesis. ).
- 44. Farmer, S.R. Regulation of PPARgamma activity during adipogenesis. Int J Obes (Lond) 29 ).
- 45. Koppen, A. & Kalkhoven, E. Brown vs white adipocytes: the PPARgamma coregulator story. FEBS Lett 584, 3250-3259 (2010).
- 46. Nielsen, R., et al. Genome-wide profiling of PPARgamma:RXR and RNA polymerase II occupancy reveals temporal activation of distinct metabolic pathways and changes in RXR dimer composition during adipogenesis. Genes Dev 22, 2953-2967 (2008).
- 47. Kajimura, S., et al. Initiation of myoblast to brown fat switch by a PRDM16-C/EBP-beta transcriptional complex. Nature 460, 1154-1158 (2009).
- 48. Duteil, D., et al. The transcriptional coregulators TIF2 and SRC-1 regulate energy homeostasis by modulating mitochondrial respiration in skeletal muscles. ).
- 49. Schwenk, F., Baron, U. & Rajewsky, K. A cre-transgenic mouse strain for the ubiquitous deletion of loxP-flanked gene segments including deletion in germ cells. ).
- 50. Puccio, H., et al. Mouse models for Friedreich ataxia exhibit cardiomyopathy, sensory nerve defect and Fe-S enzyme deficiency followed by intramitochondrial iron deposits. Nat Genet 27, 181-186 (2001).
- 51. Picard, F., et al. SRC-1 and TIF2 control energy balance between white and brown adipose tissues. Cell 111, 931-941 (2002).
- 52. Hamalainen, N. & Pette, D. The histochemical profiles of fast fiber types IIB, IID, and IIA in skeletal muscles of mouse, rat, and rabbit. J Histochem Cytochem 41, 733-743 (1993).
- 53. Bookout, A.L., Cummins, C.L., Mangelsdorf, D.J., Pesola, J.M. & Kramer, M.F. High-throughput real-time quantitative reverse transcription PCR. Curr Protoc ).
- 54. Trapnell, C., et al. Differential gene and transcript expression analysis of RNA-seq experiments with TopHat and Cufflinks. ).
- 55. Robinson, M.D. & Smyth, G.K. Small-sample estimation of negative binomial dispersion, with applications to SAGE data. ).
- 56. Anders, S. & Huber, W. Differential expression analysis for sequence count data. Genome Biol 11, R106 (2010).
- 57. Metzger, E., et al. Phosphorylation of histone H3 at threonine 11 establishes a novel chromatin mark for transcriptional regulation. ).
- 58. Langmead, B., Trapnell, C., Pop, M. & Salzberg, S.L. Ultrafast and memory-efficient alignment of short DNA sequences to the human genome. ).
- 59. Zhang, Y., et al. Model-based analysis of ChlP-Seq (MACS). ).
- 60. Thorvaldsdottir, H., Robinson, J.T. & Mesirov, J.P. Integrative Genomics Viewer (IGV): high-performance genomics data visualization and exploration. Brief Bioinform (2012).
- 61. Hölzel, M., et al. Rapid conditional knock-down-knock-in system for mammalian cells. Nucleic Acids Res 35, e17 (2007).
- 62. Rodbell, M. Metabolism of Isolated Fat Cells. I. Effects of Hormones on Glucose Metabolism and Lipolysis. J Biol Chem 239, 375-380 (1964).
- 63. Soukas, A., Socci, N.D., Saatkamp, B.D., Novelli, S. & Friedman, J.M. Distinct transcriptional profiles of adipogenesis in vivo and in vitro. J Biol Chem 276, 34167-34174 (2001).
- 64. Hood, D.A., Irrcher, I., Ljubicic, V. & Joseph, A.M. Coordination of metabolic plasticity in skeletal muscle. J Exp Biol 209, 2265-2275 (2006).
-
- <110> Universitaetsklinikum Freiburg
- <120> Animal Model for
Type 2 Diabetes and Obesity - <130> LSD1
- <160> 7
- <170> PatentIn version 3.5
- <210> 1
<211> 2559
<212> DNA
<213> homo sapiens - <400> 1


- <210> 2
<211> 3053
<212> DNA
<213> homo sapiens - <220>
<221> CDS
<222> (150)..(2708) - <400> 2


- <210> 3
<211> 852
<212> PRT
<213> homo sapiens - <400> 3

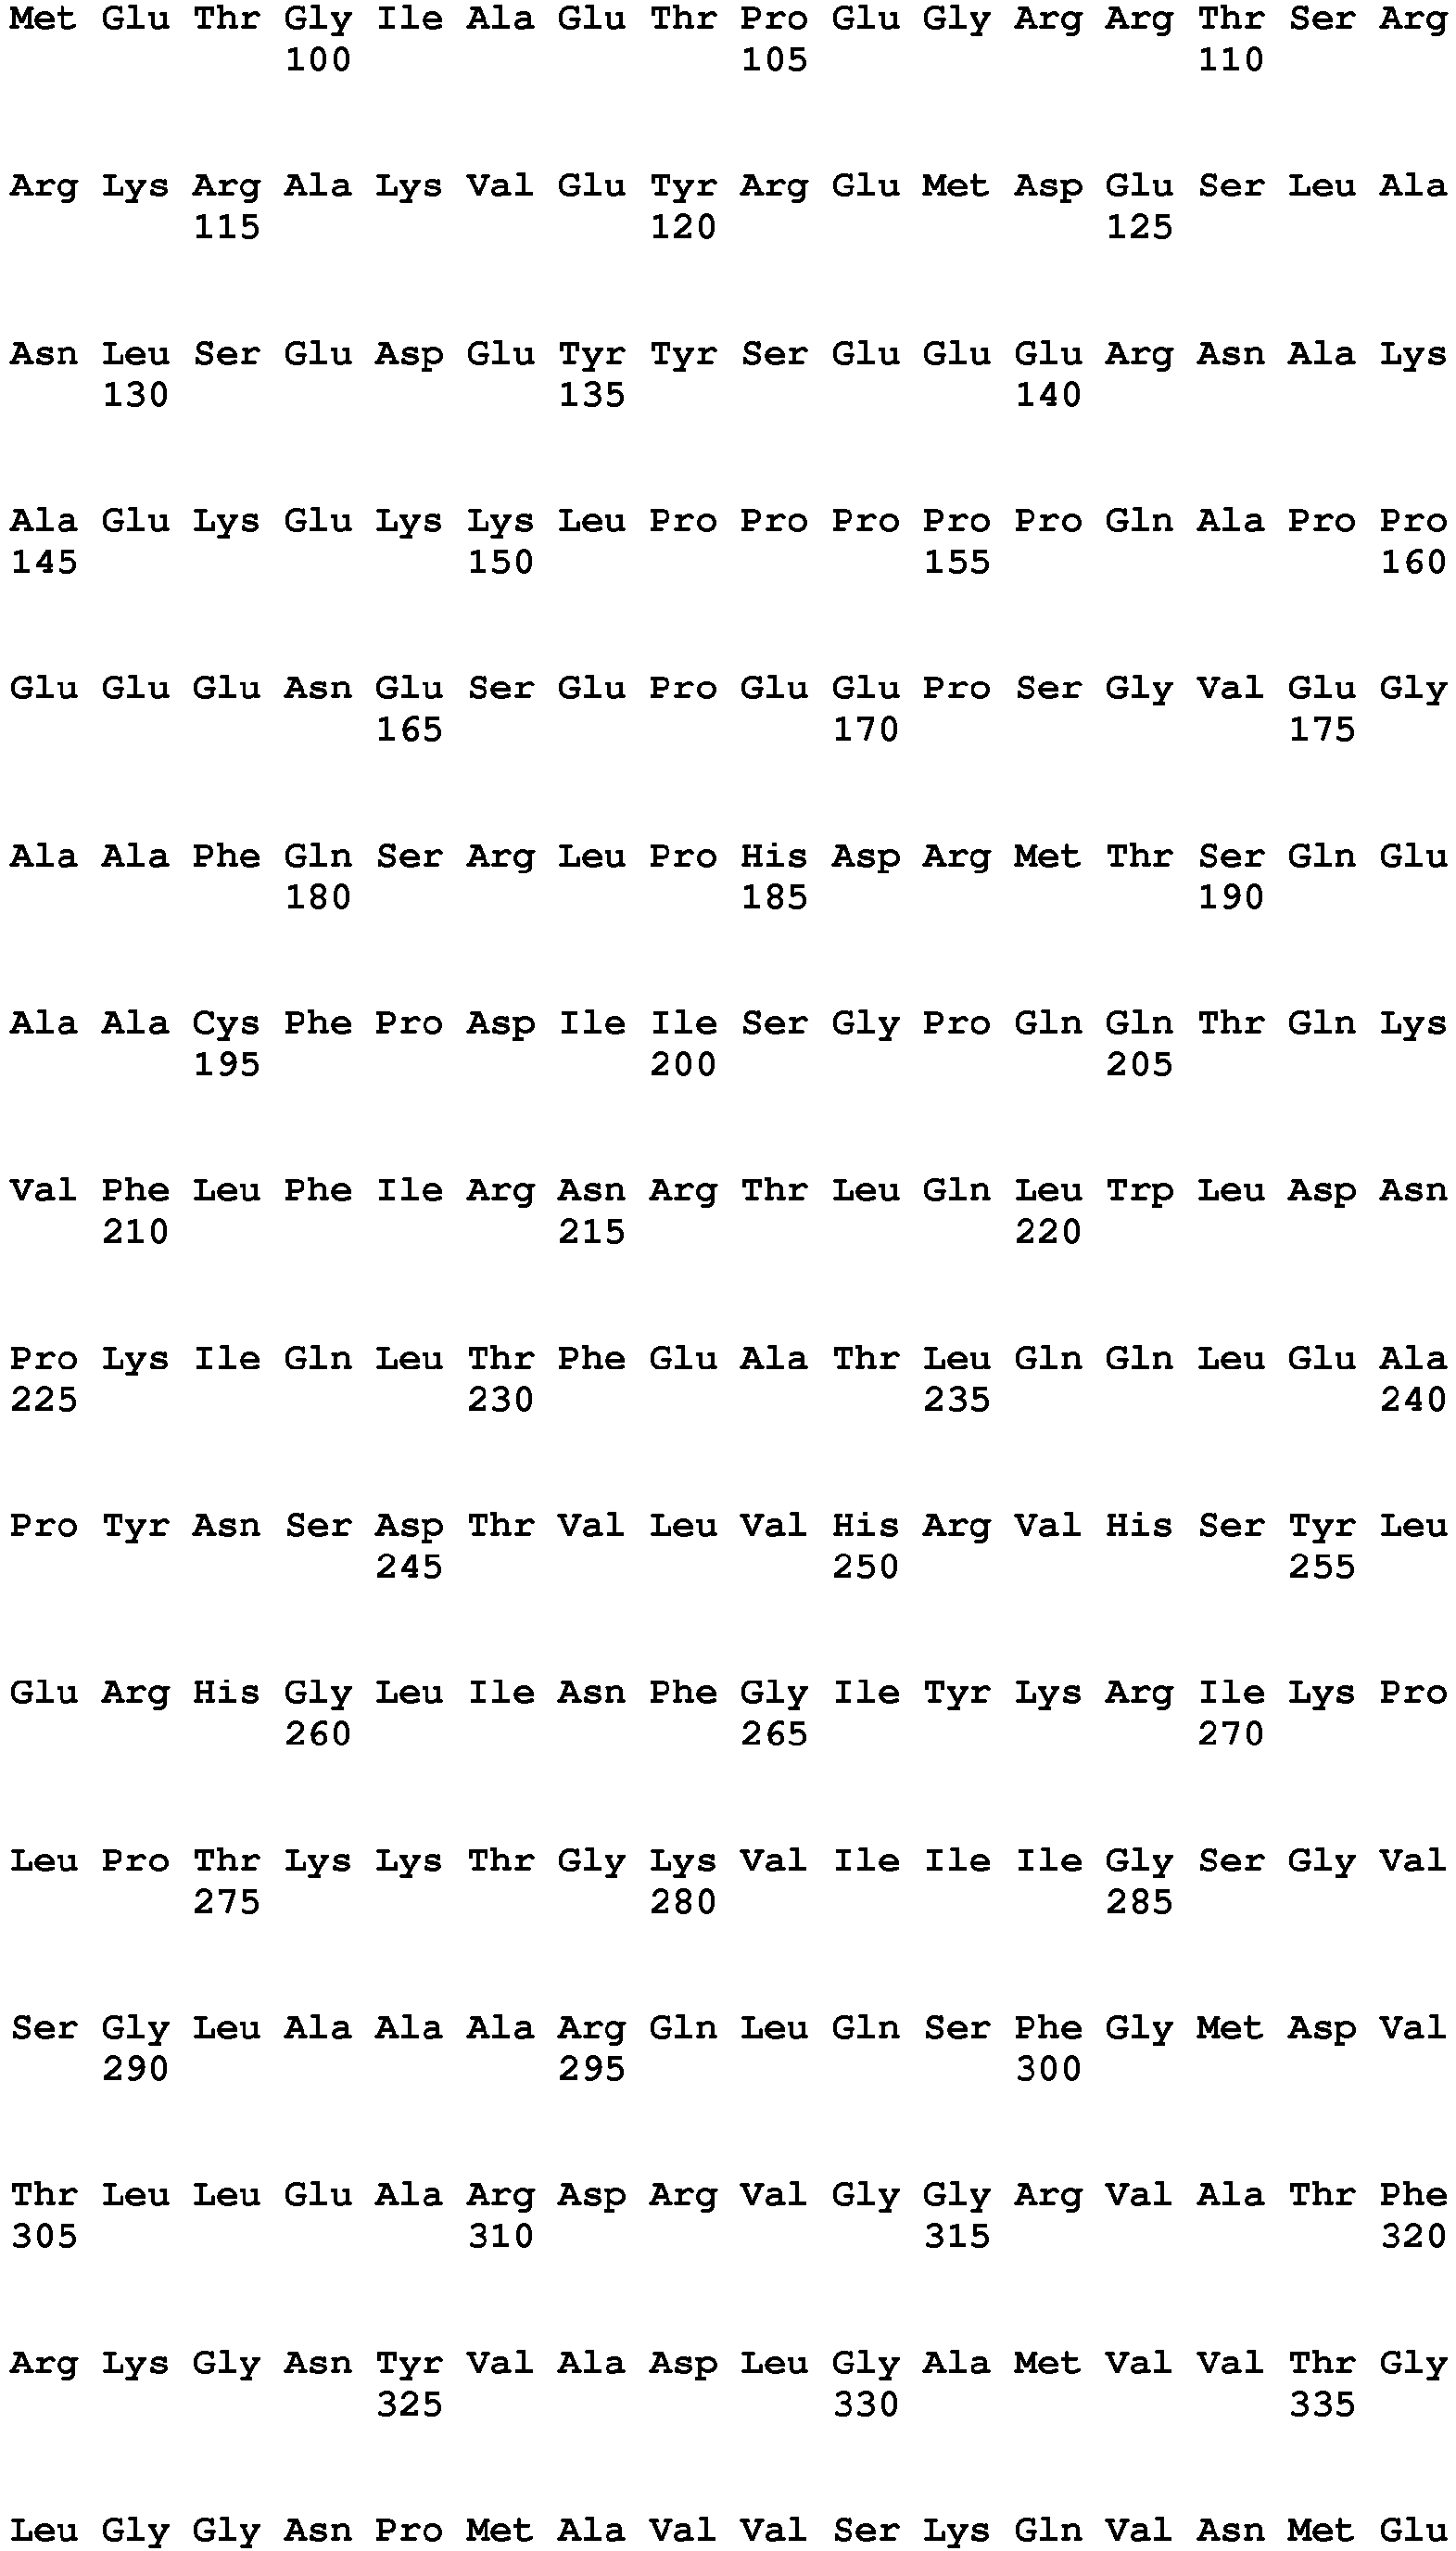


- <210> 4
<211> 3030
<212> DNA
<213> mus musculus - <220>
<221> CDS
<222> (139)..(2700) - <400> 4


- <210> 5
<211> 853
<212> PRT
<213> mus musculus - <400> 5


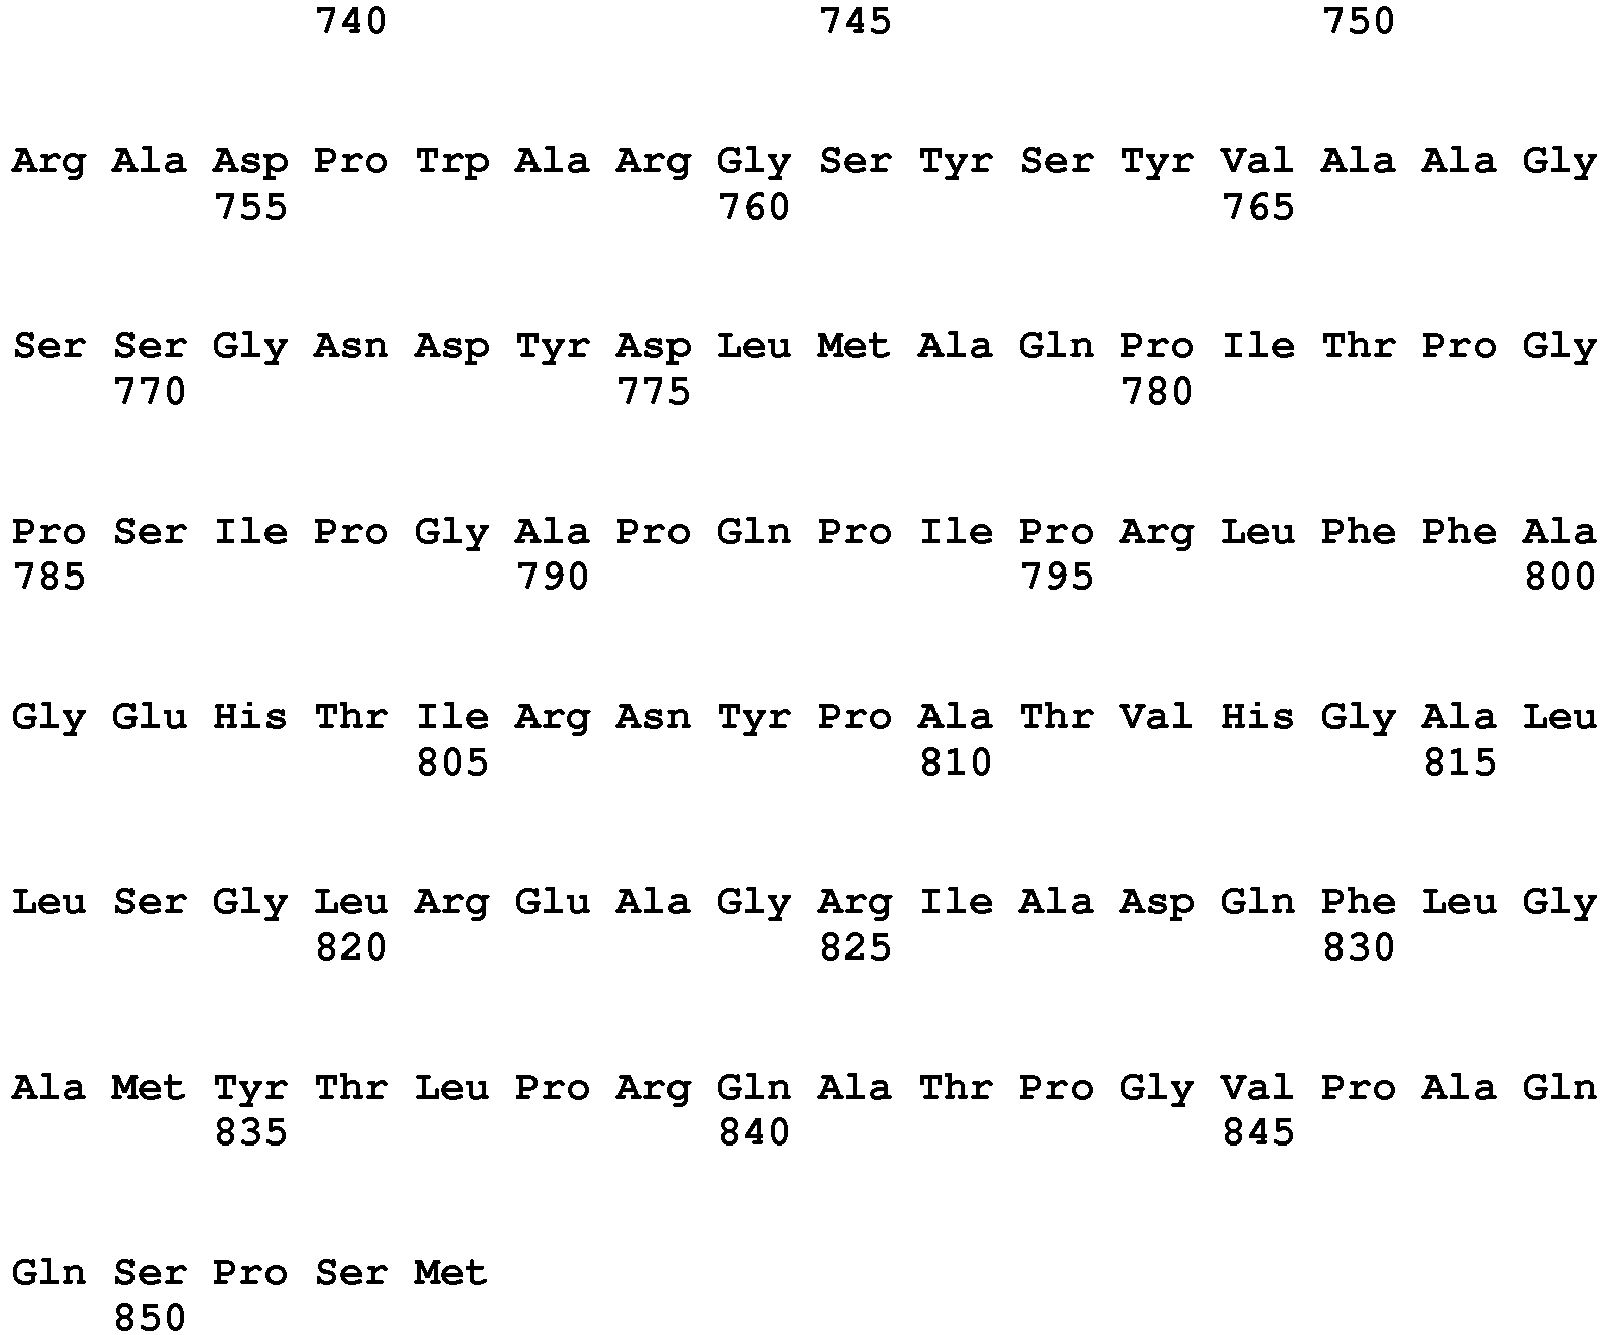
- <210> 6
<211> 8717
<212> DNA
<213> artificial sequence - <220>
<223> pBS-ROSA26-AOF2 - <220>
<221> promoter
<222> (625)..(645)
<223> T7 promoter - <220>
<221> misc_feature
<222> (1018)..(1381)
<223> HS4 insulator - <220>
<221> promoter
<222> (1414)..(2225)
<223> ROSA26 promoter - <220>
<221> Intron
<222> (2311)..(2878)
<223> rabbit beta-globin intron - <220>
<221> misc_feature
<222> (3079)..(3106)
<223> sequence encoding FLAG tag - <220>
<221> CDS
<222> (3079)..(5667) - <220>
<221> misc_feature
<222> (3112)..(5667)
<223> seqence encoding human LSD1 - <220>
<221> polyA_site
<222> (5686)..(5819)
<223> SV40 poly A site - <220>
<221> misc_feature
<222> (5896)..(6434)
<223> HS4 insulator - <220>
<221> misc_feature
<222> (6914)..(7581)
<223> pUC origin - <220>
<221> misc_feature
<222> (8589)..(7729)
<223> sequence encoding beta-lactamase - <400> 6


- <210> 7
<211> 862
<212> PRT
<213> artificial sequence - <220>
<223> Synthetic Construct - <400> 7


Claims (8)
- The use of a modified non-human mammal as an animal model for obesity or obesity-related disorders, wherein the modified non-human mammal (i) is heterozygous for the disruption of the gene encoding LSD1 or (ii) has a deletion of the gene encoding LSD1, said deletion being limited to adipose tissue, wherein said obesity-related disorder is selected from the group consisting of insulin resistance, type II diabetes, fatty liver, non-alcoholic fatty liver disease, endocrine abnormalities and triglyceride storage disease.
- The use of claim 1, wherein the genetically modified non-human mammal has a nucleic acid inserted in its genome, wherein the presence of the inserted nucleic acid in the genome of the mammal results in reduced expression of LSD1.
- The use of claim 1 or 2, wherein said genetic modification is a disruption of an allele of the endogenous gene encoding LSD1.
- The use of any one of the preceding claims, wherein the amount of LSD1 is reduced in tissue of said mammal, preferably in adipose, liver or muscle of said mammal.
- The use of any one of the preceding claims, wherein said mammal develops obesity after high fat diet.
- The use of any one of the preceding claims, wherein said mammal has at least one symptom of type 2 diabetes.
- The use of any one of the preceding claims, wherein the mammal is a rodent, preferably a mouse.
- A method for identifying a compound useful in the treatment and/or prevention of obesity or an obesity-related disorder, comprising (a) administering a test compound to a transgenic mammal or rodent as defined in any one of claims 1 to 7, and (b) determining the effect of the test compound on the initiation, maintenance, or progression of at least one obesity-related parameter in said transgenic mammal or rodent, thereby identifying a compound that inhibits obesity or an obesity-related disorder,
wherein said obesity-related disorder is selected from the group consisting of insulin resistance, type II diabetes, fatty liver, non-alcoholic fatty liver disease, endocrine abnormalities and triglyceride storage disease;
and wherein said obesity-related parameter is selected from the group consisting of the mass of white adipose tissue, the total mass of adipose tissue, glucose intolerance, and expression of a adipose tissue differentiation marker.
Priority Applications (1)
| Application Number | Priority Date | Filing Date | Title |
|---|---|---|---|
| EP13785854.4A EP2914101B1 (en) | 2012-10-31 | 2013-10-31 | Animal model for type 2 diabetes and obesity |
Applications Claiming Priority (3)
| Application Number | Priority Date | Filing Date | Title |
|---|---|---|---|
| EP12007446.3A EP2727465A1 (en) | 2012-10-31 | 2012-10-31 | Animal model for type 2 diabetes and obesity |
| EP13785854.4A EP2914101B1 (en) | 2012-10-31 | 2013-10-31 | Animal model for type 2 diabetes and obesity |
| PCT/EP2013/072772 WO2014068033A2 (en) | 2012-10-31 | 2013-10-31 | Animal model for type 2 diabetes and obesity |
Publications (2)
| Publication Number | Publication Date |
|---|---|
| EP2914101A2 EP2914101A2 (en) | 2015-09-09 |
| EP2914101B1 true EP2914101B1 (en) | 2018-12-12 |
Family
ID=47142882
Family Applications (2)
| Application Number | Title | Priority Date | Filing Date |
|---|---|---|---|
| EP12007446.3A Withdrawn EP2727465A1 (en) | 2012-10-31 | 2012-10-31 | Animal model for type 2 diabetes and obesity |
| EP13785854.4A Active EP2914101B1 (en) | 2012-10-31 | 2013-10-31 | Animal model for type 2 diabetes and obesity |
Family Applications Before (1)
| Application Number | Title | Priority Date | Filing Date |
|---|---|---|---|
| EP12007446.3A Withdrawn EP2727465A1 (en) | 2012-10-31 | 2012-10-31 | Animal model for type 2 diabetes and obesity |
Country Status (3)
| Country | Link |
|---|---|
| US (1) | US10299467B2 (en) |
| EP (2) | EP2727465A1 (en) |
| WO (1) | WO2014068033A2 (en) |
Families Citing this family (8)
| Publication number | Priority date | Publication date | Assignee | Title |
|---|---|---|---|---|
| JP6473152B2 (en) | 2013-11-20 | 2019-02-20 | オハイオ・ステイト・イノベーション・ファウンデーション | HDAC inhibitors for suppressing cancer-related cachexia |
| CN105400732A (en) * | 2015-11-19 | 2016-03-16 | 南京理工大学 | Establishment method for alcoholic fatty liver zebra fish model |
| CN106190953B (en) * | 2016-07-25 | 2019-12-10 | 华南理工大学 | Hyperuricemia cell model, construction method thereof and application of hyperuricemia cell model in aspect of uric acid reduction efficacy evaluation |
| CN106190954B (en) * | 2016-07-25 | 2019-12-10 | 华南理工大学 | Hyperuricemia hepatocyte model and construction method thereof |
| US12270042B2 (en) | 2018-01-31 | 2025-04-08 | The Jackson Laboratory | Methods for preventing and treating type II diabetes |
| WO2020152280A1 (en) * | 2019-01-24 | 2020-07-30 | Fundación Pública Andaluza Progreso Y Salud | Lsd1 inhibitors for use in the treatment of type 2 diabetes |
| CN117965621B (en) * | 2023-06-19 | 2025-06-06 | 上海慧福德生物科技有限公司 | A method for preparing a weight-increasing strain of the bright-spotted flathorn soldier fly and its nucleic acid construct |
| CN117065028B (en) * | 2023-08-17 | 2026-04-24 | 赣南创新与转化医学研究院 | Application of substances that reduce KDM1A content or activity in the preparation of products for the treatment of non-alcoholic fatty liver disease and related diseases. |
Family Cites Families (2)
| Publication number | Priority date | Publication date | Assignee | Title |
|---|---|---|---|---|
| EP2258858A1 (en) | 2009-06-05 | 2010-12-08 | Universitätsklinikum Freiburg | Transgenic LSD1 animal model for cancer |
| US20140296255A1 (en) * | 2011-05-19 | 2014-10-02 | Oryzong Genomics, S.A. | Lysine demethylase inhibitors for thrombosis and cardiovascular diseases |
-
2012
- 2012-10-31 EP EP12007446.3A patent/EP2727465A1/en not_active Withdrawn
-
2013
- 2013-10-31 US US14/439,609 patent/US10299467B2/en active Active
- 2013-10-31 EP EP13785854.4A patent/EP2914101B1/en active Active
- 2013-10-31 WO PCT/EP2013/072772 patent/WO2014068033A2/en not_active Ceased
Non-Patent Citations (1)
| Title |
|---|
| None * |
Also Published As
| Publication number | Publication date |
|---|---|
| WO2014068033A3 (en) | 2014-09-04 |
| WO2014068033A2 (en) | 2014-05-08 |
| EP2727465A1 (en) | 2014-05-07 |
| US10299467B2 (en) | 2019-05-28 |
| EP2914101A2 (en) | 2015-09-09 |
| US20150296757A1 (en) | 2015-10-22 |
Similar Documents
| Publication | Publication Date | Title |
|---|---|---|
| EP2914101B1 (en) | Animal model for type 2 diabetes and obesity | |
| Stine et al. | EBF2 promotes the recruitment of beige adipocytes in white adipose tissue | |
| Guo et al. | Adipocyte ALK7 links nutrient overload to catecholamine resistance in obesity | |
| Mikula et al. | Embryonic lethality and fetal liver apoptosis in mice lacking the c‐raf‐1 gene | |
| Lin et al. | Foxa1 and Foxa2 function both upstream of and cooperatively with Lmx1a and Lmx1b in a feedforward loop promoting mesodiencephalic dopaminergic neuron development | |
| Sun et al. | Acute myeloid leukemia-associated Mkl1 (Mrtf-a) is a key regulator of mammary gland function | |
| Skovsø et al. | Beta-cell specific Insr deletion promotes insulin hypersecretion and improves glucose tolerance prior to global insulin resistance | |
| Verma et al. | The estrogen-responsive Agr2 gene regulates mammary epithelial proliferation and facilitates lobuloalveolar development | |
| Kitagawa et al. | Phf14, a novel regulator of mesenchyme growth via platelet-derived growth factor (PDGF) receptor-α | |
| Lee et al. | Mll3/MLL4-associated PAGR1 regulates adipogenesis by controlling induction of C/EBP β and C/EBP δ | |
| Jia et al. | Early embryonic lethality of mice with disrupted transcription cofactor PIMT/NCOA6IP/Tgs1 gene | |
| Kantarci et al. | The Warburg Effect and lactate signaling augment Fgf-MAPK to promote sensory-neural development in the otic vesicle | |
| Yang et al. | Krüppel-like factor 10 upregulates the expression of cyclooxygenase 1 and further modulates angiogenesis in endothelial cell and platelet aggregation in gene-deficient mice | |
| Zhou et al. | Osr2 acts downstream of Pax9 and interacts with both Msx1 and Pax9 to pattern the tooth developmental field | |
| Cox et al. | Ube2i deletion in adipocytes causes lipoatrophy in mice | |
| Ji et al. | Mesodermal and neuronal retinoids regulate the induction and maintenance of limb innervating spinal motor neurons | |
| Charrier et al. | Adipocyte-specific deletion of zinc finger protein 407 results in lipodystrophy and insulin resistance in mice | |
| Zhou et al. | NR2F6 is essential for brown adipocyte differentiation and systemic metabolic homeostasis | |
| Alimujiang et al. | Survivin is essential for thermogenic program and metabolic homeostasis in mice | |
| US20120096568A1 (en) | Transgenic lsd1 animal model for cancer | |
| Herzog et al. | TIF1β association with HP1 is essential for post-gastrulation development, but not for Sertoli cell functions during spermatogenesis | |
| US20110035815A1 (en) | Mosaic knockout mouse tumor models and methods or use | |
| JP6825910B2 (en) | Flattop (Fltp) is a novel biomarker for β-cell maturation | |
| KR101894670B1 (en) | Method of screening agents for treating disorder related to dysregulation of hepatic lipid metabolism through inhibition of PPARγ-mediated transcription | |
| Kotikalapudi et al. | Acute regulation of murine adipose tissue lipolysis and insulin resistance by the TGFβ superfamily protein GDF3 |
Legal Events
| Date | Code | Title | Description |
|---|---|---|---|
| PUAI | Public reference made under article 153(3) epc to a published international application that has entered the european phase |
Free format text: ORIGINAL CODE: 0009012 |
|
| 17P | Request for examination filed |
Effective date: 20150424 |
|
| AK | Designated contracting states |
Kind code of ref document: A2 Designated state(s): AL AT BE BG CH CY CZ DE DK EE ES FI FR GB GR HR HU IE IS IT LI LT LU LV MC MK MT NL NO PL PT RO RS SE SI SK SM TR |
|
| AX | Request for extension of the european patent |
Extension state: BA ME |
|
| RIN1 | Information on inventor provided before grant (corrected) |
Inventor name: SCHUELE, ROLAND Inventor name: DUTEIL, DELPHINE Inventor name: GUENTHER, THOMAS Inventor name: METZGER, ERIC |
|
| DAX | Request for extension of the european patent (deleted) | ||
| STAA | Information on the status of an ep patent application or granted ep patent |
Free format text: STATUS: EXAMINATION IS IN PROGRESS |
|
| 17Q | First examination report despatched |
Effective date: 20161128 |
|
| GRAP | Despatch of communication of intention to grant a patent |
Free format text: ORIGINAL CODE: EPIDOSNIGR1 |
|
| STAA | Information on the status of an ep patent application or granted ep patent |
Free format text: STATUS: GRANT OF PATENT IS INTENDED |
|
| GRAJ | Information related to disapproval of communication of intention to grant by the applicant or resumption of examination proceedings by the epo deleted |
Free format text: ORIGINAL CODE: EPIDOSDIGR1 |
|
| STAA | Information on the status of an ep patent application or granted ep patent |
Free format text: STATUS: EXAMINATION IS IN PROGRESS |
|
| GRAJ | Information related to disapproval of communication of intention to grant by the applicant or resumption of examination proceedings by the epo deleted |
Free format text: ORIGINAL CODE: EPIDOSDIGR1 |
|
| GRAP | Despatch of communication of intention to grant a patent |
Free format text: ORIGINAL CODE: EPIDOSNIGR1 |
|
| GRAP | Despatch of communication of intention to grant a patent |
Free format text: ORIGINAL CODE: EPIDOSNIGR1 |
|
| STAA | Information on the status of an ep patent application or granted ep patent |
Free format text: STATUS: GRANT OF PATENT IS INTENDED |
|
| INTG | Intention to grant announced |
Effective date: 20180604 |
|
| INTC | Intention to grant announced (deleted) | ||
| INTG | Intention to grant announced |
Effective date: 20180703 |
|
| GRAS | Grant fee paid |
Free format text: ORIGINAL CODE: EPIDOSNIGR3 |
|
| GRAA | (expected) grant |
Free format text: ORIGINAL CODE: 0009210 |
|
| STAA | Information on the status of an ep patent application or granted ep patent |
Free format text: STATUS: THE PATENT HAS BEEN GRANTED |
|
| AK | Designated contracting states |
Kind code of ref document: B1 Designated state(s): AL AT BE BG CH CY CZ DE DK EE ES FI FR GB GR HR HU IE IS IT LI LT LU LV MC MK MT NL NO PL PT RO RS SE SI SK SM TR |
|
| REG | Reference to a national code |
Ref country code: GB Ref legal event code: FG4D |
|
| REG | Reference to a national code |
Ref country code: CH Ref legal event code: EP |
|
| REG | Reference to a national code |
Ref country code: AT Ref legal event code: REF Ref document number: 1074791 Country of ref document: AT Kind code of ref document: T Effective date: 20181215 |
|
| REG | Reference to a national code |
Ref country code: DE Ref legal event code: R096 Ref document number: 602013048169 Country of ref document: DE |
|
| REG | Reference to a national code |
Ref country code: IE Ref legal event code: FG4D |
|
| REG | Reference to a national code |
Ref country code: NL Ref legal event code: MP Effective date: 20181212 |
|
| REG | Reference to a national code |
Ref country code: LT Ref legal event code: MG4D |
|
| PG25 | Lapsed in a contracting state [announced via postgrant information from national office to epo] |
Ref country code: HR Free format text: LAPSE BECAUSE OF FAILURE TO SUBMIT A TRANSLATION OF THE DESCRIPTION OR TO PAY THE FEE WITHIN THE PRESCRIBED TIME-LIMIT Effective date: 20181212 Ref country code: LT Free format text: LAPSE BECAUSE OF FAILURE TO SUBMIT A TRANSLATION OF THE DESCRIPTION OR TO PAY THE FEE WITHIN THE PRESCRIBED TIME-LIMIT Effective date: 20181212 Ref country code: ES Free format text: LAPSE BECAUSE OF FAILURE TO SUBMIT A TRANSLATION OF THE DESCRIPTION OR TO PAY THE FEE WITHIN THE PRESCRIBED TIME-LIMIT Effective date: 20181212 Ref country code: FI Free format text: LAPSE BECAUSE OF FAILURE TO SUBMIT A TRANSLATION OF THE DESCRIPTION OR TO PAY THE FEE WITHIN THE PRESCRIBED TIME-LIMIT Effective date: 20181212 Ref country code: BG Free format text: LAPSE BECAUSE OF FAILURE TO SUBMIT A TRANSLATION OF THE DESCRIPTION OR TO PAY THE FEE WITHIN THE PRESCRIBED TIME-LIMIT Effective date: 20190312 Ref country code: LV Free format text: LAPSE BECAUSE OF FAILURE TO SUBMIT A TRANSLATION OF THE DESCRIPTION OR TO PAY THE FEE WITHIN THE PRESCRIBED TIME-LIMIT Effective date: 20181212 Ref country code: NO Free format text: LAPSE BECAUSE OF FAILURE TO SUBMIT A TRANSLATION OF THE DESCRIPTION OR TO PAY THE FEE WITHIN THE PRESCRIBED TIME-LIMIT Effective date: 20190312 |
|
| REG | Reference to a national code |
Ref country code: AT Ref legal event code: MK05 Ref document number: 1074791 Country of ref document: AT Kind code of ref document: T Effective date: 20181212 |
|
| PG25 | Lapsed in a contracting state [announced via postgrant information from national office to epo] |
Ref country code: RS Free format text: LAPSE BECAUSE OF FAILURE TO SUBMIT A TRANSLATION OF THE DESCRIPTION OR TO PAY THE FEE WITHIN THE PRESCRIBED TIME-LIMIT Effective date: 20181212 Ref country code: GR Free format text: LAPSE BECAUSE OF FAILURE TO SUBMIT A TRANSLATION OF THE DESCRIPTION OR TO PAY THE FEE WITHIN THE PRESCRIBED TIME-LIMIT Effective date: 20190313 Ref country code: AL Free format text: LAPSE BECAUSE OF FAILURE TO SUBMIT A TRANSLATION OF THE DESCRIPTION OR TO PAY THE FEE WITHIN THE PRESCRIBED TIME-LIMIT Effective date: 20181212 Ref country code: SE Free format text: LAPSE BECAUSE OF FAILURE TO SUBMIT A TRANSLATION OF THE DESCRIPTION OR TO PAY THE FEE WITHIN THE PRESCRIBED TIME-LIMIT Effective date: 20181212 |
|
| PG25 | Lapsed in a contracting state [announced via postgrant information from national office to epo] |
Ref country code: NL Free format text: LAPSE BECAUSE OF FAILURE TO SUBMIT A TRANSLATION OF THE DESCRIPTION OR TO PAY THE FEE WITHIN THE PRESCRIBED TIME-LIMIT Effective date: 20181212 |
|
| PG25 | Lapsed in a contracting state [announced via postgrant information from national office to epo] |
Ref country code: PL Free format text: LAPSE BECAUSE OF FAILURE TO SUBMIT A TRANSLATION OF THE DESCRIPTION OR TO PAY THE FEE WITHIN THE PRESCRIBED TIME-LIMIT Effective date: 20181212 Ref country code: PT Free format text: LAPSE BECAUSE OF FAILURE TO SUBMIT A TRANSLATION OF THE DESCRIPTION OR TO PAY THE FEE WITHIN THE PRESCRIBED TIME-LIMIT Effective date: 20190412 Ref country code: CZ Free format text: LAPSE BECAUSE OF FAILURE TO SUBMIT A TRANSLATION OF THE DESCRIPTION OR TO PAY THE FEE WITHIN THE PRESCRIBED TIME-LIMIT Effective date: 20181212 Ref country code: IT Free format text: LAPSE BECAUSE OF FAILURE TO SUBMIT A TRANSLATION OF THE DESCRIPTION OR TO PAY THE FEE WITHIN THE PRESCRIBED TIME-LIMIT Effective date: 20181212 |
|
| PG25 | Lapsed in a contracting state [announced via postgrant information from national office to epo] |
Ref country code: SK Free format text: LAPSE BECAUSE OF FAILURE TO SUBMIT A TRANSLATION OF THE DESCRIPTION OR TO PAY THE FEE WITHIN THE PRESCRIBED TIME-LIMIT Effective date: 20181212 Ref country code: EE Free format text: LAPSE BECAUSE OF FAILURE TO SUBMIT A TRANSLATION OF THE DESCRIPTION OR TO PAY THE FEE WITHIN THE PRESCRIBED TIME-LIMIT Effective date: 20181212 Ref country code: SM Free format text: LAPSE BECAUSE OF FAILURE TO SUBMIT A TRANSLATION OF THE DESCRIPTION OR TO PAY THE FEE WITHIN THE PRESCRIBED TIME-LIMIT Effective date: 20181212 Ref country code: IS Free format text: LAPSE BECAUSE OF FAILURE TO SUBMIT A TRANSLATION OF THE DESCRIPTION OR TO PAY THE FEE WITHIN THE PRESCRIBED TIME-LIMIT Effective date: 20190412 Ref country code: RO Free format text: LAPSE BECAUSE OF FAILURE TO SUBMIT A TRANSLATION OF THE DESCRIPTION OR TO PAY THE FEE WITHIN THE PRESCRIBED TIME-LIMIT Effective date: 20181212 |
|
| REG | Reference to a national code |
Ref country code: DE Ref legal event code: R097 Ref document number: 602013048169 Country of ref document: DE |
|
| PLBE | No opposition filed within time limit |
Free format text: ORIGINAL CODE: 0009261 |
|
| STAA | Information on the status of an ep patent application or granted ep patent |
Free format text: STATUS: NO OPPOSITION FILED WITHIN TIME LIMIT |
|
| PG25 | Lapsed in a contracting state [announced via postgrant information from national office to epo] |
Ref country code: SI Free format text: LAPSE BECAUSE OF FAILURE TO SUBMIT A TRANSLATION OF THE DESCRIPTION OR TO PAY THE FEE WITHIN THE PRESCRIBED TIME-LIMIT Effective date: 20181212 Ref country code: AT Free format text: LAPSE BECAUSE OF FAILURE TO SUBMIT A TRANSLATION OF THE DESCRIPTION OR TO PAY THE FEE WITHIN THE PRESCRIBED TIME-LIMIT Effective date: 20181212 Ref country code: DK Free format text: LAPSE BECAUSE OF FAILURE TO SUBMIT A TRANSLATION OF THE DESCRIPTION OR TO PAY THE FEE WITHIN THE PRESCRIBED TIME-LIMIT Effective date: 20181212 |
|
| 26N | No opposition filed |
Effective date: 20190913 |
|
| PG25 | Lapsed in a contracting state [announced via postgrant information from national office to epo] |
Ref country code: TR Free format text: LAPSE BECAUSE OF FAILURE TO SUBMIT A TRANSLATION OF THE DESCRIPTION OR TO PAY THE FEE WITHIN THE PRESCRIBED TIME-LIMIT Effective date: 20181212 |
|
| PG25 | Lapsed in a contracting state [announced via postgrant information from national office to epo] |
Ref country code: MC Free format text: LAPSE BECAUSE OF FAILURE TO SUBMIT A TRANSLATION OF THE DESCRIPTION OR TO PAY THE FEE WITHIN THE PRESCRIBED TIME-LIMIT Effective date: 20181212 |
|
| PG25 | Lapsed in a contracting state [announced via postgrant information from national office to epo] |
Ref country code: LU Free format text: LAPSE BECAUSE OF NON-PAYMENT OF DUE FEES Effective date: 20191031 |
|
| REG | Reference to a national code |
Ref country code: BE Ref legal event code: MM Effective date: 20191031 |
|
| PG25 | Lapsed in a contracting state [announced via postgrant information from national office to epo] |
Ref country code: BE Free format text: LAPSE BECAUSE OF NON-PAYMENT OF DUE FEES Effective date: 20191031 |
|
| PG25 | Lapsed in a contracting state [announced via postgrant information from national office to epo] |
Ref country code: CY Free format text: LAPSE BECAUSE OF FAILURE TO SUBMIT A TRANSLATION OF THE DESCRIPTION OR TO PAY THE FEE WITHIN THE PRESCRIBED TIME-LIMIT Effective date: 20181212 |
|
| PG25 | Lapsed in a contracting state [announced via postgrant information from national office to epo] |
Ref country code: HU Free format text: LAPSE BECAUSE OF FAILURE TO SUBMIT A TRANSLATION OF THE DESCRIPTION OR TO PAY THE FEE WITHIN THE PRESCRIBED TIME-LIMIT; INVALID AB INITIO Effective date: 20131031 Ref country code: MT Free format text: LAPSE BECAUSE OF FAILURE TO SUBMIT A TRANSLATION OF THE DESCRIPTION OR TO PAY THE FEE WITHIN THE PRESCRIBED TIME-LIMIT Effective date: 20181212 |
|
| PG25 | Lapsed in a contracting state [announced via postgrant information from national office to epo] |
Ref country code: MK Free format text: LAPSE BECAUSE OF FAILURE TO SUBMIT A TRANSLATION OF THE DESCRIPTION OR TO PAY THE FEE WITHIN THE PRESCRIBED TIME-LIMIT Effective date: 20181212 |
|
| PGFP | Annual fee paid to national office [announced via postgrant information from national office to epo] |
Ref country code: FR Payment date: 20221020 Year of fee payment: 10 |
|
| PGFP | Annual fee paid to national office [announced via postgrant information from national office to epo] |
Ref country code: IE Payment date: 20221021 Year of fee payment: 10 Ref country code: GB Payment date: 20221024 Year of fee payment: 10 Ref country code: DE Payment date: 20221020 Year of fee payment: 10 |
|
| PGFP | Annual fee paid to national office [announced via postgrant information from national office to epo] |
Ref country code: CH Payment date: 20221027 Year of fee payment: 10 |
|
| REG | Reference to a national code |
Ref country code: DE Ref legal event code: R119 Ref document number: 602013048169 Country of ref document: DE |
|
| REG | Reference to a national code |
Ref country code: CH Ref legal event code: PL |
|
| GBPC | Gb: european patent ceased through non-payment of renewal fee |
Effective date: 20231031 |
|
| PG25 | Lapsed in a contracting state [announced via postgrant information from national office to epo] |
Ref country code: GB Free format text: LAPSE BECAUSE OF NON-PAYMENT OF DUE FEES Effective date: 20231031 |
|
| PG25 | Lapsed in a contracting state [announced via postgrant information from national office to epo] |
Ref country code: CH Free format text: LAPSE BECAUSE OF NON-PAYMENT OF DUE FEES Effective date: 20231031 |
|
| PG25 | Lapsed in a contracting state [announced via postgrant information from national office to epo] |
Ref country code: GB Free format text: LAPSE BECAUSE OF NON-PAYMENT OF DUE FEES Effective date: 20231031 Ref country code: FR Free format text: LAPSE BECAUSE OF NON-PAYMENT OF DUE FEES Effective date: 20231031 Ref country code: DE Free format text: LAPSE BECAUSE OF NON-PAYMENT OF DUE FEES Effective date: 20240501 Ref country code: CH Free format text: LAPSE BECAUSE OF NON-PAYMENT OF DUE FEES Effective date: 20231031 |
|
| PG25 | Lapsed in a contracting state [announced via postgrant information from national office to epo] |
Ref country code: IE Free format text: LAPSE BECAUSE OF NON-PAYMENT OF DUE FEES Effective date: 20231031 |
|
| PG25 | Lapsed in a contracting state [announced via postgrant information from national office to epo] |
Ref country code: IE Free format text: LAPSE BECAUSE OF NON-PAYMENT OF DUE FEES Effective date: 20231031 |