EP2913002A1 - Elektrische impedanzmessvorrichtung - Google Patents
Elektrische impedanzmessvorrichtung Download PDFInfo
- Publication number
- EP2913002A1 EP2913002A1 EP15155944.0A EP15155944A EP2913002A1 EP 2913002 A1 EP2913002 A1 EP 2913002A1 EP 15155944 A EP15155944 A EP 15155944A EP 2913002 A1 EP2913002 A1 EP 2913002A1
- Authority
- EP
- European Patent Office
- Prior art keywords
- impedance
- measuring apparatus
- rois
- histogram
- displayed
- Prior art date
- Legal status (The legal status is an assumption and is not a legal conclusion. Google has not performed a legal analysis and makes no representation as to the accuracy of the status listed.)
- Withdrawn
Links
Images


Classifications
-
- A—HUMAN NECESSITIES
- A61—MEDICAL OR VETERINARY SCIENCE; HYGIENE
- A61B—DIAGNOSIS; SURGERY; IDENTIFICATION
- A61B5/00—Measuring for diagnostic purposes; Identification of persons
- A61B5/05—Detecting, measuring or recording for diagnosis by means of electric currents or magnetic fields; Measuring using microwaves or radio waves
- A61B5/053—Measuring electrical impedance or conductance of a portion of the body
- A61B5/0536—Impedance imaging, e.g. by tomography
-
- A—HUMAN NECESSITIES
- A61—MEDICAL OR VETERINARY SCIENCE; HYGIENE
- A61B—DIAGNOSIS; SURGERY; IDENTIFICATION
- A61B5/00—Measuring for diagnostic purposes; Identification of persons
- A61B5/0033—Features or image-related aspects of imaging apparatus, e.g. for MRI, optical tomography or impedance tomography apparatus; Arrangements of imaging apparatus in a room
- A61B5/004—Features or image-related aspects of imaging apparatus, e.g. for MRI, optical tomography or impedance tomography apparatus; Arrangements of imaging apparatus in a room adapted for image acquisition of a particular organ or body part
-
- A—HUMAN NECESSITIES
- A61—MEDICAL OR VETERINARY SCIENCE; HYGIENE
- A61B—DIAGNOSIS; SURGERY; IDENTIFICATION
- A61B5/00—Measuring for diagnostic purposes; Identification of persons
- A61B5/08—Measuring devices for evaluating the respiratory organs
- A61B5/085—Measuring impedance of respiratory organs or lung elasticity
- A61B5/086—Measuring impedance of respiratory organs or lung elasticity by impedance pneumography
-
- A—HUMAN NECESSITIES
- A61—MEDICAL OR VETERINARY SCIENCE; HYGIENE
- A61B—DIAGNOSIS; SURGERY; IDENTIFICATION
- A61B5/00—Measuring for diagnostic purposes; Identification of persons
- A61B5/68—Arrangements of detecting, measuring or recording means, e.g. sensors, in relation to patient
- A61B5/6801—Arrangements of detecting, measuring or recording means, e.g. sensors, in relation to patient specially adapted to be attached to or worn on the body surface
- A61B5/6813—Specially adapted to be attached to a specific body part
- A61B5/6823—Trunk, e.g., chest, back, abdomen, hip
-
- A—HUMAN NECESSITIES
- A61—MEDICAL OR VETERINARY SCIENCE; HYGIENE
- A61B—DIAGNOSIS; SURGERY; IDENTIFICATION
- A61B5/00—Measuring for diagnostic purposes; Identification of persons
- A61B5/74—Details of notification to user or communication with user or patient; User input means
- A61B5/742—Details of notification to user or communication with user or patient; User input means using visual displays
- A61B5/743—Displaying an image simultaneously with additional graphical information, e.g. symbols, charts, function plots
-
- A—HUMAN NECESSITIES
- A61—MEDICAL OR VETERINARY SCIENCE; HYGIENE
- A61B—DIAGNOSIS; SURGERY; IDENTIFICATION
- A61B5/00—Measuring for diagnostic purposes; Identification of persons
- A61B5/74—Details of notification to user or communication with user or patient; User input means
- A61B5/7475—User input or interface means, e.g. keyboard, pointing device, joystick
- A61B5/748—Selection of a region of interest, e.g. using a graphics tablet
- A61B5/7485—Automatic selection of region of interest
-
- A—HUMAN NECESSITIES
- A61—MEDICAL OR VETERINARY SCIENCE; HYGIENE
- A61B—DIAGNOSIS; SURGERY; IDENTIFICATION
- A61B2562/00—Details of sensors; Constructional details of sensor housings or probes; Accessories for sensors
- A61B2562/02—Details of sensors specially adapted for in-vivo measurements
- A61B2562/0209—Special features of electrodes classified in A61B5/24, A61B5/25, A61B5/283, A61B5/291, A61B5/296, A61B5/053
- A61B2562/0214—Capacitive electrodes
-
- A—HUMAN NECESSITIES
- A61—MEDICAL OR VETERINARY SCIENCE; HYGIENE
- A61B—DIAGNOSIS; SURGERY; IDENTIFICATION
- A61B2562/00—Details of sensors; Constructional details of sensor housings or probes; Accessories for sensors
- A61B2562/04—Arrangements of multiple sensors of the same type
- A61B2562/046—Arrangements of multiple sensors of the same type in a matrix array
-
- A—HUMAN NECESSITIES
- A61—MEDICAL OR VETERINARY SCIENCE; HYGIENE
- A61B—DIAGNOSIS; SURGERY; IDENTIFICATION
- A61B2576/00—Medical imaging apparatus involving image processing or analysis
- A61B2576/02—Medical imaging apparatus involving image processing or analysis specially adapted for a particular organ or body part
-
- A—HUMAN NECESSITIES
- A61—MEDICAL OR VETERINARY SCIENCE; HYGIENE
- A61B—DIAGNOSIS; SURGERY; IDENTIFICATION
- A61B5/00—Measuring for diagnostic purposes; Identification of persons
- A61B5/0033—Features or image-related aspects of imaging apparatus, e.g. for MRI, optical tomography or impedance tomography apparatus; Arrangements of imaging apparatus in a room
- A61B5/0037—Performing a preliminary scan, e.g. a prescan for identifying a region of interest
Definitions
- the presently disclosed subject matter relates to an electrical impedance measuring apparatus which is called the EIT (Electrical Impedance Tomography) or the like.
- the impedance distribution of the chest is continuously displayed as a tomographic image, or, in place of or together with the tomographic image, an impedance variation waveform is displayed.
- an impedance variation waveform is displayed in the EIT.
- ARDS acute Respiratory Distress Syndrome
- the EIT images show the aerated state of the lungs.
- the state where aeration spreads over not only the ventral side but also the dorsal side is used as an index indicating a good state.
- the presently disclosed subject matter may provide an electrical impedance measuring apparatus having a configuration which enables the spread of aeration from the ventral side to the dorsal side to be adequately known.
- the electrical impedance measuring apparatus may comprise: a plurality of electrodes which are adapted to be adhered to a periphery of a chest of a living body; a potential measurer which is configured to perform a process of applying a current to any ones of the electrodes, and measuring potentials by means of other electrodes, on all of the electrodes while changing the electrodes to which the current is to be applied; an impedance acquirer which, based on the applied current and the potentials measured by the potential measurer, is configured to obtain an impedance of each of meshes, a chest section divided into the meshes; a histogram producer which is configured to set, in the chest section, at least one ROI including from a ventral side to a dorsal side, and which is configured to obtain a histogram of an impedance distribution in the ROI; and a producer which is configured to produce a color impedance distribution map in which amplitudes of the histogram are replaced with corresponding colors.
- the histogram producer may obtain a normalized histogram, and the producer may produce a color impedance distribution map in which amplitudes of the normalized histogram are replaced with corresponding colors.
- the electrical impedance measuring apparatus may further comprise: a display controller which is configured to cause the color impedance distribution map to be displayed.
- the display controller may further cause the histogram of the impedance distribution to be displayed.
- the display controller may cause color impedance distribution maps to be displayed while being arranged in a direction of a time axis.
- the histogram producer may set two ROIs, a lung field laterally segmented into the ROIs, and obtain histograms of impedance distributions in the ROIs, and the producer may produce color impedance distribution maps in which amplitudes of the histograms of the impedance distributions are replaced with corresponding colors.
- the electrical impedance measuring apparatus may further comprise: a centroid calculator which is configured to obtain a centroid of the impedance distribution in the ROI.
- the display controller causes the centroid to be displayed.
- the electrical impedance measuring apparatus may further comprise: a curve producer which is configured to produce a displacement curve of a centroid, the displacement curve connecting together centroids of impedance distributions that vary with time in the ROI.
- the display controller may cause the displacement curve to be displayed.
- the centroid calculator may set two ROIs, a lung field laterally segmented into the ROIs, and further obtain centroids of impedance distributions in the ROIs, and the display controller may cause the centroids to be displayed.
- the curve producer may set two ROIs, a lung field laterally segmented into the ROIs, and further obtain displacement curves of centroids, the displacement curves connecting together centroids of impedance distributions that vary with time in the ROIs, and the display controller may cause the displacement curves to be displayed.
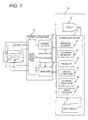
- Fig. 1 is a diagram of the embodiment of the electrical impedance measuring apparatus of the presently disclosed subject matter.
- the electrical impedance measuring apparatus mainly includes a plurality of electrodes 111 to 11n, a potential measurer 20, and a computer 30.
- the plurality of electrodes 111 to 11n are to be adhered to the periphery of the chest of the living body. For example, a necessary number of electrodes are used at the same height and at regular intervals.
- the potential measurer 20 includes a current applier 21, a measurer 22, an electrode selector 23, and a controller 24. Based on the control of the controller 24, the current applier 21 applies a current to electrode pairs which are connected to the current applier 21 via the electrode selector 23.
- the measurer 22 measures potentials produced in the electrode pairs, based on the control of the controller 24.
- the electrode selector 23 connects the first electrode pair to which the current is to be applied, to the current applier 21, and the electrode pairs which are not connected to the current applier 21, to the measurer 22, so that the potential can be measured under this state. Then, the potential measurement is performed. Next, the electrode pair which is connected to the measurer 22 is changed to another pair so that the potential can be measured. Then, the potential measurement is performed. Thereafter, the all electrode pairs other than the first electrode pair to which the current is applied are sequentially connected to the measurer 22, and subjected to the potential measurement.
- the electrode selector 23 connects the second electrode pair to which the current is to be applied, to the current applier 21, and the electrode pairs which are not connected to the current applier 21, to the measurer 22, so that the potential can be measured under this state. Then, the potential measurement is performed. Thereafter, the all electrode pairs other than the second electrode pair to which the current is applied are sequentially connected to the measurer 22, and subjected to the potential measurement. Next, the third electrode pair to which the current is to be applied is selected, and the potential measurement is performed in a manner similar to the above. Thereafter, all the electrodes 111 to 11n are similarly sequentially selected as the electrode pair to which the current is to be applied, the all electrode pairs other than the electrode pair to which the current is applied are sequentially connected to the measurer 22, and the potential measurement is performed.
- the computer 30 has a controlling device 31 which functions as a calculator having a CPU and a memory, and an inputting unit 32 and a display 33 which are connected to the controlling device 31. Command and various kinds of information are input through the inputting unit 32.
- the display 33 displays various kinds of display information such as an EIT image, various waveforms, numerical values, and characters.
- the controlling device 31 includes an impedance acquirer 34, a histogram producer 35, a display controller 37, a centroid calculator 38, and a curve producer 39.
- the impedance acquirer 34 obtains the impedance of each of meshes which are obtained by dividing a chest section region into meshes, based on the applied current and the potentials obtained by the potential measurer 20. Namely, the impedances of the meshes which are obtained by dividing a chest section region into meshes are obtained by using a related-art conversion table based on the applied current and the obtained potentials.
- the meshes correspond to the pixels of the EIT image, respectively. An image in which each of the meshes is converted to a color corresponding to the impedance can be displayed as an EIT image.
- the histogram producer 35 sets one or more ROIs including from the ventral side to the dorsal side in the chest section, and obtains a histogram of the impedance distribution in the ROIs.
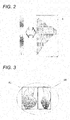
- an ROI A may be set in which the whole region of the chest section is one ROI.
- the lung field in the whole region of the chest section may be laterally segmented into two ROIs AR, AL, so that the impedance distribution between the ventral side and the dorsal side can be displayed in detail.
- An ROI is divided into a plurality of meshes, and the impedances which are obtained by the impedance acquirer 34 are made correspond to the meshes, respectively.
- impedance values are allocated to the n x m meshes, respectively.
- n indicates the number of meshes of one row contained from one side of the body to the other side
- m indicates the number of meshes of one column contained from the ventral side of the body to the dorsal side in the ROI A.
- the impedance values are divided into an N (integer) number of hierarchies, the hierarchy values are added together in the row direction, and a histogram of the impedance distribution in the column direction can be obtained.
- the histogram producer obtains a normalized histogram.
- a normalized histogram can be obtained as shown in, for example, (a) of Fig. 4 .
- a producer 36 produces a color impedance distribution map in which the amplitudes of the normalized histogram are replaced with corresponding colors.
- colors can be correspondingly allocated to the amplitudes.
- the color allocation can be performed in a following manner.
- White is allocated to the maximum amplitude (MAX).
- MAX maximum amplitude
- the amplitude becomes lower, the color gradually approaches red.
- the amplitude further becomes lower, the color gradually approaches yellow.
- the amplitude still further becomes lower the color gradually approaches green.
- the amplitude still further becomes lower the color gradually approaches blue.
- Purple is allocated to the minimum amplitude (MIN).
- the resulting distribution map is as shown in (b) of Fig. 4 .
- the amplitude is high in the vicinity of the middle, and, the more approaching the both ends, the lower amplitude is. Therefore, the color impedance distribution map is produced so that the vicinity of the middle is white corresponding to the maximum amplitude, the color gradually becomes red when the position advances toward the both ends of the white area, the color approaches yellow when the position further advances toward the ends, and the color approaches green when the position still further advances from that of yellow to the ends.
- color impedance distribution maps are produced in time series.
- the display controller 37 causes the color impedance distribution maps which are produced as described above, to be displayed on the display 33.
- the color impedance distribution maps can be displayed while being arranged in the direction of the time axis.
- the display controller 37 may be configured so as to further display the histogram of an impedance distribution.
- the centroid calculator 38 of the controlling device 31 obtains the centroid of the impedance distribution in an ROI.
- the centroid of a histogram is equal to the average value of the histogram, and may be obtained as the average value of impedances of meshes in the ROI.
- centroid of the impedance distribution When the centroid of the impedance distribution is obtained, one centroid (impedance value) is obtained in the embodiment of Fig. 2 in which the one ROI is set, and two centroids (impedance values) are obtained in the embodiment of Fig. 3 in which the two ROIs are set.
- the curve producer 39 produces a displacement curve of the centroid which is obtained by connecting together the centroids that vary with time in the ROIs.
- the display controller 37 can cause the displacement curve of the centroid to be displayed.
- the centroid calculator 38 sets two ROIs which are obtained by laterally segmenting the lung field, and obtains the centroid of the impedance distribution in the ROIs, and the display controller 37 causes the centroid to be displayed.
- the apparatus When a color impedance distribution map is to be displayed in the thus configured electrical impedance measuring apparatus, the apparatus operates as shown in the flowchart of, for example, Fig. 6 .
- the operation will be described.
- the plurality of electrodes 111 to 11n are adhered to the periphery of the chest of the living body, and the measurement is started.
- An electrode pair is selected, and a current is applied to the selected electrode pair.
- the potentials are obtained from the electrode pairs to which the current is not applied.
- the potentials are measured while sequentially changing electrodes from which the potential is to be obtained.
- the electrode pair to which the current is to be applied is changed to another electrode pair, and the subsequent potential measurement will be performed in a similar manner. In this way, the measurement is continued until the current apply is performed on the all electrode pairs, and the corresponding potential measurement is completed. Then, the series of potential measurements is ended (S11).
- the impedance of each of meshes is obtained by using the related-art conversion table (S12).
- the impedance values are divided into the N (integer) number of hierarchies, and a histogram of the impedance distribution in the column direction (from the ventral side to the dorsal side) in the ROI is obtained (S13).
- a color impedance distribution map in which the amplitudes of the histogram are replaced with corresponding colors is produced (S14), and the produced color impedance distribution map is displayed (S15).
- Fig. 7 shows an example in which, as a result of the operation of step S15, color impedance distribution maps of the ROI A in Fig. 2 and the ROIs AR, AL in Fig. 3 are displayed in time series and in a trend format.
- the display may be performed on one screen, or the ROI A in Fig. 2 and the ROIs AR, AL in Fig. 3 may be selectively displayed on another screen.
- a higher impedance indicates a more highly aerated state. Therefore, it can be determined that, when the color of the lower side of the figure is white or red, higher aeration is attained.
- the trend display of a color impedance distribution map is visually checked in this way, the spread of aeration from the ventral side to the dorsal side can be known intuitively and adequately.
- Steps 11 and 12 are identical with those of the flowchart of Fig. 6 for displaying a color impedance distribution map.
- step S12 by using the impedances of the meshes in the all ROIs, the centroid of the impedance distribution is obtained for each of the ROIs (S21).
- step S21 the centroids of the ROIs which are obtained in step S21 above are plotted against the height (amplitude), and connected together in time series to produce a displacement curve of the centroid (S22).
- the produced displacement curve of the centroid is displayed (S23).
- step S21 it is assumed that one column extending from the ventral side to the dorsal side is configured by meshes as shown in Fig. 9 , for example, the centroids (indicated by solid points) of the impedance distribution in one ROI are obtained in time series. Then, the centroids are connected in time series, and a displacement curve of the centroid l such as shown in Fig. 10 can be produced.
- the display controller 37 causes the displacement curve of the centroid l which is produced as described above, to be displayed on the display 33.
- the display controller 37 can cause the displacement curve of the centroid l to be displayed together with an EIT image as shown in Fig. 10 .
- the displacement curve of the centroid is displayed by one line in the direction of the time axis.
- the curve may be displayed together with a trend display of a color impedance distribution map in the time series direction.
- the aerated state from the ventral side to the dorsal side in the chest can be known, and, from the displacement curve of the centroid l, it is possible to know intuitively and adequately how the centroid of impedances is displaced with time from the ventral side to the dorsal side, and how the aerated state varies.
- one or more ROIs including from the ventral side to the dorsal side are set in a chest section, a histogram of the impedance distribution in the ROIs is obtained, a color impedance distribution map in which amplitudes of the histogram are replaced with corresponding colors is produced, and the color impedance distribution map is displayed in a trend format. Therefore, the histogram of the impedance distribution in the one or more ROIs including from the ventral side of the chest section to the dorsal side can be intuitively known based on the colors, and the spread of aeration from the ventral side to the dorsal side can be adequately known.
Landscapes
- Health & Medical Sciences (AREA)
- Life Sciences & Earth Sciences (AREA)
- Nuclear Medicine, Radiotherapy & Molecular Imaging (AREA)
- Medical Informatics (AREA)
- Surgery (AREA)
- Biophysics (AREA)
- Pathology (AREA)
- Engineering & Computer Science (AREA)
- Biomedical Technology (AREA)
- Heart & Thoracic Surgery (AREA)
- Veterinary Medicine (AREA)
- Molecular Biology (AREA)
- Physics & Mathematics (AREA)
- Animal Behavior & Ethology (AREA)
- General Health & Medical Sciences (AREA)
- Public Health (AREA)
- Radiology & Medical Imaging (AREA)
- Pulmonology (AREA)
- Physiology (AREA)
- Measurement And Recording Of Electrical Phenomena And Electrical Characteristics Of The Living Body (AREA)
- Measurement Of Resistance Or Impedance (AREA)
Applications Claiming Priority (1)
| Application Number | Priority Date | Filing Date | Title |
|---|---|---|---|
| JP2014037524A JP6276067B2 (ja) | 2014-02-27 | 2014-02-27 | 電気的インピーダンス測定装置 |
Publications (1)
| Publication Number | Publication Date |
|---|---|
| EP2913002A1 true EP2913002A1 (de) | 2015-09-02 |
Family
ID=52784884
Family Applications (1)
| Application Number | Title | Priority Date | Filing Date |
|---|---|---|---|
| EP15155944.0A Withdrawn EP2913002A1 (de) | 2014-02-27 | 2015-02-20 | Elektrische impedanzmessvorrichtung |
Country Status (4)
| Country | Link |
|---|---|
| US (1) | US9636038B2 (de) |
| EP (1) | EP2913002A1 (de) |
| JP (1) | JP6276067B2 (de) |
| CN (1) | CN104873194A (de) |
Families Citing this family (2)
| Publication number | Priority date | Publication date | Assignee | Title |
|---|---|---|---|---|
| CN113273988B (zh) * | 2020-02-03 | 2022-10-11 | 西交利物浦大学 | 基于电流量的电阻抗成像方法、装置及存储介质 |
| EP4059416B1 (de) * | 2021-03-18 | 2025-08-27 | SenTec AG | Regionaler stamm |
Citations (3)
| Publication number | Priority date | Publication date | Assignee | Title |
|---|---|---|---|---|
| US20040092809A1 (en) * | 2002-07-26 | 2004-05-13 | Neurion Inc. | Methods for measurement and analysis of brain activity |
| US8321007B2 (en) | 2009-03-09 | 2012-11-27 | Dräger Medical GmbH | Apparatus and method to determine functional lung characteristics |
| US20140012061A1 (en) * | 2007-09-24 | 2014-01-09 | Oregon Health & Science University | Non-invasive location and tracking of tumors and other tissues for radiation therapy |
Family Cites Families (4)
| Publication number | Priority date | Publication date | Assignee | Title |
|---|---|---|---|---|
| CA1196691A (en) * | 1982-01-12 | 1985-11-12 | Bradley Fry | Reconstruction system and methods for impedance imaging |
| AU8384901A (en) * | 2000-06-09 | 2001-12-17 | Stephan Bohm | Method and apparatus for displaying information obtained by electrical impedancetomography data |
| US20050105789A1 (en) * | 2003-11-17 | 2005-05-19 | Isaacs Hugh S. | Method and apparatus for detecting, monitoring, and quantifying changes in a visual image over time |
| US20090112109A1 (en) * | 2007-08-31 | 2009-04-30 | Pawel Kuklik | Reconstruction of geometry of a body component and analysis of spatial distribution of electrophysiological values |
-
2014
- 2014-02-27 JP JP2014037524A patent/JP6276067B2/ja active Active
-
2015
- 2015-02-16 CN CN201510085154.XA patent/CN104873194A/zh not_active Withdrawn
- 2015-02-18 US US14/625,336 patent/US9636038B2/en active Active
- 2015-02-20 EP EP15155944.0A patent/EP2913002A1/de not_active Withdrawn
Patent Citations (3)
| Publication number | Priority date | Publication date | Assignee | Title |
|---|---|---|---|---|
| US20040092809A1 (en) * | 2002-07-26 | 2004-05-13 | Neurion Inc. | Methods for measurement and analysis of brain activity |
| US20140012061A1 (en) * | 2007-09-24 | 2014-01-09 | Oregon Health & Science University | Non-invasive location and tracking of tumors and other tissues for radiation therapy |
| US8321007B2 (en) | 2009-03-09 | 2012-11-27 | Dräger Medical GmbH | Apparatus and method to determine functional lung characteristics |
Non-Patent Citations (1)
| Title |
|---|
| GUNNAR ELKE ET AL: "Quantification of ventilation distribution in regional lung injury by electrical impedance tomography and xenon computed tomography", PHYSIOLOGICAL MEASUREMENT, INSTITUTE OF PHYSICS PUBLISHING, BRISTOL, GB, vol. 34, no. 10, 11 September 2013 (2013-09-11), pages 1303 - 1318, XP020251547, ISSN: 0967-3334, [retrieved on 20130911], DOI: 10.1088/0967-3334/34/10/1303 * |
Also Published As
| Publication number | Publication date |
|---|---|
| US20150238116A1 (en) | 2015-08-27 |
| US9636038B2 (en) | 2017-05-02 |
| JP2015160004A (ja) | 2015-09-07 |
| JP6276067B2 (ja) | 2018-02-07 |
| CN104873194A (zh) | 2015-09-02 |
Similar Documents
| Publication | Publication Date | Title |
|---|---|---|
| US20130231578A1 (en) | Electrocardiogram analysis report, electrocardiogram analysis apparatus, and electrocardiogram analysis program | |
| DE112017004579B4 (de) | Blutdruckmessgerät, Verfahren zum Steuern des Blutdruckmessgerätes und Programm | |
| CN101877030B (zh) | 一种耳穴伪彩色分布图的计算机实现方法 | |
| DE102016107603B4 (de) | Benutzerinterface eines medizinischen Diagnosesystems sowie Computerprogramm dafür | |
| CN104905766B (zh) | 基于定位像确定扫描参数的医疗扫描系统和方法 | |
| US6741887B1 (en) | Apparatus and method for presenting periodic data | |
| CN109091110A (zh) | 一种食道测压标识识别系统及电子设备和存储介质 | |
| US9636038B2 (en) | Electrical impedance measuring apparatus | |
| KR102405150B1 (ko) | 태아의 심박동을 모니터링하는 방법 및 그 장치 | |
| DE112018001382T5 (de) | Informationsverarbeitungsvorrichtung, verfahren und programm | |
| US9636037B2 (en) | Electrical impedance measuring apparatus | |
| KR102150200B1 (ko) | 7-세그먼트를 구비한 진단 기기 이미지 인식 장치 | |
| JP2013173043A (ja) | 生体情報処理装置、運動負荷心電図検査システム及び生体情報処理プログラム | |
| US8731254B2 (en) | Biological signal drawing apparatus and biological signal drawing method | |
| US8390624B2 (en) | Interrelated graphical method for displaying blood pressure data | |
| EP3328271B1 (de) | Verfahren zur nichtinvasiven bestimmung von vitalparametern eines lebenden organismus | |
| CN104199076B (zh) | 辐射提示方法和装置 | |
| US9901259B2 (en) | System for generating cardiac and other electric waveforms | |
| US10232176B2 (en) | Biological signal display apparatus | |
| DE102011053763A1 (de) | Systeme und Verfahren zum Anzeigen digitalisierter Wellenformen auf Pixel-Bildschirmen | |
| DE112018001384T5 (de) | Blutdruckbezogene informationsanzeigevorrichtung und -verfahren | |
| JP4859043B2 (ja) | 等輝度測定装置、等輝度測定方法、ディスプレイ装置およびコンピュータグラフィックス処理装置 | |
| DE102022124351A1 (de) | Kapazitives hovererfassungsmodul und -verfahren | |
| CN112991333A (zh) | 一种内窥镜手术中基于语音分析的图像处理方法及系统 | |
| KR102297681B1 (ko) | 생체 데이터 처리 방법 및 장치 |
Legal Events
| Date | Code | Title | Description |
|---|---|---|---|
| PUAI | Public reference made under article 153(3) epc to a published international application that has entered the european phase |
Free format text: ORIGINAL CODE: 0009012 |
|
| AK | Designated contracting states |
Kind code of ref document: A1 Designated state(s): AL AT BE BG CH CY CZ DE DK EE ES FI FR GB GR HR HU IE IS IT LI LT LU LV MC MK MT NL NO PL PT RO RS SE SI SK SM TR |
|
| AX | Request for extension of the european patent |
Extension state: BA ME |
|
| 17P | Request for examination filed |
Effective date: 20160302 |
|
| RBV | Designated contracting states (corrected) |
Designated state(s): AL AT BE BG CH CY CZ DE DK EE ES FI FR GB GR HR HU IE IS IT LI LT LU LV MC MK MT NL NO PL PT RO RS SE SI SK SM TR |
|
| STAA | Information on the status of an ep patent application or granted ep patent |
Free format text: STATUS: THE APPLICATION HAS BEEN WITHDRAWN |
|
| 18W | Application withdrawn |
Effective date: 20180907 |