EP2864741B1 - Objektträgerscanner für fluoreszenz- und hellfeldbildgebung in der pathologie und verfahren zum betrieb - Google Patents
Objektträgerscanner für fluoreszenz- und hellfeldbildgebung in der pathologie und verfahren zum betrieb Download PDFInfo
- Publication number
- EP2864741B1 EP2864741B1 EP13810226.4A EP13810226A EP2864741B1 EP 2864741 B1 EP2864741 B1 EP 2864741B1 EP 13810226 A EP13810226 A EP 13810226A EP 2864741 B1 EP2864741 B1 EP 2864741B1
- Authority
- EP
- European Patent Office
- Prior art keywords
- specimen
- colour
- array
- image
- instrument
- Prior art date
- Legal status (The legal status is an assumption and is not a legal conclusion. Google has not performed a legal analysis and makes no representation as to the accuracy of the status listed.)
- Active
Links
Images


Classifications
-
- G—PHYSICS
- G02—OPTICS
- G02B—OPTICAL ELEMENTS, SYSTEMS OR APPARATUS
- G02B21/00—Microscopes
- G02B21/36—Microscopes arranged for photographic purposes or projection purposes or digital imaging or video purposes including associated control and data processing arrangements
-
- G—PHYSICS
- G01—MEASURING; TESTING
- G01N—INVESTIGATING OR ANALYSING MATERIALS BY DETERMINING THEIR CHEMICAL OR PHYSICAL PROPERTIES
- G01N21/00—Investigating or analysing materials by the use of optical means, i.e. using sub-millimetre waves, infrared, visible or ultraviolet light
- G01N21/62—Systems in which the material investigated is excited whereby it emits light or causes a change in wavelength of the incident light
- G01N21/63—Systems in which the material investigated is excited whereby it emits light or causes a change in wavelength of the incident light optically excited
- G01N21/64—Fluorescence; Phosphorescence
- G01N21/645—Specially adapted constructive features of fluorimeters
- G01N21/6456—Spatial resolved fluorescence measurements; Imaging
- G01N21/6458—Fluorescence microscopy
-
- G—PHYSICS
- G02—OPTICS
- G02B—OPTICAL ELEMENTS, SYSTEMS OR APPARATUS
- G02B21/00—Microscopes
- G02B21/0004—Microscopes specially adapted for specific applications
- G02B21/002—Scanning microscopes
- G02B21/0024—Confocal scanning microscopes (CSOMs) or confocal "macroscopes"; Accessories which are not restricted to use with CSOMs, e.g. sample holders
- G02B21/0052—Optical details of the image generation
- G02B21/0076—Optical details of the image generation arrangements using fluorescence or luminescence
-
- G—PHYSICS
- G02—OPTICS
- G02B—OPTICAL ELEMENTS, SYSTEMS OR APPARATUS
- G02B21/00—Microscopes
- G02B21/06—Means for illuminating specimens
- G02B21/08—Condensers
- G02B21/12—Condensers affording bright-field illumination
-
- G—PHYSICS
- G02—OPTICS
- G02B—OPTICAL ELEMENTS, SYSTEMS OR APPARATUS
- G02B21/00—Microscopes
- G02B21/36—Microscopes arranged for photographic purposes or projection purposes or digital imaging or video purposes including associated control and data processing arrangements
- G02B21/365—Control or image processing arrangements for digital or video microscopes
- G02B21/367—Control or image processing arrangements for digital or video microscopes providing an output produced by processing a plurality of individual source images, e.g. image tiling, montage, composite images, depth sectioning, image comparison
-
- G—PHYSICS
- G02—OPTICS
- G02B—OPTICAL ELEMENTS, SYSTEMS OR APPARATUS
- G02B5/00—Optical elements other than lenses
- G02B5/20—Filters
- G02B5/201—Filters in the form of arrays
Definitions
- This invention relates to the fields of microscopic imaging of large specimens with particular emphasis on brightfield and fluorescence imaging, including photoluminescence and spectrally-resolved fluorescence.
- Applications include imaging tissue specimens, genetic microarrays, protein arrays, tissue arrays, cells and cell populations, biochips, arrays of biomolecules, detection of nanoparticles, photoluminescence imaging of semiconductor materials and devices, and many others.
- the macroscope originally described in US Patent No. 5,381,224 is a scanning-laser system that uses a telecentric laser-scan lens to provide a wide field of view.
- Several embodiments are presently in use. These include instruments for fluorescence and photoluminescence (including spectrally-resolved) imaging (several other contrast mechanisms are also possible), instruments in which a raster scan is provided by the combination of a scanning mirror and a scanning specimen stage, instruments in which the specimen stage is stationary and the raster scan is provided by two scanning mirrors rotating about perpendicular axes, confocal and non-confocal versions, and other embodiments.
- a macroscope with fine focus adjustment was described in US Patent No.
- 7,218,446 and versions for reflected-light, fluorescence, photoluminescence, multi-photon fluorescence, transmitted-light, and brightfield imaging were described.
- Exposure for each fluorophore can be adjusted separately without changing scan speed by changing either laser intensity and/or detector gain (in the case of a detector comprised of a photomultiplier tube (pmt) followed by a preamplifier, both the pmt voltage (which changes pmt gain) and preamplifier gain can be changed).
- the ability to adjust the detection gain for each fluorophore separately allows the instrument to simultaneously collect multiple fluorophore images that are all correctly exposed.
- the appropriate laser wavelength can be provided to excite a chosen fluorophore, and excitation wavelengths can be chosen so they do not overlap detection wavelength ranges.
- Such images may contain tiling artifacts, caused by focus changes between adjacent tiles, differences in illumination intensity across the field of view of the microscope, barrel or pincushion distortion near the edge of the tiles, and microscope objectives that do not have a flat focal plane.
- tiling artifacts caused by focus changes between adjacent tiles, differences in illumination intensity across the field of view of the microscope, barrel or pincushion distortion near the edge of the tiles, and microscope objectives that do not have a flat focal plane.
- tiling artifacts caused by focus changes between adjacent tiles, differences in illumination intensity across the field of view of the microscope, barrel or pincushion distortion near the edge of the tiles, and microscope objectives that do not have a flat focal plane.
- For large specimens, thousands of tiles may be required to image the entire specimen, increasing the chance of tiling artifacts.
- Tiling microscopes are very slow for fluorescence imaging.
- Strip scanning instruments are also used for imaging large specimens.
- infinity-corrected microscope optics are used, with a high Numerical Aperture (high NA) microscope objective and a tube lens of the appropriate focal length to focus an image of the specimen directly on a CCD or CMOS linear array sensor or TDI sensor with the correct magnification to match the resolution of the microscope objective with the detector pixel size for maximum magnification in the digitized image ⁇ as described in " Choosing Objective Lenses: The Importance of Numerical Aperture and Magnification in Digital Optical Microscopy", David W. Piston, Biol. Bull. 195, 1-4 (1998 ) ⁇ .
- a linear CCD detector array with 1000 or 2000 pixels is often used, and three separate linear detectors with appropriate filters to pass red, green and blue light are used for RGB brightfield imaging.
- the sample is moved at constant speed in the direction perpendicular to the long dimension of the linear detector array to scan a narrow strip across a microscope slide.
- the entire slide can be imaged by imaging repeated strips and butting them together to create the final image.
- Another version of this technology uses linear TDI (Time Delay Integration) array sensors which increase both sensitivity and imaging speed. In both of these instruments, exposure is varied by changing illumination intensity and/or scan speed.
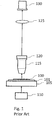
- FIG. 1 Such a microscope is shown in Fig. 1 (Prior Art).
- a tissue specimen 100 (or other specimen to be imaged) mounted on microscope slide 101 is illuminated from below by illumination source 110.
- Light passing through the specimen is collected by infinity-corrected microscope objective 115, which is focused on the specimen by piezo positioner 120.
- the microscope objective 115 and tube lens 125 form a real image of the specimen on linear detector array 130.
- An image of the specimen is collected by moving the microscope slide at constant speed using motorized stage 105 in a direction perpendicular to the long dimension of the detector array 130, combining a sequence of equally-spaced line images from the array to construct an image of one strip across the specimen. Strips are then assembled to form a complete image of the specimen.
- strip-scanning instruments For brightfield imaging, most strip-scanning instruments illuminate the specimen from below, and detect the image in transmission using a sensor placed above the specimen. In brightfield, signal strength is high, and red, green and blue channels are often detected simultaneously with separate linear detector arrays to produce a colour image.
- fluorescence signals can be thousands of times weaker, and some fluorophores have much weaker emission than others. Fluorescence microscopy is usually performed using illumination from the same side as detection (epifluorescence) so that the bright illumination light passing through the specimen does not enter the detector.
- detection epifluorescence
- strip-scanning instruments exposure is varied by changing scan speed, so present strip-scanning instruments scan each fluorophore separately, reducing the scan speed when greater exposure is required for a weak fluorophore. Varying exposure by changing scan speed makes it difficult to design a strip-scanner for simultaneous imaging of multiple fluorophores, where each channel would have the same exposure time, and present strip-scanners scan one fluorophore at-a-time.
- relative intensity measurements are sometimes important for quantitative measurement, and 12 or 16 bit dynamic range may be required. For present strip scanners, this would require larger dynamic range detectors and slower scan speeds.
- the exposure time in a tiling or strip-scanning microscope
- the combination of laser intensity, detector gain and scan speed in a scanning laser macroscope or microscope
- the exposure time must be adjusted separately for each detection channel before scanning.
- estimating the exposure in advance is difficult without scanning the whole specimen first to check exposure, and this must be done for each fluorophore. Instead of scanning first to set exposure, many operators simply set the scan speed to underexpose slightly, with resulting noisy images, or possibly images with some overexposed (saturated) areas if the estimated exposure was not correct.
- a high-speed preview scan can be used to set detection gain in each channel before final simultaneous imaging of multiple fluorophores (see WO2009/137935 , "Imaging System with Dynamic Range Maximization").
- FIG. 2 A prior art scanning microscope for fluorescence imaging is shown in Fig. 2 .
- a tissue specimen 100 (or other specimen to be imaged) mounted on microscope slide 101 is illuminated from above by illumination source 200.
- the illumination source is usually mounted above the specimen (epifluorescence) so that the intense illumination light that passes through the specimen is not mixed with the weaker fluorescence emission from the specimen, as it would be if the illumination source were below the specimen.
- Several different optical combinations can be used for epifluorescence illumination - including illumination light that is injected into the microscope tube between the microscope objective and the tube lens, using a dichroic beamsplitter to reflect it down through the microscope objective and onto the specimen.
- a narrow wavelength band for the illumination light is chosen to match the absorption peak of the fluorophore in use.
- Fluorescence emitted by the specimen is collected by the infinity-corrected microscope objective 115 which is focused on the specimen by the piezo positioner 120.
- Emission filter 205 is chosen to reject light at the illumination wavelength and to pass the emission band of the fluorophore in use.
- the microscope objective 115 and the tube lens 125 form a real image of the specimen on TDI detector array 210.
- An image of the specimen is collected by moving the microscope slide at constant speed using the motorized stage 105 in a direction perpendicular to the long dimension of the detector array 210, combining a sequence of equally-spaced, time-integrated line images from the array to construct an image of one strip across the specimen. Strips are then assembled to form a complete image of the specimen.
- each line image stored in memory is the result of integrating the charge generated in all of the previous lines of the array while the scan proceeds, and thus has both increased signal/noise and amplitude (due to increased exposure time) when compared to the result from a linear array detector.
- Exposure is also increased by reducing scan speed, so the scan time (and thus image acquisition time) is increased when using weak fluorophores.
- the usual imaging method is to choose illumination wavelengths to match one fluorophore, select the appropriate emission filter and scan time (speed) for the chosen fluorophore, and scan one strip in the image. Then, the illumination wavelength band is adjusted to match the absorption band of the second fluorophore, a matching emission filter and scan speed are chosen, and that strip is scanned again. Additional fluorophores require the same steps to be repeated. Finally, this is repeated for all strips in the final image.
- Some instruments use multiple TDI detector arrays to expose and scan multiple fluorophores simultaneously, but this usually results in a final image where one fluorophore is exposed correctly and the others are either under- or over-exposed. Exposure can be adjusted by changing the relative intensity of the excitation illumination for each fluorophore, which should be easy to do if LED illumination is used.
- the resulting image for each fluorophore may differ from that produced when only one illumination band is used at a time because of overlap of the fluorophore emission bands, and because autofluorescence from the tissue itself may be excited by one of the illumination bands.
- Autofluorescence emission usually covers a wide spectrum and may cause a bright background in all of the images when multiple fluorophores are illuminated and imaged simultaneously.
- Linear arrays work well for brightfield imaging, but the user is often required to perform a focus measurement at several places on the specimen before scanning, or a separate detector is used for automatic focus.
- Linear arrays are not often used for fluorescence imaging because exposure time is inversely proportional to scan speed, which makes the scan time very long for weak fluorophores.
- exposure (scan speed) must be adjusted for each fluorophore, making simultaneous measurement of multiple fluorophores difficult when they have widely different fluorescence intensity (which is common).
- TDI arrays and associated electronics are expensive, but the on-chip integration of several exposures of the same line on the specimen provides the increased exposure time required for fluorescence imaging while maintaining a reasonable scan speed. Simultaneous imaging of multiple fluorophores using multiple TDI detector arrays is still very difficult however, since each of the detectors has the same integration time (set by the scan speed), so it is common to use only one TDI array, adjusting exposure for each fluorophore by changing the scan speed and collecting a separate image for each fluorophore. Focus is set before scanning at several positions on the specimen, or automatic focus is achieved using a separate detector or focus measuring device.
- Single-chip colour cameras (including those often used on ordinary optical microscopes to record an image of the specimen area seen in the field of view of the microscope) often use a mosaic Colour Filter Array (CFA) on the photosensors of an area detector that enables a single-chip camera to record a colour image.
- CFA Color Filter Array
- the most common CFA is the Bayer filter, named after the inventor, which arranges red, green and blue filters in a square grid (usually RGGB) of photosensors on the array (see US Patent No. 3,971,065 ). Bayer chose to use two green pixels in each set as luminance elements to match the sensitivity of the human eye.
- demosaicing Data from each pixel only records one colour, so in order to obtain a full-colour image, the red, green and blue values for each pixel are calculated by interpolation using information from the surrounding pixels. This is called demosaicing, and several different demosaicing algorithms have been developed. Demosaicing may happen inside the camera (producing jpeg or tiff files), or outside using raw data from the sensor. Because of the computing power required for demosiacing, and the possibility of false colours and moire, most tiling microscopes use separate array detectors to detect red, green and blue. Cameras for digital photography often use an optical low-pass filter in front of the detector array to reduce moire and false colour caused by use of a Bayer filter, resulting in some loss of resolution.
- a "macroscopic specimen” (or “large microscope specimen”) is defined as one that is larger than the field of view of a compound optical microscope containing a microscope objective that has the same Numerical Aperture (NA) as that of the scanner described in this document.
- NA Numerical Aperture
- TDI or Time Delay and Integration is defined as the method and detectors used for scanning moving objects, usually consisting of a CCD-based detector array in which charge is transferred from one row of pixels in the detector array to the next in synchronism with the motion of the real image of the moving object. As the object moves, charge builds up and the result is charge integration just as if a longer exposure was used in a stationary imaging situation. When the image (and integrated charge) reaches the last row of the array, that line of pixels is read out. In operation the last line of the moving image is read out continuously, one row of pixels at a time.
- TDI Time Delay and Integration
- image acquisition includes all of the steps necessary to acquire and produce the final image of the specimen, including some of but not limited to the following: the steps of preview scanning, instrument focus, predicting and setting gain for imaging each fluorophore, image adjustments including scan linearity adjustment, field flattening (compensating for fluorescence intensity variation caused by excitation intensity and detection sensitivity changes across the field of view), correction of fluorescence signal in one channel caused by overlap of fluorescence from adjacent (in wavelength) channels when two or more fluorophores are excited simultaneously, dynamic range adjustment, butting or stitching together adjacent image strips (when necessary), storing, transmitting and viewing the final image.
- image adjustments including scan linearity adjustment, field flattening (compensating for fluorescence intensity variation caused by excitation intensity and detection sensitivity changes across the field of view), correction of fluorescence signal in one channel caused by overlap of fluorescence from adjacent (in wavelength) channels when two or more fluorophores are excited simultaneously, dynamic range adjustment, butting or stitching together adjacent image strips (when necessary), storing, transmitting and viewing the final
- image processing means all of the steps required to process the data to prepare the final image file, including some of but not limited to the following: the steps of scan linearity adjustment, field flattening, correction for crosstalk when simultaneously scanning multiple fluorophores, correcting fluorescence image data by subtracting fluorescence originating from the glass of the microscope slide, subtracting the dark-current noise floor from the detector, and contracting the dynamic range of the image data to match the (smaller) dynamic range of the final image.
- “Proper exposure” is defined as a gain setting such that in the output image file no (or only a small number of) pixels are saturated, and the dynamic range of the image data matches the dynamic range of the output image file (8 bits for an 8 bit file, 12 bits for a 12 bit file, etc.) and includes substantially the entire range of pixel amplitudes from the noise floor to the brightest pixel.
- the output image file may have a smaller dynamic range than that of the detection system, and that of an intermediate image file that is collected during scanning.
- WO2009/137935 describes two methods of maximizing the dynamic range of data stored in the output image file - (1) accurately estimating the gain required to maximize the dynamic range of each detection channel when the dynamic range of the detection channel and the dynamic range of the output image data file are the same, and (2) using a dynamic range in the detection channel that is larger than that required in the final image data file and contracting the acquired data to utilize substantially the entire dynamic range of the final image data file.
- sparse image means an image in which only pixels in a sparse grid exist in the image - e.g. one pixel at the centre of a square area of the image that would normally contain 100 or more pixels.
- the pixel values (intensities) are the same as they would be in the complete image, and do not reflect in any way the values of the pixels that were discarded (or not measured) to produce the sparse image.
- a "frame grabber” is any electronic device that captures individual, digital still frames from an analog video signal or a digital video stream or digital camera. It is often employed as a component of a computer vision system, in which video frames are captured in digital form and then displayed, stored or transmitted in raw or compressed digital form.
- This definition includes direct camera connections via USB, Ethernet, IEEE 1394 (“FireWire”) and other interfaces that are now practical.
- TDI time delay and integration
- Each line in the final image is the result of adding several exposures of the same line and then dividing by the number of exposures, or adding the data from each exposure to a data set with a larger dynamic range, e.g. one could add 256 images from an 8-bit detector into a 16-bit image store).
- dynamic-range contraction can be used on each fluorophore image to fill the dynamic range required in the output file for each fluorophore, as described in WO2009/137935 ).
- a 16-bit image store for each fluorescence detection channel. Up to 256 8-bit measurements can be added to each pixel in the 16-bit image store, and, if desired, the resulting 16-bit image can be contracted back to 8 bits, using the contraction methods described in WO2009/137935 . Contraction can be different for each fluorescence channel so that the resulting 8-bit image from each channel fills the 8 bit dynamic range commonly available for viewing each colour.
- CCD or CMOS or other technology two-dimensional sensor arrays in place of linear arrays or TDI arrays
- These single field-of-view images can be either brightfield or fluorescence, and allow the operator to view changes in the specimen as a function of time. Video-rate acquisition enables these changes to be viewed in real time.
- Increased exposure of single field-of-view fluorescence images can be accomplished by increasing the time the shutter is open, or by adding a series of images of the same field-of-view (which also allows the dynamic range in the image to be larger than that of the detector array).
- Increased optical resolution can be achieved in the single field-of-view images using structured illumination (see “ Widefield fluorescence microscopy with extended resolution” by A Stemmer, M Beck & R Fiolka, Histochem Cell Biol 130 (807-817) 2008 ).
- Optical sectioning can be accomplished in the single field-of-view images by injecting a laser beam into the tube of the microscope through a diffuser plate, which is imaged onto the back aperture of the objective (or by simply illuminating the specimen directly).
- Two images can be acquired, one illuminated by speckle when the diffuser plate is stationary, and a second uniform-illumination image when the diffuser plate is in rapid motion. These two images can be processed and combined to give a final optically-sectioned high resolution image, as described in " Wide-field fluorescence sectioning with hybrid speckle and uniform-illumination microscopy" by D. Lim, K. Chu & J. Mertz, Optics Letters 33 (1819-1821) 2008 .
- Figure 3 shows a microscope for fluorescence and brightfield imaging that is a first embodiment of this invention.
- a tissue specimen 100 (or other specimen to be imaged) mounted on microscope slide 101 on a scanning stage 105.
- illumination source 310 mounted above the specimen (epifluorescence) so that the intense illumination light that passes through the specimen is not mixed with the weaker fluorescence emission from the specimen, as it would be if the fluorescence illumination source were below the specimen.
- a narrow wavelength band for the illumination light is chosen to match the absorption peak of the fluorophore in use.
- This narrow-band illumination may come from a filtered white-light source, an LED or laser-based source (including a laser sent through a diffuser plate in rapid motion to eliminate speckle), or other source.
- Fluorescence emitted by the specimen is collected by infinity-corrected microscope objective 115 (or other high-numerical-aperture objective lens) which is focused on the specimen by piezo positioner 120 (or other focusing mechanism).
- Emission filter 320 is chosen to reject light at the illumination wavelength and to pass the emission band of the fluorophore in use.
- the microscope objective 115 and tube lens 125 form a real image of the specimen on two-dimensional detector array 330.
- An image of the specimen is collected by moving the microscope slide at constant speed using motorized stage 105 in a direction perpendicular to the long dimension of detector array 330, combining a sequence of equally-spaced overlapping two-dimensional images from the array (usually spaced one line apart) to construct a time-integrated image of one strip of the specimen.
- Data from detector array 330 is read out by frame grabber 340 and passed to computer 350 where strips are then assembled to form a complete image of the specimen.
- transmitted-light illumination source 305 is used instead of illumination source 310 (which illuminates the specimen from above) and emission filter 320 is removed from the optical train.
- Figure 4 shows a specimen 100 mounted on a microscope slide 101.
- the microscope slide is square, but it can have any convenient size and shape, including standard 1x3 inch microscope slides up to very large slides (we have imaged specimens on slides 6x8 inches in size) and for the purposes of this document, the term "microscope slide” includes slides made from glass or other medium (usually but not always transparent) and any other specimen carrier including but not limited to microwell plates and tissue blocks. Specimens may be covered with a cover slip.
- the specimen is larger than the field-of-view 412 of the microscope detector array.
- three image strips are required to image the entire specimen 100, but for a larger specimen many more strips may be required.
- microscope stage 105 of Fig. 3 moves the microscope slide 101 at constant speed in the direction shown in Fig. 4 (or the microscope optical train 350 is moved at constant speed in the opposite direction).
- An electronic or mechanical shutter opens for a short time to expose the sensors that make up the two-dimensional detector array 330, which is also shown in detail as detector array 500 in Figure 5 .
- the exposure time is short enough so that during exposure the constant relative motion of the detector and microscope slide moves field-of-view 410 only part of the way to the adjacent field-of-view 411, which is one pixel away from 410.
- data in the entire two-dimensional detector array is transferred to frame-buffer RAM in a frame grabber 340 or to other electronic frame capture device, and is then transferred to a computer 350.
- the shutter is opened again and a new image frame is collected, the shutter is then closed and this new image is then transferred via the frame grabber to the computer, where this data is added to the image data already stored, but shifted one pixel in the direction of motion of the field-of-view.
- the detector array 330 is comprised of 4000 pixels by 256 lines, as shown in Figure 5 ⁇ which shows a CCD or CMOS (or other technology) two-dimensional sensor array 330 with 256 lines of 4000 pixels each (a 256 x 4000 pixel array) ⁇ .
- Figure 5 shows a CCD or CMOS (or other technology) two-dimensional sensor array 330 with 256 lines of 4000 pixels each (a 256 x 4000 pixel array) ⁇ .
- each pixel in the final strip image stored in computer 350 is the sum of 256 exposures of the same pixel position in the specimen.
- the resulting stored image has a dynamic range of 16 bits (each pixel is made up of a sum of 256 exposures where each exposure has a maximum value of 255).
- the fluorescence image of the strip is stored and adjacent strip images are assembled to produce a final image of the specimen. Adjacent strips may be assembled by butting them together, or by collecting overlapping strip images and using feature-matching software for registration.
- p ⁇ i -(m-1) ⁇ ,n, i represents the pixel value for pixels in each detector image frame, where ⁇ i -(m-1) ⁇ represents the row number of the pixel and n represents the column number of the pixel in frame number i .
- Each pixel P in the final image is the sum of 256 detector image pixels from 256 sequential frames, where the column number varies from 1 to 4,000 (the same number as in the detector image frames) and the row number varies from 1 to 40,000.
- the running index in the sum is i , and i also equals the frame number (in this example varies from 1 to 40,255).
- N the number of frames exposed
- N the number of frames exposed
- N the number of frames exposed
- N the number of frames exposed
- N the number of frames exposed
- N the number of frames exposed
- N the number of frames exposed
- N the number of frames exposed
- the scanning stage is set to move at a constant speed of 100 microns/second (1/10 mm/second), and assuming the same 0.25 micron object pixel resolution and 4000 x 256 pixel detector array as used in the example above, lines of data are collected at 400 lines/second (this is similar to a scan rate of 400 lines/second in a scanning laser microscope or macroscope). If an exposure time of 1/1000 second is used, the moving specimen stage will move less than half the distance between adjacent pixels during the time the shutter is open, and since 256 lines of data from the detector array are summed into each line of data in the final image, the total exposure time for each pixel in the final image is 256/1000 seconds, or approximately 250 milliseconds.
- the exposure time is only 1 millisecond, which is too short for weak fluorophores.
- the operation of the shutter should be closely synchronized with stage motion, just as it must be if TDI detectors were used instead of the two-dimensional detector arrays described in this document. (Note: the specimen image may have enough features to allow sequential image frames to be registered using feature-matching software, which reduces the requirement for synchronization between sequential image frames and therefore would allow a less-expensive moving stage to be used.)
- the exposure time for each image was 1 msec., leaving approximately 1 msec. to read out the data in the array before the scanning stage has moved a distance equal to the distance between pixels on the specimen. If this read-out time is too short to read out the array, the next exposure can be synchronized to start when the stage has moved a distance equal to an integral number of pixels instead of the distance between adjacent pixels, thus increasing the read-out time while keeping the scan speed unchanged.
- the number of images added together to form the final image will be reduced by a factor equal to 1/s, where s is the number of pixels the stage moves between exposures.
- Figure 6 (top) shows a rectangular detector array 600 of 40 pixels (10 pixels by 4 lines). In an ordinary array, the entire frame is read out through the same output port, which can be time consuming (especially for a large array like the 1,024,000 pixel array described in the example above (4000 pixels by 256 lines).
- Figure 6 (bottom) shows a second rectangular detector array 610 that also has 40 pixels (10 pixels by 4 lines), but in this array each line is read out through its own output port. Read-out time can be reduced substantially if the lines of data are read out simultaneously into a frame buffer, where they can be stored for further processing. In theory, this could reduce the read-out time of the 1,024,000 pixel array used as example previously by a factor of 1/256. Additionally, since in this application lines of data from the detector array are added in a moving sequence to lines of data stored in a strip image, lines can be shifted and added to the appropriate memory locations in the strip image as parallel processes, thus reducing the computational load as well.
- the system magnification object lens plus tube lens
- a microscope objective with a numerical aperture of 0.75 and a focal length of 10 mm is available (this is labeled a 20X objective, but that label assumes a particular tube lens with focal length 200mm).
- Magnification f tube lens / f microscope objective
- the tube lens must be able to form an image at least 4cm wide for the detector array described above.
- an infinity-corrected microscope objective or other infinity-corrected objective lens
- a tube lens is used because it is possible to insert filters, filter cubes, and beamsplitters into the optical path between the objective and the tube lens without affecting instrument focus and optical performance.
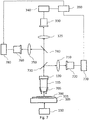
- Figure 7 shows a microscope for fluorescence or brightfield imaging that is a second embodiment of this invention.
- a tissue specimen 700 (or other specimen to be imaged) which has been stained with three different fluorescent dyes is mounted on microscope slide 101 on a scanning stage 105.
- the tissue specimen is illuminated from above by illumination source 705, mounted above the specimen (epifluorescence) so that the intense illumination light that passes through the specimen is not mixed with the weaker fluorescence emission from the specimen, as it would be if the illumination source were below the specimen.
- Narrow wavelength bands are chosen for the illumination light to match the absorption peaks of the fluorophores in use.
- This narrow-band illumination may come from a filtered white-light source, an LED or laser-based source (including an amplitude or frequency-modulated laser or LED source), or other source.
- Fluorescence emitted by the specimen is collected by infinity-corrected microscope objective 115 (or other high-numerical-aperture objective lens) which is focused on the specimen by piezo positioner 120 (or other focusing mechanism).
- Dichroic mirror 730 is chosen to reflect light in the emission band of the first fluorophore towards tube lens 710 placed in front of two-dimensional detector array 720.
- Microscope objective 115 and tube lens 710 form a real image of the specimen on two-dimensional detector array 720.
- Data from the two-dimensional detector array is collected by frame grabber 770 or other electronic frame capture device and passed to computer 350.
- dichroic mirror 730 Light from the specimen 700 that was not reflected by dichroic mirror 730 continues up the microscope to reach dichroic mirror 740, which is chosen to reflect light in the emission band of the second fluorophore towards tube lens 750 placed in front of two-dimensional detector array 760.
- the microscope objective 115 and tube lens 750 form a real image of the specimen on two-dimensional detector array 760. Data from this two-dimensional detector array is read out by frame grabber 780 or other electronic frame capture device and passed to computer 350.
- Light from the specimen 700 that was not reflected by dichroic mirrors 730 and 740 contains light in the emission band wavelengths for fluorophore three, and continues up the microscope to reach tube lens 125, in front of two-dimensional detector array 330.
- the microscope objective 115 and tube lens 125 form a real image of the specimen on two-dimensional detector array 330.
- Data from this two-dimensional detector array is read out by frame grabber 340 or other electronic frame capture device and passed to computer 350.
- An image of the specimen is collected by moving the microscope slide at constant speed using motorized stage 105 in a direction perpendicular to the long dimension of the three detector arrays 720, 760 and 330 (which are all oriented with the long dimension of the arrays perpendicular to the motion of the real images projected on them by the microscope objective 115 and tube lenses 710, 750 and 125 respectively).
- a sequence of equally-spaced overlapping two-dimensional images from the each of the three arrays is passed to computer 350 by frame grabbers 770, 780 and 340 where three time-integrated images of one strip of the specimen are constructed, one for each fluorophore.
- These three images can be viewed separately (fluorescence images are essentially greyscale images) or combined using false colours into a colour image for viewing. In many cases the false colours are chosen to make the final image look like the image that would be seen through a fluorescence microscope.
- Figure 7 shows a scanner with three detection arms, one for each of three fluorophores (a scanner can also be envisioned for other numbers of fluorophores).
- quantum dots nanonocrystals
- several detection arms can be used. This is possible because quantum dots can be manufactured with very narrow emission bands, and they are inherently brighter and more stable than fluorophores.
- all quantum dots in a specimen can be excited with the same excitation wavelength, so a single wavelength source can be used which is not in the emission bands of any of the dots in the specimen, making it easier to separate the emission signals.
- white light source 110 is used to illuminate the specimen from below (instead of using light source 310), and the dichroic mirrors 730 and 740 are chosen to separate the colours detected by area detectors 770, 780 and 340 into red, green and blue. Images from each of the three detection arms are combined to produce a colour brightfield image. If area detector 340 is replaced by an RGB detector, dichroic mirrors 730 and 740 can be removed from the optical train and the single colour detector will produce a colour brightfield image.
- Figure 8 shows a third embodiment of this invention, a scanner in which a tunable filter 810 is used to provide a multi-spectral fluorescence slide scanner and method for imaging large specimens mounted on microscope slides.
- the tunable filter can be set to transmit a band of emission wavelengths from one fluorophore (or other fluorescent source) and a strip image recorded for that source, followed by setting a second wavelength band for a second fluorophore to record a strip image for that source, and so on until a strip image has been recorded for each fluorescence source in the specimen.
- the strip images can either be viewed separately or combined into a single image (usually false coloured) and the strips can then be assembled into a single image of the entire specimen.
- This instrument can also be used for brightfield imaging by replacing epifluorescence source 705 with white light transmission source 110, and using the tunable filter 810 to pass red, green and blue wavelengths to record red, green and blue strip images in sequence which can be combined into a single RGB brightfield image.
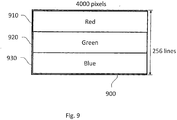
- Figure 9 shows a single two-dimensional CCD (or other technology) array 900 in which the top third 910 of the array is covered with a red transmission filter, the middle third 920 is covered with a green transmission filter, and the bottom third 930 is covered with a blue transmission filter.
- Such an array can be used to simultaneously image three colours, for example red, green and blue for brightfield imaging, or three different fluorophores in multi-spectral fluorescence (where the transmission filters are chosen with bandwidths that match the fluorescence emission peaks).
- Figure 10 shows a fourth embodiment of this invention, a scanner in which a detector array 900 (covered with red, green and blue transmission filters as discussed above) simultaneously records three strip images (red, green and blue) when white light transmission source 110 is used to illuminate the specimen from below.
- Image data from the top third 910 of array 900 is used to record the red image
- data from the middle third 920 of array 900 is used to record the green image
- that from the bottom third 930 of array 900 is used to record the blue image.
- Each of these images is recorded in separate strip images that can be combined into an RGB image after the scan for that strip is completed.
- Figure 9 shows a 4000 pixel x 256 line array - this is for example only - arrays with different pixel number width and number of lines can also be used.
- the epifluorescence light source 310 (or other epifluorescence source) is used instead of white light source 110, and transmission filters are chosen to cover fractions of the array 900, one matching the peak of the emission band of each fluorophore in the specimen.
- transmission filters are chosen to cover fractions of the array 900, one matching the peak of the emission band of each fluorophore in the specimen.
- a filter is chosen with transmission bandwidth to match the emission peak of each of the nanoparticles, and fluorescence from several nanoparticles can be imaged simultaneously.
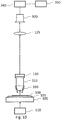
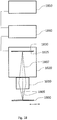
- Figure 11 is a schematic representation of a scanning fluorescence microscope that is a fifth embodiment of this invention.
- Light from white light source 1110 passes through tunable filter 1120, is partially reflected by beamsplitter 1130, passes through microscope objective 115, and illuminates an area of the surface of specimen 100, which is mounted on microscope slide 101 on moving microscope stage 105.
- Motion of the microscope stage is in a direction perpendicular to rows in the detector array ⁇ data is read out from rows in the detector array, usually the long dimension of the array (for example see Hamamatsu's ORCA-flash 4.0 camera, or PCO's pco.edge camera, both of which use Scientific CMOS (sCMOS) detector arrays) ⁇ .
- sCMOS Scientific CMOS
- Fluorescence emitted from the specimen is collected by microscope objective 115, is partially transmitted by beamsplitter 1130, and then passes through tunable filter 810 and is focused by tube lens 125 onto detector array 330, which is not covered by a colour filter array. Data from the detector array 330 is read out by frame grabber 340 and passed to computer 350 where an image strip is assembled for each fluorophore.
- Tunable filter 1120 is adjusted to transmit the appropriate excitation wavelength range for the first fluorophore
- tunable filter 810 is adjusted to transmit the emission wavelength band of the first fluorophore.
- Detector array 330 is read by frame grabber 340 which passes the data for the first image frame to computer 350, which stores this image frame at the beginning of a first strip image.
- the microscope stage is moved a distance equal to the distance required to move the image projected on the detector array by tube lens 125 a distance equal to the distance between rows in the array.
- Tunable filter 1120 is then adjusted to transmit the appropriate excitation wavelength range for the second fluorophore, and tunable filter 810 is adjusted to transmit the emission wavelength band of the second fluorophore.
- the first image frame for fluorophore 2 is stored in a second strip image.
- the microscope stage is moved a distance equal to the distance required to move the image the distance between pixels in the detector array, and a second image of the first fluorophore is collected, moved in the scan direction a distance equal to the distance between pixels, and added to the first image already stored in the strip image for the first fluorophore. Imaging continues from one fluorophore to the other until the entire strip of specimen has been imaged and a strip image has been collected for each fluorophore.
- the scanning stage usually moves at a constant speed, and the tunable filters are synchronized with the motion to produce one exposure every time the stage has moved a distance that is equivalent to the distance between image pixels.
- each image frame from the detector is moved by one pixel in the scan direction from the image before it, so when each image is added to one of the fluorophore strip images, it must be displaced by 2 pixels.
- three fluorophores are present, three images are collected during the time the stage moves a distance that will cause the moving image to move a distance equal to that between three rows of pixels in the detector array, and the tunable filters are synchronized to provide the appropriate excitation and emission wavelengths during the specimen motion.
- the specimen stage can be moved a distance equivalent to half the distance between image pixels between exposures and the tunable filters can be synchronized to change excitation and emission wavelengths each time the stage has moved a distance equivalent to half the distance between image pixels.
- tunable filters 810 and 1120 can be replaced by rotating optical filters or filter wheels that are synchronized to each other and to stage motion to pass the appropriate excitation and emission wavelengths.
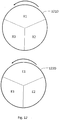
- Figure 12 shows one example of a pair of rotating optical filters designed for use for simultaneous imaging of three fluorophores, with first rotating optical filter 1210 (which replaces tunable filter 1120 in Figure 11 ) designed to pass three excitation wavelength bands X1, X2 and X3, chosen to excite the three fluorophores known to be present in specimen 100.
- Second rotating optical filter 1220 replaces tunable filter 810, and is designed to pass the three emission bands E1, E2 and E3 of the three fluorophores present in the specimen.
- a tunable light source can be used in place of the combination of white Light Source 1110 and tunable filter 1120 to provide an excitation wavelength band that is appropriate for the fluorophore in use.
- a tunable light source placed in the epifluorescence position shown by light source 310 in Figure 3 and synchronized with stage scan and the tunable emission filter 810 can replace white light source 1110 and tunable filter 1120.
- tunable filter 810 can be adjusted sequentially to pass red, green and blue, and R, G and B strip images can be acquired simultaneously and assembled after scanning into a single RGB image.
- R, G and B strip images can be acquired simultaneously and assembled after scanning into a single RGB image.
- data can be added to or averaged with data already present in the R, G and B components of a single RGB strip image if that is more convenient for data flow.
- the addition of a white illumination source below the specimen has resulted in a scanner that performs both brightfield and fluorescence imaging.
- beamsplitter 1130, tunable filter 1120 and white light source 1110 are removed, this becomes a brightfield-only scanner.
- a tunable light source in the same position as light source 310 in Figure 3 an epifluorescence position results in a brightfield and fluorescence scanner.
- a rotating filter like RGB filter 1220 can be used either to filter the incoming light from the source (where the filter is placed between the white light source and the specimen) or to filter light collected by the objective lens (where the filter is placed between the objective lens and the tube lens).
- filter rotation is synchronized with stage scan, either of these arrangements can be used to produce a colour brightfield scanner.
- Other colour combinations are possible, including but not limited to RGBW, CYGM and RGBE. When used in this manner, no colour filter array is required on the detector array, and the images do not require demosaicing.
- FIG 13 is a schematic representation of a scanning brightfield microscope that is a sixth embodiment of this invention.
- area detector array 1300 contains a mosaic Colour Filter Array (a Bayer filter, which is commonly used in single-chip colour cameras). Images acquired using a Bayer filter (or other common mosaic filters) are normally demosaiced using a computer algorithm before viewing, but this will not be necessary when Moving Specimen Image Averaging is used.
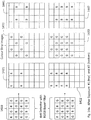
- a small 4x4 pixel area array 1410 using a Bayer filter is shown on the left side of Figure 14 . This small array example is used to explain how an area array using a Bayer filter can be used for Moving Specimen Image Averaging, however in practice much larger arrays are used (for example, 2560 x 256).
- the first exposure in a scan using the small array 1410 is shown at the top of Figure 14a .
- Three strip images are set up in RAM in computer 350, one strip each for red, green and blue, and data values in each pixel position are initially set to zero.
- Data from the first exposure is transferred to each of the strips, resulting in red strip image 1421, green strip image 1431, and blue strip image 1441, as shown at the top of Figure 14a .
- a second exposure is acquired, and data from this second exposure is transferred to the colour strip images, resulting in strip images 1422, 1432 and 1442.
- the simplest interpolation (which may be good enough in many cases) is simply to average the red or green pixels on either side of an empty pixel position. More complex interpolation could include an algorithm that includes changes in local brightness using the green pixels, or nearest neighbor interactions between adjacent pixels. Since a single chip colour camera was used to take all of the separate images, the colour image resulting from each exposure can be demosaiced and then added to the demosaiced images resulting from subsequent exposures using MSIA, but this is a calculation-intensive process that will not be necessary in most applications, and slows down image acquisition.
- a more realistic situation is one where the detector array is much larger than the 4 x 4 pixel array shown in Figure 14 .
- the same RGGB Bayer filter is used. If the array has 256 rows and 2560 columns of pixels, then each image strip is 2560 pixels wide. The first row to be fully exposed (after exposure #256) will be row 256 in each strip image (the first 255 rows of image data should be discarded), each green pixel will have been exposed 128 times, and the same rows of red and blue pixels as shown in Figure 14c will be exposed 128 times, or not at all. The final 255 rows in the image strip should be discarded. Since a 1cm scan contains 40,000 rows of data (assuming 1 ⁇ 4 micron pixels), discarding the first 255 and last 255 rows will not increase the scan time very much.
- the Bayer filter (and other common Colour Filter Arrays) were designed for cameras in which an entire colour image is captured in a single exposure. As discussed above, such filters can also be used for microscope slide scanners using Moving Specimen Image Averaging, but when the Bayer filter is used in that application the resolution of red and blue pixels in the horizontal direction is only half that in the vertical direction. The green pixels have full resolution in both directions. Interpolation is necessary to fill in the missing red and blue pixels in the horizontal direction, but this interpolation is much simpler than the demosaicing usually used with Bayer filter cameras. Many cameras are commercially available with Bayer filters, which is an advantage.
- FIG. 9 shows a two-dimensional sensor array in which the top third of the array was covered with a red transmission filter, the middle third was covered with a green transmission filter, and the bottom third was covered with a blue transmission filter, was shown in Figure 9 .
- This colour filter array is not useful for capturing an entire colour image in a single exposure, but is useful for scanning using Moving Specimen Image Averaging, and results in a final strip image in which all three colour components of the image have maximum resolution in both directions.
- SCFA Sccanning Colour Filter Arrays
- Figure 9 shows a first embodiment of a Scanning Colour Filter Array.
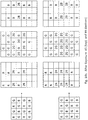
- FIG 15 shows a second embodiment of a Scanning Colour Filter Array.
- This SCFA is shown on a 5 x 6 pixel sensor array (top left), with the data flow from the first exposure to the image store for red, green and blue monochrome images (or to the R,G and B components of a single RGB image) on the right.
- the second exposure is shown at the bottom of Figure 15 , after the moving stage has moved a distance such that the image on the detector has moved a distance equal to the distance between rows of detector pixels.
- Data from the rows of Red, Green and Blue pixels is transferred to the image store and fills in the next rows of R, G and B pixel image data.
- the rows of R, G and B pixels in the R, G and B images will be completely filled in (not shown).
- Figure 16 shows a four-line sequence RGBW Scanning Colour Filter Array that is a third embodiment of a Scanning Colour Filter Array.
- the addition of a row of white (panchromatic) pixels with three rows of colour pixels adds several new possibilities for scanned images using MSIA.
- the clear (white) pixels are the brightest pixels in the array, and result in a panchromatic image strip that is the brightest of the four images and can also be used to detect infrared. This image will have the best contrast of the four images, and will be useful for image processing later since it is perfectly registered with the three single-colour images.
- each of the four images will be composed of pixels that have been exposed 64 times, and after MSIA the signal/noise ratio in each image will have been increased by a factor of 8.
- the white image will be useful for autofocusing, and can also be used for fluorescence imaging (the R, G and B images can be ignored or discarded when not required) with the addition of a fluorescence light source and emission filter.
- fluorescence imaging the light source and emission filter do not have to be synchronized with the scanning stage, and can be implemented using a white light epifluorescence source and filter cube.
- a standard fluorescence microscope with the addition of a scanning stage and a brightfield/fluorescence MSIA camera (a single-chip camera using an RGBW or RWGWBW Scanning Colour Filter Array), can be used for both RGB and fluorescence scanning.
- a second fluorophore can be imaged simply by changing the filter cube in the microscope and scanning again.
- FIG. 17 A third example of a Scanning Colour Filter Array is shown in Figure 17 , an RWGWBW Scanning Filter Colour Array.
- this array a row of clear (white) pixels is placed after each row of colour pixels.
- This filter array results in four images, as the RGBW array did, however in this case the exposure of the panchromatic image will be three times that of each of the colour images. This is particularly important for fluorescence imaging, where signal strength is low and there is considerable background noise.
- each of the single-colour images will be exposed 42 times, and each panchromatic image will be exposed 128 times. This results in increased signal/noise ratio in the fluorescence image (where it is required) compared to each of the R, G and B images.
Claims (15)
- Instrument zum Abtasten und Erhalten eines Farbbildes eines Prüfstücks (100), wobei das Instrument eine zweidimensionale Sensoranordnung (330) und eine Verschlussblende umfasst, die sich öffnet, um Sensoren, die die Sensoranordnung bilden, zu belichten, wobei das Prüfstück (100) an einem Träger (105) montiert wird, der relativ zur Sensoranordnung beweglich ist, wobei die Sensoranordnung eine Vielzahl von Reihen und Spalten aufweist und eine Farbfilteranordnung (1410) mit Filtern für mindestens drei verschiedene Farben aufweist,
wobei die Filteranordnung eine Mosaikquadratgitteranordnung ist, wobei die Verschlussblende mit der Bewegung des Trägers (105) synchronisiert wird, an dem das Prüfstück montiert ist, um die Verschlussblende zu öffnen und zu schließen, um ein zweidimensionales Einzelbild des Prüfstücks jedes Mal zu erfassen, wenn ein Blickfeld (410) der Sensoranordnung um einen Abstand von einem Pixel in der Bewegungsrichtung des Blickfeldes relativ zum Prüfstück bewegt wird, wobei die Sensoranordnung ein zweidimensionales Einzelbild jedes Mal erfasst, wenn die Verschlussblende geöffnet ist, und das zweidimensionale Einzelbild zu einer Einzelbildaufnahmevorrichtung (340) des Instruments jedes Mal überträgt, wenn die Verschlussblende geschlossen ist,
wobei das Instrument ferner einen Computer (350) umfasst, wobei der Computer dazu ausgelegt ist:die zweidimensionalen Einzelbilder über die Einzelbildaufnahmevorrichtung (340) zu empfangen,die Daten von den zweidimensionalen Einzelbildern in einen Bildstreifen für alle Farben der Farbfilteranordnung oder in Bildstreifen (1422, 1432, 1442) für jeweilige Farben der Farbfilteranordnung durch Addieren oder Mitteln der Pixelfarbwerte jedes neu erfassten zweidimensionalen Einzelbildes mit entsprechenden Pixelfarbwerten der vorherigen zweidimensionalen Einzelbilder in jeder Pixelposition für jeden Bildstreifen (1421, 1431, 1441) zu übertragen, undalle Bildstreifen (1422, 1432, 1442) zusammenzufügen, um ein Endbild des Prüfstücks zu erzeugen. - Instrument nach Anspruch 1, wobei die Farbfilteranordnung eine Mosaikfarbfilteranordnung (1410) ist, wobei das Instrument eingerichtet ist, um Hellfeldfarbbilder zu erfassen.
- Instrument nach Anspruch 2, wobei die Farbfilteranordnung ein Bayer-Filter (1410) ist.
- Instrument nach Anspruch 2 oder 3, wobei der Computer (350) dazu ausgelegt ist, zwischen nächsten Pixelwerten derselben Farbe zueinander zu interpolieren, um Vollfarbinformationen in jeder Pixelposition bereitzustellen.
- Instrument nach Anspruch 2, wobei die Mosaikfarbfilteranordnung eine Mosaikquadratgitteranordnung (1410) ist.
- Instrument nach Anspruch 1, wobei die Farbfilteranordnung eine Abtastfarbfilteranordnung ist und alle Pixel in einer Reihe in der Abtastfarbfilteranordnung dieselbe Farbe aufweisen, so dass keine Interpolation erforderlich ist, um Farbinformationen in jeder Pixelposition bereitzustellen.
- Instrument nach einem der Ansprüche 2 bis 5, wobei das Instrument ein konfokales Drehscheibenmikroskop ist, das für die Hellfeldabtastung verwendet wird, wenn das Prüfstück sich relativ zur Mosaikfarbfilteranordnung während der Abtastung bewegt, wobei das konfokale Drehscheibenmikroskop alternativ für die Echtzeitabbildung von kleinen interessierenden Bereichen im Prüfstück verwendet wird, wobei das Prüfstück relativ zur Mosaikfarbfilteranordnung stationär ist, wenn die Bilder aufgenommen werden, wobei die Bilder Demosaicing erfordern.
- Instrument nach Anspruch 1, wobei das Instrument dazu ausgelegt ist, Hellfeldfarbbilder oder Fluoreszenzfarbbilder zu erfassen.
- Instrument nach Anspruch 1, wobei der Träger (105) das Prüfstück relativ zur Sensoranordnung (330) mit einer konstanten Geschwindigkeit bewegt.
- Instrument nach Anspruch 1, wobei die Farbfilteranordnung eine Abtastfarbfilteranordnung ist und die Abtastfarbfilteranordnung eine Vielzahl von Reihen von Pixeln aufweist, wobei alle der Pixel in jeder Reihe dieselbe Farbe aufweisen, wobei mindestens eine Reihe der Vielzahl von Reihen weiße Pixel aufweist und mindestens drei andere Reihen der Vielzahl von Reihen lauter rote, lauter grüne und lauter blaue Pixel aufweisen.
- Instrument nach Anspruch 1, wobei die Farbfilteranordnung eine Abtastfarbfilteranordnung mit einer Vielzahl von Reihen ist, wobei alle Pixel in jeder Reihe dieselbe Farbe aufweisen, aber die Farbe zwischen benachbarten Reihen variiert, wobei die Filteranordnung mindestens vier Reihen aufweist, von denen eine Reihe weiße Pixel enthält, von denen eine andere Reihe rote Pixel enthält und von denen noch eine andere Reihe grüne Pixel enthält und von denen eine andere Reihe blaue Pixel enthält.
- Verfahren zum Abtasten und Erhalten eines Farbbildes eines Prüfstücks (100) unter Verwendung eines Instruments mit einer zweidimensionalen Sensoranordnung (330) mit einer Vielzahl von Reihen und Spalten und einer Verschlussblende, die sich öffnen, um Sensoren, die die Sensoranordnung bilden, zu belichten, wobei das Prüfstück an einem Träger (105) montiert wird, der relativ zur Sensoranordnung beweglich ist, wobei das Verfahren umfasst:Verwenden einer Farbfilteranordnung (1410) mit Filtern für mindestens drei verschiedene Farben an der Sensoranordnung;wobei die Filteranordnung eine Mosaikquadratgitteranordnung ist,Bewegen des Prüfstücks und des Prüfstückträgers relativ zur Sensoranordnung (330);Synchronisieren der Verschlussblende zum Öffnen und Schließen während der Bewegung des Prüfstücks (100) und des Prüfstückträgers (105) relativ zur Sensoranordnung (330), um ein zweidimensionales Einzelbild des Prüfstücks jedes Mal zu erfassen, wenn ein Blickfeld der Sensoranordnung um einen Abstand von einem Pixel in der Bewegungsrichtung des Blickfeldes relativ zum Prüfstück bewegt wird, wobei die Sensoranordnung ein zweidimensionales Einzelbild jedes Mal erfasst, wenn die Verschlussblende geöffnet ist, und das zweidimensionale Einzelbild zu einer Einzelbildaufnahmevorrichtung (340) des Instruments jedes Mal überträgt, wenn die Verschlussblende geschlossen ist;
Empfangen der zweidimensionalen Einzelbilder an einem Computer (350) über die Einzelbildaufnahmevorrichtung;Übertragen der Daten von den zweidimensionalen Einzelbildern in einen Bildstreifen für alle Farben der Farbfilteranordnung oder in Bildstreifen für jeweilige Farben der Farbfilteranordnung (1422, 1432, 1442) durch Addieren oder Mitteln der Pixelfarbwerte jedes neu erfassten zweidimensionalen Einzelbildes mit den entsprechenden Pixelfarbwerten der vorherigen zweidimensionalen Einzelbilder in jeder Pixelposition für jeden Bildstreifen (1421, 1431, 1441), undZusammenfügen aller Bildstreifen, um ein Endbild des Prüfstücks zu erzeugen. - Verfahren nach Anspruch 12, wobei die Farbfilteranordnung eine Abtastfarbfilteranordnung mit einer Vielzahl von Reihen ist, wobei alle Pixel in jeder Reihe dieselbe Farbe aufweisen, aber die Farbe zwischen benachbarten Reihen variiert, wobei mindestens drei Reihen von verschiedenen Farben vorhanden sind, wobei eine Farbsequenz der mindestens drei Reihen mindestens einmal in zusätzlichen Reihen der Abtastfarbfilteranordnung wiederholt ist.
- Verfahren nach Anspruch 13, wobei jede nicht-weiße Reihe ein Übertragungsfilter enthält, das einer Emissionswellenlänge eines speziellen Fluorophors entspricht.
- Verfahren nach Anspruch 12, wobei die Farbfilteranordnung eine Mosaikfarbfilteranordnung (1410) ist und wobei das Verfahren ferner das Interpolieren zwischen nächsten Pixelwerten derselben Farbe zueinander umfasst, um Vollfarbinformationen in jeder Pixelposition bereitzustellen.
Applications Claiming Priority (3)
| Application Number | Priority Date | Filing Date | Title |
|---|---|---|---|
| US201261664022P | 2012-06-25 | 2012-06-25 | |
| US13/730,488 US9575304B2 (en) | 2012-06-25 | 2012-12-28 | Pathology slide scanners for fluorescence and brightfield imaging and method of operation |
| PCT/CA2013/000592 WO2014000085A1 (en) | 2012-06-25 | 2013-06-25 | Pathology slide scanners for fluorescence and brightfield imaging and method of operation |
Publications (3)
| Publication Number | Publication Date |
|---|---|
| EP2864741A1 EP2864741A1 (de) | 2015-04-29 |
| EP2864741A4 EP2864741A4 (de) | 2016-10-19 |
| EP2864741B1 true EP2864741B1 (de) | 2018-03-21 |
Family
ID=49774123
Family Applications (1)
| Application Number | Title | Priority Date | Filing Date |
|---|---|---|---|
| EP13810226.4A Active EP2864741B1 (de) | 2012-06-25 | 2013-06-25 | Objektträgerscanner für fluoreszenz- und hellfeldbildgebung in der pathologie und verfahren zum betrieb |
Country Status (4)
| Country | Link |
|---|---|
| US (1) | US9575304B2 (de) |
| EP (1) | EP2864741B1 (de) |
| CA (1) | CA2877902C (de) |
| WO (1) | WO2014000085A1 (de) |
Families Citing this family (68)
| Publication number | Priority date | Publication date | Assignee | Title |
|---|---|---|---|---|
| US20080161744A1 (en) | 2006-09-07 | 2008-07-03 | University Of Rochester Medical Center | Pre-And Intra-Operative Localization of Penile Sentinel Nodes |
| US8406860B2 (en) | 2008-01-25 | 2013-03-26 | Novadaq Technologies Inc. | Method for evaluating blush in myocardial tissue |
| EP3358387A1 (de) | 2010-08-27 | 2018-08-08 | The Board of Trustees of The Leland Stanford Junior University | Mikroskopiebildgebungsvorrichtung mit erweiterten bildgebungseigenschaften |
| US9223138B2 (en) | 2011-12-23 | 2015-12-29 | Microsoft Technology Licensing, Llc | Pixel opacity for augmented reality |
| US8917453B2 (en) | 2011-12-23 | 2014-12-23 | Microsoft Corporation | Reflective array waveguide |
| US8638498B2 (en) | 2012-01-04 | 2014-01-28 | David D. Bohn | Eyebox adjustment for interpupillary distance |
| US9606586B2 (en) | 2012-01-23 | 2017-03-28 | Microsoft Technology Licensing, Llc | Heat transfer device |
| US9779643B2 (en) * | 2012-02-15 | 2017-10-03 | Microsoft Technology Licensing, Llc | Imaging structure emitter configurations |
| US9297996B2 (en) | 2012-02-15 | 2016-03-29 | Microsoft Technology Licensing, Llc | Laser illumination scanning |
| US9368546B2 (en) | 2012-02-15 | 2016-06-14 | Microsoft Technology Licensing, Llc | Imaging structure with embedded light sources |
| US9726887B2 (en) | 2012-02-15 | 2017-08-08 | Microsoft Technology Licensing, Llc | Imaging structure color conversion |
| US9578318B2 (en) | 2012-03-14 | 2017-02-21 | Microsoft Technology Licensing, Llc | Imaging structure emitter calibration |
| US11068049B2 (en) | 2012-03-23 | 2021-07-20 | Microsoft Technology Licensing, Llc | Light guide display and field of view |
| WO2013145487A1 (ja) * | 2012-03-27 | 2013-10-03 | ソニー株式会社 | 画像処理装置、撮像素子、および画像処理方法、並びにプログラム |
| US9558590B2 (en) | 2012-03-28 | 2017-01-31 | Microsoft Technology Licensing, Llc | Augmented reality light guide display |
| US10191515B2 (en) | 2012-03-28 | 2019-01-29 | Microsoft Technology Licensing, Llc | Mobile device light guide display |
| US9717981B2 (en) | 2012-04-05 | 2017-08-01 | Microsoft Technology Licensing, Llc | Augmented reality and physical games |
| US10502876B2 (en) | 2012-05-22 | 2019-12-10 | Microsoft Technology Licensing, Llc | Waveguide optics focus elements |
| US8989535B2 (en) | 2012-06-04 | 2015-03-24 | Microsoft Technology Licensing, Llc | Multiple waveguide imaging structure |
| US10278585B2 (en) | 2012-06-21 | 2019-05-07 | Novadaq Technologies ULC | Quantification and analysis of angiography and perfusion |
| US10192358B2 (en) | 2012-12-20 | 2019-01-29 | Microsoft Technology Licensing, Llc | Auto-stereoscopic augmented reality display |
| WO2014127468A1 (en) * | 2013-02-25 | 2014-08-28 | Huron Technologies International Inc. | Microscopy slide scanner with variable magnification |
| US9769399B2 (en) | 2013-03-15 | 2017-09-19 | Yale University | Techniques for processing imaging data having sensor-dependent noise |
| US9267784B2 (en) * | 2013-07-15 | 2016-02-23 | Faro Technologies, Inc. | Laser line probe having improved high dynamic range |
| DE102013019347A1 (de) * | 2013-08-15 | 2015-02-19 | Carl Zeiss Microscopy Gmbh | Hochauflösende Scanning-Mikroskopie |
| DE102013019348A1 (de) * | 2013-08-15 | 2015-02-19 | Carl Zeiss Microscopy Gmbh | Hochauflösende Scanning-Mikroskopie |
| US9658061B2 (en) | 2013-12-31 | 2017-05-23 | Faro Technologies, Inc. | Line scanner that uses a color image sensor to improve dynamic range |
| US9531967B2 (en) | 2013-12-31 | 2016-12-27 | Faro Technologies, Inc. | Dynamic range of a line scanner having a photosensitive array that provides variable exposure |
| EP3108222B1 (de) * | 2014-02-17 | 2022-03-30 | Eaton Intelligent Power Limited | Sauerstoffsensor enthaltend eine optische faser mit grossem durchmesser und einer beschichteten spitze |
| US10375300B2 (en) * | 2014-04-28 | 2019-08-06 | Lynx System Developers, Inc. | Methods for processing event timing data |
| JP6355961B2 (ja) * | 2014-04-30 | 2018-07-11 | オリンパス株式会社 | 標本観察装置 |
| US9753140B2 (en) * | 2014-05-05 | 2017-09-05 | Raytheon Company | Methods and apparatus for imaging in scattering environments |
| US9304235B2 (en) | 2014-07-30 | 2016-04-05 | Microsoft Technology Licensing, Llc | Microfabrication |
| US10254942B2 (en) | 2014-07-31 | 2019-04-09 | Microsoft Technology Licensing, Llc | Adaptive sizing and positioning of application windows |
| US10678412B2 (en) | 2014-07-31 | 2020-06-09 | Microsoft Technology Licensing, Llc | Dynamic joint dividers for application windows |
| US10592080B2 (en) | 2014-07-31 | 2020-03-17 | Microsoft Technology Licensing, Llc | Assisted presentation of application windows |
| WO2016049756A1 (en) | 2014-09-29 | 2016-04-07 | Novadaq Technologies Inc. | Imaging a target fluorophore in a biological material in the presence of autofluorescence |
| EP3203902B1 (de) | 2014-10-09 | 2021-07-07 | Novadaq Technologies ULC | Quantifizierung des absoluten blutströmung in gewebe mittels fluoreszenzvermittelter photoplethysmographie |
| JP6351765B2 (ja) * | 2015-01-27 | 2018-07-04 | 株式会社日立ハイテクノロジーズ | 多色蛍光分析装置 |
| US9429692B1 (en) | 2015-02-09 | 2016-08-30 | Microsoft Technology Licensing, Llc | Optical components |
| US9423360B1 (en) | 2015-02-09 | 2016-08-23 | Microsoft Technology Licensing, Llc | Optical components |
| US9372347B1 (en) | 2015-02-09 | 2016-06-21 | Microsoft Technology Licensing, Llc | Display system |
| US10018844B2 (en) | 2015-02-09 | 2018-07-10 | Microsoft Technology Licensing, Llc | Wearable image display system |
| US10317677B2 (en) | 2015-02-09 | 2019-06-11 | Microsoft Technology Licensing, Llc | Display system |
| US11086216B2 (en) | 2015-02-09 | 2021-08-10 | Microsoft Technology Licensing, Llc | Generating electronic components |
| US9535253B2 (en) | 2015-02-09 | 2017-01-03 | Microsoft Technology Licensing, Llc | Display system |
| US9827209B2 (en) | 2015-02-09 | 2017-11-28 | Microsoft Technology Licensing, Llc | Display system |
| US9513480B2 (en) | 2015-02-09 | 2016-12-06 | Microsoft Technology Licensing, Llc | Waveguide |
| RU2718149C2 (ru) | 2015-03-19 | 2020-03-30 | Конинклейке Филипс Н.В. | Освещение при сканировании для цифровой патологии |
| CA2981348C (en) * | 2015-04-02 | 2023-05-23 | Huron Technologies International Inc. | High resolution pathology scanner with improved signal to noise ratio |
| US9645291B1 (en) * | 2016-04-18 | 2017-05-09 | Ii-Vi Incorporated | Voltage-tunable optical filters for instrumentation applications |
| CA3024346A1 (en) * | 2016-05-19 | 2017-11-23 | Huron Technologies International Inc. | Spectrally-resolved scanning microscope |
| US10203491B2 (en) | 2016-08-01 | 2019-02-12 | Verily Life Sciences Llc | Pathology data capture |
| US10025902B2 (en) | 2016-08-12 | 2018-07-17 | Verily Life Sciences Llc | Enhanced pathology diagnosis |
| EP3504577A4 (de) * | 2016-08-26 | 2020-04-01 | Huron Technologies International Inc. | Abtastmikroskop mit verwendung von mosaikabtastfilter |
| CA3035109C (en) * | 2016-08-26 | 2024-01-02 | Huron Technologies International Inc. | Scanning microscope using a mosaic scan filter |
| CA3049922A1 (en) | 2017-02-10 | 2018-08-16 | Novadaq Technologies ULC | Open-field handheld fluorescence imaging systems and methods |
| CN107040879B (zh) * | 2017-04-14 | 2020-04-14 | 电子科技大学 | 一种基于遗传模糊树的无线传感网节点联合移动算法 |
| EP3615916A4 (de) * | 2017-04-24 | 2020-12-30 | Technologies International Inc. Huron | Rastermikroskop zur 3d-bildgebung mittels msia |
| US10823952B2 (en) * | 2017-06-22 | 2020-11-03 | Huron Technologies International Inc. | MSIA scanning instrument with increased dynamic range |
| DE102017121483B3 (de) * | 2017-09-15 | 2019-03-07 | Leica Microsystems Cms Gmbh | Verfahren zur Untersuchung einer multispektralen Probe, Steuereinheit hierfür und Mikroskop-Anordnung |
| NL2020622B1 (en) * | 2018-01-24 | 2019-07-30 | Lllumina Cambridge Ltd | Reduced dimensionality structured illumination microscopy with patterned arrays of nanowells |
| CN110378184A (zh) | 2018-04-12 | 2019-10-25 | 北京图森未来科技有限公司 | 一种应用于自动驾驶车辆的图像处理方法、装置 |
| US11143855B2 (en) | 2018-07-17 | 2021-10-12 | Huron Technologies International Inc. | Scanning microscope using pulsed illumination and MSIA |
| US11294162B2 (en) | 2019-02-07 | 2022-04-05 | Nanotronics Imaging, Inc. | Fluorescence microscopy inspection systems, apparatus and methods with darkfield channel |
| CN111879771A (zh) * | 2020-07-16 | 2020-11-03 | 梅傲科技(广州)有限公司 | 一种带有光源滤波片的数字病理图像扫描仪 |
| WO2022056385A1 (en) * | 2020-09-14 | 2022-03-17 | Singular Genomics Systems, Inc. | Methods and systems for multidimensional imaging |
| CN116744123B (zh) * | 2022-12-14 | 2024-01-23 | 深圳市中图仪器股份有限公司 | 共焦测量系统的多孔盘 |
Family Cites Families (13)
| Publication number | Priority date | Publication date | Assignee | Title |
|---|---|---|---|---|
| US4081277A (en) * | 1976-10-08 | 1978-03-28 | Eastman Kodak Company | Method for making a solid-state color imaging device having an integral color filter and the device |
| US6339217B1 (en) * | 1995-07-28 | 2002-01-15 | General Nanotechnology Llc | Scanning probe microscope assembly and method for making spectrophotometric, near-field, and scanning probe measurements |
| JP3532781B2 (ja) * | 1999-02-12 | 2004-05-31 | 株式会社メガチップス | 画像入力装置の画像処理回路 |
| US6803955B1 (en) * | 1999-03-03 | 2004-10-12 | Olympus Corporation | Imaging device and imaging apparatus |
| US6532086B1 (en) * | 1999-11-19 | 2003-03-11 | Xerox Corporation | Optical color matrixing using time delay and integration sensor arrays |
| US6711283B1 (en) * | 2000-05-03 | 2004-03-23 | Aperio Technologies, Inc. | Fully automatic rapid microscope slide scanner |
| US20060133657A1 (en) * | 2004-08-18 | 2006-06-22 | Tripath Imaging, Inc. | Microscopy system having automatic and interactive modes for forming a magnified mosaic image and associated method |
| US8164622B2 (en) * | 2005-07-01 | 2012-04-24 | Aperio Technologies, Inc. | System and method for single optical axis multi-detector microscope slide scanner |
| WO2007095090A2 (en) * | 2006-02-10 | 2007-08-23 | Monogen, Inc. | Method and apparatus and computer program product for collecting digital image data from microscope media-based specimens |
| EP1989583B1 (de) | 2006-02-27 | 2017-07-19 | Leica Biosystems Imaging, Inc. | System und verfahren für einen einachsigen optischen objektträger-scanner mit mehreren abtastern |
| US7629124B2 (en) * | 2006-06-30 | 2009-12-08 | Canon U.S. Life Sciences, Inc. | Real-time PCR in micro-channels |
| US7787112B2 (en) * | 2007-10-22 | 2010-08-31 | Visiongate, Inc. | Depth of field extension for optical tomography |
| JP5677770B2 (ja) * | 2009-06-25 | 2015-02-25 | オリンパス株式会社 | 医療診断支援装置、バーチャル顕微鏡システムおよび標本支持部材 |
-
2012
- 2012-12-28 US US13/730,488 patent/US9575304B2/en active Active
-
2013
- 2013-06-25 CA CA2877902A patent/CA2877902C/en active Active
- 2013-06-25 WO PCT/CA2013/000592 patent/WO2014000085A1/en active Application Filing
- 2013-06-25 EP EP13810226.4A patent/EP2864741B1/de active Active
Non-Patent Citations (1)
| Title |
|---|
| None * |
Also Published As
| Publication number | Publication date |
|---|---|
| WO2014000085A1 (en) | 2014-01-03 |
| US9575304B2 (en) | 2017-02-21 |
| CA2877902A1 (en) | 2014-01-03 |
| EP2864741A4 (de) | 2016-10-19 |
| CA2877902C (en) | 2021-09-14 |
| EP2864741A1 (de) | 2015-04-29 |
| US20130342674A1 (en) | 2013-12-26 |
Similar Documents
| Publication | Publication Date | Title |
|---|---|---|
| EP2864741B1 (de) | Objektträgerscanner für fluoreszenz- und hellfeldbildgebung in der pathologie und verfahren zum betrieb | |
| EP2656133B1 (de) | Krankheits-gleitscanner | |
| US20140125776A1 (en) | 3d pathology slide scanner | |
| US9804376B2 (en) | Scanner with increased dynamic range | |
| Jonkman et al. | Any way you slice it—a comparison of confocal microscopy techniques | |
| CA2849330C (en) | Slide scanner with a tilted image | |
| US11269171B2 (en) | Spectrally-resolved scanning microscope | |
| US11106026B2 (en) | Scanning microscope for 3D imaging using MSIA | |
| US20160004062A1 (en) | Microscopy slide scanner with variable magnification | |
| US11143855B2 (en) | Scanning microscope using pulsed illumination and MSIA | |
| CA3035109C (en) | Scanning microscope using a mosaic scan filter | |
| EP3504577A1 (de) | Abtastmikroskop mit verwendung von mosaikabtastfilter | |
| Varga et al. | Automated high throughput whole slide imaging using area sensors, flash light illumination and solid state light engine |
Legal Events
| Date | Code | Title | Description |
|---|---|---|---|
| PUAI | Public reference made under article 153(3) epc to a published international application that has entered the european phase |
Free format text: ORIGINAL CODE: 0009012 |
|
| 17P | Request for examination filed |
Effective date: 20150123 |
|
| AK | Designated contracting states |
Kind code of ref document: A1 Designated state(s): AL AT BE BG CH CY CZ DE DK EE ES FI FR GB GR HR HU IE IS IT LI LT LU LV MC MK MT NL NO PL PT RO RS SE SI SK SM TR |
|
| AX | Request for extension of the european patent |
Extension state: BA ME |
|
| DAX | Request for extension of the european patent (deleted) | ||
| RIC1 | Information provided on ipc code assigned before grant |
Ipc: G01J 3/443 20060101ALI20160321BHEP Ipc: G02B 21/36 20060101ALI20160321BHEP Ipc: G01J 3/06 20060101AFI20160321BHEP Ipc: G01J 3/12 20060101ALI20160321BHEP |
|
| RA4 | Supplementary search report drawn up and despatched (corrected) |
Effective date: 20160920 |
|
| RIC1 | Information provided on ipc code assigned before grant |
Ipc: G02B 21/36 20060101ALI20160914BHEP Ipc: G01J 3/443 20060101ALI20160914BHEP Ipc: G01J 3/12 20060101ALI20160914BHEP Ipc: G01J 3/06 20060101AFI20160914BHEP |
|
| GRAP | Despatch of communication of intention to grant a patent |
Free format text: ORIGINAL CODE: EPIDOSNIGR1 |
|
| RIC1 | Information provided on ipc code assigned before grant |
Ipc: G01J 3/12 20060101ALI20170901BHEP Ipc: G02B 5/20 20060101ALI20170901BHEP Ipc: G01N 21/64 20060101ALI20170901BHEP Ipc: G01J 3/443 20060101ALI20170901BHEP Ipc: G02B 21/36 20060101ALI20170901BHEP Ipc: G01J 3/06 20060101AFI20170901BHEP Ipc: G02B 21/12 20060101ALI20170901BHEP |
|
| INTG | Intention to grant announced |
Effective date: 20171009 |
|
| GRAS | Grant fee paid |
Free format text: ORIGINAL CODE: EPIDOSNIGR3 |
|
| GRAA | (expected) grant |
Free format text: ORIGINAL CODE: 0009210 |
|
| AK | Designated contracting states |
Kind code of ref document: B1 Designated state(s): AL AT BE BG CH CY CZ DE DK EE ES FI FR GB GR HR HU IE IS IT LI LT LU LV MC MK MT NL NO PL PT RO RS SE SI SK SM TR |
|
| REG | Reference to a national code |
Ref country code: GB Ref legal event code: FG4D |
|
| REG | Reference to a national code |
Ref country code: CH Ref legal event code: EP |
|
| REG | Reference to a national code |
Ref country code: AT Ref legal event code: REF Ref document number: 981620 Country of ref document: AT Kind code of ref document: T Effective date: 20180415 |
|
| REG | Reference to a national code |
Ref country code: IE Ref legal event code: FG4D |
|
| REG | Reference to a national code |
Ref country code: DE Ref legal event code: R096 Ref document number: 602013034788 Country of ref document: DE |
|
| REG | Reference to a national code |
Ref country code: NL Ref legal event code: MP Effective date: 20180321 |
|
| PG25 | Lapsed in a contracting state [announced via postgrant information from national office to epo] |
Ref country code: HR Free format text: LAPSE BECAUSE OF FAILURE TO SUBMIT A TRANSLATION OF THE DESCRIPTION OR TO PAY THE FEE WITHIN THE PRESCRIBED TIME-LIMIT Effective date: 20180321 Ref country code: CY Free format text: LAPSE BECAUSE OF FAILURE TO SUBMIT A TRANSLATION OF THE DESCRIPTION OR TO PAY THE FEE WITHIN THE PRESCRIBED TIME-LIMIT Effective date: 20180321 Ref country code: LT Free format text: LAPSE BECAUSE OF FAILURE TO SUBMIT A TRANSLATION OF THE DESCRIPTION OR TO PAY THE FEE WITHIN THE PRESCRIBED TIME-LIMIT Effective date: 20180321 Ref country code: NO Free format text: LAPSE BECAUSE OF FAILURE TO SUBMIT A TRANSLATION OF THE DESCRIPTION OR TO PAY THE FEE WITHIN THE PRESCRIBED TIME-LIMIT Effective date: 20180621 Ref country code: FI Free format text: LAPSE BECAUSE OF FAILURE TO SUBMIT A TRANSLATION OF THE DESCRIPTION OR TO PAY THE FEE WITHIN THE PRESCRIBED TIME-LIMIT Effective date: 20180321 |
|
| REG | Reference to a national code |
Ref country code: LT Ref legal event code: MG4D |
|
| REG | Reference to a national code |
Ref country code: AT Ref legal event code: MK05 Ref document number: 981620 Country of ref document: AT Kind code of ref document: T Effective date: 20180321 |
|
| PG25 | Lapsed in a contracting state [announced via postgrant information from national office to epo] |
Ref country code: LV Free format text: LAPSE BECAUSE OF FAILURE TO SUBMIT A TRANSLATION OF THE DESCRIPTION OR TO PAY THE FEE WITHIN THE PRESCRIBED TIME-LIMIT Effective date: 20180321 Ref country code: SE Free format text: LAPSE BECAUSE OF FAILURE TO SUBMIT A TRANSLATION OF THE DESCRIPTION OR TO PAY THE FEE WITHIN THE PRESCRIBED TIME-LIMIT Effective date: 20180321 Ref country code: GR Free format text: LAPSE BECAUSE OF FAILURE TO SUBMIT A TRANSLATION OF THE DESCRIPTION OR TO PAY THE FEE WITHIN THE PRESCRIBED TIME-LIMIT Effective date: 20180622 Ref country code: RS Free format text: LAPSE BECAUSE OF FAILURE TO SUBMIT A TRANSLATION OF THE DESCRIPTION OR TO PAY THE FEE WITHIN THE PRESCRIBED TIME-LIMIT Effective date: 20180321 Ref country code: BG Free format text: LAPSE BECAUSE OF FAILURE TO SUBMIT A TRANSLATION OF THE DESCRIPTION OR TO PAY THE FEE WITHIN THE PRESCRIBED TIME-LIMIT Effective date: 20180621 |
|
| PG25 | Lapsed in a contracting state [announced via postgrant information from national office to epo] |
Ref country code: AL Free format text: LAPSE BECAUSE OF FAILURE TO SUBMIT A TRANSLATION OF THE DESCRIPTION OR TO PAY THE FEE WITHIN THE PRESCRIBED TIME-LIMIT Effective date: 20180321 Ref country code: ES Free format text: LAPSE BECAUSE OF FAILURE TO SUBMIT A TRANSLATION OF THE DESCRIPTION OR TO PAY THE FEE WITHIN THE PRESCRIBED TIME-LIMIT Effective date: 20180321 Ref country code: PL Free format text: LAPSE BECAUSE OF FAILURE TO SUBMIT A TRANSLATION OF THE DESCRIPTION OR TO PAY THE FEE WITHIN THE PRESCRIBED TIME-LIMIT Effective date: 20180321 Ref country code: NL Free format text: LAPSE BECAUSE OF FAILURE TO SUBMIT A TRANSLATION OF THE DESCRIPTION OR TO PAY THE FEE WITHIN THE PRESCRIBED TIME-LIMIT Effective date: 20180321 Ref country code: IT Free format text: LAPSE BECAUSE OF FAILURE TO SUBMIT A TRANSLATION OF THE DESCRIPTION OR TO PAY THE FEE WITHIN THE PRESCRIBED TIME-LIMIT Effective date: 20180321 Ref country code: RO Free format text: LAPSE BECAUSE OF FAILURE TO SUBMIT A TRANSLATION OF THE DESCRIPTION OR TO PAY THE FEE WITHIN THE PRESCRIBED TIME-LIMIT Effective date: 20180321 Ref country code: EE Free format text: LAPSE BECAUSE OF FAILURE TO SUBMIT A TRANSLATION OF THE DESCRIPTION OR TO PAY THE FEE WITHIN THE PRESCRIBED TIME-LIMIT Effective date: 20180321 |
|
| PG25 | Lapsed in a contracting state [announced via postgrant information from national office to epo] |
Ref country code: SM Free format text: LAPSE BECAUSE OF FAILURE TO SUBMIT A TRANSLATION OF THE DESCRIPTION OR TO PAY THE FEE WITHIN THE PRESCRIBED TIME-LIMIT Effective date: 20180321 Ref country code: AT Free format text: LAPSE BECAUSE OF FAILURE TO SUBMIT A TRANSLATION OF THE DESCRIPTION OR TO PAY THE FEE WITHIN THE PRESCRIBED TIME-LIMIT Effective date: 20180321 Ref country code: CZ Free format text: LAPSE BECAUSE OF FAILURE TO SUBMIT A TRANSLATION OF THE DESCRIPTION OR TO PAY THE FEE WITHIN THE PRESCRIBED TIME-LIMIT Effective date: 20180321 Ref country code: SK Free format text: LAPSE BECAUSE OF FAILURE TO SUBMIT A TRANSLATION OF THE DESCRIPTION OR TO PAY THE FEE WITHIN THE PRESCRIBED TIME-LIMIT Effective date: 20180321 |
|
| PG25 | Lapsed in a contracting state [announced via postgrant information from national office to epo] |
Ref country code: PT Free format text: LAPSE BECAUSE OF FAILURE TO SUBMIT A TRANSLATION OF THE DESCRIPTION OR TO PAY THE FEE WITHIN THE PRESCRIBED TIME-LIMIT Effective date: 20180723 |
|
| REG | Reference to a national code |
Ref country code: DE Ref legal event code: R097 Ref document number: 602013034788 Country of ref document: DE |
|
| PLBE | No opposition filed within time limit |
Free format text: ORIGINAL CODE: 0009261 |
|
| STAA | Information on the status of an ep patent application or granted ep patent |
Free format text: STATUS: NO OPPOSITION FILED WITHIN TIME LIMIT |
|
| PG25 | Lapsed in a contracting state [announced via postgrant information from national office to epo] |
Ref country code: DK Free format text: LAPSE BECAUSE OF FAILURE TO SUBMIT A TRANSLATION OF THE DESCRIPTION OR TO PAY THE FEE WITHIN THE PRESCRIBED TIME-LIMIT Effective date: 20180321 |
|
| REG | Reference to a national code |
Ref country code: CH Ref legal event code: PL |
|
| 26N | No opposition filed |
Effective date: 20190102 |
|
| REG | Reference to a national code |
Ref country code: BE Ref legal event code: MM Effective date: 20180630 |
|
| REG | Reference to a national code |
Ref country code: IE Ref legal event code: MM4A |
|
| PG25 | Lapsed in a contracting state [announced via postgrant information from national office to epo] |
Ref country code: LU Free format text: LAPSE BECAUSE OF NON-PAYMENT OF DUE FEES Effective date: 20180625 Ref country code: MC Free format text: LAPSE BECAUSE OF FAILURE TO SUBMIT A TRANSLATION OF THE DESCRIPTION OR TO PAY THE FEE WITHIN THE PRESCRIBED TIME-LIMIT Effective date: 20180321 |
|
| PG25 | Lapsed in a contracting state [announced via postgrant information from national office to epo] |
Ref country code: LI Free format text: LAPSE BECAUSE OF NON-PAYMENT OF DUE FEES Effective date: 20180630 Ref country code: IE Free format text: LAPSE BECAUSE OF NON-PAYMENT OF DUE FEES Effective date: 20180625 Ref country code: FR Free format text: LAPSE BECAUSE OF NON-PAYMENT OF DUE FEES Effective date: 20180630 Ref country code: CH Free format text: LAPSE BECAUSE OF NON-PAYMENT OF DUE FEES Effective date: 20180630 |
|
| PG25 | Lapsed in a contracting state [announced via postgrant information from national office to epo] |
Ref country code: SI Free format text: LAPSE BECAUSE OF FAILURE TO SUBMIT A TRANSLATION OF THE DESCRIPTION OR TO PAY THE FEE WITHIN THE PRESCRIBED TIME-LIMIT Effective date: 20180321 Ref country code: BE Free format text: LAPSE BECAUSE OF NON-PAYMENT OF DUE FEES Effective date: 20180630 |
|
| PG25 | Lapsed in a contracting state [announced via postgrant information from national office to epo] |
Ref country code: MT Free format text: LAPSE BECAUSE OF NON-PAYMENT OF DUE FEES Effective date: 20180625 |
|
| PG25 | Lapsed in a contracting state [announced via postgrant information from national office to epo] |
Ref country code: TR Free format text: LAPSE BECAUSE OF FAILURE TO SUBMIT A TRANSLATION OF THE DESCRIPTION OR TO PAY THE FEE WITHIN THE PRESCRIBED TIME-LIMIT Effective date: 20180321 |
|
| PG25 | Lapsed in a contracting state [announced via postgrant information from national office to epo] |
Ref country code: MK Free format text: LAPSE BECAUSE OF NON-PAYMENT OF DUE FEES Effective date: 20180321 Ref country code: HU Free format text: LAPSE BECAUSE OF FAILURE TO SUBMIT A TRANSLATION OF THE DESCRIPTION OR TO PAY THE FEE WITHIN THE PRESCRIBED TIME-LIMIT; INVALID AB INITIO Effective date: 20130625 |
|
| PG25 | Lapsed in a contracting state [announced via postgrant information from national office to epo] |
Ref country code: IS Free format text: LAPSE BECAUSE OF FAILURE TO SUBMIT A TRANSLATION OF THE DESCRIPTION OR TO PAY THE FEE WITHIN THE PRESCRIBED TIME-LIMIT Effective date: 20180721 |
|
| PGFP | Annual fee paid to national office [announced via postgrant information from national office to epo] |
Ref country code: DE Payment date: 20230608 Year of fee payment: 11 |
|
| PGFP | Annual fee paid to national office [announced via postgrant information from national office to epo] |
Ref country code: GB Payment date: 20230606 Year of fee payment: 11 |