EP2830496B1 - A method and apparatus for processing sound recordings of a patient - Google Patents
A method and apparatus for processing sound recordings of a patient Download PDFInfo
- Publication number
- EP2830496B1 EP2830496B1 EP13768257.1A EP13768257A EP2830496B1 EP 2830496 B1 EP2830496 B1 EP 2830496B1 EP 13768257 A EP13768257 A EP 13768257A EP 2830496 B1 EP2830496 B1 EP 2830496B1
- Authority
- EP
- European Patent Office
- Prior art keywords
- cough
- pneumonia
- sounds
- features
- pneumonic
- Prior art date
- Legal status (The legal status is an assumption and is not a legal conclusion. Google has not performed a legal analysis and makes no representation as to the accuracy of the status listed.)
- Active
Links
- 238000000034 method Methods 0.000 title claims description 191
- 238000012545 processing Methods 0.000 title claims description 13
- 206010011224 Cough Diseases 0.000 claims description 506
- 206010035664 Pneumonia Diseases 0.000 claims description 144
- 238000012549 training Methods 0.000 claims description 62
- 230000008569 process Effects 0.000 claims description 53
- 238000003745 diagnosis Methods 0.000 claims description 49
- 230000029058 respiratory gaseous exchange Effects 0.000 claims description 38
- 201000010099 disease Diseases 0.000 claims description 34
- 208000037265 diseases, disorders, signs and symptoms Diseases 0.000 claims description 34
- 239000013598 vector Substances 0.000 claims description 21
- 238000007477 logistic regression Methods 0.000 claims description 19
- 238000013528 artificial neural network Methods 0.000 claims description 18
- 208000006673 asthma Diseases 0.000 claims description 17
- 210000002569 neuron Anatomy 0.000 claims description 15
- 206010006451 bronchitis Diseases 0.000 claims description 13
- 201000009240 nasopharyngitis Diseases 0.000 claims description 11
- 208000037656 Respiratory Sounds Diseases 0.000 claims description 8
- 238000001514 detection method Methods 0.000 claims description 8
- 238000012544 monitoring process Methods 0.000 claims description 7
- 206010047924 Wheezing Diseases 0.000 claims description 6
- QVGXLLKOCUKJST-UHFFFAOYSA-N atomic oxygen Chemical compound [O] QVGXLLKOCUKJST-UHFFFAOYSA-N 0.000 claims description 4
- 208000019622 heart disease Diseases 0.000 claims description 4
- 201000004792 malaria Diseases 0.000 claims description 4
- 229910052760 oxygen Inorganic materials 0.000 claims description 4
- 239000001301 oxygen Substances 0.000 claims description 4
- 238000012706 support-vector machine Methods 0.000 claims description 4
- 206010060786 Laryngomalacia Diseases 0.000 claims description 3
- 238000004891 communication Methods 0.000 claims description 3
- 230000035945 sensitivity Effects 0.000 description 72
- 238000010200 validation analysis Methods 0.000 description 35
- 206010037660 Pyrexia Diseases 0.000 description 32
- 238000012360 testing method Methods 0.000 description 28
- 239000011159 matrix material Substances 0.000 description 24
- 238000004458 analytical method Methods 0.000 description 22
- 238000013461 design Methods 0.000 description 21
- 101000608734 Helianthus annuus 11 kDa late embryogenesis abundant protein Proteins 0.000 description 17
- 208000024891 symptom Diseases 0.000 description 17
- 230000006870 function Effects 0.000 description 15
- 230000011218 segmentation Effects 0.000 description 15
- 238000005516 engineering process Methods 0.000 description 13
- 208000017574 dry cough Diseases 0.000 description 12
- 210000000038 chest Anatomy 0.000 description 11
- 230000007717 exclusion Effects 0.000 description 11
- 230000000241 respiratory effect Effects 0.000 description 11
- 230000005236 sound signal Effects 0.000 description 11
- 238000013459 approach Methods 0.000 description 10
- 238000001228 spectrum Methods 0.000 description 10
- 238000010333 wet classification Methods 0.000 description 10
- 206010036790 Productive cough Diseases 0.000 description 9
- 238000010586 diagram Methods 0.000 description 9
- 208000023504 respiratory system disease Diseases 0.000 description 9
- 208000024794 sputum Diseases 0.000 description 9
- 230000001419 dependent effect Effects 0.000 description 8
- 238000009826 distribution Methods 0.000 description 8
- 238000000605 extraction Methods 0.000 description 8
- 210000003802 sputum Anatomy 0.000 description 8
- 230000034994 death Effects 0.000 description 7
- 231100000517 death Toxicity 0.000 description 7
- 238000011161 development Methods 0.000 description 7
- 230000018109 developmental process Effects 0.000 description 7
- 206010006448 Bronchiolitis Diseases 0.000 description 6
- 206010041235 Snoring Diseases 0.000 description 6
- 238000010332 dry classification Methods 0.000 description 6
- 238000011282 treatment Methods 0.000 description 6
- 238000003759 clinical diagnosis Methods 0.000 description 5
- PCHJSUWPFVWCPO-UHFFFAOYSA-N gold Chemical compound [Au] PCHJSUWPFVWCPO-UHFFFAOYSA-N 0.000 description 5
- 208000015181 infectious disease Diseases 0.000 description 5
- 210000004072 lung Anatomy 0.000 description 5
- 238000011946 reduction process Methods 0.000 description 5
- 238000011160 research Methods 0.000 description 5
- 238000005070 sampling Methods 0.000 description 5
- 238000003860 storage Methods 0.000 description 5
- 208000000059 Dyspnea Diseases 0.000 description 4
- 206010013975 Dyspnoeas Diseases 0.000 description 4
- 206010058467 Lung neoplasm malignant Diseases 0.000 description 4
- 201000005702 Pertussis Diseases 0.000 description 4
- 230000003190 augmentative effect Effects 0.000 description 4
- 239000003814 drug Substances 0.000 description 4
- 238000009499 grossing Methods 0.000 description 4
- 201000005202 lung cancer Diseases 0.000 description 4
- 208000020816 lung neoplasm Diseases 0.000 description 4
- 238000005259 measurement Methods 0.000 description 4
- 210000003097 mucus Anatomy 0.000 description 4
- 238000005457 optimization Methods 0.000 description 4
- 238000011084 recovery Methods 0.000 description 4
- 210000002345 respiratory system Anatomy 0.000 description 4
- 102220279244 rs1555053901 Human genes 0.000 description 4
- 208000026425 severe pneumonia Diseases 0.000 description 4
- 230000003595 spectral effect Effects 0.000 description 4
- 206010024971 Lower respiratory tract infections Diseases 0.000 description 3
- 208000036071 Rhinorrhea Diseases 0.000 description 3
- 206010039101 Rhinorrhoea Diseases 0.000 description 3
- 238000002555 auscultation Methods 0.000 description 3
- 230000008901 benefit Effects 0.000 description 3
- 230000015572 biosynthetic process Effects 0.000 description 3
- 238000011976 chest X-ray Methods 0.000 description 3
- 238000002790 cross-validation Methods 0.000 description 3
- 229940079593 drug Drugs 0.000 description 3
- 238000001914 filtration Methods 0.000 description 3
- 230000036541 health Effects 0.000 description 3
- 230000003434 inspiratory effect Effects 0.000 description 3
- 238000007726 management method Methods 0.000 description 3
- 238000004519 manufacturing process Methods 0.000 description 3
- 208000001797 obstructive sleep apnea Diseases 0.000 description 3
- 238000005192 partition Methods 0.000 description 3
- 230000009467 reduction Effects 0.000 description 3
- 230000028327 secretion Effects 0.000 description 3
- 206010043089 tachypnoea Diseases 0.000 description 3
- 230000007704 transition Effects 0.000 description 3
- 208000035473 Communicable disease Diseases 0.000 description 2
- 206010011469 Crying Diseases 0.000 description 2
- 206010012735 Diarrhoea Diseases 0.000 description 2
- 206010019280 Heart failures Diseases 0.000 description 2
- 206010033546 Pallor Diseases 0.000 description 2
- 208000003443 Unconsciousness Diseases 0.000 description 2
- 230000004913 activation Effects 0.000 description 2
- 239000008186 active pharmaceutical agent Substances 0.000 description 2
- 230000001154 acute effect Effects 0.000 description 2
- 230000003044 adaptive effect Effects 0.000 description 2
- 239000003242 anti bacterial agent Substances 0.000 description 2
- 229940088710 antibiotic agent Drugs 0.000 description 2
- 230000003115 biocidal effect Effects 0.000 description 2
- 230000001684 chronic effect Effects 0.000 description 2
- 238000013145 classification model Methods 0.000 description 2
- 238000013479 data entry Methods 0.000 description 2
- 210000004704 glottis Anatomy 0.000 description 2
- 238000003384 imaging method Methods 0.000 description 2
- 238000009434 installation Methods 0.000 description 2
- 238000011835 investigation Methods 0.000 description 2
- 230000007774 longterm Effects 0.000 description 2
- 239000000463 material Substances 0.000 description 2
- 230000003287 optical effect Effects 0.000 description 2
- 230000008520 organization Effects 0.000 description 2
- 238000007430 reference method Methods 0.000 description 2
- 230000004044 response Effects 0.000 description 2
- 238000012216 screening Methods 0.000 description 2
- 238000013179 statistical model Methods 0.000 description 2
- 230000008685 targeting Effects 0.000 description 2
- 230000002123 temporal effect Effects 0.000 description 2
- 229960005486 vaccine Drugs 0.000 description 2
- 230000000007 visual effect Effects 0.000 description 2
- 230000001755 vocal effect Effects 0.000 description 2
- 230000002747 voluntary effect Effects 0.000 description 2
- HRANPRDGABOKNQ-ORGXEYTDSA-N (1r,3r,3as,3br,7ar,8as,8bs,8cs,10as)-1-acetyl-5-chloro-3-hydroxy-8b,10a-dimethyl-7-oxo-1,2,3,3a,3b,7,7a,8,8a,8b,8c,9,10,10a-tetradecahydrocyclopenta[a]cyclopropa[g]phenanthren-1-yl acetate Chemical compound C1=C(Cl)C2=CC(=O)[C@@H]3C[C@@H]3[C@]2(C)[C@@H]2[C@@H]1[C@@H]1[C@H](O)C[C@@](C(C)=O)(OC(=O)C)[C@@]1(C)CC2 HRANPRDGABOKNQ-ORGXEYTDSA-N 0.000 description 1
- 208000030090 Acute Disease Diseases 0.000 description 1
- 201000004813 Bronchopneumonia Diseases 0.000 description 1
- 206010007559 Cardiac failure congestive Diseases 0.000 description 1
- 208000006545 Chronic Obstructive Pulmonary Disease Diseases 0.000 description 1
- 206010010904 Convulsion Diseases 0.000 description 1
- 206010018762 Grunting Diseases 0.000 description 1
- 206010019233 Headaches Diseases 0.000 description 1
- 206010021113 Hypothermia Diseases 0.000 description 1
- 206010024264 Lethargy Diseases 0.000 description 1
- 208000019693 Lung disease Diseases 0.000 description 1
- 208000002720 Malnutrition Diseases 0.000 description 1
- 206010052319 Nasal flaring Diseases 0.000 description 1
- 201000007100 Pharyngitis Diseases 0.000 description 1
- 206010037423 Pulmonary oedema Diseases 0.000 description 1
- 206010057190 Respiratory tract infections Diseases 0.000 description 1
- 206010042241 Stridor Diseases 0.000 description 1
- 238000000692 Student's t-test Methods 0.000 description 1
- 206010066901 Treatment failure Diseases 0.000 description 1
- 238000009825 accumulation Methods 0.000 description 1
- 230000004596 appetite loss Effects 0.000 description 1
- 230000003416 augmentation Effects 0.000 description 1
- 210000004369 blood Anatomy 0.000 description 1
- 239000008280 blood Substances 0.000 description 1
- 210000000988 bone and bone Anatomy 0.000 description 1
- 210000004556 brain Anatomy 0.000 description 1
- 210000003123 bronchiole Anatomy 0.000 description 1
- 238000013276 bronchoscopy Methods 0.000 description 1
- 230000001413 cellular effect Effects 0.000 description 1
- 238000013098 chemical test method Methods 0.000 description 1
- 208000023819 chronic asthma Diseases 0.000 description 1
- 208000013116 chronic cough Diseases 0.000 description 1
- 230000000295 complement effect Effects 0.000 description 1
- 238000004590 computer program Methods 0.000 description 1
- 238000007596 consolidation process Methods 0.000 description 1
- 238000007796 conventional method Methods 0.000 description 1
- 230000036461 convulsion Effects 0.000 description 1
- 238000012864 cross contamination Methods 0.000 description 1
- 230000001186 cumulative effect Effects 0.000 description 1
- 238000013500 data storage Methods 0.000 description 1
- 230000008260 defense mechanism Effects 0.000 description 1
- 238000012774 diagnostic algorithm Methods 0.000 description 1
- 238000002059 diagnostic imaging Methods 0.000 description 1
- 238000002405 diagnostic procedure Methods 0.000 description 1
- 230000010339 dilation Effects 0.000 description 1
- 238000005315 distribution function Methods 0.000 description 1
- 230000007613 environmental effect Effects 0.000 description 1
- 230000003628 erosive effect Effects 0.000 description 1
- 238000011156 evaluation Methods 0.000 description 1
- 231100000869 headache Toxicity 0.000 description 1
- 230000002631 hypothermal effect Effects 0.000 description 1
- 230000006872 improvement Effects 0.000 description 1
- 210000004969 inflammatory cell Anatomy 0.000 description 1
- 238000011221 initial treatment Methods 0.000 description 1
- 238000011423 initialization method Methods 0.000 description 1
- 230000010354 integration Effects 0.000 description 1
- 238000012729 kappa analysis Methods 0.000 description 1
- 238000009533 lab test Methods 0.000 description 1
- 208000019017 loss of appetite Diseases 0.000 description 1
- 235000021266 loss of appetite Nutrition 0.000 description 1
- 230000001071 malnutrition Effects 0.000 description 1
- 235000000824 malnutrition Nutrition 0.000 description 1
- 230000007246 mechanism Effects 0.000 description 1
- 230000003278 mimic effect Effects 0.000 description 1
- 238000012986 modification Methods 0.000 description 1
- 230000004048 modification Effects 0.000 description 1
- 208000015380 nutritional deficiency disease Diseases 0.000 description 1
- 230000010355 oscillation Effects 0.000 description 1
- 244000052769 pathogen Species 0.000 description 1
- 238000003909 pattern recognition Methods 0.000 description 1
- 230000000737 periodic effect Effects 0.000 description 1
- 230000000704 physical effect Effects 0.000 description 1
- 238000007781 pre-processing Methods 0.000 description 1
- 238000002360 preparation method Methods 0.000 description 1
- 230000000644 propagated effect Effects 0.000 description 1
- 208000005333 pulmonary edema Diseases 0.000 description 1
- 208000005069 pulmonary fibrosis Diseases 0.000 description 1
- 210000003019 respiratory muscle Anatomy 0.000 description 1
- 230000036387 respiratory rate Effects 0.000 description 1
- 210000005070 sphincter Anatomy 0.000 description 1
- 230000001954 sterilising effect Effects 0.000 description 1
- 238000004659 sterilization and disinfection Methods 0.000 description 1
- 210000005177 subglottis Anatomy 0.000 description 1
- 210000005176 supraglottis Anatomy 0.000 description 1
- 238000012353 t test Methods 0.000 description 1
- 210000000779 thoracic wall Anatomy 0.000 description 1
- 210000001519 tissue Anatomy 0.000 description 1
- 238000012546 transfer Methods 0.000 description 1
- 230000009466 transformation Effects 0.000 description 1
- 238000000844 transformation Methods 0.000 description 1
- 238000013519 translation Methods 0.000 description 1
- 230000014616 translation Effects 0.000 description 1
- 238000012285 ultrasound imaging Methods 0.000 description 1
- 238000009423 ventilation Methods 0.000 description 1
Images


Classifications
-
- A—HUMAN NECESSITIES
- A61—MEDICAL OR VETERINARY SCIENCE; HYGIENE
- A61B—DIAGNOSIS; SURGERY; IDENTIFICATION
- A61B7/00—Instruments for auscultation
- A61B7/003—Detecting lung or respiration noise
-
- A—HUMAN NECESSITIES
- A61—MEDICAL OR VETERINARY SCIENCE; HYGIENE
- A61B—DIAGNOSIS; SURGERY; IDENTIFICATION
- A61B5/00—Measuring for diagnostic purposes; Identification of persons
- A61B5/08—Detecting, measuring or recording devices for evaluating the respiratory organs
- A61B5/0823—Detecting or evaluating cough events
-
- A—HUMAN NECESSITIES
- A61—MEDICAL OR VETERINARY SCIENCE; HYGIENE
- A61B—DIAGNOSIS; SURGERY; IDENTIFICATION
- A61B5/00—Measuring for diagnostic purposes; Identification of persons
- A61B5/72—Signal processing specially adapted for physiological signals or for diagnostic purposes
- A61B5/7235—Details of waveform analysis
- A61B5/7264—Classification of physiological signals or data, e.g. using neural networks, statistical classifiers, expert systems or fuzzy systems
-
- A—HUMAN NECESSITIES
- A61—MEDICAL OR VETERINARY SCIENCE; HYGIENE
- A61B—DIAGNOSIS; SURGERY; IDENTIFICATION
- A61B5/00—Measuring for diagnostic purposes; Identification of persons
- A61B5/74—Details of notification to user or communication with user or patient ; user input means
- A61B5/742—Details of notification to user or communication with user or patient ; user input means using visual displays
-
- A—HUMAN NECESSITIES
- A61—MEDICAL OR VETERINARY SCIENCE; HYGIENE
- A61B—DIAGNOSIS; SURGERY; IDENTIFICATION
- A61B7/00—Instruments for auscultation
- A61B7/02—Stethoscopes
- A61B7/04—Electric stethoscopes
-
- G—PHYSICS
- G10—MUSICAL INSTRUMENTS; ACOUSTICS
- G10L—SPEECH ANALYSIS OR SYNTHESIS; SPEECH RECOGNITION; SPEECH OR VOICE PROCESSING; SPEECH OR AUDIO CODING OR DECODING
- G10L25/00—Speech or voice analysis techniques not restricted to a single one of groups G10L15/00 - G10L21/00
- G10L25/48—Speech or voice analysis techniques not restricted to a single one of groups G10L15/00 - G10L21/00 specially adapted for particular use
- G10L25/51—Speech or voice analysis techniques not restricted to a single one of groups G10L15/00 - G10L21/00 specially adapted for particular use for comparison or discrimination
- G10L25/66—Speech or voice analysis techniques not restricted to a single one of groups G10L15/00 - G10L21/00 specially adapted for particular use for comparison or discrimination for extracting parameters related to health condition
-
- G—PHYSICS
- G16—INFORMATION AND COMMUNICATION TECHNOLOGY [ICT] SPECIALLY ADAPTED FOR SPECIFIC APPLICATION FIELDS
- G16H—HEALTHCARE INFORMATICS, i.e. INFORMATION AND COMMUNICATION TECHNOLOGY [ICT] SPECIALLY ADAPTED FOR THE HANDLING OR PROCESSING OF MEDICAL OR HEALTHCARE DATA
- G16H50/00—ICT specially adapted for medical diagnosis, medical simulation or medical data mining; ICT specially adapted for detecting, monitoring or modelling epidemics or pandemics
- G16H50/20—ICT specially adapted for medical diagnosis, medical simulation or medical data mining; ICT specially adapted for detecting, monitoring or modelling epidemics or pandemics for computer-aided diagnosis, e.g. based on medical expert systems
-
- G—PHYSICS
- G16—INFORMATION AND COMMUNICATION TECHNOLOGY [ICT] SPECIALLY ADAPTED FOR SPECIFIC APPLICATION FIELDS
- G16H—HEALTHCARE INFORMATICS, i.e. INFORMATION AND COMMUNICATION TECHNOLOGY [ICT] SPECIALLY ADAPTED FOR THE HANDLING OR PROCESSING OF MEDICAL OR HEALTHCARE DATA
- G16H50/00—ICT specially adapted for medical diagnosis, medical simulation or medical data mining; ICT specially adapted for detecting, monitoring or modelling epidemics or pandemics
- G16H50/30—ICT specially adapted for medical diagnosis, medical simulation or medical data mining; ICT specially adapted for detecting, monitoring or modelling epidemics or pandemics for calculating health indices; for individual health risk assessment
-
- A—HUMAN NECESSITIES
- A61—MEDICAL OR VETERINARY SCIENCE; HYGIENE
- A61B—DIAGNOSIS; SURGERY; IDENTIFICATION
- A61B5/00—Measuring for diagnostic purposes; Identification of persons
- A61B5/08—Detecting, measuring or recording devices for evaluating the respiratory organs
- A61B5/0803—Recording apparatus specially adapted therefor
-
- G—PHYSICS
- G06—COMPUTING; CALCULATING OR COUNTING
- G06F—ELECTRIC DIGITAL DATA PROCESSING
- G06F2218/00—Aspects of pattern recognition specially adapted for signal processing
- G06F2218/08—Feature extraction
-
- G—PHYSICS
- G06—COMPUTING; CALCULATING OR COUNTING
- G06F—ELECTRIC DIGITAL DATA PROCESSING
- G06F2218/00—Aspects of pattern recognition specially adapted for signal processing
- G06F2218/12—Classification; Matching
-
- G—PHYSICS
- G10—MUSICAL INSTRUMENTS; ACOUSTICS
- G10L—SPEECH ANALYSIS OR SYNTHESIS; SPEECH RECOGNITION; SPEECH OR VOICE PROCESSING; SPEECH OR AUDIO CODING OR DECODING
- G10L25/00—Speech or voice analysis techniques not restricted to a single one of groups G10L15/00 - G10L21/00
- G10L25/27—Speech or voice analysis techniques not restricted to a single one of groups G10L15/00 - G10L21/00 characterised by the analysis technique
- G10L25/30—Speech or voice analysis techniques not restricted to a single one of groups G10L15/00 - G10L21/00 characterised by the analysis technique using neural networks
-
- Y—GENERAL TAGGING OF NEW TECHNOLOGICAL DEVELOPMENTS; GENERAL TAGGING OF CROSS-SECTIONAL TECHNOLOGIES SPANNING OVER SEVERAL SECTIONS OF THE IPC; TECHNICAL SUBJECTS COVERED BY FORMER USPC CROSS-REFERENCE ART COLLECTIONS [XRACs] AND DIGESTS
- Y02—TECHNOLOGIES OR APPLICATIONS FOR MITIGATION OR ADAPTATION AGAINST CLIMATE CHANGE
- Y02A—TECHNOLOGIES FOR ADAPTATION TO CLIMATE CHANGE
- Y02A90/00—Technologies having an indirect contribution to adaptation to climate change
- Y02A90/10—Information and communication technologies [ICT] supporting adaptation to climate change, e.g. for weather forecasting or climate simulation
Definitions
- the present invention relates to a method and device for processing cough sounds of a patient.
- the present invention relates to a method and device for diagnosing pneumonia from patient cough sounds.
- Cough is a defense mechanism of the body to clear the respiratory tract from foreign materials which is inhaled accidentally or produced internally by infections [1]. It is a common symptom in a range of respiratory diseases such as asthma and whooping cough (pertussis) as well as pneumonia, which is the leading cause of death in children under 5 years of age. It has been estimated [2] that pneumonia causes over 1.6 million deaths in this group per year, with more than 97% [3] of cases occurring in the developing world. The world health organization (WHO) also reported that in those countries, pertussis has became one of the major childhood morbidities with an estimated 50 million cases and 300,000 deaths every year [4].
- WHO world health organization
- physicians may also seek quantitative information on coughs, such as the frequency of occurrence of cough events over a given time interval. This information can be used to determine the nature (e.g., acute, chronic) and the severity of coughs as well as to monitor the efficacy of treatment.
- physicians heavily rely on subjective reports of patients or their carers. There is a great need for an automated device capable of counting the number of coughs, especially in childhood diseases. More importantly, technology capable of automatically extracting cough events from long pediatric recordings is needed in order to facilitate the diagnosis of diseases such as pneumonia, pertussis and asthma.
- HACC Hull Automatic Cough Counter
- LCD Leicester Cough Monitor
- LCM Leicester Cough Monitor
- PulmoTrack PulmoTrack
- the performances of these devices are varied.
- the HACC claimed a sensitivity and specificity of (80%, 96%) [5].
- the figures for LifeShirt, Pulmotrack, LCM, and Vitalojak are (78%, 99%), (94%, 96%), (85.7%, 99.9%), and (97.5%, 97.7%) respectively [6, 10-13]. They relied on sound intensity dependent techniques, making them susceptible to variations in recording conditions and the particular instruments used. To the best of the inventors' knowledge, none of these commercial devices have been tested on pediatric populations.
- Cough sounds carry critically useful information on the state of the airways.
- the existing devices use method that can detect only the presence of events (“Cough Detection”) but are unable to automatically extract cough events (“Cough Segmentation”) for further analysis. Thus they are limited to the counting of coughs.
- Cough Segmentation requires, in addition to Cough Detection capabilities, the knowledge on the exact beginning as well as the end of each cough event. It is known that inter-cough gaps, the durations of the coughs, and the amplitude of coughs may carry information related to respiratory diseases [14].
- Pneumonia is the leading killer of young children around the world. It accounts for more than 19% of under-five child deaths each year. It's a disease of poverty and is strongly related with malnutrition and poor healthcare facilities. As a result childhood pneumonia deaths are critically high in developing countries. Pneumonia is also a problem among the aged people throughout the world.
- Pneumonia is defined as an infection in the lungs with accumulation of inflammatory cells and secretions in the alveoli.
- the common symptoms of the Pneumonia includes, cough, difficulty in breathing, fever, headaches, loss of appetite, runny nose, and wheezing.
- severe pneumonia cases young infants struggle for breath and may suffer convulsions, skin pallor, unconsciousness, hypothermia and lethargy.
- Pneumonia is a difficult disease to diagnose.
- Current methods of diagnosis include clinical examination (eg: physical signs, chest auscultation), bio-chemical testing (eg: sputum analysis, oxygen saturation) and medical imaging (eg: chest X-rays and in some cases X-ray CT).
- Chest X-ray is considered as a commonly available reference standard for diagnosing pneumonia. However, it is not a golden standard. In early stages of the disease, or when the disease involves a part of the lung not easily seen in CXR, pneumonia can be difficult to diagnose using CXR alone. Moreover, sometimes CXR results can be misleading due to lung scarring or congestive heart failure, which can mimic pneumonia in CXR. Even though X-ray CT may provide better outcomes, they are not widely available even in tertiary care hospitals in developing countries. Sputum tests require laboratory cultures and can take a minimum 2-3 days making them too slow for initial diagnosis.
- a positive sputum test does not necessarily indicate the presence of pneumonia because many of the pathogens causing pneumonia are naturally present in the throats of healthy people. Therefore, sputum test is mainly done to check the sensitiveness of a particular antibiotic that has already been started on a patient.
- the clinical examination together with the chest auscultation via stethoscopes is the frontline approach used in the initial diagnosis of pneumonia in a clinical setting; X-ray may be used to confirm a diagnosis when available.
- WHO World Health Organization
- a child presenting with difficult breathing or cough is diagnosed with pneumonia if they have tachyponea (fast breathing).
- Fast breathing is defined as 60 breaths or more in infants less than 2 months, 50 breaths or more per minute for the infants between 2 months to 12 months and 40 breaths or more per minute for children age between 12 months to 5 year old [ref 3, 4].
- Chest in-drawing, skin pallor and unconsciousness may indicate severe pneumonia and also belong in WHO Danger Signs. This system is easier to implement in the field and is designed to have a high sensitivity of diagnosis (about 90% patients with the disease are picked up).
- WHO guidelines suffer from poor specificity of diagnosis; a large number of patients without pneumonia are also picked up as having pneumonia. The specificity of WHO algorithm is known to be about 20%.
- a computational device (52) to process a sound recording of a patient (501) the method characterized by the steps of:
- the pattern classifier comprises an artificial neural network (300).
- the artificial neural network (300) comprises a time delay neural network (TDNN).
- TDNN time delay neural network
- the TDNN (300) has a hidden layer (303) between an output layer (305) and an input layer (307) with 10 to 50 neurons in the hidden layer (303).
- the method includes calculating a bispectrum for further classification of the cough segments.
- the method further comprises diagnosing a disease related state based on the segments of the patient sounds classified as cough sounds and presenting the diagnosis on the display under control of the computational device.
- the method includes monitoring patient data from one or more of a: breathing detection sensor, temperature sensor, movement sensor, EEG sensor, oxygen level sensor.
- the method includes categorizing cough sounds as being “wet cough” or “non-wet cough” sounds (1506).
- the classification procedure comprises of any one of: a logistic regression model; an artificial neural network; a Bayes classifier; a hidden Markov model; a support vector machine.
- the diseased cough index (1207) comprises a pneumonic cough index.
- the method includes deeming the patient to be suffering from pneumonia based on the pneumonic cough index.
- the pneumonic cough index is compared to a predetermined threshold.
- a computational device including at least one electronic processor (70) in communication with an electronic memory (62, 64, 66) containing instructions for the processor to carry out the method.
- the cough recording system consisted of low-noise microphones 53, 55 having a hypercardiod beam pattern (Model NT3, RODE ® , Sydney, Australia), followed by a pre-amplifier 52 and A/D converter 51 (Model Mobile Pre-USB, M-Audio ® , CA, USA) for the signal acquisition.
- the output of the Mobile Pre-USB was connected to the USB port 50 of a laptop computer 52.
- the nominal distance from the microphones to the mouth of subject 42 was 50 cm. The actual distance could vary from 40 cm to 100 cm due to the subject movement.
- the proposed method did not depend on the sound intensity and the results were independent of the mouth to microphone distance.
- the computer system 52 operates as a cough / non-cough classification system and/or a cough based diagnosis system according to preferred embodiments of various aspects of the present invention, while executing a computer program which will be described shortly.
- Personal Computer system 52 includes data entry devices in the form of pointing device 60 and keyboard 58 and a data output device in the form of display 56.
- the data entry and output devices are coupled to a processing box 54 which includes a central processing unit 70.
- the display 56 comprises a human-machine interface for presenting the results of various classification procedures implemented by the methods described herein. Other human-machine interfaces are also possible, such as a smart phone or a printer for example.
- Central processing unit (CPU) 70 interfaces with storage devices that are readable by machine and which tangibly embody programs of instructions that are executable by the CPU. These storage devices include RAM 62, ROM 64 and secondary storage devices i.e. a magnetic hard disk 66 and optical disk reader 48, via mainboard 68.
- the personal computer system also includes a USB port 50 for communication with the external ADC module 51 which pre-amplifies, filters and digitises signals from microphones 53 and 55. The microphones pick up sounds, e.g. cough sounds, from the subject 42 lying on bed 40.
- Secondary storage device 66 is a magnetic data storage medium that bears tangible instructions, for execution by central processor 70. These instructions will typically have been installed from an installation disk such as optical disk 46 although they might also be provided in a memory integrated circuit or via a computer network from a remote server installation.
- the instructions constitute a software product 72 that is loaded into the electronic memory of RAM 62. When executed the instructions cause computer system 52 to operate as a cough-based diagnosis system, and/or a cough or non-cough patient sound classifier, and in particular to implement a one of a number of methods that will be described shortly.
- the computational device that has been shown comprises a personal computer, e.g. a desktop or laptop computer
- a dedicated medical device and also a smartphone loaded with an application, i.e. an "app" for implementing one or more of the methods described herein.
- the phone's onboard microphone may be used to monitor the patient sounds or alternatively one or more high quality external microphones may be connected to the smartphone for such monitoring.
- the smartphone may transmit digital recordings of patient sounds to a distant computer which then processes the digital recordings, via cellular telephone networks and/or the Internet, according to the methods that are described herein.
- the results of the processing may be transmitted back to the smartphone for display thereon or alternatively be displayed on an electronic display device under the control of the distant computer.
- the computational device may also be interfaced to a number of patient sensors such as a movement sensor; EEG sensor; Oxygen level sensor, breathing detection sensor, temperature sensor for example.
- the data from these sensors may also be used during performance of the various methods described herein.
- FIG. 2 An automated method to extract s c [n] from the recording r[n] is provided.
- the block diagram of the overall method is shown in Fig. 2 . It comprises of four main processes: (a) noise reduction, (b) feature extraction from sub-blocks of data, (c) classification of the sub-blocks of data into cough group (CG) and non-cough group (NG) classes, and (d) identifying/forming cough segments by appropriately grouping CG/NG-classified contiguous sub-blocks of data.
- CG cough group
- NG non-cough group
- r[n] In order to reduce the background noise b[n] , we processed r[n] through two different filters: (a) a high pass filter (HPF), and, (b) a power spectral subtractions (PSS) filter.
- HPF high pass filter
- PSS power spectral subtractions
- the HPF was designed as a fourth-order Butterworth filter. It was used to reduce the low frequency interference that may come from the movement of the microphone stands or the bed.
- the PSS filter was employed to reduce the locally stationary background noise. It estimates the clean sound signal by subtracting the power spectral of original sound signal with estimated background noise [15].
- SNR signal to ratio
- ⁇ [n] is used as the input to the feature extraction unit.
- cough sounds are often considered as a combination of four different phases [1]: inspiratory, contractive, compressive, and expulsive.
- the inspiratory phase is initiated by breathing in and terminated by the closure of the glottis, supraglottis sphincters, or both.
- the contractive phase groups of respiratory muscles contract against glottal structures leading to the compressive phase characterized by marked elevation of alveolar, pleural, and sub glottis airway pressures.
- the expulsive phase the glottis opens quickly followed by rapid exhalation of air under a large pressure gradient. The rapid movement of air expelled from the lung generates the cough sounds with contributions coming from different areas of the respiratory system.
- the mechanism of cough sounds production shares some similarities to that of speech production.
- the Cough Segmentation technique starts by classifying each and every data sub-block s k [n] into the two non-overlapping categories of Cough Group (CG) and non-Cough Group (NG) based on the feature vector f k,j .
- section 2.2.3 we describe the pattern classification scheme we developed for this CG/NG classification at the sub-block level.
- ANN Artificial Neural Network
- ANN has several advantages in that its capable of classifying data using non-linear decision boundaries, based on a process of supervised learning with a set of given examples. It has a proven ability to work with limited training data sets compared to conventional methods [25].
- TDNN Time Delay Neural Network
- TDNN is capable of classifying data sub-blocks s k [n] discounting temporal translations [26] of the input feature set.
- TDDN we show the structure of TDDN in Fig. 3 . It comprised of an input layer, a hidden layer, and an output layer.
- TDNN we used d successive feature vectors of the matrix G j , to classify a sub-block as a CG/NG class.
- To classify the next sub-block we shifted the input by a sub-block the right, and used the next group of feature vectors. We performed this process from the beginning to the end of matrix G j , thus all of the sub-blocks in ⁇ [n], can be classified into CG/NG class.
- TDS training
- VDS validation
- TeDS testing
- the proportions of TDS, VDS, and TeDS from the database are (40%, 30%, and 30%, respectively).
- C m , m 1, 2, ..., M , where M is the total number of random partitions used in this work. All classification data set were analyzed independently. We effectively used our data set by applying K-fold cross validation method using the random sub-sampling technique.
- the matrix W k was used as a target in the training process. Note that the dimension of W k is similar to G j .
- TDNN used in this study has the parameters as prescribed in Table 3.
- net c The linear and sigmoid functions were selected as activation function between layers.
- Nguyen-Widrow initialization method To determine the initial weight and bias, we used the Nguyen-Widrow initialization method.
- RPROP resilient back propagation
- stopping criteria (a) the mean squared error ( mse ) of the training data was less than 10 -5 , (b) the validation error began increasing, and (c) a minimum gradient in training performance of 10 -10 was reached. Unless the training was stopped earlier, the neural network was allowed to train up to 100 epochs.
- the group of contiguous elements in ⁇ k was defined as cough segment candidates.
- w ⁇ k ⁇ 1 , for w ⁇ k ⁇ ⁇ 0 , for w ⁇ k ⁇ ⁇ (S3) Compute the duration ( ⁇ s ) of the corresponding segments containing '1' in ⁇ k . This process is carried by determining the start and end of each segment.
- Starting k 1 , find the smallest value of k (say k a ) where all sub-blocks ⁇ k correspond to the category of NG class.
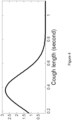
- Steps (S1)-(S4) describe the method to determine the beginning and the end of each segment of s c [n] and to discount segments of s nc [n] in a recording. In order to validate the results, all obtained cough segments in w ⁇ k were compared with cough segments in W k .
- each cough segment ( ⁇ s ) by a combined process of visual observation and listening.
- the smoothed probability density function of ⁇ s is illustrated in Fig. 4 .
- the feature vector f k ⁇ M k F k Z k S k N k ⁇ for each sub-block of s k [n].
- the sub-block size N 882 (20 ms).
- the selected sub-block size is the basic unit for feature extraction of MFCC. Smaller sizes (e.g., 10 ms), generally lead to distorted results, because of very few samples involved in Mel-filter integration; larger sizes have tendency to increase the word error rate [28].
- the feature vector f k contains 22 elements: 14 coefficients of M k (including log energy and the 0 th - 12 th cepstral coefficients), 5 coefficients of F k , and 1 coefficient of each Z k , S k , and N k .
- pdf probability density function
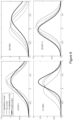
- Fig. 7 exhibits the pdf of formant frequencies.
- the statistical distribution (mean, standard deviation, skewness, and kurtosis) of formant frequencies of F(1), F(3), and F(5) between CG and AS are distinguishable.
- the distribution of F(2) in CG, CY, VC, and AS seem similar, however CG has the lowest mean (-0.06).
- the distribution of F(4) in TS has the lowest mean among the classes (-0.003).
- Fig. 8 we illustrate the NGS index of CG, CY, VC, and AS.
- the NGS has the potential to discriminate CG from VC and CY ( Fig. 7(D) ).
- Fig. 6(B) it could be seen that ZCR can be used to discriminate CG from AS.
- the pdf of the features shows that there are no dominant feature which can be used alone as an input for TDNN to classify CG/NG class. Hence, to obtain the maximum benefit of each component of the features, we combined them and used d successive of features vector as the input of TDNN to classify CG/NG class.
- sensitivity TP / TP + FN ⁇ 100
- specificity TN / FP + TN ⁇ 100
- TP True Positive
- TN True Negative
- FP False Positive
- FN False Negative
- TDS 98.34 98.35 VDS 85.24 85.24 TeDS 90.32 90.35 20 TDS 98.12 98.13 VDS 86.80 86.61 TeDS 91.51 91.51 30 TDS 98.31 98.32 VDS 85.03 85.05 TeDS 90.24 90.25 40 TDS 98.41 98.41 VDS 85.57 85.57 TeDS 91.45 91.45 50 TDS 98.43 98.43 VDS 85.69 85.69 TeDS 89.89 89.92
- the classification result using ⁇ Z k S hk N k ⁇ shows the lowest sensitivity and specificity (79.95 and 99.98) respectively.
- the combination ⁇ M k F k ⁇ has a higher result with 89.37% of sensitivity and specificity.
- the combination of ⁇ M k F k Z k S hk N k ⁇ achieved the best sensitivity and specificity of 91.51%.
- Fig. 9(A) shows the signal from the noise reduction process while Fig. 9(B) illustrates the output signal from TDNN-based classification ( ⁇ k ).
- Fig. 9(B) we show the output of the network net c representing the approximation of the state of CG and NG classes (1 and 0, respectively).
- the groups of sub-blocks associated to cough sounds formed segments with value close to 1, and otherwise for the groups of sub-blocks from the non-cough sounds. From the Fig.
- each element in a segment represents the class of 20 ms sub-block.
- we can compute the duration of a segment by multiplying the number of elements between the beginning and the end of a segment with 20 ms.
- the proposed method effectively segments the cough (CG1 - CG6) even though they have different intensity and duration. Moreover, although cough sound CG3 is overlapped with speech, the method is capable of extracting the corresponding cough sound.
- the false segment (FD) shown in Fig. 9(D) also has been eliminated.
- Figure 11 illustrates the output of the segmentation method in a typical signal which contains cough sounds intermixed with cry sounds.
- the method successfully extracted the two cough sounds from the signal and only detected one false segment from a long duration of cry.
- FIG. 12 there is shown a block diagram illustrating a method according to a preferred embodiment of a further aspect of the present invention.
- the method illustrated in Figure 12 is developed for the diagnosis of particular disease states, for example Pneumonia/-non-Pneumonia classification, associated with a patient.
- Pneumonia/-non-Pneumonia classification associated with a patient.
- a further classification method is discussed at the end of this specification.
- the data acquisition environment for this work is Respiratory Medicine Unit of the Sardjito Hospital, Gadjah Mada University, Indonesia.
- Our subject population includes individuals with symptoms of respiratory disease. Patients admitted to the general ward of the hospital were assessed by a clinician for the presented symptoms. All the observations were documented in a standard sheet. Observations included presence of cough, runny nose, fever, breathing difficulty, diarrhoea etc. Clinician also recorded Temperature, Breathing rate, SpO2 and Heart rate.
- Table 8 lists the inclusion and exclusion criteria. All patients fulfilling the inclusion criteria were approached. An informed consent was made. Patients were recruited within first 12 hours of their admission. After the informed consent continuous sound recordings were made for next 4-6 hours. Table 8. Inclusion and Exclusion Criteria Used in the study Inclusion Criteria Exclusion Criteria - Patients with symptoms of chest infection : At least 2 of - Advanced disease where recovery is not expected eg terminal lung cancer - Cough - Sputum - Droplet precautions - Increased breathlessness - NIV required - Temperature >37.5° - No Consent - Consent
- the sound recordings were made in the general adult ward of the hospital. Patient shared the room with 5 other patients separated by curtains. The patients were accompanied by their family members. The attending physician regularly visited the patient, however no confidential information related to the patient was recorded.
- the common noise present in the recordings were from celling fan, foot step, speech, door banging, trolley movement and other ambiguity noises from outside the room.
- Figure 12 shows the block diagram of the overall algorithm developed for the Pneumonia/-non-Pneumonia classification
- Figure 15 shows the block diagram of the algorithm developed for the Wet/non-Wet cough sound classification.
- Figure 13 shows a sample of cough sound data with two cough events. Start and end of the cough events were manually marked after careful listening. After the manual scoring of start and end of cough events we followed the following steps to compute mathematical features from the cough event data.
- Step 1 In the first step we classified each cough event into one of the two categories, 'Pneumonic Cough' or ⁇ non-Pneumonic Cough'. To solve this problem, we formed a feature vector for each cough event and derive a model, which can separate the cough events into two categories. Different models were derived with different feature set as shown in the Table 9. Table 9. Derived logistic-regression model for classification of cough event into categories 'Pneumonic Cough' and 'non-Pneumonic Cough'. ' ⁇ ' indicates the inclusion of that feature in model design. Breathing index was calculated by subtracting the breathing threshold from the recorded breathing rate.
- Logistic Regression statistical model For the cough classification we used Logistic Regression statistical model. It is a generalized linear model, uses several predictors (independent variables) to estimate the probability of a categorical event (dependent variable).
- ⁇ 0 is called the intercept and ⁇ 1 , ⁇ 2 and so on are called the regression coefficient of independent variables (features) x 1 , x 2 respectively.
- Logistic regression model were designed using the MATLAB statistical toolbox version 7.5. Features were selected to include only the best independent variables (variables with low 'p' value) that facilitate the classification, in the final model. The final model is then used to estimate the probability P and each cough event is classified as belonging to either of the two categories using a probability threshold P th .
- Step 2 In the second step for each patient, we summed number of ⁇ Pneumonia cough' and computed an index called ⁇ Pneumonic Cough Index (PCI)' using (9).
- PCI Total number of Pneumonic cough Total number of cough
- Step 3 In the third step we applied a predetermined threshold PCI th (optimized for high sensitivity while keeping specificity>75%) to the PCI to classify patient into two classes, ⁇ Class I - Pneumonia' and ⁇ Class II - non-Pneumonia'.
- PCI th optimal for high sensitivity while keeping specificity>75%
- Total of 541 cough events were analysed from the 81 subjects sound recording (minimum 2, maximum 12, and on average 6.6+2.14 cough events).
- Out of 81 subjects 50 were Pneumonia patients and 31 were non-pneumonia patients.
- Non-pneumonia patients included with diseases such as, Asthma - 11, Bronchitis - 8, Rhinopharyngitis - 6 and others (weezing, tonsilopharanzitis, heart disease, larangomalaysia, foreign body inhalation) - 6.
- Chest x-ray was performed on all suspected pneumonia patients.
- Nineteen patients on which chest x-ray was not performed 8 were asthma, 5 Rhinopharyngitis, 2 bronhitis and 4 other disease patients.
- Table 10 gives the age and gender statistics of the patient database.
- Table 11 shows the contingency table for Pneumonia diagnosis using WHO criteria and Clinically diagnosed Pneumonia cases for our database of 81 subjects.
- Table 11. Contingency table for pneumonia diagnosis using WHO criteria vs Clinically diagnosed Pneumonia. BPM - Breaths per minute. WHO criteria. [Cough OR Difficult Breathing & Fast breathing] Sensitivity Specificity Accuracy 92 26 66.67 Threshold for fast breathing used are Clinically Confirmed Diagnosis ⁇ 2 months - 60 BPM 2 - 11 months - 50 BPM WHO Criteria 46 23 12 - 60 months - 40 4 8 > 60 months - 20 BPM
- Table 12 shows the training and testing classification results in separating cough events into two categories using designed 4 logistic regression models given in table 9.
- Table 12. Classification results for cough events into two categories ('Pneumonic cough' and non-Pneumonic cough') using different Logistic Regression models as shown in table 3, following the method given in section 2.D Step 1.
- Selected cough features used to develop the model were BSG, FF1, FF2, FF4, ZCR, MFCC3 and MFCC6.
- Table 13 gives the pneumonia classification results using Pneumonic Cough Index.
- LR-Model5 gives the best classification results for cough events classification (mean sensitivity and specificity were 85.6 ⁇ 8% and 80.1 ⁇ 12% respectively).
- LR-Model4 performed better than LR-Model5. It achieved the mean sensitivity and specificity of 86.2 ⁇ 9.6 and 84.3 ⁇ 15 respectively.
- Table 13 Results for Pneumonic Cough Index based pneumonia diagnosis after only selected cough features were used in the model training. Cough Features selected were BI, FF1, FF2, Zcr, MFCC coefficients 4,6 and 9.
- Total of 178 cough events from 46 subjects were analyzed.
- the male to female ratio of the subjects in database was 1:1.
- the mean age of the subjects was 3 years and 1 month.
- Out of 178 cough events 82 were Wet and 96 were, as classified by reference standard. We used 70% (124 cough events) of the cough events for training and 30% (54 cough events) for testing the model. Training and testing cough events were randomly chosen using a random number generator. To validate the model, we generated 200 different training and testing dataset from the 178 cough events.
- the mean sensitivity and specificity for Wet/non-wet classification using LR-model was 74.8 ⁇ 9% and 69.9 ⁇ 9.4% respectively for testing datasets, when all the cough features were used to train the model.
- Mean sensitivity and specificity values jumped to 79 ⁇ 9% and 72.7 ⁇ 8.7% when only selected cough features were used.
- the selected features were 1 each from BSG, LogE and Kurt; 2 from NGS; 3 from ZCR; 5 from formant frequency; and 9 from MFCC.
- Table 14 shows the mean sensitivity, specificity, accuracy and kappa results for training and testing datasets.
- Figure 16 shows the histogram plots for the sensitivity and specificity obtained using 200 training and testing datasets.
- Table 15 shows the contingency table for the best LR-model among 200. It has the sensitivity of 90%, specificity of 80% and a high kappa agreement of 0.71.
- the overall approach of the method is summarised in Fig. 17 .
- the method consists of three main stages: the acquisition of data from subjects, the development of features and the training of pattern classifiers, and, the prospective validation and performance evaluation of the technology.
- Section 2A-2C we provide details of these steps.
- a paediatric clinician assessed the patient for the presented symptoms. All the observations such as the presence of cough, runny nose, fever, breathing difficulty, diarrhoea etc. were documented in a standard sheet.
- the database also contained routine demographic information and the results of clinical (eg. chest auscultation, breathing rate, oxymetry, temperature) as well as laboratory (eg: blood, sputum analysis) investigations.
- the reference standard used for Pneumonia diagnosis in this discussion is the overall diagnosis provided by physicians, on the basis of clinical presentation, laboratory tests, chest X-ray and the clinical course of the disease. In order to minimize the radiation exposure to children, X-ray was performed only on subjects clinically suspected of pneumonia, or if there was a clear clinical need for it. Thus, not all subjects in our database had undergone X-ray imaging.
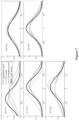
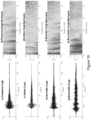
- Fig. 19 shows typical examples of (a)pneumonia-cough, (c)asthma-cough, (e)bronchitis-cough and (g)bronchiolitis-cough waveforms and their corresponding power spectrogram. A clear characteristic difference between the pneumonia-cough and other-coughs in duration and power spectrogram magnitude can be seen.
- the first step we compute a feature matrix.
- the second step we design automatic classifiers using the feature matrix from step 1 to classify cough sounds into ⁇ pneumonic cough' and ⁇ non-pneumonic cough' classes.
- the third step we select an optimal classifier and in the fourth step we define a new index called Pneumonic Cough Index (PCI) to identify patients with pneumonia.
- PCI Pneumonic Cough Index
- Step-1 Extraction and Augmentation of Cough Features
- our first target is to extract features from cough sounds to be used in the pneumonia diagnosis algorithm.
- Mathematical features from each cough event in D md were computed as follows :
- BR breathing rate
- Age age of the patient in months. While fever is a common symptom of pneumonia, it is not specific to pneumonia. A similar observation holds for the breathing rate.
- LRM Logistic-regression model
- Cough events drawn from a subject with a diagnostic classification of pneumonia are labelled pneumonic coughs and vice versa.
- a model is derived using a regression function to estimate the probability Y given the independent cough features (i.e.
- f 1 , f 2 ,...f F are the elements of feature vector F c (independent variables), ⁇ 0 is called the intercept and ⁇ 1 , ⁇ 2 and so on are called the regression coefficient of independent variables.
- ⁇ 0 is called the intercept
- ⁇ 1 , ⁇ 2 is called the regression coefficient of independent variables.
- ROC Receiver-Operating Curve
- LOV leave-1-out cross validation
- Step 3 Selecting a good model from N md LRMs - From the candidate LRMs that use the selected features F c s as the input features, we selected one model as the best based on the k-mean clustering algorithm.
- target is to divide q data points in d -dimensional space into k clusters, so that within the cluster sum of squared distance from the centroid is minimized.
- R fc Once R fc is chosen, we fix all the parameters of the model and completely terminate the training process. The model R fc is then used as the best model to classify each individual cough event into 'pneumonic-cough' or 'non-pneumonic-cough' groups.
- PCI Pneumonic Cough Index
- Figure 4 shows a typical example of pneumonia-cough, asthma-cough, bronchitis-cough and bronchiolitis-cough waveforms and their corresponding power spectrogram.
- the pneumonia-cough is of short duration with widely spread power spectrum up-to 20 kHz.
- other coughs are of long duration with power spectrum up-to 15 kHz.
- the cough sound waveforms were generally clean with high signal-to-noise-ratio (SNR).
- SNR signal-to-noise-ratio
- Table 19 shows the contingency table for Pneumonia diagnosis using WHO criteria and clinically diagnosed Pneumonia.
- WHO Criteria [Cough and/or breathing difficulty] Sensitivity Specificity Accuracy 86% 22% Threshold for fast breathing used are ⁇ 2 months - 60 BPM 2-11 months - 50 BPM 12 - 60 months - 40 > 60 months - 20 BPM
- WHO guidelines for pneumonia diagnosis in community settings are designed for children with age group of 2 months to 5 years 18 . "Infants less than 2 months with signs of pneumonia are referred promptly to the nearest health facility because they are at high risk of suffering severe illness or death" 18 . Therefore table 19 is generated using #68 subjects in our database, which falls in the age range 2 months to 5 years. WHO criteria achieved a high sensitivity of 83% in picking clinically confirmed pneumonia cases, however presented with a poor specificity of 47%.
- D md Training/Validation dataset
- D pv Prospective study dataset.
- Feature Matrix Following the method given in section 2-B [Step 1] we computed feature matrix M c .
- Pneumonic Cough Classification using LRM before feature selection For F 1 feature combination (only mathematical features of cough), the mean training sensitivity and specificity over 66 LRMs in classifying cough events into Pneumonic and non-pneumonic cough classes were 81 ⁇ 1%. Validation sensitivity and specificity were 63% and 52% respectively. When BrI was included as feature, sensitivity and specificity of validation set jumped to 71% and 55% respectively. And when all the features, Age, presence of fever and BrI were included in train LRM along with mathematical features of cough, sensitivity and specificity further increased to 73% and 62% respective. Table 20 gives the performance of the model in classifying cough events into Pneumonic and non-pneumonic cough classes using different combination of features.
- Table 22 gives the performance of the model after feature selection in classifying cough events into Pneumonic and non-pneumonic cough classes. Table 22 - Performance of the LRM models in classifying cough events into ⁇ pneumonic cough' and ⁇ non-pneumonic cough' classes on training/validation dataset D md when selected features were used to train the model.
- PCI based classification From designed LRMs for each F c s using data from robust model R fc was selected using k-mean clustering method as discussed in section 2-B [Step 3]. The chosen model R fc and all its parameters were fixed for use in step [4] of section 2-B. Using the definition given in section 2-B [Step 4], PCI index was computed for each patient. By ROC analysis a PCI th was selected and applied on PCI to classify patients into 'Pneumonia' and 'non-Pneumonia'. Table 23 shows the PCI based pneumonia/non-pneumonia classification results for 6 feature combinations F c s .
- Table 25 shows the performance of model in classifying patients into pneumonia and non-pneumonia.
- Selected LRM model Prospective Dataset D pv Sens Spec Acc PPV NPV K
- R f 1 C f S 94% 75% 88% 89% 86% 0.72
- R f5 C f S + BrI + Fever 88% 75% 84% 88% 75% 0.63
- R f6 C f S + BrI + Age + Fever 82% 100% 88% 100% 73% 0.75
- R f1 which used only cough features has sensitivity and specificity of 83% and 58% respectively.
- top 3 performing models were R f1 , R f3 , R f4 and R f6 all with kappa agreement greater than 0.7, substantial agreement.
- R f1 achieved a high sensitivity and specificity of 94% and 75% respectively.
- the preceding has provided an automated procedure to diagnose pneumonia using cough sounds.
- the method is based on initially classifying individual cough events into ⁇ pneumonic cough' and 'non-pneumonic cough' classes and then calculating a Pneumoic Cough Index (PCI) over all the cough events recorded.
- PCI Pneumoic Cough Index
- Figure 20 shows the block diagram of the automated cough classification process using logistic regression. It is divided into four stages, (A) data acquisition process (B) creating a cough sound database and classification into wet/dry classes by expert scorer (C) designing of automatic classifier (D) testing of classifier on prospective cough sound dataset.
- A data acquisition process
- B creating a cough sound database
- C designing of automatic classifier
- D testing of classifier on prospective cough sound dataset.
- Table 26 lists the inclusion and exclusion criteria of subjects. Table 26 - Inclusion and Exclusion Criteria for Subjects Inclusion Criteria Exclusion Criteria - Patients with symptoms of chest - Advanced disease where infection : At least 2 of recovery is not expected eg - Cough terminal lung cancer - Sputum - Droplet precautions -Increased breathlessness - NIV required -Temperature >37.5° - No Consent -Consent
- N be the number of patients whose sound recording is used and C be total number of cough events from N patients. These C cough events were manually segmented after screening though 6-8 hours of the sound data of each patient. There is no accepted method for automatic marking of start and end of a cough event. Manual marking is still considered the gold standard. After careful listening start and end of all cough events were manually marked.
- DS11 be the subset of DS1 containing those cough events on which both scorers agreed on the class of cough sounds.
- C11 cough events in DS11 Use cough events in DS11 to design automatic classifier model. This is a three step process.
- Step 1 Cough event Feature matrix computation: In this step, feature vector containing 'F' mathematical features is computed from each of C11 cough events and a cough event feature matrix 'M DS11 ' of size, C11 ⁇ F was formed. To compute 'F' features from a cough event use below steps.
- LRM Logistic-regression model
- f 1 , f 2 ,...f F are the elements of feature vector (independent variables), ⁇ 0 is called the intercept and ⁇ 1 , ⁇ 2 and so on are called the regression coefficient of independent variables.
- ⁇ 0 is called the intercept
- ⁇ 1 , ⁇ 2 is called the regression coefficient of independent variables.
- ROC Receiver-Operating Curve
- LOV technique involves using data from all cough events except one to train the model and one cough event to validate the model. This process was systematically repeated C11 times such that each cough event in DS11 was used as the validation data once. This resulted in L C11 number of LRMs.
- Step 3 Selecting a good model from L C11 LRMs : From L C11 LRMs we selected one model as the best, using the k-mean clustering algorithm 9 to test on prospective study dataset DS2.
- target is to divide q data points in d- dimensional space into k clusters, so that within the cluster sum of squared distance from the centroid is minimized.
- Step 1 Following the procedure described in section C [Step 1] and using the cough events from dataset DS2, compute the cough event feature matrix M DS2 of size C2 ⁇ F.
- C2 is total cough events in DS2 and 'F' is feature vector.
- the inventors used sound recording data from N 78 patients (41 were male and 37 were female).
- Table 27 gives the demographic and clinical details of the patients.
- Table 28 shows the contingency table between two scorers in classifying cough sounds from DS1 and DS2, into two classes wet and dry.
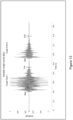
- FIG. 21 shows a typical example of dry cough waveform and wet cough waveform from two patients, ids #35 & #38 respectively.
- the cough sound waveforms were generally clean with high signal-to-noise-ratio (SNR).
- SNR signal-to-noise-ratio
- Figures 23A and 22B are histograms of SNR for the cough sound in DS11 and DS2.
- the mean training sensitivity and specificity for the 310 LRMs were 92 ⁇ 1% and 93 ⁇ 0.5% respectively. Validation sensitivity and specificity for these models were 62% and 84% respectively.
- MFCC based features were most dominant. Out of 31 selected features, 19 features were contributed from different MFCC components. After MFCC formant frequencies made second most dominant contribution with 5 features. Moreover except for 4 th formant frequency and pitch based features, which were completely omitted, all other features contributed with features from at-least one sub-segment towards building of final LRM model.
- LRM LRM
- 310 designed LRMs using data from DS11, optimal model was selected using k-mean clustering method as discussed in section II-C-[Step 3]. Models were clustered into two groups, high performance model and low performance models based on model parameters and performance measures. Of 310 models, 202 were clustered in high performance model group and 108 into low performance model group. LRM model #26 has the lowest mean square error value with respect to centroid of the high performance models. This model was chosen and all its parameters were fixed for future use. was tested on prospective dataset DS2. Performance of on prospective dataset DS2: Table 31 gives the classification results of against expert scorers.
- Table 33 shows the performance of the LRM on DS11 and DS2 when matched for age and gender.
- Table 33 - LRM validation results for dataset DS11 and prospective dataset DS2 with age and gender matched.
- Embodiments of the present invention encompass an automated, objective method to classify cough sounds in to wet and dry categories. As far as the inventors are aware know, this is the first attempt to develop objective technology for the dry/wet classification of pediatric cough sounds, espcially in diseases such as pneumonia.
- the results presented herein are based on 536 cough events from 78 subjects, compared to existing work which use no more than 30 coughs in their descriptive analyses. For these reasons no other work has been availble to directly compare the results against.
- the reference method used for the assessment of our technology is the subjective classification of cough sounds into wet/dry classes by two pediatric respiratory physicians from different countries. These scorers were blinded to the actual clinical diagnosis of the subjects.
- Cough is an early symptom of diseases such as pneumonia, bronchitis and bronchiolitis.
- the accurate assessment of this symptom is a crucial factor in diagnosing acute diseases or the monitoring of chronic symptoms and treatment efficacy. It is known that in children, wet coughs are more likely to be associated with lower respiratory tract infections 3 .
- the subjective classification of wet coughs has low sensitivity as a method of detecting airway mucus, even in the hands of expert clinicians. Accurate, objective technology for the classification of dry/wet coughs is currently unavailable either at the commercial or research levels. To the best of our knowledge, this work is the first attempt in the world to develop such technology.
- the methods described herein may be simultaneously implemented with other potential technologies such as microwave imaging and ultrasound imaging that may be capable of detecting consolidations and mucus in lungs.
- a method which is capable of extracting cough sounds from a recording by defining the beginning and the end of the cough segments has been described herein.
- a set of different features were computed from the sound signal and used as an input to a decision engine, for example an adaptive neural network-based pattern recognition algorithm or a logistic regression model.
- the proposed method achieved segmentation sensitivity and specificity of about 95%. This method can be used as the front-end of cough analysis system; hence the quantitative and qualitative information from a larger number of cough sounds in a recording can be analyzed automatically.
Description
- The present invention relates to a method and device for processing cough sounds of a patient. In particular, the present invention relates to a method and device for diagnosing pneumonia from patient cough sounds.
- Any references to methods, apparatus or documents of the prior art are not to be taken as constituting any evidence or admission that they formed, or form part of the common general knowledge.
- Cough is a defense mechanism of the body to clear the respiratory tract from foreign materials which is inhaled accidentally or produced internally by infections [1]. It is a common symptom in a range of respiratory diseases such as asthma and whooping cough (pertussis) as well as pneumonia, which is the leading cause of death in children under 5 years of age. It has been estimated [2] that pneumonia causes over 1.6 million deaths in this group per year, with more than 97% [3] of cases occurring in the developing world. The world health organization (WHO) also reported that in those countries, pertussis has became one of the major childhood morbidities with an estimated 50 million cases and 300,000 deaths every year [4].
- Even though cough is common in respiratory diseases and considered an importance clinical symptom, there is no golden standard to assess it. In a typical consultation session, physicians may listen to several episodes of natural or voluntary coughs, to obtain qualitative information such as the "wetness" of a cough. Such qualitative information is extremely useful in diagnosis as well as the treatment of respiratory diseases. However, manual analysis suffers from operator bias and leads to subjective outcomes.
- During the consultation session physicians may also seek quantitative information on coughs, such as the frequency of occurrence of cough events over a given time interval. This information can be used to determine the nature (e.g., acute, chronic) and the severity of coughs as well as to monitor the efficacy of treatment. However, to obtain this information, physicians heavily rely on subjective reports of patients or their carers. There is a great need for an automated device capable of counting the number of coughs, especially in childhood diseases. More importantly, technology capable of automatically extracting cough events from long pediatric recordings is needed in order to facilitate the diagnosis of diseases such as pneumonia, pertussis and asthma.
- Several approaches have been taken to develop automated cough counting systems (e.g., Hull Automatic Cough Counter (HACC) [5], Leicester Cough Monitor (LCM) [6], LifeShirt [7], VitaloJAK [8], and PulmoTrack [9]). The performances of these devices are varied. The HACC claimed a sensitivity and specificity of (80%, 96%) [5]. The figures for LifeShirt, Pulmotrack, LCM, and Vitalojak are (78%, 99%), (94%, 96%), (85.7%, 99.9%), and (97.5%, 97.7%) respectively [6, 10-13]. They relied on sound intensity dependent techniques, making them susceptible to variations in recording conditions and the particular instruments used. To the best of the inventors' knowledge, none of these commercial devices have been tested on pediatric populations.
- Other approaches to automatically detecting coughs or automatically diagnosing disease states from patient audio recordings are:
- 1.
US patent publication No. 2011/125044 (Rhee Hyekyn [US] et al) 26 May 2011 . This document is primarily concerned with wheeze detection for asthma patients. - 2. Hiew Y H et al. "DSP algorithm for cough identification and counting" 2002 IEEE International Conference on Acoustics, Speech, and Signal Processing, Proceedings (ICASSP), Orland, FL, May 13-17, 2002; [IEEE International Conference on Acoustics, Speech and Signal Processing (ICASSP)], New York, NY: IEEE, US, 13 May 2002 (2002-05-13), pages IV-3888, XP032015691, DOI: 10.1109/ICASSP.2002.5745506, ISBN: 978-0-7803-7402-7. This document reports a study on cough counting on asthma subjects. It describes identifying `wheezing" characteristics in coughs and uses it to count coughs primarily by monitoring the amplitude of the patient sound recordings.
- 3. US Patent publication
US 2008/082018 A1 (Sackner Marvin A [US] et al) 3 April 2008 . This document describes two methods for cough event detection. One uses a threshold on the Peak Expiratory Flow (PEF) which was computed using body-contact instruments. Another method uses bandpass filtering and duration measuring in the time domain to detect candidate cough events. A pitch value is then determined for the candidate cough event using mel-frequency cepstral coefficient determination and the event is deemed a cough if it falls within a predetermined characteristic value range. - 4. Japanese Patent publication
JP 2003038460 (Mitsubishi Pharma Corp; Toray Industries) 12 February 2003 - 5. US patent publication
US 2012/071777 A1 (MacAuslan) 22 March 2012 . This document describes various cough detection and analysis techniques generally based on cough morphology, sometimes including image processing operations such as erosion and dilation and the use of fuzzy logic. - 6. WIPO Publication No.
WO2008/152433 (BIORICS NV et al) 18 December 2008 . This document describes detecting cough sounds by calculating the Hilbert transform of the energy of the patient sound signal. An autoregression analysis is described for cough recognition but it is stated (lines 27-30 page 14) that such an approach cannot be considered reliable. - 7.
US Patent Publication No. 2011/208521 (MCCLAIN MATTHEW) 25 August 2011 . This document describes a method, system and apparatus for preprocessing a speech or audio signal to discriminate between non-language speech sounds, of which cough is one example, and language sounds. The solution described uses a hidden Markov model that is trained using various sets of features extracted from the speech or audio signal. A preferred minimum set of features comprises cepstral coefficients, pitch confidence, cepstral variance and cepstral stationarity. The document is not concerned with presenting a diagnosis of a disease related state from the non-language speech sounds that are identified. - Cough recording on children, especially the younger ones, pose several additional challenges. Younger children are unable to produce voluntary coughs upon request. Any method targeting pediatric populations should be capable of using natural coughs recorded over a period of interest. In pediatric recordings, crying, vocalization, and grunting are found abundantly, intermixed with cough sounds. Consequently, technology developed for adults are unlikely to be optimal for use on children. Another issue in cough recording from children is the cough sound intensity variation. Diseases such as severe pediatric pneumonia can dramatically lower the amplitude of a cough sound. Even in healthy people, cough sounds can have a large dynamic range, covering loud coughs to the barely audible. This condition may make intensity-based techniques unreliable for field use. The performance will also depend on particular sound capturing equipment, calibration status, and measurement protocols used.
- Existing commercial cough counting devices such as LifeShirt, Vitalojak, and Pulmotrack employ contact sensors. While the use of contact sensors may have some advantages, they also carry several drawbacks. The intervening musculature severely curtails the bandwidth of a cough recorded using contact sensors; free air systems are immune to this. Contact sensors, compared to non-contact (free-air) microphones are robust against background sound propagated through air. However, they are more vulnerable to sound conducted through tissue and bones; spurious rubbing sounds due to sensor movement can also be an issue. In infectious diseases, elaborate efforts are needed to avoid cross contamination of patients through contact instrumentation. Furthermore, in pediatric subjects, contact sensors can also be difficult to attach because of patient discomfort.
- Cough sounds carry critically useful information on the state of the airways. However, the existing devices use method that can detect only the presence of events ("Cough Detection") but are unable to automatically extract cough events ("Cough Segmentation") for further analysis. Thus they are limited to the counting of coughs. Cough Segmentation requires, in addition to Cough Detection capabilities, the knowledge on the exact beginning as well as the end of each cough event. It is known that inter-cough gaps, the durations of the coughs, and the amplitude of coughs may carry information related to respiratory diseases [14].
- One disease whose symptoms include coughing is pneumonia. Pneumonia is the leading killer of young children around the world. It accounts for more than 19% of under-five child deaths each year. It's a disease of poverty and is strongly related with malnutrition and poor healthcare facilities. As a result childhood pneumonia deaths are critically high in developing countries. Pneumonia is also a problem among the aged people throughout the world.
- Pneumonia is defined as an infection in the lungs with accumulation of inflammatory cells and secretions in the alveoli. The common symptoms of the Pneumonia includes, cough, difficulty in breathing, fever, headaches, loss of appetite, runny nose, and wheezing. In severe pneumonia cases young infants struggle for breath and may suffer convulsions, skin pallor, unconsciousness, hypothermia and lethargy.
- Pneumonia is a difficult disease to diagnose. Current methods of diagnosis include clinical examination (eg: physical signs, chest auscultation), bio-chemical testing (eg: sputum analysis, oxygen saturation) and medical imaging (eg: chest X-rays and in some cases X-ray CT).
- Chest X-ray (CXR) is considered as a commonly available reference standard for diagnosing pneumonia. However, it is not a golden standard. In early stages of the disease, or when the disease involves a part of the lung not easily seen in CXR, pneumonia can be difficult to diagnose using CXR alone. Moreover, sometimes CXR results can be misleading due to lung scarring or congestive heart failure, which can mimic pneumonia in CXR. Even though X-ray CT may provide better outcomes, they are not widely available even in tertiary care hospitals in developing countries. Sputum tests require laboratory cultures and can take a minimum 2-3 days making them too slow for initial diagnosis. A positive sputum test does not necessarily indicate the presence of pneumonia because many of the pathogens causing pneumonia are naturally present in the throats of healthy people. Therefore, sputum test is mainly done to check the sensitiveness of a particular antibiotic that has already been started on a patient. The clinical examination together with the chest auscultation via stethoscopes is the frontline approach used in the initial diagnosis of pneumonia in a clinical setting; X-ray may be used to confirm a diagnosis when available.
- None of the methods described above are available for mass deployment in remote regions of the world where pneumonia is rampant. They are expensive, resource intensive and require trained medical professionals to perform them.
- In order overcome this problem, World Health Organization (WHO) has developed a set of highly simplified guidelines [ref. 3] to diagnose childhood pneumonia in resource poor and remote areas of the world. According to these, a child presenting with difficult breathing or cough is diagnosed with pneumonia if they have tachyponea (fast breathing). Fast breathing is defined as 60 breaths or more in infants less than 2 months, 50 breaths or more per minute for the infants between 2 months to 12 months and 40 breaths or more per minute for children age between 12 months to 5 year old [
ref 3, 4]. Chest in-drawing, skin pallor and unconsciousness may indicate severe pneumonia and also belong in WHO Danger Signs. This system is easier to implement in the field and is designed to have a high sensitivity of diagnosis (about 90% patients with the disease are picked up). However, WHO guidelines suffer from poor specificity of diagnosis; a large number of patients without pneumonia are also picked up as having pneumonia. The specificity of WHO algorithm is known to be about 20%. - Though WHO guidelines have helped in reducing the mortality rate down to 1.6 million childhood deaths per annum, several problems remain with the method. Due to its low specificity[ref.6], a large number of non-pneumonic children are receiving antibiotics unnecessarily. This has resulted in treatment failures arising from community antibiotic resistance. In many pneumonia endemic regions diseases such as malaria are also common. Both pneumonia and malaria share symptoms of fever, fast breathing and cough, and WHO algorithm for pneumonia can lead to misdiagnosis and delay in treatment. Several other diseases/conditions (such as COPD, asthma, pulmonary edema, lung cancer etc), which do not require antibiotics, can present with similar clinical features to pneumonia.
- To improve the specificity of the WHO criteria, Cardoso et al [ref 6] suggested including presence of fever to diagnose pneumonia. They showed that adding fever improves diagnostic specificity significantly (up to 50%). Several other researchers in the past have assessed the accuracy of the WHO criteria in childhood pneumonia diagnosis. Harari et al [ref 7] studied several variables including tachypnoea to determine which clinical signs best predict radiographic evidence of pneumonia, in 185 children. They reported sensitivity of 73% and 64% specificity in diagnosing pneumonia with only tachypnoea (respiratory rate (RR) 50≥ breaths/min for kids <12 months and RR≥40 breaths/min if
age 1 year or older) as predictor. When they added chest indrawing to tachypnoea sensitivity improved by 4% at the cost of specificity (dropped by 6%). Similarly with the other clinical symptoms such as nasal flaring, fever, sleeping poorly cough > 2 days etc, sensitivity and specificity varied between 20 to 90%[ref 6 - 10]. High sensitivity was achieved at the cost of specificity and vice-versa. - It is an object of the present invention to provide an improved method for identifying cough sounds and diagnosing pneumonia.
- According to a first aspect of the invention there is provided a method of operating a computational device (52) to process a sound recording of a patient (501), the method characterized by the steps of:
- extracting Mel-frequency cepstral coefficients (MFCCs) (209), Formant Frequency (211), Zero Crossing Rate (213), Shannon Entropy (215) and Non-Gaussianity (217) features from patient sounds in the recording to form feature vectors (223);
- classifying (225) segments as cough sounds (1001) based upon the extracted features with a pattern classifier (300); and
- presenting a diagnosis of a disease related state on a display (56) under control of the computational device (52) based on segments (1001) of the patient sounds (501) classified as cough sounds, wherein the diagnosis presented is pneumonia.
- In an embodiment the pattern classifier comprises an artificial neural network (300).
- In an embodiment the artificial neural network (300) comprises a time delay neural network (TDNN).
- In an embodiment the TDNN (300) has a hidden layer (303) between an output layer (305) and an input layer (307) with 10 to 50 neurons in the hidden layer (303).
- In an embodiment the method includes calculating a bispectrum for further classification of the cough segments.
- In an embodiment the method further comprises diagnosing a disease related state based on the segments of the patient sounds classified as cough sounds and presenting the diagnosis on the display under control of the computational device.
- In an embodiment the method includes monitoring patient data from one or more of a: breathing detection sensor, temperature sensor, movement sensor, EEG sensor, oxygen level sensor.
- In an embodiment the method includes categorizing cough sounds as being "wet cough" or "non-wet cough" sounds (1506).
- In an embodiment the method includes the steps of:
- categorizing cough events of the patient sounds as either diseased or non-diseased by processing features extracted from cough events according to a classification procedure;
- computing a diseased cough index indicating the proportion of diseased cough events categorized; and
- deeming the patient to be suffering from the particular disease state in the event of the diseased cough index complying with a predetermined requirement.
- In an embodiment the classification procedure comprises of any one of: a logistic regression model; an artificial neural network; a Bayes classifier; a hidden Markov model; a support vector machine.
- In an embodiment the diseased cough index (1207) comprises a pneumonic cough index.
- In an embodiment the method includes deeming the patient to be suffering from pneumonia based on the pneumonic cough index.
- In an embodiment the pneumonic cough index is compared to a predetermined threshold.
- In an embodiment the method incldues applying a training set to said any one of:
- a logistic regression model; an artificial neural network; a Bayes classifier; a hidden Markov model; a support vector machine;
- the training set including non-pneumonic sounds recorded from patients suffering from one or more of the following complaints: Asthma, Bronchitis, Rhinopharyngitis, wheezing, tonsillopharyngitis, heart disease, laryngomalacia, malaria, and foreign body inhalation.
- According to a further aspect of the present invention there is provided a computational device (52) including at least one electronic processor (70) in communication with an electronic memory (62, 64, 66) containing instructions for the processor to carry out the method.
- According to a further aspect of the present invention there is provided a machine readable media (46) bearing tangible instructions for execution by one or more electronic processors (70) for carrying out the method.
- Preferred features, embodiments and variations of the invention may be discerned from the following Detailed Description which provides sufficient information for those skilled in the art to perform the invention. The Detailed Description is not to be regarded as limiting the scope of the preceding Summary of the Invention in any way. The Detailed Description will make reference to a number of drawings as follows:
-
Figure 1 . Is a block diagram of a cough processing system. -
Figure 2 . Is a flowchart of a method according to a preferred embodiment of an aspect of the present invention. -
Figure 3 . Depicts the structure of a TDNN. It comprised of an input layer, a hidden layer, and an output layer. The input of TDNN is d successive feature vector fk. As an example, for d = 5, the input is {fk-4,j , fk-3,j , ..., fk,j }. To classify the all sub-blocks, the input is shifted by a sub-block to the right. -
Figure 4 . Depicts the smoothed probability density function of the duration of cough segments (τs ). It has mean of 0.373 s, and standard deviation of 0.144 s. -
Figure 5 . Illustrates a noise reduction process. (A) is typical signal in the recording, (B) is the output of high pass filter, and (C) is the output spectral subtraction filter. The developed filter improved the SNR (signal to ratio) of the signal significantly. -
Figure 6 . Depicts the probability density function (pdf) of randomly selected Mel-frequency cepstral coefficient (smoothed for display purposes). Although they are overlapping, the coefficient M(4) can be used to differentiate cough and appliance sound, the coefficient M(9) differentiate between cough to cry, and M(11) differentiate between cough and vocalization. -
Figure 7 . The pdf of five first formant frequencies (F(1) - F(5)). Even though the distribution of the formant frequencies are overlapping, they have different mean, skewness, and kurtosis, especially for F(1), F(3), and F(5). -
Figure 8 . The pdf of the energy, zero crossing rate (ZCR), Shannon entropy, and non-Gaussianity score (NGS). The NGS can be used to differentiate between cough with vocalization and cry, while ZCR differentiate between cough and appliance sound. The profile of log energy and Shannon entropy between sounds are similar but they have different skewness and kurtosis. -
Figure 9 . Illustrates cough segment identification. (A) The sound signal from the noise reduction process, (B) the output signal from TDNN, (C) the output signal after smoothing process, and (D) the output signal after thresholding process. The signal from the thresholding may contain false segment (e.g., FD segment). -
Figure 10 . The illustration of input signal and the output signal from segmentation algorithm. The dashed line indicates the segmentation output where the beginning and the end of each cough segment can be determined. The false segment FD (shown in -
Fig. 9(D) ) is discarded because its duration is outside the criteria of duration (τmin<τs<τmax ). The algorithm successfully segments all cough sounds including CG3 which overlaps with speech (SP). -
Figure 11 . The segmentation output (dashed line) of the signal which contains cough and cry sounds. Our segmentation algorithm successfully segmented two cough sounds and discarding the cry sounds. Only small part of cry sounds mistakenly detected as cough segment. -
Figure 12 . Block diagram for the proposed algorithm for the Pneumonia diagnosis using cough feature. -
Figure 13 . Sample pneumonia cough sound. Start and end of the cough events were manually marked after carefully listening to the cough events. -
Figure 14 . Magnitude response of the digital high pass filter. Pneumonia classification method. -
Figure 15 Block diagram for the proposed algorithm for the Wet and Dry cough sounds classification. -
Figure 16 . Histogram of sensitivity and specificities achieved for 200 training and testing datasets. Only selected features were used for LR model designing. -
Figure 17 is a flowchart of a method for diagnosis of a disease state, for example pneumonia. -
Figure 18 comprises charts presenting details of subjects associated with application of the method ofFigure 17 . -
Figure 19 shows typical examples of (a) pneumonia-cough, (c)asthma-cough, (e)bronchitis-cough and (g)bronchiolitis-cough waveforms and their corresponding power spectrogram. -
Figure 20 is a block diagram of an automated cough classification procedure. -
Figure 21 shows a typical example of dry cough waveform and wet cough waveform from two patients, -
Figures 22A and 22B are histograms of SNR for the cough sound. -
Figure 23 Shows statistical information used in an analysis and discussion of the method illustrated inFigure 20 . - The cough recording system consisted of low-
noise microphones pre-amplifier 52 and A/D converter 51 (Model Mobile Pre-USB, M-Audio®, CA, USA) for the signal acquisition. The output of the Mobile Pre-USB was connected to theUSB port 50 of alaptop computer 52. The nominal distance from the microphones to the mouth of subject 42 was 50 cm. The actual distance could vary from 40 cm to 100 cm due to the subject movement. However, the proposed method did not depend on the sound intensity and the results were independent of the mouth to microphone distance. We kept the sampling rate at 44.1 k samples/s and 16-bit resolution to obtain the best sound quality. - The
computer system 52 operates as a cough / non-cough classification system and/or a cough based diagnosis system according to preferred embodiments of various aspects of the present invention, while executing a computer program which will be described shortly.Personal Computer system 52 includes data entry devices in the form of pointingdevice 60 andkeyboard 58 and a data output device in the form ofdisplay 56. The data entry and output devices are coupled to aprocessing box 54 which includes acentral processing unit 70. Thedisplay 56 comprises a human-machine interface for presenting the results of various classification procedures implemented by the methods described herein. Other human-machine interfaces are also possible, such as a smart phone or a printer for example. - Central processing unit (CPU) 70 interfaces with storage devices that are readable by machine and which tangibly embody programs of instructions that are executable by the CPU. These storage devices include
RAM 62,ROM 64 and secondary storage devices i.e. a magnetichard disk 66 andoptical disk reader 48, viamainboard 68. The personal computer system also includes aUSB port 50 for communication with theexternal ADC module 51 which pre-amplifies, filters and digitises signals frommicrophones bed 40. -
Secondary storage device 66 is a magnetic data storage medium that bears tangible instructions, for execution bycentral processor 70. These instructions will typically have been installed from an installation disk such asoptical disk 46 although they might also be provided in a memory integrated circuit or via a computer network from a remote server installation. The instructions constitute asoftware product 72 that is loaded into the electronic memory ofRAM 62. When executed the instructions causecomputer system 52 to operate as a cough-based diagnosis system, and/or a cough or non-cough patient sound classifier, and in particular to implement a one of a number of methods that will be described shortly. - It will be realised by those skilled in the art that the programming of
software product 72 is straightforward in light of the method of the present invention, embodiments of which will now be described. In the following method various variables are manipulated. It will be realized that during operation ofcomputer system 52 to implement the method corresponding registers ofCPU 70 will be incremented and data written to and retrieved fromsecondary storage 66 andRAM 62 by virtue of electrical signals travelling along conductive busses etched onmainboard 68. Consequently, physical effects and transformations occur withincomputer system 52 as it executessoftware 72 to implement the method that will now be described. - Although the computational device that has been shown comprises a personal computer, e.g. a desktop or laptop computer, other computational devices are also encompassed. For example, a dedicated medical device and also a smartphone loaded with an application, i.e. an "app" for implementing one or more of the methods described herein. In the case of a smartphone the phone's onboard microphone may be used to monitor the patient sounds or alternatively one or more high quality external microphones may be connected to the smartphone for such monitoring. The smartphone may transmit digital recordings of patient sounds to a distant computer which then processes the digital recordings, via cellular telephone networks and/or the Internet, according to the methods that are described herein. The results of the processing may be transmitted back to the smartphone for display thereon or alternatively be displayed on an electronic display device under the control of the distant computer.
- The computational device may also be interfaced to a number of patient sensors such as a movement sensor; EEG sensor; Oxygen level sensor, breathing detection sensor, temperature sensor for example. The data from these sensors may also be used during performance of the various methods described herein.
- The data for this work was recorded at Sardjito hospital, Yogyakarta, Indonesia, from pediatric patients admitted for respiratory complaints. We acquired data in the natural hospital environment, without modifying it in anyway, other than placing our sound recording system by the bed (see
Fig. 1 ). Recordings were carried out in two types of hospital rooms (single occupancy and double occupancy) during daytime. The research protocol had received ethics clearances from Sardjito Hospital and The University of Queensland, Australia. - Our database consisted of cough sounds from children spanning the age range of 5 - 64 months. See Table 1 for details of inclusion and exclusion criteria.
TABLE 1 INCLUSION AND EXCLUSION CRITERIA USED IN THE STUDY Inclusion criteria Exclusion criteria - Symptoms of respiratory tract infection , at least 2 of: cough, sputum, breathlessness, and temperature >37.5° - Advanced disease where recovery is not expected. - Droplet precautions - Having non-invasive ventilation treatment - Informed consent complete - No informed consent - The recordings were started after physicians had examined the subjects and the initial treatment had begun. The duration of recording for each subject was from 4 - 6 hours. In Table 2, we illustrate the demographic details of the subjects.
TABLE 2 THE DEMOGRAPHIC INFORMATION OF THE SUBJECTS INVOLVED IN THIS STUDY. Sub-ject Age (months) Gender Diagnosis 1 6 M Heart failure, pneumonia 2 8 M Pneumonia 3 2 M Rhinopharyngitis 4 8 M Pneumonia 4 5 M Pneumonia 6 12 F Pneumonia 7 64 F Bronchopneumonia 8 16 F Pneumonia 9 15 F Tonsilopharyngitis 10 16 F Rhinopharyngitis 11 9 M Pneumonia 12 11 M Pneumonia 13 30 M Bronchitis 14 11 M Pneumonia - The discretized sound recording, r[n], can be modeled as the summation of cough sounds sc[n], background noises b[n], and non-cough sounds snc[n] (e.g., speech, cry, vocalization, appliances movement, etc) as follows:

- An automated method to extract sc[n] from the recording r[n] is provided. The block diagram of the overall method is shown in
Fig. 2 . It comprises of four main processes: (a) noise reduction, (b) feature extraction from sub-blocks of data, (c) classification of the sub-blocks of data into cough group (CG) and non-cough group (NG) classes, and (d) identifying/forming cough segments by appropriately grouping CG/NG-classified contiguous sub-blocks of data. - In sections 2.2.1 - 2.2.4, we provide a detailed description of the method.
- In order to reduce the background noise b[n], we processed r[n] through two different filters: (a) a high pass filter (HPF), and, (b) a power spectral subtractions (PSS) filter. The HPF was designed as a fourth-order Butterworth filter. It was used to reduce the low frequency interference that may come from the movement of the microphone stands or the bed. The PSS filter was employed to reduce the locally stationary background noise. It estimates the clean sound signal by subtracting the power spectral of original sound signal with estimated background noise [15]. The output signal ŝ[n] after filtering can be re-written as follows:

- We measured the performance of the filter by computing the signal to ratio [SNR], defined as a measure of signal magnitude relative to background noise, before and after noise reduction process. The SNR is computed as:

- After the noise reduction process, ŝ[n] is used as the input to the feature extraction unit.
- In this section, we describe the model of cough sound production and the details of the feature extraction unit.
- Based on physiological considerations, cough sounds are often considered as a combination of four different phases [1]: inspiratory, contractive, compressive, and expulsive. The inspiratory phase is initiated by breathing in and terminated by the closure of the glottis, supraglottis sphincters, or both. In the contractive phase, groups of respiratory muscles contract against glottal structures leading to the compressive phase characterized by marked elevation of alveolar, pleural, and sub glottis airway pressures. In the expulsive phase, the glottis opens quickly followed by rapid exhalation of air under a large pressure gradient. The rapid movement of air expelled from the lung generates the cough sounds with contributions coming from different areas of the respiratory system. The mechanism of cough sounds production shares some similarities to that of speech production.
- To obtain the features of the sound signal, we apply a rectangular sliding window wr[n] of length N to ŝ[n], generating data sub-blocks. Let the kth data sub-block be denoted by sk[n]; hence ŝ[n] can be expressed as the concatenation of sub-blocks sk[n], i.e., ŝ[n] = {|s1[n]|, |s2[n]|, ..., |sk[n]|, ..., sK[n]|} where K is the total number of sub-blocks in ŝ[n]. We compute the following features for each sub-block sk [n].
- i) Mel-frequency cepstral coefficients (MFCCs): MFCC is widely used in speech processing [16, 17], and were found to be highly useful for snore analysis [18-21] as well. In this work, inspired by the similarities of cough/respiratory sounds to snores and speech, we explore the use of MFCC in Cough Segmentation. We compute the first L Mel-frequency cepstral coefficients M(l) k = {M(l)k, 1 = 1, 2, ..., L} of each sub-blocks sk[n]. The coefficient was computed by multiplying the signal sk[n]with a hamming window wh followed by applying the successive processes of: Fast Fourier Transform (FFT), Mel-frequency filter bank fm filtering, and discrete cosine transform. The Mel-frequency filter fm is defined in (4) and M(l) k is given in (5).


- ii)Formant frequency: In speech, Formant frequencies show characteristics of vocal tract resonances; in snore sound analysis they indicate the resonance of the upper airway. We hypothesized that in cough/respiratory sounds, formant may carry resonances of the entire respiratory tract. For instance, wheezing sounds, which originates due to vibrations of the bronchioles of the lung, may contribute higher frequency formants (resonance frequencies) in the cough sounds. In this work, we estimated the first P formant frequencies F(p)k = {F(p)k, p = 1, 2, ..., P}. LPC spectrum and its parameters were determined by solving Yule-Walker equations via the Levinson-Durbin recursion [22].
- iii)Zero crossing rates (ZCR): The ZCR, defined as the total times a signal crosses the zero axis, is a simple but useful method to detect the periodic nature of a signal regardless of its magnitude. The ZCR feature Zk is computed as follows.

- iv)Non-Gaussianity score (NGS): The non-Gaussianity score (NGS) provides an easy method to quantify the deviation of a given signal from a Gaussian model. In our previous work on snore sound analysis [23], this feature showed a capability to screen obstructive sleep apnea. To obtain the NGS, in each and every sk[n], we computed the inverse (F-1 ) of normal Cumulative Distribution Function (y) as given in (7).


- v)Shannon entropy: Cough sound is a complex signal which represents contributions from various sub-structures of the respiratory tract. Some of these components display pseudo-periodic structures, while others have a random stochastic character. In some cases, cough sounds have abrupt transitions from inspiratory phase to expiratory phase. This period may contain instant break as well as high frequency components. In this work, we computed the Shannon wavelet entropy to capture these features. In wavelet analysis, the signal sk[n] at scale i can be decomposed into its high and low frequency component using a complementary filter consisted of low pass and high pass filter. The outputs from low and high filter are defined as approximation and details (Ai and Di , respectively). The wavelet Shannon entropy Sk is obtained using definition in (9) by computing the wavelet energy spectrum Ei as in (10) [24].


- The features described in B(i) - B(v) are computed for each sub-blocks sk[n]. In each feature, we computed the minimum and the maximum values in each feature of Mk, Fk, Zk, Sk, and Nk. We used these values to normalize the components of the corresponding feature into range of -1 to 1.
- The normalized parameter vector fk of sk[n] is then defined as: fk = {[MkFkZkSkNk ]T}. The overall feature matrix Gj for the jth patients is then given by Gj = {f1,1, f1,2,..., fk,j , ..., fK,J }.
- As illustrated in
Fig. 2 , the Cough Segmentation technique starts by classifying each and every data sub-block sk[n] into the two non-overlapping categories of Cough Group (CG) and non-Cough Group (NG) based on the feature vector fk,j. - In section 2.2.3, we describe the pattern classification scheme we developed for this CG/NG classification at the sub-block level.
- One embodiment of the invention makes use of an Artificial Neural Network (ANN) as the CG/NG pattern classifier at the sub-block level. We used the ANN inspired by the capability of human brain to recognize different types of cough sounds regardless of their intensity, duration, or wetness. Moreover, ANN has several advantages in that its capable of classifying data using non-linear decision boundaries, based on a process of supervised learning with a set of given examples. It has a proven ability to work with limited training data sets compared to conventional methods [25]. In this work, we used the particular form of an ANN known as a Time Delay Neural Network (TDNN) [26] that has found success in speech recognition applications. TDNN is capable of classifying data sub-blocks sk[n] discounting temporal translations [26] of the input feature set.
- We show the structure of TDDN in
Fig. 3 . It comprised of an input layer, a hidden layer, and an output layer. In TDNN, we used d successive feature vectors of the matrix Gj , to classify a sub-block as a CG/NG class. To classify the next sub-block, we shifted the input by a sub-block the right, and used the next group of feature vectors. We performed this process from the beginning to the end of matrix Gj , thus all of the sub-blocks in ŝ[n], can be classified into CG/NG class. - The classification of sub-blocks using TDNN was carried out through the process of training, validation, and testing. To complete these processes, we prepared a data set, selected the training parameters, trained the TDNN, and validated the classification results. Details of these processes are described in the following sub-sections. (a) TDNN data set preparation.
- We developed a data set comprised of cough and other sounds from the recording. There are 665 cough sounds in our data set. We divided our data set into three non-overlapping random partitions, and named them as training (TDS), validation (VDS) and testing (TeDS), respectively. The proportions of TDS, VDS, and TeDS from the database are (40%, 30%, and 30%, respectively). We denote the mth such random partitions by the symbol Cm, m = 1, 2, ..., M, where M is the total number of random partitions used in this work. All classification data set were analyzed independently. We effectively used our data set by applying K-fold cross validation method using the random sub-sampling technique.
- By using information cough segments locations of the classification data set, we defined a matrix Wk = [w1 , w2, ..., wk, ..., wK , wk = II{CG class}], where wk is the class of each sub-block of sk[n] filled by "1" when the argument of Π{CG class} is correct and "0" for otherwise. The matrix Wk was used as a target in the training process. Note that the dimension of Wk is similar to Gj.
- TDNN used in this study has the parameters as prescribed in Table 3.
TABLE 3 TDNN TRAINING PARAMETERS Parameters Details Number of layers 3 Number of neurons per layer Input layer (Li ) = 110, Hidden layer (Lh ) = 20, Output layer (Lo ) = 1 Activation function Tangent sigmoid and linear Weight and initialization Nguyen-Widrow Training method Resilient back propagation (RPROP) Stopping criteria Mean square error = 10-5, Minimum gradient = 10-10 , Maximum validation failure = 100 Successive inputs (d) 5 - We explain the procedure used to determine the selection of number of the neuron in Section 3.4.
- We constructed the network of TDNN, denoted as netc, comprising of an input layer Li , a hidden layer Lh, and an output layer Lo. The linear and sigmoid functions were selected as activation function between layers. To determine the initial weight and bias, we used the Nguyen-Widrow initialization method.
- For updating the bias term and weights of neuron during the training process, we employed the resilient back propagation (RPROP) algorithm [27]. The RPROP was found success to overcome problem of determining learning rate for updating the weights of neurons. In gradient descent algorithm, a too small learning rate increase the computation time while a too large learning rate will produce oscillation before reach the optimum point with reasonable error. In contrast, the RPROP use an adaptive value to update the weight, hence it is capable of achieving the maximum optimization quickly. The details of this algorithm is described in [27].
- In the training process, we defined stopping criteria: (a) the mean squared error (mse) of the training data was less than 10-5, (b) the validation error began increasing, and (c) a minimum gradient in training performance of 10-10 was reached. Unless the training was stopped earlier, the neural network was allowed to train up to 100 epochs.
- Once these parameters have been set, we started training the TDNN. In the training process, we let the network of TDNN netc, to learn classifying the sub-blocks into CG/NG class. The process was carried by giving d successive feature vectors from Gj to netc, to approximate a target in Wk. We investigated several combinations of features in fk to find the combination of inputs which give the best results in classifying the CG and NG classes. We denoted the output of the netc during training process as Ŵk , the approximation of Wk. To identify the Cough Segments, Ŵk was processed as in the following section.
- In this section, we describe the technique to obtain the Cough Segment by processing the output of TDNN (Ŵk ) through segment identification process. The process comprised of: smoothing the output of TDNN, applying a threshold to the smoothed signal to obtain segments, measurement of the duration of segments, and selection of the segments based on a criterion. The overall processes are described in the following steps:
(S1) Define a parameter β, a small positive integer which determines the span of moving average filter (H). Apply Ŵk to filter H to produce a smoothed signal Ŵk. (S2) Apply threshold value (λ) to the smoothed signal Ŵk. The output signal from this process was denoted as Ẅk given in (11). The group of contiguous elements in Ẅk was defined as cough segment candidates. 
(S3) Compute the duration (τs ) of the corresponding segments containing '1' in ẅk . This process is carried by determining the start and end of each segment. a. Starting k = 1, find the smallest value of k (say ka ) where all sub-blocks ẅk correspond to the category of NG class. The beginning of the sub-block ẅk , k = ka was taken as the beginning of a NG segment. b. To identify the beginning of cough segment, start the searching in the domain of ka<k<K. Find the smallest value of k (say kb) in that domain, such that none of the sub-blocks in ẅk correspond to NG. The beginning of the sub-block ẅk, k = kb is taken as the beginning of a CG segment. c. The end of NG is determined in a process similar to step (S3.a), with search domain for k set to kb<k<K. (S4) Define parameters of τmin and τmax , a small positive fraction which determine the minimum and maximum segment duration of a typical cough sound from children. The segments which durations are outside of this constraint will be discarded. We denoted the output signal of this process as w̋k. - Steps (S1)-(S4) describe the method to determine the beginning and the end of each segment of sc[n] and to discount segments of snc[n] in a recording. In order to validate the results, all obtained cough segments in w̋k were compared with cough segments in Wk.
- In our clinical data, we identified the duration of each cough segment (τs ) by a combined process of visual observation and listening. The smoothed probability density function of τs is illustrated in
Fig. 4 . The cough segments have minimum and maximum duration of (τmin = 0.18 s and τmax = 11.6 s). The mean and standard deviation of the cough segments are (µs = 0.373, σs = 0.144). In the segmentation process, we use the τmin and τmax as one of the criteria to determine the predicted segments as cough or non-cough sound. We describe this process in Section 3.5. - Recording in an uncontrolled environment makes the data more susceptible to background noise. In our recordings, we identified two separate components of noise: (a) low-frequency noise below 10 Hz and (b) white Gaussian noise (see
Figure 5(A) ). From the figure it could be seen that the recording has a poor signal to noise ratio (SNR) spanning the range 1.54 - 5.92 dB. To reduce theses noises we used a fourth order Butterworth high pass filter (HPF) with 10Hz cut off frequency and power spectral subtraction (PSS) filter. - These filters improved the SNR significantly. The HPF increased it to 11.98 - 17.19 dB (
Figure 5(B) ) and the PSS further increases it to 12.62 - 17.44 dB (Figure 5(C) ). These results show that the developed filters capable of reducing the background noise and improving the SNR of the recording signal. - As described in Section 2.2.2, we computed the feature vector fk = {Mk Fk Zk Sk Nk} for each sub-block of sk [n]. We used the sub-block size N = 882 (20 ms). The selected sub-block size is the basic unit for feature extraction of MFCC. Smaller sizes (e.g., 10 ms), generally lead to distorted results, because of very few samples involved in Mel-filter integration; larger sizes have tendency to increase the word error rate [28].
- The feature vector fk contains 22 elements: 14 coefficients of Mk (including log energy and the 0th - 12th cepstral coefficients), 5 coefficients of Fk , and 1 coefficient of each Zk, Sk, and Nk. To discover the characteristic of these features, we calculated the probability density function (pdf) of a specific sound in the CG and NG classes. The NG represent wide range of non-cough sounds, hence in this work; we choose the most dominant sound such as cry (CY), vocalization (abbreviated as VC, e.g., speech, typical baby voices) and appliances sound (abbreviated as AS, e.g., sound from the door bank, trolley, bed).
- We illustrate the smoothed pdf of each feature of fk in
Fig. 6 - 8 . As can be seen from these figures, the distribution of features (Mk, Fk , Zk, Sk, and Nk ) between cough and other sounds are overlapping. However, each component of the features has a unique distribution. -
Fig. 6 shows the pdf from a randomly selected elements of MFCC (M(1), M(4), M(9), and M(11)). FromFig. 5(A) and 5(B) , it could be seen that the pdf of M(1) in CG and AS classes have different mean (µ = 0.31 to 0.18). The pdf of M(9) inFig. 5(C) show that CG has lower mean than CY (µ = -0.01 to µ = -0.13, respectively). -
Fig. 7 exhibits the pdf of formant frequencies. The statistical distribution (mean, standard deviation, skewness, and kurtosis) of formant frequencies of F(1), F(3), and F(5) between CG and AS are distinguishable. The distribution of F(2) in CG, CY, VC, and AS seem similar, however CG has the lowest mean (-0.06). Moreover, the distribution of F(4) in TS has the lowest mean among the classes (-0.003). - In
Fig. 8 we illustrate the NGS index of CG, CY, VC, and AS. The NGS has the potential to discriminate CG from VC and CY (Fig. 7(D) ). Similarly, fromFig. 6(B) it could be seen that ZCR can be used to discriminate CG from AS. - The pdf of the features shows that there are no dominant feature which can be used alone as an input for TDNN to classify CG/NG class. Hence, to obtain the maximum benefit of each component of the features, we combined them and used d successive of features vector as the input of TDNN to classify CG/NG class.
- In this work, we used five successive feature vectors (d = 5); hence the number of neurons in the input layer is (Li =110). In the output layer, there is only one neuron (Lo=1) to represent of CG or NG class. To determine the number of neurons in Lh, we tested several numbers of neurons during the training process.
- To evaluate the performance of the network (netc), we computed the sensitivity and the specificity defined by the following equations.


- In Table 4, we show the performance of netc for different values of Lh.
TABLE 4 THE PERFORMANCE OF TDNN FOR DIFFERENT COMBINATIONS OF HIDDEN LAYERS (LH ). THE HIDDEN LAYER WITH 20 NEURONS SHOWS THE BEST CLASSIFICATION PERFORMANCE. Number of neurons in hidden layer (Lh ) Data set Performance Sensitivity Specifiedy 10 TDS 98.34 98.35 VDS 85.24 85.24 TeDS 90.32 90.35 20 TDS 98.12 98.13 VDS 86.80 86.61 TeDS 91.51 91.51 30 TDS 98.31 98.32 VDS 85.03 85.05 TeDS 90.24 90.25 40 TDS 98.41 98.41 VDS 85.57 85.57 TeDS 91.45 91.45 50 TDS 98.43 98.43 VDS 85.69 85.69 TeDS 89.89 89.92 - From Table 4 it could be seen that in the testing set (TeDS), the netc with 20 neurons in the hidden layer has the highest sensitivity and specificity of (both 91.51%). Thus, for the rest of this discussion we fix the network netc (Li=110, Lh=20, Lo=1). The number of neurons in netc is compact enough to be used in a system with limited computing resources. The small number of layer and neurons also improve the capability of the network to develop the best model for CG/NG classification and to avoid memorizing the samples given in the training.
- We show the performance of the classification of sub-block sk[n] into cough (CG) and non-cough (NG) classes, using different combination of features in Table 5.
TABLE 5 THE PERFORMANCE OF TDNN IN DIFFERENT COMBINATION OF FEATURES. THE COMPLETE COMBINATION {MKFKZKSK NK } HAS THE BEST SENSITIVITY AND SPECIFICITY. Data set Mk +Fk Zk +Sk +Nk Mk +Zk +Sk +Fk+Nk Sens. Spec. Sens. Spec. Sens. Spec. TDS 99.05 99.05 87.00 87.00 98.12 98.13 VDS 85.69 85.73 81.44 81.48 86.80 86.81 TeDS 89.37 89.37 79.95 79.98 91.51 91.51 - In the testing set (TeDS), the classification result using {Zk Shk Nk } shows the lowest sensitivity and specificity (79.95 and 99.98) respectively. The combination {MkFk} has a higher result with 89.37% of sensitivity and specificity. In contrast, the combination of {Mk Fk Zk Shk Nk} achieved the best sensitivity and specificity of 91.51%. Next, we explored the combination {Mk Fk Zk Shk Nk} as the input for TDNN.
- The performance of TDNN for M = 14, (Cm , m = 1, 2, ..., 14) is shown in Table 6.
TABLE 6 SUMMARY OF NG/CG CLASSIFICATION OUTCOMES FROM TDNN FOR M = 14, (CM, M = 1, 2, ...., 14). Data set Sensitivity Specificity mean std mean std TDS 96.77 0.0121 96.78 0.0121 VDS 89.40 0.0170 89.41 0.0170 TeDS 91.13 0.0073 91.14 0.0073 - Classification outcomes for each realization, Cm, m = 1, 2, ..., 14, were computed and the mean and the standard deviation of sensitivity and specificity were estimated (91.13 ± 0.0073% and 91.14 ± 0.0073 %, respectively).
- We illustrate the formation of cough segments, starting from sub-blocks classified in Section 3.4, in
Fig. 9. Fig. 9(A) shows the signal from the noise reduction process whileFig. 9(B) illustrates the output signal from TDNN-based classification (ŵk ). InFig. 9(B) we show the output of the network netc representing the approximation of the state of CG and NG classes (1 and 0, respectively). As can be seen, the groups of sub-blocks associated to cough sounds formed segments with value close to 1, and otherwise for the groups of sub-blocks from the non-cough sounds. From theFig. 9(B) it also could be seen that the network netc effectively classify the sub-blocks into CG and NG classes, even though they overlap with speeches (illustrated in CG3 signal). However, some of the sub-blocks in the middle parts of CG2 and CG5 segments were misclassified as NG class indicated by the sharp transition from high to low values. - To refine the segments and reduce the misclassified sub-blocks in the segments, we processed the signal into a smoothing process based on moving average filter. In this stage, we carefully selected the span of the moving average filter as (β = 9). We show the smoothed signal (ẅk ) obtained from smoothing process in
Fig. 9(C) . As can be seen fromFig. 9(C) , the sharp transition parts in the corresponding segments were reduced. - To determine the beginning and the end of cough segments, all elements in ẅk were compared against a threshold (λ). The corresponding element will be set to 1 If ẅk > A then and 0 for otherwise (ẅk < λ), where λ was set to 0.05. This value of λ was chosen to maximize the classifier performance. We show the output signal from thresholding process (w̋k ) in
Fig. 9(D) . It now contains two groups of segments formed from 1 and 0 elements. We denoted the segments with elements of 1 as cough segment candidates - Next, we defined the first element in a cough segment candidate as the beginning of the segment and the last element as the end of the segment. From Section 3.3 and 3.4 we knew that each element in a segment represents the class of 20 ms sub-block. Hence, we can compute the duration of a segment by multiplying the number of elements between the beginning and the end of a segment with 20 ms. We computed the duration of each segment (τs ), and tested τs against a minimum and maximum cough duration obtained in Section 3.1. Only the cough segment candidates which durations within the boundary (τmin <τs <τmax ) were selected as cough segments. The illustration of this process is shown in
Fig. 10 . From the figure it could be seen that the proposed method effectively segments the cough (CG1 - CG6) even though they have different intensity and duration. Moreover, although cough sound CG3 is overlapped with speech, the method is capable of extracting the corresponding cough sound. The false segment (FD) shown inFig. 9(D) also has been eliminated. -
Figure 11 illustrates the output of the segmentation method in a typical signal which contains cough sounds intermixed with cry sounds. The method successfully extracted the two cough sounds from the signal and only detected one false segment from a long duration of cry. - We show the performance of our segmentation method for M = 14, (Cm, m = 1, 2, ..., 14) in Table 7.
TABLE 7 THE PERFORMANCE OF THE COUGH SEGMENTATION METHOD FOR M = 14, (CM, M = 1, 2, ...., 14). Data set Sensitivity Specificity mean std mean std TDS 99.20 0.77 98.80 0.68 VDS 94.85 2.86 95.00 2.18 TeDS 95.07 3.43 94.76 4.02 - Segmentation outcomes for each realization, Cm, m = 1, 2, ..., 14, were computed and the mean and the standard deviation of sensitivity and specificity were estimated (95.07 ± 3.43% and 94.76 ± 4.02%, respectively). The result also shows that the formation of cough segments from sub-blocks process improves the sensitivity and specificity by around 4% compared to the outcomes of sub-blocks classification. The proposed method successfully discounted sounds such as crying, vocalization, and other environmental sounds.
- In this work, we recorded the cough from children in a pediatric ward in Indonesia using a non-contact sensor. We found that a non-contact sensor is preferable for this purposes because of the ease of deployment and infection control.
- Our work focused on the pediatric populations less than 5.5 years which is an area left untouched by previous studies. Children in that age range are more vulnerable to respiratory diseases shown by the high rate of morbidity and mortality. Thus, investigation to develop a method for analyzing signal from the populations is extremely important.
- Referring now to
Figure 12 there is shown a block diagram illustrating a method according to a preferred embodiment of a further aspect of the present invention. The method illustrated inFigure 12 is developed for the diagnosis of particular disease states, for example Pneumonia/-non-Pneumonia classification, associated with a patient. A further classification method is discussed at the end of this specification. - The data acquisition environment for this work is Respiratory Medicine Unit of the Sardjito Hospital, Gadjah Mada University, Indonesia. Our subject population includes individuals with symptoms of respiratory disease. Patients admitted to the general ward of the hospital were assessed by a clinician for the presented symptoms. All the observations were documented in a standard sheet. Observations included presence of cough, runny nose, fever, breathing difficulty, diarrhoea etc. Clinician also recorded Temperature, Breathing rate, SpO2 and Heart rate.
- Table 8 lists the inclusion and exclusion criteria. All patients fulfilling the inclusion criteria were approached. An informed consent was made. Patients were recruited within first 12 hours of their admission. After the informed consent continuous sound recordings were made for next 4-6 hours.
Table 8. Inclusion and Exclusion Criteria Used in the study Inclusion Criteria Exclusion Criteria - Patients with symptoms of chest infection : At least 2 of - Advanced disease where recovery is not expected eg terminal lung cancer - Cough - Sputum - Droplet precautions - Increased breathlessness - NIV required - Temperature >37.5° - No Consent - Consent - The sound recordings were made in the general adult ward of the hospital. Patient shared the room with 5 other patients separated by curtains. The patients were accompanied by their family members. The attending physician regularly visited the patient, however no confidential information related to the patient was recorded. The common noise present in the recordings were from celling fan, foot step, speech, door banging, trolley movement and other ambiguity noises from outside the room.
- Cough sound recordings were made using two systems,
- (i) Computerized data acquisition system - A high fidelity, professional quality pre-amplifier and A/D converter unit, (Model Mobile-Pre USB, M-Audio, California, USA) with a matched pair of low-noise microphones having a hypercardiod beam pattern (Model NT3, RODE, Sydney, Australia).
- (ii) Portable recording system - A high-end, light-weight portable, 2-AA battery powered audio recorder (Olympus LS-11) with two precision condenser microphones.
- In both the recording setup we used a sampling rate of 44.1 kHz with a 16 bit resolution. The nominal distance from the microphone to the mouth of the patient was 50 cm, but could vary from 40 cm to 70 cm due to patient movements.
- We received the digital sound data aided with the clinical diagnostic information from the hospital. Data was completely de-identified and was stored behind the secure firewall, under a strict regime of password control. The access of the data was restricted to the participant researchers individually authorized by the principle investigator.
-
Figure 12 shows the block diagram of the overall algorithm developed for the Pneumonia/-non-Pneumonia classification whereasFigure 15 shows the block diagram of the algorithm developed for the Wet/non-Wet cough sound classification. -
Figure 13 shows a sample of cough sound data with two cough events. Start and end of the cough events were manually marked after careful listening. After the manual scoring of start and end of cough events we followed the following steps to compute mathematical features from the cough event data. - [C1]. Let x[k] denotes the kth sample of the discrete time cough sound. Filter x[k] using a digital high pass filter to get y[k]. The transfer function of the filter in z-transform is given by (1).
Figure 14 shows the filter response with B=[1 -0.85] and A = [1].
- For the Wet/non-Wet cough sound classification divide y[k] into 'n' equal size segments. Let yn[k] represents the nth segment of y[k].
- For pneumonia/non-pneumonia classification this sub-segmentation is not considered.
- [C2]. Compute the following features from the filtered cough segment y[k] in case of pneumonia classification and from each filtered subsegment yn[k] in case of wet/non-wet classification.
- 1. Non-Gaussianity Score (NGS) - NGS gives the measure of non-gaussianity of a given segment of data. The normal probability plot can be utilized to obtain a visual measure of the gaussianity of a set of data. The NGS of the data segment y[k] can be calculated using (2). Note that in (2), p(k) and q(k) represents the probabilities and
p andq represents the mean of the reference normal data and the analyzed data, respectively. Detail method of computing NGS can be found in [29].
- 2. Formants frequencies - In human voice analysis formants are referred as the resonance of the human vocal tract. They are manifested as the amplitude peak in the LPC spectrum of the acoustic signal. We included the 1st four formant frequencies (F1, F2, F3, F4) in our feature set. Past studies in the speech and acoustic analysis have shown that F1-F4 corresponds to various acoustic features of upper airway [30]. We computed the F1-F4 by peak picking the LPC spectrum. For this work we used 14th order LPC spectrum and its parameters were determined via Yule-Walker autoregressive method along with the Levinson-Durbin recursive procedure [31].
- 3. Log Energy(LogE) - The log energy for segment y[k] was computed using eq. 3

- 4. Zero crossing (Zcr) - The number of zero crossings were counted for each cough event.
- 5. Kurtosis (Kurt) - The kurtosis is a measure of the peaked-ness associated with a probability distribution of cough event data y[k], computed using (4), where µ and σ in (4) are mean and standard deviation of y[k].

- 6. Mel-frequency cepstral coefficients (MFCC) - MFCCs are commonly used in the speech analysis systems [32]. They represent the short term power spectrum of an acoustic signal based on a cosine transform of a log power spectrum on a non-linear mel-scale of frequency. We included the 12 MFCC coefficients in our feature set.
- 7. Bispectrum Score (BS) - The 3rd order spectrum of the signal is known as the bispectrum. The bispectrum can be estimated via estimating the 3rd order cumulant and then taking a 2D-Fourier transform, this method, known as the indirect method of estimating the bispectrum, was followed. The 3rd order cumulant C(τ1,τ2) was estimated using (5) as defined in [33].

- By applying a bispectrum window function to the cumulant estimate, windowed cumulant function Cw(τ1,τ2) was obtained. We used the minimum bispectrum-bias supremum window described in [34] for the purpose.
- The bispectrum B(ω1,ω2) of the segment y[k] was estimated as the 2-D Fourier transform of the cumulant estimate Cw(τ1,τ2) using (6). We used FFT length of 512 points.

- In the frequency domain, a quantity P(ω;φ,ρ) can be defined for the data segment y[k] such that

- Then Bispectrum Score (BS) is computed using (8). In (8) we used ω1 = 90hz, ω2 = 5khz, ω3 = 6khz and ω4 = 10.5khz.

- 1. Non-Gaussianity Score (NGS) - NGS gives the measure of non-gaussianity of a given segment of data. The normal probability plot can be utilized to obtain a visual measure of the gaussianity of a set of data. The NGS of the data segment y[k] can be calculated using (2). Note that in (2), p(k) and q(k) represents the probabilities and
- After the feature computation, for each cough segment, in the case of the pneumonia classification we form a feature vector containing 21 features (12 from MFCC; 4 - Formant frequency; 1 each from NGS, LogE, Zcr, Kurt and Bispectrum) and in the case of wet/non-wet cough classification we get a vector containing 63 features (36 from MFCC; 12 - Formant frequency; 3 each from NGS, LogE, Zcr, Kurt and Bispectrum).
- We followed a three-step process for the pneumonia classification using cough based features, which is as follows -
-
Step 1. In the first step we classified each cough event into one of the two categories, 'Pneumonic Cough' or `non-Pneumonic Cough'. To solve this problem, we formed a feature vector for each cough event and derive a model, which can separate the cough events into two categories. Different models were derived with different feature set as shown in the Table 9.Table 9. Derived logistic-regression model for classification of cough event into categories 'Pneumonic Cough' and 'non-Pneumonic Cough'. '√' indicates the inclusion of that feature in model design. Breathing index was calculated by subtracting the breathing threshold from the recorded breathing rate. Features Models Age (in months) Presence of Fever Breathing Index Cough Feature LR-model1 √ LR-model2 √ √ LR-model3 √ √ LR-model4 √ √ √ LR-model5 √ √ √ √ Age Breathing threshold for fast breathing 1 months - 60 months 40 breaths per minute > 60 months 20 breaths per minute - For the cough classification we used Logistic Regression statistical model. It is a generalized linear model, uses several predictors (independent variables) to estimate the probability of a categorical event (dependent variable).
- In this work (pneumonia classification modelling), the dependent variable Y is assumed to be equal to "one" (Y=1) for Pneumonic Cough and "zero" (Y=0) for non-Pneumonic Cough.
- A model is derived using logistic regression function to estimate the probability Y=1 (i.e cough event belong to category of `Pneumonic Cough') given the independent variables (i.e feature set) as follows:


- In (10) β0 is called the intercept and β1, β2 and so on are called the regression coefficient of independent variables (features) x1, x2 respectively.
- Logistic regression model were designed using the MATLAB statistical toolbox version 7.5. Features were selected to include only the best independent variables (variables with low 'p' value) that facilitate the classification, in the final model. The final model is then used to estimate the probability P and each cough event is classified as belonging to either of the two categories using a probability threshold Pth .
-
Step 2. In the second step for each patient, we summed number of `Pneumonia cough' and computed an index called `Pneumonic Cough Index (PCI)' using (9).
-
Step 3. In the third step we applied a predetermined threshold PCIth (optimized for high sensitivity while keeping specificity>75%) to the PCI to classify patient into two classes, `Class I - Pneumonia' and `Class II - non-Pneumonia'. - For Wet and non-Wet cough classification we again used Logistic Regression statistical model. In this case, the dependent variable Y is assumed to be equal to "one" (Y=1) for Wet Cough and "zero" (Y=0) for non-Wet Cough.
- A model is derived using logistic regression function to estimate the probability Y=1 (i.e cough event belong to category of `Wet Cough') given the independent variables (i.e feature set) using (9) and (10).Features were then selected to include only the best independent variables (variables with low 'p' value) that facilitate the classification, in the final model. The final model is then used to estimate the probability P and each cough event is classified as belonging to either of the two categories using a probability threshold.
- Total of 541 cough events were analysed from the 81 subjects sound recording (
minimum 2, maximum 12, and on average 6.6+2.14 cough events). Out of 81 subjects, 50 were Pneumonia patients and 31 were non-pneumonia patients. Non-pneumonia patients included with diseases such as, Asthma - 11, Bronchitis - 8, Rhinopharyngitis - 6 and others (weezing, tonsilopharanzitis, heart disease, larangomalaysia, foreign body inhalation) - 6. Chest x-ray was performed on all suspected pneumonia patients. Nineteen patients on which chest x-ray was not performed, 8 were asthma, 5 Rhinopharyngitis, 2 bronhitis and 4 other disease patients. Table 10 gives the age and gender statistics of the patient database.
- Table 11 shows the contingency table for Pneumonia diagnosis using WHO criteria and Clinically diagnosed Pneumonia cases for our database of 81 subjects.
Table 11. Contingency table for pneumonia diagnosis using WHO criteria vs Clinically diagnosed Pneumonia. BPM - Breaths per minute. WHO criteria. [Cough OR Difficult Breathing & Fast breathing] Sensitivity Specificity Accuracy 92 26 66.67 Threshold for fast breathing used are Clinically Confirmed Diagnosis <2 months - 60 BPM 2 - 11 months - 50 BPM WHO Criteria 46 23 12 - 60 months - 40 4 8 > 60 months - 20 BPM - Table 12 shows the training and testing classification results in separating cough events into two categories using designed 4 logistic regression models given in table 9.
Table 12. Classification results for cough events into two categories ('Pneumonic cough' and non-Pneumonic cough') using different Logistic Regression models as shown in table 3, following the method given in section 2. D Step 1. Selected cough features used to develop the model were BSG, FF1, FF2, FF4, ZCR, MFCC3 and MFCC6.Features Models Training Dataset (374±9 cough events from 56 subjects) Testing Dataset (166±9 cough events from 25 Subjects) Sensitivity Specificity Accuracy Sensitivity Specificity Accuracy LR-model1 68.84±2.4 69.12±2.4 68.94±2.4 65.2±8 64.5±9 65±5 LR-model2 78.7±2.4 79±2.4 79±2.4 73.8±10 75.5±10.4 74.3±5.5 LR-model3 77.9±2.9 78±2.9 78±2.9 75.4±9 72.6±12 74.4±5.7 LR-model4 87.1±2 87.4±2 87.2±2 83.5±8.5 80.5±10 82.3±5 LR- model5 90±2.6 90.1±2.6 90±2.6 85.6±8 80.1±12 83.5±5 - Table 13 gives the pneumonia classification results using Pneumonic Cough Index. According to table 12, LR-Model5 gives the best classification results for cough events classification (mean sensitivity and specificity were 85.6±8% and 80.1±12% respectively). However in the pneumonia classification task LR-Model4 performed better than LR-Model5. It achieved the mean sensitivity and specificity of 86.2±9.6 and 84.3±15 respectively.
Table 13. Results for Pneumonic Cough Index based pneumonia diagnosis after only selected cough features were used in the model training. Cough Features selected were BI, FF1, FF2, Zcr, MFCC coefficients Features Models Training Dataset (56 Subjects) Testing Dataset (25 Subjects) PCIth Sensitivity Specificity Accuracy Sensitivity Specificity Accuracy LR-model1 0.4 83.3±4 65.8±6 76.7±4 76.9±12 60.5±16 70.6±8.3 LR-model2 0.38 84±3.2 81±4 83±3 80.8±11.5 78.5±12 79.7±7.6 LR-model3 0.4 87±3.7 77±4.8 83.4±3 84.5±9 70.8±16 79±7.5 LR-model4 0.4 90±3 91.5±4 90.7±2.9 86.2±9.6 84.3±15 85.2±7 LR-model5 0.4 92.3±2.8 88±4 90.6±2.9 87.4±8.8 77.9±14 83.6±6.3 - Total of 178 cough events from 46 subjects were analyzed. The male to female ratio of the subjects in database was 1:1. The mean age of the subjects was 3 years and 1 month. A pediatrician, with clinical and research experience of more than 20 years in the field of childhood illness with specialty in chronic cough, asthma, and other respiratory diseases, manually classified 178 cough events into Wet and non-Wet after careful listening. We consider this manual classification as the 'reference standard' against which results of automatic classification by designed LR model were compared.
- Out of 178 cough events 82 were Wet and 96 were, as classified by reference standard. We used 70% (124 cough events) of the cough events for training and 30% (54 cough events) for testing the model. Training and testing cough events were randomly chosen using a random number generator. To validate the model, we generated 200 different training and testing dataset from the 178 cough events.
- The mean sensitivity and specificity for Wet/non-wet classification using LR-model was 74.8±9% and 69.9±9.4% respectively for testing datasets, when all the cough features were used to train the model. Mean sensitivity and specificity values jumped to 79±9% and 72.7±8.7% when only selected cough features were used. In all 22 features were selected out of 63 after the feature optimization. The selected features were 1 each from BSG, LogE and Kurt; 2 from NGS; 3 from ZCR; 5 from formant frequency; and 9 from MFCC.
- Table 14 shows the mean sensitivity, specificity, accuracy and kappa results for training and testing datasets.
- The kappa agreement between the LR-model and reference method was 0.45±0.12 when all the cough features were used and 0.52±0.1 when only selected cough features were used.
TABLE 14 MEAN ± STD VALUES FOR SENSITIVITY, SPECIFICITY, ACCURACY AND KAPPA, FOR 200 DESIGNED LR MODELS 200 Datasets Using all the cough features Using selected cough features Training Testing Training Testing Sensitivity 100±0.1 74.8+9 95.93±2 79±9 Specificity 100±0 69.9±9.4 83.4±4 72.7±8.7 Accuracy 100±0.1 72.6±6.1 88.7+2.7 76.1±5.5 Kappa 1±0 0.45±0.12 0.77+0.05 0.52±0.1 -
Figure 16 shows the histogram plots for the sensitivity and specificity obtained using 200 training and testing datasets. - Table 15 shows the contingency table for the best LR-model among 200. It has the sensitivity of 90%, specificity of 80% and a high kappa agreement of 0.71.

- A second pneumonia diagnosis method will now be described.
- The overall approach of the method is summarised in
Fig. 17 . The method consists of three main stages: the acquisition of data from subjects, the development of features and the training of pattern classifiers, and, the prospective validation and performance evaluation of the technology. In Section 2A-2C we provide details of these steps. - The clinical data acquisition environment for this work is Respiratory Medicine Unit of the Sardjito Hospital, Gadjah Mada University, Indonesia. Table 16 lists the inclusion and exclusion criteria of subjects.
Table 16 Inclusion Criteria Exclusion Criteria Patients with symptoms of chest - Advanced disease where recovery is not expected eg terminal lung cancer Infection : At least 2 of -Cough -Sputum - Droplet precautions -Increased breathlessness - NIV required -Temperature >37.5° - No Consent Consent - Patients suspected of acute respiratory illness such as pneumonia, bronchiolitis, bronchitis, asthma, rhinopharyngitis etc. were recruited for the study. An informed consent was made using form approved by the human ethics committees of Gadjah Mada University and The University of Queensland. Patients were recruited within the first 12 hours of their admission.
- A paediatric clinician assessed the patient for the presented symptoms. All the observations such as the presence of cough, runny nose, fever, breathing difficulty, diarrhoea etc. were documented in a standard sheet. The database also contained routine demographic information and the results of clinical (eg. chest auscultation, breathing rate, oxymetry, temperature) as well as laboratory (eg: blood, sputum analysis) investigations. The reference standard used for Pneumonia diagnosis in this discussion is the overall diagnosis provided by physicians, on the basis of clinical presentation, laboratory tests, chest X-ray and the clinical course of the disease. In order to minimize the radiation exposure to children, X-ray was performed only on subjects clinically suspected of pneumonia, or if there was a clear clinical need for it. Thus, not all subjects in our database had undergone X-ray imaging.
- After the initial medical assessment, sound recordings were made in the natural environment of the respiratory ward. We collected sound data records of 6-8hr durations from each patient, using bedside microphones (Rode® NT7 or Olympus® LS11, 44.1kHz sampling rate). The distance from the mouth to the microphone could vary between 40cm to 70cm depending on the position of the patient's head. The inventors' objective has been to develop technology that is robust against intensity variations, such that the distance from the mouth to the recording device does not play any significant role in the diagnosis.
- We used a total of 91 patients (63 pneumonia and 28 non-pneumonia subjects) to develop and validate our technology. Diseases such as bronchiolitis, asthma, bronchitis, pharyngitis, laryngomalacia are lumped within the non-pneumonia group. Details of the subjects are given in
Fig. 18 . The overall dataset at our disposal was separated into two non-overlapping groups: the Model Development Dataset (Dmd) and the Prospective Validation Dataset (Dpv). These two datasets were completely independent of each other. The sets Dmd and Dpv did not share either coughs or any subjects. Patients were assigned to each group based on the order of presentation to the respiratory clinic of the hospital. Dmd and Dpv consisted of Nnd =66 and Npv=25 subjects respectively. - Sound data from each subject consisted of about 6-8hrs or continuous recordings. Cough sounds were manually segmented after a careful listening process. There is no accepted method for automatic identification of coughs and the manual analysis is still used as the gold standard in clinical work as well as in research literature.
Fig. 19 shows typical examples of (a)pneumonia-cough, (c)asthma-cough, (e)bronchitis-cough and (g)bronchiolitis-cough waveforms and their corresponding power spectrogram. A clear characteristic difference between the pneumonia-cough and other-coughs in duration and power spectrogram magnitude can be seen. - We used the Model Development Dataset Dmd for the work described in this section. Let Cmd be the total number of coughs events from the subjects in Dmd. The approach taken in here uses a leave-one-out model building and validation process to develop features and optimize model parameters. Within this framework, our method can be described in four major processing steps (see
Fig. 17 ), Step-1 to Step-4 as described below. - In the first step we compute a feature matrix. In the second step we design automatic classifiers using the feature matrix from
step 1 to classify cough sounds into `pneumonic cough' and `non-pneumonic cough' classes. In the third step we select an optimal classifier and in the fourth step we define a new index called Pneumonic Cough Index (PCI) to identify patients with pneumonia. - In this step, our first target is to extract features from cough sounds to be used in the pneumonia diagnosis algorithm. Mathematical features from each cough event in Dmd were computed as follows :
- [1]. Let x denotes a discrete time sound signal from an arbitrary cough event.
- [2]. Segment x into `n=3' equal size non-overlapping sub-segments. In the literature19, clinicians and scientist alike have described cough sounds consisting of 3 phases, (i) initial opening burst, (ii) followed by noisy airflow and last (iii) glottal closure. It has been shown that these phases carry different significant information specific to quality of cough. On this basis we divided each cough segments into n=3 sub-segments. Let xi represents the ith sub-segment of x, where i = 1, 2, 3, ...., n.
- [3]. For each of the sub-segments xi compute the following features: Bispectrum Score (BGS), Non-Gaussianity score (NGS), the first four formant frequencies (FF), log energy (LogE), zero crossing (ZCR), kurtosis (Kurt), and twelve Mel-frequency cepstral coefficients (MFCC). Note that we do not make use of the 0th coefficient of MFCC, which represents energy in the signal xi.
- [4]. Repeat steps (i) - (iii) for all Cmd cough events in Dmd.
- This process leads to a candidate cough feature matrix Mc of the size Cmd × Cf for each sub-segment xi. Where Cf = 63 represents cough based features and Cmd is the total cough events in database Dmd.
- In the simplest form of the diagnostic algorithm, we will only be using cough-based features to diagnose pneumonia. However, we recognize the existence of some simple clinical measurements that can be used to improve our algorithms at minimal cost in complexity. The WHO algorithm for resource-poor areas, Table 17, uses the age and breathing rates, and other researchers have used the existence of fever.
Table 17 Screening in criteria Cough or difficult breathing Criterion for Pneumonia Cough and fast breathing. Threshold for fast breathing depends on the child's age. 2-11 months - 50 Breaths Per Minute 12 - 60 months - 40 Breaths Per Minute Criterion for Severe Pneumonia or Very Severe Pneumonia Cough and fast breathing with general danger signs such as • Lower chest wall indrawing • Stridor in calm child - While none of these alone or in combination have yielded the desired diagnostic performance in remote areas, these measurements have the potential to augment cough-derived features. Inspired by the WHO algorithm that uses age as one of the parameters, we used age in months as a candidate parameter in our models. We also used the presence or absence of fever as a binary variable. In the WHO algorithm, breathing rate is used as the prime parameter in diagnosing pneumonia. In our work, we propose a new measure (see (1)), which we call the Breathing Index (BrI), to capture breathing rate elevations in pneumonia.

- In (1) BR is breathing rate and Age is age of the patient in months. While fever is a common symptom of pneumonia, it is not specific to pneumonia. A similar observation holds for the breathing rate. Table 18 shows the candidate feature set Fc={Cf, f 1, f2, ...f f}, where Cf represents cough-derived features and the rest denotes augmented features used in our models.
Table 18 - Six different combinations of features used to form feature matrix in section 2-B [Step 1]. Here a tick indicates the inclusion of that feature in the model design. Breathing index was calculated by subtracting the breathing threshold from the recorded breathing rate. Features Combination Age (in months) Presence of Fever Breathing Index Cough Feature (#66) F1 (All cough Features, Cf) ✔ F2 (Cf+ BrI) ✔ ✔ F3 (Cf+ Fever) ✔ ✔ F4 (Cf+ Age) ✔ ✔ F5 (Cf+ Fever + BrI) ✔ ✔ ✔ F6 (Cf+ Age + Fever + BrI) ✔ ✔ ✔ ✔ - The final features in our algorithms will be drawn from the group of candidate features. Details of the feature selection, model development and validation will be described in Step-2 below.
- [Step 2] Feature Selection and Automatic classifier design - The inventors used Logistic-regression model (LRM) as the preferred pattern classifier however those skilled in the art will appreciate that other classifier methods are also applicable. LRM is a generalized linear model, which uses several independent features to estimate the probability of a categorical event (dependent variable). In this work, the dependent variable Y is assumed to be equal to "one" (Y=1) for pneumonic cough and "zero" (Y=0) for non-pneumonic cough. Cough events drawn from a subject with a diagnostic classification of pneumonia are labelled pneumonic coughs and vice versa. A model is derived using a regression function to estimate the probability Y given the independent cough features (i.e. Fc={Cf, f 1, f 2, ....f f }) as follows:


- In (2) and (3) f1, f2,...fF are the elements of feature vector Fc (independent variables), β0 is called the intercept and β1, β2 and so on are called the regression coefficient of independent variables. To select the optimal decision threshold λ from Y (that the cough is pneumonic if Y is above λ otherwise non-pneumonic) we used the Receiver-Operating Curve (ROC) analysis.
- We used a leave-1-out cross validation (LOV) technique for the LRM design. As the name suggests, LOV technique involves using data from all the patients except one to train the model and cough events from one patient to validate the model. This process was systematically repeated such that each patient in Dmd was used as the validation data exactly one time. At the end of this process, we end up in Nmd different LRM models. To evaluate the performance of the designed Nmd LRMs, performance measures such as Sensitivity, Specificity, Accuracy, Positive Predicted Value (PPV), Negative Predicted Value (NPV), Cohen's Kappa (K) statistic were computed.
- (i) Feature Selection: Feature selection is a technique of selecting a sub-set of relevant features for building a robust learning model. Theoretically, optimal feature selection requires exhaustive search of all possible subsets of features. However, to do so for large number of features it will be computationally intensive and impractical. Therefore we searched for satisfactory set of features using p-value. In LRM design a p-value is computed for each feature and it indicates how significantly that feature contributed in the development of the model. Important features have low p-value. We used this property of LRM to select a reasonable combination of features (independent variables with low p-value) that facilitate the classification, in the model during the training phase. Compute mean p-value for Fc features over Nmd LRMs. Select the features with mean p-value less than a threshold value given by pths. Let Cf s be the sub-set of selected cough features from Cf and Fc s be the candidate features set formed by augmenting features with selected cough features.
- (ii) Robust LRM design: Once the subset Fc s is known, we use those features and build a new set of LRMs once again following another leave-one-out validations process. At the end of this process, we have Nmd number of LRMs using Fc s as the input feature set.
- [Step 3] Selecting a good model from Nmd LRMs - From the candidate LRMs that use the selected features Fc s as the input features, we selected one model as the best based on the k-mean clustering algorithm. In the k-mean clustering algorithm, target is to divide q data points in d-dimensional space into k clusters, so that within the cluster sum of squared distance from the centroid is minimized. Problem in our hand is to select a good model from the Nmd models available to us. To do so we divided Nmd models in d-dimensional space into k=2 clusters, i.e. high performance model cluster and low-performance model cluster. We set space dimension d equal to model parameters plus three performance measures (sensitivity, specificity and kappa). Then from the cluster of the high performance models, we selected that model which had the lowest mean square error value with respect to the centroid. Let


- Once


- [Step 4] Pneumonic Cough Index - In this step, for each Nmd = 66 patient in the Dmd we compute a Pneumonic Cough Index (PCI) using the below definition.
- Definition of Pneumonic Cough Index (PCI): Let 'P' be the total number of coughs recorded and analysed from a patient. And let 'Q' out of 'P' coughs are classified as pneumonic cough using selected LRM

step 3. Then the PCI index for the patient is computed as
- Then using the ROC analysis we computed a threshold PCIth (optimized for high sensitivity while keeping acceptable specificity) to classify patient into two classes, 'Pneumonia' and `non-Pneumonia'.
F. Testing of selected LRM
- Following the procedure described in section 2-B [Step 1] and using the cough events sound data from Npv = 25 patients in dataset Dpv, compute the cough event feature matrix Mc Dpv of size Cpv × Cf. Cpv is total cough events in Dpv and Cf = 63 represents cough based features. Form Mc Dpv from Mfc sDpv by augmenting clinical features with selected cough features Cf s. Use selected LRM

- Compare the results of automatic classification by PCI with that of attending clinician and compute the performance measures.
- Sound recordings from N = 91 patients (48 males and 43 females) were used. The mean age of the subjects was 3 years and 1 month (
standard deviation 3 years and 11 months). The age range of the subjects varied from 1 month to 15 years. Of the 91 subjects, 63 were Pneumonia patients and 28 were non-pneumonia patients. Non-pneumonia patients had diseases such as Asthma, Bronchitis, Rhinopharyngitis and others (wheezing, tonsilopharyngitis, heart disease, foreign body inhalation). Chest X ray (CXR) was performed on 65 patients to confirm the diagnosis. Of the 26 patients on whom CXR was not done, eight had been clinically diagnosed as pneumonic and 17 as non-pneumonia patients.Fig. 18 gives the distribution of age and disease categories in the database. -
Figure 4 shows a typical example of pneumonia-cough, asthma-cough, bronchitis-cough and bronchiolitis-cough waveforms and their corresponding power spectrogram. We can see a clear characteristic difference between the pneumonia-cough and other-coughs in duration and power spectrogram magnitude. The pneumonia-cough is of short duration with widely spread power spectrum up-to 20 kHz. On the contrary other coughs are of long duration with power spectrum up-to 15 kHz. The mean duration of pneumonia-cough (0.26±0.7s using n = 401 coughs) was significantly less (2-tailed t-test, ρ<0.005, t=-8.6786) than that of other cough (0.32±0.08s using n = 198 coughs). The cough sound waveforms were generally clean with high signal-to-noise-ratio (SNR). The mean SNR for the Dmd was 15.8±5.6 db (maximum = 28.05db and minimum = 2.08 db) and that for Dpv was 16.7±5 db (maximum = 26.7 db and minimum = 7.9 db). -
Table 19 shows the contingency table for Pneumonia diagnosis using WHO criteria and clinically diagnosed Pneumonia. WHO Criteria [Cough and/or breathing difficulty] Sensitivity Specificity Accuracy 86% 22% Threshold for fast breathing used are <2 months - 60 BPM 2-11 months - 50 BPM 12 - 60 months - 40 > 60 months - 20 BPM - WHO guidelines for pneumonia diagnosis in community settings are designed for children with age group of 2 months to 5 years18. "Infants less than 2 months with signs of pneumonia are referred promptly to the nearest health facility because they are at high risk of suffering severe illness or death" 18. Therefore table 19 is generated using #68 subjects in our database, which falls in the
age range 2 months to 5 years. WHO criteria achieved a high sensitivity of 83% in picking clinically confirmed pneumonia cases, however presented with a poor specificity of 47%. - From N=91 patients a total of C=599 cough events were analysed. On the average 6.6+2 cough events per patients were analysed (minimum = 2 and maximum = 12 per each patient). In section 2-A, we divided N=91 patients into two datasets Dmd (Training/Validation dataset) and Dpv (Prospective study dataset). Dmd has data from Nmd = 66 patients with Cmd = 440 cough events (average = 6.7±2, minimum = 2, maximum = 12). Dpv has data from Npv = 25 patients with Cpv = 159 cough events (average = 6.4±1, minimum = 5, maximum = 10).
- Feature Matrix: Following the method given in section 2-B [Step 1] we computed feature matrix Mc. We used n=3 to divide each cough segment into 3 sub-segments. Setting n=3 gave 63 mathematical features from each cough event, consisting of (36 MFCC) + (12 FF) + (3 each of BSG, NGS, LogE, ZCR and Kurt). Augmenting clinical features with cough features 6 cough event feature matrix Mfc were created. Following LOV technique Nmd = 66 LRMs were designed (since Nmd = 66 patients in Dmd). Pneumonic Cough Classification using LRM before feature selection: For F1 feature combination (only mathematical features of cough), the mean training sensitivity and specificity over 66 LRMs in classifying cough events into Pneumonic and non-pneumonic cough classes were 81±1%. Validation sensitivity and specificity were 63% and 52% respectively. When BrI was included as feature, sensitivity and specificity of validation set jumped to 71% and 55% respectively. And when all the features, Age, presence of fever and BrI were included in train LRM along with mathematical features of cough, sensitivity and specificity further increased to 73% and 62% respective. Table 20 gives the performance of the model in classifying cough events into Pneumonic and non-pneumonic cough classes using different combination of features.
Table 20 - Performance of the LRM models in classifying cough events into 'pneumonic cough' and 'non-pneumonic cough' classes on training/validation dataset Dmd when all the features were used to train the model. Fc represents the different feature combination. Fc Training Validation Sens Spec Acc PPV NPV K Sens Spec Acc PPV NPV K F1 (All cough Features, Cf) 81±1 % 81±1% 81± 1% 90±1% 68±1% 0.59±0.01 63% 52% 59% 73% 40% 0.13 F2 (Cf+ BrI) 85± 1 % 85±1% 85± 1% 92±1% 73±2% 0.67±0.02 71% 55% 66% 77% 48% 0.26 F3 (Cf+ Fever) 83± 1 % 83±1% 83 1% 91±1% 70±2% 0.62±0.01 68% 54% 63% 75% 45% 0.20 F4 (Cf+ Age) 85± 1 % 85±1% 85± 1% 92±1% 73±1% 0.68±0.02 70% 56% 65% 77% 47% 0.24 F5 (Cf+ Fever + BrI) 87± 1 % 87±1% 87± 1% 93±1% 76±1% 0.71±0.02 70% 59% 67% 78% 49% 0.28 F6 (Cf+ Age + Fever + BrI) 91± 1 % 92±1% 91± 1% 96±1% 83±2% 0.8±0.02 73% 62% 70% 80% 53% 0.34 - Pneumonic Cough Classification using LRM after feature selection: Following the procedure described in section 2-B [Step-2] and using p-value, we selected features for each of Fc s. Table 6 gives the details of the cough features selected and the pths used for selection.
Table 21 - 30 cough features were selected from Cf = 63 features after the feature selection step. Pths used Features selected BSG NGS FF LogE Kurt ZCR MFCC 0.23 2 1 3 2 0 3 19 - Table 22 gives the performance of the model after feature selection in classifying cough events into Pneumonic and non-pneumonic cough classes.
Table 22 - Performance of the LRM models in classifying cough events into `pneumonic cough' and `non-pneumonic cough' classes on training/validation dataset Dmd when selected features were used to train the model. FC s Training Validation Sens Spec Acc PPV NPV K Sens Spec Acc PPV NPV K F1 s (Cf S) 79± 1% 79± 1% 79± 1% 89± 1% 64± 1% 0.54± 0.01 69% 64% 68% 80% 50% 0.31 F2 s (Cf S + BrI) 82± 1% 83± 1% 83± 1% 91± 1% 70± 1% 0.60± 0.02 72% 69% 71% 83% 54% 0.39 F3 s (Cf S+ Fever) 82± 1% 82± 1% 82± 1% 91± 1% 69± 1% 0.61± 0.02 72% 60% 68% 79% 51% 0.31 F4 s (Cf S+ Age) 82± 1% 82± 1% 82± 1% 91± 1% 69± 1% 0.71±0.02 71% 67% 70% 82% 53% 0.36 F5 s (Cf S+ BrI+ Fever) 86± 1% 87± 1% 86± 1% 93± 1% 75± 1% 0.70± 0.01 77% 74% 76% 86% 60% 0.49 F6 s (Cf S+ BrI+ Age + Fever) 89± 1% 89± 1% 89± 1% 94± 1% 79± 1% 0.75± 0.01 80% 73% 78% 86% 63% 0.51 - According to Table 22 we see a general improvement in model performance after the feature selection for all Fc. The validation sensitivity and specificity for F1s, where only mathematical feature from cough events were used to train the model, increased to 69% and 64% respectively with K = 0.31. Best sensitivity and specificity of 80% and 73% respectively were achieved for F6 s.
- PCI based classification: From


Selected LRM model Dataset Dmd PCIths Sens Spec Acc PPV NPV K 
0.5 93% 90.5% 92% 95% 86% 0.83 
0.5 93% 90.5% 92% 95% 86% 0.83 
0.5 91% 86% 89% 93% 82% 0.76 
0.5 91% 91% 91% 95% 83% 0.80 
0.5 93% 90.5% 92% 95.5% 86% 0.83 
0.67 91% 90.5% 91% 95% 83% 0.8 - Table 23 - Performance of the selected LRM

- All the feature combinations achieved a sensitivity and specificity greater than 90% except for F3 s which registered a slightly lower specificity of 86% . F1 s which uses only cough features has the sensitivity of 93% and specificity 90.5% with K=0.83.
- The model


Selected LRM model Dataset Dpv Sens Spec Acc PPV NPV K 
83% 58% 74% 79% 64% 0.42 
82% 60% 74% 80% 64% 0.42 
82% 78% 81% 88% 69% 0.58 
84% 75% 81% 86% 71% 0.57 
82% 69% 77% 83% 67% 0.50 
88% 85% 87% 92% 78% 0.71 - Table 24 - Performance of the selected LRM

- Table 25 shows the performance of model in classifying patients into pneumonia and non-pneumonia.
Selected LRM model Prospective Dataset Dpv Sens Spec Acc PPV NPV K 
94% 75% 88% 89% 86% 0.72 
82% 63% 76% 82% 63% 0.45 
94% 87.5% 92% 94% 88% 0.82 
94% 75% 88% 89% 86% 0.72 
88% 75% 84% 88% 75% 0.63 
82% 100% 88% 100% 73% 0.75 - Table 25 - Performance of the selected LRM

- For cough classification, model


- The preceding has provided an automated procedure to diagnose pneumonia using cough sounds. The method is based on initially classifying individual cough events into `pneumonic cough' and 'non-pneumonic cough' classes and then calculating a Pneumoic Cough Index (PCI) over all the cough events recorded. Working on 599 cough events from 91 pediatric patients diagnosed with a range of respiratory diseases, we showed the method is capable of classifying pneumonia at a sensitivity >90% while holding the specificity at >85%.
- As far as the inventors are aware this is the first attempt in the world to develop an objective model for the penumonia diagnosis centred about cough sounds. The results indicate the feasibility of taking a cough-centred approach in diagnosing pneumonia in resourse-poor regions. Furthermore, using features derived from cough only we obtained a sensitivity >90% at a specificity of 75%. Cough can be recorded with noncontact instrumentation, and our algorithms can be implemented on ubiquitious platforms such as smart phones in a form ready to be used by a minimally trained person. The device will not require physical contact with the subject, making sterilization easy and requiring minimal operator training for field use. The technology, in the simplest version, will require between 5-10 cough sounds and will automatically and immediately provide a diagnosis. Such a system is expected to be a paradigm shifting novelty in the field of pneumonia diagnosis in remote regions.
- The simplicity of proposed technology and potential low cost implementation on ubiquitous devices make our approach valuable in long term monitoring. It also will have substantial strategic value in developing new vaccines as well management strategies for childhood pneumonia. Clinical trials of new pneumonia vaccines conducted in resource-limited regions of the world require reliable tools to measure the efficacy of intervention. The same is true for assessing the effectiveness of any new pneumonia management strategy targeting large populations. There are no field deployable gold standards to diagnose pneumonia, especially the early stage (non-severe) disease where even chest X-rays fail4. The existing WHO algorithm is limited due to its low diagnostic performance. While the algorithm serves a very useful role in picking up potential cases of pneumonia, the cost of doing so, the low specificity, makes it difficult to use in assessing the validity of a new intervention.
-
Figure 20 shows the block diagram of the automated cough classification process using logistic regression. It is divided into four stages, (A) data acquisition process (B) creating a cough sound database and classification into wet/dry classes by expert scorer (C) designing of automatic classifier (D) testing of classifier on prospective cough sound dataset. In Section II-A to Section II-D we describe details of the method. - The clinical data acquisition environment for this work is Respiratory Medicine Unit of the Sardjito Hospital, Gadjah Mada University, Indonesia. Table 26 lists the inclusion and exclusion criteria of subjects.
Table 26 - Inclusion and Exclusion Criteria for Subjects Inclusion Criteria Exclusion Criteria - Patients with symptoms of chest - Advanced disease where infection : At least 2 of recovery is not expected eg - Cough terminal lung cancer - Sputum - Droplet precautions -Increased breathlessness - NIV required -Temperature >37.5° - No Consent -Consent - All patients fulfilling the inclusion criteria were approached. An informed consent was made using form approved by the human ethics committees of Gadjah Mada University and The University of Queensland. Patients were recruited within the first 12 hours of their admission. After the initial medical assessment sound recordings were made for next 4-6 hours in the natural environment of the respiratory ward.
- Sound recordings were made using two systems,
- 1. Computerized data acquisition system - A high fidelity system with a professional quality pre-amplifier and A/D converter unit, (Model Mobile-Pre USB, M-Audio, California, USA) and a matched pair of low-noise microphones having a hypercardiod beam pattern (Model NT3, RODE, Sydney, Australia). Adobe
audition software version 2 was used to record the sound data on to the laptop computer. - SeeFigure 1 for an illustration of this type of arrangement. - 2. Portable recording system - A high-end, light-weight portable, 2-AA battery powered audio recorder (Olympus LS-11) with two precision condenser microphones.
- In both sound recording systems we used a sampling rate of 44.1 khz with a 16 bit resolution (CD-quality recording). The nominal distance from the microphone to the mouth of the patient was 50 cm, but could vary from 40 cm to 70 cm due to patient movements. For each patient, we also received the final diagnosis as well as all the laboratory and clinical examination results.
- Let N be the number of patients whose sound recording is used and C be total number of cough events from N patients. These C cough events were manually segmented after screening though 6-8 hours of the sound data of each patient. There is no accepted method for automatic marking of start and end of a cough event. Manual marking is still considered the gold standard. After careful listening start and end of all cough events were manually marked.
- We divided N patients with C cough events into two datasets, (i) DS1 (model design dataset) and (ii) DS2 (prospective study dataset). The patients were divided into DS1 and DS2 based on the order of presentation to the respiratory clinic of the hospital. Patients in datasets DS1 and DS2 were mutually exclusive.
- (i) DS1 - consisted of C1 cough events from N1 patients. Cough events from this dataset were used to design the optimal model.
- (ii) DS2 - consisted of C2 cough events from N2 patients. Cough events from this dataset were used to test the designed model. Cough events from DS2 were blind to the process of model design.
- Two expert scorers having experience of 15-20 years in pediatric respiratory diseases then scored cough events from two datasets into two classes, wet or dry. Scorers were blinded to the subject's history and diagnosis. This manual classification is considered as the reference standard against which results of automatic classification are compared.
- To design a system for automatic classification of cough sounds we used cough events from DS1. Let DS11 be the subset of DS1 containing those cough events on which both scorers agreed on the class of cough sounds. We had C11 cough events in DS11. Use cough events in DS11 to design automatic classifier model. This is a three step process.
- [Step 1] Cough event Feature matrix computation: In this step, feature vector containing 'F' mathematical features is computed from each of C11 cough events and a cough event feature matrix 'MDS11' of size, C11 × F was formed. To compute 'F' features from a cough event use below steps.
- (i) Let x denotes a discrete time sound signal from a cough event.
- (ii) Normalize x by dividing it by absolute maximum value.
- (iii) Segment x into 'n' equal size non-overlapping sub-segments. Let xi represents the ith sub-segment of x, where i = 1, 2, 3,...., n.
- (iv) Compute following features for each sub-segment and form feature vector containing F features: Bispectrum Score (BGS), Non-gaussianity score (NGS), formant frequencies (FF), Pitch (P), log energy (LogE), zero crossing (ZCR), kurtosis (Kurt), and twelve mel-frequency cepstral coefficients (MFCC).
- (v) Repeat steps (i) - (iii) for all C11 cough events and form cough event feature matrix MDS11 of size C11 × F.
- [Step 2] Automatic classifier design: We used a Logistic-regression model (LRM) as the pattern classifier. LRM is a generalized linear model, which uses several independent predictors to estimate the probability of a categorical event (dependent variable). In this work, the dependent variable Y is assumed to be equal to "one" (Y=1) for wet cough and "zero" (Y=0) for dry cough. A model is derived using regression function to estimate the probability Y=1 (i.e cough event belong to category of `wet cough') given the independent variables (i.e F features) as follows:


- In (1) and (2) f1, f2,...fF are the elements of feature vector (independent variables), β0 is called the intercept and β1, β2 and so on are called the regression coefficient of independent variables. To select the optimal decision threshold λ from Y (that the cough is wet if Y is above λ otherwise dry) we used the Receiver-Operating Curve (ROC) analysis.
- Use data in matrix MDS11 (C11 observations from F independent variables) and adopt leave-1-out cross validation (LOV) technique for LRM design. As the name suggests, LOV technique involves using data from all cough events except one to train the model and one cough event to validate the model. This process was systematically repeated C11 times such that each cough event in DS11 was used as the validation data once. This resulted in LC11 number of LRMs.
- To evaluate the performance of the designed LC11, performance measures such as Sensitivity, Specificity, Accuracy, Positive Predicted Value (PPV), Negative Predicted Value (NPV), Cohen's Kappa (K) statistic were computed. Please see appendix A2 on how to interpret K values.
- Design logistic regression model (LRM) for
- (i) Feature Selection: Feature selection is a technique of selecting a sub-set of relevant features for building a robust learning model. Theoretically, optimal feature selection requires exhaustive search of all possible subsets of features. However, to do so for large number of features it will be computationally intensive and impractical. Therefore we searched for satisfactory set of features using p-value. In LRM design a p-value is computed for each feature and it indicates how significantly that feature contributed in development of the model. Important features have low p-value. We used this property of LRM to select a reasonable combination of features (independent variables with low p-value) that facilitate the classification, in the model during the training phase. Compute mean p-value for 'F' features over C11 LRMs. Select the features with mean p-value less than pths. Let Fs be the sub-set of selected features from F.
- (ii) Robust LRM design: Create a matrix M'DS11 of size C11 × Fs from MDS11. Matrix M'DS11 is a cough event feature matrix with only selected features Fs from C11 cough events in DS11. Using M'DS11 and adopting LOV, retrain C11 LRMs.
- [Step 3] Selecting a good model from LC11 LRMs: From LC11 LRMs we selected one model as the best, using the k-mean clustering algorithm 9 to test on prospective study dataset DS2. In the k-mean clustering algorithm, target is to divide q data points in d-dimensional space into k clusters, so that within the cluster sum of squared distance from the centroid is minimized.
- Problem in our hand is to select a good model from the LC11 models available to us. To do so we divided LC11 models in d-dimensional space into k=2 clusters, i.e. high performance model cluster and low-performance model cluster. We set space dimension d equal to model parameters plus three performance measures (sensitivity, specificity and kappa). Then from the cluster of the high performance models, we selected that model which had the lowest mean square error value with respect to the centroid. Letrepresent the selected LRM and

 is chosen, we fix all the parameters of the model and use it for classifying cough sounds in the prospective dataset DS2.
D. Testing of selected LRM
- Following the procedure described in section C [Step 1] and using the cough events from dataset DS2, compute the cough event feature matrix MDS2 of size C2 × F. C2 is total cough events in DS2 and 'F' is feature vector. Form M'DS2 from MDS2 by selecting only robust Fs features. Use selected LRMto classify data in M'DS2 into classes wet or dry. Decision process of wet/dry class from the output of
 is as follows: Let the output of the 91 to a given cough input is


- Compare the results of automatic classification bywith that of expert scorers and compute the performance measures described in section C [Step 2]. All the algorithms were developed using software programming language MATLAB version 7.14.0.739 (R2012a).

- The inventors used sound recording data from N=78 patients (41 were male and 37 were female). The mean age of the subjects was 2 years and 11 month. The age range of the subjects varied from 1 month to 15 years and having diseases such as asthma, pneumonia, bronchitis and rhinopharyngitis. Table 27 gives the demographic and clinical details of the patients.
Table 27 - Demographic and Clinical Details of the Subject GENDER Male 41 Female 37 AGE Neonatal 2 < 12 months 31 < 60 months 29 >= 60 months 16 DIAGNOSIS Pneumonia 34 Pneumonia + other 21 Bronchitis 8 Asthma 3 Rhinopharyngitis 5 Asthma + Rhinopharyngitis 1 Others 6 - From N=78 patients a total of C=536 cough events were analyzed. On the average 7 cough events per patients were analyzed (minimum = 2 and maximum = 13). Dataset DS1 has C1=385 cough events from N1=60 patients and dataset DS2 has C2=151 cough events from N2=18 patients.
- Table 28 shows the contingency table between two scorers in classifying cough sounds from DS1 and DS2, into two classes wet and dry.

- In DS1 out of 385 cough events, scorers agreed C11=310 times (80.5%) on the classes of cough events which were used to form subset DS11. In dataset DS2 they agreed 117 times out of 151 (77.5%). The kappa agreement between
Scorer 1 andScorer 2 is 0.55 for DS1 and 0.54 for DS2. Of the 310 cough events in DS11, 82 belonged to wet class and 228 belonged to dry class. The DS11 cough events were then used to design LRM models described in section II-C. - The mean duration of dry cough in DS11 was 260±77 ms (computed using 228 dry coughs) and that of wet cough was 238±54 ms (computed using 82 wet coughs).
Figure 21 shows a typical example of dry cough waveform and wet cough waveform from two patients, ids #35 & #38 respectively. The cough sound waveforms were generally clean with high signal-to-noise-ratio (SNR). The mean signal to noise ratio for the DS11 was 15.2±5.5 db (maximum = 28.65db and minimum = 2.9 db) and that for DS2 was 18.6±4.5 db (maximum = 27.8 db and minimum = 11.1 db).Figures 23A and 22B are histograms of SNR for the cough sound in DS11 and DS2. - Start and end of each coughs were carefully marked by a human operator after listening to cough sounds as shown in the
Fig.21 . Following the method given in section II-C-[Step 1] we computed feature matrix MDS11. We used n=3 to divide each cough segment into 3 sub-segments. In the literature, clinicians and scientist alike have described cough sounds consisting of 3 phases, (i) initial opening burst, (ii) followed by noisy airflow and last (3) glottal closure24,25. It has been shown that these phases carry different significant information specific to quality of cough, wet or dry. On this basis we divided each cough segments into 3 sub-segments. Setting n=3 led to a feature vector F oflength 66 consisting of following features (n× 12 MFCC) + (n × 4 FF) +([n × [BGS, NGS, P, LogE, Zcr, Kurt]). From C11=310 cough events and F=66 features, cough event feature matrix MDS11 was created. - Feature Matrix and LRM performance during training stage: Following LOV technique, LC11= 310 LRMs were designed.
- The mean training sensitivity and specificity for the 310 LRMs were 92±1% and 93±0.5% respectively. Validation sensitivity and specificity for these models were 62% and 84% respectively. Table 4-(A) gives the detailed classification results when all the F=66 features were used to train the LRMs.
Table 29: LRM performance before and after the feature selection. Statistics provided in the table are mean I standard deviation. 95% confidence interval for mean of the training dataset is provide at bottom. For scorer 1 andscorer 2 sample size is C1 = 385 cough events from N1 = 60 patients in dataset DS1. Out of 385 cough events scorers had wet/dry consensus on C11=310 cough events.Sensitivity Specificity Accuracy PPV NPV K (A) When all the features were used to develop LRM Consensus of scorer 1 & scorer 2 Training 91.76±0.68 [91.69-91.84] 92.65±0.45 [92.6-92.7] 92.45±0.5 [92.36-92.47] 81.80±1 [81.68-81.91] 96.90±0.3 [96.87-96.93] 0.8125±0.1 [0.8112-0.8138] Validation 62 84 78 59 86 0.46 Scorer 1 wet/dry class Training 87.15±0.95 [86.9-87.4] 87.49±0.89 [87.26-87.72] 87.40±0.90 [87.17-87.63] 71.53±1.84 [71-72] 94.97±0.40 [94.87-95.07] 0.6977±0.02 [0.69-0.70] Validation 53 78 71 47 82 0.3 Scorer 2 wet/dry class Training 81.96±1.01 [81.7-82.23] 82.24±0.97 [81.98-82.49] 82.14±0.98 [81.89-82.4] 71.83±1.37 [71.48-72.19] 89.18±0.78 [88.98-89.38] 0.6224±0.01 [0.6173-0.6276] Validation 45 67 59 43 69 0.12 (B) When selected all the features were used to develop LRM Consensus of scorer 1 & scorer 2 Training 87.36±0.61 [87.29-87.43] 87.82±0.43 [87.77-87.87] 87.70±0.46 [87.65-87.75] 72.07±0.87 [71.98-72.17] 95.07±0.25 [95.05-95.10] 0.7041±0.01 [0.7029-0.7053] Validation 81 83 82 63 92 0.58 Scorer 1 wet/dry class Training 82.75±0.57 [82.60-82.89] 83.06±0.52 [82.92-83.19] 82.98±0.52 [82.84-83.11] 63.78.±1.18 [63.47-64.08] 93.03±0.27 [92.96-93.10] 0.60±0.01 [0.59-0.60] Validation 76 79 78 57 90 0.5 Scorer 2 wet/dry class Training 75.66±0.57 [75.51-75.81] 75.92±0.58 [75.77-76.07] 75.83±0.57 [75.68-75.98] 63.44.±0.96 [63.19-63.69] 84.95±0.61 [84.79-85.11] 0.49±0.01 [0.4916-0.4975] Validation 72 73 72 59 82 0.43 - Following the process described in section II-B [Step 2] and using pths = 0.06, we selected Fs = 31 features.
Figure 23 shows the mean 'p-value' associated with F=66 features computed over C11=310 LRMs. All the features which have mean 'p-value' less than pths = 0.06 were selected. The selected features were 1 each from Bispectrum score, kurtosis, and number of zero-crossing, 2 each from non-gaussianity score and log-energy, 5 from formant frequencies, and 19 from mel-frequency cepstral coefficients. Table 30 gives details of the feature selected for designing the final LRM.Table 30: F=66 features were computed from each cough segment by using n=3 at section II-C [Step 1]. '√' indicates that feature was selected for designing the final model at section II-C [Step 2]. Features BSG NGS FF1 FF2 FF3 FF4 1 2 3 1 2 3 1 2 3 1 2 3 1 2 3 1 2 3 Selected ✔ ✔ ✔ ✔ ✔ ✔ ✔ ✔ Features Pitch LogE Kurt ZCR MFCC0 MFCC1 1 2 3 1 2 3 1 2 3 1 2 3 1 2 3 1 2 3 Selected ✔ ✔ ✔ ✔ ✔ ✔ Features MFCC2 MFCC3 MFCC4 MFCC5 MFCC6 MFCC7 1 2 3 1 2 3 1 2 3 1 2 3 1 2 3 1 2 3 Selected ✔ ✔ ✔ ✔ ✔ ✔ ✔ ✔ ✔ ✔ Features MFCC8 MFCC9 MFCC10 MFCC11 1 2 3 1 2 3 1 2 3 1 2 3 Selected ✔ ✔ ✔ ✔ ✔ ✔ ✔ - According to this table MFCC based features were most dominant. Out of 31 selected features, 19 features were contributed from different MFCC components. After MFCC formant frequencies made second most dominant contribution with 5 features. Moreover except for 4th formant frequency and pitch based features, which were completely omitted, all other features contributed with features from at-least one sub-segment towards building of final LRM model.
- When only selected features Fs were used to re-train LRMs, mean training sensitivity and specificity were recorded as 87±1% and 88±0.5% respectively and validation sensitivity and specificity were 81% and 83%. The validation kappa agreement between the LRM and scorers was 0.46 when all the features were used to train LRM and it increased to 0.58 when only selected features were used. Table 29-(B) gives the detailed training and validation results after feature selection.
- Selection of LRM (): From LC11 = 310 designed LRMs using data from DS11, optimal model
 was selected using k-mean clustering method as discussed in section II-C-[Step 3]. Models were clustered into two groups, high performance model and low performance models based on model parameters and performance measures. Of 310 models, 202 were clustered in high performance model group and 108 into low performance model group. LRM model #26 has the lowest mean square error value with respect to centroid of the high performance models. This modelwas chosen and all its parameters were fixed for future use.was tested on prospective dataset DS2. Performance ofon prospective dataset DS2: Table 31 gives the classification results ofagainst expert scorers.
Against individual scorer when tested on all the cough events (151) from DS2 Sensitivity Specificity Accuracy PPV NPV K Scorer 1 77.5% 76% 76% 54% 90% 0.47 Scorer 275% 64% 67% 43% 87% 0.31 Tested on only those events when both Scorer 1 andScorer 2 agreed on class84% 76% 78% 55% 93% 0.51 - Table 31 - Performance ofon dataset DS2 prospective study dataset.

- When
Scorer 1, wet/dry classification was used as reference standard,has the sensitivity of 77.5%, specificity of 76% and kappa agreement of 0.47. For theScorer 2, results were sensitivity 75%,specificity 64% and kappa 0.31. When modelwas tested on only those events, in whichScorer 1 andScorer 2 agreed on classification (117 cough events), sensitivity jumped to 84% and kappa value to 0.51. Table 32 shows the contingency table.
- LRM results when matched for Age and Gender: Table 33 shows the performance of the LRM on DS11 and DS2 when matched for age and gender.
Table 33 - LRM validation results for dataset DS11 and prospective dataset DS2 with age and gender matched. (A) Validation results for dataset DS 11. All features were used to train the LRMSensitivity Specificity Accuracy PPV NPV K Age <= 60 months, Male (#121 cough events) 59% 83% 76% 57% 84% 0.41 Age <= 60 months, Female (#145 cough events) 58% 88% 80% 63% 85% 0.47 Age >60 months, Male (#20 cough events) 89% 64% 75% 67% 87.5% 0.51 Age >60 months, Female (#24 cough events) 100% 83% 86% 20% 100% 0.28 Validation results for dataset DS 11. Selected features were used to train the LRMSensitivity Specificity Accuracy PPV NPV K Age <= 60 months, Male (#121 cough events) 73.5% 78% 77% 57% 88% 0.47 Age <= 60 months, Female (#145 cough events) 84% 87% 86% 70% 94% 0.67 Age >60 months, Male (#20 cough events) 89% 64% 75% 67% 87.5% 0.51 Age >60 months, Female (#24 cough events) 100% 91% 92% 33% 100% 0.47 (B) Prospective Study dataset DS2 Sensitivity Specificity Accuracy PPV NPV K Age <= 60 months, Male (#36 cough events) 92% 87.5% 89% 78.5% 95% 0.76 Age <= 60 months, Female (#27 cough events) 87.5% 95% 92.5% 87.5% 95% 0.82 Age >60 months, Male (#30 cough events) 50% 54% 53% 14% 87.5% 0.02 Age >60 months, Female (#24 cough events) 86% 71% 75% 54.5% 92% 0.48 - Due to limited availability of data we considered only 4 divisions; (i) male with age<=60 months, (ii) female with age<=60 months, (iii) male with age>60 months and (iv) female with age>60 months. According to this table during the model designing stage, generally no significance difference was seen in the model validation performance across four divisions in comparison to when no division was considered, table 29 & table 33(A). Similar to this on the prospective dataset DS2, selected modelperformed well across all division (table 31 & table 33(B)), except in the 3rd division (male with age>60) where performance were very poor.
- Embodiments of the present invention encompass an automated, objective method to classify cough sounds in to wet and dry categories. As far as the inventors are aware know, this is the first attempt to develop objective technology for the dry/wet classification of pediatric cough sounds, espcially in diseases such as pneumonia. The results presented herein are based on 536 cough events from 78 subjects, compared to existing work which use no more than 30 coughs in their descriptive analyses. For these reasons no other work has been availble to directly compare the results against.
- The reference method used for the assessment of our technology is the subjective classification of cough sounds into wet/dry classes by two pediatric respiratory physicians from different countries. These scorers were blinded to the actual clinical diagnosis of the subjects. In an event-by-event cough classification, the two experts agreed with each other at a Moderate Level (kappa value of κ = 0.54). In 5, inter-clinician agreement for wet/dry cough is reported as κ = 0.88. However it should be noted that, in 5 clinicians assessed wetness of cough at the patient level but not at individual cough level. When we computed the agreement between scorers at the patient level, the kappa value increased to κ = 0.66 (Substantial Agreement). These numbers further illustrate the subjective nature of dry/wet classification.
- Our classifier technology was trained on coughs from the training set (set DS 1) using only events where both scorers reached consensus. As the output of the training process we identified a good Logistic Regression Model () and fixed its parameters. The model was then tested on the Prospective Set (Set DS2) in several different ways. The highest sensitivity and specificity (84% and 76%) of classification were achieved when we testedagainst consensus events within DS2. It is interesting to note that these numbers were consistently higher than what we got by testing against individual classification outcomes of each scorer.
- Another salient feature of our method is that it has a high negative predictive value (NPV = 93%), when scorer consensus data is used as the ground truth. This means that if the model classifies a cough as non-wet (dry), it is most likely that the two expert scorers would independently reach the same conclusion. However, the positive predictive value of our method compared to human scorers is lower (PPV = 55%). Thus, a sizable fraction of coughs classified by the model as wet ends up being consensus-classified as dry by human scorers. This phenomenon appears to be explained by the results presented by Chang et. al5 which found that expert human scorers underscore wet coughs. In 5 they systematically compared subjective dry/wet classifications of expert clinicians with bronchoscopic indications of airway mucus. They reported that clinician's classification of dry cough do not necessarily indicate the absence of secretions. Certain situations in airways, for instance small amounts of secretions, may not be reflected in cough sounds at a sufficient magnitude to be detected by a human observer. One of the possible reasons for a lower PPV value found in our method can be this weakness in the gold standard, human scorers, used to generate our performance statistics. This hypothesis needs to be carefully validated against bronchoscopic findings in the future.
- The ability to correctly detect airway mucus can be particularly important in the management of suppurative lung diseases 3,5. Cough is an early symptom of diseases such as pneumonia, bronchitis and bronchiolitis. The accurate assessment of this symptom is a crucial factor in diagnosing acute diseases or the monitoring of chronic symptoms and treatment efficacy. It is known that in children, wet coughs are more likely to be associated with lower respiratory tract infections3. The subjective classification of wet coughs has low sensitivity as a method of detecting airway mucus, even in the hands of expert clinicians. Accurate, objective technology for the classification of dry/wet coughs is currently unavailable either at the commercial or research levels. To the best of our knowledge, this work is the first attempt in the world to develop such technology.
- We present the first ever approach to automate dry-wet classification of coughs. The results that have been presented herein can be improved by syetematically optimizing the parameters and fine tunining the training processes of the classifier. The heuristic model selection process that has been discussed makes the reported results pessimistic estimates. The inventors also believe that the feature set can be improved and the classification accuracy of the method can be further increased. However before an optimization attemp, issue we need to resolve is to improve the `gold standard' used in the clinical diagnosis. A carfully controlled bronchoscopy study will be best suited as the gold standard.
- Another possible limiting factor to this study is the biasedness of the cough sound database towards dry coughs; almost 70% cough sounds are dry as perceived by expert human scorers. However, with all these factors, embodiments of the present invention can currently classify wet and dry coughs with high sensitivity (84%) and specificity (76%) and with a good agreement (κ =0.51) with the expert human scorers.
- In light of the above it will be realized that methods according to embodiments of the invention described herein can classify the cough sounds into dry and wet classes with high accuracy and good agreement with pediatricians. To the best of the inventors' knowledge it is the first known method for wet/dry classification, presented with complete training and testing results on significantly large cough samples. It is also the first effort to automate the wet/dry classification in pediatric population with range of respiratory infectious diseases. It carries the potential to develop as a useful clinical tool for long term cough monitoring and in the assessment of treatment efficacy or in characterizing the lower respiratory tract infections. It will be essentially useful in clinical or research studies where temporal patterns of cough quality (wet/dry) from hour to hour basis are needed.
- The methods described herein may be simultaneously implemented with other potential technologies such as microwave imaging and ultrasound imaging that may be capable of detecting consolidations and mucus in lungs.
- Explanations of some of the terms used in explaining the previous method are as follows:
[A2]. Kappa statistic is widely used in situations where the agreement between two techniques should be compared. Below are the guidelines for interpreting the Kappa values.Kappa Interpretation < 0 less than chance agreement 0.01 - 0.20 Slight agreement 0.21 - 0.40 Fair agreement 0.41 - 0.60 Moderate agreement 0.61 - 0.80 Substantial agreement 0.81 - 1 Almost perfect agreement
[A3]. Definition of the statistical measures used to evaluate the performance of the LRM. - True Positive (TP) - Wet cough correctly identified as 'WET' by LRM.
- False Positive (FP) - Dry cough incorrectly identified as 'WET' by LRM.
- True Negative (TN) - Dry cough correctly identified as `DRY by LRM.
- False Negative (FN) - Wet cough incorrectly identified as 'DRY' by LRM.


- A method which is capable of extracting cough sounds from a recording by defining the beginning and the end of the cough segments has been described herein. A set of different features were computed from the sound signal and used as an input to a decision engine, for example an adaptive neural network-based pattern recognition algorithm or a logistic regression model. In one example the proposed method achieved segmentation sensitivity and specificity of about 95%. This method can be used as the front-end of cough analysis system; hence the quantitative and qualitative information from a larger number of cough sounds in a recording can be analyzed automatically.
-
- [1] A. J. Hotaling and G. T. Moynihan, "Cough," in Pediatirc Otolaryngology. vol. 2, ed Philadelphia: Saunders, 2003, pp. 1395-1404.
- [2] R. E. Black, etal., "Global, regional, and national causes of child mortality in 2008: a systematic analysis," The Lancet, vol. 375, pp. 1969-1987, 2010.
- [3] Igor Rudan, et al., "Epidemiology and etiology of childhood pneumonia," Bulletin of the World Health Organization, vol. 86, pp. 408-416, 2008.
- [4] WHO, "WHO-recommended standards for surveillance of selected-preventable diseases," Geneva, WHO/ V&B/03.01, 2003.
- [5] S. Barry, et al., "The automatic recognition and counting of cough," Cough, vol. 2, p. 8, 2006.
- [6] S. Matos, et al., "An Automated System for 24-h Monitoring of Cough Frequency: The Leicester Cough Monitor," Biomedical Engineering, IEEE Transactions on, vol. 54, pp. 1472-1479, 2007.
- [7] PDA Cortex. (acessed at 12 October 2011). LifeShirt a new era in ambulatory monitoring. Available: http://www.pdacortex.com/VivoMetrics.htm
- [8] J. Thomas. (accessed at 12 October 2011). VitaloJAK Cough Monitor. Available: http://www.trustech.org.uk/case-study/the-vitalojak/
- [9] KarmelSonix. (accessed at 12 October 2011). PulmoTrack. Available: http://www.kartnelsonix.com/solution-pulmotrack.html
- [10] M. A. Coyle, et al., "Evaluation of an ambulatory system for the quantification of cough frequency in patients with chronic obstructive pulmonary disease," Cough, vol. 1, p. 3, 2005.
- [11]E. Vizel, et al., "Validation of an ambulatory cough detection and counting application using voluntary cough under different conditions," Cough, vol. 6, p. 3, 2010.
- [12] K. McGuinness, et al., "Automated cough detection: a novel approach [abstract]," Am J Resp Crit Care Med, p. 175: A381, 2007.
- [13] J. Smith and A. Woodcock, "New Developments in the Objective Assessment of Cough," Lung, vol. 186, pp. 48-54, 2008.
- [14] S. Ferrari, et al., "Cough sound analysis to identify respiratory infection in pigs," Computers and Electronics in Agriculture, vol. 64, pp. 318-325, 2008.
- [15] R. Martin, "Noise power spectral density estimation based on optimal smoothing and minimum statistics," Speech and Audio Processing, IEEE Transactions on, vol. 9, pp. 504-512, 2001.
- [16] S. Greenberg, et al., Speech processing in auditory system. New York: Springer, 2004.
- [17] S. Chatterjee and W. B. Kleijn, "Auditory model based modified MFCC features," in Acoustics Speech and Signal Processing (ICASSP), 2010 IEEE International Conference on, 2010, pp. 4590-4593.
- [18] W. D. Duckitt, et al., "Automatic detection, segmentation and assessment of snoring from ambient acoustic data," Physiological Measurement, vol. 27, p. 1047, 2006.
- [19] E. Goldshtein, et al., "Automatic Detection of Obstructive Sleep Apnea Using Speech Signals," Biomedical Engineering, IEEE Transactions on, vol. 58, pp. 1373-1382, 2011.
- [20] S. K. Asela, et al., "Multi-feature snore sound analysis in obstructive sleep apnea-hypopnea syndrome," Physiological Measurement, vol. 32, p. 83, 2011.
- [21] U. R. Abeyratne, et al., "Multi-parametric analysis of snore sounds for the community screening of sleep apnea with non-gaussianity index," US Patent, 2010.
- [22] J. E. Markel and A. H. Gray, Linear Prediction of Speech: Springer-Verlag New York, Inc. , 1982.
- [23] H. Ghaemmaghami, et al., "Normal probability testing of snore signals for diagnosis of obstructive sleep apnea," in Engineering in Medicine and Biology Society, 2009. EMBC 2009. Annual International Conference of the IEEE, 2009, pp. 5551-5554.
- [24] S. El Safty and A. El-Zonkoly, "Applying wavelet entropy principle in fault classification," International Journal of Electrical Power & Energy Systems, vol. 31, pp. 604-607, 2008.
- [25] G. M. Foody, "Using prior knowledge in artificial neural network classification with a minimal training set," International Journal of Remote Sensing, vol. 16, pp. 301-312, 1995/01/01 1995.
- [26] A. Waibel, et al., "Phoneme recognition using time-delay neural networks," Acoustics, Speech and Signal Processing, IEEE Transactions on, vol. 37, pp. 328-339, 1989.
- [27] M. Riedmiller and H. Braun, "A direct adaptive method for faster backpropagation learning: the RPROP algorithm," in Neural Networks, 1993., IEEE International Conference on, 1993, pp. 586-591 vol.1.
- [28] V. Tyagi, et al., "A variable-scale piecewise stationary spectral analysis technique applied to ASR," in Machine learning for multimodal interaction, Edinburgh, 2005, pp. 274-284.
- [29] 1. Ghaemmaghami, H., U. Abeyratne, and C. Hukins. Normal probability testing of snore signals for diagnosis of obstructive sleep apnea. 2009: IEEE.
- [30]. Ng, A.K., et al., Could formant frequencies of snore signals be an alternative means for the diagnosis of obstructive sleep apnea? Sleep medicine, 2008. 9(8): p. 894-898.
- [31] Oppenheim, A.V., R.W. Schafer, and J.R. Buck, Discrete-time signal processing. Vol. 1999. 1989: Prentice hall Englewood Cliffs, NJ:.
- [32] Zheng, F., G. Zhang, and Z. Song, Comparison of different implementations of MFCC. Journal of Computer Science and Technology, 2001. 16(6): p. 582-589.
- [33] Abeyratne, U. Blind reconstruction of non-minimum-phase systems from 1-D oblique slices of bispectrum. 1999: IET.
- [34] Mendel, J.M., Tutorial on higher-order statistics (spectra) in signal processing and system theory: Theoretical results and some applications. Proceedings of the IEEE, 1991. 79(3): p. 278-305.
- 3. Tessa Wardlaw, E.W. Johansson, and M. Hodge, Pneumonia: The forgotten killer of children. UNICEF/WHO, 2006.
- 4. Berman, S., E. Simoes, and C. Lanata, Respiratory rate and pneumonia in infancy. Archives of disease in childhood, 1991. 66(1): p. 81-84.
- 5. WHO, Childhood disease, WHO.
- 6. Cardoso, M.R.A., et al., Adding fever to WHO criteria for diagnosing pneumonia enhances the ability to identify pneumonia cases among wheezing children. Archives of disease in childhood, 2011. 96(1): p. 58.
- 7. Harari, M., et al., Clinical signs of pneumonia in children. The Lancet, 1991. 338(8772): p. 928-930.
- 8. Lozano, J., et al., Clinical predictors of acute radiological pneumonia and hypoxaemia at high altitude. Archives of disease in childhood, 1994. 71(4): p. 323-327.
- 9. Mulholland, E., et al., Standardized diagnosis of pneumonia in developing countries. The Pediatric infectious disease journal, 1992. 11(2): p. 77.
- 10. Palafox, M., et al., Diagnostic value of tachypnoea in pneumonia defined radiologically. Archives of disease in childhood, 2000. 82(1): p. 41-45.
- Any embodiment of the invention is meant to be illustrative only and is not meant to be limiting to the invention. Therefore, it should be appreciated that various other changes and modifications can be made to any embodiment described without departing from the scope of the invention as defined by the claims.
- In the present specification and claims, the word "comprising" and its related and derivative terms, including "comprises" and "comprise", are to be interpreted in an inclusive sense as including each of the stated integers but without excluding the inclusion of one or more further integers.
Claims (14)
- A method of operating a computational device (52) to process a sound recording of a patient (501), the method characterized by the steps of:extracting Mel-frequency cepstral coefficients (MFCCs) (209), Formant Frequency (211), Zero Crossing Rate (213), Shannon Entropy (215) and Non-Gaussianity (217) features from patient sounds in the recording to form feature vectors (223);classifying (225) segments as cough sounds (1001) based upon the extracted features with a pattern classifier (300); andpresenting a diagnosis of a disease related state on a display (56) under control of the computational device (52) based on segments (1001) of the patient sounds (501) classified as cough sounds, wherein the diagnosis presented is pneumonia.
- A method according to claim 1, wherein the pattern classifier comprises an artificial neural network (300).
- A method according to claim 2, wherein the artificial neural network (300) comprises a time delay neural network (TDNN).
- A method according to claim 3, wherein the TDNN (300) has a hidden layer (303) between an output layer (305) and an input layer (307) with 10 to 50 neurons in the hidden layer (303).
- A method according to any one of claims 1 to 4 including calculating a bispectrum for further classification of the cough segments.
- A method according to claim 1, further comprising diagnosing a pneumonic state based on the segments of the patient sounds classified as cough sounds and presenting the diagnosis on the display under control of the computational device.
- A method according to claim 6, including monitoring patient data from one or more of a: breathing detection sensor, temperature sensor, movement sensor, EEG sensor, oxygen level sensor.
- A method according to claim 1, including categorizing cough sounds as being "wet cough" or "non-wet cough" sounds (1506).
- A method according to claim 6 or claim 7, including the steps of:categorizing cough events of the patient sounds as either pneumonic or non-pneumonic by processing features extracted from cough events according to a classification procedure;computing a pneumonic cough index indicating the proportion of pneumonic cough events categorized; anddeeming the patient to be suffering from the pneumonic disease state in the event of the pneumonic cough index complying with a predetermined requirement.
- A method according to claim 9, wherein the classification procedure comprises any one of: a logistic regression model; an artificial neural network; a Bayes classifier; a hidden Markov model; a support vector machine.
- A method according to claim 9 or claim 10, including comparing the pneumonic cough index to a threshold and deeming the patient to be suffering from pneumonia based on the comparison.
- A method according to any one of claims 9 to 11, including applying a training set to said any one of:a logistic regression model; an artificial neural network; a Bayes classifier; a hidden Markov model; a support vector machine;the training set including non-pneumonic sounds recorded from patients suffering from one or more of the following complaints: Asthma, Bronchitis, Rhinopharyngitis, wheezing, tonsillopharyngitis, heart disease, laryngomalacia, malaria, and foreign body inhalation.
- A computational device (52) including at least one electronic processor (70) in communication with an electronic memory (62, 64, 66) containing instructions for the processor to carry out a method according to any one of the preceding claims.
- A machine readable media (46) bearing tangible instructions for execution by one or more electronic processors (70) for carrying out a method according to any one of claims 1 to 12.
Priority Applications (1)
| Application Number | Priority Date | Filing Date | Title |
|---|---|---|---|
| EP23169487.8A EP4241676A3 (en) | 2012-03-29 | 2013-03-28 | A method and apparatus for processing sound recordings of a patient |
Applications Claiming Priority (2)
| Application Number | Priority Date | Filing Date | Title |
|---|---|---|---|
| AU2012901255A AU2012901255A0 (en) | 2012-03-29 | A method and apparatus for processing patient sounds | |
| PCT/AU2013/000323 WO2013142908A1 (en) | 2012-03-29 | 2013-03-28 | A method and apparatus for processing patient sounds |
Related Child Applications (1)
| Application Number | Title | Priority Date | Filing Date |
|---|---|---|---|
| EP23169487.8A Division EP4241676A3 (en) | 2012-03-29 | 2013-03-28 | A method and apparatus for processing sound recordings of a patient |
Publications (3)
| Publication Number | Publication Date |
|---|---|
| EP2830496A1 EP2830496A1 (en) | 2015-02-04 |
| EP2830496A4 EP2830496A4 (en) | 2015-12-16 |
| EP2830496B1 true EP2830496B1 (en) | 2023-04-26 |
Family
ID=49257951
Family Applications (2)
| Application Number | Title | Priority Date | Filing Date |
|---|---|---|---|
| EP13768257.1A Active EP2830496B1 (en) | 2012-03-29 | 2013-03-28 | A method and apparatus for processing sound recordings of a patient |
| EP23169487.8A Pending EP4241676A3 (en) | 2012-03-29 | 2013-03-28 | A method and apparatus for processing sound recordings of a patient |
Family Applications After (1)
| Application Number | Title | Priority Date | Filing Date |
|---|---|---|---|
| EP23169487.8A Pending EP4241676A3 (en) | 2012-03-29 | 2013-03-28 | A method and apparatus for processing sound recordings of a patient |
Country Status (8)
| Country | Link |
|---|---|
| US (1) | US10098569B2 (en) |
| EP (2) | EP2830496B1 (en) |
| JP (1) | JP6435257B2 (en) |
| KR (1) | KR102081241B1 (en) |
| CN (2) | CN104321015A (en) |
| AU (1) | AU2013239327B2 (en) |
| ES (1) | ES2947765T3 (en) |
| WO (1) | WO2013142908A1 (en) |
Families Citing this family (127)
| Publication number | Priority date | Publication date | Assignee | Title |
|---|---|---|---|---|
| CN105193443A (en) | 2010-04-16 | 2015-12-30 | 田纳西大学研究基金会 | Systems and methods for predicting gastrointestinal impairment |
| US8992435B2 (en) * | 2010-08-25 | 2015-03-31 | Diacoustic Medical Devices (Pty) Ltd | System and method for classifying a heart sound |
| US11315687B2 (en) * | 2012-06-18 | 2022-04-26 | AireHealth Inc. | Method and apparatus for training and evaluating artificial neural networks used to determine lung pathology |
| CN103730130B (en) * | 2013-12-20 | 2019-03-01 | 中国科学院深圳先进技术研究院 | A kind of detection system of pathological voice |
| JP6320109B2 (en) * | 2014-03-27 | 2018-05-09 | 旭化成株式会社 | Heart disease identification device |
| EP2945084A1 (en) * | 2014-05-12 | 2015-11-18 | Electrosalus Biyomedikal Sanayi ve Ticaret Anonim Sirketi | Auscultation data acquisition, communication and evaluation system incorporating mobile facilities |
| US9981107B2 (en) | 2014-06-05 | 2018-05-29 | Eight Sleep Inc. | Methods and systems for gathering and analyzing human biological signals |
| CN106471567B (en) * | 2015-05-15 | 2019-04-26 | 深圳市大疆创新科技有限公司 | Color calibration system and method |
| US9687208B2 (en) * | 2015-06-03 | 2017-06-27 | iMEDI PLUS Inc. | Method and system for recognizing physiological sound |
| JP6780182B2 (en) * | 2015-10-08 | 2020-11-04 | コルディオ メディカル リミテッド | Evaluation of lung disease by voice analysis |
| US10154932B2 (en) | 2015-11-16 | 2018-12-18 | Eight Sleep Inc. | Adjustable bedframe and operating methods for health monitoring |
| US20170135883A1 (en) * | 2015-11-16 | 2017-05-18 | Eight Sleep Inc. | Adjustable bedframe and operating methods |
| US10105092B2 (en) | 2015-11-16 | 2018-10-23 | Eight Sleep Inc. | Detecting sleeping disorders |
| US9899034B2 (en) * | 2015-12-22 | 2018-02-20 | Intel IP Corporation | Technologies for robust crying detection using temporal characteristics of acoustic features |
| US11116478B2 (en) | 2016-02-17 | 2021-09-14 | Sanolla Ltd. | Diagnosis of pathologies using infrasonic signatures |
| EP3416564B1 (en) | 2016-02-17 | 2020-06-03 | Bat Call D. Adler Ltd. | Digital stethoscopes, and auscultation and imaging systems |
| US9998487B2 (en) * | 2016-04-25 | 2018-06-12 | General Electric Company | Domain level threat detection for industrial asset control system |
| CN105962897B (en) * | 2016-04-27 | 2018-10-02 | 南京理工大学 | A kind of adaptive sound of snoring signal detecting method |
| US10592733B1 (en) * | 2016-05-20 | 2020-03-17 | Educational Testing Service | Computer-implemented systems and methods for evaluating speech dialog system engagement via video |
| EP3484344A1 (en) * | 2016-07-14 | 2019-05-22 | Koninklijke Philips N.V. | System and method for monitoring asthma symptoms |
| US10008218B2 (en) | 2016-08-03 | 2018-06-26 | Dolby Laboratories Licensing Corporation | Blind bandwidth extension using K-means and a support vector machine |
| CN106364542B (en) * | 2016-09-20 | 2018-08-21 | 智易行科技(武汉)有限公司 | Multi-sensor Fusion intelligence baby figure based on support vector machines pacifies method |
| WO2018053604A1 (en) * | 2016-09-26 | 2018-03-29 | The University Of Queensland | A method and apparatus for automatic disease state diagnosis |
| EP3541288B1 (en) * | 2016-11-15 | 2023-07-19 | Boehringer Ingelheim Vetmedica GmbH | Method for predicting a specific respiratory pathogen |
| JP6907553B2 (en) * | 2017-01-23 | 2021-07-21 | 富士フイルムビジネスイノベーション株式会社 | Cough detector and program |
| CN110383375B (en) * | 2017-02-01 | 2024-02-13 | 辉瑞公司 | Method and apparatus for detecting cough in noisy background environment |
| CN110891486A (en) * | 2017-03-10 | 2020-03-17 | 梅西莫股份有限公司 | Pneumonia screening instrument |
| WO2018187664A1 (en) * | 2017-04-06 | 2018-10-11 | Brown University | Improved diagnostic instrument and methods |
| KR101924852B1 (en) * | 2017-04-14 | 2018-12-04 | 네이버 주식회사 | Method and system for multi-modal interaction with acoustic apparatus connected with network |
| EP3619657A4 (en) * | 2017-05-05 | 2021-02-17 | Canary Speech, LLC | Selecting speech features for building models for detecting medical conditions |
| CN107591162B (en) * | 2017-07-28 | 2021-01-12 | 南京邮电大学 | Cry recognition method based on pattern matching and intelligent nursing system |
| CN108701469B (en) * | 2017-07-31 | 2023-06-20 | 深圳和而泰智能控制股份有限公司 | Cough sound recognition method, device, and storage medium |
| CN107693043B (en) * | 2017-08-18 | 2019-10-11 | 中国人民解放军总医院 | The nonlinear dynamic analysis method of borborygmus sound signal |
| CN110021435A (en) * | 2017-09-07 | 2019-07-16 | 医疗财团法人徐元智先生医药基金会亚东纪念医院 | Voice detects categorizing system |
| WO2019060298A1 (en) | 2017-09-19 | 2019-03-28 | Neuroenhancement Lab, LLC | Method and apparatus for neuroenhancement |
| CN108053841A (en) * | 2017-10-23 | 2018-05-18 | 平安科技(深圳)有限公司 | The method and application server of disease forecasting are carried out using voice |
| WO2019079909A1 (en) * | 2017-10-27 | 2019-05-02 | Ecole De Technologie Superieure | In-ear nonverbal audio events classification system and method |
| WO2019096714A1 (en) | 2017-11-17 | 2019-05-23 | Koninklijke Philips N.V. | Cough detection in a respiratory support system |
| US11717686B2 (en) | 2017-12-04 | 2023-08-08 | Neuroenhancement Lab, LLC | Method and apparatus for neuroenhancement to facilitate learning and performance |
| USD865167S1 (en) | 2017-12-20 | 2019-10-29 | Bat Call D. Adler Ltd. | Digital stethoscope |
| US11864880B2 (en) * | 2017-12-21 | 2024-01-09 | The University Of Queensland | Method for analysis of cough sounds using disease signatures to diagnose respiratory diseases |
| US10957335B2 (en) * | 2017-12-28 | 2021-03-23 | Sleep Number Corporation | Home automation having user privacy protections |
| CN108090686B (en) * | 2017-12-29 | 2022-01-25 | 北京大学 | Medical event risk assessment analysis method and system |
| EP3731749A4 (en) | 2017-12-31 | 2022-07-27 | Neuroenhancement Lab, LLC | System and method for neuroenhancement to enhance emotional response |
| GB2584242B (en) | 2018-01-09 | 2022-09-14 | Eight Sleep Inc | Systems and methods for detecting a biological signal of a user of an article of furniture |
| GB2584241B (en) | 2018-01-19 | 2023-03-08 | Eight Sleep Inc | Sleep pod |
| KR20190113390A (en) * | 2018-03-28 | 2019-10-08 | (주)오상헬스케어 | Apparatus for diagnosing respiratory disease and method thereof |
| US11364361B2 (en) | 2018-04-20 | 2022-06-21 | Neuroenhancement Lab, LLC | System and method for inducing sleep by transplanting mental states |
| JP7197922B2 (en) * | 2018-05-08 | 2022-12-28 | 国立大学法人徳島大学 | Machine learning device, analysis device, machine learning method and analysis method |
| EA201800377A1 (en) * | 2018-05-29 | 2019-12-30 | Пт "Хэлси Нэтворкс" | METHOD FOR DIAGNOSTIC OF RESPIRATORY DISEASES AND SYSTEM FOR ITS IMPLEMENTATION |
| WO2020004727A1 (en) * | 2018-06-29 | 2020-01-02 | 주식회사 디플리 | Real-time sound analysis method and device |
| CN112399819A (en) * | 2018-07-02 | 2021-02-23 | 3M创新有限公司 | Sensing system and method for monitoring a time-dependent process |
| US10832673B2 (en) | 2018-07-13 | 2020-11-10 | International Business Machines Corporation | Smart speaker device with cognitive sound analysis and response |
| US10832672B2 (en) | 2018-07-13 | 2020-11-10 | International Business Machines Corporation | Smart speaker system with cognitive sound analysis and response |
| GB2578418B (en) * | 2018-07-25 | 2022-06-15 | Audio Analytic Ltd | Sound detection |
| KR102092543B1 (en) * | 2018-08-31 | 2020-03-24 | 재단법인 아산사회복지재단 | Method, apparatus and program for obtaining information of lung using lung sound |
| US11298101B2 (en) * | 2018-08-31 | 2022-04-12 | The Trustees Of Dartmouth College | Device embedded in, or attached to, a pillow configured for in-bed monitoring of respiration |
| CA3112564A1 (en) | 2018-09-14 | 2020-03-19 | Neuroenhancement Lab, LLC | System and method of improving sleep |
| US11380351B2 (en) * | 2018-09-20 | 2022-07-05 | Samsung Electronics Co., Ltd. | System and method for pulmonary condition monitoring and analysis |
| US10847177B2 (en) | 2018-10-11 | 2020-11-24 | Cordio Medical Ltd. | Estimating lung volume by speech analysis |
| AU2019360358A1 (en) * | 2018-10-17 | 2021-05-27 | The University Of Queensland | A method and apparatus for diagnosis of maladies from patient sounds |
| US20200135334A1 (en) * | 2018-10-26 | 2020-04-30 | AIRx Health, Inc. | Devices and methods for remotely managing chronic medical conditions |
| CN109498228B (en) * | 2018-11-06 | 2021-03-30 | 林枫 | Lung rehabilitation treatment device based on cough sound feedback |
| US11810670B2 (en) | 2018-11-13 | 2023-11-07 | CurieAI, Inc. | Intelligent health monitoring |
| WO2020123950A1 (en) * | 2018-12-13 | 2020-06-18 | EpilepsyCo Inc. | Systems and methods for a wearable device including stimulation and monitoring components |
| US20220008030A1 (en) * | 2018-12-20 | 2022-01-13 | University Of Washington | Detection of agonal breathing using a smart device |
| EP3935581A4 (en) | 2019-03-04 | 2022-11-30 | Iocurrents, Inc. | Data compression and communication using machine learning |
| US11011188B2 (en) | 2019-03-12 | 2021-05-18 | Cordio Medical Ltd. | Diagnostic techniques based on speech-sample alignment |
| KR20210137502A (en) * | 2019-03-12 | 2021-11-17 | 코디오 메디칼 리미티드 | Diagnostic technique based on negative sample alignment |
| US11024327B2 (en) | 2019-03-12 | 2021-06-01 | Cordio Medical Ltd. | Diagnostic techniques based on speech models |
| KR20210153638A (en) | 2019-04-16 | 2021-12-17 | 엔탁 메디칼, 인코포레이티드 | Enhanced detection and analysis of biological acoustic signals |
| US11786694B2 (en) | 2019-05-24 | 2023-10-17 | NeuroLight, Inc. | Device, method, and app for facilitating sleep |
| SG11202113302UA (en) * | 2019-05-30 | 2021-12-30 | Insurance Services Office Inc | Systems and methods for machine learning of voice attributes |
| CN111883174A (en) * | 2019-06-26 | 2020-11-03 | 深圳数字生命研究院 | Voice recognition method and device, storage medium and electronic device |
| US11948690B2 (en) * | 2019-07-23 | 2024-04-02 | Samsung Electronics Co., Ltd. | Pulmonary function estimation |
| DE102019210929B4 (en) * | 2019-07-24 | 2023-07-20 | Zf Friedrichshafen Ag | Computer-implemented method for machine learning of coughing and/or sneezing noises from passengers using a means of transport in order to initiate measures for cleaning the means of transport when coughing and/or sneezing noises are detected, and control device, method, device, means of transport and computer program for initiating the measures |
| CN110367934B (en) * | 2019-07-25 | 2023-02-03 | 深圳大学 | Health monitoring method and system based on non-voice body sounds |
| US11526780B2 (en) * | 2019-08-05 | 2022-12-13 | Microsoft Technology Licensing, Llc | Converting nonnative skills for conversational computing interfaces |
| US20220280065A1 (en) * | 2019-08-19 | 2022-09-08 | The University Of Queensland | A method and apparatus for processing asthma patient cough sound for application of appropriate therapy |
| US10709414B1 (en) | 2019-10-21 | 2020-07-14 | Sonavi Labs, Inc. | Predicting a respiratory event based on trend information, and applications thereof |
| US10702239B1 (en) | 2019-10-21 | 2020-07-07 | Sonavi Labs, Inc. | Predicting characteristics of a future respiratory event, and applications thereof |
| US10750976B1 (en) * | 2019-10-21 | 2020-08-25 | Sonavi Labs, Inc. | Digital stethoscope for counting coughs, and applications thereof |
| US10709353B1 (en) | 2019-10-21 | 2020-07-14 | Sonavi Labs, Inc. | Detecting a respiratory abnormality using a convolution, and applications thereof |
| US10716534B1 (en) | 2019-10-21 | 2020-07-21 | Sonavi Labs, Inc. | Base station for a digital stethoscope, and applications thereof |
| US11741986B2 (en) * | 2019-11-05 | 2023-08-29 | Samsung Electronics Co., Ltd. | System and method for passive subject specific monitoring |
| US20210161502A1 (en) * | 2019-12-03 | 2021-06-03 | Samsung Electronics Co., Ltd. | System and method for determining a likelihood of paradoxical vocal cord motion (pvcm) in a person |
| MX2022007560A (en) * | 2019-12-16 | 2022-09-19 | Resapp Health Ltd | Diagnosing respiratory maladies from subject sounds. |
| AU2020404447A1 (en) * | 2019-12-16 | 2022-06-23 | Pfizer Inc. | Method and apparatus for automatic cough detection |
| CN111179967B (en) * | 2019-12-17 | 2022-05-24 | 华南理工大学 | Algorithm, medium and equipment for linear classification of true and false cough sounds of patients with cervical and spinal cord injuries |
| US20210199503A1 (en) * | 2019-12-26 | 2021-07-01 | Industrial Technology Research Institute | Data processing system disposed on sensor and method thereof |
| CN111009263A (en) * | 2019-12-28 | 2020-04-14 | 哈尔滨工业大学 | System and method for identifying rales of lung |
| CN111260835B (en) * | 2020-01-19 | 2022-08-09 | 上海瑞皇管业科技股份有限公司 | Monitoring and alarming system for urban comprehensive pipe gallery and control method thereof |
| US11484211B2 (en) | 2020-03-03 | 2022-11-01 | Cordio Medical Ltd. | Diagnosis of medical conditions using voice recordings and auscultation |
| US11468908B2 (en) | 2020-04-15 | 2022-10-11 | Optum, Inc. | Hybrid input machine learning frameworks |
| CN111584069B (en) * | 2020-05-07 | 2023-04-18 | 成都兰途网络科技有限公司 | Psychosis recognition system based on speech deep-shallow feature stack sparse automatic coding |
| KR102394882B1 (en) * | 2020-05-11 | 2022-05-04 | 한양대학교 산학협력단 | Method and apparatus for monitoring and diagnosing infectious disease |
| WO2021248092A1 (en) * | 2020-06-04 | 2021-12-09 | Entac Medical, Inc. | Apparatus and methods for predicting in vivo functional impairments and events |
| CN111653273A (en) * | 2020-06-09 | 2020-09-11 | 杭州叙简科技股份有限公司 | Out-hospital pneumonia preliminary identification method based on smart phone |
| US11219386B2 (en) | 2020-06-15 | 2022-01-11 | Cirrus Logic, Inc. | Cough detection |
| US11134354B1 (en) | 2020-06-15 | 2021-09-28 | Cirrus Logic, Inc. | Wear detection |
| IL298823A (en) * | 2020-06-18 | 2023-02-01 | Resapp Health Ltd | Event detection in subject sounds |
| US11417342B2 (en) | 2020-06-29 | 2022-08-16 | Cordio Medical Ltd. | Synthesizing patient-specific speech models |
| KR20230028370A (en) | 2020-07-13 | 2023-02-28 | 다인기술 주식회사 | A method for counting coughs by analyzing acoustic signals, a server performing the same, and a non-temporary computer readable recording medium |
| US20220047088A1 (en) * | 2020-08-12 | 2022-02-17 | Cvb Inc | Method for analyzing sound data for use in an anti-snoring system and apparatus |
| KR102241399B1 (en) * | 2020-08-25 | 2021-04-16 | 주식회사 쓰리빌리언 | A System to measure symptom specificity accounting symptom prevalence in diseases |
| US20240015445A1 (en) * | 2020-09-04 | 2024-01-11 | Level 42 Ai Inc. | Non-contact sensor systems and methods |
| CN112233700A (en) * | 2020-10-09 | 2021-01-15 | 平安科技(深圳)有限公司 | Audio-based user state identification method and device and storage medium |
| US11862188B2 (en) * | 2020-10-22 | 2024-01-02 | Google Llc | Method for detecting and classifying coughs or other non-semantic sounds using audio feature set learned from speech |
| US20220338756A1 (en) * | 2020-11-02 | 2022-10-27 | Insubiq Inc. | System and method for automatic detection of disease-associated respiratory sounds |
| KR102445294B1 (en) * | 2020-11-30 | 2022-09-20 | 한국전자기술연구원 | Respiratory disease diagnosis method and system based on vital signal including respiratory sound |
| CN112754502A (en) * | 2021-01-12 | 2021-05-07 | 曲阜师范大学 | Automatic music switching method based on electroencephalogram signals |
| WO2022162600A1 (en) * | 2021-01-28 | 2022-08-04 | Sivan Danny | Detection of diseases and viruses by ultrasonic frequency |
| RU2752453C1 (en) * | 2021-03-29 | 2021-07-28 | Елена Алексеевна Терешко | Telemedicine terminal for examination and testing of workers of industrial and transport enterprises |
| CN113158916B (en) * | 2021-04-26 | 2022-04-22 | 华南理工大学 | Cough sound automatic identification algorithm, device, medium and equipment |
| CN115414025A (en) * | 2021-05-31 | 2022-12-02 | 华为技术有限公司 | Screening method, apparatus, storage medium, and program product |
| WO2023014063A1 (en) * | 2021-08-03 | 2023-02-09 | 다인기술 주식회사 | Method for evaluating possibility of dysphagia by analyzing acoustic signals, and server and non-transitory computer-readable recording medium performing same |
| KR102580057B1 (en) * | 2021-08-23 | 2023-09-21 | 한양대학교 산학협력단 | Wearable device and the operation method |
| KR102410650B1 (en) * | 2021-10-09 | 2022-06-17 | 전상현 | Untact Comprehensive MANAGEMENT SYSTEM) Health Care Service Providing Method |
| CN114041779A (en) * | 2021-11-26 | 2022-02-15 | 河南牧原智能科技有限公司 | Identification system and computer device for identifying respiratory diseases of livestock |
| KR102376188B1 (en) * | 2021-12-15 | 2022-03-17 | 가천대학교 산학협력단 | Method and System for Feature Information Selection for Classification of Lung Sounds using Deep-Learning |
| KR102429256B1 (en) * | 2021-12-31 | 2022-08-04 | 주식회사 에이슬립 | Method, computing device and computer program for analyzing a user's sleep state through sound information |
| US11948599B2 (en) * | 2022-01-06 | 2024-04-02 | Microsoft Technology Licensing, Llc | Audio event detection with window-based prediction |
| TWI820704B (en) * | 2022-05-12 | 2023-11-01 | 財團法人工業技術研究院 | Method and device for voice signal analyzation, method and device for chip design |
| WO2023243754A1 (en) * | 2022-06-17 | 2023-12-21 | 주식회사 엔씨소프트 | Electronic device and method for extracting time point at which designated motion is captured |
| CN114822567B (en) * | 2022-06-22 | 2022-09-27 | 天津大学 | Pathological voice frequency spectrum reconstruction method based on energy operator |
| CN117770790A (en) * | 2022-09-28 | 2024-03-29 | 华为技术有限公司 | Respiratory health detection method and wearable electronic device |
| CN117357754A (en) * | 2023-11-15 | 2024-01-09 | 江苏麦麦医疗科技有限公司 | Intelligent household oxygenerator and control system |
Citations (2)
| Publication number | Priority date | Publication date | Assignee | Title |
|---|---|---|---|---|
| US20110208521A1 (en) * | 2008-08-14 | 2011-08-25 | 21Ct, Inc. | Hidden Markov Model for Speech Processing with Training Method |
| US20120004749A1 (en) * | 2008-12-10 | 2012-01-05 | The University Of Queensland | Multi-parametric analysis of snore sounds for the community screening of sleep apnea with non-gaussianity index |
Family Cites Families (18)
| Publication number | Priority date | Publication date | Assignee | Title |
|---|---|---|---|---|
| US5598508A (en) * | 1991-10-18 | 1997-01-28 | Goldman; Julian M. | Real-time waveform analysis using artificial neural networks |
| US6436057B1 (en) * | 1999-04-22 | 2002-08-20 | The United States Of America As Represented By The Department Of Health And Human Services, Centers For Disease Control And Prevention | Method and apparatus for cough sound analysis |
| US6443907B1 (en) * | 2000-10-06 | 2002-09-03 | Biomedical Acoustic Research, Inc. | Acoustic detection of respiratory conditions |
| JP2003038460A (en) * | 2001-08-03 | 2003-02-12 | Mitsubishi Pharma Corp | Cough sound detector, cough sound detecting method, cough sound detecting program and information storage medium |
| US20080082018A1 (en) * | 2003-04-10 | 2008-04-03 | Sackner Marvin A | Systems and methods for respiratory event detection |
| US7207948B2 (en) * | 2004-06-24 | 2007-04-24 | Vivometrics, Inc. | Systems and methods for monitoring cough |
| EP2589335A3 (en) | 2003-04-10 | 2017-10-04 | Adidas AG | Systems and methods for respiratory event dedection |
| AU2005258237A1 (en) | 2004-06-24 | 2006-01-05 | Adidas Ag | Systems and methods for monitoring cough |
| JP2007125360A (en) * | 2005-10-05 | 2007-05-24 | Konica Minolta Medical & Graphic Inc | Cough detecting device |
| US7479115B2 (en) * | 2006-08-25 | 2009-01-20 | Savic Research, Llc | Computer aided diagnosis of lung disease |
| JP2008178635A (en) | 2007-01-26 | 2008-08-07 | Konica Minolta Medical & Graphic Inc | Coughing analyzer |
| GB0711524D0 (en) | 2007-06-15 | 2007-07-25 | Univ Leuven Kath | Online recognition and localisation of sick pig cough sounds |
| EP2299910B1 (en) * | 2008-06-17 | 2016-08-03 | Koninklijke Philips N.V. | Acoustical patient monitoring using a sound classifier and microphones |
| AU2009330118B2 (en) * | 2008-12-22 | 2013-08-29 | Pneumoflex Systems, Llc | Techniques for evaluating stress urinary incontinence (SUI) using involuntary reflex cough test |
| US20120071777A1 (en) * | 2009-09-18 | 2012-03-22 | Macauslan Joel | Cough Analysis |
| US8758262B2 (en) * | 2009-11-25 | 2014-06-24 | University Of Rochester | Respiratory disease monitoring system |
| CN101894551B (en) * | 2010-07-02 | 2012-05-09 | 华南理工大学 | Device for automatically identifying cough |
| US8784311B2 (en) * | 2010-10-05 | 2014-07-22 | University Of Florida Research Foundation, Incorporated | Systems and methods of screening for medical states using speech and other vocal behaviors |
-
2013
- 2013-03-28 ES ES13768257T patent/ES2947765T3/en active Active
- 2013-03-28 JP JP2015502020A patent/JP6435257B2/en active Active
- 2013-03-28 US US14/389,291 patent/US10098569B2/en active Active
- 2013-03-28 CN CN201380028268.XA patent/CN104321015A/en active Pending
- 2013-03-28 EP EP13768257.1A patent/EP2830496B1/en active Active
- 2013-03-28 KR KR1020147030062A patent/KR102081241B1/en active IP Right Grant
- 2013-03-28 CN CN201910202125.5A patent/CN110353685B/en active Active
- 2013-03-28 WO PCT/AU2013/000323 patent/WO2013142908A1/en active Application Filing
- 2013-03-28 AU AU2013239327A patent/AU2013239327B2/en active Active
- 2013-03-28 EP EP23169487.8A patent/EP4241676A3/en active Pending
Patent Citations (2)
| Publication number | Priority date | Publication date | Assignee | Title |
|---|---|---|---|---|
| US20110208521A1 (en) * | 2008-08-14 | 2011-08-25 | 21Ct, Inc. | Hidden Markov Model for Speech Processing with Training Method |
| US20120004749A1 (en) * | 2008-12-10 | 2012-01-05 | The University Of Queensland | Multi-parametric analysis of snore sounds for the community screening of sleep apnea with non-gaussianity index |
Also Published As
| Publication number | Publication date |
|---|---|
| EP4241676A3 (en) | 2023-10-18 |
| CN110353685B (en) | 2022-03-04 |
| KR102081241B1 (en) | 2020-02-25 |
| WO2013142908A1 (en) | 2013-10-03 |
| US20150073306A1 (en) | 2015-03-12 |
| EP4241676A2 (en) | 2023-09-13 |
| JP6435257B2 (en) | 2018-12-05 |
| AU2013239327B2 (en) | 2018-08-23 |
| AU2013239327A1 (en) | 2014-11-06 |
| CN104321015A (en) | 2015-01-28 |
| EP2830496A4 (en) | 2015-12-16 |
| US10098569B2 (en) | 2018-10-16 |
| EP2830496A1 (en) | 2015-02-04 |
| KR20140142330A (en) | 2014-12-11 |
| ES2947765T3 (en) | 2023-08-18 |
| CN110353685A (en) | 2019-10-22 |
| JP2015514456A (en) | 2015-05-21 |
Similar Documents
| Publication | Publication Date | Title |
|---|---|---|
| EP2830496B1 (en) | A method and apparatus for processing sound recordings of a patient | |
| Abeyratne et al. | Cough sound analysis can rapidly diagnose childhood pneumonia | |
| Swarnkar et al. | Automatic identification of wet and dry cough in pediatric patients with respiratory diseases | |
| Dafna et al. | Automatic detection of whole night snoring events using non-contact microphone | |
| Amrulloh et al. | Automatic cough segmentation from non-contact sound recordings in pediatric wards | |
| JP2023164839A (en) | Method for analysis of cough sound using disease signature to diagnose respiratory disease | |
| Reichert et al. | Analysis of respiratory sounds: state of the art | |
| Xu et al. | Listen2cough: Leveraging end-to-end deep learning cough detection model to enhance lung health assessment using passively sensed audio | |
| Akbari et al. | An efficient voice pathology classification scheme based on applying multi-layer linear discriminant analysis to wavelet packet-based features | |
| Wang et al. | Automatic snoring sounds detection from sleep sounds via multi-features analysis | |
| Datta et al. | Automated lung sound analysis for detecting pulmonary abnormalities | |
| Costantini et al. | Deep learning and machine learning-based voice analysis for the detection of COVID-19: A proposal and comparison of architectures | |
| Hong et al. | A robust audio classification system for detecting pulmonary edema | |
| Çavuşoğlu et al. | Acoustics of snoring and automatic snore sound detection in children | |
| Aly et al. | A new model to detect COVID-19 coughing and breathing sound symptoms classification from CQT and Mel spectrogram image representation using deep learning | |
| Kim et al. | Non-invasive way to diagnose dysphagia by training deep learning model with voice spectrograms | |
| Yılmaz et al. | Obstructive sleep apnea detection with nonlinear analysis of speech | |
| Ali et al. | Cough Detection Using Mobile Phone Accelerometer and Machine Learning Techniques | |
| Markandeya et al. | Severity Analysis of Upper Airway Obstructions: Oesophageal Pressure Versus Snoring Sounds | |
| Sreerama | Respiratory Sound Analysis for the Evidence of Lung Health | |
| Yamashita | Construction of suitable DNN-HMM for classification between normal and abnormal respiration | |
| Sharan et al. | Automated Cough Sound Analysis for Detecting Childhood Pneumonia | |
| Botha | Lung health diagnosis through cough sound analysis | |
| Gupta et al. | Correlating spirometry findings with auscultation sounds for diagnosis of respiratory diseases | |
| Murakami et al. | Orthogonality-Constrained CNMF-Based Noise Reduction with Reduced Degradation of Biological Sound |
Legal Events
| Date | Code | Title | Description |
|---|---|---|---|
| PUAI | Public reference made under article 153(3) epc to a published international application that has entered the european phase |
Free format text: ORIGINAL CODE: 0009012 |
|
| 17P | Request for examination filed |
Effective date: 20141029 |
|
| AK | Designated contracting states |
Kind code of ref document: A1 Designated state(s): AL AT BE BG CH CY CZ DE DK EE ES FI FR GB GR HR HU IE IS IT LI LT LU LV MC MK MT NL NO PL PT RO RS SE SI SK SM TR |
|
| AX | Request for extension of the european patent |
Extension state: BA ME |
|
| DAX | Request for extension of the european patent (deleted) | ||
| RIC1 | Information provided on ipc code assigned before grant |
Ipc: G06F 19/00 20110101ALI20151104BHEP Ipc: A61B 7/00 20060101ALI20151104BHEP Ipc: G06K 9/00 20060101ALI20151104BHEP Ipc: A61B 5/08 20060101AFI20151104BHEP |
|
| RA4 | Supplementary search report drawn up and despatched (corrected) |
Effective date: 20151112 |
|
| STAA | Information on the status of an ep patent application or granted ep patent |
Free format text: STATUS: EXAMINATION IS IN PROGRESS |
|
| 17Q | First examination report despatched |
Effective date: 20200110 |
|
| STAA | Information on the status of an ep patent application or granted ep patent |
Free format text: STATUS: EXAMINATION IS IN PROGRESS |
|
| GRAP | Despatch of communication of intention to grant a patent |
Free format text: ORIGINAL CODE: EPIDOSNIGR1 |
|
| STAA | Information on the status of an ep patent application or granted ep patent |
Free format text: STATUS: GRANT OF PATENT IS INTENDED |
|
| RIC1 | Information provided on ipc code assigned before grant |
Ipc: G10L 25/30 20130101ALN20221103BHEP Ipc: G16H 50/30 20180101ALI20221103BHEP Ipc: G16H 50/20 20180101ALI20221103BHEP Ipc: G10L 25/66 20130101ALI20221103BHEP Ipc: G06K 9/00 20060101ALI20221103BHEP Ipc: A61B 7/04 20060101ALI20221103BHEP Ipc: A61B 7/00 20060101ALI20221103BHEP Ipc: A61B 5/00 20060101ALI20221103BHEP Ipc: A61B 5/08 20060101AFI20221103BHEP |
|
| INTG | Intention to grant announced |
Effective date: 20221121 |
|
| RAP3 | Party data changed (applicant data changed or rights of an application transferred) |
Owner name: THE UNIVERSITY OF QUEENSLAND |
|
| RIN1 | Information on inventor provided before grant (corrected) |
Inventor name: AMRULLOH, YUSUF, A. Inventor name: SWANKAR, VINAYAK Inventor name: ABEYRATNE, UDANTHA, R. |
|
| GRAS | Grant fee paid |
Free format text: ORIGINAL CODE: EPIDOSNIGR3 |
|
| GRAA | (expected) grant |
Free format text: ORIGINAL CODE: 0009210 |
|
| STAA | Information on the status of an ep patent application or granted ep patent |
Free format text: STATUS: THE PATENT HAS BEEN GRANTED |
|
| AK | Designated contracting states |
Kind code of ref document: B1 Designated state(s): AL AT BE BG CH CY CZ DE DK EE ES FI FR GB GR HR HU IE IS IT LI LT LU LV MC MK MT NL NO PL PT RO RS SE SI SK SM TR |
|
| REG | Reference to a national code |
Ref country code: GB Ref legal event code: FG4D |
|
| REG | Reference to a national code |
Ref country code: CH Ref legal event code: EP |
|
| REG | Reference to a national code |
Ref country code: DE Ref legal event code: R096 Ref document number: 602013083683 Country of ref document: DE |
|
| REG | Reference to a national code |
Ref country code: AT Ref legal event code: REF Ref document number: 1562268 Country of ref document: AT Kind code of ref document: T Effective date: 20230515 |
|
| REG | Reference to a national code |
Ref country code: IE Ref legal event code: FG4D |
|
| P01 | Opt-out of the competence of the unified patent court (upc) registered |
Effective date: 20230602 |
|
| REG | Reference to a national code |
Ref country code: ES Ref legal event code: FG2A Ref document number: 2947765 Country of ref document: ES Kind code of ref document: T3 Effective date: 20230818 |
|
| REG | Reference to a national code |
Ref country code: LT Ref legal event code: MG9D |
|
| REG | Reference to a national code |
Ref country code: NL Ref legal event code: MP Effective date: 20230426 |
|
| REG | Reference to a national code |
Ref country code: AT Ref legal event code: MK05 Ref document number: 1562268 Country of ref document: AT Kind code of ref document: T Effective date: 20230426 |
|
| PG25 | Lapsed in a contracting state [announced via postgrant information from national office to epo] |
Ref country code: NL Free format text: LAPSE BECAUSE OF FAILURE TO SUBMIT A TRANSLATION OF THE DESCRIPTION OR TO PAY THE FEE WITHIN THE PRESCRIBED TIME-LIMIT Effective date: 20230426 |
|
| PG25 | Lapsed in a contracting state [announced via postgrant information from national office to epo] |
Ref country code: SE Free format text: LAPSE BECAUSE OF FAILURE TO SUBMIT A TRANSLATION OF THE DESCRIPTION OR TO PAY THE FEE WITHIN THE PRESCRIBED TIME-LIMIT Effective date: 20230426 Ref country code: PT Free format text: LAPSE BECAUSE OF FAILURE TO SUBMIT A TRANSLATION OF THE DESCRIPTION OR TO PAY THE FEE WITHIN THE PRESCRIBED TIME-LIMIT Effective date: 20230828 Ref country code: NO Free format text: LAPSE BECAUSE OF FAILURE TO SUBMIT A TRANSLATION OF THE DESCRIPTION OR TO PAY THE FEE WITHIN THE PRESCRIBED TIME-LIMIT Effective date: 20230726 Ref country code: AT Free format text: LAPSE BECAUSE OF FAILURE TO SUBMIT A TRANSLATION OF THE DESCRIPTION OR TO PAY THE FEE WITHIN THE PRESCRIBED TIME-LIMIT Effective date: 20230426 |
|
| PG25 | Lapsed in a contracting state [announced via postgrant information from national office to epo] |
Ref country code: RS Free format text: LAPSE BECAUSE OF FAILURE TO SUBMIT A TRANSLATION OF THE DESCRIPTION OR TO PAY THE FEE WITHIN THE PRESCRIBED TIME-LIMIT Effective date: 20230426 Ref country code: PL Free format text: LAPSE BECAUSE OF FAILURE TO SUBMIT A TRANSLATION OF THE DESCRIPTION OR TO PAY THE FEE WITHIN THE PRESCRIBED TIME-LIMIT Effective date: 20230426 Ref country code: LV Free format text: LAPSE BECAUSE OF FAILURE TO SUBMIT A TRANSLATION OF THE DESCRIPTION OR TO PAY THE FEE WITHIN THE PRESCRIBED TIME-LIMIT Effective date: 20230426 Ref country code: LT Free format text: LAPSE BECAUSE OF FAILURE TO SUBMIT A TRANSLATION OF THE DESCRIPTION OR TO PAY THE FEE WITHIN THE PRESCRIBED TIME-LIMIT Effective date: 20230426 Ref country code: IS Free format text: LAPSE BECAUSE OF FAILURE TO SUBMIT A TRANSLATION OF THE DESCRIPTION OR TO PAY THE FEE WITHIN THE PRESCRIBED TIME-LIMIT Effective date: 20230826 Ref country code: HR Free format text: LAPSE BECAUSE OF FAILURE TO SUBMIT A TRANSLATION OF THE DESCRIPTION OR TO PAY THE FEE WITHIN THE PRESCRIBED TIME-LIMIT Effective date: 20230426 Ref country code: GR Free format text: LAPSE BECAUSE OF FAILURE TO SUBMIT A TRANSLATION OF THE DESCRIPTION OR TO PAY THE FEE WITHIN THE PRESCRIBED TIME-LIMIT Effective date: 20230727 |
|
| PG25 | Lapsed in a contracting state [announced via postgrant information from national office to epo] |
Ref country code: FI Free format text: LAPSE BECAUSE OF FAILURE TO SUBMIT A TRANSLATION OF THE DESCRIPTION OR TO PAY THE FEE WITHIN THE PRESCRIBED TIME-LIMIT Effective date: 20230426 |
|
| PG25 | Lapsed in a contracting state [announced via postgrant information from national office to epo] |
Ref country code: SK Free format text: LAPSE BECAUSE OF FAILURE TO SUBMIT A TRANSLATION OF THE DESCRIPTION OR TO PAY THE FEE WITHIN THE PRESCRIBED TIME-LIMIT Effective date: 20230426 |
|
| REG | Reference to a national code |
Ref country code: DE Ref legal event code: R097 Ref document number: 602013083683 Country of ref document: DE |
|
| PG25 | Lapsed in a contracting state [announced via postgrant information from national office to epo] |
Ref country code: SM Free format text: LAPSE BECAUSE OF FAILURE TO SUBMIT A TRANSLATION OF THE DESCRIPTION OR TO PAY THE FEE WITHIN THE PRESCRIBED TIME-LIMIT Effective date: 20230426 Ref country code: SK Free format text: LAPSE BECAUSE OF FAILURE TO SUBMIT A TRANSLATION OF THE DESCRIPTION OR TO PAY THE FEE WITHIN THE PRESCRIBED TIME-LIMIT Effective date: 20230426 Ref country code: RO Free format text: LAPSE BECAUSE OF FAILURE TO SUBMIT A TRANSLATION OF THE DESCRIPTION OR TO PAY THE FEE WITHIN THE PRESCRIBED TIME-LIMIT Effective date: 20230426 Ref country code: EE Free format text: LAPSE BECAUSE OF FAILURE TO SUBMIT A TRANSLATION OF THE DESCRIPTION OR TO PAY THE FEE WITHIN THE PRESCRIBED TIME-LIMIT Effective date: 20230426 Ref country code: DK Free format text: LAPSE BECAUSE OF FAILURE TO SUBMIT A TRANSLATION OF THE DESCRIPTION OR TO PAY THE FEE WITHIN THE PRESCRIBED TIME-LIMIT Effective date: 20230426 Ref country code: CZ Free format text: LAPSE BECAUSE OF FAILURE TO SUBMIT A TRANSLATION OF THE DESCRIPTION OR TO PAY THE FEE WITHIN THE PRESCRIBED TIME-LIMIT Effective date: 20230426 |
|
| PLBE | No opposition filed within time limit |
Free format text: ORIGINAL CODE: 0009261 |
|
| STAA | Information on the status of an ep patent application or granted ep patent |
Free format text: STATUS: NO OPPOSITION FILED WITHIN TIME LIMIT |
|
| 26N | No opposition filed |
Effective date: 20240129 |