EP2821824B1 - Multicore optical fiber - Google Patents
Multicore optical fiber Download PDFInfo
- Publication number
- EP2821824B1 EP2821824B1 EP13754922.6A EP13754922A EP2821824B1 EP 2821824 B1 EP2821824 B1 EP 2821824B1 EP 13754922 A EP13754922 A EP 13754922A EP 2821824 B1 EP2821824 B1 EP 2821824B1
- Authority
- EP
- European Patent Office
- Prior art keywords
- core
- cores
- wavelength
- relation
- eff
- Prior art date
- Legal status (The legal status is an assumption and is not a legal conclusion. Google has not performed a legal analysis and makes no representation as to the accuracy of the status listed.)
- Active
Links
Images


Classifications
-
- G—PHYSICS
- G02—OPTICS
- G02B—OPTICAL ELEMENTS, SYSTEMS OR APPARATUS
- G02B6/00—Light guides; Structural details of arrangements comprising light guides and other optical elements, e.g. couplings
- G02B6/02—Optical fibres with cladding with or without a coating
- G02B6/02042—Multicore optical fibres
-
- G—PHYSICS
- G02—OPTICS
- G02B—OPTICAL ELEMENTS, SYSTEMS OR APPARATUS
- G02B6/00—Light guides; Structural details of arrangements comprising light guides and other optical elements, e.g. couplings
- G02B6/02—Optical fibres with cladding with or without a coating
- G02B6/02214—Optical fibres with cladding with or without a coating tailored to obtain the desired dispersion, e.g. dispersion shifted, dispersion flattened
- G02B6/02219—Characterised by the wavelength dispersion properties in the silica low loss window around 1550 nm, i.e. S, C, L and U bands from 1460-1675 nm
- G02B6/02266—Positive dispersion fibres at 1550 nm
-
- G—PHYSICS
- G02—OPTICS
- G02B—OPTICAL ELEMENTS, SYSTEMS OR APPARATUS
- G02B6/00—Light guides; Structural details of arrangements comprising light guides and other optical elements, e.g. couplings
- G02B6/02—Optical fibres with cladding with or without a coating
- G02B6/028—Optical fibres with cladding with or without a coating with core or cladding having graded refractive index
- G02B6/0283—Graded index region external to the central core segment, e.g. sloping layer or triangular or trapezoidal layer
- G02B6/0285—Graded index layer adjacent to the central core segment and ending at the outer cladding index
-
- G—PHYSICS
- G02—OPTICS
- G02B—OPTICAL ELEMENTS, SYSTEMS OR APPARATUS
- G02B6/00—Light guides; Structural details of arrangements comprising light guides and other optical elements, e.g. couplings
- G02B6/02—Optical fibres with cladding with or without a coating
- G02B6/02004—Optical fibres with cladding with or without a coating characterised by the core effective area or mode field radius
- G02B6/02009—Large effective area or mode field radius, e.g. to reduce nonlinear effects in single mode fibres
- G02B6/02014—Effective area greater than 60 square microns in the C band, i.e. 1530-1565 nm
- G02B6/02019—Effective area greater than 90 square microns in the C band, i.e. 1530-1565 nm
-
- G—PHYSICS
- G02—OPTICS
- G02B—OPTICAL ELEMENTS, SYSTEMS OR APPARATUS
- G02B6/00—Light guides; Structural details of arrangements comprising light guides and other optical elements, e.g. couplings
- G02B6/02—Optical fibres with cladding with or without a coating
- G02B6/036—Optical fibres with cladding with or without a coating core or cladding comprising multiple layers
- G02B6/03616—Optical fibres characterised both by the number of different refractive index layers around the central core segment, i.e. around the innermost high index core layer, and their relative refractive index difference
- G02B6/03638—Optical fibres characterised both by the number of different refractive index layers around the central core segment, i.e. around the innermost high index core layer, and their relative refractive index difference having 3 layers only
- G02B6/0365—Optical fibres characterised both by the number of different refractive index layers around the central core segment, i.e. around the innermost high index core layer, and their relative refractive index difference having 3 layers only arranged - - +
Definitions
- the present invention relates to a multi-core optical fiber.
- a multi-core optical fiber with a plurality of cores extending along the fiber axis (center axis) in a common cladding is expected as an optical transmission line that can transmit a large volume of information.
- a variety of studies have been conducted for the purpose of transmitting a larger volume of information (e.g., cf. Non Patent Literatures 1 to 7).
- Non Patent Literatures 2 to 5 disclose the studies to increase the effective area (A eff ) of the multi-core optical fiber.
- Non Patent Literature 1 discloses MCFs reducing transmission loss and crosstalk
- Non Patent Literature 6 discloses MFCs reducing crosstalk between cores.
- OSNR optical signal-to-noise ratio
- Non Patent Literature 7 describes the study on an improvement in OSNR in a single-core optical fiber.
- US 2011/206331 A1 discloses a multi-core optical fibre including a plurality of core portions.
- the Inventor conducted the research on the conventional multi-core optical fibers and found the problem as described below. Namely, the transmission capacity in each core in the multi-core optical fiber was studied without consideration to influence of crosstalk as noise and was not satisfactorily large when compared to the transmission capacity of one core in the conventional single-core optical fibers.
- the present invention has been accomplished in view of the above circumstances and it is an object of the present invention to provide a multi-core optical fiber with a plurality of cores having their respective increased transmission capacities.
- a multi-core optical fiber in accordance with the present invention is defined in claim 1.
- Dependent claims relate to preferred embodiments.
- the present invention provides the multi-core optical fibers with increased transmission capacities in the respective cores.
- Fig. 1 is a drawing showing a cross-sectional configuration of a multi-core optical fiber 100 (7-core fiber) including seven cores, as an example of the multi-core optical fiber according to the present embodiment.
- Fig. 2 is a refractive index profile of each core 110 and its surrounding region.
- the multi-core optical fiber 100 of the example shown in Fig. 1 includes seven cores 110 and each of these cores 110 has a structure surrounded by a common cladding 140 (which will be referred to hereinafter simply as cladding) having a refractive index lower than each core 110.
- a trench layer 130 having a refractive index lower than the cladding 140 is provided between an outer peripheral surface of each core 110 and the cladding 140, and an inner cladding layer 120 having a refractive index higher than the trench layer 130 and lower than each core 110 is provided between the outer peripheral surface of each core 110 and the trench layer 130.
- Each core 110 has an outside diameter 2a
- the inner cladding layer 120 has an outside diameter 2b
- the trench layer 130 has an outside diameter 2c.
- the inner cladding layer 120 and the trench layer 130 have a ring-like cross-sectional shape, as shown in Fig. 1 , and their respective outside diameters are defined by diameters of their outside contours.
- a ratio Ra of the outside diameter 2a of each core 110 to the outside diameter 2b of the inner cladding layer 120 is given by a/b
- a ratio Rb of the outside diameter 2b of the inner cladding layer 120 to the outside diameter 2c of the trench layer 130 by b/c.
- a distance ⁇ (core pitch) between neighboring cores between which crosstalk can occur is defined by a center-to-center distance between the neighboring cores.
- Fig. 2 is the index profile of each core 110 and its surrounding region shown in Fig. 1 , which shows the refractive indices of the respective parts on a line L in Fig. 1 .
- This index profile 150 is separated into region 151 corresponding to the core 110, region 152 corresponding to the inner cladding layer 120, region 153 corresponding to the trench layer 130, and region 154 corresponding to the cladding 140.
- Relative index differences with respect to a reference refractive index, of the respective parts of core 110, inner cladding layer 120, trench layer 130, and cladding 140 are represented by ⁇ 1, ⁇ 2, ⁇ 3, and ⁇ 4, respectively.
- the multi-core optical fiber 100 is a transmission medium with an increased transmission capacity of each core 110, and the below will first describe problems in the conventional multi-core optical fibers.
- a multi-core fiber For increasing the transmission capacity of a multi-core fiber (MCF), it is necessary to increase the number of embedded cores or to increase the transmission capacities of the individual cores embedded in the MCF.
- SNR signal-to-noise ratio
- For increasing the transmission capacities of the individual cores embedded in the MCF it is necessary to increase a signal-to-noise ratio (SNR) of signal light after propagation through each core and thereby allow increase in modulation order.
- SNR signal-to-noise ratio
- a countermeasure against it is to increase the effective area A eff or to use a material with a small non-linear refractive index n 2 , thereby reducing the non-linearity of the core. By this, the noise due to the non-linear phenomena can be suppressed even with incidence of signal light of greater intensity.
- the core-to-core crosstalk (XT) is considered to be noise, which has not been taken into consideration heretofore, and the SNR of a certain core (a core with the largest XT to that core/first core) in the MCF can be expressed by Expressions (105), (106) below.
- SNR MC P Tx , ch ⁇ P TX P ASE
- B n R s + P NLI
- B n R s + P TX ⁇ P Tx , ch P ASE
- B n R s + P NLI
- ⁇ nm is a power coupling coefficient per unit length from core m to core n.
- Expressions (110), (111), the interior of the In() term includes fiber-related parameters, system parameters, and so on, but, with a sufficiently large WDM band (N ch R s ), a small parameter change will cause little change in SNR and is thus negligible.
- Expression (110) can be rearranged like Expression (112).
- C system herein is a constant not related to the parameters of the optical fiber (including the system parameters and the ln() term).
- ASNR SC a difference (ASNR SC ) of SNR SC,max [dB] between different SC fibers can be approximately calculated using Expression (112).
- ASNR SC is obtained by canceling out all the system parameters except for L s and the difference (ASNR SC ) of maximum SNR of the system due to the difference of fibers can be expressed by only the fiber parameters.
- SNR MC,max [dB] cannot be rearranged into a simple expression like Expression (112), but it can be confirmed from Expression (111) that ⁇ SNR MC is independent of N s (which is canceled out during the calculation).
- *2 21 ps/(nm ⁇ km) assumed in calculation.
- *3 value directly calculated from total average crosstalk to the center core.
- *4 Since XT-related values were values not subjected to statistical averaging (wavelength averaging), the calculation was conducted on the assumption that ⁇ X between two adjacent cores was the median of dB values of XT between two adjacent cores.
- *5 the medium among all cores. **n 2 : 2.2 ⁇ 10 -20 m 2 /W assumed for PSCF, and 2.34 ⁇ 10 -20 m 2 /W assumed for Ge-doped fiber.
- dash-dotted lines represent contours of SNR penalty due to XT (SNR SC /SNR MC , Expression (107b))
- solid lines represent contours of SNR improvement ⁇ SNR MC with respect to the standard SMF, of individual cores in each MCF with consideration to XT.
- Rhombic marks represent correspondences between "SNR SC,max after propagation through one span (on the vertical axis)" and " ⁇ X,WC after propagation through one span (on the horizontal axis)" of the respective fibers described in Table 2.
- Fig. 92 suggests the following points.
- Expression (113) needs to be satisfied, in order to keep SNR penalty [dB] as the SNR penalty due to XT in a specific range, i.e., in the range of SNR penality,min [dB] ⁇ SNR penalty [dB] ⁇ SNR penalty,max [dB].
- SNR SC -1 is a ratio of ASE and non-linear noise to signal.
- C penalty herein takes the values shown in Table 3 for some values of SNR penalty [dB].
- System parameter dependences of SNR SC,max [dB] in the standard SMF are as provided in Table 4.
- the dependence on F dB is approximately -(2/3)F dB and the dependence on L s approximately -(2/3) ⁇ dB L s .
- the dependence on N ch R s (WDM band) can be approximated to about -0.27ln(N ch R s ) and the influence thereof is found to be little.
- SNR penalty [dB] is more preferably not more than at least 1 dB, still more preferably not more than 0.5 dB, and yet more preferably not more than 0.1 dB.
- SNR penalty [dB] is preferably not less than 0.02 dB, more preferably not less than 0.03 dB, and still more preferably not less than 0.05 dB.
- Expression (A2) below is preferably to be satisfied, in order to keep SNR penalty [dB] not less than 0.05 dB and not more than 1 dB.
- SNR penalty [dB] not less than 0.05 dB and not more than 1 dB.
- Expression (A3) below is preferably to be satisfied, in order to keep SNR penalty [dB] not less than 0.05 dB and not more than 0.5 dB.
- SNR penalty [dB] not less than 0.05 dB and not more than 0.5 dB.
- ⁇ X,WC after 80 km propagation is preferably not more than at least -33.9 dB, more preferably not more than -37.2 dB, and still more preferably not more than -44.4 dB, in order to prevent the degradation of SNR due to XT.
- NF of EDFA is considered to be 3 dB
- ⁇ X,WC after 80 km propagation is preferably not more than at least -35.9 dB, more preferably not more than -39.2 dB, and still more preferably not more than -46.4 dB.
- ⁇ X,WC after at least 80 km propagation is preferably not less than -51.4 dB, more preferably not less than -49.6 dB, and still more preferably not less than -47.4 dB.
- ⁇ X,WC after at least 80 km propagation is preferably not less than -53.4 dB, more preferably not less than -51.6 dB, and still more preferably not less than -49.4 dB.
- SNR penalty [dB] is more preferably not more than at least 2 dB, still more preferably not more than 1 dB, yet more preferably not more than 0.5 dB, and yet still more preferably not more than 0.1 dB.
- ⁇ X,WC after 80 km propagation is preferably not more than at least -32.9 dB, more preferably not more than -36.4 dB, still more preferably not more than -39.7 dB, and yet more preferably not more than -46.9 dB.
- ⁇ X,WC after 80 km propagation is preferably not more than at least -33.6 dB, more preferably not more than -37.1 dB, still more preferably not more than -40.4 dB, and yet more preferably not more than -47.6 dB.
- ⁇ X,WC after at least 80 km propagation is preferably not less than -53.9 dB, more preferably not less than -52.2 dB, and still more preferably not less than -49.9 dB.
- ⁇ X,WC after at least 80 km propagation is preferably not less than -54.6 dB, more preferably not less than -52.8 dB, and still more preferably not less than -50.6 dB.
- SNR MC max
- the effective area A eff achieved in the multi-core optical fibers is at most in the level of 110 ⁇ M 2 and the transmission loss in that case is about 0.2 dB/km.
- K. Imamura et al. "Trench Assisted Multi-Core Fiber with Large Aeff over 100 ⁇ m2 and Low Attenuation Loss," ECOC2011, paper Mo. 1. LeCervin. 1 . (Non-Patent Literature 2)" and “ K. Takenaga et al., "A Large Effective Area Multi-Core Fibre with an Optimised Cladding Thickness ,” (Non-Patent Literature 3).”
- Hayashi et al. "Design and Fabrication of Ultra-Low-Crosstalk and Low-Loss Multi-Core Fber," Optics Express, vol. 19, no. 17, pp.16576-16592 (2011 ).” realized the low transmission loss (0.175 to 0.181 dB/km), but A eff in that case is about 80 ⁇ m 2 .
- the MCF for increasing the transmission capacity per MCF, it is preferable to achieve both of A eff of not less than at least 120 ⁇ m 2 and the low transmission loss equal to or less than at least that of the standard single-mode fiber, in the MCF, and thereby to improve the transmission capacity of each individual core in the MCF to a level equivalent to that of the single-core low-nonlinearity optical fiber described in Reference Literature 2.
- the absolute value of chromatic dispersion D is also preferably set as large as possible, for the improvement in transmission capacity, and it is more preferable to realize the chromatic dispersion (approximately 17 ps/nm/km or more at the wavelength of 1550 nm) larger than that of the standard single-mode optical fiber, simultaneously with the increase of A eff and the low transmission loss.
- the chromatic dispersion is more preferably realized in the range of not less than about 20 ps/nm/km closer to the material dispersion of silica glass if possible.
- the properties of the cores are preferably as uniform as possible, and differences of transmission losses among the cores of MCF, including dispersion of transmission losses among the cores due to manufacturing dispersion and the transmission loss differences due to the aforementioned differences of core positions, are preferably controlled to not more than at most 0.02 dB/km at the wavelength of 1550 nm.
- a value of crosstalk from a first core to a second core out of a plurality of cores forming an MCF can be determined as follows: light is injected into the first core from one end face of the MCF, an emission power from the first core and an emission power from the second core are measured at the other end face, and a ratio is calculated as the crosstalk value by dividing the emission power from the second core by the emission power from the first core. Since the crosstalk of MCF has statistical dispersion, an average of statistical dispersion of crosstalk can be obtained by measuring a spectrum of crosstalk with wavelength sweeping of a light source during the measurement and obtaining an average thereof, or, by performing time-averaged measurement with a broadband light source. When the crosstalk is simply referred to hereinafter, it means the average of statistical dispersion of crosstalk.
- an MCF for example, a 7-core fiber consisting of a center core and six peripheral cores arranged as cores on the hexagonal lattice.
- the crosstalk to the center core from the six peripheral cores is approximately 6 ⁇ L, and, in order to keep 6 ⁇ L not more than 0.01 after 100 km propagation, the relation of Expression (7) below needs to be satisfied.
- ⁇ 2 ⁇ 2 ⁇ R ⁇ ⁇ 1 6 10 ⁇ 7 ⁇ 2 ⁇ ⁇ ⁇ R 1 12 10 ⁇ 7
- the fiber bending radius R is assumed to be not less than at least 0.1 m. Therefore, for keeping 6 ⁇ L not more than 0.01 in the MCF, at least the relation of Expression (9) needs to be satisfied. ⁇ 2 ⁇ ⁇ ⁇ 12 10 ⁇ 6
- the core pitch needs to be not less than at least ⁇ th in Fig. 4 , in order to enable the transmission over the length of 100 km while keeping the crosstalk (XT) not more than 0.01 in the C-band (1530-1565 nm).
- the cutoff wavelength ⁇ CC is preferably set as long as possible.
- Fig. 5 shows relations between ⁇ CC and ⁇ th at 1550 nm, 1565 nm, and 1625 nm, in the case where the effective area A eff is fixed at 80 ⁇ m 2 . It is shown by Fig. 5 that ⁇ th can be made smaller with increase of ⁇ CC .
- ⁇ CC is preferably not more than 1460 nm and is preferably a wavelength as long as possible.
- ⁇ CC is not less than 1360 nm
- the cores in a trench type structure with properties of (1) to (4), having (1) a core part in a central region, (2) a cladding with a refractive index lower than the core part, around the core part, (3) a trench layer with a refractive index lower than the cladding, between the core part and the cladding, and (4) an inner cladding layer with a refractive index higher than the trench layer and lower than the core part, between the trench layer and the core part, because it can enhance the confinement of light of the fundamental mode in the cores with an assist of the trench layer and ⁇ th can be made smaller in the relation of A eff and ⁇ th and the relation of ⁇ CC and ⁇ th .
- ⁇ 1 (%) as a relative index difference of the core part with reference to a certain refractive index n 0
- ⁇ 2 (%) as a relative index difference of the inner cladding layer with respect to the refractive index n 0
- ⁇ 3 (%) as a relative index difference of the trench layer with respect to the refractive index n 0
- ⁇ 4 (%) as a relative index difference of the cladding with respect to the refractive index n 0
- 2a an outside diameter of the core part
- 2b an outside diameter of the inner cladding layer
- 2c as an outside diameter of the trench layer
- Ra a/b
- Rb b/c.
- fluorine or the like is added to make the refractive indices of the inner cladding layer, trench layer, and cladding smaller than that of the pure silica core.
- an excessively large change of refractive index due to fluorine doping is not preferred for stable and low-cost manufacture.
- An example of a condition to enable stable and low-cost manufacture of pure silica core fiber to realize a low transmission loss is that ⁇ 1 - ⁇ 3 is not more than about 0.81%.
- the core of the pure silica core fiber herein is preferably comprised of pure silica glass or preferably comprised of a silica glass containing C1 less than 2000 molppm, F not less than 2000 molppm and not more than 10000 molppm, and A 2 O (A is an alkali element) not less than 1 molppm and not more than 10000 molppm.
- the pure silica glass herein contains Cl not less than 2000 molppm and not more than 20000 molppm which is added during a dehydration process in manufacture.
- the alkali element of A 2 O is preferably Na, K, Rb, or Cs.
- the legends are values of ⁇ 2 - ⁇ 4, and six types were set in the range of -0.05% to 0.05%, each of which was investigated.
- ⁇ 2 - ⁇ 4 causes little influence on ⁇ th .
- Fig. 6B for the case of ⁇ CC 1530 nm, the larger Ra, the smaller ⁇ th ; therefore, it is preferable to set Ra in the range of 0.6 to 1.
- Ra is not more than 0.6
- ⁇ th tends to increase with decrease of Ra; particularly, when Ra is below 0.5, the slopes of the graphs become larger and therefore it is preferable to set Ra not less than at least 0.5.
- each of the figures include graphs where Ra is 0.4, 0.5, 0.6, and 0.7.
- a blue line indicates ⁇ th at the wavelength of 1625 nm in the case of the step-index type core with equal A eff and ⁇ CC and a green line ⁇ th at the wavelength of 1625 nm in the case of the step-index type core with A eff of 80 ⁇ m 2 and equal ⁇ CC .
- Concerning Ra, ⁇ th tends to decrease slightly with increase of Ra, but it is not a significant dependence. In contrast to it, the dependence on ⁇ 3 - ⁇ 4 is dominant, and it is shown from Fig. 7 that ⁇ th decreases with decrease in ⁇ 3 - ⁇ 4 (or with increase in depth ⁇ of the trench layer relative to the cladding).
- ⁇ th is preferably smaller than at least those of the step-index type cores shown in Fig. 4 .
- ⁇ th is always smaller than in the case of the step-index type cores as long as the cores are the trench type cores.
- ⁇ th becomes smaller than in the case of the step-index type core with equal A eff and ⁇ CC
- ⁇ th becomes smaller than in the case of the step-index type core with equal A eff and ⁇ CC .
- ⁇ th becomes smaller than in the case of the step-index type core with equal A eff and ⁇ CC .
- ⁇ th can be larger than in the case of the step-index type core with equal A eff and ⁇ CC , depending upon design.
- Ra when Ra is considered to be in the range of not less than about 0.5, one has to satisfy the conditions that ⁇ 3 - ⁇ 4 is not more than about -0.53% and ⁇ 1 - ⁇ 4 is not more than about 0.28%; or, when Ra is considered to be in the range of not less than about 0.6, one has to satisfy the conditions that ⁇ 3 - ⁇ 4 is not more than about -0.51% and ⁇ 1 - ⁇ 4 is not more than about 0.30%.
- Ra 7B are as follows: when Ra is considered to be in the range of not less than about 0.5, it is preferable to satisfy the conditions that ⁇ 3 - ⁇ 4 is not more than about -0.57% and ⁇ 1 - ⁇ 4 is not more than about 0.24%; or, when Ra is considered to be in the range of not less than about 0.6, it is preferable to satisfy the conditions that ⁇ 3 - ⁇ 4 is not more than about -0.56% and ⁇ 1 - ⁇ 4 is not more than about 0.25%.
- Examples of more specific design include structures of (i) to (iii) below.
- a eff is about 130 ⁇ m 2
- ⁇ CC is about from 1460 to 1480 nm
- ⁇ th is 43.3 ⁇ m at the wavelength of 1565 nm and 45.2 ⁇ m at the wavelength of 1625 nm.
- the chromatic dispersion at the wavelength of 1550 nm is about 23 ps/nm/km.
- a eff is about 130 ⁇ m 2
- ⁇ CC is about from 1490 to 1520 nm
- ⁇ th is 34.9 ⁇ m at the wavelength of 1565 nm and 36.6 ⁇ m at the wavelength of 1625 nm.
- the chromatic dispersion at the wavelength of 1550 nm is about 23 ps/nm/km.
- a eff is about 130 ⁇ m 2
- ⁇ CC is about from 1430 to 1440 nm
- ⁇ th is 38.7 ⁇ m at the wavelength of 1565 nm and 40.7 ⁇ m at the wavelength of 1625 nm.
- the chromatic dispersion at the wavelength of 1550 nm is about 23 ps/nm/km.
- the certain refractive index n 0 may be the refractive index of pure silica or may be any other refractive index.
- a preferred structure is also one satisfying structure (i. 1):
- Fig. 15 is a drawing showing the relation between 2a and A eff ;
- Fig. 16 a drawing showing the relation between Ra and A eff ;
- Fig. 17 a drawing showing the relation between 1/Rb and A eff ;
- Fig. 18 a drawing showing the relation between ⁇ 1 and A eff ;
- Fig. 19 a drawing showing the relation between ⁇ 2 and A eff ;
- Fig. 20 a drawing showing the relation between ⁇ 3 and A eff ;
- Fig. 21 a drawing showing the relation between ⁇ 4 and A eff . It is found from these results that the necessary conditions for satisfying A eff ⁇ 120 ⁇ m 2 are
- the normalized bending loss herein refers to a value obtained by dividing a bending loss per 100 turns (dB/100 turns) in the bending radius of 30 mm at the wavelength 1625 nm, by 0.5 dB. If it is 1 or less, the bending loss per 100 turns becomes 0.5 dB/100 turns or less.
- Fig. 22 is a drawing showing the relation between 2a and normalized bending loss; Fig. 23 a drawing showing the relation between Ra and normalized bending loss; Fig. 24 a drawing showing the relation between 1/Rb and normalized bending loss; Fig. 25 a drawing showing the relation between ⁇ 1 and normalized bending loss; Fig. 26 a drawing showing the relation between ⁇ 2 and normalized bending loss; Fig. 27 a drawing showing the relation between ⁇ 3 and normalized bending loss; Fig. 28 a drawing showing the relation between ⁇ 4 and normalized bending loss. It is found from these results that the necessary conditions for the bending loss per 100 turns in the bending radius of 30 mm at the wavelength of 1625 nm to satisfy 0.5 dB/100 turns or less are as follows:
- the chromatic dispersion at the wavelength of 1550 nm is preferably a value over at least 20 ps/nm/km.
- the structure satisfying the structure (i. 1) is preferred.
- the major factor for the transmission loss is Rayleigh scattering, and the transmission loss due to Rayleigh scattering can be calculated from a distribution of Rayleigh scattering coefficients (Rayleigh scattering coefficients of materials) in the cross section of MCF and a power distribution of propagation modes. It is, however, confirmed by calculation that the transmission loss due to Rayleigh scattering at the wavelength of 1550 nm in the case of the structure (i. 1) is smaller than that in the core structure described in "T. Ayashi et al. (non-patent literature first cited in paragraph 78 as a particularly relevant document)" realizing 0.181 dB/km or less.
- Fig. 29 is a drawing showing the relation between 2a and ⁇ th ;
- Fig. 30 a drawing showing the relation between Ra and ⁇ th ;
- Fig. 31 a drawing showing the relation between 1/Rb and ⁇ th ;
- Fig. 32 a drawing showing the relation between ⁇ 1 and ⁇ th ;
- a preferred structure is also one satisfying structure (ii. 1):
- Fig. 36 is a drawing showing the relation between 2a and ⁇ CC ;
- Fig. 37 a drawing showing the relation between Ra and ⁇ CC
- Fig. 38 a drawing showing the relation between 1/Rb and ⁇ CC ;
- Fig. 39 a drawing showing the relation between ⁇ 1 and ⁇ CC ;
- Fig. 36 is a drawing showing the relation between 2a and ⁇ CC ;
- Fig. 37 a drawing showing the relation between Ra and ⁇ CC ,
- Fig. 38 a drawing showing the relation between 1/Rb and ⁇ CC ;
- Fig. 39 a drawing
- Fig. 43 is a drawing showing the relation between 2a and A eff ;
- Fig. 44 a drawing showing the relation between Ra and A eff ;
- Fig. 45 shows the relation between 1/Rb and A eff ;
- Fig. 46 a drawing showing the relation between ⁇ 1 and A eff ;
- Fig. 47 a drawing showing the relation between ⁇ 2 and A eff ;
- Fig. 48 a drawing showing the relation between ⁇ 3 and A eff ;
- Fig. 49 a drawing showing the relation between ⁇ 4 and A eff . It is found from these results that the necessary conditions for satisfying A eff ⁇ 120 ⁇ m 2 are as follows:
- the normalized bending loss herein refers to a value obtained by dividing a bending loss per 100 turns (dB/100 turns) in the bending radius of 30 mm at the wavelength 1625 nm, by 0.5 dB. If it is 1 or less, the bending loss per 100 turns becomes 0.5 dB/100 turns or less.
- Fig. 50 is a drawing showing the relation between 2a and normalized bending loss; Fig. 51 a drawing showing the relation between Ra and normalized bending loss; Fig. 52 a drawing showing the relation between 1/Rb and normalized bending loss; Fig. 53 a drawing showing the relation between ⁇ 1 and normalized bending loss; Fig. 54 a drawing showing the relation between ⁇ 2 and normalized bending loss; Fig. 55 a drawing showing the relation between ⁇ 3 and normalized bending loss; Fig. 56 a drawing showing the relation between ⁇ 4 and normalized bending loss. It is found from these results that the necessary conditions for the bending loss per 100 turns in the bending radius of 30 mm at the wavelength of 1625 nm to satisfy 0.5 dB/100 turns or less are as follows:
- the structure (ii. 1) is one calculated in view of the above results.
- the chromatic dispersion at the wavelength of 1550 nm is preferably a value over at least 20 ps/nm/km.
- the transmission loss due to Rayleigh scattering at the wavelength of 1550 nm in the case of the structure (ii. 1) is smaller than that in the core structure of Reference Literature 5 realizing 0.181 dB/km or less, and it is thus preferable to adopt a structure satisfying the structure (ii. 1).
- Fig. 57 is a drawing showing the relation between 2a and ⁇ th ; Fig. 58 a drawing showing the relation between Ra and ⁇ th ; Fig. 59 a drawing showing the relation between 1/Rb and ⁇ th ; Fig. 60 a drawing showing the relation between ⁇ 1 and ⁇ th ; Fig. 61 a drawing showing the relation between ⁇ 2 and ⁇ th ; Fig. 62 a drawing showing the relation between ⁇ 3 and ⁇ th ; Fig. 63 a drawing showing the relation between ⁇ 4 and ⁇ th . Since it is found from these results that the condition for keeping ⁇ th not more than about 44.9 ⁇ m is: Rb ⁇ 0.777, it is more preferable to adopt a structure satisfying structure (ii. 2):
- Fig. 64 is a drawing showing the relation between 2a and ⁇ CC ;
- Fig. 65 a drawing showing the relation between Ra and ⁇ CC ;
- Fig. 66 a drawing showing the relation between 1/Rb and ⁇ CC ;
- Fig. 67 a drawing showing the relation between ⁇ 1 and ⁇ CC ;
- Fig. 64 is a drawing showing the relation between 2a and ⁇ CC ;
- Fig. 65 a drawing showing the relation between Ra and ⁇ CC ;
- Fig. 66 a drawing showing the relation between 1/Rb and ⁇ CC ;
- Fig. 71 is a drawing showing the relation between 2a and A eff ;
- Fig. 72 a drawing showing the relation between Ra and A eff ;
- Fig. 73 a drawing showing the relation between 1/Rb and A eff ;
- Fig. 74 a drawing showing the relation between ⁇ 1 and A eff ;
- Fig. 75 a drawing showing the relation between ⁇ 2 and A eff ;
- Fig. 76 a drawing showing the relation between ⁇ 3 and A eff ;
- Fig. 77 a drawing showing the relation between ⁇ 4 and A eff . It is confirmed from these results that the necessary conditions for satisfying A eff
- the normalized bending loss herein refers to a value obtained by dividing a bending loss per 100 turns (dB/100 turns) in the bending radius of 30 mm at the wavelength of 1625 nm, by 0.5 dB. If it is 1 or less, the bending loss per 100 turns becomes 0.5 dB/100 turns or less.
- Fig. 78 is a drawing showing the relation between 2a and normalized bending loss; Fig. 79 a drawing showing the relation between Ra and normalized bending loss; Fig. 80 a drawing showing the relation between 1/Rb and normalized bending loss; Fig. 81 a drawing showing the relation between ⁇ 1 and normalized bending loss; Fig. 82 a drawing showing the relation between ⁇ 2 and normalized bending loss; Fig. 83 a drawing showing the relation between ⁇ 3 and normalized bending loss; Fig. 84 a drawing showing the relation between ⁇ 4 and normalized bending loss. It is confirmed from these results that the necessary conditions for the bending loss per 100 turns in the bending radius of 30 mm at the wavelength of 1625 nm to satisfy 0.5 dB/100 turns or less are as follows:
- the chromatic dispersion at the wavelength of 1550 nm is preferably a value over at least 20 ps/nm/km.
- the transmission loss due to Rayleigh scattering at the wavelength of 1550 nm in the case of the structure (iii. 1) is smaller than that in the core structure described in Reference Literature 5 realizing 0.181 dB/km or less, and it is thus preferable to adopt a structure satisfying the structure (iii. 1).
- Fig. 85 is a drawing showing the relation between 2a and ⁇ th ; Fig. 86 a drawing showing the relation between Ra and ⁇ th ; Fig. 87 a drawing showing the relation between 1/Rb and ⁇ th ; Fig. 88 a drawing showing the relation between ⁇ 1 and ⁇ th ; Fig. 89 a drawing showing the relation between ⁇ 2 and ⁇ th ; Fig. 90 a drawing showing the relation between ⁇ 3 and ⁇ th ; Fig. 91 a drawing showing the relation between ⁇ 4 and ⁇ th . It is confirmed from these results that the necessary condition for ⁇ th to satisfy about 45.8 ⁇ m or less is as follows: ⁇ 3 (%) ⁇ -0.30.
- 100 multi-core optical fiber 110 core; 120 inner cladding layer; 130 trench layer; 140 cladding layer.
Landscapes
- Physics & Mathematics (AREA)
- Chemical & Material Sciences (AREA)
- Dispersion Chemistry (AREA)
- General Physics & Mathematics (AREA)
- Optics & Photonics (AREA)
- Optical Communication System (AREA)
- Lasers (AREA)
Description
- The present invention relates to a multi-core optical fiber.
- A multi-core optical fiber with a plurality of cores extending along the fiber axis (center axis) in a common cladding is expected as an optical transmission line that can transmit a large volume of information. On the multi-core optical fiber of this kind, a variety of studies have been conducted for the purpose of transmitting a larger volume of information (e.g., cf.
Non Patent Literatures 1 to 7). - For increasing the transmission capacity of the multi-core optical fiber (MCF), it is necessary to increase the number of cores forming the multi-core optical fiber or to increase the transmission capacity of each of the individual cores forming the multi-core optical fiber. As methods of the latter,
Non Patent Literatures 2 to 5 disclose the studies to increase the effective area (Aeff) of the multi-core optical fiber.Non Patent Literature 1 discloses MCFs reducing transmission loss and crosstalk, andNon Patent Literature 6 discloses MFCs reducing crosstalk between cores. It is also necessary to investigate an improvement in optical signal-to-noise ratio (OSNR) of signal light after propagation through the cores, for increase in the transmission capacity of each of the individual cores embedded in the MCF.Non Patent Literature 7 describes the study on an improvement in OSNR in a single-core optical fiber.
US 2011/206331 A1 discloses a multi-core optical fibre including a plurality of core portions. -
- Non Patent Literature 1: J. Lightwave Technol., Vol. 30, No. 4, pp. 583-589, Feb. 2012.
- Non Patent Literature 2: ECOC2011, p. Mo. 1 .LeCervin. 1.
- Non Patent Literature 3: Opt. Express, Vol. 19, No. 26, pp. B543-B550, Nov. 2011.
- Non Patent Literature 4: Opt. Lett., Vol. 36, No. 23, pp. 4626-4628, Dec. 2011.
- Non Patent Literature 5: OFC2012, p. OM2D.5.
- Non Patent Literature 6: Opt. Express, Vol. 20. No. 9, pp. 10100-10105, Apr. 2012.
- Non Patent Literature 7: OFC2011, paper OWA6.
- The Inventor conducted the research on the conventional multi-core optical fibers and found the problem as described below. Namely, the transmission capacity in each core in the multi-core optical fiber was studied without consideration to influence of crosstalk as noise and was not satisfactorily large when compared to the transmission capacity of one core in the conventional single-core optical fibers.
- The present invention has been accomplished in view of the above circumstances and it is an object of the present invention to provide a multi-core optical fiber with a plurality of cores having their respective increased transmission capacities.
- A multi-core optical fiber in accordance with the present invention is defined in
claim 1. Dependent claims relate to preferred embodiments. - The present invention provides the multi-core optical fibers with increased transmission capacities in the respective cores.
-
-
Fig. 1 is a drawing showing an example of a cross-sectional structure of a multi-core optical fiber according to an embodiment of the present invention; -
Fig. 2 is a refractive index profile of each core and its peripheral region; -
Fig. 3 is a drawing showing relations among Aeff, A, and h at the wavelength of 1565 nm, where the cable cutoff wavelength (λCC) is fixed at 1530 nm, with identical-core type MCFs (R = 1 (m)) of step-index type cores; -
Fig. 4 is relations between Aeff and Λth at the wavelengths of the legends, where the cable cutoff wavelength (λCC) is fixed at 1530 nm, with identical-core type MCFs (R = 0.1 (m)) of step-index type cores; -
Fig. 5 is a drawing showing relations between λCC and Λth at the wavelengths of the legends, where Aeff is fixed at 80 µm2, with identical-core type MCFs (R = 0.1 (m)) of step-index type cores; -
Figs. 6A and 6B show drawings showing dependences of Λth at the wavelength of 1625 nm on Ra, in the case of Aeff = 130 µm2; -
Figs. 7A and 7B show drawings showing dependences of Λth at the wavelength of 1625 nm on Δ1 - Δ4 or on Δ3 - Δ4, in the case of Aeff = 130 µm2; -
Fig. 8 is a drawing showing a relation between 2a and λCC in trench type cores under the design center conditions of 2a = 12.8 µm, Ra = 0.6, Rb = 0.819, Δ1 = 0.26%, Δ2 = 0%, Δ3 = -0.55%, and Δ4 = 0%; -
Fig. 9 is a drawing showing a relation between Ra and λCC in the same trench type cores as inFig. 8 ; -
Fig. 10 is a drawing showing a relation between 1/Rb and λCC in the same trench type cores as inFig. 8 ; -
Fig. 11 is a drawing showing a relation between Δ1 and λCC in the same trench type cores as inFig. 8 ; -
Fig. 12 is a drawing showing a relation between Δ2 and λCC in the same trench type cores as inFig. 8 ; -
Fig. 13 is a drawing showing a relation between Δ3 and λCC in the same trench type cores as inFig. 8 ; -
Fig. 14 is a drawing showing a relation between Δ4 and λCC in the same trench type cores as inFig. 8 ; -
Fig. 15 is a drawing showing a relation between 2a and Aeff in trench type cores under the design center conditions of 2a = 12.8 µm, Ra = 0.6, Rb = 0.819, Δ1 = 0.26%, Δ2 = 0%, Δ3 = -0.55%, and Δ4 = 0%; -
Fig. 16 is a drawing showing a relation between Ra and Aeff in the same trench type cores as inFig. 15 ; -
Fig. 17 is a drawing showing a relation between 1/Rb and Aeff in the same trench type cores as inFig. 15 ; -
Fig. 18 is a drawing showing a relation between Δ1 and Aeff in the same trench type cores as inFig. 15 ; -
Fig. 19 is a drawing showing a relation between Δ2 and Aeff in the same trench type cores as inFig. 15 ; -
Fig. 20 is a drawing showing a relation between Δ3 and Aeff in the same trench type cores as inFig. 15 ; -
Fig. 21 is a drawing showing a relation between Δ4 and Aeff in the same trench type cores as inFig. 15 ; -
Fig. 22 is a drawing showing a relation between 2a and normalized bending loss in trench type cores under the design center conditions of 2a = 12.8 µm, Ra = 0.6, Rb = 0.819, Δ1 = 0.26%, Δ2 = 0%, Δ3 = -0.55%, and Δ4 = 0%; -
Fig. 23 is a drawing showing a relation between Ra and normalized bending loss in the same trench type cores as inFig. 22 ; -
Fig. 24 is a drawing showing a relation between 1/Rb and normalized bending loss in the same trench type cores as inFig. 22 ; -
Fig. 25 is a drawing showing a relation between Δ1 and normalized bending loss in the same trench type cores as inFig. 22 ; -
Fig. 26 is a drawing showing a relation between Δ2 and normalized bending loss in the same trench type cores as inFig. 22 ; -
Fig. 27 is a drawing showing a relation between Δ3 and normalized bending loss in the same trench type cores as inFig. 22 ; -
Fig. 28 is a drawing showing a relation between Δ4 and normalized bending loss in the same trench type cores as inFig. 22 ; -
Fig. 29 is a drawing showing a relation between 2a and Λth at the wavelength of 1565 nm in trench type cores under the design center conditions of 2a = 12.8 µm, Ra = 0.6, Rb = 0.819, Δ1 = 0.26%, Δ2 = 0%, Δ3 = -0.55%, and Δ4 = 0%; -
Fig. 30 is a drawing showing a relation between Ra and Λth in the same trench type cores as inFig. 29 ; -
Fig. 31 is a drawing showing a relation between 1/Rb and Λth in the same trench type cores as inFig. 29 ; -
Fig. 32 is a drawing showing a relation between Δ1 and Λth in the same trench type cores as inFig. 29 ; -
Fig. 33 is a drawing showing a relation between Δ2 and Λth in the same trench type cores as inFig. 29 ; -
Fig. 34 is a drawing showing a relation between Δ3 and Λth in the same trench type cores as inFig. 29 ; -
Fig. 35 is a drawing showing a relation between Δ4 and Λth in the same trench type cores as inFig. 29 ; -
Fig. 36 is a drawing showing a relation between 2a and λCC in trench type cores under the design center conditions of 2a = 12.4 µm, Ra = 0.6, Rb = 0.622, Δ1 = 0.22%, Δ2 = 0%, Δ3 = -0.59%, and Δ4 = 0%; -
Fig. 37 is a drawing showing a relation between Ra and λCC in the same trench type cores as inFig. 36 ; -
Fig. 38 is a drawing showing a relation between 1/Rb and λCC in the same trench type cores as inFig. 36 ; -
Fig. 39 is a drawing showing a relation between Δ1 and λCC in the same trench type cores as inFig. 36 ; -
Fig. 40 is a drawing showing a relation between Δ2 and λCC in the same trench type cores as inFig. 36 ; -
Fig. 41 is a drawing showing a relation between Δ3 and λCC in the same trench type cores as inFig. 36 ; -
Fig. 42 is a drawing showing a relation between Δ4 and λCC in the same trench type cores as inFig. 36 ; -
Fig. 43 is a drawing showing a relation between 2a and Aeff in trench type cores under the design center conditions of 2a = 12.4 µm, Ra = 0.6, Rb = 0.622, Δ1 = 0.22%, Δ2 = 0%, Δ3 = -0.59%, and Δ4 = 0%; -
Fig. 44 is a drawing showing a relation between Ra and Aeff in the same trench type cores as inFig. 43 ; -
Fig. 45 is a drawing showing a relation between 1/Rb and Aeff in the same trench type cores as inFig. 43 ; -
Fig. 46 is a drawing showing a relation between Δ1 and Aeff in the same trench type cores as inFig. 43 ; -
Fig. 47 is a drawing showing a relation between Δ2 and Aeff in the same trench type cores as inFig. 43 ; -
Fig. 48 is a drawing showing a relation between Δ3 and Aeff in the same trench type cores as inFig. 43 ; -
Fig. 49 is a drawing showing a relation between Δ4 and Aeff in the same trench type cores as inFig. 43 ; -
Fig. 50 is a drawing showing a relation between 2a and normalized bending loss in trench type cores under the design center conditions of 2a = 12.4 µm, Ra = 0.6, Rb = 0.622, Δ1 = 0.22%, Δ2 = 0%, Δ3 = -0.59%, and Δ4 = 0%; -
Fig. 51 is a drawing showing a relation between Ra and normalized bending loss in the same trench type cores as inFig. 50 ; -
Fig. 52 is a drawing showing a relation between 1/Rb and normalized bending loss in the same trench type cores as inFig. 50 ; -
Fig. 53 is a drawing showing a relation between Δ1 and normalized bending loss in the same trench type cores as inFig. 50 ; -
Fig. 54 is a drawing showing a relation between Δ2 and normalized bending loss in the same trench type cores as inFig. 50 ; -
Fig. 55 is a drawing showing a relation between Δ3 and normalized bending loss in the same trench type cores as inFig. 50 ; -
Fig. 56 is a drawing showing a relation between Δ4 and normalized bending loss in the same trench type cores as inFig. 50 ; -
Fig. 57 is a drawing showing a relation between 2a and Λth at the wavelength of 1565 nm in trench type cores under the design center conditions of 2a = 12.4 µm, Ra = 0.6, Rb = 0.622, Δ1 = 0.22%, Δ2 = 0%, Δ3 = -0.59%, and Δ4 = 0%; -
Fig. 58 is a drawing showing a relation between Ra and Λth in the same trench type cores as inFig. 57 ; -
Fig. 59 is a drawing showing a relation between 1/Rb and Λth in the same trench type cores as inFig. 57 ; -
Fig. 60 is a drawing showing a relation between Δ1 and Λth in the same trench type cores as inFig. 57 ; -
Fig. 61 is a drawing showing a relation between Δ2 and Λth in the same trench type cores as inFig. 57 ; -
Fig. 62 is a drawing showing a relation between Δ3 and Λth in the same trench type cores as inFig. 57 ; -
Fig. 63 is a drawing showing a relation between Δ4 and Λth in the same trench type cores as inFig. 57 ; -
Fig. 64 is a drawing showing a relation between 2a and λCC in trench type cores under the design center conditions of 2a = 12.4 µm, Ra = 0.6, Rb = 0.673, Δ1 = 0.22%, Δ2 = 0%, Δ3 = -0.59%, and Δ4 = 0%; -
Fig. 65 is a drawing showing a relation between Ra and λCC in the same trench type cores as inFig. 64 ; -
Fig. 66 is a drawing showing a relation between 1/Rb and λCC in the same trench type cores as inFig. 64 ; -
Fig. 67 is a drawing showing a relation between Δ1 and λCC in the same trench type cores as inFig. 64 ; -
Fig. 68 is a drawing showing a relation between Δ2 and λCC in the same trench type cores as inFig. 64 ; -
Fig. 69 is a drawing showing a relation between Δ3 and λCC in the same trench type cores as inFig. 64 ; -
Fig. 70 is a drawing showing a relation between Δ4 and λCC in the same trench type cores as inFig. 64 ; -
Fig. 71 is a drawing showing a relation between 2a and Aeff in trench type cores under the design center conditions of 2a = 12.4 µm, Ra = 0.6, Rb = 0.673, Δ1 = 0.22%, Δ2 = 0%, Δ3 = -0.59%, and Δ4 = 0%; -
Fig. 72 is a drawing showing a relation between Ra and Aeff in the same trench type cores as inFig. 71 ; -
Fig. 73 is a drawing showing a relation between 1/Rb and Aeff in the same trench type cores as inFig. 71 ; -
Fig. 74 is a drawing showing a relation between Δ1 and Aeff in the same trench type cores as inFig. 71 ; -
Fig. 75 is a drawing showing a relation between Δ2 and Aeff in the same trench type cores as inFig. 71 ; -
Fig. 76 is a drawing showing a relation between Δ3 and Aeff in the same trench type cores as inFig. 71 ; -
Fig. 77 is a drawing showing a relation between Δ4 and Aeff in the same trench type cores as inFig. 71 ; -
Fig. 78 is a drawing showing a relation between 2a and normalized bending loss in trench type cores under the design center conditions of 2a = 12.4 µm, Ra = 0.6, Rb = 0.673, Δ1 = 0.22%, Δ2 = 0%, Δ3 = -0.59%, and Δ4 = 0%; -
Fig. 79 is a drawing showing a relation between Ra and normalized bending loss in the same trench type cores as inFig. 78 ; -
Fig. 80 is a drawing showing a relation between 1/Rb and normalized bending loss in the same trench type cores as inFig. 78 ; -
Fig. 81 is a drawing showing a relation between Δ1 and normalized bending loss in the same trench type cores as inFig. 78 ; -
Fig. 82 is a drawing showing a relation between Δ2 and normalized bending loss in the same trench type cores as inFig. 78 ; -
Fig. 83 is a drawing showing a relation between Δ3 and normalized bending loss in the same trench type cores as inFig. 78 ; -
Fig. 84 is a drawing showing a relation between Δ4 and normalized bending loss in the same trench type cores as inFig. 78 ; -
Fig. 85 is a drawing showing a relation between 2a and Λth at the wavelength of 1565 nm in trench type cores under the design center conditions of 2a = 12.4 µm, Ra = 0.6, Rb = 0.673, Δ1 = 0.22%, Δ2 = 0%, Δ3 = -0.59%, and Δ4 = 0%; -
Fig. 86 is a drawing showing a relation between Ra and Λth in the same trench type cores as inFig. 85 ; -
Fig. 87 is a drawing showing a relation between 1/Rb and Λth in the same trench type cores as inFig. 85 ; -
Fig. 88 is a drawing showing a relation between Δ1 and Λth in the same trench type cores as inFig. 85 ; -
Fig. 89 is a drawing showing a relation between Δ2 and Λth in the same trench type cores as inFig. 85 ; -
Fig. 90 is a drawing showing a relation between Δ3 and Λth in the same trench type cores as inFig. 85 ; -
Fig. 91 is a drawing showing a relation between Δ4 and Λth in the same trench type cores as inFig. 85 ; and -
Fig. 92 is a drawing showing influence of SNRSC,max and µX,WC after propagation through one span on SNR, on the assumption of NchRs = 10 THz. - Embodiments of the present invention will be described below in detail with reference to the accompanying drawings. The same elements will be denoted by the same reference signs in the description of the drawings, without redundant description.
-
Fig. 1 is a drawing showing a cross-sectional configuration of a multi-core optical fiber 100 (7-core fiber) including seven cores, as an example of the multi-core optical fiber according to the present embodiment.Fig. 2 is a refractive index profile of each core 110 and its surrounding region. - The multi-core
optical fiber 100 of the example shown inFig. 1 includes sevencores 110 and each of thesecores 110 has a structure surrounded by a common cladding 140 (which will be referred to hereinafter simply as cladding) having a refractive index lower than each core 110. Atrench layer 130 having a refractive index lower than thecladding 140 is provided between an outer peripheral surface of each core 110 and thecladding 140, and aninner cladding layer 120 having a refractive index higher than thetrench layer 130 and lower than each core 110 is provided between the outer peripheral surface of each core 110 and thetrench layer 130. Eachcore 110 has anoutside diameter 2a, theinner cladding layer 120 has anoutside diameter 2b, and thetrench layer 130 has anoutside diameter 2c. Theinner cladding layer 120 and thetrench layer 130 have a ring-like cross-sectional shape, as shown inFig. 1 , and their respective outside diameters are defined by diameters of their outside contours. A ratio Ra of theoutside diameter 2a of each core 110 to theoutside diameter 2b of theinner cladding layer 120 is given by a/b, and a ratio Rb of theoutside diameter 2b of theinner cladding layer 120 to theoutside diameter 2c of thetrench layer 130 by b/c. Furthermore, a distance Λ (core pitch) between neighboring cores between which crosstalk can occur, is defined by a center-to-center distance between the neighboring cores. -
Fig. 2 is the index profile of each core 110 and its surrounding region shown inFig. 1 , which shows the refractive indices of the respective parts on a line L inFig. 1 . Thisindex profile 150 is separated intoregion 151 corresponding to thecore 110,region 152 corresponding to theinner cladding layer 120,region 153 corresponding to thetrench layer 130, andregion 154 corresponding to thecladding 140. Relative index differences with respect to a reference refractive index, of the respective parts ofcore 110,inner cladding layer 120,trench layer 130, andcladding 140 are represented by Δ1, Δ2, Δ3, and Δ4, respectively. - Next, the multi-core
optical fiber 100 according to the present embodiment is a transmission medium with an increased transmission capacity of each core 110, and the below will first describe problems in the conventional multi-core optical fibers. - For increasing the transmission capacity of a multi-core fiber (MCF), it is necessary to increase the number of embedded cores or to increase the transmission capacities of the individual cores embedded in the MCF. For increasing the transmission capacities of the individual cores embedded in the MCF, it is necessary to increase a signal-to-noise ratio (SNR) of signal light after propagation through each core and thereby allow increase in modulation order. For improving the SNR, it is necessary to enhance the intensity of signal light input into each core or to reduce a transmission loss of the core so as to reduce noise due to signal amplification. Since noise due to non-linear phenomena increases with increase in intensity of signal light input into the core, the SNR can degrade in some cases on the contrary. A countermeasure against it is to increase the effective area Aeff or to use a material with a small non-linear refractive index n2, thereby reducing the non-linearity of the core. By this, the noise due to the non-linear phenomena can be suppressed even with incidence of signal light of greater intensity.
- In the case of the MCF, however, core-to-core crosstalk (XT) is further added as a noise source and therefore the improvement of SNR cannot be achieved without consideration to influence of XT on SNR. This will be discussed below.
- According to "G. Bosco, P. Poggiolini, a. Carena, V. Curri, and F. Forghieri, "Analytical results on channel capacity in uncompensated optical links with coherent detection," Opt. Express, vol. 19, no. 26, pp.B438-B449, Nov. 2011. " it is known that the signal-to-noise ratio (SNR) of a Nyquist wavelength division multiplexing (WDM) transmission link (SC transmission link) composed of a single core (SC)-single mode fiber (SMF) and an erbium-doped optical fiber amplifier (EDFA) is expressed by Expressions (101) to (104) below.


- Concerning the SNR of a similar transmission link (MC transmission link) constructed using a multi-core (MC) fiber instead of the SC fiber, the core-to-core crosstalk (XT) is considered to be noise, which has not been taken into consideration heretofore, and the SNR of a certain core (a core with the largest XT to that core/first core) in the MCF can be expressed by Expressions (105), (106) below.


- The parameters in the foregoing Expressions (101) to (106) are as described in Table 1 below. ηWC = sup{∑ηnm} represents the upper limit of values that ∑ηnm can take. Furthermore, ηnm is a power coupling coefficient per unit length from core m to core n.
- In the foregoing Expression (105), "-PXT" in the term with the numerator of "PTx,ch - PXT" indicates that the signal light power is reduced because of XT to the other cores. That term has the denominator including "+PXT," and this indicates that noise increases because of XT from the other cores. The foregoing Expression (106) is valid as long as XT is small. The below will discuss the scope in which Expressions (105), (106) hold with µX,WC being -20 dB.
(Table 1) P signal signal light power (time average) P noise noise light power (time average) P Tx,ch transmission power per channel (time average) P ASE power of ASE noise in band Bn (time average) P NLI power of non-linear noise in band Bn (time average) P XT power of noise due to core-core XT (time average) N s number of spans L s span length α loss coefficient [/unit length] α dB loss coefficient [dB/unit length] F noise figure (NF) of EDFA (F linear value; FdB decibel value) h Planck's constant v center frequency of entire band of WDM N ch number of WDM channels γ non-linear coefficient γ = 2πn 2/(λA eff) n 2: non-linear refractive index β 2 second order differential ∂2 β/∂ω2[(unit time)2/unit length] of propagation coefficient β by angular rate ω; can be represented by β 2 = -λ 2 D/(2πc) D: chromatic dispersion [unit time/(unit length)2] λ: wavelength c: velocity of light in vacuum L eff effective length L eff = [1-exp(-αLs )]/α R s symbol rate µ X,WC sum (statistical average) of XTs to core with worst XT (Worst Core) Nc maximum number of neighboring cores η power coupling coefficient per unit length - It is seen herein from the foregoing Expressions (101), (105), and (106) that relations of Expressions (107a), (107b) below hold.


- It is found herein from Expression (107a) that SNRMC without any XT is SNRSC. Furthermore, Expression (107b) corresponds to a linear value of SNR penalty due to XT. In the both cases of SC/MC transmission links, the SNR is maximized with PTx,ch = [PASE/2NNLI)]1/3 and their maxima are represented by Expressions (108), (109) below.


- By substituting Expressions (102), (103), and (106) into the foregoing Expressions (108), (109) and rearranging them, we obtain Expressions (110), (111) below.


- In Expressions (110), (111), the interior of the In() term includes fiber-related parameters, system parameters, and so on, but, with a sufficiently large WDM band (NchRs), a small parameter change will cause little change in SNR and is thus negligible. Then Expression (110) can be rearranged like Expression (112). Csystem herein is a constant not related to the parameters of the optical fiber (including the system parameters and the ln() term).

- Now, a difference (ASNRSC) of SNRSC,max [dB] between different SC fibers can be approximately calculated using Expression (112). ASNRSC is obtained by canceling out all the system parameters except for Ls and the difference (ASNRSC) of maximum SNR of the system due to the difference of fibers can be expressed by only the fiber parameters. In the case of the MC transmission link, SNRMC,max [dB] cannot be rearranged into a simple expression like Expression (112), but it can be confirmed from Expression (111) that ΔSNRMC is independent of Ns (which is canceled out during the calculation).
- The above results tell us the following five points.
- (1) The fiber-caused SNR improvement ΔSNRSC of the SC transmission link can be expressed by the span length Ls and the fiber parameters (D, Aeff, n2, α, Leff) only.
- (2) The fiber-caused SNR improvement ΔSNRMC of the MC transmission link is hard to be simplified, different from ΔSNRSC, and is dependent on the system parameters.
- (3) Without XT, SNRMC of the MC transmission link is SNRSC, and ΔSNRMC is ΔSNRSC.
- (4) ΔSNRSC and ΔSNRMC both are independent of the number of spans Ns.
- (5) If we find "SNRSC as SNR with XT being ignored" and "µX,WC ≒ NcηLs" after propagation through one span, we can derive SNRMC in the MC transmission link and can obtain the SNR improvement ΔSNRMC independent of the number of spans.
- For investigating effects of the various fiber parameters on ΔSNRMC, let us evaluate maximum SNR improvements ΔSNRMC of systems using various MCFs described in published literatures, with respect to a maximum SNR of a system using a standard SMF. The properties of the various MCFs are provided in Table 2.
(Table 2) Fiber type (MCF i-vi) αdB [dB/k m] Aeff [µm 2] D [ps/(nm·k m)] µX [dB] between two adjacent cores Fiber length [km] Nc N c η [/km] µ X,WC [dB] after 80 km propagatio n µ X,WC [dB] after 100 km propagation standard SMF 0.195 80 16.7 0 0 0 0 MCF i 0.178* 1 80*1 22.2*1 -79.5*1 17.4 6 ∼3×10 -9 -65.7*3 -64.7*3 MCF ii 0.20 102 N/A*2 ∼-53.5 ∼0.8 6 ∼3×10⁻⁵ ∼-25.7 ∼-24.7 MCF iii 0.198 112.4 N/A*2 -56 1.905 6 -8×10 -6 -32 -31 MCF iv 0.242 116 N/A*2 -40 3.962 2 ~5×10⁻⁵ -24 -23 MCF v*4 0.214*1 133.4* 1 20.6*1 -48.5 5.0 2 ∼7×10 -7 -33.4 -32.4 MCF vi 0.195* 5 110 20.65*5 -65 75 6 ∼3×10 -8 -56.9 -56.0 *1: average over all cores.
*2: 21 ps/(nm·km) assumed in calculation.
*3: value directly calculated from total average crosstalk to the center core.
*4: Since XT-related values were values not subjected to statistical averaging (wavelength averaging), the calculation was conducted on the assumption that µX between two adjacent cores was the median of dB values of XT between two adjacent cores.
*5: the medium among all cores.
**n2: 2.2 × 10⁻²⁰ m2/W assumed for PSCF, and 2.34 × 10⁻²⁰ m2/W assumed for Ge-doped fiber. - The sources of the MCFs described in Table 2 are as listed below.
- i) (Non-Patent literature 1) T. Hayashi, T. Taru, O. Shimakawa, T. Sasaki, and E. Sasaoka, "Characterization of Crosstalk in Ultra-Low-Crosstalk multi-Core Fiber," J. Lightwave Technol., vol. 30, no. 4, pp.583-589, Feb. 2012.
- ii) (Non-Patent literature 2) K. Imamura, K. Mukasa, and R. Sugizaki, "Trench Assisted Multi-Core Fiber with Large Aeff over 100 µm2 and Low Attenuation Loss," in Eur. CoNF. Opt. Commun. (ECOC), 2011, p. Mo. 1. LeCervin. 1.
- iii) (Non-Patent literature 3) K. Takenaga, Y. Arakawa, Y. Sasaki, S. Tanigawa, S. Matsuo, K. Saitoh, and M. Koshiba, "A large effective area multi-core fiber with an optimized cladding thickness," Opt. Express, vol. 19, no. 26, pp.B543-B550, Nov. 2011.
- iv) (Non-Patent literature 4) S. Matsuo, K. Takenaga, Y. Arakawa, Y. Sasaki, S. Tanigawa, K. Saitoh, and M. Koshiba, "Large-effective-area ten-core fiber with cladding diameter of about 200 µm," Opt. Lett., vol. 36, no. 23, pp.4626-4628, Dec. 2011.
- v) (Non-Patent literature 5) B. Yao, K. Ohsono, N. Shiina, F. Koji, A. Hongo, E. H. Sekiya, and K. Saito, "Reduction of Crosstalk by Hole-Walled Multi-Core Fibers," in Opt. Fiber Commun. CoNF. (OFC), 2012, p.OM2D.5.
- vi) (Non-Patent literature 6) H. Takara, H. Ono, A. Yoshiteru, H. Masuda, K. Takenaga, S. Matsuo, H. Kubota, K. Shibahara, T. Kobayashi, and Y. Miyamoto, "1000-km 7-corefiber transmission of 10x96-Gb/s PDM-16QAM using Raman amplification with 6.5W per fiber," Opt. Express, vol. 20, no. 9, pp.10100-10105, Apr. 2012.
-
Fig. 92 shows the effects of SNRSC,max and µX,WC after propagation through one span on SNR on the assumption of NchRs = 10 THz. InFig. 92 , dash-dotted lines represent contours of SNR penalty due to XT (SNRSC/SNRMC, Expression (107b)), a dashed line represents SNRSC,max (ΔSNRSC = 0) of the standard SMF, and solid lines represent contours of SNR improvement ΔSNRMC with respect to the standard SMF, of individual cores in each MCF with consideration to XT. Rhombic marks represent correspondences between "SNRSC,max after propagation through one span (on the vertical axis)" and "µX,WC after propagation through one span (on the horizontal axis)" of the respective fibers described in Table 2. -
Fig. 92 suggests the following points. - (A) At the points of all the MCFs except for the MCF of the source (iv) with a large loss, the positions on the vertical axis are higher than that of the standard SMF and it is considered that SNR (SNRSC,max) is improved without consideration to XT.
- (B) With the MCFs of the sources (ii) to (iv), however, µX,WC is too large and it is therefore considered that even if SNRSC,max is better than that of the standard SMF, SNRMC,max becomes worse than SNR of the standard SMF because of the SNR penalty due to XT.
- (C) The SNR penalty due to XT shows a drastic increase when µX,WC exceeds a specific threshold range and the threshold varies depending upon the value of SNRSC,max. This is because µX,WC needs to be sufficiently smaller than the ASE noise and non-linear noise, in order to keep ΔSNRMC from being affected by XT. On the other hand, it is seen that suppression of µX,WC more than necessary results in little contribution to ΔSNRMC improvement.
- (D) Concerning the MCF of the source (i) and the MCF of the source (vi), the suppression of µX,WC is considered to be excessive. The reason for it is that the suppression of µX,WC requires decrease of Aeff and increase of core pitch and it can cause degradation of SNR and large decrease of core density.
- The below will more quantitatively discuss desired "µX,WC" and "relations between fiber parameters and µX,WC" for SNR improvement (or for prevention of degradation). On the basis of Expression (107b), Expression (113) below needs to be satisfied, in order to keep SNRpenalty [dB] as the SNR penalty due to XT in a specific range, i.e., in the range of SNRpenality,min [dB] ≤ SNRpenalty [dB] ≤ SNRpenalty,max [dB]. In this expression, SNRSC -1 is a ratio of ASE and non-linear noise to signal. By converting Expression (113) into decibel expression and approximately rewriting it, it can be rewritten into Expressions (114a) to (114c) below.


- Cpenalty herein takes the values shown in Table 3 for some values of SNRpenalty [dB]. Examples of FoM and SNRSC,max [dB] are as follows for the case of the standard SMF (on the assumption of n2 of 2.34 × 10⁻²⁰ m2/W) in Table 2: FoM is about 4.12 dB at Ls = 80 km and about 1.45 dB at Ls = 100 km (the units of the respective parameters herein are D [ps/(nm·km)], Aeff [µm2], αdB [dB/km], and Ls [km]). System parameter dependences of SNRSC,max [dB] in the standard SMF are as provided in Table 4. The dependence on FdB is approximately -(2/3)FdB and the dependence on Ls approximately -(2/3)αdBLs. The dependence on NchRs (WDM band) can be approximated to about -0.27ln(NchRs) and the influence thereof is found to be little.
(Table 3) 
0.02 0.03 0.05 0.1 0.2 0.3 0.5 1 2 Cpenalty [dB] -23.3 6 -21.5 9 -19.3 6 -16.33 -13.2 7 -11.4 6 -9.14 -5.87 -2.33 (Table 4) Ls [km] 80 100 F dB [dB] 3 4 5 6 3 4 5 6 N ch Rs [THz] 1 30.68 30.01 29.35 28.68 28.01 27.34 26.67 26.01 2 30.46 29.79 29.13 28.46 27.79 27.12 26.45 25.79 3 30.35 29.68 29.01 28.35 27.67 27.00 26.34 25.67 4 30.27 29.60 28.94 28.27 27.59 26.93 26.26 25.59 5 30.21 29.55 28.88 28.21 27.54 26.87 26.20 25.54 6 30.17 29.50 28.83 28.17 27.49 26.83 26.16 25.49 7 30.13 29.46 28.80 28.13 27.46 26.79 26.12 25.46 8 30.10 29.43 28.77 28.10 27.43 26.76 26.09 25.43 9 30.07 29.41 28.74 28.07 27.40 26.73 26.07 25.40 10 30.05 29.38 28.72 28.05 27.38 26.71 26.04 25.38 - In the case of an MCF with cores equivalent to the standard SMF, in order to prevent the degradation of SNR due to XT, SNRpenalty [dB] is more preferably not more than at least 1 dB, still more preferably not more than 0.5 dB, and yet more preferably not more than 0.1 dB. In order to prevent the SNR degradation due to excessive XT suppression, SNRpenalty [dB] is preferably not less than 0.02 dB, more preferably not less than 0.03 dB, and still more preferably not less than 0.05 dB.
- It is found by calculation using Expression (114a) and the numeral values in Tables 3 and 4 that, for example, in the case where NchRs = 10 THz and F dB = 3 dB, Expression (A1) below is preferably to be satisfied, in order to keep SNRpenalty [dB] not less than 0.02 dB and not more than 1 dB.

- Expression (A2) below is preferably to be satisfied, in order to keep SNRpenalty [dB] not less than 0.05 dB and not more than 1 dB.

- Furthermore, Expression (A3) below is preferably to be satisfied, in order to keep SNRpenalty [dB] not less than 0.05 dB and not more than 0.5 dB.

- It is found by calculation using these that in the case of NchRs = 10THz in the MCF with cores equivalent to the standard SMF, µX,WC necessary for SNRpenalty [dB] to take the values in Table 3 can be calculated as in Table 5.
(Table 5) Ls [km] 80 100 F dB [dB] 3 4 5 6 3 4 5 6 
0.02 -53.4 1 -52.7 4 -52.0 7 -51.4 1 -50.7 3 -50.0 7 -49.4 0 -48.7 3 0.03 -51.6 4 -50.9 7 -50.3 1 -49.6 4 -48.9 7 -48.3 0 -47.6 3 -46.9 7 0.05 -49.4 1 -48.7 5 -48.0 8 -47.4 1 -46.7 4 -46.0 7 -45.4 0 -44.7 4 0.1 -46.3 8 -45.7 1 -45.0 4 -44.3 8 -43.7 0 -43.0 4 -42.3 7 -41.7 0 0.2 -43.3 2 -42.6 5 -41.9 8 -41.3 2 -40.6 4 -39.9 8 -39.3 1 -38.6 4 0.3 -41.5 1 -40.8 4 -40.1 7 -39.5 1 -38.8 3 -38.1 6 -37.5 0 -36.8 3 0.5 -39.1 9 -38.5 2 -37.8 5 -37.1 9 -36.5 1 -35.8 4 -35.1 8 -34.5 1 1 -35.9 2 -35.2 5 -34.5 8 -33.9 2 -33.2 4 -32.5 8 -31.9 1 -31.2 4 2 -32.3 8 -31.7 1 -31.0 5 -30.3 8 -29.7 0 -29.0 4 -28.3 7 -27.7 0 - Therefore, when it is considered that the span length of standard transmission links is 80 km and NF of EDFA is 6 dB, µX,WC after 80 km propagation is preferably not more than at least -33.9 dB, more preferably not more than -37.2 dB, and still more preferably not more than -44.4 dB, in order to prevent the degradation of SNR due to XT. When NF of EDFA is considered to be 3 dB, µX,WC after 80 km propagation is preferably not more than at least -35.9 dB, more preferably not more than -39.2 dB, and still more preferably not more than -46.4 dB. In order to prevent the SNR degradation due to excessive XT suppression, when NF of EDFA is considered to be 6 dB, µX,WC after at least 80 km propagation is preferably not less than -51.4 dB, more preferably not less than -49.6 dB, and still more preferably not less than -47.4 dB. When NF of EDFA is considered to be 3 dB, µX,WC after at least 80 km propagation is preferably not less than -53.4 dB, more preferably not less than -51.6 dB, and still more preferably not less than -49.4 dB.
- For example, when Aeff is 120 µm2, out of the parameters of the standard SMF, FoM is about 5.29 dB at Ls = 80 km and about 2.62 dB at Ls = 100 km; therefore, FoM is improved by 1 dB or more when compared to the case of Aeff of 80 µm2. In this case, SNRpenalty [dB] is more preferably not more than at least 2 dB, still more preferably not more than 1 dB, yet more preferably not more than 0.5 dB, and yet still more preferably not more than 0.1 dB. Therefore, when it is considered that the span length of standard transmission links is 80 km and NF of EDFA is 6 dB, it is found by Expression (114) that, in order to prevent the degradation of SNR due to XT, µX,WC after 80 km propagation is preferably not more than at least -32.9 dB, more preferably not more than -36.4 dB, still more preferably not more than -39.7 dB, and yet more preferably not more than -46.9 dB. When NF of EDFA is considered to be 3 dB, µX,WC after 80 km propagation is preferably not more than at least -33.6 dB, more preferably not more than -37.1 dB, still more preferably not more than -40.4 dB, and yet more preferably not more than -47.6 dB. In order to prevent the SNR degradation due to excessive XT suppression, when NF of EDFA is considered to be 6 dB, µX,WC after at least 80 km propagation is preferably not less than -53.9 dB, more preferably not less than -52.2 dB, and still more preferably not less than -49.9 dB. When NF of EDFA is considered to be 3 dB, µX,WC after at least 80 km propagation is preferably not less than -54.6 dB, more preferably not less than -52.8 dB, and still more preferably not less than -50.6 dB.
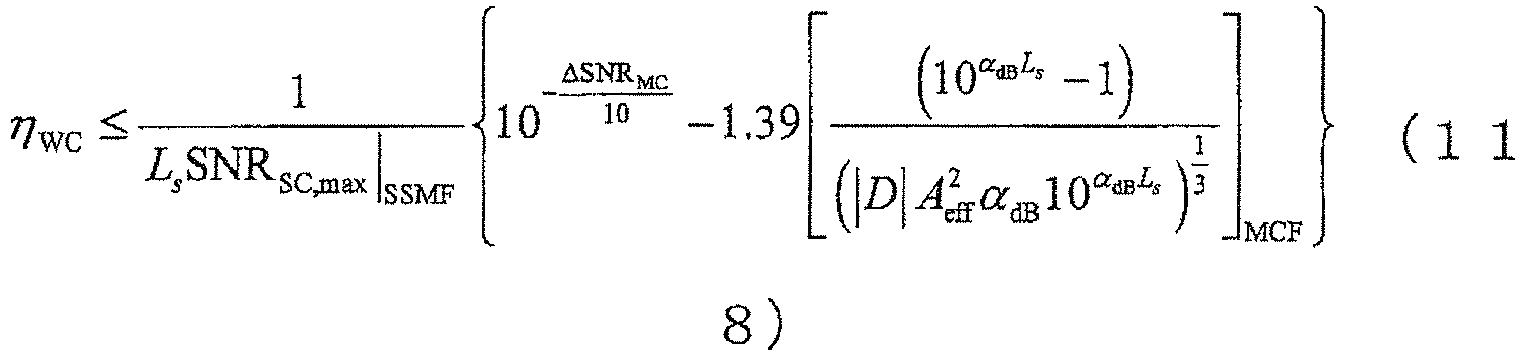
- For improving SNRMC,max|MCF by ΔSNRMC [dB] more than SNRSC,max|SSMF, Expression (115) below needs to be satisfied.

- However, there is the condition of Expression (116) herein.

10^(-ΔSNRMC/10) is, for example, about 0.71 with LlSNRMC = 1.5 dB, about 0.63 with ΔSNRMC = 2 dB, and about 0.50 with ΔSNRMC = 3 dB. 10^(FoMSSMF/10) is about 2.58 at Ls = 80 km and about 1.39 at Ls = 100 km and therefore the relations of Expressions (117), (118) below are obtained from the foregoing Expressions (115), (116). (In the case of Ls =80km)
- Since SNRSC|SSMF is linear values of the values in Table 3, the system parameter dependences can be summarized as in Table 6 below.
(Table 6) Ls [km] 80 100 F dB [dB] 3 4 5 6 3 4 5 6 NchRs [THz ] 1 1.17×1 03 1.00×1 03 8.60×1 02 7.38×1 02 6.32×1 02 5.42×1 02 4.65×1 02 3.99×1 02 2 1.11×10 3 9.54×1 02 8.18×1 02 7.01×1 02 6.01×1 02 5.15×1 02 4.42×1 02 3.79×1 02 3 1.08×1 03 9.29×1 02 7.96×1 02 6.83×1 02 5.85×1 02 5.02×1 02 4.30×1 02 3.69×1 02 4 1.06×1 03 9.12×1 02 7.83×1 02 6.71×1 02 5.75×1 02 4.93×1 02 4.23×1 02 3.63×1 02 5 1.05×1 03 9.01×1 02 7.72×1 02 6.63×1 02 5.67×1 02 4.87×1 02 4.17×1 02 3.58×1 02 6 1.04×1 03 8.91×1 02 7.65×1 02 6.56×1 02 5.61×1 02 4.82×1 02 4.13×1 02 3.54×1 02 7 1.03×1 03 8.84×1 02 7.58×1 02 6.50×1 02 5.57×1 02 4.78×1 02 4.1 0×1 02 3.51×1 02 8 1.02×1 03 8.78×1 02 7.53×1 02 6.46×1 02 5.53×1 02 4.74×1 02 4.07×1 02 3.49×1 02 9 1.02×1 03 8.72×1 02 7.48×1 02 6.42×1 02 5.49×1 02 4.71×1 02 4.04×1 02 3.47×1 02 10 1.01×1 03 8.67×1 02 7.44×1 02 6.38×1 02 5.46×1 02 4.69×1 02 4.02×1 02 3.45×1 02 - Therefore, when the standard SMF is defined as a reference and, for example, when it is assumed that Ls = 80 km, NchRs = 10 THz, and F dB = 6 dB, ηWC [/km], D [ps/(nm·km)], Aeff [µm2], and αdB [dB/km] need to satisfy Expression (119) below, for each core of MCF to realize ΔSNRMC ≥ 1.5 dB.

- For realizing ΔSNRMC ≥ 2 dB, they need to satisfy Expression (120) below.

- Furthermore, for realizing ΔSNRMC ≥ 3 dB, they need to satisfy Expression (121) below.
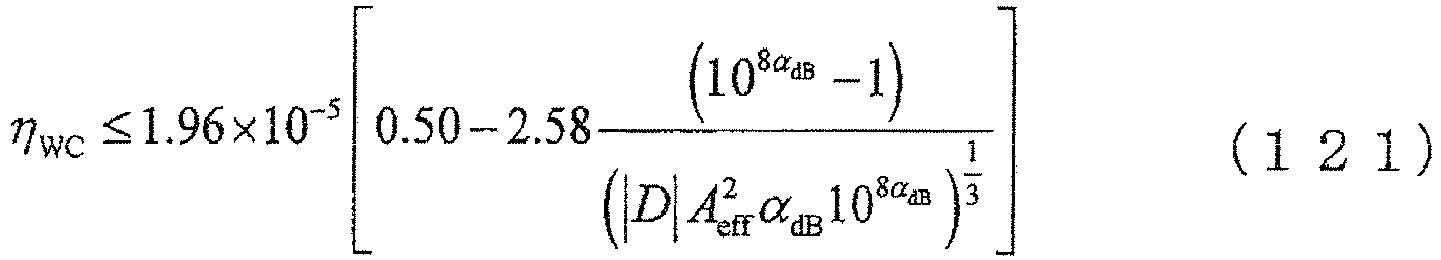
- For example, when it is assumed that Ls = 80 km, NchRs = 10 THz, and F dB = 3 dB, they need to satisfy Expression (122) below, for each core of MCF to realize ΔSNRMC ≥ 1.5 dB.

- For realizing ΔSNRMC ≥ 2 dB, they need to satisfy Expression (123) below.

- Furthermore, for realizing ΔSNRMC ≥ 3 dB, they need to satisfy Expression (124) below.

- For example, when it is assumed that Ls = 100 km, NchRs = 10 THz, and FdB = 6 dB, they need to satisfy Expression (125) below, for each core of MCF to realize ASNRMC ≥ 1.5 dB.

- For realizing ΔSNRMC ≥ 2 dB, they need to satisfy Expression (126) below.

- Furthermore, for realizing ΔSNRMC ≥ 3 dB, they need to satisfy Expression (127) below.

- For example, when it is assumed that Ls = 100 km, NchRs = 10 THz, and F dB = 3 dB, they need to satisfy Expression (128) below, for each core of MCF to realize ΔSNRMC ≥ 1.5 dB.
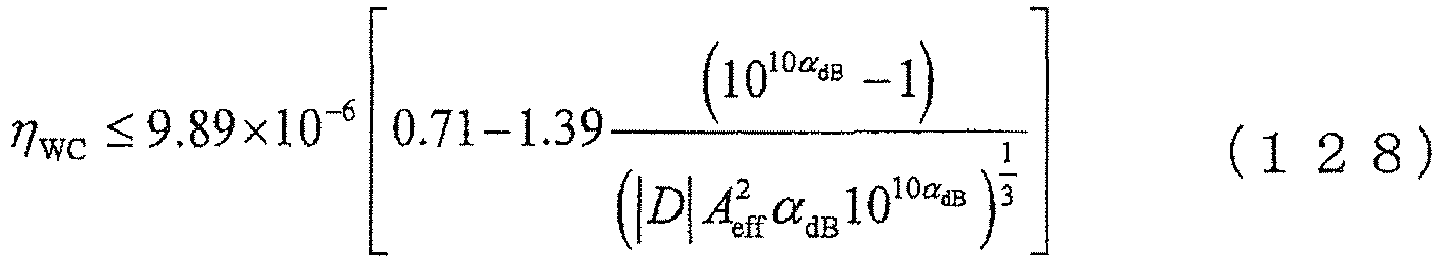
- For realizing ΔSNRMC ≥ 2 dB, they need to satisfy Expression (129) below.

- Furthermore, for realizing ΔSNRMC ≥ 3 dB, they need to satisfy Expression (130) below.

- For improving SNR of each core in MCF, it is necessary, of course, to implement the design to keep XT in the appropriate range as described above, but it is also necessary to improve SNRSC,max. It is found from the foregoing Expression (112) that the smaller αdB, the larger Aeff, or the larger the absolute value of D, the more SNRSC,max is improved. The reduction of transmission loss and the increase of Aeff are achieved in the single-core optical fibers and the optimum value of Aeff is reported to be 130 µm2, with consideration to splice loss and others as well, while also achieving an extremely low transmission loss (0.161 dB/km). This is described in "Y. Yamamoto et al., "A New Class of Optical Fiber to Support Large Capacity Transmission," OFC2011, paperOWA6 (Non-Patent Literature 7)."
- However, the effective area Aeff achieved in the multi-core optical fibers is at most in the level of 110 µM 2 and the transmission loss in that case is about 0.2 dB/km. This is described in "K. Imamura et al., "Trench Assisted Multi-Core Fiber with Large Aeff over 100 µm2 and Low Attenuation Loss," ECOC2011, paper Mo. 1. LeCervin. 1. (Non-Patent Literature 2)" and "K. Takenaga et al., "A Large Effective Area Multi-Core Fibre with an Optimised Cladding Thickness," (Non-Patent Literature 3)." Furthermore, in a particularly relevant non patent literature document, "T. Hayashi et al., "Design and Fabrication of Ultra-Low-Crosstalk and Low-Loss Multi-Core Fber," Optics Express, vol. 19, no. 17, pp.16576-16592 (2011)." realized the low transmission loss (0.175 to 0.181 dB/km), but Aeff in that case is about 80 µm2. As described above, it is the present status of the conventional technologies that there are no examples achieving both of large Aeff of 130 µm2 (or 120 µm2 or more even with consideration to manufacturing dispersion of ±10 µm2) and low transmission loss equivalent to that of the standard single-mode fibers (not more than 0.195 dB/km and more preferably not more than 0.185 dB/km) in the case of MCFs.
- In the case of the MCF, for increasing the transmission capacity per MCF, it is preferable to achieve both of Aeff of not less than at least 120 µm2 and the low transmission loss equal to or less than at least that of the standard single-mode fiber, in the MCF, and thereby to improve the transmission capacity of each individual core in the MCF to a level equivalent to that of the single-core low-nonlinearity optical fiber described in
Reference Literature 2. The absolute value of chromatic dispersion D is also preferably set as large as possible, for the improvement in transmission capacity, and it is more preferable to realize the chromatic dispersion (approximately 17 ps/nm/km or more at the wavelength of 1550 nm) larger than that of the standard single-mode optical fiber, simultaneously with the increase of Aeff and the low transmission loss. The chromatic dispersion is more preferably realized in the range of not less than about 20 ps/nm/km closer to the material dispersion of silica glass if possible. - It is reported in "T. Ayashi et al. (non-patent literature cited in paragraph 78 as a particularly relevant document)" and others that in the case of MCF, if the cores are too close to the cladding, propagation modes in the cores can be coupled with a mode in a coating material with high refractive index covering the cladding, so as to increase the transmission loss of the cores near the cladding. In application of MCF, the properties of the cores are preferably as uniform as possible, and differences of transmission losses among the cores of MCF, including dispersion of transmission losses among the cores due to manufacturing dispersion and the transmission loss differences due to the aforementioned differences of core positions, are preferably controlled to not more than at most 0.02 dB/km at the wavelength of 1550 nm.
- Incidentally, in design of MCF with a large effective area Aeff, there is a possibility that confinement of light in the cores becomes weaker with increase of Aeff and there is a need for increase in core pitch in order to control the crosstalk. In the case of MCF, it is preferable to control the increase of core pitch as low as possible, while achieving sufficiently large Aeff. Then, the below will discuss the shortest core pitch that can be determined by the structure of cores and permissible crosstalk.
- A value of crosstalk from a first core to a second core out of a plurality of cores forming an MCF can be determined as follows: light is injected into the first core from one end face of the MCF, an emission power from the first core and an emission power from the second core are measured at the other end face, and a ratio is calculated as the crosstalk value by dividing the emission power from the second core by the emission power from the first core. Since the crosstalk of MCF has statistical dispersion, an average of statistical dispersion of crosstalk can be obtained by measuring a spectrum of crosstalk with wavelength sweeping of a light source during the measurement and obtaining an average thereof, or, by performing time-averaged measurement with a broadband light source. When the crosstalk is simply referred to hereinafter, it means the average of statistical dispersion of crosstalk.
- It is already disclosed in "T. Ayashi et al. (non-patent literature cited in paragraph 78 as a particularly relevant document)" and others that the crosstalk of MCF follows the power coupling equation, and, particularly, the power coupling coefficient η of an identical-core-type MCF can be expressed by Expression (6) below, using the mode coupling coefficient κ, the propagation constant β, the fiber bending radius R, and the core pitch Λ.

-
Fig. 3 shows relations among the effective area Aeff (values at the wavelength of 1550 nm unless otherwise stated in particular, hereinbelow), the core pitch A, and the power coupling coefficient η at the wavelength of 1565 nm, for example, in MCFs using step-index type cores with R = 1 (m) and the cable cutoff wavelength (λCC) of 1530 nm. It is shown byFig. 3 that the power coupling coefficient η largely increases in the logarithmic scale with increase in Aeff. - Let us consider as an MCF, for example, a 7-core fiber consisting of a center core and six peripheral cores arranged as cores on the hexagonal lattice. In this case, supposing the fiber length is L, the crosstalk to the center core from the six peripheral cores is approximately 6ηL, and, in order to keep 6ηL not more than 0.01 after 100 km propagation, the relation of Expression (7) below needs to be satisfied. By rearranging this in accordance with the dependence on the core pitch A, we can obtain Expression (8).
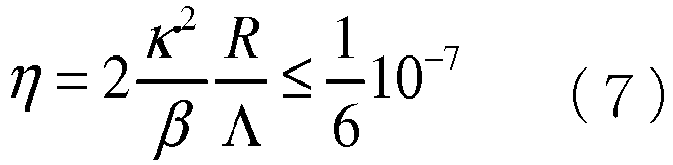

- With consideration to a tape-slot cable configuration or the like in which fibers are housed in a helical form in an actually fiber-installed state, the fiber bending radius R is assumed to be not less than at least 0.1 m. Therefore, for keeping 6ηL not more than 0.01 in the MCF, at least the relation of Expression (9) needs to be satisfied.

- Let us define herein Λth as the core pitch A satisfying Expression (10) below.

-
Fig. 4 shows relations between Aeff at thewavelength 1550 nm and Ath at 1550 nm, 1565 nm, and 1625 nm under the same conditions as inFig. 3 (provided that R = 0.1 m). According toFig. 4 , in the case of the MCF in which the step-index type cores are arranged on the hexagonal lattice (two-dimensionally close-packed), the core pitch needs to be not less than at least Λth inFig. 4 , in order to enable the transmission over the length of 100 km while keeping the crosstalk (XT) not more than 0.01 in the C-band (1530-1565 nm). - For making Λth smaller, it is necessary to enhance the confinement of light in the cores. For enhancing the confinement of light in the cores, the cutoff wavelength λCC is preferably set as long as possible.
Fig. 5 shows relations between λCC and Λth at 1550 nm, 1565 nm, and 1625 nm, in the case where the effective area Aeff is fixed at 80 µm2. It is shown byFig. 5 that Λth can be made smaller with increase of λCC. - When the multi-core optical fiber is applied, for example, to transmission in the C-band (1530-1565 nm) or in the (C+L) band (1530-1625 nm), λCC is preferably not more than 1530 nm and is preferably a wavelength as long as possible. It is shown in
Fig. 5 that, for example, as long as λCC is set not less than 1460 nm, the increase of Λth can be controlled to not more than about 0.41 µm, when compared to the case of λCC = 1530 nm. When the multi-core optical fiber is applied to transmission in the (S+C+L) band (1460-1625 nm), λCC is preferably not more than 1460 nm and is preferably a wavelength as long as possible. For example, when λCC is not less than 1360 nm, the increase of Λth can be controlled to not more than about 0.82 µm, when compared to the case of λCC = 1460 nm, as shown inFig. 5 . - For increasing the transmission capacity of each core in the MCF, it is necessary to increase Aeff of each core, in order to decrease the non-linearity of each core. However, the increase of Aeff results in increase in Λth and decrease in the number of cores per MCF sectional area (core density). Then, it is necessary to devise the structure of cores, so as to increase Aeff, while suppressing the increase of Λth with enhanced confinement of light in the cores.
- For enhancing the confinement of light in the cores, it is preferable to adopt the cores in a trench type structure with properties of (1) to (4), having (1) a core part in a central region, (2) a cladding with a refractive index lower than the core part, around the core part, (3) a trench layer with a refractive index lower than the cladding, between the core part and the cladding, and (4) an inner cladding layer with a refractive index higher than the trench layer and lower than the core part, between the trench layer and the core part, because it can enhance the confinement of light of the fundamental mode in the cores with an assist of the trench layer and Λth can be made smaller in the relation of Aeff and Λth and the relation of λCC and Λth.
- Now, let us define Δ1 (%) as a relative index difference of the core part with reference to a certain refractive index n0, Δ2 (%) as a relative index difference of the inner cladding layer with respect to the refractive index n0, Δ3 (%) as a relative index difference of the trench layer with respect to the refractive index n0, Δ4 (%) as a relative index difference of the cladding with respect to the refractive index n0, 2a as an outside diameter of the core part, 2b as an outside diameter of the inner cladding layer, 2c as an outside diameter of the trench layer, Ra = a/b, and Rb = b/c. It is noted herein that a relative index difference Δ (%) of a refractive index n with respect to n0 is defined by Δ (%) = 100(n2 - n0 2)/(2n2). By arranging magnitude relations among Δ1, Δ2, Δ3, and Δ4, we obtain relations of Δ1 > Δ4 > Δ3 and Δ1 > Δ2 > Δ3.
- In manufacture of a pure silica core fiber that can realize a low transmission loss, fluorine or the like is added to make the refractive indices of the inner cladding layer, trench layer, and cladding smaller than that of the pure silica core. However, an excessively large change of refractive index due to fluorine doping is not preferred for stable and low-cost manufacture. An example of a condition to enable stable and low-cost manufacture of pure silica core fiber to realize a low transmission loss is that Δ1 - Δ3 is not more than about 0.81%. The core of the pure silica core fiber herein is preferably comprised of pure silica glass or preferably comprised of a silica glass containing C1 less than 2000 molppm, F not less than 2000 molppm and not more than 10000 molppm, and A2O (A is an alkali element) not less than 1 molppm and not more than 10000 molppm. The pure silica glass herein contains Cl not less than 2000 molppm and not more than 20000 molppm which is added during a dehydration process in manufacture. The alkali element of A2O is preferably Na, K, Rb, or Cs.
- On the basis of the condition in the case of Δ1 - Δ3 = 0.81% allowing the deepest trench layer, among the conditions enabling the stable and low-cost manufacture of pure silica core fiber as discussed above, let us study the design of preferred trench type cores as the cores of MCF. It is noted herein that in each design, adjustment of the effective area Aeff can be implemented by adjustment of the
core diameter 2a and, adjustment of the cutoff wavelength λCC by adjustment of the ratio Rb of the outside diameter of the inner cladding layer and the outside diameter of the trench layer. Since Δ1 - Δ3 = 0.81%, Δ2 and Δ4 are parameters that can be adjusted as to the refractive index. Therefore, when Aeff and λCC are fixed, the adjustable parameters are Ra, Δ2, and Δ4. - First,
Fig. 6 shows dependences of Λth on Ra and on Δ2 - Δ4, for the case of Aeff = 130 µm2 and λCC = 1460 nm and for the case of Aeff = 130 µm2 and λCC = 1530 nm, with Δ4 being fixed so as to keep Δ1 - Δ4 equal to 0.24%. The legends are values of Δ2 - Δ4, and six types were set in the range of -0.05% to 0.05%, each of which was investigated.Fig. 6A shows the case of λCC = 1460 nm andFig. 6B the case of λCC = 1530 nm. Although Δ2 - Δ4 is different among the series, it is shown that Δ2 - Δ4 causes little influence on Λth. Concerning Ra, inFig. 6A for the case of λCC = 1460 nm, Λth becomes minimum near Ra of 0.6 to 0.8, and it is thus preferable to set Ra in the range of 0.6 to 0.8. InFig. 6B for the case of λCC = 1530 nm, the larger Ra, the smaller Λth; therefore, it is preferable to set Ra in the range of 0.6 to 1. In either case, when Ra is not more than 0.6, Λth tends to increase with decrease of Ra; particularly, when Ra is below 0.5, the slopes of the graphs become larger and therefore it is preferable to set Ra not less than at least 0.5. - From the above results, in the light of little influence of Δ2 on Λth and with the setting of Δ2 = Δ4 for simplicity,
Fig. 7 shows dependences of Λth on Ra and on Δ3 - Δ4 (= Δ3 - Δ2, corresponding to the depth of the trench layer Δ relative to the cladding), for the case of Aeff = 130 µm2 and λCC = 1460 nm and for the case of Aeff = 130 µm2 and λCC = 1530 nm.Fig. 7A shows the case of λCC = 1460 nm andFig. 7B the case of λCC = 1530 nm. Each of the figures include graphs where Ra is 0.4, 0.5, 0.6, and 0.7. In the drawings, a blue line indicates Λth at the wavelength of 1625 nm in the case of the step-index type core with equal Aeff and λCC and a green line Λth at the wavelength of 1625 nm in the case of the step-index type core with Aeff of 80 µm2 and equal λCC. Concerning Ra, Λth tends to decrease slightly with increase of Ra, but it is not a significant dependence. In contrast to it, the dependence on Δ3 - Δ4 is dominant, and it is shown fromFig. 7 that Λth decreases with decrease in Δ3 - Δ4 (or with increase in depth Δ of the trench layer relative to the cladding). - Next, let us investigate Λth. Under the same conditions of Aeff and λCC, Λth is preferably smaller than at least those of the step-index type cores shown in
Fig. 4 . However, it should be noted that it is not the case that Λth is always smaller than in the case of the step-index type cores as long as the cores are the trench type cores. - For example, in the case of the step-index type cores with Aeff = 130 µm2 and λCC = 1530 nm, it is shown by
Fig. 4 that: - Λth at the wavelength of 1550 nm is 44.4 µm,
- Λth at the wavelength of 1565 nm is 44.9 µm, and
- Λth at the wavelength of 1625 nm is 46.7 µm, and therefore,
- in the case of the cores with Aeff of not less than 120 µm2 and λCC ≤ 1530 nm, preferably,
- Λth at the wavelength of 1550 nm is not more than about 44.4 µm, or,
- Λth at the wavelength of 1565 nm is not more than about 44.9 µm, or,
- Λth at the wavelength of 1625 nm is not more than about 46.7 µm.
- For example, in the case of the step-index type cores with Aeff = 130 µm2 and λCC = 1460 nm, it is shown by
Fig. 4 that: - Λth at the wavelength of 1550 nm is 45.5 µm,
- Λth at the wavelength of 1565 nm is 45.8 µm, and
- Λth at the wavelength of 1625 nm is 47.9 µm, and therefore,
- in the case of the cores with Aeff of not less than 120 µm2 and λCC ≤ 1460 nm, preferably,
- Λth at the wavelength of 1550 nm is not more than about 45.5 µm, or,
- Λth at the wavelength of 1565 nm is not more than about 45.8 µm, or,
- Λth at the wavelength of 1625 nm is not more than about 47.9 µm.
- For example, in the case of the step-index type cores with λCC = 1530 nm and Aeff = 80 µm2, it is shown by
Fig. 5 that: - Λth at the wavelength of 1550 nm is about 37.6 µm,
- Λth at the wavelength of 1565 nm is about 38.0 µm, and
- Λth at the wavelength of 1625 nm is about 39.6 µm, and therefore,
- in the case of the cores with Aeff of not less than 120 µm2 and λCC ≤ 1530 nm, more preferably,
- Λth at the wavelength of 1550 nm is not more than about 37.6 µm, or,
- Λth at the wavelength of 1565 nm is not more than about 38.0 µm, or,
- Λth at the wavelength of 1625 nm is not more than about 39.6 µm.
- For example, in the case of the step-index type cores with λCC = 1460 nm and Aeff = 80 µm2, it is shown by
Fig. 5 that: - Λth at the wavelength of 1550 nm is about 37.9 µm,
- Λth at the wavelength of 1565 nm is about 38.3 µm, and
- Λth at the wavelength of 1625 nm is about 40.0 µm, and therefore,
- in the case of the cores with Aeff of not less than 120 µm2 and λCC ≤ 1460 nm, more preferably,
- Λth at the wavelength of 1550 nm is not more than about 37.9 µm, or,
- Λth at the wavelength of 1565 nm is not more than about 38.3 µm, or,
- Λth at the wavelength of 1625 nm is not more than about 40.0 µm.
- Since
Fig. 7 shows the graphs about Λth at the wavelength of 1625 nm for the case of λCC = 1460 nm (Fig. 7A ) and for the case of λCC = 1530 nm (Fig. 7B ) with Aeff = 130 µm2, if Λth is not more than 47.9 µm in the case ofFig. 7A , Λth becomes smaller than in the case of the step-index type core with equal Aeff and λCC. In the case ofFig. 7B , if Λth is not more than 46.7 µm, Λth becomes smaller than in the case of the step-index type core with equal Aeff and λCC. It is, however, seen fromFig. 7 that, even in the case of the trench type core, Λth can be larger than in the case of the step-index type core with equal Aeff and λCC, depending upon design. - Now, let us consider conditions for keeping Λth smaller in the case of the trench type core under investigation than in the case of the step-index type core with equal Aeff and λCC. In the case of Aeff = 130 µm2 and λCC = 1530 nm (
Fig. 7B ), when Ra is considered to be in the range of not less than about 0.5, one has to satisfy the conditions that Δ3 - Δ4 is not more than about -0.53% and Δ1 - Δ4 is not more than about 0.28%; or, when Ra is considered to be in the range of not less than about 0.6, one has to satisfy the conditions that Δ3 - Δ4 is not more than about -0.51% and Δ1 - Δ4 is not more than about 0.30%. - Fr making Λth smaller in the case of the trench type core under investigation than in the case of the step-index type core with equal λCC and Aeff of 80 µm2, the preferred conditions for the case of Aeff = 130 µm2 and λCC = 1530 nm (
Fig. 7B ) are as follows:
when Ra is considered to be in the range of not less than about 0.5, it is preferable to satisfy the conditions that Δ3 - Δ4 is not more than about -0.57% and Δ1 - Δ4 is not more than about 0.24%; or, when Ra is considered to be in the range of not less than about 0.6, it is preferable to satisfy the conditions that Δ3 - Δ4 is not more than about -0.56% and Δ1 - Δ4 is not more than about 0.25%. - Examples of more specific design include structures of (i) to (iii) below.
- (i) 2a = 12.8 µm, Ra = 0.6, Rb = 0.819, Δ1 = 0.26%, Δ2 = 0%, Δ3 = -0.55%, and Δ4 = 0%.
- (ii) 2a = 12.4 µm, Ra = 0.6, Rb = 0.622, Δ1 = 0.22%, Δ2 = 0%, Δ3 = -0.59%, and Δ4 = 0%.
- (iii) 2a = 12.4 µm, Ra = 0.6, Rb = 0.673, Δ1 = 0.22%, Δ2 = 0%, Δ3 = -0.59%, and Δ4 = 0%.
- The properties in the respective structures are as described below.
- In the case of (i), Aeff is about 130 µm2, λCC is about from 1460 to 1480 nm, and Λth is 43.3 µm at the wavelength of 1565 nm and 45.2 µm at the wavelength of 1625 nm. The chromatic dispersion at the wavelength of 1550 nm is about 23 ps/nm/km.
- In the case of (ii), Aeff is about 130 µm2, λCC is about from 1490 to 1520 nm, and Λth is 34.9 µm at the wavelength of 1565 nm and 36.6 µm at the wavelength of 1625 nm. The chromatic dispersion at the wavelength of 1550 nm is about 23 ps/nm/km.
- In the case of (iii), Aeff is about 130 µm2, λCC is about from 1430 to 1440 nm, and Λth is 38.7 µm at the wavelength of 1565 nm and 40.7 µm at the wavelength of 1625 nm. The chromatic dispersion at the wavelength of 1550 nm is about 23 ps/nm/km.
- It is noted herein that the certain refractive index n0 may be the refractive index of pure silica or may be any other refractive index.
- Among structures around the structure of (i), a preferred structure is also one satisfying structure (i. 1):
- 12.1 ≤ 2a (µm) ≤ 13.3;
- 0.496 ≤ Ra ≤ 0.739;
- 0.713 ≤ Rb;
- 0.21 ≤ Δ1 (%) ≤ 0.28;
- -0.07 ≤ Δ2 (%) ≤ 0.04;
- -1.62 ≤ Δ3 (%);
- -0.02 ≤ Δ4 (%) ≤ 0.05.
- This is the result of selection of the preferred numerical ranges of the respective parameters by the study described below. First, the necessary conditions for satisfying λCC ≤ 1530 nm are as follows:
- 2a (µm) ≤ 13.3;
- Ra ≥ 0.496;
- Rb ≥ 0.713;
- Δ1 (%) ≤ 0.28;
- Δ2 (%) ≤ 0.04;
- Δ3 (%) ≥ -1.62;
- Δ4 (%) ≥ -0.02.
-
Figs. 15 to 21 show the results of investigation on relations between each of the parameters of the trench type core and Aeff under the design center conditions of 2a = 12.8 µm, Ra = 0.6, Rb = 0.819, Δ1 = 0.26%, Δ2 = 0%, Δ3 = -0.55%, and Δ4 = 0%.Fig. 15 is a drawing showing the relation between 2a and Aeff;Fig. 16 a drawing showing the relation between Ra and Aeff;Fig. 17 a drawing showing the relation between 1/Rb and Aeff;Fig. 18 a drawing showing the relation between Δ1 and Aeff;Fig. 19 a drawing showing the relation between Δ2 and Aeff;Fig. 20 a drawing showing the relation between Δ3 and Aeff;Fig. 21 a drawing showing the relation between Δ4 and Aeff. It is found from these results that the necessary conditions for satisfying Aeff ≥ 120 µm2 are as follows: - 2a (µm) ≥ 12.1;
- Ra ≤ 0.739;
- Δ1 (%) ≤ 0.32
- Δ2 (%) ≥ -0.07.
- Furthermore,
Figs. 22 to 28 show the results of investigation on relations between each of the parameters of the trench type core and normalized bending loss under the design center conditions of 2a = 12.8 µm, Ra = 0.6, Rb = 0.819, Δ1 = 0.26%, Δ2 = 0%, Δ3 = -0.55%, and Δ4 = 0%. The normalized bending loss herein refers to a value obtained by dividing a bending loss per 100 turns (dB/100 turns) in the bending radius of 30 mm at thewavelength 1625 nm, by 0.5 dB. If it is 1 or less, the bending loss per 100 turns becomes 0.5 dB/100 turns or less.Fig. 22 is a drawing showing the relation between 2a and normalized bending loss;Fig. 23 a drawing showing the relation between Ra and normalized bending loss;Fig. 24 a drawing showing the relation between 1/Rb and normalized bending loss;Fig. 25 a drawing showing the relation between Δ1 and normalized bending loss;Fig. 26 a drawing showing the relation between Δ2 and normalized bending loss;Fig. 27 a drawing showing the relation between Δ3 and normalized bending loss;Fig. 28 a drawing showing the relation between Δ4 and normalized bending loss. It is found from these results that the necessary conditions for the bending loss per 100 turns in the bending radius of 30 mm at the wavelength of 1625 nm to satisfy 0.5 dB/100 turns or less are as follows: - Δ1 (%) ≥ 0.21;
- Δ4 (%) ≤ 0.05.
- In terms of the chromatic dispersion, in the range satisfying the structure (i. 1), the chromatic dispersion at the wavelength of 1550 nm is preferably a value over at least 20 ps/nm/km.
- In terms of the transmission loss as well, the structure satisfying the structure (i. 1) is preferred. The major factor for the transmission loss is Rayleigh scattering, and the transmission loss due to Rayleigh scattering can be calculated from a distribution of Rayleigh scattering coefficients (Rayleigh scattering coefficients of materials) in the cross section of MCF and a power distribution of propagation modes. It is, however, confirmed by calculation that the transmission loss due to Rayleigh scattering at the wavelength of 1550 nm in the case of the structure (i. 1) is smaller than that in the core structure described in "T. Ayashi et al. (non-patent literature first cited in paragraph 78 as a particularly relevant document)" realizing 0.181 dB/km or less.
- A further necessary condition in addition to the above conditions in order to keep Λth smaller than in the case of the step-index type core with Aeff = 130 µm2 and λCC = 1530 nm can be, in the case of Λth at the wavelength of 1565 nm, that Λth, is not more than about 44.9 µm. Investigation was conducted in view of this point.
Figs. 29 to 35 show the results of investigation on relations between each of the parameters of the trench type core and Λth at the wavelength of 1565 nm under the design center conditions of 2a = 12.8 µm, Ra = 0.6, Rb = 0.819, Δ1 = 0.26%, Δ2 = 0%, Δ3 = -0.55%, and Δ4 = 0%.Fig. 29 is a drawing showing the relation between 2a and Λth;Fig. 30 a drawing showing the relation between Ra and Λth;Fig. 31 a drawing showing the relation between 1/Rb and Λth;Fig. 32 a drawing showing the relation between Δ1 and Λth;Fig. 33 a drawing showing the relation between Δ2 and Λth;Fig. 34 a drawing showing the relation between Δ3 and Λth;Fig. 35 a drawing showing the relation between Δ4 and Λth. Since it is found by these results that it is preferable to satisfy the following conditions: - Ra ≤ 0.729;
- Rb ≤ 0.866;
- Δ1 (%) ≥ 0.24;
- Δ3 (%) ≤ -0.37;
- Δ4 (%) ≤ 0.03,
- 12.1 ≤ 2a (µm) ≤ 13.3;
- 0.496 ≤ Ra ≤ 0.729;
- 0.713 ≤ Rb ≤ 0.866;
- 0.24 ≤ A1 (%) ≤0.28;
- -0.07 ≤ Δ2 (%) ≤ 0.04;
- -1.62 ≤ Δ3 (%) ≤ -0.37;
- -0.02 ≤ Δ4 (%) ≤ 0.03.
- Next, among structures around the structure of (ii), a preferred structure is also one satisfying structure (ii. 1):
- 11.7 ≤ 2a (µm) ≤ 12.4;
- 0.596 ≤ Ra ≤ 0.699;
- 0.618 ≤ Rb ≤ 0.787;
- 0.18 ≤ Δ1 (%) ≤0.22;
- -0.05 ≤ Δ2 (%) ≤ 0.02;
- -0.59 ≤ Δ3 (%) ≤ -0.25;
- -0.01 ≤ Δ4 (%) ≤ 0.04.
-
Figs. 36 to 42 show the results of investigation on relations between each of the parameters of the trench type core and λCC under the design center conditions of 2a = 12.4 µm, Ra = 0.6, Rb = 0.622, Δ1 = 0.22%, Δ2 = 0%, Δ3 = -0.59%, and Δ4 = 0%.Fig. 36 is a drawing showing the relation between 2a and λCC;Fig. 37 a drawing showing the relation between Ra and λCC,Fig. 38 a drawing showing the relation between 1/Rb and λCC;Fig. 39 a drawing showing the relation between Δ1 and λCC;Fig. 40 a drawing showing the relation between Δ2 and λCC;Fig. 41 a drawing showing the relation between Δ3 and λCC;Fig. 42 a drawing showing the relation between Δ4 and λCC. It is found from these results that the necessary conditions for satisfying λCC ≤ 1530 nm are as follows: - 2a (µm) ≤ 12.4;
- Ra ≥ 0.596;
- Rb ≥ 0.618;
- Δ1 (%) ≤ 0.22;
- Δ2 (%) ≤ 0.02;
- Δ3 (%) ≥ -0.59;
- Δ4 (%) ≥ -0.01.
-
Figs. 43 to 49 show the results of investigation on relations between each of the parameters of the trench type core and Aeff under the design center conditions of 2a = 12.4 µm, Ra = 0.6, Rb = 0.622, Δ1 = 0.22%, Δ2 = 0%, Δ3 = -0.59%, and Δ4 = 0%.Fig. 43 is a drawing showing the relation between 2a and Aeff;Fig. 44 a drawing showing the relation between Ra and Aeff;Fig. 45 a drawing showing the relation between 1/Rb and Aeff;Fig. 46 a drawing showing the relation between Δ1 and Aeff;Fig. 47 a drawing showing the relation between Δ2 and Aeff;Fig. 48 a drawing showing the relation between Δ3 and Aeff;Fig. 49 a drawing showing the relation between Δ4 and Aeff. It is found from these results that the necessary conditions for satisfying Aeff ≥ 120 µm2 are as follows: - 2a (µm) ≥ 11.7;
- Ra ≤ 0.699;
- Δ1 (%) ≤ 0.27;
- Δ2 (%) ≥ -0.05.
- Furthermore,
Figs. 50 to 56 show the results of investigation on relations between each of the parameters of the trench type core and normalized bending loss under the design center conditions of 2a = 12.4 µm, Ra = 0.6, Rb = 0.622, Δ1 = 0.22%, Δ2 = 0%, Δ3 = -0.59%, and Δ4 = 0%. The normalized bending loss herein refers to a value obtained by dividing a bending loss per 100 turns (dB/100 turns) in the bending radius of 30 mm at thewavelength 1625 nm, by 0.5 dB. If it is 1 or less, the bending loss per 100 turns becomes 0.5 dB/100 turns or less.Fig. 50 is a drawing showing the relation between 2a and normalized bending loss;Fig. 51 a drawing showing the relation between Ra and normalized bending loss;Fig. 52 a drawing showing the relation between 1/Rb and normalized bending loss;Fig. 53 a drawing showing the relation between Δ1 and normalized bending loss;Fig. 54 a drawing showing the relation between Δ2 and normalized bending loss;Fig. 55 a drawing showing the relation between Δ3 and normalized bending loss;Fig. 56 a drawing showing the relation between Δ4 and normalized bending loss. It is found from these results that the necessary conditions for the bending loss per 100 turns in the bending radius of 30 mm at the wavelength of 1625 nm to satisfy 0.5 dB/100 turns or less are as follows: - Ra ≤ 0.728;
- Rb ≤ 0.787;
- Δ1 (%) ≥ 0.18;
- Δ3 (%) ≤ -0.25;
- Δ4 (%) ≤ 0.04.
- The structure (ii. 1) is one calculated in view of the above results. In terms of the chromatic dispersion as well, in the range satisfying the structure (ii. 1), the chromatic dispersion at the wavelength of 1550 nm is preferably a value over at least 20 ps/nm/km.
- In view of the transmission loss as well, it is also confirmed by calculation that the transmission loss due to Rayleigh scattering at the wavelength of 1550 nm in the case of the structure (ii. 1) is smaller than that in the core structure of
Reference Literature 5 realizing 0.181 dB/km or less, and it is thus preferable to adopt a structure satisfying the structure (ii. 1). - A further necessary condition in addition to the above conditions for keeping Λth smaller than in the case of the step-index type core with Aeff = 130 µm2 and λCC = 1530 nm can be, in the case of Λth at the wavelength of 1565 nm, that Λth is not more than about 44.9 µm.
Figs. 57 to 63 show the results of investigation on relations between each of the parameters of the trench type core and Λth at the wavelength of 1565 nm under the design center conditions of 2a = 12.4 µm, Ra = 0.6, Rb = 0.622, Δ1 = 0.22%, Δ2 = 0%, Δ3 = -0.59%, and Δ4 = 0%.Fig. 57 is a drawing showing the relation between 2a and Λth;Fig. 58 a drawing showing the relation between Ra and Λth;Fig. 59 a drawing showing the relation between 1/Rb and Λth;Fig. 60 a drawing showing the relation between Δ1 and Λth;Fig. 61 a drawing showing the relation between Δ2 and Λth;Fig. 62 a drawing showing the relation between Δ3 and Λth;Fig. 63 a drawing showing the relation between Δ4 and Λth. Since it is found from these results that the condition for keeping Λth not more than about 44.9 µm is:
Rb ≤ 0.777,
it is more preferable to adopt a structure satisfying structure (ii. 2): - 11.7 ≤ 2a (µm) ≤ 12.4;
- 0.596 ≤ Ra ≤ 0.699;
- 0.618 ≤ Rb ≤ 0.777;
- 0.18 ≤ Δ1 (%) ≤ 0.22;
- -0.05 ≤ Δ2 (%) ≤ 0.02
- -0.59 ≤ Δ3 (%) ≤ -0.25;
- -0.01 ≤ Δ4 (%) ≤ 0.04.
- A further necessary condition in addition to the above conditions for keeping Λth smaller than in the case of the step-index type core with Aeff = 80 µm2 and λCC = 1530 nm can be, in the case of Λth at the wavelength of 1565 nm, that Λth is not more than about 38.0 µm. Therefore, since it is found based on the results of
Figs. 57 to 63 that the conditions for keeping Λth not more than about 38.0 µm are as follows: - Ra ≤ 0.684;
- Rb ≤ 0.665;
- Δ3 (%) ≤ -0.48,
- 11.7 ≤ 2a (µm) ≤ 12.4;
- 0.596 ≤ Ra ≤ 0.684;
- 0.618 ≤ Rb ≤ 0.665;
- 0.18 ≤ Δ1 (%) ≤ 0.22;
- -0.05 ≤ Δ2 (%) ≤ 0.02
- -0.59 ≤ Δ3 (%) ≤ -0.48;
- -0.01 ≤ Δ4 (%) ≤ 0.04.
- Next, among structures around the structure of (iii), a desired structure is also one satisfying structure (iii. 1):
- 11.7 ≤ 2a (µm) ≤ 13.2;
- 0.537 ≤ Ra ≤ 0.704;
- 0.623 ≤ Rb ≤ 0.792;
- 0.20 ≤ Δ1 (%) ≤ 0.26;
- -0.06 ≤ Δ2 (%) ≤ 0.10
- -0.83 ≤ Δ3 (%) ≤ -0.32;
- -0.03 ≤ Δ4 (%) ≤ 0.02.
-
Figs. 64 to 70 show the results of investigation on relations between each of the parameters of the trench type core and λCC under the design center conditions of 2a = 12.4 µm, Ra = 0.6, Rb = 0.673, Δ1 = 0.22%, Δ2 = 0%, Δ3 = -0.59%, and Δ4 = 0%.Fig. 64 is a drawing showing the relation between 2a and λCC;Fig. 65 a drawing showing the relation between Ra and λCC;Fig. 66 a drawing showing the relation between 1/Rb and λCC;Fig. 67 a drawing showing the relation between Δ1 and λCC;Fig. 68 a drawing showing the relation between Δ2 and λCC;Fig. 69 a drawing showing the relation between Δ3 and λCC;Fig. 70 a drawing showing the relation between Δ4 and λCC. It is confirmed from these results that the necessary conditions for satisfying λCC ≤ 1530 nm are as follows: - 2a (µm) ≤ 13.2;
- Ra ≥ 0.537;
- Rb ≥ 0.623;
- Δ1 (%) ≤ 0.26;
- Δ2 (%) ≤ 0.10;
- Δ3 (%) ≥ -0.83;
- Δ4 (%) ≥ -0.03.
-
Figs. 71 to 77 show the results of investigation on relations between each of the parameters of the trench type core and Aeff under the design center conditions of 2a = 12.4 µm, Ra = 0.6, Rb = 0.673, Δ1 = 0.22%, Δ2 = 0%, Δ3 = -0.59%, and Δ4 = 0%.Fig. 71 is a drawing showing the relation between 2a and Aeff;Fig. 72 a drawing showing the relation between Ra and Aeff;Fig. 73 a drawing showing the relation between 1/Rb and Aeff;Fig. 74 a drawing showing the relation between Δ1 and Aeff;Fig. 75 a drawing showing the relation between Δ2 and Aeff;Fig. 76 a drawing showing the relation between Δ3 and Aeff;Fig. 77 a drawing showing the relation between Δ4 and Aeff. It is confirmed from these results that the necessary conditions for satisfying Aeff ≥ 120 µm2 are as follows: - 2a (µm) ≥ 11.7;
- Ra ≤ 0.710;
- Δ1 (%) ≤ 0.28;
- Δ2 (%) ≥ -0.06.
- Furthermore,
Figs. 78 to 84 show the results of investigation on relations between each of the parameters of the trench type core and normalized bending loss under the design center conditions of 2a = 12.4 µm, Ra = 0.6, Rb = 0.673, Δ1 = 0.22%, Δ2 = 0%, Δ3 = -0.59%, and Δ4 = 0%. The normalized bending loss herein refers to a value obtained by dividing a bending loss per 100 turns (dB/100 turns) in the bending radius of 30 mm at the wavelength of 1625 nm, by 0.5 dB. If it is 1 or less, the bending loss per 100 turns becomes 0.5 dB/100 turns or less.Fig. 78 is a drawing showing the relation between 2a and normalized bending loss;Fig. 79 a drawing showing the relation between Ra and normalized bending loss;Fig. 80 a drawing showing the relation between 1/Rb and normalized bending loss;Fig. 81 a drawing showing the relation between Δ1 and normalized bending loss;Fig. 82 a drawing showing the relation between Δ2 and normalized bending loss;Fig. 83 a drawing showing the relation between Δ3 and normalized bending loss;Fig. 84 a drawing showing the relation between Δ4 and normalized bending loss. It is confirmed from these results that the necessary conditions for the bending loss per 100 turns in the bending radius of 30 mm at the wavelength of 1625 nm to satisfy 0.5 dB/100 turns or less are as follows: - 2a (µm) ≥ 11.7
- Ra ≤ 0.704;
- Rb ≤ 0.792;
- Δ1 (%) ≥ 0.20;
- Δ3 (%) ≤ -0.32;
- Δ4 (%) ≤ 0.02.
- It is found from
Figs. 64 to 70 that necessary conditions in addition to the above conditions for satisfying λCC ≤ 1460 nm allowing application to the S-band range are as follows: - 2a (µm) ≤ 12.6;
- Ra ≥ 0.584;
- Rb ≥ 0.658;
- Δ1 (%) ≤ 0.23;
- Δ2 (%) ≤ 0.03;
- Δ3 (%) ≥ -0.65;
- Δ4 (%) ≥ -0.01.
- Therefore, it is more preferable to adopt a structure satisfying the following conditions:
- 11.7 ≤ 2a (µm) ≤ 12.6;
- 0.584 ≤ Ra ≤ 0.704;
- 0.658 ≤ Rb ≤ 0.792;
- 0.20 ≤ Δ1 (%) ≤ 0.23;
- -0.06 ≤ Δ2 (%) ≤ 0.03
- -0.65 ≤ Δ3 (%) ≤ -0.32;
- -0.01 ≤ Δ4 (%) ≤ 0.02.
- In terms of the chromatic dispersion, in the range satisfying the structure (iii. 1), the chromatic dispersion at the wavelength of 1550 nm is preferably a value over at least 20 ps/nm/km.
- In terms of the transmission loss, it is confirmed by calculation that the transmission loss due to Rayleigh scattering at the wavelength of 1550 nm in the case of the structure (iii. 1) is smaller than that in the core structure described in
Reference Literature 5 realizing 0.181 dB/km or less, and it is thus preferable to adopt a structure satisfying the structure (iii. 1). - A further necessary condition in addition to the above conditions for keeping Λth smaller than in the case of the step-index type core with Aeff = 130 µm2 and λCC = 1460 nm can be, in the case of Λth at the wavelength of 1565 nm, that Λth is not more than about 45.8 µm.
Figs. 85 to 91 show the results of investigation on relations between each of the parameters of the trench type core and Λth at the wavelength of 1565 nm under the design center conditions of 2a = 12.4 µm, Ra = 0.6, Rb = 0.673, Δ1 = 0.22%, Δ2 = 0%, Δ3 = -0.59%, and Δ4 = 0%.Fig. 85 is a drawing showing the relation between 2a and Λth;Fig. 86 a drawing showing the relation between Ra and Λth;Fig. 87 a drawing showing the relation between 1/Rb and Λth;Fig. 88 a drawing showing the relation between Δ1 and Λth;Fig. 89 a drawing showing the relation between Δ2 and Λth;Fig. 90 a drawing showing the relation between Δ3 and Λth;Fig. 91 a drawing showing the relation between Δ4 and Λth. It is confirmed from these results that the necessary condition for Λth to satisfy about 45.8 µm or less is as follows:
Δ3 (%) ≤ -0.30. - Therefore, it is more preferable to adopt a structure satisfying the structure (iii. 2):
- 11.7 ≤ 2a (µm) ≤ 12.4;
- 0.596 ≤ Ra ≤ 0.699;
- 0.618 ≤ Rb ≤ 0.777;
- 0.18 ≤ Δ1 (%) ≤ 0.22;
- -0.05 ≤ Δ2 (%) ≤ 0.02
- -0.59 ≤ Δ3 (%) ≤ -0.30;
- -0.01 ≤ Δ4 (%) ≤ 0.04.
- The above described the embodiments of the present invention and it should be noted that the present invention is by no means limited to the above embodiments but can be modified in many ways as defined by the appended claims.
- 100 multi-core optical fiber; 110 core; 120 inner cladding layer; 130 trench layer; 140 cladding layer.
Claims (11)
- A multi-core optical fiber (100) comprising a plurality of cores (110), wherein
a core neighboring region including at least any one of the plurality of cores (110) is comprised of:a cladding (140) surrounding an outer peripheral surface of the core (110) and having a refractive index lower than the core (110);a trench layer (130) provided between the core (110) and the cladding (140) and having a refractive index lower than the cladding (140); andan inner cladding layer (120) provided between the trench layer (130) and the core (110) and having a refractive index higher than the trench layer (130) and lower than the core (110), andwherein when Ra represents a ratio of an outside diameter of the core to an outside diameter of the inner cladding layer, Δ1 a relative index difference of the core with respect to a certain refractive index, Δ3 a relative index difference of the trench layer with respect to the certain refractive index, and Δ4 a relative index difference of the cladding with respect to the certain refractive index, said Ra, Δ1, Δ3, and Δ4 satisfy either:a first relation that Ra is not less than about 0.5, and,Δ3 - Δ4 is not more than about -0.53%, and,Δ1 - Δ4 is not more than about 0.28%; or,a second relation that Ra is not less than about 0.6, andΔ3 - Δ4 is not more than about -0.51%, and,Δ1 - Δ4 is not more than about 0.30%, andthe multi-core optical fiber satisfying at least one of first to third conditions, whereinthe first condition is defined by satisfying both of relations of Expressions (1) and (2) below at a wavelength of 1550 nm, when a first core represents a core with a largest crosstalk from other core, D [ps/(nm·km)] represents a chromatic dispersion of the first core, Aeff [µm2] represents an effective area of the first core, αdB [dB/km] represents a transmission loss of the first core, ηWC [/km] represents a sum of power coupling coefficients to the first core from the other cores, µX,WC [dB] [dB] represents a sum of statistical averages of crosstalks to the first core from the other cores after 80 km propagation,
 the second condition is defined by:a fundamental mode in each of the plurality of cores having an effective area of not less than 120 µm2 at the wavelength of 1550 nm, a transmission loss of not more than 0.195 dB/km at the wavelength of 1550 nm, a chromatic dispersion of not less than about 17 ps/(nm·km) at the wavelength of 1550 nm, and a bending loss per 100 turns of not more than 0.5 dB in a bending radius of 30 mm at a wavelength of 1625 nm;a difference of the transmission loss of the fundamental mode at the wavelength of 1550 nm between different cores out of the plurality of cores, the difference being at most 0.02 dB/km or less; anda sum of statistical averages of crosstalks to a core from other cores out of the plurality of cores after 80 km propagation, the sum being not more than -32.9 dB at the wavelength of 1550 nm, and whereinthe third condition is defined by:a fundamental mode in each of the plurality of cores having an effective area of not less than 80 µm2 at the wavelength of 1550 nm, a transmission loss of not more than 0.195 dB/km at the wavelength of 1550 nm, a chromatic dispersion of not less than about 17 ps/(nm·km) at the wavelength of 1550 nm, and a bending loss per 100 turns of not more than 0.5 dB in a bending radius of 30 mm at the wavelength of 1625 nm;a difference of the transmission loss of the fundamental mode at the wavelength of 1550 nm between different cores out of the plurality of cores, the difference being at most 0.02 dB/km or less; anda sum of statistical averages of crosstalks to the certain core from other cores out of the plurality of cores after 80 km propagation, the certain core represents a core with a largest crosstalk from other cores, the sum being not less than -53.4 dB and not more than -33.9 dB at the wavelength of 1550 nm.
 - The multi-core optical fiber according to claim 1, wherein when κ represents a mode coupling coefficient between different cores out of the plurality of cores, Λ represents a core pitch, and β represents a propagation constant of each core, /\th is defined as Λ satisfying Expression (3) below:
 wherein the plurality of cores include a core of a structure satisfying any one of said /\th of not more than 44.4 µm at the wavelength of 1550 nm, said /\th of not more than 44.9 µm at the wavelength of 1565 nm, and said /\th of not more than 46.7 µm at the wavelength of 1625 nm, andwherein the shortest Λ between different cores out of the plurality of cores is not less than said Λth.
 - The multi-core optical fiber according to claim 1, which has a cable cutoff wavelength of not more than 1530 nm.
- The multi-core optical fiber according to claim 3, which has the cable cutoff wavelength of not less than 1460 nm.
- The multi-core optical fiber according to claim 1, which has the cable cutoff wavelength of not less than 1360 nm and not more than 1460 nm.
- The multi-core optical fiber according to claim 1,
wherein when 2a represents an outside diameter of the core, Rb a ratio of the outside diameter of the inner cladding layer to an outside diameter of the trench layer, and Δ2 a relative index difference of the inner cladding layer with respect to the certain refractive index, said 2a, Ra, Rb, Δ1, Δ2, Δ3, and Δ4 satisfy the following relations:12.1 ≤ 2a (µm) ≤ 13.3;0.496 ≤ Ra ≤ 0.739;0.713 ≤ Rb;0.21 ≤ Δ1 (%) ≤ 0.28;-0.07 ≤ Δ2 (%) ≤ 0.04;-1.62 ≤ Δ3 (%);-0.02 ≤ Δ4 (%) ≤ 0.05. - The multi-core optical fiber according to claim 6, wherein a core pitch between the plurality of cores is not less than 43.3 µm.
- The multi-core optical fiber according to claim 1,
wherein when 2a represents an outside diameter of the core, Rb a ratio of the outside diameter of the inner cladding layer to an outside diameter of the trench layer, and Δ2 a relative index difference of the inner cladding layer with respect to the certain refractive index, said 2a, Ra, Rb, Δ1, Δ2, Δ3, and Δ4 satisfy the following relations:11.7 ≤ 2a (µm) ≤ 12.4;0.596 ≤ Ra ≤ 0.699;0.618 ≤ Rb ≤ 0.787;0.18 ≤ Δ1 (%) ≤ 0.22;-0.05 ≤ Δ2 (%) ≤ 0.02;-0.59 ≤ Δ3 (%) ≤ -0.25;-0.01 ≤ Δ4 (%) ≤ 0.04. - The multi-core optical fiber according to claim 8, wherein a core pitch between the plurality of cores is not less than 34.9 µm.
- The multi-core optical fiber according to claim 1,
wherein when 2a represents an outside diameter of the core, Rb a ratio of the outside diameter of the inner cladding layer to an outside diameter of the trench layer, and Δ2 a relative index difference of the inner cladding layer with respect to the certain refractive index, said 2a, Ra, Rb, Δ1, Δ2, Δ3, and Δ4 satisfy the following relations:11.7 ≤ 2a (µm) ≤ 13.2;0.537 ≤ Ra ≤ 0.704;0.623 ≤ Rb ≤ 0.792;0.20 ≤ Δ1 (%) ≤ 0.26;-0.06 ≤ Δ2 (%) ≤ 0.10-0.83 ≤ Δ3 (%) ≤ -0.32;-0.03 ≤ Δ4 (%) ≤ 0.02. - The multi-core optical fiber according to claim 10, wherein a core pitch between the plurality of cores is not less than 38.7 µm.
Applications Claiming Priority (3)
| Application Number | Priority Date | Filing Date | Title |
|---|---|---|---|
| JP2012044633 | 2012-02-29 | ||
| JP2012154940 | 2012-07-10 | ||
| PCT/JP2013/054346 WO2013129232A1 (en) | 2012-02-29 | 2013-02-21 | Multicore optical fiber |
Publications (3)
| Publication Number | Publication Date |
|---|---|
| EP2821824A1 EP2821824A1 (en) | 2015-01-07 |
| EP2821824A4 EP2821824A4 (en) | 2015-10-28 |
| EP2821824B1 true EP2821824B1 (en) | 2021-04-21 |
Family
ID=49082432
Family Applications (1)
| Application Number | Title | Priority Date | Filing Date |
|---|---|---|---|
| EP13754922.6A Active EP2821824B1 (en) | 2012-02-29 | 2013-02-21 | Multicore optical fiber |
Country Status (6)
| Country | Link |
|---|---|
| US (1) | US8811785B2 (en) |
| EP (1) | EP2821824B1 (en) |
| JP (1) | JP6156359B2 (en) |
| CN (1) | CN104145197B (en) |
| DK (1) | DK2821824T3 (en) |
| WO (1) | WO2013129232A1 (en) |
Families Citing this family (20)
| Publication number | Priority date | Publication date | Assignee | Title |
|---|---|---|---|---|
| KR101763633B1 (en) * | 2014-08-14 | 2017-08-02 | 한국과학기술원 | Trench-assisted multicore fiber structure with inhomogeneous trench for redecing cutoff wavelengh |
| WO2016152507A1 (en) * | 2015-03-25 | 2016-09-29 | 住友電気工業株式会社 | Multicore optical fiber |
| JP2017072818A (en) * | 2015-10-08 | 2017-04-13 | 住友電気工業株式会社 | Multi-core optical fiber, multi-core optical fiber cable and optical fiber transmission system |
| JP6668833B2 (en) * | 2016-03-09 | 2020-03-18 | 住友電気工業株式会社 | Coupled multi-core optical fiber |
| JP6862712B2 (en) * | 2016-08-05 | 2021-04-21 | 住友電気工業株式会社 | Optical fiber evaluation method and optical fiber evaluation device |
| JP6560806B1 (en) * | 2018-11-21 | 2019-08-14 | 日本電信電話株式会社 | Multi-core optical fiber, multi-core optical fiber design method, and optical transmission method |
| JP7326933B2 (en) * | 2019-07-03 | 2023-08-16 | 住友電気工業株式会社 | multicore optical fiber |
| JP2023518941A (en) * | 2020-03-18 | 2023-05-09 | コーニング インコーポレイテッド | Reduced diameter optical fiber with improved microbending |
| NL2025271B1 (en) * | 2020-03-18 | 2021-10-20 | Corning Inc | Reduced diameter optical fiber with improved microbending |
| CN111431621B (en) * | 2020-03-19 | 2021-03-26 | 华中科技大学 | Phase noise estimation method and signal compensation method for multi-core fiber |
| JP7375941B2 (en) * | 2020-08-21 | 2023-11-08 | 日本電信電話株式会社 | optical transmission system |
| WO2022046705A1 (en) * | 2020-08-27 | 2022-03-03 | Corning Incorporated | Multicore optical fiber with depressed index common cladding |
| CN112346170B (en) * | 2020-09-21 | 2022-03-25 | 燕山大学 | Double-groove surrounding type multi-core few-mode optical fiber based on space division-mode division multiplexing technology |
| CN113820780B (en) * | 2021-08-16 | 2024-01-30 | 暨南大学 | Full MIMO double-step 7-core 6-mode optical fiber |
| US12032200B2 (en) * | 2021-12-28 | 2024-07-09 | Sterlite Technologies Limited | Trench assisted multi-core optical fiber with reduced crosstalk |
| US12535637B2 (en) * | 2022-08-12 | 2026-01-27 | Corning Incorporated | Uncoupled multicore optical fiber with alkali doped, off-set trench cores |
| US20240069271A1 (en) * | 2022-08-26 | 2024-02-29 | Corning Incorporated | Uncoupled-core multicore optical fiber with reduced cross talk |
| CN115407447B (en) * | 2022-09-23 | 2024-04-05 | 长飞光纤光缆股份有限公司 | O-band dispersion compensation optical fiber |
| US20240411081A1 (en) * | 2023-06-06 | 2024-12-12 | Corning Research & Development Corporation | Multicore optical fiber system connectivity in data centers |
| CN121596450A (en) * | 2024-08-22 | 2026-03-03 | 华为技术有限公司 | A multi-core optical fiber, optical cable and communication system |
Family Cites Families (3)
| Publication number | Priority date | Publication date | Assignee | Title |
|---|---|---|---|---|
| FR2914751B1 (en) * | 2007-04-06 | 2009-07-03 | Draka Comteq France | OPTICAL FIBER MONOMODE |
| JP5684109B2 (en) * | 2009-04-16 | 2015-03-11 | 古河電気工業株式会社 | Multi-core optical fiber |
| EP2352047B1 (en) * | 2010-02-01 | 2019-09-25 | Draka Comteq B.V. | Non-zero dispersion shifted optical fiber having a large effective area |
-
2013
- 2013-02-21 CN CN201380011465.0A patent/CN104145197B/en active Active
- 2013-02-21 EP EP13754922.6A patent/EP2821824B1/en active Active
- 2013-02-21 WO PCT/JP2013/054346 patent/WO2013129232A1/en not_active Ceased
- 2013-02-21 DK DK13754922.6T patent/DK2821824T3/en active
- 2013-02-21 JP JP2014502164A patent/JP6156359B2/en active Active
- 2013-02-26 US US13/776,946 patent/US8811785B2/en active Active
Non-Patent Citations (1)
| Title |
|---|
| TETSUYA HAYASHI ET AL: "Low-crosstalk and low-loss multi-core fiber utilizing fiber bend", 2011 OPTICAL FIBER COMMUNICATION CONFERENCE AND EXPOSITION AND THE NATIONAL FIBER OPTIC ENGINEERS CONFERENCE (OFC/NFOEC 2011) : LOS ANGELES, CALIFORNIA, USA, 6 - 10 MARCH 2011, IEEE, PISCATAWAY, NJ, USA, 6 March 2011 (2011-03-06), pages 1 - 3, XP031946645, ISBN: 978-1-4577-0213-6 * |
Also Published As
| Publication number | Publication date |
|---|---|
| EP2821824A4 (en) | 2015-10-28 |
| US8811785B2 (en) | 2014-08-19 |
| US20130243381A1 (en) | 2013-09-19 |
| JPWO2013129232A1 (en) | 2015-07-30 |
| WO2013129232A1 (en) | 2013-09-06 |
| CN104145197A (en) | 2014-11-12 |
| JP6156359B2 (en) | 2017-07-05 |
| DK2821824T3 (en) | 2021-05-17 |
| CN104145197B (en) | 2019-07-19 |
| EP2821824A1 (en) | 2015-01-07 |
Similar Documents
| Publication | Publication Date | Title |
|---|---|---|
| EP2821824B1 (en) | Multicore optical fiber | |
| EP1930753B1 (en) | Optical fiber with high Brillouin threshold power and low bending losses | |
| EP2211212B1 (en) | Single-mode optical fibre having an enlarged effective area | |
| US9207396B2 (en) | Single mode optical fiber with large effective area | |
| EP2562571B1 (en) | Optical fiber | |
| US20140241684A1 (en) | Low attenuation optical fibers with an f-graded index core | |
| US11366267B2 (en) | Optical fiber | |
| EP1891472B1 (en) | High sbs threshold optical fiber with aluminium dopant | |
| JP4851371B2 (en) | Optical fiber and optical fiber transmission line | |
| JP2009122277A (en) | Optical fiber and optical transmission system | |
| CN101535851B (en) | Optical fiber and optical fiber base material | |
| US7099543B2 (en) | High SBS threshold NZDS optical fiber | |
| Hayashi et al. | Low-loss and large-Aeff multi-core fiber for SNR enhancement | |
| US6819846B2 (en) | High absorption erbium doped amplifying optical fiber | |
| Yamamoto et al. | A new class of optical fiber to support large capacity transmission | |
| US6717721B2 (en) | Large effective area erbium doped fiber optical amplifier | |
| KR100433297B1 (en) | Optical fiber for wavelength division multiplexing communication | |
| EP1609008B1 (en) | Microstructured optical fibre | |
| KR100826053B1 (en) | Optical fiber for wavelength division multiplexing optical transmission system, optical transmission line and optical communication system using same | |
| Yamamoto et al. | A new class of optical fibers for high capacity transmission | |
| JP2001255433A (en) | Dispersion flat optical fiber | |
| JP2004101841A (en) | Dispersion shifted optical fiber | |
| Imamura et al. | The study on loss reduction of holey fiber by viscosity profile control | |
| He et al. | Non-zero dispersion for wideband optical fiber |
Legal Events
| Date | Code | Title | Description |
|---|---|---|---|
| PUAI | Public reference made under article 153(3) epc to a published international application that has entered the european phase |
Free format text: ORIGINAL CODE: 0009012 |
|
| 17P | Request for examination filed |
Effective date: 20140929 |
|
| AK | Designated contracting states |
Kind code of ref document: A1 Designated state(s): AL AT BE BG CH CY CZ DE DK EE ES FI FR GB GR HR HU IE IS IT LI LT LU LV MC MK MT NL NO PL PT RO RS SE SI SK SM TR |
|
| AX | Request for extension of the european patent |
Extension state: BA ME |
|
| DAX | Request for extension of the european patent (deleted) | ||
| RA4 | Supplementary search report drawn up and despatched (corrected) |
Effective date: 20150928 |
|
| RIC1 | Information provided on ipc code assigned before grant |
Ipc: G02B 6/02 20060101AFI20150922BHEP Ipc: G02B 6/036 20060101ALI20150922BHEP |
|
| STAA | Information on the status of an ep patent application or granted ep patent |
Free format text: STATUS: EXAMINATION IS IN PROGRESS |
|
| 17Q | First examination report despatched |
Effective date: 20190926 |
|
| GRAP | Despatch of communication of intention to grant a patent |
Free format text: ORIGINAL CODE: EPIDOSNIGR1 |
|
| STAA | Information on the status of an ep patent application or granted ep patent |
Free format text: STATUS: GRANT OF PATENT IS INTENDED |
|
| INTG | Intention to grant announced |
Effective date: 20201208 |
|
| RIN1 | Information on inventor provided before grant (corrected) |
Inventor name: HAYASHI, TETSUYA |
|
| GRAS | Grant fee paid |
Free format text: ORIGINAL CODE: EPIDOSNIGR3 |
|
| GRAA | (expected) grant |
Free format text: ORIGINAL CODE: 0009210 |
|
| STAA | Information on the status of an ep patent application or granted ep patent |
Free format text: STATUS: THE PATENT HAS BEEN GRANTED |
|
| AK | Designated contracting states |
Kind code of ref document: B1 Designated state(s): AL AT BE BG CH CY CZ DE DK EE ES FI FR GB GR HR HU IE IS IT LI LT LU LV MC MK MT NL NO PL PT RO RS SE SI SK SM TR |
|
| REG | Reference to a national code |
Ref country code: GB Ref legal event code: FG4D |
|
| REG | Reference to a national code |
Ref country code: CH Ref legal event code: EP |
|
| REG | Reference to a national code |
Ref country code: DE Ref legal event code: R096 Ref document number: 602013077024 Country of ref document: DE |
|
| REG | Reference to a national code |
Ref country code: IE Ref legal event code: FG4D |
|
| REG | Reference to a national code |
Ref country code: AT Ref legal event code: REF Ref document number: 1385236 Country of ref document: AT Kind code of ref document: T Effective date: 20210515 |
|
| REG | Reference to a national code |
Ref country code: DK Ref legal event code: T3 Effective date: 20210512 |
|
| REG | Reference to a national code |
Ref country code: NL Ref legal event code: FP |
|
| REG | Reference to a national code |
Ref country code: LT Ref legal event code: MG9D |
|
| REG | Reference to a national code |
Ref country code: AT Ref legal event code: MK05 Ref document number: 1385236 Country of ref document: AT Kind code of ref document: T Effective date: 20210421 |
|
| PG25 | Lapsed in a contracting state [announced via postgrant information from national office to epo] |
Ref country code: HR Free format text: LAPSE BECAUSE OF FAILURE TO SUBMIT A TRANSLATION OF THE DESCRIPTION OR TO PAY THE FEE WITHIN THE PRESCRIBED TIME-LIMIT Effective date: 20210421 Ref country code: BG Free format text: LAPSE BECAUSE OF FAILURE TO SUBMIT A TRANSLATION OF THE DESCRIPTION OR TO PAY THE FEE WITHIN THE PRESCRIBED TIME-LIMIT Effective date: 20210721 Ref country code: AT Free format text: LAPSE BECAUSE OF FAILURE TO SUBMIT A TRANSLATION OF THE DESCRIPTION OR TO PAY THE FEE WITHIN THE PRESCRIBED TIME-LIMIT Effective date: 20210421 Ref country code: FI Free format text: LAPSE BECAUSE OF FAILURE TO SUBMIT A TRANSLATION OF THE DESCRIPTION OR TO PAY THE FEE WITHIN THE PRESCRIBED TIME-LIMIT Effective date: 20210421 Ref country code: LT Free format text: LAPSE BECAUSE OF FAILURE TO SUBMIT A TRANSLATION OF THE DESCRIPTION OR TO PAY THE FEE WITHIN THE PRESCRIBED TIME-LIMIT Effective date: 20210421 |
|
| PG25 | Lapsed in a contracting state [announced via postgrant information from national office to epo] |
Ref country code: SE Free format text: LAPSE BECAUSE OF FAILURE TO SUBMIT A TRANSLATION OF THE DESCRIPTION OR TO PAY THE FEE WITHIN THE PRESCRIBED TIME-LIMIT Effective date: 20210421 Ref country code: RS Free format text: LAPSE BECAUSE OF FAILURE TO SUBMIT A TRANSLATION OF THE DESCRIPTION OR TO PAY THE FEE WITHIN THE PRESCRIBED TIME-LIMIT Effective date: 20210421 Ref country code: ES Free format text: LAPSE BECAUSE OF FAILURE TO SUBMIT A TRANSLATION OF THE DESCRIPTION OR TO PAY THE FEE WITHIN THE PRESCRIBED TIME-LIMIT Effective date: 20210421 Ref country code: NO Free format text: LAPSE BECAUSE OF FAILURE TO SUBMIT A TRANSLATION OF THE DESCRIPTION OR TO PAY THE FEE WITHIN THE PRESCRIBED TIME-LIMIT Effective date: 20210721 Ref country code: PL Free format text: LAPSE BECAUSE OF FAILURE TO SUBMIT A TRANSLATION OF THE DESCRIPTION OR TO PAY THE FEE WITHIN THE PRESCRIBED TIME-LIMIT Effective date: 20210421 Ref country code: PT Free format text: LAPSE BECAUSE OF FAILURE TO SUBMIT A TRANSLATION OF THE DESCRIPTION OR TO PAY THE FEE WITHIN THE PRESCRIBED TIME-LIMIT Effective date: 20210823 Ref country code: LV Free format text: LAPSE BECAUSE OF FAILURE TO SUBMIT A TRANSLATION OF THE DESCRIPTION OR TO PAY THE FEE WITHIN THE PRESCRIBED TIME-LIMIT Effective date: 20210421 Ref country code: GR Free format text: LAPSE BECAUSE OF FAILURE TO SUBMIT A TRANSLATION OF THE DESCRIPTION OR TO PAY THE FEE WITHIN THE PRESCRIBED TIME-LIMIT Effective date: 20210722 Ref country code: IS Free format text: LAPSE BECAUSE OF FAILURE TO SUBMIT A TRANSLATION OF THE DESCRIPTION OR TO PAY THE FEE WITHIN THE PRESCRIBED TIME-LIMIT Effective date: 20210821 |
|
| REG | Reference to a national code |
Ref country code: DE Ref legal event code: R097 Ref document number: 602013077024 Country of ref document: DE |
|
| PG25 | Lapsed in a contracting state [announced via postgrant information from national office to epo] |
Ref country code: RO Free format text: LAPSE BECAUSE OF FAILURE TO SUBMIT A TRANSLATION OF THE DESCRIPTION OR TO PAY THE FEE WITHIN THE PRESCRIBED TIME-LIMIT Effective date: 20210421 Ref country code: SK Free format text: LAPSE BECAUSE OF FAILURE TO SUBMIT A TRANSLATION OF THE DESCRIPTION OR TO PAY THE FEE WITHIN THE PRESCRIBED TIME-LIMIT Effective date: 20210421 Ref country code: SM Free format text: LAPSE BECAUSE OF FAILURE TO SUBMIT A TRANSLATION OF THE DESCRIPTION OR TO PAY THE FEE WITHIN THE PRESCRIBED TIME-LIMIT Effective date: 20210421 Ref country code: CZ Free format text: LAPSE BECAUSE OF FAILURE TO SUBMIT A TRANSLATION OF THE DESCRIPTION OR TO PAY THE FEE WITHIN THE PRESCRIBED TIME-LIMIT Effective date: 20210421 Ref country code: EE Free format text: LAPSE BECAUSE OF FAILURE TO SUBMIT A TRANSLATION OF THE DESCRIPTION OR TO PAY THE FEE WITHIN THE PRESCRIBED TIME-LIMIT Effective date: 20210421 |
|
| PLBE | No opposition filed within time limit |
Free format text: ORIGINAL CODE: 0009261 |
|
| STAA | Information on the status of an ep patent application or granted ep patent |
Free format text: STATUS: NO OPPOSITION FILED WITHIN TIME LIMIT |
|
| 26N | No opposition filed |
Effective date: 20220124 |
|
| PG25 | Lapsed in a contracting state [announced via postgrant information from national office to epo] |
Ref country code: IS Free format text: LAPSE BECAUSE OF FAILURE TO SUBMIT A TRANSLATION OF THE DESCRIPTION OR TO PAY THE FEE WITHIN THE PRESCRIBED TIME-LIMIT Effective date: 20210821 Ref country code: AL Free format text: LAPSE BECAUSE OF FAILURE TO SUBMIT A TRANSLATION OF THE DESCRIPTION OR TO PAY THE FEE WITHIN THE PRESCRIBED TIME-LIMIT Effective date: 20210421 |
|
| PG25 | Lapsed in a contracting state [announced via postgrant information from national office to epo] |
Ref country code: IT Free format text: LAPSE BECAUSE OF FAILURE TO SUBMIT A TRANSLATION OF THE DESCRIPTION OR TO PAY THE FEE WITHIN THE PRESCRIBED TIME-LIMIT Effective date: 20210421 |
|
| REG | Reference to a national code |
Ref country code: DE Ref legal event code: R119 Ref document number: 602013077024 Country of ref document: DE |
|
| PG25 | Lapsed in a contracting state [announced via postgrant information from national office to epo] |
Ref country code: MC Free format text: LAPSE BECAUSE OF FAILURE TO SUBMIT A TRANSLATION OF THE DESCRIPTION OR TO PAY THE FEE WITHIN THE PRESCRIBED TIME-LIMIT Effective date: 20210421 |
|
| REG | Reference to a national code |
Ref country code: CH Ref legal event code: PL |
|
| REG | Reference to a national code |
Ref country code: BE Ref legal event code: MM Effective date: 20220228 |
|
| PG25 | Lapsed in a contracting state [announced via postgrant information from national office to epo] |
Ref country code: LU Free format text: LAPSE BECAUSE OF NON-PAYMENT OF DUE FEES Effective date: 20220221 |
|
| PG25 | Lapsed in a contracting state [announced via postgrant information from national office to epo] |
Ref country code: LI Free format text: LAPSE BECAUSE OF NON-PAYMENT OF DUE FEES Effective date: 20220228 Ref country code: IE Free format text: LAPSE BECAUSE OF NON-PAYMENT OF DUE FEES Effective date: 20220221 Ref country code: DE Free format text: LAPSE BECAUSE OF NON-PAYMENT OF DUE FEES Effective date: 20220901 Ref country code: CH Free format text: LAPSE BECAUSE OF NON-PAYMENT OF DUE FEES Effective date: 20220228 |
|
| PG25 | Lapsed in a contracting state [announced via postgrant information from national office to epo] |
Ref country code: BE Free format text: LAPSE BECAUSE OF NON-PAYMENT OF DUE FEES Effective date: 20220228 |
|
| P01 | Opt-out of the competence of the unified patent court (upc) registered |
Effective date: 20230515 |
|
| PG25 | Lapsed in a contracting state [announced via postgrant information from national office to epo] |
Ref country code: HU Free format text: LAPSE BECAUSE OF FAILURE TO SUBMIT A TRANSLATION OF THE DESCRIPTION OR TO PAY THE FEE WITHIN THE PRESCRIBED TIME-LIMIT; INVALID AB INITIO Effective date: 20130221 |
|
| PG25 | Lapsed in a contracting state [announced via postgrant information from national office to epo] |
Ref country code: MK Free format text: LAPSE BECAUSE OF FAILURE TO SUBMIT A TRANSLATION OF THE DESCRIPTION OR TO PAY THE FEE WITHIN THE PRESCRIBED TIME-LIMIT Effective date: 20210421 Ref country code: CY Free format text: LAPSE BECAUSE OF FAILURE TO SUBMIT A TRANSLATION OF THE DESCRIPTION OR TO PAY THE FEE WITHIN THE PRESCRIBED TIME-LIMIT Effective date: 20210421 |
|
| PG25 | Lapsed in a contracting state [announced via postgrant information from national office to epo] |
Ref country code: TR Free format text: LAPSE BECAUSE OF FAILURE TO SUBMIT A TRANSLATION OF THE DESCRIPTION OR TO PAY THE FEE WITHIN THE PRESCRIBED TIME-LIMIT Effective date: 20210421 |
|
| PG25 | Lapsed in a contracting state [announced via postgrant information from national office to epo] |
Ref country code: MT Free format text: LAPSE BECAUSE OF FAILURE TO SUBMIT A TRANSLATION OF THE DESCRIPTION OR TO PAY THE FEE WITHIN THE PRESCRIBED TIME-LIMIT Effective date: 20210421 |
|
| PGFP | Annual fee paid to national office [announced via postgrant information from national office to epo] |
Ref country code: FR Payment date: 20251231 Year of fee payment: 14 |
|
| PGFP | Annual fee paid to national office [announced via postgrant information from national office to epo] |
Ref country code: NL Payment date: 20260106 Year of fee payment: 14 |
|
| PGFP | Annual fee paid to national office [announced via postgrant information from national office to epo] |
Ref country code: GB Payment date: 20260106 Year of fee payment: 14 |
|
| PGFP | Annual fee paid to national office [announced via postgrant information from national office to epo] |
Ref country code: DK Payment date: 20260213 Year of fee payment: 14 |