EP2814021A1 - Measurement data display device - Google Patents
Measurement data display device Download PDFInfo
- Publication number
- EP2814021A1 EP2814021A1 EP13747209.8A EP13747209A EP2814021A1 EP 2814021 A1 EP2814021 A1 EP 2814021A1 EP 13747209 A EP13747209 A EP 13747209A EP 2814021 A1 EP2814021 A1 EP 2814021A1
- Authority
- EP
- European Patent Office
- Prior art keywords
- measurement data
- data
- map
- location
- measurement
- Prior art date
- Legal status (The legal status is an assumption and is not a legal conclusion. Google has not performed a legal analysis and makes no representation as to the accuracy of the status listed.)
- Withdrawn
Links
Images


Classifications
-
- G—PHYSICS
- G06—COMPUTING OR CALCULATING; COUNTING
- G06F—ELECTRIC DIGITAL DATA PROCESSING
- G06F3/00—Input arrangements for transferring data to be processed into a form capable of being handled by the computer; Output arrangements for transferring data from processing unit to output unit, e.g. interface arrangements
- G06F3/01—Input arrangements or combined input and output arrangements for interaction between user and computer
- G06F3/048—Interaction techniques based on graphical user interfaces [GUI]
- G06F3/0481—Interaction techniques based on graphical user interfaces [GUI] based on specific properties of the displayed interaction object or a metaphor-based environment, e.g. interaction with desktop elements like windows or icons, or assisted by a cursor's changing behaviour or appearance
- G06F3/04817—Interaction techniques based on graphical user interfaces [GUI] based on specific properties of the displayed interaction object or a metaphor-based environment, e.g. interaction with desktop elements like windows or icons, or assisted by a cursor's changing behaviour or appearance using icons
-
- G—PHYSICS
- G06—COMPUTING OR CALCULATING; COUNTING
- G06F—ELECTRIC DIGITAL DATA PROCESSING
- G06F3/00—Input arrangements for transferring data to be processed into a form capable of being handled by the computer; Output arrangements for transferring data from processing unit to output unit, e.g. interface arrangements
- G06F3/01—Input arrangements or combined input and output arrangements for interaction between user and computer
- G06F3/048—Interaction techniques based on graphical user interfaces [GUI]
- G06F3/0481—Interaction techniques based on graphical user interfaces [GUI] based on specific properties of the displayed interaction object or a metaphor-based environment, e.g. interaction with desktop elements like windows or icons, or assisted by a cursor's changing behaviour or appearance
-
- G—PHYSICS
- G06—COMPUTING OR CALCULATING; COUNTING
- G06F—ELECTRIC DIGITAL DATA PROCESSING
- G06F3/00—Input arrangements for transferring data to be processed into a form capable of being handled by the computer; Output arrangements for transferring data from processing unit to output unit, e.g. interface arrangements
- G06F3/01—Input arrangements or combined input and output arrangements for interaction between user and computer
- G06F3/048—Interaction techniques based on graphical user interfaces [GUI]
- G06F3/0484—Interaction techniques based on graphical user interfaces [GUI] for the control of specific functions or operations, e.g. selecting or manipulating an object, an image or a displayed text element, setting a parameter value or selecting a range
-
- G—PHYSICS
- G06—COMPUTING OR CALCULATING; COUNTING
- G06T—IMAGE DATA PROCESSING OR GENERATION, IN GENERAL
- G06T11/00—Two-dimensional [2D] image generation
-
- G—PHYSICS
- G06—COMPUTING OR CALCULATING; COUNTING
- G06T—IMAGE DATA PROCESSING OR GENERATION, IN GENERAL
- G06T11/00—Two-dimensional [2D] image generation
- G06T11/20—Drawing from basic elements
- G06T11/26—Drawing of charts or graphs
-
- G—PHYSICS
- G09—EDUCATION; CRYPTOGRAPHY; DISPLAY; ADVERTISING; SEALS
- G09B—EDUCATIONAL OR DEMONSTRATION APPLIANCES; APPLIANCES FOR TEACHING, OR COMMUNICATING WITH, THE BLIND, DEAF OR MUTE; MODELS; PLANETARIA; GLOBES; MAPS; DIAGRAMS
- G09B29/00—Maps; Plans; Charts; Diagrams, e.g. route diagram
- G09B29/003—Maps
- G09B29/006—Representation of non-cartographic information on maps, e.g. population distribution, wind direction, radiation levels, air and sea routes
- G09B29/007—Representation of non-cartographic information on maps, e.g. population distribution, wind direction, radiation levels, air and sea routes using computer methods
Definitions
- the present invention relates to a measurement data display device that displays pieces of measurement data measured at arbitrary locations, such as environmental radiation doses, on a map corresponding to the respective locations.
- an environmental radiation monitoring apparatus described in Patent Literature 1 includes: many mobile slave stations that measure radiation doses at measuring sites; and a master station that performs data processing in a location distant from the slave stations, and is configured such that each of the slave stations is provided with: a GPS receiver that senses its installation location; a radiation measuring device that measures a radiation dose at regular time intervals, and a data transmission device that wirelessly transmits sensed location data and measured radiation dose data to the master station, and the master station is provided with: a data reception device that receives location data and radiation dose data transmitted from each of the slave stations; and a data processor that performs data processing for instantaneously storing pieces of received dada in a database to draw a contour map of a radiation dose rate in real time, and superimposing the contour map on a geographical information system to create an image as a radiation dose rate map of a measurement area.
- Patent Literature 1 JP-A-8-334563
- the present invention is made in order to solve the above-described problems, and a main object thereof is to provide a user-friendly measurement data display device that can reflect pieces of measurement data measured at arbitrary locations, such as radiation doses, on a map only with a simple screen operation.
- the measurement data display device is provided with: a screen that displays at least one icon representing a data file in which measurement data measured by a predetermined measuring device and location data indicating a location where the measurement data was measured are recorded in association with each other, and also displays a window for displaying a map; a display control part that controls display on the screen; wherein when the icon is moved onto the window, the display control part displays a predetermined type of symbol determined in advance depending on a value of the measurement data at a position on the map, the position being indicated by the location data corresponding to the measurement data.
- the symbol associated with the measurement data in the data file indicated by the icon is displayed on the map corresponding to the measurement location, with only an intuitively understandable operation of moving the icon onto the window, and therefore the measurement value at the measurement location can be grasped.
- an icon is separately displayed for each series of pieces of measurement data, and a user can select only desired pieces of measurement data with an icon, so that it is possible to easily prevent map display from becoming unnecessarily complicated.
- the data file is formed by further associating the measurement data with time data indicating time when the measurement data was measured.
- time data indicating time when the measurement data was measured.
- the accompanying of corresponding pieces of time data can make a map easy to see in such a way that, for example, the display control part selects only the latest measurement data to map a symbol corresponding to the measurement data, or displays the latest measurement data in the forefront of the map.
- the present invention can provide not only a display of the latest measurement data but also a mapping display of, for example, only pieces of measurement data measured during a certain period in the past.
- the display control part displays all pieces of measurement data in a data file corresponding to each of the icons on the map with a plurality of symbols.
- the display control device may be one that sets a scale of the map such that a plurality of the symbols corresponding to all pieces of measurement data contained in a data file corresponding to each of the icons moved onto the window are displayed within the window.
- pieces of measurement data to be displayed on the window pieces of measurement data may be partially thinned so as to include not all the pieces of measurement data contained in a data file but at least one of pieces of measurement data measured at the same location or at close locations. That is, the present invention may be adapted to display all pieces of measurement data in association with different locations determined from pieces of location data.
- the measurement data display device may be one that makes the portable terminal create the data file by associating the location data with the measurement data transmitted from the measuring device, which is portable, and makes the portable terminal input (transmit) the data file to the display control part.
- the portable terminal may be a smartphone that receives the measurement data from the dosimeter through short range wireless communication or wired communication.
- the short range wireless communication and the wired communication may be Bluetooth-based communication and wired communication through a USB cable, respectively. Since a distance between the measuring device and the smartphone is short in the case of a smartphone equipped with a Bluetooth device or the like as described, it is possible to reduce the possibility that location data corresponding to measurement data is different from data on a location where the measurement data was measured, i.e., to reduce the possibility of obtaining location data on a displaced location, thereby increasing accuracy of location data.
- the portable terminal may also be a tablet computer that can be connected to the Internet, has a locating mechanism such as a GPS receiving device, and further has a short range wireless or wired communication function.
- the symbol is color-coded depending on the value of the measurement data.
- a measurement data display device 1 is realized by a notebook computer 2 as illustrated in Fig.1 .
- the notebook computer 2 includes a screen 3, and a computer main body 4 integrated with input devices including a keyboard.
- the notebook computer 2 may be replaced by an information processor such as a desktop computer including a display device and a computer main body.
- a system for transmitting measurement data to the measurement data display device 1 is, as illustrated in Figs. 1 and 2 , configured to include: a dosimeter 5 as a portable measuring device that measures environmental radiation doses; and a smartphone 6 that is a communicable portable terminal that receives pieces of measurement data on environmental radiation doses measured by the dosimeter 5.
- the notebook computer 2 has a CPU, an internal memory, a storage device such as a hard disk, an I/O interface, a communication interface, and the like.
- the notebook computer 2 is one that fulfills various types of functions in such a way that the CPU operates on the basis of various types of application software (hereinafter referred to as programs) stored in the storage device.
- the storage device stores system software, a communication program, a mail program, a program for displaying radiation doses on a map (hereinafter referred to as a display program), and the like.
- the computer main body 4 of the notebook computer 2 functions as: a reception part 2a that receives measurement data from the smartphone 6 via, for example, email; and a display control part 2b that controls display on the screen 3.
- the dosimeter 5 is one that utilizes an unillustrated scintillator, and that captures a radiation such as a ⁇ -ray incoming from outside to measure doses of the radiation with an optical receiver or a counter, and outputs measurement data indicating a radiation dose per unit time. Needless to say, the dosimeter 5 may be one that measures a radiation in another manner.
- the dosimeter 5 is equipped with a Bluetooth function as a short range wireless communication function.
- the dosimeter 5 transmits measurement data to the smartphone 6 as a portable terminal in real time through the Bluetooth function.
- the smartphone 6 should be always carried, and the smartphone 6 should be set in a state of being able to receive measurement data through the Bluetooth function.
- the measurement of environmental radiation doses is performed in such a way as to repeatedly measure an environmental radiation dose at regular intervals, for example, at intervals of 10 seconds by operating a power switch 7 of the dosimeter 5 to power on the dosimeter 5, and to stop the measurement by operating the power switch 7 to power off the dosimeter 5.
- the dosimeter 5 adds up measurement values measured during a period of, for example, 60 seconds, calculates a moving average of the measurement values to obtain an environmental radiation dose per hour (microsieverts/hour), creates measurement data at intervals of 10 seconds, and outputs the measurement data to a simplified display of the dosimeter 5. Also, such measurement data is transmitted to the smartphone 6 one by one without being accumulated in the dosimeter 5.
- reference sign 8 represents a switch for turning on/off a built-in buzzer.
- the smartphone 6 is of a type equipped with a GPS (Global Positioning System) function as a locating function, and receives a radio wave from a GPS satellite AS to acquire location data.
- Location data is configured to include longitudinal data, latitudinal data, and altitudinal data. Note that altitudinal data is not necessarily required.
- the smartphone 6 Upon receipt of measurement data from the dosimeter 5, the smartphone 6 creates a data file DF in association with the measurement data, time data corresponding to the time of receiving the measurement data, and location data corresponding to the location at the time of receiving the measurement data. As described above, in a measurement continuation state, the smartphone 6 creates one data file DF by associating each of pieces of measurement data received in the state with corresponding location data and time data.
- a portable terminal having a locating function can also be used, such as a notebook computer or a tablet computer.
- a data file DF is, as illustrated in Fig. 3 , for example, a CSV (Comma-Separated Values) file.
- CSV Common-Separated Values
- one data file DF is created from one piece of measurement data, and location data and time data related to the measurement data.
- one data file DF is created from a series of pieces of measurement data measured at the regular intervals, i.e., multiple pieces of measurement data, and sets of location data and time data respectively corresponding to the pieces of measurement data.
- a data file DF created as described above is transmitted from the smartphone 6 to the notebook computer 2.
- a data file DF is transmitted to the notebook computer 2 by, for example, in the case where the notebook computer 2 is placed far away, being attached to mail.
- a data file DF is transmitted to the notebook computer 2 through the Bluetooth function, or in the case where a USB cable is available, a data file DF is transmitted through USB connection.
- the present invention may be adapted to perform direct transmission from the dosimeter 5 to the notebook computer through the Bluetooth function or the USB cable to create a data file DF.
- a data file DF transmitted to and stored in the notebook computer 2 is stored in a specified area of the storage device, and an icon 9 for the data file DF is directly displayed or displayed as a folder containing the data file DF on the screen 3 of the notebook computer 2, i.e., on a desktop 10.
- icons 9 are displayed on the desktop 10.
- a window 11 is displayed on the desktop 10 of the screen 3 as illustrated in Fig. 4 , and in the window 11, an arbitrary map (not illustrated) is displayed.
- the arbitrary map may be any of maps such as a world map showing the whole world, a map showing Japan and its surrounding areas, and a map showing the Kinki region.
- the window 11 may be one that displays a default map.
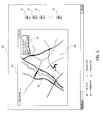
- circular dots 12 each of which is a symbol having a predetermined appearance preliminarily determined depending on a value of corresponding measurement data in data files DF represented by the icons 9 are displayed on a map 13 on the window 11 as illustrated in Fig. 5 .
- Each of the symbols may be, in addition to the circular dot, a polygonal dot such as a square dot or an equilateral triangular dot.
- the present invention may be adapted to combine a shape and a color to be able to distinguish a radiation dose among pieces of measurement data.
- a scale of the map is set to the maximum scale on which in the window 11, all pieces of measurement data are included and their corresponding symbols are displayed.
- a map 13 including a position corresponding to location data contained in the data file DF is displayed on the window 11, and at the position corresponding to the location data on the map 13, the measurement data is displayed with a colored dot 12. That is, the measurement data is displayed with the dot 12 that is color-coded depending on a value of an environmental radiation dose.
- Respective dots 12 are set so as to be able to intuitively grasp environmental radiation doses, such as green, yellow, brown, and red dots 12 respectively set to correspond to low, middle, high, and alert levels.
- each of the pieces of measurement data is related to corresponding time data and location data, and displayed with a dot 12 on a map 13 in the window 11. That is, in the case of multiple pieces of measurement data, all the pieces of measurement data are collectively displayed on a one-screen map 13. In this case, regarding pieces of measurement data at an unchanged measurement location, dots corresponding to the pieces of measurement data are displayed at the same location one after another in time series. On the other hand, in the case of multiple pieces of measurement data at measurement locations as a result of changing with time, the respective pieces of measurement data were acquired at the regular intervals, and therefore displayed on a map 13 as a line formed by a series of dots in contact with each other.
- the pieces of measurement data are displayed as a line formed by a series of differently colored dots 12.
- the present invention may be adapted to be able to easily see the pieces of measurement data by, for example, selecting only the latest measurement data to map a symbol corresponding to the measurement data, or displaying the latest measurement data in the forefront of a map.
- one or more pieces of measurement data in each of the data files DF are all displayed with dots 12 on one and the same map 13.
- a window 11 is opened, and in each window 11, a map 13 is displayed, but that on the map 13 representing an area covering all pieces of location data contained in each of the data files DF, pieces of measurement data are collectively displayed.
- dots 12 corresponding to pieces of measurement data contained in all of the data files DF are displayed on the same map 13.
- a scale of a map 13 displayed in the window 11 is not always constant, but changed by the display control par 2b correspondingly to pieces of location data contained in a dragged data file DF. That is, in the case of dragging and dropping onto the window 11 the above-described one data file DF where there is a plurality of measurement locations, and the locations spread out over the wide range, or dragging and dropping into the window 11 a plurality of data files DF created at locations mutually separated at distances between prefectures, a scale tends to decrease. Accordingly, how an environmental radiation dose changes depending on a measurement location can be grasped.
- a data file DF for measurement data is created with the portable dosimeter 5 being paired with the smartphone 6 to be carried, so that environmental radiation doses can be measured at any location as long as the location is accessible along with the both carried, and therefore mobility can be exhibited.
- the pieces of measurement data can be extremely easily mapped on a map in an easy-to-see manner. Note that the present invention is not limited to the above-described embodiment.
- the present invention may be one that utilizes Internet-based application software and storage devices typified by cloud computing or network computing.
- the present invention may be configured to be able to check environmental radiation doses from various locations by, for example, using application software, which can create CSV data usable in the cloud computing, to create a data file, storing the data file in a storage device within the cloud computing, and accessing the storage device through the Internet.
- the present invention may be one that, in place of the smartphone 6, uses a tablet computer equipped with a GPS function, a Bluetooth function, and the like.
- the above-described notebook computer 2 is not necessarily required.
- measurement data ion concentration such as NOx concentration, CO 2 concentration, or pH, another environment-related parameter, or still another parameter of which a measurement value can be grasped in relation to a corresponding measurement location is possible.
Landscapes
- Engineering & Computer Science (AREA)
- Theoretical Computer Science (AREA)
- Physics & Mathematics (AREA)
- General Physics & Mathematics (AREA)
- General Engineering & Computer Science (AREA)
- Human Computer Interaction (AREA)
- Ecology (AREA)
- Life Sciences & Earth Sciences (AREA)
- Computer Hardware Design (AREA)
- Mathematical Physics (AREA)
- Business, Economics & Management (AREA)
- Educational Administration (AREA)
- Educational Technology (AREA)
- Measurement Of Radiation (AREA)
- Instructional Devices (AREA)
- Processing Or Creating Images (AREA)
Abstract
Description
- The present invention relates to a measurement data display device that displays pieces of measurement data measured at arbitrary locations, such as environmental radiation doses, on a map corresponding to the respective locations.
- In recent years, in a living space near one's own residential area and including the residential area, a demand to measure environmental radiation doses has been increasing. In response to such a demand, portable dosimeters for measuring environmental radiation doses are starting to spread.
- For example, an environmental radiation monitoring apparatus described in
Patent Literature 1 includes: many mobile slave stations that measure radiation doses at measuring sites; and a master station that performs data processing in a location distant from the slave stations, and is configured such that each of the slave stations is provided with: a GPS receiver that senses its installation location; a radiation measuring device that measures a radiation dose at regular time intervals, and a data transmission device that wirelessly transmits sensed location data and measured radiation dose data to the master station, and the master station is provided with: a data reception device that receives location data and radiation dose data transmitted from each of the slave stations; and a data processor that performs data processing for instantaneously storing pieces of received dada in a database to draw a contour map of a radiation dose rate in real time, and superimposing the contour map on a geographical information system to create an image as a radiation dose rate map of a measurement area. - However, in the conventional radiation monitoring apparatus, a user interface used at the time of plotting pieces of radiation measurement data on a map is not considered at all.
- Also, many problems related to a user interface still remain unsolved, such that it becomes extremely hard to read the map due to complexity of the map and operability becomes worse at the time of selecting measurement data to display the data on the map when displaying all peaces of measurement data.
- Further, such problems occur not only in a radiation measuring device but also in measuring devices used in the case where a relationship between a measurement location and measurement data has a significant meaning, such as measuring devices for environmental states such as CO2 concentration, NOx concentration, and a pH level, and mobile type vehicle measuring device such as a tachograph. That is, in the case of frequently moving to make measurements at respective locations, or installing measuring devices at many spots, reflecting pieces of measurement data on a map with the simplest possible operation is considered to be an important challenge for many people to know a value distribution or the like of the pieces of measurement data.
- Patent Literature 1:
JP-A-8-334563 - Therefore, the present invention is made in order to solve the above-described problems, and a main object thereof is to provide a user-friendly measurement data display device that can reflect pieces of measurement data measured at arbitrary locations, such as radiation doses, on a map only with a simple screen operation.
- That is, the measurement data display device according to the present invention is provided with: a screen that displays at least one icon representing a data file in which measurement data measured by a predetermined measuring device and location data indicating a location where the measurement data was measured are recorded in association with each other, and also displays a window for displaying a map; a display control part that controls display on the screen; wherein when the icon is moved onto the window, the display control part displays a predetermined type of symbol determined in advance depending on a value of the measurement data at a position on the map, the position being indicated by the location data corresponding to the measurement data.
- According to such a configuration, the symbol associated with the measurement data in the data file indicated by the icon is displayed on the map corresponding to the measurement location, with only an intuitively understandable operation of moving the icon onto the window, and therefore the measurement value at the measurement location can be grasped. Also, an icon is separately displayed for each series of pieces of measurement data, and a user can select only desired pieces of measurement data with an icon, so that it is possible to easily prevent map display from becoming unnecessarily complicated.
- It is preferable that the data file is formed by further associating the measurement data with time data indicating time when the measurement data was measured. In the case where there are multiple pieces of measurement data measured at the same location or at close locations although corresponding measurement times are different, the accompanying of corresponding pieces of time data can make a map easy to see in such a way that, for example, the display control part selects only the latest measurement data to map a symbol corresponding to the measurement data, or displays the latest measurement data in the forefront of the map. The present invention can provide not only a display of the latest measurement data but also a mapping display of, for example, only pieces of measurement data measured during a certain period in the past.
- In order to make it possible to simultaneously grasp pieces of measurement data at different locations, it is preferable that, when a plurality of icons are collectively moved onto the window, the display control part displays all pieces of measurement data in a data file corresponding to each of the icons on the map with a plurality of symbols. In this case, the display control device may be one that sets a scale of the map such that a plurality of the symbols corresponding to all pieces of measurement data contained in a data file corresponding to each of the icons moved onto the window are displayed within the window. On the other hand, as pieces of measurement data to be displayed on the window, pieces of measurement data may be partially thinned so as to include not all the pieces of measurement data contained in a data file but at least one of pieces of measurement data measured at the same location or at close locations. That is, the present invention may be adapted to display all pieces of measurement data in association with different locations determined from pieces of location data.
- In order to make the number of additional functions of the measuring device as small as possible to reduce cost, it is preferable to utilize a portable terminal that has a GPS receiving device, to which the location data acquired through the GPS receiving device can be added. For example, the measurement data display device may be one that makes the portable terminal create the data file by associating the location data with the measurement data transmitted from the measuring device, which is portable, and makes the portable terminal input (transmit) the data file to the display control part.
- The portable terminal may be a smartphone that receives the measurement data from the dosimeter through short range wireless communication or wired communication. The short range wireless communication and the wired communication may be Bluetooth-based communication and wired communication through a USB cable, respectively. Since a distance between the measuring device and the smartphone is short in the case of a smartphone equipped with a Bluetooth device or the like as described, it is possible to reduce the possibility that location data corresponding to measurement data is different from data on a location where the measurement data was measured, i.e., to reduce the possibility of obtaining location data on a displaced location, thereby increasing accuracy of location data. In addition, the portable terminal may also be a tablet computer that can be connected to the Internet, has a locating mechanism such as a GPS receiving device, and further has a short range wireless or wired communication function.
- In order to increase visibility of the measurement data, it is preferable that the symbol is color-coded depending on the value of the measurement data.
- According to the present invention configured as described, only with a simple operation of moving an icon onto the window, symbols related to pieces of measurement data in a data file indicated by the icon are displayed on a map, and therefore a tendency of measurement values in a specified area or regional measurement value can be easily grasped. Brief Description of Drawings
-
- [
Fig. 1 ]
Fig. 1 is a schematic overall diagram illustrating a configuration of a measurement data display device in one embodiment of the present invention. - [
Fig. 2 ]
Fig. 2 is a functional block diagram illustrating an overall configuration in the same embodiment. - [
Fig. 3 ]
Fig. 3 is a table listing contents of a data file in the same embodiment. - [
Fig. 4 ]
Fig. 4 is a screen diagram illustrating contents displayed on the display device in the same embodiment. - [
Fig. 5 ]
Fig. 5 is a screen diagram illustrating contents displayed on the display device in the same embodiment. -
- 1 Measurement data display device
- 2 Computer
- 3 Screen
- 5 Dosimeter
- 6 Smartphone
- 9 Icon
- 11 Window
- 12 Dot
- 13 Map
- In the following, one embodiment of the present invention is described referring to the drawings.
- A measurement
data display device 1 according to the present embodiment is realized by anotebook computer 2 as illustrated inFig.1 . Thenotebook computer 2 includes ascreen 3, and a computermain body 4 integrated with input devices including a keyboard. Thenotebook computer 2 may be replaced by an information processor such as a desktop computer including a display device and a computer main body. - A system for transmitting measurement data to the measurement
data display device 1 is, as illustrated inFigs. 1 and2 , configured to include: adosimeter 5 as a portable measuring device that measures environmental radiation doses; and asmartphone 6 that is a communicable portable terminal that receives pieces of measurement data on environmental radiation doses measured by thedosimeter 5. - The respective parts are described.
- Structurally, the
notebook computer 2 has a CPU, an internal memory, a storage device such as a hard disk, an I/O interface, a communication interface, and the like. Thenotebook computer 2 is one that fulfills various types of functions in such a way that the CPU operates on the basis of various types of application software (hereinafter referred to as programs) stored in the storage device. The storage device stores system software, a communication program, a mail program, a program for displaying radiation doses on a map (hereinafter referred to as a display program), and the like. As illustrated inFig. 2 , the computermain body 4 of thenotebook computer 2 functions as: areception part 2a that receives measurement data from thesmartphone 6 via, for example, email; and adisplay control part 2b that controls display on thescreen 3. - The
dosimeter 5 is one that utilizes an unillustrated scintillator, and that captures a radiation such as a γ-ray incoming from outside to measure doses of the radiation with an optical receiver or a counter, and outputs measurement data indicating a radiation dose per unit time. Needless to say, thedosimeter 5 may be one that measures a radiation in another manner. - Also, the
dosimeter 5 is equipped with a Bluetooth function as a short range wireless communication function. During measurement of environmental radiation doses, thedosimeter 5 transmits measurement data to thesmartphone 6 as a portable terminal in real time through the Bluetooth function. Accordingly, in the case of measuring environmental radiation doses with thedosimeter 5, thesmartphone 6 should be always carried, and thesmartphone 6 should be set in a state of being able to receive measurement data through the Bluetooth function. The measurement of environmental radiation doses is performed in such a way as to repeatedly measure an environmental radiation dose at regular intervals, for example, at intervals of 10 seconds by operating a power switch 7 of thedosimeter 5 to power on thedosimeter 5, and to stop the measurement by operating the power switch 7 to power off thedosimeter 5. Specifically, thedosimeter 5 adds up measurement values measured during a period of, for example, 60 seconds, calculates a moving average of the measurement values to obtain an environmental radiation dose per hour (microsieverts/hour), creates measurement data at intervals of 10 seconds, and outputs the measurement data to a simplified display of thedosimeter 5. Also, such measurement data is transmitted to thesmartphone 6 one by one without being accumulated in thedosimeter 5. In addition,reference sign 8 represents a switch for turning on/off a built-in buzzer. - The
smartphone 6 is of a type equipped with a GPS (Global Positioning System) function as a locating function, and receives a radio wave from a GPS satellite AS to acquire location data. Location data is configured to include longitudinal data, latitudinal data, and altitudinal data. Note that altitudinal data is not necessarily required. Upon receipt of measurement data from thedosimeter 5, thesmartphone 6 creates a data file DF in association with the measurement data, time data corresponding to the time of receiving the measurement data, and location data corresponding to the location at the time of receiving the measurement data. As described above, in a measurement continuation state, thesmartphone 6 creates one data file DF by associating each of pieces of measurement data received in the state with corresponding location data and time data. In place of the smartphone, a portable terminal having a locating function can also be used, such as a notebook computer or a tablet computer. - A data file DF is, as illustrated in
Fig. 3 , for example, a CSV (Comma-Separated Values) file. For one round of measurement by thedosimeter 5, i.e., for measurement during a period from a point of powering on thedosimeter 5 or the Bluetooth function to a point of powering off thedosimeter 5 or the Bluetooth function, one data file DF is created. For example, in the case of operating the power switch 7 to switch off the power switch 7 substantially one minute after switching on, one data file DF is created from one piece of measurement data, and location data and time data related to the measurement data. - On the other hand, in the case of continuously keeping the power switch 7 in the on state for approximately 10 minutes, and then switching off the power switch 7, the measurement of environmental radiation doses is repeatedly performed at the regular intervals, and therefore one data file DF is created from a series of pieces of measurement data measured at the regular intervals, i.e., multiple pieces of measurement data, and sets of location data and time data respectively corresponding to the pieces of measurement data. A data file DF created as described above is transmitted from the
smartphone 6 to thenotebook computer 2. - A data file DF is transmitted to the
notebook computer 2 by, for example, in the case where thenotebook computer 2 is placed far away, being attached to mail. On the other hand, in the case where thenotebook computer 2 is present near thesmartphone 6, and the Bluetooth function is available, a data file DF is transmitted to thenotebook computer 2 through the Bluetooth function, or in the case where a USB cable is available, a data file DF is transmitted through USB connection. In addition, the present invention may be adapted to perform direct transmission from thedosimeter 5 to the notebook computer through the Bluetooth function or the USB cable to create a data file DF. A data file DF transmitted to and stored in thenotebook computer 2 is stored in a specified area of the storage device, and anicon 9 for the data file DF is directly displayed or displayed as a folder containing the data file DF on thescreen 3 of thenotebook computer 2, i.e., on adesktop 10. In the example illustrated inFig. 4 ,icons 9 are displayed on thedesktop 10. - In the case of starting the display program on the
notebook computer 2 in the above configuration, awindow 11 is displayed on thedesktop 10 of thescreen 3 as illustrated inFig. 4 , and in thewindow 11, an arbitrary map (not illustrated) is displayed. The arbitrary map may be any of maps such as a world map showing the whole world, a map showing Japan and its surrounding areas, and a map showing the Kinki region. Also, thewindow 11 may be one that displays a default map. - Next, by moving one or
more icons 9 into thewindow 11, i.e., by dragging (and dropping) theicons 9 onto thewindow 11, as illustrated inFig. 4 ,circular dots 12 each of which is a symbol having a predetermined appearance preliminarily determined depending on a value of corresponding measurement data in data files DF represented by theicons 9 are displayed on amap 13 on thewindow 11 as illustrated inFig. 5 . Each of the symbols may be, in addition to the circular dot, a polygonal dot such as a square dot or an equilateral triangular dot. Also, the present invention may be adapted to combine a shape and a color to be able to distinguish a radiation dose among pieces of measurement data. - In
Fig. 5 , a scale of the map is set to the maximum scale on which in thewindow 11, all pieces of measurement data are included and their corresponding symbols are displayed. - First, in the case of dragging and dropping an
icon 9 for a data file DF containing one piece of measurement data, amap 13 including a position corresponding to location data contained in the data file DF is displayed on thewindow 11, and at the position corresponding to the location data on themap 13, the measurement data is displayed with acolored dot 12. That is, the measurement data is displayed with thedot 12 that is color-coded depending on a value of an environmental radiation dose.Respective dots 12 are set so as to be able to intuitively grasp environmental radiation doses, such as green, yellow, brown, andred dots 12 respectively set to correspond to low, middle, high, and alert levels. - Next, in the case where multiple pieces of measurement data are contained in one data file DF, each of the pieces of measurement data is related to corresponding time data and location data, and displayed with a
dot 12 on amap 13 in thewindow 11. That is, in the case of multiple pieces of measurement data, all the pieces of measurement data are collectively displayed on a one-screen map 13. In this case, regarding pieces of measurement data at an unchanged measurement location, dots corresponding to the pieces of measurement data are displayed at the same location one after another in time series. On the other hand, in the case of multiple pieces of measurement data at measurement locations as a result of changing with time, the respective pieces of measurement data were acquired at the regular intervals, and therefore displayed on amap 13 as a line formed by a series of dots in contact with each other. In the case where respective pieces of measurement data are different in value, the pieces of measurement data are displayed as a line formed by a series of differently coloreddots 12. In addition, in the case where there are multiple pieces of measurement data respectively measured at different measurement times but measured at the same location or close locations, the present invention may be adapted to be able to easily see the pieces of measurement data by, for example, selecting only the latest measurement data to map a symbol corresponding to the measurement data, or displaying the latest measurement data in the forefront of a map. - Differently from the above-described cases, in the case of dragging and dropping a plurality of data files DF into the
window 11, one or more pieces of measurement data in each of the data files DF are all displayed withdots 12 on one and thesame map 13. In other words, it is not that for each of the data files DF, awindow 11 is opened, and in eachwindow 11, amap 13 is displayed, but that on themap 13 representing an area covering all pieces of location data contained in each of the data files DF, pieces of measurement data are collectively displayed. In this case, even in the case where locations where one or more pieces of measurement data in each of the data files DF are acquired are not within a short distance area such as a city, town, or village, but within a long distance area such as a prefecture or a nation,dots 12 corresponding to pieces of measurement data contained in all of the data files DF are displayed on thesame map 13. - In the case of placing a mouse cursor on a
dot 12 in a state wheredots 12 are displayed on amap 13, as illustrated inFig. 5 , respective values of time data, measurement data, and location data corresponding to thedot 12 are displayed in aballoon 14 as characters. Accordingly, rough values of pieces of measurement data can be grasped withcorresponding dots 12, and also details such as measurement data corresponding to each dot 12 can be grasped. In this case, aballoon 14 is displayed only by placing the mouse cursor on adot 12, and therefore by moving the mouse cursor along displayeddots 12, details such as pieces of measurement data can be successively seen. - As described, even pieces of measurement data dotted in a wide range can be displayed on one and the
same map 13, and therefore a scale of amap 13 displayed in thewindow 11 is not always constant, but changed by thedisplay control par 2b correspondingly to pieces of location data contained in a dragged data file DF. That is, in the case of dragging and dropping onto thewindow 11 the above-described one data file DF where there is a plurality of measurement locations, and the locations spread out over the wide range, or dragging and dropping into the window 11 a plurality of data files DF created at locations mutually separated at distances between prefectures, a scale tends to decrease. Accordingly, how an environmental radiation dose changes depending on a measurement location can be grasped. - Further, only by dragging and dropping an
icon 9 displayed on thedesktop 10 onto thewindow 11 opened according to the display program, all pieces of measurement data corresponding to theicon 9 are automatically displayed with differently coloreddots 12 depending on a difference in environmental radiation dose on anappropriate map 12 corresponding to measurement locations without selecting a map that can be determined to be appropriate, and therefore environmental radiation doses can be intuitively recognized. - In addition, in this embodiment, a data file DF for measurement data is created with the
portable dosimeter 5 being paired with thesmartphone 6 to be carried, so that environmental radiation doses can be measured at any location as long as the location is accessible along with the both carried, and therefore mobility can be exhibited. - Also, for example, even in the case of automatically successively outputting pieces of measurement data in a few seconds or a few tens of seconds to create a plurality of data files each containing many pieces of measurement data, the pieces of measurement data can be extremely easily mapped on a map in an easy-to-see manner.
Note that the present invention is not limited to the above-described embodiment. - In the above-described embodiment, described is an example where measurement data is transmitted from the
smartphone 6 to thecomputer 2 through mail or the like; however, the present invention may be one that utilizes Internet-based application software and storage devices typified by cloud computing or network computing. In such a case, the present invention may be configured to be able to check environmental radiation doses from various locations by, for example, using application software, which can create CSV data usable in the cloud computing, to create a data file, storing the data file in a storage device within the cloud computing, and accessing the storage device through the Internet. - With such a configuration, multiple people other than a measurer can check environmental radiation doses measured at various locations by sharing a storage location on the Internet. Also, in the case of using the cloud computing, application software can also be shared, and therefore a load of each person on browsing measurement data can be reduced.
- Further, the present invention may be one that, in place of the
smartphone 6, uses a tablet computer equipped with a GPS function, a Bluetooth function, and the like. In this case, the above-describednotebook computer 2 is not necessarily required.
As measurement data, ion concentration such as NOx concentration, CO2 concentration, or pH, another environment-related parameter, or still another parameter of which a measurement value can be grasped in relation to a corresponding measurement location is possible. - Besides, it should be appreciated that the present invention is not limited to any of the above-described embodiments, but can be variously modified without departing from the scope thereof.
Claims (10)
- A measurement data display device comprising:a screen that displays at least one icon representing a data file in which measurement data measured by a predetermined measuring device and location data indicating a location where the measurement data was measured are recorded in association with each other, and also displays a window for displaying a map; anda display control part that controls a display on the screen, whereinwhen the icon is moved onto the window, the display control part displays a predetermined type of symbol determined in advance depending on a value of the measurement data at a position on the map, the position being indicated by the location data corresponding to the measurement data.
- The measurement data display device according to claim 1, wherein
the data file is formed by further associating the measurement data with time data indicating time when the measurement data was measured. - The measurement data display device according to claim 1, wherein
when a plurality of the icons are collectively moved onto the window, the display control part displays all pieces of measurement data in a data file corresponding to each of the icons, or all pieces of measurement data related to different locations on the map with a plurality of the symbols. - The measurement data display device according to claim 1, wherein
the display control part sets a scale of the map such that a plurality of the symbols corresponding to all pieces of measurement data contained in a data file corresponding to the icon moved onto the window, or a plurality of the symbols corresponding to all pieces of measurement data related to different locations are displayed within the window. - The measurement data display device according to claim 1, wherein
the data file is inputted to the display control part through a portable terminal that receives the measurement data from the measuring device that is portable, and associates the received measurement data with the location data acquired through a GPS receiving device to create the data file. - The measurement data display device according to claim 5, wherein
the portable terminal receives the measurement data from the measuring device through short range wireless communication or wired communication. - The measurement data display device according to claim 6, wherein
the portable terminal is a smartphone, and the short range wireless communication is based on Bluetooth. - The measurement data display device according to claim 1, wherein
the symbol is a dot that is color-coded depending on the value of the measurement data. - A measurement data display method comprising:displaying at least one icon representing a data file in which measurement data measured by a predetermined measuring device and location data indicating a location where the measurement data was measured are recorded in association with each other,displaying a window for displaying a map on a screen anddisplaying a predetermined type of symbol determined in advance depending on a value of the measurement data at a position on the map when the icon is moved onto the window, the position being indicated by the location data corresponding to the measurement data.
- A measurement data display program instructing a computer to fulfill functions of:displaying at least one icon representing a data file in which measurement data measured by a predetermined measuring device and location data indicating a location where the measurement data was measured are recorded in association with each other,displaying a window for displaying a map on a screen, anddisplaying a predetermined type of symbol determined in advance depending on a value of the measurement data at a position on the map when the icon is moved onto the window, the position being indicated by the location data corresponding to the measurement data.
Applications Claiming Priority (2)
| Application Number | Priority Date | Filing Date | Title |
|---|---|---|---|
| JP2012025624 | 2012-02-08 | ||
| PCT/JP2013/052917 WO2013118837A1 (en) | 2012-02-08 | 2013-02-07 | Measurement data display device |
Publications (2)
| Publication Number | Publication Date |
|---|---|
| EP2814021A1 true EP2814021A1 (en) | 2014-12-17 |
| EP2814021A4 EP2814021A4 (en) | 2016-04-06 |
Family
ID=48947592
Family Applications (1)
| Application Number | Title | Priority Date | Filing Date |
|---|---|---|---|
| EP13747209.8A Withdrawn EP2814021A4 (en) | 2012-02-08 | 2013-02-07 | MEASUREMENTS DISPLAY DEVICE |
Country Status (6)
| Country | Link |
|---|---|
| US (1) | US9746993B2 (en) |
| EP (1) | EP2814021A4 (en) |
| JP (1) | JP6193765B2 (en) |
| KR (1) | KR102088266B1 (en) |
| CN (1) | CN104115207B (en) |
| WO (1) | WO2013118837A1 (en) |
Families Citing this family (5)
| Publication number | Priority date | Publication date | Assignee | Title |
|---|---|---|---|---|
| JP6692235B2 (en) * | 2016-07-12 | 2020-05-13 | 株式会社東芝 | Air dose rate distribution monitoring device, method and program |
| CN109215709B (en) * | 2017-07-03 | 2020-12-22 | 华邦电子股份有限公司 | Resistive memory device and setting method of resistive memory cell |
| CN111640162B (en) * | 2020-05-24 | 2024-01-23 | 中信银行股份有限公司 | A method, device, equipment and computer-readable storage medium for displaying test results based on traffic network |
| CN112817336A (en) * | 2021-02-08 | 2021-05-18 | 广东省环境辐射监测中心 | High-precision radioactive source searching and positioning system and positioning method based on civil small unmanned aerial vehicle |
| JP2022149892A (en) * | 2021-03-25 | 2022-10-07 | 日本製鉄株式会社 | Data display processing method |
Family Cites Families (21)
| Publication number | Priority date | Publication date | Assignee | Title |
|---|---|---|---|---|
| JPH08334563A (en) | 1995-06-06 | 1996-12-17 | Power Reactor & Nuclear Fuel Dev Corp | Environmental radiation monitoring apparatus for emergency |
| CA2400161C (en) | 2000-02-22 | 2015-11-24 | Metacarta, Inc. | Spatially coding and displaying information |
| JP5001649B2 (en) | 2003-07-12 | 2012-08-15 | ラジエーション・ウォッチ・リミテッド | Ionizing radiation monitoring assembly, ionizing radiation monitoring assembly operating method, and ionizing radiation monitoring network |
| CN2690896Y (en) * | 2003-09-03 | 2005-04-06 | 广州杰赛科技股份有限公司 | Digital radiation survey system |
| JP3118287U (en) * | 2005-11-04 | 2006-01-26 | 行政院原子能委員會核能研究所 | Mobile environment immediate measurement system |
| US8090533B2 (en) * | 2006-02-27 | 2012-01-03 | Navitime Japan Co., Ltd. | Map display system, method of inputting conditions for searching for POI, method of displaying guidance to POI, and terminal device |
| EP1895745B1 (en) * | 2006-08-31 | 2015-04-22 | Swisscom AG | Method and communication system for continuous recording of data from the environment |
| US20080120122A1 (en) * | 2006-11-20 | 2008-05-22 | Jon Olenski | Field site data gathering and reporting system and method |
| US8485019B2 (en) * | 2006-12-22 | 2013-07-16 | Bruce D. Groves | Methods and systems for analysis, reporting and display of environmental data |
| JP4006473B1 (en) | 2007-01-11 | 2007-11-14 | 地球観測株式会社 | Environmental measurement system |
| JP4525722B2 (en) * | 2007-09-20 | 2010-08-18 | 株式会社デンソー | Weather information display device, program |
| KR20090099257A (en) * | 2008-03-17 | 2009-09-22 | (주)엑셀코리아 | Device manufacturing method for displaying radiation in real-time color change |
| CN101387704A (en) | 2008-10-17 | 2009-03-18 | 中国广东核电集团有限公司 | Environmental monitoring vehicle |
| AU2009338855A1 (en) * | 2009-01-30 | 2011-08-18 | Telefonaktiebolaget L M Ericsson (Publ) | Presentation of a digital map |
| US20100228469A1 (en) * | 2009-03-05 | 2010-09-09 | Kavita Varadarajan | Method and system for overlaying landmark information on a geocoded graphic |
| US8085145B2 (en) * | 2009-04-03 | 2011-12-27 | Sharp Laboratories Of America, Inc. | Personal environmental monitoring method and system and portable monitor for use therein |
| US20110246875A1 (en) * | 2010-04-02 | 2011-10-06 | Symantec Corporation | Digital whiteboard implementation |
| US9818072B2 (en) * | 2010-05-18 | 2017-11-14 | United States Postal Service | Systems and methods for facility optimization |
| JP5597056B2 (en) * | 2010-08-02 | 2014-10-01 | 株式会社キーエンス | Image measuring apparatus, image measuring method, and program for image measuring apparatus |
| JP2011227521A (en) * | 2011-07-19 | 2011-11-10 | Zenrin Datacom Co Ltd | Information providing system and information providing method |
| US10198485B2 (en) * | 2011-10-13 | 2019-02-05 | Microsoft Technology Licensing, Llc | Authoring of data visualizations and maps |
-
2013
- 2013-02-07 JP JP2013557575A patent/JP6193765B2/en active Active
- 2013-02-07 EP EP13747209.8A patent/EP2814021A4/en not_active Withdrawn
- 2013-02-07 KR KR1020147022474A patent/KR102088266B1/en not_active Expired - Fee Related
- 2013-02-07 CN CN201380008171.2A patent/CN104115207B/en not_active Expired - Fee Related
- 2013-02-07 US US14/377,320 patent/US9746993B2/en not_active Expired - Fee Related
- 2013-02-07 WO PCT/JP2013/052917 patent/WO2013118837A1/en not_active Ceased
Also Published As
| Publication number | Publication date |
|---|---|
| EP2814021A4 (en) | 2016-04-06 |
| CN104115207B (en) | 2017-09-05 |
| JP6193765B2 (en) | 2017-09-06 |
| JPWO2013118837A1 (en) | 2015-05-11 |
| US20150007097A1 (en) | 2015-01-01 |
| CN104115207A (en) | 2014-10-22 |
| KR20140133518A (en) | 2014-11-19 |
| WO2013118837A1 (en) | 2013-08-15 |
| US9746993B2 (en) | 2017-08-29 |
| KR102088266B1 (en) | 2020-03-12 |
Similar Documents
| Publication | Publication Date | Title |
|---|---|---|
| US9746993B2 (en) | Measurement data display device | |
| TW201513060A (en) | A method for global positioning services and a device thereof | |
| US20150002539A1 (en) | Methods and apparatuses for displaying perspective street view map | |
| JP2017009341A (en) | Data analysis device, data analysis method and data analysis program | |
| JP7020852B2 (en) | Mobile terminal, position confirmation device, position confirmation system, position identification program, position confirmation program, position identification method and position confirmation method | |
| EP3252492A1 (en) | Determining one or more potential installation positions and/or areas for installing one or more radio positioning support devices | |
| KR101661058B1 (en) | System for guiding parking position | |
| JP2017101942A (en) | Altitude measuring system and altitude measuring method | |
| KR101963030B1 (en) | Network system | |
| CN106383458B (en) | Universal wireless control method and system for electrical equipment | |
| KR20140113764A (en) | Location based service system via landmark sensor and controlling method thereof | |
| KR20160019296A (en) | System for detecting loss of mobile phone | |
| JP2013140023A (en) | Radiation measuring device and radiation measuring system | |
| US11131613B2 (en) | Systems and methods for handheld snow stability analyzer | |
| US20130247945A1 (en) | Contacting assembly for conductors present on flat structures, in particular glass panels | |
| JP6077236B2 (en) | Information processing apparatus, information processing method, and program | |
| CN102170608A (en) | Automatic handheld equipment positioning method | |
| US20130300632A1 (en) | Display system, display method and portable electronic device | |
| CN104949671A (en) | Electronic equipment and information processing method | |
| JP2013168761A (en) | Information communication terminal and information communication system | |
| JP2022062180A (en) | Mobile terminal, position checking device, position identification system, position identification program, position checking program, position identification method, and position checking method | |
| KR20120056473A (en) | Navigation, Navigation Diagnostic Device, Navigation Diagnostic System and Method for Providing Navigation Diagnostic Service | |
| WO2014120303A2 (en) | Radiation detector | |
| US20250085411A1 (en) | Vertical localization between devices using altitude measurements | |
| JP2014096763A (en) | measuring device |
Legal Events
| Date | Code | Title | Description |
|---|---|---|---|
| PUAI | Public reference made under article 153(3) epc to a published international application that has entered the european phase |
Free format text: ORIGINAL CODE: 0009012 |
|
| 17P | Request for examination filed |
Effective date: 20140828 |
|
| AK | Designated contracting states |
Kind code of ref document: A1 Designated state(s): AL AT BE BG CH CY CZ DE DK EE ES FI FR GB GR HR HU IE IS IT LI LT LU LV MC MK MT NL NO PL PT RO RS SE SI SK SM TR |
|
| AX | Request for extension of the european patent |
Extension state: BA ME |
|
| DAX | Request for extension of the european patent (deleted) | ||
| RA4 | Supplementary search report drawn up and despatched (corrected) |
Effective date: 20160308 |
|
| RIC1 | Information provided on ipc code assigned before grant |
Ipc: G06T 11/20 20060101ALI20160302BHEP Ipc: G01T 1/00 20060101ALI20160302BHEP Ipc: G01T 1/16 20060101ALI20160302BHEP Ipc: H04M 11/00 20060101ALI20160302BHEP Ipc: H04M 1/00 20060101ALI20160302BHEP Ipc: G09B 29/00 20060101AFI20160302BHEP Ipc: G06T 11/60 20060101ALI20160302BHEP Ipc: G09B 29/10 20060101ALI20160302BHEP |
|
| 17Q | First examination report despatched |
Effective date: 20190201 |
|
| STAA | Information on the status of an ep patent application or granted ep patent |
Free format text: STATUS: THE APPLICATION IS DEEMED TO BE WITHDRAWN |
|
| 18D | Application deemed to be withdrawn |
Effective date: 20201106 |