EP2775691A2 - Gestion et la présentation de consommation d'énergie de station - Google Patents
Gestion et la présentation de consommation d'énergie de station Download PDFInfo
- Publication number
- EP2775691A2 EP2775691A2 EP14160993.3A EP14160993A EP2775691A2 EP 2775691 A2 EP2775691 A2 EP 2775691A2 EP 14160993 A EP14160993 A EP 14160993A EP 2775691 A2 EP2775691 A2 EP 2775691A2
- Authority
- EP
- European Patent Office
- Prior art keywords
- energy consumption
- station
- stations
- consumption value
- graphical
- Prior art date
- Legal status (The legal status is an assumption and is not a legal conclusion. Google has not performed a legal analysis and makes no representation as to the accuracy of the status listed.)
- Granted
Links
Images


Classifications
-
- G—PHYSICS
- G05—CONTROLLING; REGULATING
- G05B—CONTROL OR REGULATING SYSTEMS IN GENERAL; FUNCTIONAL ELEMENTS OF SUCH SYSTEMS; MONITORING OR TESTING ARRANGEMENTS FOR SUCH SYSTEMS OR ELEMENTS
- G05B15/00—Systems controlled by a computer
- G05B15/02—Systems controlled by a computer electric
-
- H—ELECTRICITY
- H04—ELECTRIC COMMUNICATION TECHNIQUE
- H04L—TRANSMISSION OF DIGITAL INFORMATION, e.g. TELEGRAPHIC COMMUNICATION
- H04L67/00—Network arrangements or protocols for supporting network services or applications
- H04L67/50—Network services
- H04L67/52—Network services specially adapted for the location of the user terminal
-
- G—PHYSICS
- G06—COMPUTING; CALCULATING OR COUNTING
- G06Q—INFORMATION AND COMMUNICATION TECHNOLOGY [ICT] SPECIALLY ADAPTED FOR ADMINISTRATIVE, COMMERCIAL, FINANCIAL, MANAGERIAL OR SUPERVISORY PURPOSES; SYSTEMS OR METHODS SPECIALLY ADAPTED FOR ADMINISTRATIVE, COMMERCIAL, FINANCIAL, MANAGERIAL OR SUPERVISORY PURPOSES, NOT OTHERWISE PROVIDED FOR
- G06Q50/00—Systems or methods specially adapted for specific business sectors, e.g. utilities or tourism
- G06Q50/06—Electricity, gas or water supply
-
- G—PHYSICS
- G06—COMPUTING; CALCULATING OR COUNTING
- G06Q—INFORMATION AND COMMUNICATION TECHNOLOGY [ICT] SPECIALLY ADAPTED FOR ADMINISTRATIVE, COMMERCIAL, FINANCIAL, MANAGERIAL OR SUPERVISORY PURPOSES; SYSTEMS OR METHODS SPECIALLY ADAPTED FOR ADMINISTRATIVE, COMMERCIAL, FINANCIAL, MANAGERIAL OR SUPERVISORY PURPOSES, NOT OTHERWISE PROVIDED FOR
- G06Q99/00—Subject matter not provided for in other groups of this subclass
-
- H—ELECTRICITY
- H04—ELECTRIC COMMUNICATION TECHNIQUE
- H04L—TRANSMISSION OF DIGITAL INFORMATION, e.g. TELEGRAPHIC COMMUNICATION
- H04L12/00—Data switching networks
- H04L12/28—Data switching networks characterised by path configuration, e.g. LAN [Local Area Networks] or WAN [Wide Area Networks]
- H04L12/2803—Home automation networks
- H04L12/2823—Reporting information sensed by appliance or service execution status of appliance services in a home automation network
- H04L12/2825—Reporting to a device located outside the home and the home network
-
- H—ELECTRICITY
- H04—ELECTRIC COMMUNICATION TECHNIQUE
- H04L—TRANSMISSION OF DIGITAL INFORMATION, e.g. TELEGRAPHIC COMMUNICATION
- H04L12/00—Data switching networks
- H04L12/28—Data switching networks characterised by path configuration, e.g. LAN [Local Area Networks] or WAN [Wide Area Networks]
- H04L12/2803—Home automation networks
- H04L12/283—Processing of data at an internetworking point of a home automation network
- H04L12/2834—Switching of information between an external network and a home network
-
- H—ELECTRICITY
- H04—ELECTRIC COMMUNICATION TECHNIQUE
- H04L—TRANSMISSION OF DIGITAL INFORMATION, e.g. TELEGRAPHIC COMMUNICATION
- H04L43/00—Arrangements for monitoring or testing data switching networks
- H04L43/04—Processing captured monitoring data, e.g. for logfile generation
- H04L43/045—Processing captured monitoring data, e.g. for logfile generation for graphical visualisation of monitoring data
-
- H—ELECTRICITY
- H04—ELECTRIC COMMUNICATION TECHNIQUE
- H04L—TRANSMISSION OF DIGITAL INFORMATION, e.g. TELEGRAPHIC COMMUNICATION
- H04L12/00—Data switching networks
- H04L12/28—Data switching networks characterised by path configuration, e.g. LAN [Local Area Networks] or WAN [Wide Area Networks]
- H04L12/2803—Home automation networks
- H04L2012/2847—Home automation networks characterised by the type of home appliance used
- H04L2012/285—Generic home appliances, e.g. refrigerators
Definitions
- the present invention relates to the field of communications, and in particular, to a station energy consumption management technology in the field of communications.
- Embodiments of the present invention provide an intuitive and efficient method and apparatus for station energy consumption management and presentation.
- a station energy consumption management method includes:
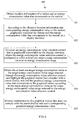
- a station energy consumption presentation method includes:
- An alternative embodiment of present invention according to the station energy consumption presentation method or any of the alternative embodiment depending on the station energy consumption presentation method, wherein the visual factor is a color, a geometric shape, a size or a combination of any two or three of the color, geometric shape and size.
- An alternative embodiment of present invention according to the station energy consumption presentation method or any of the alternative embodiment depending on the station energy consumption presentation method further comprises:
- An alternative embodiment of present invention according to the station energy consumption presentation method or any of the alternative embodiment depending on the station energy consumption presentation method further comprises: weakening representation of a station and an energy consumption label that corresponds to the station, wherein the station complies with the preset display rule but does not match the selected region type.
- a station energy consumption presentation apparatus comprising:
- An alternative embodiments of the present invention according to the station presentation apparatus further comprising:
- the graphical representation weakening module is further configured to weaken representation of a station and an energy consumption label that corresponds to the station, wherein the station complies with the preset display rule but does not match the selected region type.
- a station energy consumption management system includes:
- the geographical location information of the station and the energy consumption value of the station are graphically represented on the display interface, so that an administrator can intuitively observe geographical distribution of the station and an energy consumption condition of each station.
- the energy consumption value selection control for selecting the energy consumption value or the energy consumption value range is generated on the display interface, so that the administrator can rapidly and conveniently select a desired target energy consumption value or target energy consumption value range.
- the graphical station complying with a preset display rule and the graphical energy consumption value that corresponds to the graphical station complying with the preset display rule are highlighted, so that the administrator can intuitively select a desired station, and rapidly understand the energy consumption condition corresponding to the station, so as to make energy consumption management of the station convenient.
- an embodiment of the present invention provides an operating environment of a station energy consumption management method, that is, hardware architecture for implementing the present invention, which includes a control unit 12, a transmission unit 14, and a net management unit 16.
- the control unit 12 is configured to be connected to loads such as a base station, load supporting energy sources such as an oil machine, solar energy, a wind turbine, a battery and a power supply, various load energy consumption monitoring devices, and load operating environment monitoring devices such as a temperature sensor, a humidity sensor and a smoke sensor in a station through a control interface, and is configured to obtain an operating parameter of the loads in the station and transmit the operating parameter to the net management unit 16 through the transmission unit 14, and meanwhile, may perform unified energy consumption management and scheduling on the loads and load supporting energy sources according to a control signal sent by the net management unit 16.
- loads such as a base station, load supporting energy sources such as an oil machine, solar energy, a wind turbine, a battery and a power supply, various load energy consumption monitoring devices, and load operating environment monitoring devices such as a temperature sensor, a humidity sensor and a smoke sensor in a station through a control interface
- load operating environment monitoring devices such as a temperature sensor, a humidity sensor and a smoke sensor in a station
- the operating parameter may include, but not limited to, a location parameter of the station, a station energy consumption value (an energy consumption value of the load), an ambient temperature of the load, an operating temperature of the load, and energy supply parameters (including a current and a voltage) of various energy devices.
- the foregoing operating parameter may be used by the net management unit 16 to judge a working condition of the load and to send a control instruction accordingly.
- the transmission unit 14 is configured to perform bidirectional data transmission between the control unit 12 and the net management unit 16.
- the data may be the operating parameter of the load and the control instruction that is sent by the net management unit 16.
- a transmission mode of the transmission unit 14 may be two transmission modes shown in FIG. 2 , namely, an in-band transmission mode and an out-band transmission mode.
- the in-band transmission mode refers to that a controller of the control unit 12 reports collected information through a channel (E1) of a base station (GSM/LTMTS/LTE/CDMA/WIMAX), so as to transmit state information and energy consumption information of the load and the supporting device that are obtained by the control unit 12 to the network management unit 12 in real time.
- the out-band transmission mode refers to that the control unit 12 transmits the obtained state information and energy consumption information of the load and the supporting device back to the net management unit 16 through an independent channel such as a short message, a GPRS and an IP.
- the net management unit 16 is configured to monitor and manage various in-network devices, and may be specifically configured to adjust an operating parameter, an environmental parameter and a control parameter of the in-network device.
- the net management unit 16 includes a display apparatus, a processing apparatus, a storage apparatus, an input apparatus, and a data bus that is connected to the foregoing various apparatuses.
- a station energy consumption management method and a station energy consumption presentation method that are provided by the embodiment of the present invention are illustrated below based on the hardware architecture introduced above. It should be noted that, the foregoing hardware architecture is an exemplary solution that is provided to describe the present invention clearly. The present invention may be run in any hardware environment that is capable of implementing the content of the present invention, which is not limited to the foregoing hardware architecture.
- An embodiment of the present invention provides a station energy consumption management method, which includes:
- the geographical location information of the station and the energy consumption value of the station are obtained, and the geographical location information of the station and the energy consumption value of the station are graphically represented on the display interface, so that an administrator can intuitively observe geographical distribution of the station and an energy consumption condition of each station.
- the energy consumption value selection control for selecting the energy consumption value or the energy consumption value range is generated on the display interface, so that the administrator can rapidly and conveniently select a desired target energy consumption value or target energy consumption value range.
- the graphical station complying with a preset display rule and the graphical energy consumption value that corresponds to the graphical station complying with the preset display rule are highlighted, so that the administrator can intuitively select a desired station, and rapidly understand the energy consumption condition corresponding to the station, so as to make energy consumption management of the station convenient.
- the graphically representing the station and the energy consumption value that corresponds to the station on the display interface according to the obtained location information and corresponding energy consumption value of the station includes:
- the visual distribution diagram of the station is generated according to the location information of the station, so that the administrator can locate the station conveniently. Meanwhile, the corresponding graphical energy consumption value of the station is associated with the station with respect to the geometric position, so that the administrator can rapidly understand the energy consumption state of the station.
- the graphically representing the station and the energy consumption value that corresponds to the station on the display interface according to the obtained location information and corresponding energy consumption value of the station further includes: rating energy consumption of the stations according to the energy consumption values that are corresponding to the stations, and applying different visual elements to stations of different energy consumption levels.
- applying different visual elements to stations of different energy consumption levels may further improve identifiability of the energy consumption condition, so that the administrator can rapidly identify the energy consumption label of each station, thereby determining the energy consumption state of each station.
- the highlighting the graphical station complying with the preset display rule and the graphical energy consumption value that corresponds to the graphical station complying with the preset display rule according to the target energy consumption value or the target energy consumption value range selected by the energy consumption value selection control includes: comparing the energy consumption value of the station with the selected target energy consumption value or target energy consumption value range, and highlighting the graphical station which has an energy consumption value greater than the target energy consumption value and the graphical energy consumption value that corresponds to the graphical station.
- the preset display rule is specifically set to display the graphical station that has the energy consumption value greater than the target energy consumption value and the graphical energy consumption value that corresponds to the graphical station, so as to enable a display manner of the graphical station and the graphical energy consumption value that corresponds to the graphical station to comply with a daily operating habit of the user better, so that the user can rapidly grasp, according to experience thereof, a method of using the energy consumption value selection control, thereby improving interface friendliness of the station energy consumption management method of the present invention.
- the method further includes: weakening representation of a graphical station not complying with the preset display rule and a corresponding graphical energy consumption value.
- the selected station complying with the preset display rule and the corresponding energy consumption state are further highlighted, so that the administrator can manage the selected station conveniently.
- the generating the energy consumption value selection control that is graphical and presented on the display interface where the energy consumption value selection control is configured to select at least one target energy consumption value or a target energy consumption value range includes: generating the energy consumption value selection control that is graphical and presented on the display interface, and associating the energy consumption value selection control with the energy consumption value that corresponds to the station, where a maximum target energy consumption value that is capable of being selected by the energy consumption value selection control is not smaller than an energy consumption value of a station consuming greatest energy, and a minimum target energy consumption value that is capable of being selected by the energy consumption value selection control is not greater than an energy consumption value of a station consuming least energy.
- the energy consumption value selection control is associated with the energy consumption value corresponding to the station, so as to enable a value selection range of the energy consumption value selection control to match the current energy consumption value corresponding to the station, so that the administrator can precisely select the target energy consumption value or the target energy consumption value range.
- the generating the energy consumption value selection control that is graphical and presented on the display interface includes: generating a graphical ruler that takes the energy consumption value as a scale, and generating at least one graphical vernier that is capable of moving along the graphical ruler to select the target energy consumption value or the target energy consumption value range.
- the energy consumption value selection control is set as the ruler that takes the energy consumption value as a scale, and the vernier that is capable of moving along the graphical ruler is generated for a user to select the target energy consumption value, which complies with a use habit of the user, intuitively reflects a function of the energy consumption value selection control, saves a process in which the user is required to learn the use method and function of the energy consumption value selection control, and is convenient for use.
- the station energy consumption management method provided by the embodiment of the present invention further includes: obtaining a set region type.
- the highlighting the graphical station complying with the preset display rule and the graphical energy consumption value that corresponds to the graphical station complying with the preset display rule according to the target energy consumption value or the target energy consumption value range selected by the energy consumption value selection control includes:
- the station energy consumption management method provided by the embodiment of the present invention further includes: weakening representation of the graphical station and the graphical energy consumption value that corresponds to the station, where the graphical station is among the graphical stations complying with the preset display rule and does not match the obtained region type.
- the user is allowed to obtain the station complying with region type characteristics according to the preset region type, so as to combine the selection of the target energy consumption value or the target energy consumption value range to select the station from a two-dimensional perspective, thereby further facilitating the use by the administrator and improving the experience of the user.
- the obtaining the set region type includes: classifying the geographical location information of the station, and generating, according to the geographical location information classification, a region type selection menu represented on the display interface, where the region type selection menu is used to select one or more region types.
- the user is allowed to associate the geographical location information of the station with the region type, so as to combine the selection of the target energy consumption value to select the station from a two-dimensional perspective, thereby further facilitating the use by the administrator and improving the experience of the user.
- the station energy consumption management method provided by the embodiment of the present invention further includes: the method further includes generating an energy saving control that is presented on the display interface, selecting, an energy saving control parameter of the station through the energy saving control, and configuring the selected energy saving control parameter on the highlighted station. Accordingly,
- the obtaining the location information of the station and the energy consumption value that corresponds to the station includes: obtaining the location information of the station and the energy consumption value that corresponds to the station configured with the control parameter.
- the graphically representing the station and the energy consumption value that corresponds to the station on the display interface according to the obtained location information of the station and corresponding energy consumption value includes: graphically representing the station and the energy consumption value that corresponds to the station configured with the control parameter on the display interface according to the obtained location information of the station and the energy consumption value that corresponds to the station configured with the control parameter.
- an energy saving control parameter may be selected through an energy saving control that is presented on the display interface, and the selected energy saving control parameter is configured on each highlighted station, that is, the selected station, and the station may adjust a working state or an operation mode thereof according to the energy saving control parameter, so as to achieve the objective of energy saving.
- the energy saving control parameter is configured to the station and the station adjusts the working state according to the control parameter, a current energy consumption state of the station is fed back instantly, and the graphical energy consumption value of the station is updated, so that the user can intuitively know the energy consumption state of the station after the energy saving control in time.
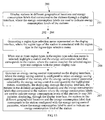
- a station energy consumption management method 100 provided by an embodiment of the present invention is illustrated below in detail.
- the station energy consumption management method 100 provided by the embodiment of the present invention includes:
- station energy consumption management When station energy consumption management is performed, it is required to obtain a station that needs to be monitored and managed and a corresponding energy consumption condition of the station first.
- the stations are usually distributed in different geographical locations. Therefore, in order to understand a distribution condition of the stations, geographical location information of the stations is required to be obtained.
- the obtaining the geographical location information of the station and the corresponding energy consumption value may be implemented by a management unit 12 that is deployed in the station. That is, the management unit 12 instantly obtains the corresponding information of the station actively or passively under triggering of a control instruction.
- the geographical location information of the station may also be pre-stored in a memory. That is, when the station is erected, the geographical location information of the station is recorded in an engineering parameter information table shown in FIG. 4 .
- the engineering parameter information table includes various information, and the geographical location information of the station is recorded in the engineering parameter information table in the form of global positioning system (GPS) information.
- GPS global positioning system
- the GPS information of the station in the engineering parameter information table can be invoked directly.
- the energy consumption value corresponding to the station may also be obtained by the management unit 12 regularly and stored in a storage apparatus, updated regularly, and invoked directly from the storage apparatus during use.
- the station and the corresponding energy consumption value need to be graphically represented to the user through the display interface, and in the embodiment of the present invention, the function is implemented by a net management unit 16. That is, a graphical user interface GUI module is pre-stored in the net management unit 16, and the GUI module intuitively exhibits the obtained distribution location of the station and energy consumption condition according to the geographical location information and the energy consumption value.
- An exhibition manner may vary according to requirements of the user, and may be, for example, a regional comprehensive energy consumption diagram exhibited in FIG. 5 .
- the stations are divided into multiple different regions according to locations thereof, and a sum of energy consumption values of all stations in the same region undergoes proper weighted calculation and is then used as the corresponding energy consumption value of the region to indicate the energy consumption condition in the region.
- the exhibition manner may be a separate energy consumption diagram. In such an exhibition manner, all stations are intuitively presented on the display interface according to the location information thereof and the energy consumption values.
- the graphically representation may be that: a modular electronic map is used as a base layer, and at this base layer, each station is marked by dotting and displayed according to the location information, and the energy consumption value corresponding to the station is displayed by being associated with the marked station.
- the association means that the graphical energy consumption value may be used to cover the graphical station location, or the graphical station and the graphical energy consumption value are displayed at the same time, an association relationship between the graphical station and the graphical energy consumption value may be exhibited through a distance there between or through an association symbol.
- an energy consumption value selection tool In order to enable the graphically represented station and corresponding energy consumption value to be conveniently used to perform corresponding management on the energy consumption value of each station, an energy consumption value selection tool needs to be generated on the graphical display interface.
- an energy consumption value selection control which is graphical and presented on the display interface is generated, and the energy consumption value selection control selects at least one target energy consumption value or a target energy consumption value range in a drag and drop manner.
- the target energy consumption value or the target energy consumption value range is selected through the energy consumption value selection control, so as to enable the user to rapidly select the energy consumption value or the energy consumption value range, thereby bringing convenience to the operation and increasing the efficiency.
- the energy consumption value selection control may be presented at an upper right corner of the display interface, and may be presented at any position on the screen according to preferences and habits of the user.
- An embodiment of the present invention provides an energy consumption value selection control 10, which performs energy consumption value selection in a drag and drop manner. Through the drag and drop manner, the selection of the energy consumption value can be implemented efficiently, thereby improving the experience of the user.
- 104 Obtain the at least one target energy consumption value or the target energy consumption value range selected through the energy consumption value selection control, and highlight the graphical station complying with a preset display rule and the graphical energy consumption value that corresponds to the graphical station complying with the preset display rule according to the target energy consumption value or the target energy consumption value range selected by the energy consumption value selection control.
- the target energy consumption value or the energy consumption value range is selected through the energy consumption value selection control.
- the selected energy consumption value or energy consumption value range is used as a critical value triggering the preset display rule.
- the preset display rule refers to: a range of energy consumption value covered by a minimum value and a maximum value of the energy consumption value selection control is used as a general set, and the selected energy consumption level is used as a critical condition to divide the energy consumption value general set into at least one subset and display the at least one subset.
- the target energy consumption value is used as the critical value to divide the general set that is formed by the whole energy consumption value range covered by the energy consumption value selection control into a part greater than the critical value, that is, a subset, a part equal to the critical value, that is, another subset, and a part smaller than the critical value, that is, a third subset.
- a subset may be selected and displayed, that is, the part greater than the critical value is displayed, or the part equal to the critical value is displayed, or the part smaller than the critical value is displayed; or a combination of the divided subsets may be selected and displayed, that is, the part greater than the critical value and the part equal to the critical value are displayed, or the part smaller than the critical value and the part equal to the critical value are displayed, or the part greater than the critical value and the part smaller than the critical value are selected.
- the display rule when the energy consumption value selection control selects the target energy consumption value range is similar to the display rule when the target energy consumption value is selected, and is not repeated here for the sake of brevity.
- the geographical location information of the station and the energy consumption value of the station are obtained, and the geographical location information of the station and the energy consumption value of the station are graphically represented on the display interface, so that an administrator can intuitively observe geographical distribution of the station and an energy consumption condition of each station.
- the energy consumption value selection control for selecting the energy consumption value or the energy consumption value range is generated on the display interface, so that the administrator can rapidly and conveniently select a desired target energy consumption value or target energy consumption value range.
- the graphical station complying with a preset display rule and the graphical energy consumption value that corresponds to the graphical station complying with the preset display rule are highlighted, so that the administrator can intuitively select a desired station, and rapidly understand the energy consumption condition corresponding to the station, so as to make energy consumption management of the station convenient.
- the station energy consumption management method provided by the embodiment of the present invention further includes:
- a method for weakening representation of the other graphical stations and the corresponding graphical energy consumption values is provided. Specifically, a contrast between the graphical station not complying with the preset display rule together with the corresponding graphical energy consumption value and a background of the display interface may be decreased, or the graphical station not complying with the preset display rule and the corresponding graphical energy consumption value are hidden. In this way, the whole display interface looks simple and clear as compared with the display interface in FIG. 1 , thereby bringing convenience to identification and a next operation performed by the user.
- the selected station complying with the preset display rule and the corresponding energy consumption state are further highlighted, so that the administrator can manage the selected station conveniently.
- a specific implementation manner of 102 may be:
- the visual station distribution diagram needs to be generated first, and a generation manner thereof may be that, pre-modeling is performed on the station according to the location information thereof, so as to form a visual station distribution diagram.
- a generated visual station distribution diagram model may be directly invoked to visually present a distribution condition of the station to the user.
- the generation of the visual station distribution diagram may be as follows. After the geographical location information (GPS information, having a unique longitude and latitude) of the station is obtained instantly, marking, that is, dotting, is performed on a prepared map (a geographical location distribution diagram) according to the geographical location information, thereby generating the visual geographical location distribution diagram.
- GPS information geographical location information
- the control unit 12 in the station transmits the geographical location information of the station to the net management unit 16 through the transmission unit 14, and the net management unit 16 marks a specific location of the station on a prepared map according to the geographical location information of the station, which is displayed through a display apparatus of the net management unit 16.
- the obtained energy consumption value corresponding to the station is graphically represented in the visual station distribution diagram, where the graphical station energy consumption value and a geometric position of the corresponding station in the station distribution diagram are associated with each other.
- the geographical location information of the station and the energy consumption value are bound, that is, a mapping relationship is established between the geographical location information and the energy consumption value.
- coordinates of the station in the station distribution diagram are used as display coordinates of the graphical energy consumption value, thereby establishing an association relationship between the graphical station energy consumption value and the geometric position of the corresponding graphical station in the station distribution diagram.
- the graphical energy consumption value not only may represent the station, but also may indicate the energy consumption value of the station. It may be understood that, the association relationship between the graphical station and the energy consumption value that corresponds to the graphical station may be set according to requirements of the user. For example, the graphical energy consumption value is displayed near the corresponding graphical station, or an association icon, such as a connecting line and an arrow, is generated between the graphical energy consumption value and the corresponding graphical station.
- the visual distribution diagram of the station is generated according to the location information of the station, so that the administrator can locate the station conveniently. Meanwhile, the corresponding graphical energy consumption value of the station is associated with the station with respect to the geometric position, so that the administrator can rapidly understand the energy consumption state of the station.
- 103 includes:
- the energy consumption value selection control is further associated with the energy consumption value that corresponds to the station, so as to ensure that the maximum target energy consumption value that is capable of being selected by the energy consumption value selection control is not smaller than the energy consumption value of the station consuming the greatest energy and the minimum target energy consumption value that is capable of being selected by the energy consumption value selection control is not greater than the energy consumption value of the station consuming the least energy.
- the energy consumption value selection control is associated with the energy consumption value that corresponds to the station, so that a value selection range of the energy consumption value selection control can match the current energy consumption value corresponding to the station, and the administrator can precisely select the target energy consumption value.
- the generating the energy consumption value selection control that is graphical and presented on the display interface in 103 includes:
- the net management unit 16 may generate, through a GUI module, the ruler indicating the energy consumption value, and generate at least one vernier that is also called slider and capable of moving along the energy consumption value ruler.
- a currently selected target energy consumption value is determined according to a reading of the ruler that corresponds to the vernier or slider.
- FIG. 8 exhibits the graphical energy consumption value selection control that is generated through the GUI module and provided by the embodiment of the present invention.
- the graphical energy consumption value control includes a graphical ruler 1002 that takes the energy consumption value as a scale and two verniers/sliders 1004 capable of moving along the graphical ruler 1002.
- the verniers/sliders 1004 are configured to move along the graphical ruler 1002 to select a corresponding target energy consumption value or target energy consumption value range.
- FIG. 8 multiple states are shown in sequence from A to D, in which the target energy consumption value range is selected through the two verniers/sliders 1006.
- the energy consumption value selection control is set as the ruler that takes the energy consumption value as a scale, and the vernier that is capable of moving along the graphical ruler is generated for a user to select the target energy consumption value, which complies with a use habit of the user, intuitively reflects a function of the energy consumption value selection control, saves a process in which the user is required to learn the function of the energy consumption value selection control, and is convenient for use.
- the station energy consumption management method provided by the embodiment of the present invention further includes:
- the highlighting the graphical station complying with the preset display rule and the graphical energy consumption value that corresponds to the graphical station complying with the preset display rule according to the target energy consumption value or the target energy consumption value range selected by the energy consumption value selection control in 103 includes:
- the different scenarios refer to regions or occasions in which station loads are obviously different.
- the load of a station changes obviously as the number of users in different geographical locations changes. Specifically, the loads of stations in the mountainous areas, forest areas, and villages are light, but the loads of the stations in towns and cities are heavy. More specifically, the loads of stations along routes of high-speed railways and in colleges and stadiums are heavy, and accordingly the loads of stations in other functional regions are lighter.
- the regions covered by stations may be divided into multiple different region types, and each of the different region types includes a location information range thereof.
- the location information range covered by the obtained region type is matched with the location information of the station.
- the location information covered by the obtained region type is a closed region defined by a longitude and latitude range
- the longitude and latitude of the station is compared with a longitude range and a latitude range of the selected region type. If the longitude and the latitude of the station fall within the longitude range and the latitude range of the selected region type, the matching is considered successful; otherwise, the matching is considered unsuccessful.
- a preset region type may also be applied to the station according to the geographical location information thereof.
- a relationship of mutual association or mapping is established between the geographical location information of the station and the region type.
- the corresponding region type may be found through the geographical location information of the station, and the corresponding geographical location information may be found through the region type.
- matching is performed on the location information of the station and the obtained region type. If being the same as the preset mapping relationship or association relationship, the matching is considered successful; otherwise, the matching is considered unsuccessful.
- the location information of the station is matched with the obtained region type, the successfully matched graphical station and the graphical energy consumption value that corresponds to the graphical station are highlighted, and representation of the other graphical stations that are not successfully matched and the corresponding graphical energy consumption values are weakened.
- the station energy consumption management method provided by the embodiment of the present invention further includes: weakening representation of the graphical station and the graphical energy consumption value that corresponds to the station, where the graphical station is among the graphical stations complying with the preset display rule and does not match the obtained region type.
- the user is allowed to obtain, according to the preset region type, the station complying with region type characteristics, so as to combine the selection of the target energy consumption value to select the station from a two-dimensional perspective, thereby further facilitating the use by the administrator and improving the experience of the user.
- the obtaining the preset region type in 106 includes:
- 107 Classify the geographical location information of the station, and generate, according to the geographical location information classification, a region type selection menu represented on the display interface, where the region type selection menu is used to select one or more region types.
- the different scenarios refer to regions or occasions in which station loads are obviously different.
- the load of a station changes obviously as the geographical location changes. Specifically, the loads of stations in the mountainous areas, forest areas, and villages are light, but the loads of the stations in towns and cities are heavy. More specifically, the loads of stations along routes of high-speed railways and in colleges and stadiums are heavy, and accordingly the loads of stations in other functional regions are lighter.
- the regions covered by stations may be divided into multiple different region types, and each of the different region types includes a location information range thereof.
- the location information range covered by the obtained region type is matched with the location information of the station. Specifically, it may be that, a relationship of mutual association or mapping is established between the geographical location information of the station and the region type. Under the relationship of mutual association or mutual mapping, the corresponding region type may be found through the geographical location information of the station, and the corresponding geographical location information may also be found through the region type. Based on this, matching is performed on the location information of the station and the obtained region type.
- the matching is considered successful; otherwise, the matching is considered unsuccessful
- the location information of the station is matched with the obtained region type
- the successfully matched graphical station and the graphical energy consumption value that corresponds to the graphical station are highlighted, and representation of the other graphical stations not successfully matched and the graphical energy consumption values are weakened.
- the user is allowed to associate the geographical location information of the station with the region type, so as to combine the selection of the target energy consumption value to select the station from a two-dimensional perspective, thereby further facilitating the use by the administrator and improving the experience of the user.
- 103 further includes:
- the stations may be rated according to specific energy consumption values thereof. That is, the energy consumption of the stations is divided into multiple energy consumption levels according to a hierarchical manner.
- different visual elements are applied to the different energy consumption levels.
- the visual elements may be set according to preferences or requirements of the user.
- the visual elements may be colors, shapes, sizes or combinations of various visual elements. Specifically, in the embodiment of the present invention, colors are used as the visual elements to be applied to different energy consumption levels. For a specific scheme, reference may be made to Table 1.
- the energy consumption value of the station ranging from 1000TPw to 4000TPw is divided into four different levels.
- colors such as blue, yellow and red are used as visual elements to be applied to the graphical energy consumption values that correspond to the corresponding graphical stations.
- the net management unit 16 controls user visible chromatic performance of the graphical energy consumption values corresponding to the graphical stations of different energy consumption levels according to a ratio of RGB, the three primary colors.
- applying different visual elements to stations of different energy consumption levels may further improve identifiability of the energy consumption condition, so that the administrator can rapidly identify the energy consumption label of each station, thereby determining the energy consumption state of each station.
- the station energy consumption management method provided by the embodiment of the present invention further includes:
- the obtaining the location information of the station and the energy consumption value that corresponds to the station includes: obtaining the location information of the station and the energy consumption value that corresponds to the station configured with the control parameter.
- the graphically representing the station and the energy consumption value that corresponds to the station on the display interface according to the obtained location information of the station and corresponding energy consumption value includes: graphically representing the station and the energy consumption value that corresponds to the station configured with the control parameter on the display interface according to the obtained location information of the station and the energy consumption value that corresponds to the station configured with the control parameter.
- an embodiment of the present invention further provides an energy saving management method.
- the net management unit 16 may generate an energy saving control, and various energy consumption parameters of the station may be effectively selected and set through the energy saving control.
- a specific energy saving control parameter is sent to the station through the transmission unit 14, and the management unit 12 in the station configures the energy saving control parameter to each load in the station, thereby achieving energy saving management of each station.
- an energy consumption value corresponding to the station configured with the control parameter may be obtained to update the corresponding graphical energy consumption value of each station under the new energy saving control parameter, so as to intuitively observe the energy consumption condition of each station after the energy saving control is performed.
- the energy saving control parameter may be selected through the energy saving control represented on the display interface, and the selected energy saving control parameter is configured on each highlighted station, that is, the selected station, and the station may adjust a working state or an operation mode thereof according to the energy saving control parameter to achieve the objective of energy saving. Meanwhile, after the energy saving control parameter is configured to the station and the station adjusts the working state according to the control parameter, a current energy consumption state of the station is fed back instantly, and the graphical energy consumption value of the station is updated, so that the user can intuitively know the energy consumption state of the station after the energy saving control in time.
- An embodiment of the present invention further provides a station energy consumption presentation method, which includes:
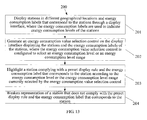
- the stations in the different geographical locations and the energy consumption labels that correspond to the stations are displayed on the display interface, so that an administrator can intuitively observe geographical distribution of the stations and an energy consumption condition of each station.
- the energy consumption value selection control that is configured to select the energy consumption level of the station is generated on the display interface, so that the administrator can select the corresponding energy consumption level or energy consumption level range through the energy consumption value selection control.
- the graphical station complying with the preset display rule and the graphical energy consumption value that corresponds to the graphical station complying with the preset display rule are highlighted through the method by using the selected energy consumption level or energy consumption level range, so that the administrator can rapidly find a desired station to perform following processing.
- the method when the station complying with the preset display rule and the energy consumption label that corresponds to the station are highlighted according to the current energy consumption level selected by the energy consumption value selection control, the method further includes:
- the selected station complying with the preset display rule and the corresponding energy consumption state are highlighted, so that the administrator can manage the selected station conveniently.
- the station energy consumption presentation method provided by the embodiment of the present invention further includes: if the stations correspond to multiple different energy consumption levels, applying different visual elements to energy consumption labels of the stations that belong to the different energy consumption levels.
- applying different visual elements to stations of different energy consumption levels can further improve identifiability of the energy consumption condition, so that the administrator can rapidly identify the energy consumption label of each station, thereby determining the energy consumption state of each station.
- the station energy consumption presentation method provided by the embodiment of the present invention further includes:
- the highlighting the station complying with the preset display rule and the energy consumption label that corresponds to the station according to the energy consumption level selected by the energy consumption value selection control includes: when one or more region types in the region type selection menu is selected, highlighting a station and the energy consumption label that corresponds to the station, where the station matches the selected region type and complies with the preset display rule.
- the station energy consumption presentation method provided by the embodiment of the present invention further includes: weakening representation of a station and the energy consumption label that corresponds to the station, where the station complies with the preset display rule but does not match the selected region type.
- the user is allowed to associate the geographical location information of the station with the region type, so as to combine the selection of the target energy consumption value to select the station from a two-dimensional perspective, thereby further facilitating the use by the administrator and improving the experience of the user.
- the station energy consumption presentation method provided by the embodiment of the present invention further includes:
- the energy saving control parameter may be selected through the energy saving control represented on the display interface, and the selected energy saving control parameter is configured on each highlighted station, that is, the selected station, and the station may adjust a working state or an operation mode thereof according to the energy saving control parameter to achieve the objective of energy saving. Meanwhile, after the energy saving control parameter is configured to the station and the station adjusts the working state according to the control parameter, a current energy consumption state of the station is fed back instantly, and the graphical energy consumption value of the station is updated, so that the user can intuitively know the energy consumption state of the station after the energy saving control in time.
- positions of the energy consumption value selection control, the region type selection menu, the energy saving mode selection menu, the stations, and the energy consumption labels on the display interface do not interfere with each other.
- the energy consumption value selection control, the region type selection menu, the energy saving mode selection menu, the stations, and the energy consumption labels are staggered, thereby highlighting the stations and the energy consumption labels to bring convenience to viewing by the administrator.
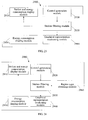
- a station energy consumption presentation method 200 provided by an embodiment of the present invention includes:
- 201 Display stations in different geographical locations and energy consumption labels that correspond to the stations through a display interface, where the energy consumption labels are used to indicate energy consumption levels of the stations.
- the stations and the corresponding energy consumption values thereof are presented by a display interface.
- the stations and the corresponding energy consumption labels thereof are displayed in different positions on the display interface accordingly according to different geographical locations thereof.
- the function is implemented through the net management unit 16.
- the energy label and the graphical station are associated with each other, an association manner of which may be that indication may be achieved through closeness with respect to the location, or visual elements of the same shape or the same color may be used for association, or an association symbol may be set for implementation.
- a solid round dot is disposed at the position where the station is located to represent the station and the energy consumption value that corresponds to the station at the same time.
- the current energy consumption level or energy consumption level range is selected through the energy consumption value selection control 1706, which may enable the user to rapidly select the energy consumption level or the energy consumption level range, thereby facilitating operation and increasing the efficiency.
- the energy consumption value selection control may be presented at an upper right corner of the display interface, or may be presented at any position on the screen according to preferences and habits of the user.
- the selected energy consumption level or energy consumption level range is used as a critical value triggering the preset display rule.
- the preset display rule refers to that, a range of energy consumption level covered by a minimum value and a maximum value of the energy consumption value selection control is used as a general set, and the selected energy consumption level or energy consumption level range is used as a critical value to divide the energy consumption value general set into at least one subset and display the at least one subset.
- the energy consumption value selection control selects a current energy consumption level
- the current energy consumption level is used as the critical value to divide the general set that is formed by the whole energy consumption level range covered by the energy consumption value selection control into a part greater than the critical value, that is, a subset, a part equal to the critical value, that is, another subset, and a part smaller than the critical value, that is, a third subset.
- a subset may be selected and displayed, that is, the part greater than the critical value is displayed, or the part equal to the critical value is displayed, or the part smaller than the critical value is displayed; or a combination of the divided subsets may be selected and displayed, that is, the part greater than the critical value and the part equal to the critical value are displayed, or the part smaller than the critical value and the part equal to the critical value are displayed, or the part greater than the critical value and the part smaller than the critical value are selected.
- the display rule when the energy consumption value selection control selects an energy consumption level range is similar to the display rule when the current energy consumption level is selected, and is not repeated here for the sake of brevity.
- the stations in the different geographical locations and the energy consumption labels that correspond to the stations are displayed on the display interface, so that an administrator can intuitively observe geographical distribution of the stations and an energy consumption condition of each station.
- the energy consumption value selection control that is configured to select the energy consumption level of the station is generated on the display interface, so that the administrator can select the corresponding energy consumption level through the energy consumption value selection control.
- the graphical station complying with the preset display rule and the graphical energy consumption value that corresponds to the graphical station complying with the preset display rule are highlighted through the method, so that the administrator can rapidly find a desired station to perform following processing.
- the method further includes:
- a contrast between a station not complying with the preset display rule together with a corresponding energy consumption label and a background of the display interface is decreased, or the station not complying with the preset display rule and the corresponding energy consumption label are hidden.
- the selected station complying with the preset display rule and the corresponding energy consumption state are further highlighted, so that the administrator can manage the selected station conveniently.
- the station energy consumption presentation method provided by the embodiment of the present invention further includes:
- different visual elements are applied to different energy consumption levels.
- the visual elements may be set according to preferences or requirements of the user.
- the visual elements may be colors, shapes, sizes or combinations of various visual elements.
- colors are used as the visual elements to be applied to different energy consumption levels.
- the energy consumption value of the station ranging from 1000TPw to 4000TPw is divided into four different levels.
- colors such as blue, yellow and red are used as visual elements to be applied to the graphical energy consumption values corresponding to the corresponding graphical stations.
- the net management unit 16 controls user visible chromatic performance of the graphical energy consumption values corresponding to the graphical stations of different energy consumption levels according to a ratio of RGB, the three primary colors.
- applying different visual elements to stations of different energy consumption levels may further improve identifiability of the energy consumption condition, so that the administrator can rapidly identify the energy consumption label of each station, thereby determining the energy consumption state of each station.
- the station energy consumption presentation method provided by the embodiment of the present invention further includes:
- the different scenarios refer to regions or occasions in which station loads are obviously different.
- the load of a station changes obviously as the geographical location changes. Specifically, the loads of stations in mountainous areas, forest areas, and villages are light, but the loads of the stations in towns and cities are heavy. More specifically, the loads of stations along routes of high-speed railways and in colleges and stadiums are heavy, and accordingly the loads of stations in other functional regions are lighter.
- Stations of different region types vary in the power consumption condition, overall condition and management method, so that the demand of selecting stations under different region types exists, and a region type selection menu that is provided by the embodiment of the present invention and displayed on the display interface can meet the demand.
- the regions covered by the stations may be associated with various region types in the region type selection menu. That is, a mapping relationship is established between the geographical location information of the station and the region type. Under the mapping relationship, the corresponding region type may be found through the geographical location information of the station, and the corresponding geographical location information may also be found through the region type.
- region type selection menu When one or more region types in the region type selection menu is selected, highlight a station and the energy consumption label that corresponds to the station, where the station matches the selected region type and complies with the preset display rule.
- the station associated with the selected region type and the energy consumption label that corresponds to the station are identified according to the association relationship, and the identified station and the energy consumption label that corresponds to the station are highlighted, where the station complies with the preset display rule.
- the station energy consumption presentation method provided by the embodiment of the present invention further includes: weakening representation of a station and the energy consumption label that corresponds to the station, where the station complies with the preset display rule but does not match the selected region type.
- the user is allowed to associate the geographical location information of the station with the region type, so as to combine the selection of the target energy consumption value to select the station from a two-dimensional perspective, thereby further facilitating the use by the administrator and improving the experience of the user.
- the station energy consumption presentation method provided by the embodiment of the present invention further includes:
- step 207 Generate an energy saving control represented on the display interface, where the energy saving control is configured to select an energy saving control parameter of the station; after the energy saving control parameter selected by the energy saving control is configured on the highlighted station, accordingly, the displaying, through the display interface, the stations in the different geographical locations and the energy consumption labels that correspond to the stations where the energy consumption labels are used to indicate the energy consumption levels of the stations in step 203 includes: displaying, through the display interface, the stations in the different geographical locations and the energy consumption label that corresponds to the station configured with the energy saving control parameter, where the energy consumption label is used to indicate an energy consumption level of the station.
- the embodiment of the present invention may further provide an energy saving control represented on the display interface.
- the net management unit 16 may generate an energy saving control.
- the energy saving control is presented on the display interface displaying the station and the energy consumption label that corresponds to the station.
- Various energy consumption parameters of the station may be effectively selected and set through the energy saving control.
- a specific energy saving control parameter is sent to the station through the transmission unit 14, and the management unit 12 in the station configures the energy saving control parameter to each load in the station, thereby achieving energy saving management of each station.
- the energy saving control parameter may be selected through the energy saving control represented on the display interface, and the selected energy saving control parameter is configured on each highlighted station, that is, the selected station, and the station may adjust a working state or an operation mode thereof according to the energy saving control parameter to achieve the objective of energy saving. Meanwhile, after the energy saving control parameter is configured to the station and the station adjusts the working state according to the control parameter, a current energy consumption state of the station is fed back instantly, and the graphical energy consumption value of the station is updated, so that the user can intuitively know the energy consumption state of the station after the energy saving control in time.
- positions of the energy consumption value selection control, the region type selection menu, an energy saving mode selection menu, the stations, and the energy consumption labels on the display interface do not interfere with each other.
- the energy consumption value selection control, the region type selection menu, the energy saving mode selection menu, the stations, and the energy consumption labels are staggered, so as to highlight the stations and the energy consumption labels to bring convenience to viewing by the administrator.
- a station energy consumption management system 2200 provided by another embodiment of the present invention includes:
- Each functional module of the station energy consumption management system 2200 provided by the embodiment of the present invention may be configured to perform the process of the station energy consumption patent method 100 shown in FIG. 3 , a specific working principle and implementation mechanism of which are not repeated. For detailed content, reference may be made to descriptions of the station energy consumption management method in FIG. 3 .
- the geographical location information of the station and the energy consumption value of the station are obtained, and the geographical location information of the station and the energy consumption value of the station are graphically represented on the display interface, so that an administrator can intuitively observe geographical distribution of the station and an energy consumption condition of each station.
- the energy consumption value selection control for selecting the energy consumption value or the energy consumption value range is generated on the display interface, so that the administrator can rapidly and conveniently select a desired target energy consumption value or target energy consumption value range.
- the graphical station complying with a preset display rule and the graphical energy consumption value that corresponds to the graphical station complying with the preset display rule are highlighted, so that the administrator can intuitively select a desired station, and rapidly understand the energy consumption condition corresponding to the station, so as to make energy consumption management of the station convenient.
- the graphical interface generation module 2220 includes:
- the graphical interface generation module 2220 generates the visual distribution diagram of the station according to the location information of the station, so that an administrator can locate the station conveniently. Meanwhile, the corresponding graphical energy consumption value of the station is associated with the station with respect to the geometric position, so that the administrator can rapidly understand the energy consumption state of the station.
- the graphical interface generation module 2220 further includes:
- the energy consumption rating shaping unit 2226 in the graphical interface generation module 2220 applies different visual elements to stations of different energy consumption levels, so as to further improve identifiability of the energy consumption condition, so that the administrator can rapidly identify the energy consumption label of each station, thereby determining the energy consumption state of each station.
- the station filtering module 2240 in the station energy consumption management system 2200 provided by the embodiment of the present invention is specifically configured to compare the energy consumption value of the station with the selected target energy consumption value or target energy consumption value range, and highlight the graphical station that has the energy consumption value greater than the target energy consumption value and the graphical energy consumption value that corresponds to the graphical station.
- the preset display rule is specifically set to display the graphical station that has the energy consumption value greater than the target energy consumption value and the graphical energy consumption value that corresponds to the graphical station, so as to enable a display manner of the graphical station and the graphical energy consumption value that corresponds to the graphical station to comply with a daily operating habit of a user better, so that the user can rapidly grasp, according to experience thereof, a method of using the energy consumption value selection control, thereby improving interface friendliness of the station energy consumption management method of the present invention.
- the station energy consumption management system 2200 provided by the embodiment of the present invention further includes a graphical representation weakening module 2250, which is configured to weaken representation of a graphical station not complying with the preset display rule and a corresponding graphical energy consumption value, at the same time of or after the comparing the energy consumption value of the station with the selected target energy consumption value or target energy consumption value range and highlighting the station that has the energy consumption value greater than the target energy consumption value.
- a graphical representation weakening module 2250 which is configured to weaken representation of a graphical station not complying with the preset display rule and a corresponding graphical energy consumption value, at the same time of or after the comparing the energy consumption value of the station with the selected target energy consumption value or target energy consumption value range and highlighting the station that has the energy consumption value greater than the target energy consumption value.
- the graphical representation weakening module 2250 weakens representation of the station not complying with the preset display rule and the energy consumption state that corresponds to the station, so as to further highlight the selected station that comlies with the preset display rule and the corresponding energy consumption state, so that the administrator can manage the selected station conveniently.
- the control generation module 2230 is specifically configured to generate an energy consumption value selection control that is graphical and presented on the display interface, and associate the energy consumption value selection control with the energy consumption value corresponding to the station.
- a maximum target energy consumption value that is capable of being selected by the energy consumption value selection control is not smaller than an energy consumption value of a station consuming greatest energy, and a minimum target energy consumption value that is capable of being selected by the energy consumption value selection control is not greater than an energy consumption value of a station consuming least energy.
- the energy consumption value selection control is associated with the energy consumption value that corresponds to the station, so that a value selection range of the energy consumption value selection control can match the current energy consumption value corresponding to the station, and the administrator can precisely select the target energy consumption value or the target energy consumption value range.
- the generating, by the control generation module 2230, the energy consumption value selection control that is graphical and presented on the display interface specifically includes: generating a graphical ruler that takes the energy consumption value as a scale, and generating at least one graphical vernier that is capable of moving along the graphical ruler to select the target energy consumption value or the target energy consumption value range.
- the energy consumption value selection control is set as the ruler that takes the energy consumption value as a scale, and the vernier that is capable of moving along the graphical ruler is generated for a user to select the target energy consumption value, which complies with a use habit of the user, intuitively reflects a function of the energy consumption value selection control, saves a process in which the user is required to learn the use method and function of the energy consumption value selection control, and is convenient for use.
- the station energy consumption management system 2200 provided by the embodiment of the present invention further includes:
- the station filtering module 2240 is configured to match the location information of the graphical station complying with the preset display rule with the obtained region type, and highlight the graphical station matching the obtained region type and the graphical energy consumption value that corresponds to the graphical station.
- the graphical representation weakening module 2250 is further configured to weaken representation of the graphical station and the graphical energy consumption value that corresponds to the station, where the graphical station is among the graphical stations complying with the preset display rule and does not match the obtained region type.
- the region type obtaining module 2260 in the station energy consumption management system 2200 provided by the embodiment of the present invention allows the user to obtain the station complying with region type characteristics according to the preset region type, so as to combine the selection of the target energy consumption value or the target energy consumption value range to select the station from a two-dimensional perspective, thereby further facilitating the use by the administrator and improving the experience of the user.
- the region type obtaining module2260 includes:
- the user is allowed to associate the geographical location information of the station with the region type, so as to combine the selection of the target energy consumption value to select the station from a two-dimensional perspective, thereby further facilitating the use by the administrator and improving the experience of the user.
- the station energy consumption management system 2200 provided by the embodiment of the present invention further includes:
- the information obtaining module 2210 is configured to obtain the location information of the station and the energy consumption value that corresponds to the station configured with the control parameter.
- the graphical interface generation module 2230 is configured to graphically represent the station and the energy consumption value that corresponds to the station configured with the control parameter on the display interface according to the obtained location information of the station and the energy consumption value that corresponds to the station configured with the control parameter.
- the energy saving control parameter may be selected through the energy saving control represented on the display interface, and the selected energy saving control parameter is configured on each highlighted station, that is, the selected station, and the station may adjust a working state or an operation mode thereof according to the energy saving control parameter to achieve the objective of energy saving. Meanwhile, after the energy saving control parameter is configured to the station and the station adjusts the working state according to the control parameter, a current energy consumption state of the station is fed back instantly, and the graphical energy consumption value of the station is updated, so that the user can intuitively know the energy consumption state of the station after the energy saving control in time.
- a station energy consumption presentation apparatus 2900 provided by another embodiment of the present invention includes:
- the stations in the different geographical locations and the energy consumption labels that correspond to the stations are displayed on the display interface, so that an administrator can intuitively observe geographical distribution of the stations and an energy consumption condition of each station.
- the energy consumption value selection control that is configured to select the energy consumption level of the station is generated on the display interface, so that the administrator can select the corresponding energy consumption level or energy consumption level range through the energy consumption value selection control.
- the graphical station complying with the preset display rule and the graphical energy consumption value that corresponds to the graphical station complying with the preset display rule are highlighted through the method by using the selected energy consumption level or energy consumption level range, so that the administrator can rapidly find a desired station to perform following processing.
- the station energy consumption presentation apparatus 2900 provided by the embodiment of the present invention further includes:
- representation of the station not complying with the preset display rule and the energy consumption label that corresponds to the station are weakened, so as to further highlight the selected station complying with the preset display rule and the corresponding energy consumption state, so that the administrator can manage the selected station conveniently.
- the station energy consumption presentation apparatus 2900 provided by the embodiment of the present invention further includes:
- applying different visual elements to stations of different energy consumption levels can further improve identifiability of the energy consumption condition, so that the administrator can rapidly identify the energy consumption label of each station, thereby determining the energy consumption state of each station.
- the station energy consumption presentation apparatus 2900 provided by the embodiment of the present invention further includes:
- the station filtering module 2930 is configured to highlight, when one or more region types in the region type selection menu is selected, a station and an energy consumption label that corresponds to the station, where the station matches the selected region type and complies with the preset display rule.
- the graphical representation weakening module 2940 is further configured to weaken representation of a station and an energy consumption label that corresponds to the station, where the station complies with the preset display rule but does not match the selected region type.
- the user is allowed to associate the geographical location information of the station with the region type, so as to combine the selection of the target energy consumption value to select the station from a two-dimensional perspective, thereby further facilitating the use by the administrator and improving the experience of the user.
- the station energy consumption presentation apparatus 2900 provided by the embodiment of the present invention further includes:
- Each functional module of the station energy consumption management system 2900 provided by the embodiment of the present invention may be configured to perform the process of the station energy consumption presentation method 200 shown in FIG. 12 , a specific working principle and implementation mechanism of which are not repeated. For detailed content, reference may be made to descriptions of the station energy consumption presentation method in FIG. 12 .
- the energy saving control parameter may be selected through the energy saving control represented on the display interface, and the selected energy saving control parameter is configured on each highlighted station, that is, the selected station, and the station may adjust a working state or an operation mode thereof according to the energy saving control parameter to achieve the objective of energy saving. Meanwhile, after the energy saving control parameter is configured to the station and the station adjusts the working state according to the control parameter, a current energy consumption state of the station is fed back instantly, and the graphical energy consumption value of the station is updated, so that the user can intuitively know the energy consumption state of the station after the energy saving control in time.
- the present invention may be accomplished by software plus necessary universal hardware, and definitely may also be accomplished by hardware, but in most cases, the present invention is preferably implemented through the former method.
- the technical solutions of the present invention or the part that makes contributions to the prior art can be substantially embodied in the form of a software product.
- the computer software product is stored in a readable storage medium, for example, a floppy disk, a hard disk, or an optical disk of the computer, and includes several instructions used to instruct a computer device (for example, a personal computer, a server, or a network device) to perform the methods according to the embodiments of the present invention.
Applications Claiming Priority (3)
| Application Number | Priority Date | Filing Date | Title |
|---|---|---|---|
| CN201110216727XA CN102307106B (zh) | 2011-07-30 | 2011-07-30 | 一种站点能耗管理、呈现的方法及装置 |
| EP12779863.5A EP2733889B1 (fr) | 2011-07-30 | 2012-03-12 | Procédé et système de gestion et de présentation de consommation d'énergie de station |
| PCT/CN2012/072181 WO2012149838A1 (fr) | 2011-07-30 | 2012-03-12 | Procédé et dispositif de gestion et de présentation de consommation d'énergie de station |
Related Parent Applications (2)
| Application Number | Title | Priority Date | Filing Date |
|---|---|---|---|
| EP12779863.5A Division-Into EP2733889B1 (fr) | 2011-07-30 | 2012-03-12 | Procédé et système de gestion et de présentation de consommation d'énergie de station |
| EP12779863.5A Division EP2733889B1 (fr) | 2011-07-30 | 2012-03-12 | Procédé et système de gestion et de présentation de consommation d'énergie de station |
Publications (3)
| Publication Number | Publication Date |
|---|---|
| EP2775691A2 true EP2775691A2 (fr) | 2014-09-10 |
| EP2775691A3 EP2775691A3 (fr) | 2014-12-24 |
| EP2775691B1 EP2775691B1 (fr) | 2018-10-31 |
Family
ID=45380920
Family Applications (2)
| Application Number | Title | Priority Date | Filing Date |
|---|---|---|---|
| EP12779863.5A Active EP2733889B1 (fr) | 2011-07-30 | 2012-03-12 | Procédé et système de gestion et de présentation de consommation d'énergie de station |
| EP14160993.3A Active EP2775691B1 (fr) | 2011-07-30 | 2012-03-12 | Gestion et la présentation de consommation d'énergie de station |
Family Applications Before (1)
| Application Number | Title | Priority Date | Filing Date |
|---|---|---|---|
| EP12779863.5A Active EP2733889B1 (fr) | 2011-07-30 | 2012-03-12 | Procédé et système de gestion et de présentation de consommation d'énergie de station |
Country Status (4)
| Country | Link |
|---|---|
| US (1) | US9046883B2 (fr) |
| EP (2) | EP2733889B1 (fr) |
| CN (1) | CN102307106B (fr) |
| WO (1) | WO2012149838A1 (fr) |
Families Citing this family (13)
| Publication number | Priority date | Publication date | Assignee | Title |
|---|---|---|---|---|
| CN102307106B (zh) * | 2011-07-30 | 2013-08-07 | 华为技术有限公司 | 一种站点能耗管理、呈现的方法及装置 |
| US9459606B2 (en) * | 2012-02-28 | 2016-10-04 | Panasonic Intellectual Property Management Co., Ltd. | Display apparatus for control information, method for displaying control information, and system for displaying control information |
| CN104734333B (zh) * | 2013-12-24 | 2017-03-22 | 中国移动通信集团四川有限公司 | 一种油机调度方法及系统 |
| US9829947B1 (en) | 2014-04-04 | 2017-11-28 | Google Llc | Selecting and serving a content item based on device state data of a device |
| CN104008154A (zh) * | 2014-05-22 | 2014-08-27 | 华为技术有限公司 | 控制呈现地理信息的方法与装置 |
| CN104582178B (zh) * | 2015-01-04 | 2018-05-15 | 常州市武进区半导体照明应用技术研究院 | 环境光控设备的学习方法和环境光控设备 |
| CN106126238B (zh) * | 2016-06-27 | 2020-03-06 | 深圳市天橙一品科技有限公司 | 一种用户界面视效规范检测装置及方法 |
| CN106604508B (zh) * | 2017-02-23 | 2019-08-27 | 上海斐讯数据通信技术有限公司 | 基于自学习的灯光环境控制方法和控制系统 |
| CN107450492A (zh) * | 2017-08-14 | 2017-12-08 | 上海许继电气有限公司 | 污水厂生产线的能耗观测系统 |
| CN107562308B (zh) * | 2017-08-14 | 2020-04-10 | 广州耐奇电气科技有限公司 | 一种能源信息管理系统及方法 |
| CN107505891A (zh) * | 2017-09-21 | 2017-12-22 | 四川长虹电器股份有限公司 | 建筑能源管理系统 |
| CN110889528B (zh) * | 2018-09-10 | 2023-01-31 | 珠海格力电器股份有限公司 | 一种热水机节能优化分析方法及设备 |
| CN109917990A (zh) * | 2019-03-21 | 2019-06-21 | 广州视源电子科技股份有限公司 | 一种页面元素突出显示方法、装置、设备及存储介质 |
Family Cites Families (19)
| Publication number | Priority date | Publication date | Assignee | Title |
|---|---|---|---|---|
| CA2017974C (fr) * | 1989-08-07 | 1998-06-16 | Richard Alan Becker | Analyse graphique dynamique de donnees de reseau |
| JP3975472B2 (ja) | 1997-06-02 | 2007-09-12 | ソニー株式会社 | デジタルマップの拡大縮小表示方法、デジタルマップの拡大縮小表示装置、及びデジタルマップの拡大縮小表示プログラムを格納した格納媒体 |
| US6421355B1 (en) * | 1998-01-20 | 2002-07-16 | Texas Instruments Incorporated | Methods and linecard device for allocating multiple timeslots over digital backplane |
| US7164883B2 (en) * | 2001-02-14 | 2007-01-16 | Motorola. Inc. | Method and system for modeling and managing terrain, buildings, and infrastructure |
| US7219300B2 (en) * | 2002-09-30 | 2007-05-15 | Sanavigator, Inc. | Method and system for generating a network monitoring display with animated utilization information |
| US7299055B1 (en) * | 2002-10-25 | 2007-11-20 | Sprint Communications Company L.P. | Geographic representation of end user fixed wireless communication device |
| US7945658B1 (en) * | 2005-12-05 | 2011-05-17 | Narus, Inc. | Method for real-time visualization of BGP analysis and trouble-shooting |
| FR2919136B1 (fr) * | 2007-07-19 | 2009-09-25 | Alcatel Lucent Sas | Dispositif et procede d'analyse de donnees d'analyse relatives a des objets d'un reseau de communication |
| US8032317B2 (en) * | 2008-05-15 | 2011-10-04 | The Nielsen Company (Us), Llc | System and methods for metering and analyzing energy consumption of events within a portable device |
| US8260471B2 (en) * | 2008-08-27 | 2012-09-04 | Herman Miller, Inc. | Energy distribution management system |
| US20110302275A1 (en) * | 2010-06-04 | 2011-12-08 | Rich Prodan | Method and System for Matching Content Consumption Preference Via a Broadband Gateway |
| US20100185976A1 (en) * | 2009-01-21 | 2010-07-22 | Sairam Sadanandan | Graphic user interface and a method thereof |
| CN101872437A (zh) | 2009-04-27 | 2010-10-27 | 深圳市中电电力技术有限公司 | 一种节能处理方法及系统 |
| CN201765486U (zh) * | 2010-03-05 | 2011-03-16 | 姜永东 | 基于云计算的设备监控系统 |
| CN101881944A (zh) | 2010-06-18 | 2010-11-10 | 北京斯普信电子技术有限公司 | 能耗综合控制系统和方法 |
| US20120029720A1 (en) * | 2010-07-29 | 2012-02-02 | Spirae, Inc. | Dynamic distributed power grid control system |
| CN101977126A (zh) * | 2010-11-11 | 2011-02-16 | 华为技术服务有限公司 | 获取网络及设备节能能力的方法、设备及系统 |
| CN102055244A (zh) | 2010-12-30 | 2011-05-11 | 广东电网公司江门供电局 | 配电网变压器运行状态图形化监视方法 |
| CN102307106B (zh) * | 2011-07-30 | 2013-08-07 | 华为技术有限公司 | 一种站点能耗管理、呈现的方法及装置 |
-
2011
- 2011-07-30 CN CN201110216727XA patent/CN102307106B/zh active Active
-
2012
- 2012-03-12 WO PCT/CN2012/072181 patent/WO2012149838A1/fr active Application Filing
- 2012-03-12 EP EP12779863.5A patent/EP2733889B1/fr active Active
- 2012-03-12 EP EP14160993.3A patent/EP2775691B1/fr active Active
- 2012-07-27 US US13/560,532 patent/US9046883B2/en active Active
Non-Patent Citations (1)
| Title |
|---|
| None |
Also Published As
| Publication number | Publication date |
|---|---|
| WO2012149838A1 (fr) | 2012-11-08 |
| EP2733889A4 (fr) | 2014-12-24 |
| EP2733889A1 (fr) | 2014-05-21 |
| EP2775691A3 (fr) | 2014-12-24 |
| CN102307106B (zh) | 2013-08-07 |
| EP2775691B1 (fr) | 2018-10-31 |
| US20130166083A1 (en) | 2013-06-27 |
| EP2733889B1 (fr) | 2016-06-22 |
| US9046883B2 (en) | 2015-06-02 |
| CN102307106A (zh) | 2012-01-04 |
Similar Documents
| Publication | Publication Date | Title |
|---|---|---|
| US9046883B2 (en) | Method and apparatus for station energy consumption management and presentation | |
| US8982130B2 (en) | Cluster mapping to highlight areas of electrical congestion | |
| US10466663B2 (en) | Systems, methods and apparatus for an improved interface to energy management systems | |
| JP6369765B2 (ja) | 太陽光発電設備の監視装置、太陽光発電設備の監視システム、および、太陽光発電設備の監視方法 | |
| CN103607735B (zh) | 一种基于地图的基站显示方法及装置 | |
| CN103164114A (zh) | 终端操作界面图标分类方法及其装置 | |
| CN105677281A (zh) | 一种推送信息的显示方法及设备 | |
| TWI425193B (zh) | 地理資訊擷取之方法與電子裝置 | |
| CN109636329B (zh) | 一种基于热力图的用电客户投诉分析系统及分析方法 | |
| CN108885730A (zh) | 基于gis的集中式碳足迹监测系统及其方法 | |
| CN110196051B (zh) | 一种航线规划方法、系统及电子设备和存储介质 | |
| CN105224703B (zh) | 用电设备管理方法和系统 | |
| CN104978334A (zh) | 一种时空行为数据的处理方法和装置 | |
| CN102833771A (zh) | 一种无线控制器参数配置方法及装置 | |
| CN104392101B (zh) | 数据共享方法及装置 | |
| CN103793152A (zh) | 一种变电站监控系统画面在线定制方法 | |
| KR101595765B1 (ko) | 네트워크 맵을 이용한 빌딩 제어 방법 및 그 시스템 | |
| US20160266739A1 (en) | User Interface for Fleet Management | |
| CN105760277A (zh) | 一种数据中心运行情况分析报告自动显示的方法及系统 | |
| KR101654882B1 (ko) | 배전선로 고장분석 및 고장분포 표시 시스템 및 방법 | |
| US9473948B2 (en) | Method and apparatus for analyzing pilot pollution | |
| CN105490863A (zh) | 一种利用图层叠加实现多网元多指标的监控方法 | |
| CN106650079B (zh) | 变电站二次回路模拟图的显示方法和系统 | |
| CN107341197B (zh) | 一种电力系统多版本图形差异可视化展示方法 | |
| CN110807077A (zh) | 基于移动端组件式gis技术实现电力设备沿布的方法 |
Legal Events
| Date | Code | Title | Description |
|---|---|---|---|
| PUAI | Public reference made under article 153(3) epc to a published international application that has entered the european phase |
Free format text: ORIGINAL CODE: 0009012 |
|
| 17P | Request for examination filed |
Effective date: 20140321 |
|
| AC | Divisional application: reference to earlier application |
Ref document number: 2733889 Country of ref document: EP Kind code of ref document: P |
|
| AK | Designated contracting states |
Kind code of ref document: A2 Designated state(s): AL AT BE BG CH CY CZ DE DK EE ES FI FR GB GR HR HU IE IS IT LI LT LU LV MC MK MT NL NO PL PT RO RS SE SI SK SM TR |
|
| AX | Request for extension of the european patent |
Extension state: BA ME |
|
| PUAL | Search report despatched |
Free format text: ORIGINAL CODE: 0009013 |
|
| AK | Designated contracting states |
Kind code of ref document: A3 Designated state(s): AL AT BE BG CH CY CZ DE DK EE ES FI FR GB GR HR HU IE IS IT LI LT LU LV MC MK MT NL NO PL PT RO RS SE SI SK SM TR |
|
| AX | Request for extension of the european patent |
Extension state: BA ME |
|
| RIC1 | Information provided on ipc code assigned before grant |
Ipc: H04L 12/24 20060101AFI20141119BHEP Ipc: G06F 3/0481 20130101ALI20141119BHEP Ipc: H04L 12/26 20060101ALI20141119BHEP Ipc: G06F 3/0484 20130101ALI20141119BHEP Ipc: G06Q 50/06 20120101ALI20141119BHEP |
|
| R17P | Request for examination filed (corrected) |
Effective date: 20150317 |
|
| RBV | Designated contracting states (corrected) |
Designated state(s): AL AT BE BG CH CY CZ DE DK EE ES FI FR GB GR HR HU IE IS IT LI LT LU LV MC MK MT NL NO PL PT RO RS SE SI SK SM TR |
|
| STAA | Information on the status of an ep patent application or granted ep patent |
Free format text: STATUS: EXAMINATION IS IN PROGRESS |
|
| 17Q | First examination report despatched |
Effective date: 20170829 |
|
| GRAP | Despatch of communication of intention to grant a patent |
Free format text: ORIGINAL CODE: EPIDOSNIGR1 |
|
| STAA | Information on the status of an ep patent application or granted ep patent |
Free format text: STATUS: GRANT OF PATENT IS INTENDED |
|
| INTG | Intention to grant announced |
Effective date: 20180227 |
|
| GRAS | Grant fee paid |
Free format text: ORIGINAL CODE: EPIDOSNIGR3 |
|
| GRAA | (expected) grant |
Free format text: ORIGINAL CODE: 0009210 |
|
| STAA | Information on the status of an ep patent application or granted ep patent |
Free format text: STATUS: THE PATENT HAS BEEN GRANTED |
|
| AC | Divisional application: reference to earlier application |
Ref document number: 2733889 Country of ref document: EP Kind code of ref document: P |
|
| AK | Designated contracting states |
Kind code of ref document: B1 Designated state(s): AL AT BE BG CH CY CZ DE DK EE ES FI FR GB GR HR HU IE IS IT LI LT LU LV MC MK MT NL NO PL PT RO RS SE SI SK SM TR |
|
| REG | Reference to a national code |
Ref country code: CH Ref legal event code: EP Ref country code: GB Ref legal event code: FG4D |
|
| REG | Reference to a national code |
Ref country code: AT Ref legal event code: REF Ref document number: 1060708 Country of ref document: AT Kind code of ref document: T Effective date: 20181115 |
|
| REG | Reference to a national code |
Ref country code: DE Ref legal event code: R096 Ref document number: 602012053047 Country of ref document: DE |
|
| REG | Reference to a national code |
Ref country code: IE Ref legal event code: FG4D |
|
| REG | Reference to a national code |
Ref country code: NL Ref legal event code: MP Effective date: 20181031 |
|
| REG | Reference to a national code |
Ref country code: LT Ref legal event code: MG4D |
|
| REG | Reference to a national code |
Ref country code: AT Ref legal event code: MK05 Ref document number: 1060708 Country of ref document: AT Kind code of ref document: T Effective date: 20181031 |
|
| PG25 | Lapsed in a contracting state [announced via postgrant information from national office to epo] |
Ref country code: ES Free format text: LAPSE BECAUSE OF FAILURE TO SUBMIT A TRANSLATION OF THE DESCRIPTION OR TO PAY THE FEE WITHIN THE PRESCRIBED TIME-LIMIT Effective date: 20181031 Ref country code: LV Free format text: LAPSE BECAUSE OF FAILURE TO SUBMIT A TRANSLATION OF THE DESCRIPTION OR TO PAY THE FEE WITHIN THE PRESCRIBED TIME-LIMIT Effective date: 20181031 Ref country code: IS Free format text: LAPSE BECAUSE OF FAILURE TO SUBMIT A TRANSLATION OF THE DESCRIPTION OR TO PAY THE FEE WITHIN THE PRESCRIBED TIME-LIMIT Effective date: 20190228 Ref country code: AT Free format text: LAPSE BECAUSE OF FAILURE TO SUBMIT A TRANSLATION OF THE DESCRIPTION OR TO PAY THE FEE WITHIN THE PRESCRIBED TIME-LIMIT Effective date: 20181031 Ref country code: FI Free format text: LAPSE BECAUSE OF FAILURE TO SUBMIT A TRANSLATION OF THE DESCRIPTION OR TO PAY THE FEE WITHIN THE PRESCRIBED TIME-LIMIT Effective date: 20181031 Ref country code: BG Free format text: LAPSE BECAUSE OF FAILURE TO SUBMIT A TRANSLATION OF THE DESCRIPTION OR TO PAY THE FEE WITHIN THE PRESCRIBED TIME-LIMIT Effective date: 20190131 Ref country code: HR Free format text: LAPSE BECAUSE OF FAILURE TO SUBMIT A TRANSLATION OF THE DESCRIPTION OR TO PAY THE FEE WITHIN THE PRESCRIBED TIME-LIMIT Effective date: 20181031 Ref country code: PL Free format text: LAPSE BECAUSE OF FAILURE TO SUBMIT A TRANSLATION OF THE DESCRIPTION OR TO PAY THE FEE WITHIN THE PRESCRIBED TIME-LIMIT Effective date: 20181031 Ref country code: NO Free format text: LAPSE BECAUSE OF FAILURE TO SUBMIT A TRANSLATION OF THE DESCRIPTION OR TO PAY THE FEE WITHIN THE PRESCRIBED TIME-LIMIT Effective date: 20190131 Ref country code: LT Free format text: LAPSE BECAUSE OF FAILURE TO SUBMIT A TRANSLATION OF THE DESCRIPTION OR TO PAY THE FEE WITHIN THE PRESCRIBED TIME-LIMIT Effective date: 20181031 |
|
| PG25 | Lapsed in a contracting state [announced via postgrant information from national office to epo] |
Ref country code: RS Free format text: LAPSE BECAUSE OF FAILURE TO SUBMIT A TRANSLATION OF THE DESCRIPTION OR TO PAY THE FEE WITHIN THE PRESCRIBED TIME-LIMIT Effective date: 20181031 Ref country code: GR Free format text: LAPSE BECAUSE OF FAILURE TO SUBMIT A TRANSLATION OF THE DESCRIPTION OR TO PAY THE FEE WITHIN THE PRESCRIBED TIME-LIMIT Effective date: 20190201 Ref country code: PT Free format text: LAPSE BECAUSE OF FAILURE TO SUBMIT A TRANSLATION OF THE DESCRIPTION OR TO PAY THE FEE WITHIN THE PRESCRIBED TIME-LIMIT Effective date: 20190301 Ref country code: NL Free format text: LAPSE BECAUSE OF FAILURE TO SUBMIT A TRANSLATION OF THE DESCRIPTION OR TO PAY THE FEE WITHIN THE PRESCRIBED TIME-LIMIT Effective date: 20181031 Ref country code: AL Free format text: LAPSE BECAUSE OF FAILURE TO SUBMIT A TRANSLATION OF THE DESCRIPTION OR TO PAY THE FEE WITHIN THE PRESCRIBED TIME-LIMIT Effective date: 20181031 Ref country code: SE Free format text: LAPSE BECAUSE OF FAILURE TO SUBMIT A TRANSLATION OF THE DESCRIPTION OR TO PAY THE FEE WITHIN THE PRESCRIBED TIME-LIMIT Effective date: 20181031 |
|
| PG25 | Lapsed in a contracting state [announced via postgrant information from national office to epo] |
Ref country code: CZ Free format text: LAPSE BECAUSE OF FAILURE TO SUBMIT A TRANSLATION OF THE DESCRIPTION OR TO PAY THE FEE WITHIN THE PRESCRIBED TIME-LIMIT Effective date: 20181031 Ref country code: IT Free format text: LAPSE BECAUSE OF FAILURE TO SUBMIT A TRANSLATION OF THE DESCRIPTION OR TO PAY THE FEE WITHIN THE PRESCRIBED TIME-LIMIT Effective date: 20181031 Ref country code: DK Free format text: LAPSE BECAUSE OF FAILURE TO SUBMIT A TRANSLATION OF THE DESCRIPTION OR TO PAY THE FEE WITHIN THE PRESCRIBED TIME-LIMIT Effective date: 20181031 |
|
| REG | Reference to a national code |
Ref country code: DE Ref legal event code: R097 Ref document number: 602012053047 Country of ref document: DE |
|
| PG25 | Lapsed in a contracting state [announced via postgrant information from national office to epo] |
Ref country code: SK Free format text: LAPSE BECAUSE OF FAILURE TO SUBMIT A TRANSLATION OF THE DESCRIPTION OR TO PAY THE FEE WITHIN THE PRESCRIBED TIME-LIMIT Effective date: 20181031 Ref country code: RO Free format text: LAPSE BECAUSE OF FAILURE TO SUBMIT A TRANSLATION OF THE DESCRIPTION OR TO PAY THE FEE WITHIN THE PRESCRIBED TIME-LIMIT Effective date: 20181031 Ref country code: SM Free format text: LAPSE BECAUSE OF FAILURE TO SUBMIT A TRANSLATION OF THE DESCRIPTION OR TO PAY THE FEE WITHIN THE PRESCRIBED TIME-LIMIT Effective date: 20181031 Ref country code: EE Free format text: LAPSE BECAUSE OF FAILURE TO SUBMIT A TRANSLATION OF THE DESCRIPTION OR TO PAY THE FEE WITHIN THE PRESCRIBED TIME-LIMIT Effective date: 20181031 |
|
| PLBE | No opposition filed within time limit |
Free format text: ORIGINAL CODE: 0009261 |
|
| STAA | Information on the status of an ep patent application or granted ep patent |
Free format text: STATUS: NO OPPOSITION FILED WITHIN TIME LIMIT |
|
| 26N | No opposition filed |
Effective date: 20190801 |
|
| PG25 | Lapsed in a contracting state [announced via postgrant information from national office to epo] |
Ref country code: SI Free format text: LAPSE BECAUSE OF FAILURE TO SUBMIT A TRANSLATION OF THE DESCRIPTION OR TO PAY THE FEE WITHIN THE PRESCRIBED TIME-LIMIT Effective date: 20181031 Ref country code: MC Free format text: LAPSE BECAUSE OF FAILURE TO SUBMIT A TRANSLATION OF THE DESCRIPTION OR TO PAY THE FEE WITHIN THE PRESCRIBED TIME-LIMIT Effective date: 20181031 |
|
| REG | Reference to a national code |
Ref country code: CH Ref legal event code: PL |
|
| PG25 | Lapsed in a contracting state [announced via postgrant information from national office to epo] |
Ref country code: LU Free format text: LAPSE BECAUSE OF NON-PAYMENT OF DUE FEES Effective date: 20190312 |
|
| REG | Reference to a national code |
Ref country code: BE Ref legal event code: MM Effective date: 20190331 |
|
| PG25 | Lapsed in a contracting state [announced via postgrant information from national office to epo] |
Ref country code: LI Free format text: LAPSE BECAUSE OF NON-PAYMENT OF DUE FEES Effective date: 20190331 Ref country code: CH Free format text: LAPSE BECAUSE OF NON-PAYMENT OF DUE FEES Effective date: 20190331 Ref country code: IE Free format text: LAPSE BECAUSE OF NON-PAYMENT OF DUE FEES Effective date: 20190312 |
|
| PG25 | Lapsed in a contracting state [announced via postgrant information from national office to epo] |
Ref country code: BE Free format text: LAPSE BECAUSE OF NON-PAYMENT OF DUE FEES Effective date: 20190331 |
|
| PG25 | Lapsed in a contracting state [announced via postgrant information from national office to epo] |
Ref country code: TR Free format text: LAPSE BECAUSE OF FAILURE TO SUBMIT A TRANSLATION OF THE DESCRIPTION OR TO PAY THE FEE WITHIN THE PRESCRIBED TIME-LIMIT Effective date: 20181031 |
|
| PG25 | Lapsed in a contracting state [announced via postgrant information from national office to epo] |
Ref country code: MT Free format text: LAPSE BECAUSE OF NON-PAYMENT OF DUE FEES Effective date: 20190312 |
|
| PG25 | Lapsed in a contracting state [announced via postgrant information from national office to epo] |
Ref country code: CY Free format text: LAPSE BECAUSE OF FAILURE TO SUBMIT A TRANSLATION OF THE DESCRIPTION OR TO PAY THE FEE WITHIN THE PRESCRIBED TIME-LIMIT Effective date: 20181031 |
|
| PG25 | Lapsed in a contracting state [announced via postgrant information from national office to epo] |
Ref country code: HU Free format text: LAPSE BECAUSE OF FAILURE TO SUBMIT A TRANSLATION OF THE DESCRIPTION OR TO PAY THE FEE WITHIN THE PRESCRIBED TIME-LIMIT; INVALID AB INITIO Effective date: 20120312 |
|
| REG | Reference to a national code |
Ref country code: DE Ref legal event code: R079 Ref document number: 602012053047 Country of ref document: DE Free format text: PREVIOUS MAIN CLASS: H04L0012240000 Ipc: H04L0041000000 |
|
| PG25 | Lapsed in a contracting state [announced via postgrant information from national office to epo] |
Ref country code: MK Free format text: LAPSE BECAUSE OF FAILURE TO SUBMIT A TRANSLATION OF THE DESCRIPTION OR TO PAY THE FEE WITHIN THE PRESCRIBED TIME-LIMIT Effective date: 20181031 |
|
| PGFP | Annual fee paid to national office [announced via postgrant information from national office to epo] |
Ref country code: FR Payment date: 20230208 Year of fee payment: 12 |
|
| PGFP | Annual fee paid to national office [announced via postgrant information from national office to epo] |
Ref country code: GB Payment date: 20230202 Year of fee payment: 12 Ref country code: DE Payment date: 20230131 Year of fee payment: 12 |