EP2735859B1 - Method for analyzing blood cells and blood cell analyzer - Google Patents
Method for analyzing blood cells and blood cell analyzer Download PDFInfo
- Publication number
- EP2735859B1 EP2735859B1 EP13193634.6A EP13193634A EP2735859B1 EP 2735859 B1 EP2735859 B1 EP 2735859B1 EP 13193634 A EP13193634 A EP 13193634A EP 2735859 B1 EP2735859 B1 EP 2735859B1
- Authority
- EP
- European Patent Office
- Prior art keywords
- blood cells
- scattered light
- blood cell
- white blood
- lymphocytes
- Prior art date
- Legal status (The legal status is an assumption and is not a legal conclusion. Google has not performed a legal analysis and makes no representation as to the accuracy of the status listed.)
- Active
Links
- 210000000601 blood cell Anatomy 0.000 title claims description 141
- 238000000034 method Methods 0.000 title claims description 65
- 210000004698 lymphocyte Anatomy 0.000 claims description 126
- 210000000265 leukocyte Anatomy 0.000 claims description 96
- 230000001613 neoplastic effect Effects 0.000 claims description 85
- 239000003153 chemical reaction reagent Substances 0.000 claims description 72
- 238000005259 measurement Methods 0.000 claims description 63
- 238000004458 analytical method Methods 0.000 claims description 33
- 210000001616 monocyte Anatomy 0.000 claims description 21
- 230000010365 information processing Effects 0.000 claims description 20
- 210000003743 erythrocyte Anatomy 0.000 claims description 16
- 150000007523 nucleic acids Chemical class 0.000 claims description 16
- 102000039446 nucleic acids Human genes 0.000 claims description 16
- 108020004707 nucleic acids Proteins 0.000 claims description 16
- 210000004027 cell Anatomy 0.000 claims description 15
- 238000001514 detection method Methods 0.000 claims description 15
- 210000003651 basophil Anatomy 0.000 claims description 14
- 210000000440 neutrophil Anatomy 0.000 claims description 13
- 210000003979 eosinophil Anatomy 0.000 claims description 12
- 238000002360 preparation method Methods 0.000 claims description 11
- 239000003086 colorant Substances 0.000 claims description 6
- 210000004369 blood Anatomy 0.000 description 50
- 239000008280 blood Substances 0.000 description 50
- -1 white blood cells Chemical class 0.000 description 26
- 239000007850 fluorescent dye Substances 0.000 description 24
- 125000000217 alkyl group Chemical group 0.000 description 20
- 125000004432 carbon atom Chemical group C* 0.000 description 18
- 201000010099 disease Diseases 0.000 description 15
- 208000037265 diseases, disorders, signs and symptoms Diseases 0.000 description 15
- 238000003745 diagnosis Methods 0.000 description 12
- 230000003287 optical effect Effects 0.000 description 12
- 125000003342 alkenyl group Chemical group 0.000 description 11
- 239000004094 surface-active agent Substances 0.000 description 10
- 208000010839 B-cell chronic lymphocytic leukemia Diseases 0.000 description 8
- 208000031422 Lymphocytic Chronic B-Cell Leukemia Diseases 0.000 description 8
- 206010025323 Lymphomas Diseases 0.000 description 8
- 208000032852 chronic lymphocytic leukemia Diseases 0.000 description 8
- 230000002949 hemolytic effect Effects 0.000 description 8
- 238000004590 computer program Methods 0.000 description 7
- 239000002736 nonionic surfactant Substances 0.000 description 7
- 210000005259 peripheral blood Anatomy 0.000 description 7
- 239000011886 peripheral blood Substances 0.000 description 7
- 208000009746 Adult T-Cell Leukemia-Lymphoma Diseases 0.000 description 6
- 206010001413 Adult T-cell lymphoma/leukaemia Diseases 0.000 description 6
- IAZDPXIOMUYVGZ-UHFFFAOYSA-N Dimethylsulphoxide Chemical compound CS(C)=O IAZDPXIOMUYVGZ-UHFFFAOYSA-N 0.000 description 6
- LYCAIKOWRPUZTN-UHFFFAOYSA-N Ethylene glycol Chemical compound OCCO LYCAIKOWRPUZTN-UHFFFAOYSA-N 0.000 description 6
- 229920003171 Poly (ethylene oxide) Polymers 0.000 description 6
- 230000002159 abnormal effect Effects 0.000 description 6
- 238000003556 assay Methods 0.000 description 6
- 210000000170 cell membrane Anatomy 0.000 description 6
- 239000003795 chemical substances by application Substances 0.000 description 6
- 239000012530 fluid Substances 0.000 description 6
- 239000002904 solvent Substances 0.000 description 6
- 239000000872 buffer Substances 0.000 description 5
- 239000003093 cationic surfactant Substances 0.000 description 5
- 238000010586 diagram Methods 0.000 description 5
- 239000003960 organic solvent Substances 0.000 description 5
- 239000002245 particle Substances 0.000 description 5
- 125000001436 propyl group Chemical group [H]C([*])([H])C([H])([H])C([H])([H])[H] 0.000 description 5
- 238000010186 staining Methods 0.000 description 5
- 230000005484 gravity Effects 0.000 description 4
- 125000002496 methyl group Chemical group [H]C([H])([H])* 0.000 description 4
- 239000000203 mixture Substances 0.000 description 4
- 238000012545 processing Methods 0.000 description 4
- OKKJLVBELUTLKV-UHFFFAOYSA-N Methanol Chemical compound OC OKKJLVBELUTLKV-UHFFFAOYSA-N 0.000 description 3
- HEMHJVSKTPXQMS-UHFFFAOYSA-M Sodium hydroxide Chemical compound [OH-].[Na+] HEMHJVSKTPXQMS-UHFFFAOYSA-M 0.000 description 3
- 125000003545 alkoxy group Chemical group 0.000 description 3
- 125000000304 alkynyl group Chemical group 0.000 description 3
- 125000001797 benzyl group Chemical group [H]C1=C([H])C([H])=C(C([H])=C1[H])C([H])([H])* 0.000 description 3
- 230000015572 biosynthetic process Effects 0.000 description 3
- 238000004891 communication Methods 0.000 description 3
- 239000003085 diluting agent Substances 0.000 description 3
- 239000000975 dye Substances 0.000 description 3
- 125000001495 ethyl group Chemical group [H]C([H])([H])C([H])([H])* 0.000 description 3
- 239000003219 hemolytic agent Substances 0.000 description 3
- 125000004435 hydrogen atom Chemical group [H]* 0.000 description 3
- 230000000366 juvenile effect Effects 0.000 description 3
- 235000005985 organic acids Nutrition 0.000 description 3
- 239000012466 permeate Substances 0.000 description 3
- 150000003839 salts Chemical class 0.000 description 3
- 239000000243 solution Substances 0.000 description 3
- 239000012128 staining reagent Substances 0.000 description 3
- LFQSCWFLJHTTHZ-UHFFFAOYSA-N Ethanol Chemical compound CCO LFQSCWFLJHTTHZ-UHFFFAOYSA-N 0.000 description 2
- QTANTQQOYSUMLC-UHFFFAOYSA-O Ethidium cation Chemical compound C12=CC(N)=CC=C2C2=CC=C(N)C=C2[N+](CC)=C1C1=CC=CC=C1 QTANTQQOYSUMLC-UHFFFAOYSA-O 0.000 description 2
- 208000031671 Large B-Cell Diffuse Lymphoma Diseases 0.000 description 2
- QIAFMBKCNZACKA-UHFFFAOYSA-N N-benzoylglycine Chemical compound OC(=O)CNC(=O)C1=CC=CC=C1 QIAFMBKCNZACKA-UHFFFAOYSA-N 0.000 description 2
- JUJWROOIHBZHMG-UHFFFAOYSA-N Pyridine Chemical class C1=CC=NC=C1 JUJWROOIHBZHMG-UHFFFAOYSA-N 0.000 description 2
- 150000005215 alkyl ethers Chemical class 0.000 description 2
- 150000001450 anions Chemical class 0.000 description 2
- WPYMKLBDIGXBTP-UHFFFAOYSA-N benzoic acid Chemical compound OC(=O)C1=CC=CC=C1 WPYMKLBDIGXBTP-UHFFFAOYSA-N 0.000 description 2
- 238000004159 blood analysis Methods 0.000 description 2
- 125000002704 decyl group Chemical group [H]C([H])([H])C([H])([H])C([H])([H])C([H])([H])C([H])([H])C([H])([H])C([H])([H])C([H])([H])C([H])([H])C([H])([H])* 0.000 description 2
- 230000001419 dependent effect Effects 0.000 description 2
- 206010012818 diffuse large B-cell lymphoma Diseases 0.000 description 2
- 125000003438 dodecyl group Chemical group [H]C([H])([H])C([H])([H])C([H])([H])C([H])([H])C([H])([H])C([H])([H])C([H])([H])C([H])([H])C([H])([H])C([H])([H])C([H])([H])C([H])([H])* 0.000 description 2
- 238000012757 fluorescence staining Methods 0.000 description 2
- 229910052736 halogen Inorganic materials 0.000 description 2
- 125000005843 halogen group Chemical group 0.000 description 2
- 125000002887 hydroxy group Chemical group [H]O* 0.000 description 2
- 210000001167 myeloblast Anatomy 0.000 description 2
- 125000002347 octyl group Chemical group [H]C([*])([H])C([H])([H])C([H])([H])C([H])([H])C([H])([H])C([H])([H])C([H])([H])C([H])([H])[H] 0.000 description 2
- 125000004430 oxygen atom Chemical group O* 0.000 description 2
- XNGIFLGASWRNHJ-UHFFFAOYSA-N phthalic acid Chemical compound OC(=O)C1=CC=CC=C1C(O)=O XNGIFLGASWRNHJ-UHFFFAOYSA-N 0.000 description 2
- 150000003242 quaternary ammonium salts Chemical class 0.000 description 2
- YGSDEFSMJLZEOE-UHFFFAOYSA-N salicylic acid Chemical compound OC(=O)C1=CC=CC=C1O YGSDEFSMJLZEOE-UHFFFAOYSA-N 0.000 description 2
- 239000004065 semiconductor Substances 0.000 description 2
- 125000001424 substituent group Chemical group 0.000 description 2
- XLYOFNOQVPJJNP-UHFFFAOYSA-N water Substances O XLYOFNOQVPJJNP-UHFFFAOYSA-N 0.000 description 2
- JKMHFZQWWAIEOD-UHFFFAOYSA-N 2-[4-(2-hydroxyethyl)piperazin-1-yl]ethanesulfonic acid Chemical compound OCC[NH+]1CCN(CCS([O-])(=O)=O)CC1 JKMHFZQWWAIEOD-UHFFFAOYSA-N 0.000 description 1
- GZFVOFMKXXTWQE-UHFFFAOYSA-N 3,8-diazido-5-ethyl-6-phenylphenanthridin-5-ium Chemical compound C12=CC(N=[N+]=[N-])=CC=C2C2=CC=C(N=[N+]=[N-])C=C2[N+](CC)=C1C1=CC=CC=C1 GZFVOFMKXXTWQE-UHFFFAOYSA-N 0.000 description 1
- HVBSAKJJOYLTQU-UHFFFAOYSA-N 4-aminobenzenesulfonic acid Chemical compound NC1=CC=C(S(O)(=O)=O)C=C1 HVBSAKJJOYLTQU-UHFFFAOYSA-N 0.000 description 1
- BGWLYQZDNFIFRX-UHFFFAOYSA-N 5-[3-[2-[3-(3,8-diamino-6-phenylphenanthridin-5-ium-5-yl)propylamino]ethylamino]propyl]-6-phenylphenanthridin-5-ium-3,8-diamine;dichloride Chemical compound [Cl-].[Cl-].C=1C(N)=CC=C(C2=CC=C(N)C=C2[N+]=2CCCNCCNCCC[N+]=3C4=CC(N)=CC=C4C4=CC=C(N)C=C4C=3C=3C=CC=CC=3)C=1C=2C1=CC=CC=C1 BGWLYQZDNFIFRX-UHFFFAOYSA-N 0.000 description 1
- 206010000830 Acute leukaemia Diseases 0.000 description 1
- IVRMZWNICZWHMI-UHFFFAOYSA-N Azide Chemical compound [N-]=[N+]=[N-] IVRMZWNICZWHMI-UHFFFAOYSA-N 0.000 description 1
- 239000005711 Benzoic acid Substances 0.000 description 1
- FBPFZTCFMRRESA-FSIIMWSLSA-N D-Glucitol Natural products OC[C@H](O)[C@H](O)[C@@H](O)[C@H](O)CO FBPFZTCFMRRESA-FSIIMWSLSA-N 0.000 description 1
- 206010013700 Drug hypersensitivity Diseases 0.000 description 1
- 239000007995 HEPES buffer Substances 0.000 description 1
- KWYHDKDOAIKMQN-UHFFFAOYSA-N N,N,N',N'-tetramethylethylenediamine Chemical compound CN(C)CCN(C)C KWYHDKDOAIKMQN-UHFFFAOYSA-N 0.000 description 1
- 229910019142 PO4 Inorganic materials 0.000 description 1
- 229930182558 Sterol Natural products 0.000 description 1
- BCTNMRNAMOIDHS-UHFFFAOYSA-N To-Pro-1(2+) Chemical compound S1C2=CC=CC=C2[N+](C)=C1C=C1C2=CC=CC=C2N(CCC[N+](C)(C)C)C=C1 BCTNMRNAMOIDHS-UHFFFAOYSA-N 0.000 description 1
- QHNORJFCVHUPNH-UHFFFAOYSA-L To-Pro-3 Chemical compound [I-].[I-].S1C2=CC=CC=C2[N+](C)=C1C=CC=C1C2=CC=CC=C2N(CCC[N+](C)(C)C)C=C1 QHNORJFCVHUPNH-UHFFFAOYSA-L 0.000 description 1
- 208000036142 Viral infection Diseases 0.000 description 1
- 239000002253 acid Substances 0.000 description 1
- 150000003973 alkyl amines Chemical class 0.000 description 1
- 125000004390 alkyl sulfonyl group Chemical group 0.000 description 1
- 239000007864 aqueous solution Substances 0.000 description 1
- 238000000149 argon plasma sintering Methods 0.000 description 1
- 125000003118 aryl group Chemical group 0.000 description 1
- SRSXLGNVWSONIS-UHFFFAOYSA-N benzenesulfonic acid Chemical compound OS(=O)(=O)C1=CC=CC=C1 SRSXLGNVWSONIS-UHFFFAOYSA-N 0.000 description 1
- 229940092714 benzenesulfonic acid Drugs 0.000 description 1
- 235000010233 benzoic acid Nutrition 0.000 description 1
- 210000003969 blast cell Anatomy 0.000 description 1
- 210000001772 blood platelet Anatomy 0.000 description 1
- 238000004364 calculation method Methods 0.000 description 1
- 229910052799 carbon Inorganic materials 0.000 description 1
- 239000004359 castor oil Substances 0.000 description 1
- 235000019438 castor oil Nutrition 0.000 description 1
- 150000001860 citric acid derivatives Chemical class 0.000 description 1
- 150000001875 compounds Chemical class 0.000 description 1
- 230000007423 decrease Effects 0.000 description 1
- 235000014113 dietary fatty acids Nutrition 0.000 description 1
- 238000004141 dimensional analysis Methods 0.000 description 1
- ROSDSFDQCJNGOL-UHFFFAOYSA-O dimethylaminium Chemical compound C[NH2+]C ROSDSFDQCJNGOL-UHFFFAOYSA-O 0.000 description 1
- 201000005311 drug allergy Diseases 0.000 description 1
- 230000000694 effects Effects 0.000 description 1
- 238000005516 engineering process Methods 0.000 description 1
- 125000004185 ester group Chemical group 0.000 description 1
- 125000001033 ether group Chemical group 0.000 description 1
- ZMMJGEGLRURXTF-UHFFFAOYSA-N ethidium bromide Chemical compound [Br-].C12=CC(N)=CC=C2C2=CC=C(N)C=C2[N+](CC)=C1C1=CC=CC=C1 ZMMJGEGLRURXTF-UHFFFAOYSA-N 0.000 description 1
- 229960005542 ethidium bromide Drugs 0.000 description 1
- 125000001301 ethoxy group Chemical group [H]C([H])([H])C([H])([H])O* 0.000 description 1
- 229930195729 fatty acid Natural products 0.000 description 1
- 239000000194 fatty acid Substances 0.000 description 1
- 238000000684 flow cytometry Methods 0.000 description 1
- ZEMPKEQAKRGZGQ-XOQCFJPHSA-N glycerol triricinoleate Natural products CCCCCC[C@@H](O)CC=CCCCCCCCC(=O)OC[C@@H](COC(=O)CCCCCCCC=CC[C@@H](O)CCCCCC)OC(=O)CCCCCCCC=CC[C@H](O)CCCCCC ZEMPKEQAKRGZGQ-XOQCFJPHSA-N 0.000 description 1
- 239000008187 granular material Substances 0.000 description 1
- 150000002367 halogens Chemical class 0.000 description 1
- 239000000833 heterodimer Substances 0.000 description 1
- 230000001678 irradiating effect Effects 0.000 description 1
- 238000009533 lab test Methods 0.000 description 1
- 239000000463 material Substances 0.000 description 1
- 125000000956 methoxy group Chemical group [H]C([H])([H])O* 0.000 description 1
- 125000000325 methylidene group Chemical group [H]C([H])=* 0.000 description 1
- 238000012986 modification Methods 0.000 description 1
- 230000004048 modification Effects 0.000 description 1
- 229910052757 nitrogen Inorganic materials 0.000 description 1
- 230000003204 osmotic effect Effects 0.000 description 1
- FJKROLUGYXJWQN-UHFFFAOYSA-N papa-hydroxy-benzoic acid Natural products OC(=O)C1=CC=C(O)C=C1 FJKROLUGYXJWQN-UHFFFAOYSA-N 0.000 description 1
- 125000001997 phenyl group Chemical group [H]C1=C([H])C([H])=C(*)C([H])=C1[H] 0.000 description 1
- 235000021317 phosphate Nutrition 0.000 description 1
- 150000003013 phosphoric acid derivatives Chemical class 0.000 description 1
- 229920002503 polyoxyethylene-polyoxypropylene Polymers 0.000 description 1
- XJMOSONTPMZWPB-UHFFFAOYSA-M propidium iodide Chemical compound [I-].[I-].C12=CC(N)=CC=C2C2=CC=C(N)C=C2[N+](CCC[N+](C)(CC)CC)=C1C1=CC=CC=C1 XJMOSONTPMZWPB-UHFFFAOYSA-M 0.000 description 1
- 229960004889 salicylic acid Drugs 0.000 description 1
- 239000000600 sorbitol Substances 0.000 description 1
- 238000001228 spectrum Methods 0.000 description 1
- 150000003432 sterols Chemical class 0.000 description 1
- 235000003702 sterols Nutrition 0.000 description 1
- 238000003756 stirring Methods 0.000 description 1
- 239000000126 substance Substances 0.000 description 1
- 229950000244 sulfanilic acid Drugs 0.000 description 1
- 229910052717 sulfur Inorganic materials 0.000 description 1
- 125000004434 sulfur atom Chemical group 0.000 description 1
- 238000012360 testing method Methods 0.000 description 1
- 230000009385 viral infection Effects 0.000 description 1
Images


Classifications
-
- G—PHYSICS
- G01—MEASURING; TESTING
- G01N—INVESTIGATING OR ANALYSING MATERIALS BY DETERMINING THEIR CHEMICAL OR PHYSICAL PROPERTIES
- G01N33/00—Investigating or analysing materials by specific methods not covered by groups G01N1/00 - G01N31/00
- G01N33/48—Biological material, e.g. blood, urine; Haemocytometers
- G01N33/50—Chemical analysis of biological material, e.g. blood, urine; Testing involving biospecific ligand binding methods; Immunological testing
- G01N33/5005—Chemical analysis of biological material, e.g. blood, urine; Testing involving biospecific ligand binding methods; Immunological testing involving human or animal cells
- G01N33/5094—Chemical analysis of biological material, e.g. blood, urine; Testing involving biospecific ligand binding methods; Immunological testing involving human or animal cells for blood cell populations
-
- G—PHYSICS
- G01—MEASURING; TESTING
- G01N—INVESTIGATING OR ANALYSING MATERIALS BY DETERMINING THEIR CHEMICAL OR PHYSICAL PROPERTIES
- G01N15/00—Investigating characteristics of particles; Investigating permeability, pore-volume, or surface-area of porous materials
- G01N15/10—Investigating individual particles
- G01N15/14—Electro-optical investigation, e.g. flow cytometers
- G01N15/1456—Electro-optical investigation, e.g. flow cytometers without spatial resolution of the texture or inner structure of the particle, e.g. processing of pulse signals
- G01N15/1459—Electro-optical investigation, e.g. flow cytometers without spatial resolution of the texture or inner structure of the particle, e.g. processing of pulse signals the analysis being performed on a sample stream
-
- G01N2015/016—
-
- G—PHYSICS
- G01—MEASURING; TESTING
- G01N—INVESTIGATING OR ANALYSING MATERIALS BY DETERMINING THEIR CHEMICAL OR PHYSICAL PROPERTIES
- G01N15/00—Investigating characteristics of particles; Investigating permeability, pore-volume, or surface-area of porous materials
- G01N15/10—Investigating individual particles
- G01N2015/1006—Investigating individual particles for cytology
-
- G—PHYSICS
- G01—MEASURING; TESTING
- G01N—INVESTIGATING OR ANALYSING MATERIALS BY DETERMINING THEIR CHEMICAL OR PHYSICAL PROPERTIES
- G01N15/00—Investigating characteristics of particles; Investigating permeability, pore-volume, or surface-area of porous materials
- G01N15/10—Investigating individual particles
- G01N15/14—Electro-optical investigation, e.g. flow cytometers
- G01N2015/1402—Data analysis by thresholding or gating operations performed on the acquired signals or stored data
-
- G—PHYSICS
- G01—MEASURING; TESTING
- G01N—INVESTIGATING OR ANALYSING MATERIALS BY DETERMINING THEIR CHEMICAL OR PHYSICAL PROPERTIES
- G01N15/00—Investigating characteristics of particles; Investigating permeability, pore-volume, or surface-area of porous materials
- G01N15/10—Investigating individual particles
- G01N15/14—Electro-optical investigation, e.g. flow cytometers
- G01N2015/1477—Multiparameters
Definitions
- the present invention relates to a method for analyzing blood cells and a blood cell analyzer for each classifying and counting white blood cells in a sample.
- normal white blood cells are classified into five types: lymphocyte, monocyte, basophil, eosinophil, and neutrophil. In normal peripheral blood, these types of blood cells exist at certain ratios. However, if a subject has a disease, there may be cases where the number of blood cells of a specific type increases or decreases. Therefore, in the field of clinical laboratory tests, information highly useful for disease diagnosis can be obtained by classifying and counting white blood cells.
- peripheral blood of a patient having a disease cells that do not exist in normal peripheral blood appear.
- diseases such as chronic lymphocytic leukemia, malignant lymphoma, and the like
- neoplastic mature lymphocytes appear in peripheral blood.
- blast cells myeloblasts, lymphoblasts
- anti-atypical lymphocytes which are lymphocytes activated by being primed appear in peripheral blood. Therefore, in order to accurately classify white blood cells, it is necessary to detect these abnormal cells separately from other normal white blood cells.
- Japanese Laid-Open Patent Publication No. 2006/91024 describes: preparing a measurement specimen by mixing a blood specimen with a hemolytic agent and a dye compound; measuring scattered light and fluorescence occurring from each blood cell in the measurement specimen by use of a flow cytometer; classifying white blood cells into five groups based on measurement data; and detecting abnormal cells such as atypical lymphocytes, myeloblasts, and the like separately from normal white blood cells based on the measurement data.
- WO 2012/147451 A1 relates to a blood analyzer for detecting an abnormal lymphocyte.
- an assay sample is prepared in a sample preparation part by mixing a first reagent containing a hemolytic agent and a second reagent containing a fluorescent dye for staining nucleic acid with a blood specimen.
- the hemolytic agent is substantially free from a cationic surfactant and contains a nonionic surfactant.
- the assay sample is assayed in a detection part and the assay data output from the detection part is processed by an information processing unit.
- the information processing unit outputs the analysis results on the basis of the detection results.
- EP 2 520 926 A1 relates to a blood analyzer for detecting abnormal lymphocytes, blasts, and atypical lymphocytes.
- a blood analyzer prepares a first measurement sample from a first reagent containing a hemolyzing agent, a second reagent containing a fluorescence staining dye, and the blood specimen, and prepares a second measurement sample from a third reagent containing a hemolyzing agent, a fourth reagent containing a fluorescence staining dye, and the blood specimen.
- the blood analyzer measures each of the measurement samples, and determines the presence or absence of abnormal lymphocytes, blasts, and atypical lymphocytes in a blood specimen based on the measurement data.
- EP 2 237 019 A2 relates to a blood analyzer comprising a blood sample supply section, a sample preparation section for preparing an assay sample by mixing the blood sample with a nucleic acid-staining fluorescent dye, a light source for irradiating the assay sample, an optical detecting section for receiving fluorescence emitted from the irradiated assay sample and a controller for performing operations comprising detecting a cell group comprising lymphoblasts on the basis of the fluorescence received by the optical detecting section (23), and outputting an information on an appearance of the lymphoblasts in the blood sample.
- US 5 496 734 A relates to a method for blood analysis which provides a treatment of a blood sample so that it can be analysed for counting and classification of leukocytes.
- Leukocytes are permeablized by treatment with a surfactant solution and labeled, preferably with a fluorescent dye.
- the method provides labeled leukocytes that can be counted and classified by optical means, including flow cytometry by analysis of a fluorescence signal.
- US2011/0027788 A1 describes a method for blood analysis where clustering of blood cells is done in 3D.
- Japanese Laid-Open Patent Publication No. 2006/91024 cannot detect neoplastic mature lymphocytes as abnormal cells. Therefore, it is desired to improve accuracy of classifying white blood cells by detecting neoplastic mature lymphocytes.
- an object of the present invention is to provide a method for analyzing blood cells, a blood cell analyzer, and a program which each allow easy detection of neoplastic lymphocytes and improvement of accuracy of classifying and counting normal white blood cells.
- a first aspect refers to a method for analyzing blood cells.
- the method for analyzing blood cells includes: preparing a measurement specimen for classifying white blood cells, by mixing a sample with a reagent in order to hemolyze red blood cells contained in the sample and to fluorescently stain nucleic acid in white blood cells contained in the sample; detecting, by flowing the measurement specimen in a flow cell, fluorescence emitted from each blood cell in the measurement specimen and two types of scattered light at respective different angles, and obtaining a fluorescence signal and two types of scattered light signals; and classifying the white blood cells into at least four groups and detecting neoplastic lymphocytes, by performing analysis using at least three types of parameters based on the fluorescence signal and the two types of scattered light signals.
- neoplastic lymphocytes are detected, separately from non-neoplastic other blood cells. Therefore, accuracy of classifying normal white blood cells can be increased, and diagnosis of disease based on the classification can be performed more appropriately. Further, since neoplastic lymphocytes are detected, separately from other blood cells, information useful for diagnosis of diseases such as chronic lymphocytic leukemia, malignant lymphoma, and the like can be provided to the user.
- the two types of scattered light may include first scattered light and second scattered light; and the classifying may include: first classification of classifying the white blood cells through analysis using parameters regarding the fluorescence and the first scattered light; and second classification of classifying the white blood cells and detecting the neoplastic lymphocytes through analysis using parameters regarding the fluorescence, the first scattered light, and the second scattered light.
- the method for analyzing blood cells according to the present aspect can be adjusted such that the second classification is performed. Accordingly, when the result of the first classification does not satisfy the predetermined condition, only the first classification is performed and analysis using two parameters is performed. Thus, burden of processing for classifying white blood cells can be reduced.
- the method for analyzing blood cells according to the present aspect may further include displaying a result of the classifying on a display unit.
- the displaying may include displaying, on the display unit, a white blood cell distribution chart in two or more dimension, as the result of the classifying. Accordingly, by referring to the white blood cell distribution chart, the user can easily understand the distribution state of each classified blood cell, and thus, information useful for diagnosis can be smoothly obtained.
- the displaying may display, on the display unit, a first white blood cell distribution chart based on a combination of two types of parameters selected from the three types of parameters, and a second white blood cell distribution chart based on a combination of two types of parameters different from the aforesaid combination, as the result of the classifying. Accordingly, in the two types of two-dimensional distribution charts, the distribution state of white blood cells can be displayed in such a manner as to be easily understood.
- the first white blood cell distribution chart may be based on at least a parameter regarding the fluorescence
- the second white blood cell distribution chart may be based on at least parameters regarding the two types of scattered light. Accordingly, in the first white blood cell distribution chart, distribution of blood cells whose nucleic acid is very active (such as juvenile blood cells and the like) and which can be detected by use of fluorescence can be displayed. In the second white blood cell distribution chart, distribution of blood cells in which neoplastic lymphocytes are isolated from other blood cells can be displayed.
- the white blood cell distribution chart it is preferable that distribution of the white blood cells is shown in colors which are different in accordance with classifications of the white blood cells. Accordingly, distribution of each blood cell can be more easily understood.
- neoplastic lymphocytes in the white blood cell distribution chart, it is further preferable that distribution of the neoplastic lymphocytes is shown in a color identical to a color for normal lymphocytes. Accordingly, distribution of lymphocytes including neoplastic lymphocytes can be easily understood.
- the white blood cell distribution chart it is further preferable that distribution of the neoplastic lymphocytes is shown in a color different from colors for other blood cells. Accordingly, distribution of neoplastic lymphocytes is more easily understood, and diagnosis of diseases such as chronic lymphocytic leukemia, malignant lymphoma, and the like are more easily performed.
- the classifying may include counting the number of blood cells included in each classification, and the displaying may be adjusted to display, on the display unit, information regarding the counted number of blood cells included in each classification. Accordingly, the user can quantitatively understand how much blood cells are included in each classification.
- the classifying may include counting the number of the neoplastic lymphocytes, and the displaying may be adjusted to display, on the display unit, information regarding a result of the counting of the number of the neoplastic lymphocytes. Accordingly, the user can quantitatively understand how much neoplastic lymphocytes are contained in the measurement specimen.
- the displaying may be adjusted to display, on the display unit, information indicating that the sample has a possibility of including the neoplastic lymphocytes, in accordance with the result of the counting of the number of the neoplastic lymphocytes. Accordingly, the user can further easily confirm the possibility of disease based on neoplastic lymphocytes.
- a second aspect of the present invention relates to a method for analyzing blood cells.
- the method for analyzing blood cells includes: preparing a measurement specimen by mixing a sample with a reagent; detecting, by flowing the measurement specimen in a flow cell, fluorescence emitted from each blood cell in the measurement specimen and two types of scattered light at respective different angles, and obtaining a fluorescence signal and two types of scattered light signals; detecting neoplastic lymphocytes, by performing analysis using at least three types of parameters based on the fluorescence signal and the two types of scattered light signals; and displaying information regarding the detected neoplastic lymphocytes on a display unit.
- neoplastic lymphocytes are detected and information regarding the detected neoplastic lymphocytes is displayed on the display unit. Therefore, information useful for diagnosis of diseases such as chronic lymphocytic leukemia, malignant lymphoma, and the like can be provided to the user.
- a third aspect of the present invention relates to a blood cell analyzer.
- the blood cell analyzer includes: a specimen preparation section configured to prepare a measurement specimen for classifying white blood cells, by mixing a sample with a reagent in order to hemolyze red blood cells contained in the sample and to fluorescently stain nucleic acid in white blood cells contained in the sample; a detection section configured to detect fluorescence emitted from each blood cell in the measurement specimen and two types of scattered light at respective different angles, and configured to output a fluorescence signal and two types of scattered light signals; and an information processing unit configured to classify the white blood cells into at least four groups and configured to detect neoplastic lymphocytes, by performing analysis using at least three types of parameters regarding the fluorescence and the two types of scattered light based on the fluorescence signal and the two types of scattered light signals.
- neoplastic lymphocytes are detected, separately from non-neoplastic other blood cells. Therefore, accuracy of classifying normal white blood cells can be increased, and diagnosis of disease based on the classification can be performed more appropriately. Further, since neoplastic lymphocytes are detected, separately from other blood cells, information useful for diagnosis of diseases such as chronic lymphocytic leukemia, malignant lymphoma, and the like can be provided to the user.
- a method for analyzing blood cells and a blood cell analyzer that each allow easy detection of neoplastic lymphocytes and improvement of accuracy of classifying and counting normal white blood cells can be provided.
- the present embodiment is obtained by applying the present invention to a blood cell analyzer for performing tests and analysis regarding blood.
- a blood cell analyzer according to the present embodiment will be described with reference to the drawings.
- FIG. 1 is a perspective view showing an external view of a blood cell analyzer 1 according to the present embodiment.
- the blood cell analyzer 1 is a multi-item blood cell analyzer which detects white blood cells, red blood cells, platelets, and the like contained in a blood sample and which counts each type of blood cells.
- the blood cell analyzer 1 includes a measurement unit 2, a transporting unit 3 arranged to the front face side of the measurement unit 2, and an information processing unit 4.
- a blood sample being peripheral blood collected from a patient is contained in a sample container (blood collecting tube) T.
- a plurality of sample containers T are held in a sample rack L, and the sample rack L is transported by the transporting unit 3, whereby blood samples are supplied to the measurement unit 2.
- the information processing unit 4 includes a display unit 41 and an input unit 42 and is communicably connected to the measurement unit 2, the transporting unit 3, and a host computer 5 (see FIG. 2 ).
- the information processing unit 4 controls operation of the measurement unit 2 and the transporting unit 3, performs analysis based on a result of measurement performed by the measurement unit 2, and transmits an analysis result to the host computer 5 (see FIG. 2 ).
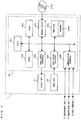
- FIG. 2 is a schematic diagram showing a configuration of the measurement unit 2.
- the measurement unit 2 includes a hand part 21, a sample container setting part 22, a bar code unit 23, a sample aspirator 24, a specimen preparation section 25, and a detection section 26.
- the sample aspirator 24 includes a piercer 24a and aspirates a sample from a sample container T.
- the specimen preparation section 25 includes a mixing chamber MC and a heater H, and prepares a measurement specimen to be used in measurement, by mixing the sample with a reagent.
- the detection section 26 includes an optical detector D, and detects blood cells from the measurement specimen. Each component of the measurement unit 2 is controlled by the information processing unit 4.
- a sample container T located at a position P1 by the transporting unit 3 is gripped by the hand part 21, and upwardly pulled out of the sample rack L. Then, by the hand part 21 being swung, the sample in the sample container T is stirred. The sample container T for which stirring has been completed is set, by the hand part 21, to the sample container setting part 22 located at the position P1. Then, the sample container T is transported to a position P2 by the sample container setting part 22.
- the bar code unit 23 provided at the vicinity of the position P2 reads a sample number from a bar code label attached to the sample container T. Then, the sample container T is transported to a position P3 by the sample container setting part 22. When the sample container T is located at the position P3, a predetermined amount of the sample is aspirated from the sample container T by the sample aspirator 24 via the piercer 24a. After the aspiration of the sample has been completed, the sample container T is transported forward by the sample container setting part 22, and returned to the original holding position in the sample rack L by the hand part 21. After the piercer 24a has been transferred to a position corresponding to the mixing chamber MC, the sample aspirated via the piercer 24a is discharged by a predetermined amount into the mixing chamber MC by the sample aspirator 24.
- the specimen preparation section 25 is connected, via tubes, to a reagent container 251 containing a first reagent, a reagent container 252 containing a second reagent, and a reagent container 253 containing a sheath fluid (diluent). Further, the specimen preparation section 25 is connected to a compressor (not shown), and can receive an aliquot of each of the reagents from the reagent containers 251 to 253, by use of a pressure generated by this compressor. The specimen preparation section 25 mixes the blood sample, the first reagent, and the second reagent together in the mixing chamber MC, and heats the mixture solution for a predetermined time period by means of the heater H, to prepare a measurement specimen. The measurement specimen prepared by the specimen preparation section 25 is supplied to the optical detector D of the detection section 26.
- the detection section 26 is connected, via a tube, to the reagent container 253 containing the sheath fluid (diluent). Further, the detection section 26 is connected to a compressor (not shown) and can receive an aliquot of the sheath fluid (diluent) from the reagent container 253 by use of a pressure generated by this compressor.
- FIG. 3 is a schematic diagram showing a configuration of the optical detector D.
- the optical detector D includes a flow cell D1, a sheath flow system D2, a beam spot formation system D3, a forward scattered light receiving system D4, a side scattered light receiving system D5, and a fluorescence receiving system D6.
- the sheath flow system D2 is configured to send, into the flow cell D1, a measurement specimen surrounded in a sheath fluid, and to generate a fluid flow in the flow cell D1.
- the beam spot formation system D3 is configured such that light emitted from a semiconductor laser D31 advances through a collimator lens D32 and a condenser lens D33 to irradiate the flow cell D1. Accordingly, each blood cell contained in the fluid flow passing through the flow cell D1 is irradiated with a laser beam. Further, the beam spot formation system D3 includes a beam stopper D34.
- the forward scattered light receiving system D4 is configured to condense scattered light advancing forward (forward scattered light) with a forward condenser lens D41, and to receive light that has passed through a pinhole D42 with a photodiode D43.
- the photodiode D43 outputs a forward scattered light signal (FSC) based on a peak value of the received forward scattered light.
- the side scattered light receiving system D5 is configured to condense scattered light advancing sideways (side scattered light) with a side condenser lens D51, and to cause a part of the side scattered light to be reflected at a dichroic mirror D52 to be received by a photodiode D53.
- the photodiode D53 outputs a side scattered light signal (SSC) based on a peak value of the received side scattered light.
- Light scattering is a phenomenon that occurs when the advancing direction of light is changed due to the presence of a particle such as a blood cell as an obstacle in the advancing direction of the light.
- information regarding the size and the material of the particle can be obtained.
- information regarding the size of a particle blood cell
- information regarding the inside of a particle can be obtained.
- the intensity of side scattered light is dependent on the complexity (the shape, size, and density of the nucleus and the amount of granules) inside the cell.
- the fluorescence receiving system D6 is configured to allow light (fluorescence), of the side scattered light, that has transmitted through the dichroic mirror D52, to further pass through a spectrum filter D61 to be received by an avalanche photodiode D62.
- the avalanche photodiode D62 outputs a fluorescence signal (SFL) based on a peak value of the received fluorescence.
- the blood cell When a blood cell stained by a fluorescent substance is irradiated with light, the blood cell emits fluorescence having a wavelength longer than the wavelength of the light that irradiated the blood cell.
- the intensity of fluorescence increases if the blood cell is well stained, and by measuring this fluorescence intensity, information regarding the stained degree of the blood cell can be obtained.
- the forward scattered light signal, the side scattered light signal, and the fluorescence signal, which have been obtained by the optical detector D, are transmitted to the information processing unit 4.
- the information processing unit 4 performs analysis based on these received signals.
- white blood cells present in the blood sample are classified into four subclasses (lymphocyte (LYMPH), monocyte (MONO), blood cell group including neutrophil (NEUT) and basophil (BASO), and eosinophil (EO)).
- the blood cell analyzer 1 mixes a blood sample with a predetermined reagent to prepare a measurement specimen for counting the number of white blood cells and individually detecting basophils. By measuring the measurement specimen using the optical detector D, the number of white blood cells can be obtained and classification of neutrophils and basophils can be performed.
- FIG. 4 shows a configuration of the information processing unit 4.
- the information processing unit 4 is implemented by a personal computer, and includes a body 40, the display unit 41, and the input unit 42.
- the body 40 includes a CPU 401, a ROM 402, a RAM 403, a hard disk 404, a readout device 405, an image output interface 406, an input/output interface 407, and a communication interface 408.
- the CPU 401 executes computer programs stored in the ROM 402 and computer programs loaded onto the RAM 403.
- the RAM 403 is used for reading out computer programs stored in the ROM 402 and the hard disk 404. Further, the RAM 403 is also used as a work area for the CPU 401 when the CPU 401 executes these computer programs.
- the hard disk 404 has stored therein an operating system, computer programs to be executed by the CPU 401, and data used for execution of such computer programs. Further, the hard disk 404 has stored therein a program 404a to be executed by the CPU 401 for performing processes for the information processing unit 4 shown in FIG. 6A .
- the readout device 405 is implemented by a CD drive, a DVD drive, or the like, and can read out computer programs and data stored in a storage medium 405a. In a case where the program 404a is stored in the storage medium 405a, the program 404a read out from the storage medium 405a by the readout device 405 is stored in the hard disk 404.
- the image output interface 406 outputs an image signal corresponding to image data to the display unit 41, and the display unit 41 displays an image based on the image signal outputted from the image output interface 406.
- a user inputs an instruction via the input unit 42, and the input/output interface 407 receives a signal inputted via the input unit 42.
- the communication interface 408 is connected to the measurement unit 2, the transporting unit 3, and the host computer 5, and the CPU 401 transmits/receives instruction signals and data to/from these apparatuses via the communication interface 408.
- a blood sample and reagents are mixed together, whereby a measurement specimen is prepared. Specifically, the following first reagent and second reagent are mixed with a blood sample to prepare a measurement specimen.
- the first reagent contains a fluorescent dye capable of staining nucleic acid and is a reagent for fluorescently staining nucleic acid in each nucleated cell contained in the blood specimen processed by the second reagent described later.
- the fluorescent dye is not limited to a particular one as long as it can stain nucleic acid, and can be selected as appropriate in accordance with the wavelength of light emitted from a light source (the semiconductor laser D31).
- a fluorescent dye include propidium iodide, ethidium bromide, ethidium-acridine heterodimer, ethidium diazide, ethidium homodimer-1, ethidium homodimer-2, ethidium monoazide, trimethylenebis[[3-[[4-[[(3-methylbenzothiazole-3-ium)-2-yl]methylene]-1,4-dihydroquinoline]-1-yl]propyl]dimethylaminium] ⁇ tetraiodide (TOTO-1), 4-[(3-methylbenzothiazole-2(3H)-ylidene)methyl]-1-[3-(trimethylaminio)propyl]quinolinium ⁇ diiodide (TO
- R 1 and R 4 are the same with each other or different from each other, and each are a hydrogen atom, an alkyl group, an alkyl chain having a hydroxy group, an alkyl chain having an ether group, an alkyl chain having an ester group, or a benzyl group that may have a substituent.
- R 2 and R 3 are the same with each other or different from each other, and each are a hydrogen atom, a hydroxyl group, a halogen, an alkyl group, an alkenyl group, an alkynyl group, an alkoxy group, an alkyl sulfonyl group, or a phenyl group.
- Z is a sulfur atom, an oxygen atom, or a carbon atom having a methyl group
- n is 0, 1, 2, or 3
- X - is an anion.
- an alkyl group may be either linear or branched.
- the other in a case where either one of R 1 and R 4 is an alkyl group having 6 to 18 carbon atoms, the other is preferably is an hydrogen atom or an alkyl group having fewer than 6 carbon atoms.
- alkyl groups having 6 to 18 carbon atoms an alkyl group having 6, 8, or 10 carbon atoms is preferable.
- examples of the substituent of the benzyl group represented by R 1 and R 4 in formula (I) above include alkyl groups having 1 to 20 carbon atoms, alkenyl groups having 2 to 20 carbon atoms, and alkynyl groups having 2 to 20 carbon atoms. Among these, a methyl group or an ethyl group is particularly preferable.
- examples of the alkenyl group represented by R 2 and R 3 in formula (I) above include alkenyl groups having 2 to 20 carbon atoms.
- examples of the alkoxy group represented by R 2 and R 3 include alkoxy groups having 1 to 20 carbon atoms. Among these, a methoxy group or an ethoxy group is particularly preferable.
- anion X - in formula (I) above examples include halogen ions such as F - , Cl - , Br - , and I - , and CF 3 SO 3 - , BF 4 - and the like.
- the fluorescent dye in the first reagent may include one, or two or more types of fluorescent dyes.
- the concentration of the fluorescent dye in the first reagent may be set as appropriate in accordance with the type of the fluorescent dye, and is normally 0.01 to 100 pg/ ⁇ L, and preferably 0.1 to 10 pg/ ⁇ L.
- the concentration of the fluorescent dye in the first reagent is preferably 0.2 to 0.6 pg/ ⁇ L, and more preferably 0.3 to 0.5 pg/ ⁇ L.
- the first reagent can be obtained by dissolving the fluorescent dye described above in an appropriate solvent at the concentration described above.
- the solvent is not limited to a particular one as long as it can dissolve the fluorescent dye described above.
- the solvent include water, an organic solvent, and a mixture of these.
- the organic solvent include alcohol, ethylene glycol, dimethyl sulfoxide (DMSO), and the like.
- a commercially-available staining reagent for classifying white blood cells may be used as the first reagent.
- a staining reagent include Stromatolyser (registered trademark)-4DS manufactured by Sysmex Corporation. Stromatolyser-4DS is a staining reagent containing a fluorescent dye represented by formula (I) above.
- the second reagent contains a surfactant, i.e., a cationic surfactant and/or a nonionic surfactant, for hemolyzing red blood cells and for damaging cell membranes of white blood cells to an extent that the fluorescent dye in the first reagent can permeate therethrough. Further, the second reagent contains an aromatic organic acid at a concentration not lower than 20 mM and not higher than 50 mM.
- a surfactant i.e., a cationic surfactant and/or a nonionic surfactant
- pH of the second reagent in a case where the concentration of the aromatic organic acid is not lower than 20 mM and lower than 30 mM, pH of the second reagent is not lower than 5.5 and not higher than 6.4, and in a case where the concentration of the aromatic organic acid is not lower than 30 mM and not higher than 50 mM, pH of the second reagent is not lower than 5.5 and not higher than 7.0.
- pH of the second reagent is preferably not lower than 5.5 and not higher than 6.4, and more preferably, not lower than 5.5 and not higher than 6.2.
- pH of the second reagent is not lower than 5.5 and not higher than 7.0. More preferably, in a case where the concentration of the aromatic organic acid in the second reagent is not lower than 40 mM and not higher than 50 mM, pH of the second reagent is not lower than 5.5 and not higher than 6.2.
- the aromatic organic acid means an acid having at least one aromatic ring in the molecule or a salt thereof.
- the aromatic organic acid include aromatic carboxylic acids, aromatic sulfonic acids, and the like.
- phthalic acid, benzoic acid, salicylic acid, hippuric acid, p-aminobenzenesulfonic acid, benzenesulfonic acid, and salts thereof are preferably used.
- the aromatic organic acid in the second reagent may include one, or two or more types of aromatic organic acids. In a case where two or more types of aromatic organic acids are included in the second reagent, it is sufficient that the total of concentrations of these is not lower than 20 mM and not higher than 50 mM.
- a quaternary ammonium salt type surfactant or a pyridinium salt type surfactant can be used.
- quaternary ammonium salt type surfactant examples include surfactants having 9 to 30 carbon atoms in total, represented by formula (II) below.
- R 1 is an alkyl or alkenyl group having 6 to 18 carbon atoms.
- R 2 and R 3 are the same with each other or different from each other, and each are an alkyl or alkenyl group having 1 to 4 carbon atoms.
- R 4 is an alkyl or alkenyl group having 1 to 4 carbon atoms, or a benzyl group, and
- X - is a halogen atom.
- R 1 is preferably an alkyl or alkenyl group having 6, 8, 10, 12, or 14 carbon atoms, and in particular, a linear alkyl group is preferable. More specific examples of R 1 include an octyl group, a decyl group, and a dodecyl group.
- R 2 and R 3 each are preferably a methyl group, an ethyl group, or a propyl group.
- R 4 is preferably a methyl group, an ethyl group, or a propyl group.
- pyridinium salt type surfactant examples include surfactants represented by formula (III) below.
- R 1 is an alkyl or alkenyl group having 6 to 18 carbon atoms
- X - is a halogen atom
- R 1 is preferably an alkyl or alkenyl group having 6, 8, 10, 12, or 14 carbon atoms, and in particular, a linear alkyl group is preferable. More specific examples of R 1 include an octyl group, a decyl group and a dodecyl group.
- the concentration of the cationic surfactant in the second reagent can be adjusted as appropriate in accordance with the type of the surfactant, and is normally 10 to 10000 ppm, and preferably 100 to 1000 ppm.
- nonionic surfactant a polyoxyethylene-based nonionic surfactant represented by formula (VI) below is preferable.
- R 1 is an alkyl, alkenyl, or alkynyl group having 8 to 25 carbon atoms
- R 2 is an oxygen atom, -COO-, or
- n is an integer of 10 to 50.
- nonionic surfactant examples include polyoxyethylene alkyl ether, polyoxyethylene sterol, polyoxyethylene castor oil, polyoxyethylene sorbitol fatty acid ester, polyoxyethylene alkyl amine, polyoxyethylene polyoxypropylene alkyl ether, and the like.
- the concentration of the nonionic surfactant in the second reagent is normally 10 to 100000 ppm, preferably 100 to 10000 ppm, and more preferably 1000 to 5000 ppm.
- the second reagent may include a buffer agent in order to maintain constant pH.
- a buffer agent examples include citrates, HEPES, phosphates, and the like.
- the aromatic organic acids described above may exhibit buffer action. In a case where such an aromatic organic acid is used, addition of a buffer agent to the second reagent is optional.
- the osmotic pressure of the second reagent is not limited to a particular one, but is preferably 20 to 150 mOsm/kg from the view point of efficiently hemolyzing red blood cells.
- the second reagent can be obtained by dissolving the surfactant and the aromatic organic acid or a salt thereof described above, optionally with the buffer agent described above, in an appropriate solvent at the concentration of the aromatic organic acid described above, and by adjusting pH using NaOH, HCl, or the like.
- the solvent is not limited to a particular one as long as it can dissolve the above components, and examples of the solvent include water, an organic solvent and a mixture thereof. Examples of the organic solvent include alcohol, methanol, ethylene glycol, DMSO, and the like.
- a commercially available hemolyzing reagent for classifying white blood cells may be used.
- a hemolyzing reagent include Stromatolyser-4DL manufactured by Sysmex Corporation. Stromatolyser-4DL is a hemolyzing reagent containing the cationic surfactant and the nonionic surfactant described above.
- the optical detector D can perform detection of the four subclasses of white blood cell.
- a first scattergram as shown in FIG. 5A is created first. Specifically, based on a side scattered light signal and a fluorescence signal regarding each individual blood cell, the first scattergram is created by plotting a dot corresponding to each individual blood cell onto a two-dimensional distribution chart whose horizontal axis represents side scattered light signal and whose vertical axis represents fluorescence signal.
- a two-dimensional distribution chart including fluorescence signal as an axis is conventionally used in order to detect blood cells (such as juvenile blood cells and the like) whose nucleic acid is very active.
- dots corresponding to red blood cell ghosts being hemolyzed red blood cells and the like are excluded. Specifically, dots included in a predetermined region AG1 set in advance as shown in the schematic diagram in FIG. 5B are excluded. Subsequently, each dot on the first scattergram from which blood cells in the region AG1 have been excluded is classified into any of four clusters respectively corresponding to the four subclasses of white blood cell (a cluster A11 of lymphocytes, a cluster A12 of monocytes, a cluster A13 of the blood cell group including neutrophils and basophils, and a cluster A14 of eosinophils).
- a blood sample collected from a patient includes neoplastic lymphocytes.
- a blood sample obtained from this patient may include neoplastic lymphocytes.
- FIG. 5C shows a first scattergram created based on a blood sample collected from a patient having adult T-cell leukemia-lymphoma (ATLL). Also in this case as in the case of a normal sample described above, each blood cell is classified to any of the four subclasses of white blood cell.
- the blood sample of the patient having adult T-cell leukemia-lymphoma (ATLL) may include neoplastic lymphocytes.
- dots corresponding to neoplastic lymphocytes appear in the region shown by a dashed line in FIG. 5B , and are included in the cluster A11 or the cluster A12 as dots corresponding to normal lymphocytes or monocytes.
- neoplastic lymphocytes alone cannot be separately detected.
- neither normal lymphocytes alone can be separated, nor monocytes alone can be separated.
- the inventors of the present application conceived an idea of not plotting dots corresponding to blood cells in two-dimensional space defined by axes of side scattered light signal and fluorescence signal as described above, but of plotting them in three-dimensional space defined by axes of forward scattered light signal, side scattered light signal, and fluorescence signal. Then, as a result of examining data based on a clinical sample, the inventors of the present application found that, in three-dimensional space defined by axes of the above three types of signals, the position of neoplastic lymphocytes are distanced from those of other blood cells.
- the inventors of the present application was successful in accurately isolating neoplastic lymphocytes, by separating blood cells in the three-dimensional space, based on the fact that the positions of neoplastic lymphocytes are distanced from those of other blood cells in the three-dimensional space above.
- a technique of isolating neoplastic lymphocytes and separating blood cells into the four subclasses of white blood cell by use of a three-dimensional distribution chart defined by axes of the three types of signals above will be described.
- FIG. 6A is a flow chart showing processes performed by the measurement unit 2 and the information processing unit 4.
- the measurement unit 2 performs a process of preparing a measurement specimen (S1). Specifically, as described above, a blood sample, the first reagent, and the second reagent are mixed together and this mixture solution is heated by the heater H, whereby a measurement specimen is prepared. Subsequently, the measurement unit 2 performs a process of detecting blood cells based on the measurement specimen (S2). Specifically, as described above, the optical detector D obtains a forward scattered light signal, a side scattered light signal, and a fluorescence signal regarding each blood cell. Signals obtained by the measurement unit 2 are transmitted to the information processing unit 4 (S3).
- the CPU 401 of the information processing unit 4 receives the forward scattered light signal, the side scattered light signal, and the fluorescence signal regarding each blood cell from the measurement unit 2 (S11), and stores the received signals in the hard disk 404. Subsequently, the CPU 401 creates a first scattergram based on the received signals, and performs a first demarcation process on the created first scattergram (S12). The first demarcation process is performed according to the technique described with reference to FIGS. 5A to C .
- the CPU 401 sets the value of a determination flag stored in the RAM 403 or the hard disk 404 to 0 (S13). Then, the CPU 401 determines whether re-demarcation is necessary, by determining whether the cluster A11 of lymphocytes and the cluster A12 of monocytes, which each have been created in the first demarcation process, are close to each other (S14).
- FIG. 6B shows an example of a part where the clusters A11 and A12 are close to each other on the first scattergram. It should be noted that round dots on the left represent dots included in the cluster A11, that is, dots classified as lymphocytes in the first demarcation process, and rectangular dots on the right represent dots included in the cluster A12, that is, dots classified as monocytes in the first demarcation process.
- each of all dots classified as lymphocytes it is determined whether the dot is adjacent to a dot classified as a monocyte.
- a dot P11 classified as a lymphocyte is adjacent to a dot P21 classified as a monocyte
- a dot P12 classified as a lymphocyte is adjacent to none of dots classified as monocytes.
- it is determined whether the dot is adjacent to a dot classified as a monocyte and based on the number of dots each determined as being adjacent to a dot classified as a monocyte, whether the clusters A11 and A12 are close to each other is determined.
- the CPU 401 determines NO in S14, that is, determines that this blood sample is normal. Then, the CPU 401 counts the number of dots included in each of the clusters A11 to A14 (the number of blood cells belonging to each cluster) (S15). As a result, the numbers of lymphocytes, monocytes, blood cells in the blood cell group including neutrophils and basophils, and eosinophils are obtained.
- the CPU 401 determines as YES in S14, that is, determines that this blood sample has a possibility of including neoplastic lymphocytes. In this case, the CPU 401 sets the value of the determination flag to 1 (S16). Then, based on the signals received in S11, the CPU 401 creates a three-dimensional distribution chart (hereinafter, referred to as "three-dimensional scattergram" defined by axes of forward scattered light signal, side scattered light signal, and fluorescence signal, and performs a second demarcation process on the created three-dimensional scattergram (S17).
- three-dimensional scattergram defined by axes of forward scattered light signal, side scattered light signal, and fluorescence signal
- FIG. 7A shows a three-dimensional scattergram and FIG. 7B illustrates the second demarcation process.
- FIG. 7A based on a forward scattered light signal, a side scattered light signal, and a fluorescence signal regarding each individual blood cell, a three-dimensional scattergram is created by plotting a dot corresponding to each individual blood cell onto a position on a three-dimensional distribution chart that corresponds to the signals. It should be noted that the three axes shown in FIG. 7A are set as shown in FIG. 7C. FIG. 7A shows the inside of FIG. 7C , without the three planes indicated by solid lines in FIG. 7C .
- dots corresponding to red blood cell ghosts being hemolyzed red blood cells and the like are excluded, as in the first demarcation process above. Specifically, dots included in a predetermined region AG2 set in advance as shown in the schematic diagram in FIG. 7B are excluded. It should be noted that FIG. 7B is a perspective view of the inside of the box of FIG. 7C .
- each dot on the three-dimensional scattergram from which blood cells in the region AG2 have been excluded is classified into any of four clusters respectively corresponding to the four subclasses of white blood cell (a cluster A21 of lymphocytes, a cluster A22 of monocytes, a cluster A23 of the blood cell group including neutrophils and basophils, and a cluster A24 of eosinophils), and a cluster A25 corresponding to neoplastic lymphocytes.
- the belonging degree of each blood cell to each cluster is obtained.
- the center of gravity is set in advance on the three-dimensional space.
- the belonging degree of each blood cell to each cluster is obtained.
- Calculation of the belonging degree is performed by extensionally applying the technique of calculating a belonging degree on a two-dimensional plane described in Japanese Laid-Open Patent Publication No. H5-149863 (corresponding U.S. patent: No. US5555196 ), onto three-dimensional space.
- dots plotted on the three-dimensional scattergram shown in FIG. 7A are separated into the clusters A21 to A25 shown in FIG. 7B . Further, in FIG. 7B , although there are parts where the clusters A21 to A25 seem to overlap adjacent clusters, they do not actually overlap one another in the three-dimensional space. Further, the clusters A21 to A25 are not close to one another as shown in FIG. 6B in the three-dimensional space.
- the CPU 401 counts the number of dots included in each of the clusters A21 to A25 (the number of blood cells belonging to each cluster) (S18). Then, the CPU 401 determines whether the number of neoplastic lymphocytes (the number of dots included in the cluster A25) is greater than or equal to a predetermined value (S19). When the number of neoplastic lymphocytes is greater than or equal to the predetermined value (S19: YES), the CPU 401 determines that this blood sample may include neoplastic lymphocytes, and sets the value of the determination flag to 2 (S20).
- the CPU 401 determines that this blood sample does not include neoplastic lymphocytes, and the processing is advanced to S21. It should be noted that, in S19, it may be determined that the blood sample may include neoplastic lymphocytes when the proportion of neoplastic lymphocytes relative to all blood cells exceeds a predetermined threshold value.
- the analysis result screen 6 includes regions 61 to 65.
- the region 61 is a region for displaying the number of white blood cells (WBC) and the number of each of neutrophils (NEUT), normal lymphocytes (LYMPH), monocytes (MONO), eosinophils (EO), and basophils (BASO), and their respective proportions relative to the number of white blood cells.
- the region 62 is a region for displaying the number of neoplastic lymphocytes, and the proportion thereof relative to the number of white blood cells. Then, the CPU 401 displays the analysis result screen 6 in accordance with the value of the determination flag.
- the CPU 401 displays an alarm indicating that neoplastic lymphocytes may be included, in the region 63 as shown in FIG. 8 (S23). Then, based on the result of the counting performed in S18, the CPU 401 displays measurement results in the regions 61 and 62, and displays first and second scattergrams in the regions 64 and 65, respectively, as shown in FIG. 8 (S24). It should be noted that the second scattergram is created in substantially the same manner as that of the first scattergram.
- the second scattergram is created by plotting a dot corresponding to each individual blood cell onto a two-dimensional distribution chart whose horizontal axis represents side scattered light signal and whose vertical axis represents forward scattered light signal.
- the CPU 401 does not perform display of the region 63 as shown in FIG. 9 , but displays measurement results in the regions 61 and 62 based on the result of the counting performed in S18, and displays first and second scattergrams in the regions 64 and 65, respectively, as shown in FIG. 8 (S24).
- the CPU 401 does not perform display of the regions 62 and 63, but displays measurement results in the region 61 based on the result of the counting performed in S12, and displays first and second scattergrams in the regions 64 and 65, respectively, as shown in FIG. 9 (S26).
- the CPU 401 displays, based on the result of the counting performed in S18, dots in the respective clusters A21 to A25 in colors such that classification of dots included in the respective clusters A21 to A25 can be recognized. Further, when displaying the first and second scattergrams in the regions 64 and 65 in S26, the CPU 401 displays, based on the result of the counting performed in S15, dots in the respective clusters A11 to A14 in colors such that classification of dots included in the respective clusters A11 to A14 can be recognized.
- FIGS. 10A, 10C, and 10E each show a first scattergram displayed in the region 64 of the analysis result screen 6, and FIGS. 10B, 10D, and 10F each show a second scattergram displayed in the region 65 of the analysis result screen 6.
- FIGS. 10A and 10B are first and second scattergrams, respectively, created based on a normal blood sample.
- each dot is classified into any of the clusters A11 to A14 as a result of the first demarcation process in S12 shown in FIG. 6A .
- the first scattergram is a scattergram in which the clusters A11 to A14 are displayed on a two-dimensional space defined by axes of side scattered light signal (SSC) and fluorescence signal (SFL).
- SSC side scattered light signal
- SFL fluorescence signal
- the second scattergram is a scattergram in which the clusters A11 to A14 are displayed on two-dimensional space defined by axes of side scattered light signal (SSC) and forward scattered light signal (FSC).
- dots included in each of the clusters A11 to A14 displayed on the first scattergram shown in FIG. 10A are displayed in a color different from cluster to cluster. For example, dots included in each of the clusters A11 to A14 are displayed in purple, yellow-green, light blue, or brown. Further, dots included in each of the clusters A11 to A14 displayed on the second scattergram shown in FIG. 10B are also displayed in the same color as that of dots included in a corresponding one of the clusters A11 to A14 shown in FIG. 10A .
- FIGS. 10C and 10D are first and second scattergrams, respectively, created based on a blood sample from a patient having an adult T-cell leukemia-lymphoma (ATLL).
- ATLL adult T-cell leukemia-lymphoma
- each dot is classified into any of the clusters A21 to A25 as a result of the second demarcation process in S17 shown in FIG. 6A .
- the first scattergram is a scattergram in which the clusters A21 to A25 are displayed on two-dimensional space defined by axes of side scattered light signal (SSC) and fluorescence signal (SFL)
- the second scattergram is a scattergram in which the clusters A21 to A25 are displayed on two-dimensional space defined by axes of side scattered light signal (SSC) and forward scattered light signal (FSC).
- dots included in each of the clusters A21 to A25 displayed on the first scattergram shown in FIG. 10C are displayed in a color different from cluster to cluster. For example, dots included in each of the clusters A21 to A25 are displayed in purple, yellow-green, light blue, brown, or red. Further, dots included in each of the clusters A21 to A25 displayed on the second scattergram shown in FIG. 10D are also displayed in the same color as that of dots included in a corresponding one of the clusters A21 to A25 shown in FIG. 10C .
- dots corresponding to blood cells are separated into the clusters A21 to A25 shown in FIG. 7B .
- the user cannot view the clusters A21 to A25, which are separated in five groups on the three-dimensional scattergram, in a state where the clusters A21 to A25 are isolated from one another.
- the second scattergram shown in FIG. 10D the user can view the clusters A21 to A25, which are separated into five groups on the three-dimensional scattergram, in a state where the clusters A21 to A25 are isolated from one another.
- FIGS. 10E and 10F are first and second scattergrams, respectively, created based on a blood sample of a patient having diffuse large B-cell lymphoma (DLBCL). Also in this case, each dot is classified into any of the clusters A21 to A25 as a result of the second demarcation process. At this time, dots included in each of the clusters A21 to A25 displayed on the first scattergram shown in FIG. 10E are displayed in a color different from cluster to cluster. Dots included in each of the clusters A21 to A25 displayed on the second scattergram shown in FIG. 10F are also displayed in the same color as that of dots included in a corresponding one of the clusters A21 to A25 shown in FIG. 10E .
- DLBCL diffuse large B-cell lymphoma
- the user cannot view the clusters A21 to A25, which are separated in five groups on the three-dimensional scattergram, in a state where the clusters A21 to A25 are isolated from one another.
- the user can view the clusters A21 to A25, which are separated in five groups on the three-dimensional scattergram, in a state where the clusters A21 to A25 are isolated from one another.
- neoplastic lymphocytes contained in a blood sample can be differentiated from other blood cells to be detected. Accordingly, accuracy of classifying normal white blood cells (lymphocytes, monocytes, the blood cell group including neutrophils and basophils, and eosinophils) can be increased, and diagnosis of disease based on the classification can be performed more appropriately. Further, information useful for diagnosis of diseases such as chronic lymphocytic leukemia, malignant lymphoma, and the like can be provided to the user.
- necessity/unnecessity of re-demarcation that is, whether there is a possibility of neoplastic lymphocytes being included, is determined based on the first demarcation process (S14).
- S14 YES
- the second demarcation process is performed on a three-dimensional scattergram (S17). Accordingly, when there is no possibility of neoplastic lymphocytes being included, the second demarcation process, which is three-dimensional analysis, is not performed. Thus, burden of processing for classifying white blood cells can be reduced.
- neoplastic lymphocytes contained in a blood sample are detected, differentiated from other blood cells, and blood cells contained in the blood sample can be classified into the four subclasses of white blood cell.
- the detection and classification in this case can be performed by using only a measurement specimen prepared by mixing a blood sample with the first reagent and the second reagent. That is, without separately preparing a measurement specimen in order to detect neoplastic lymphocytes, the above detection and classification can be performed by use of the measurement specimen prepared for classifying white blood cells.
- neoplastic lymphocytes may be classified as normal lymphocytes in the first demarcation process in S12 as shown in FIG. 5B .
- neoplastic lymphocytes are classified separately from normal lymphocytes. Therefore, normal lymphocytes can be classified appropriately, and accuracy of classifying white blood cells can be increased.
- the first and second scattergrams are displayed on the analysis result screen 6. Accordingly, by referring to the first and second scattergrams, the user can easily understand the distribution state of each classified blood cell, and thus, information useful for diagnosis can be smoothly obtained.
- the first scattergram is a two-dimensional distribution chart defined by axes of side scattered light signal and fluorescence signal
- the second scattergram is a two-dimensional distribution chart defined by axes of side scattered light signal and forward scattered light signal. Since combinations of signals that are used are different in this manner, the user can further easily understand the distribution state of white blood cells.
- the vertical axis of the first scattergram is fluorescence signal
- distribution of blood cells whose nucleic acid is very active for example, juvenile blood cells and the like
- the user can view the clusters A21 to A25, which are separated in five groups as shown in FIG. 7B , in a state where the clusters A21 to A25 are isolated from one another.
- each dot corresponding to a blood cell is displayed in a color which differs in accordance with its classification. Accordingly, distribution of blood cells that have been classified can be more easily understood. Further, in this case, since dots corresponding to neoplastic lymphocytes are displayed in a color (red) different from other blood cells, distribution of neoplastic lymphocytes are more easily understood, and diagnosis of disease such as chronic lymphocytic leukemia, malignant lymphoma, and the like can be more easily performed.
- dots corresponding to neoplastic lymphocytes may be displayed in the same color as that of dots corresponding to normal lymphocytes. That is, in the second scattergram shown in FIGS. 10D and 10F , dots included in the cluster A25 may be displayed in the same color as that of dots included in the cluster A21.
- the number of blood cells included in each classification is counted. Further, the number and the proportion of blood cells classified into each of the four subclasses of white blood cell are displayed in the region 61 of the analysis result screen 6, and the number and the proportion of blood cells classified as neoplastic lymphocytes are displayed in the region 62 of the analysis result screen 6. Accordingly, the user can quantitatively understand how much blood cells classified in the four subclasses of white blood cell are contained in the measurement specimen, and how much neoplastic lymphocytes are contained in the measurement specimen.
- the number and the proportion of normal lymphocytes excluding neoplastic lymphocytes are displayed as the number of lymphocytes.
- the present invention is not limited thereto. Normal lymphocytes and neoplastic lymphocytes are collectively counted as lymphocytes, and in the region 61, the total of the number of neoplastic lymphocytes and the number of normal lymphocytes may be displayed as the number of lymphocytes, and the proportion of this total number relative to all blood cells may be displayed as the proportion of lymphocytes.
- the first and second scattergrams are displayed on the analysis result screen 6.
- either of the first and second scattergrams may be displayed.
- the three-dimensional scattergram may be displayed on the analysis result screen 6.
- Each dot on the three-dimensional scattergram in this case is displayed in a color corresponding to its classification, as in the case of FIGS. 10C to 10F .
- the above first demarcation process may be performed again on this re-configured first scattergram, and dots included in each of the clusters respectively corresponding to the four subclasses of white blood cell may be determined again. Then, dots included in these clusters and dots included in the cluster A25 of the three-dimensional scattergram are counted, and based on the result of this counting, the number and the proportion of each type of blood cells may be displayed on the analysis result screen 6.
- the user can view the clusters A21 to A25, which are separated in five groups on the three-dimensional scattergram, in a state where the clusters A21 to A25 are isolated from one another, as shown in FIGS. 10D and 10F . Therefore, in S17 in FIG. 6A , instead of the second demarcation process performed on the three-dimensional scattergram, a demarcation process on the second scattergram may be performed. It should be noted that, in order to accurately perform classification among the four subclasses of white blood cell and neoplastic lymphocyte, it is preferable to perform the second demarcation process based on the three-dimensional scattergram as in the above embodiment.
- a measurement specimen is prepared by use of the first reagent for staining nucleic acid and the second reagent for hemolyzing red blood cells and damaging cell membranes of white blood cells to an extent that the fluorescent dye can permeate therethrough.
- the measurement specimen may be prepared by use of one reagent that can stain nucleic acid and that can hemolyze red blood cells and damage cell membranes of white blood cells.
Description
- The present invention relates to a method for analyzing blood cells and a blood cell analyzer for each classifying and counting white blood cells in a sample.
- Typically, normal white blood cells are classified into five types: lymphocyte, monocyte, basophil, eosinophil, and neutrophil. In normal peripheral blood, these types of blood cells exist at certain ratios. However, if a subject has a disease, there may be cases where the number of blood cells of a specific type increases or decreases. Therefore, in the field of clinical laboratory tests, information highly useful for disease diagnosis can be obtained by classifying and counting white blood cells.
- On the other hand, in peripheral blood of a patient having a disease, cells that do not exist in normal peripheral blood appear. For example, in the case of diseases such as chronic lymphocytic leukemia, malignant lymphoma, and the like, neoplastic mature lymphocytes appear in peripheral blood. In the case of acute leukemia, "blast cells (myeloblasts, lymphoblasts)" which are immature white blood cells appear in peripheral blood. Further, in the case of viral infection, drug allergy, and the like, "atypical lymphocytes", which are lymphocytes activated by being primed appear in peripheral blood. Therefore, in order to accurately classify white blood cells, it is necessary to detect these abnormal cells separately from other normal white blood cells.
- Japanese Laid-Open Patent Publication No.
2006/91024 -
WO 2012/147451 A1 relates to a blood analyzer for detecting an abnormal lymphocyte. In the blood analyzer, an assay sample is prepared in a sample preparation part by mixing a first reagent containing a hemolytic agent and a second reagent containing a fluorescent dye for staining nucleic acid with a blood specimen. The hemolytic agent is substantially free from a cationic surfactant and contains a nonionic surfactant. In the blood analyzer, the assay sample is assayed in a detection part and the assay data output from the detection part is processed by an information processing unit. The information processing unit outputs the analysis results on the basis of the detection results. -
EP 2 520 926 A1 -
EP 2 237 019 A2 -
US 5 496 734 A relates to a method for blood analysis which provides a treatment of a blood sample so that it can be analysed for counting and classification of leukocytes. Leukocytes are permeablized by treatment with a surfactant solution and labeled, preferably with a fluorescent dye. The method provides labeled leukocytes that can be counted and classified by optical means, including flow cytometry by analysis of a fluorescence signal. -
US2011/0027788 A1 describes a method for blood analysis where clustering of blood cells is done in 3D. - The scope of the present invention is defined solely by the appended claims, and is not affected to any degree by the statements within this summary.
- The technology of Japanese Laid-Open Patent Publication No.
2006/91024 - In view of the above problem, an object of the present invention is to provide a method for analyzing blood cells, a blood cell analyzer, and a program which each allow easy detection of neoplastic lymphocytes and improvement of accuracy of classifying and counting normal white blood cells.
- The object of the invention is achieved by the subject-matter of the independent claims. Advantageous embodiments are defined in the dependent claims. Further examples are provided for facilitating the understanding of the invention.
- A first aspect refers to a method for analyzing blood cells. The method for analyzing blood cells according to this aspect includes: preparing a measurement specimen for classifying white blood cells, by mixing a sample with a reagent in order to hemolyze red blood cells contained in the sample and to fluorescently stain nucleic acid in white blood cells contained in the sample; detecting, by flowing the measurement specimen in a flow cell, fluorescence emitted from each blood cell in the measurement specimen and two types of scattered light at respective different angles, and obtaining a fluorescence signal and two types of scattered light signals; and classifying the white blood cells into at least four groups and detecting neoplastic lymphocytes, by performing analysis using at least three types of parameters based on the fluorescence signal and the two types of scattered light signals.
- In the method for analyzing blood cells according to the present aspect, neoplastic lymphocytes are detected, separately from non-neoplastic other blood cells. Therefore, accuracy of classifying normal white blood cells can be increased, and diagnosis of disease based on the classification can be performed more appropriately. Further, since neoplastic lymphocytes are detected, separately from other blood cells, information useful for diagnosis of diseases such as chronic lymphocytic leukemia, malignant lymphoma, and the like can be provided to the user.
- In the method for analyzing blood cells according to the present aspect, the two types of scattered light may include first scattered light and second scattered light; and the classifying may include: first classification of classifying the white blood cells through analysis using parameters regarding the fluorescence and the first scattered light; and second classification of classifying the white blood cells and detecting the neoplastic lymphocytes through analysis using parameters regarding the fluorescence, the first scattered light, and the second scattered light.
- In this case, when a result of the first classification satisfies a predetermined condition, the method for analyzing blood cells according to the present aspect can be adjusted such that the second classification is performed. Accordingly, when the result of the first classification does not satisfy the predetermined condition, only the first classification is performed and analysis using two parameters is performed. Thus, burden of processing for classifying white blood cells can be reduced.
- Further, the method for analyzing blood cells according to the present aspect may further include displaying a result of the classifying on a display unit.
- Here, the displaying may include displaying, on the display unit, a white blood cell distribution chart in two or more dimension, as the result of the classifying. Accordingly, by referring to the white blood cell distribution chart, the user can easily understand the distribution state of each classified blood cell, and thus, information useful for diagnosis can be smoothly obtained.
- In this case, the displaying may display, on the display unit, a first white blood cell distribution chart based on a combination of two types of parameters selected from the three types of parameters, and a second white blood cell distribution chart based on a combination of two types of parameters different from the aforesaid combination, as the result of the classifying. Accordingly, in the two types of two-dimensional distribution charts, the distribution state of white blood cells can be displayed in such a manner as to be easily understood.
- Here, the first white blood cell distribution chart may be based on at least a parameter regarding the fluorescence, and the second white blood cell distribution chart may be based on at least parameters regarding the two types of scattered light. Accordingly, in the first white blood cell distribution chart, distribution of blood cells whose nucleic acid is very active (such as juvenile blood cells and the like) and which can be detected by use of fluorescence can be displayed. In the second white blood cell distribution chart, distribution of blood cells in which neoplastic lymphocytes are isolated from other blood cells can be displayed.
- In the white blood cell distribution chart, it is preferable that distribution of the white blood cells is shown in colors which are different in accordance with classifications of the white blood cells. Accordingly, distribution of each blood cell can be more easily understood.
- In this case, in the white blood cell distribution chart, it is further preferable that distribution of the neoplastic lymphocytes is shown in a color identical to a color for normal lymphocytes. Accordingly, distribution of lymphocytes including neoplastic lymphocytes can be easily understood.
- In this case, in the white blood cell distribution chart, it is further preferable that distribution of the neoplastic lymphocytes is shown in a color different from colors for other blood cells. Accordingly, distribution of neoplastic lymphocytes is more easily understood, and diagnosis of diseases such as chronic lymphocytic leukemia, malignant lymphoma, and the like are more easily performed.
- In the method for analyzing blood cells according to the present aspect, the classifying may include counting the number of blood cells included in each classification, and the displaying may be adjusted to display, on the display unit, information regarding the counted number of blood cells included in each classification. Accordingly, the user can quantitatively understand how much blood cells are included in each classification.
- In this case, the classifying may include counting the number of the neoplastic lymphocytes, and the displaying may be adjusted to display, on the display unit, information regarding a result of the counting of the number of the neoplastic lymphocytes. Accordingly, the user can quantitatively understand how much neoplastic lymphocytes are contained in the measurement specimen.
- Further, the displaying may be adjusted to display, on the display unit, information indicating that the sample has a possibility of including the neoplastic lymphocytes, in accordance with the result of the counting of the number of the neoplastic lymphocytes. Accordingly, the user can further easily confirm the possibility of disease based on neoplastic lymphocytes.
- A second aspect of the present invention relates to a method for analyzing blood cells. The method for analyzing blood cells according to this aspect includes: preparing a measurement specimen by mixing a sample with a reagent; detecting, by flowing the measurement specimen in a flow cell, fluorescence emitted from each blood cell in the measurement specimen and two types of scattered light at respective different angles, and obtaining a fluorescence signal and two types of scattered light signals; detecting neoplastic lymphocytes, by performing analysis using at least three types of parameters based on the fluorescence signal and the two types of scattered light signals; and displaying information regarding the detected neoplastic lymphocytes on a display unit.
- In the method for analyzing blood cells according to the present aspect, neoplastic lymphocytes are detected and information regarding the detected neoplastic lymphocytes is displayed on the display unit. Therefore, information useful for diagnosis of diseases such as chronic lymphocytic leukemia, malignant lymphoma, and the like can be provided to the user.
- A third aspect of the present invention relates to a blood cell analyzer. The blood cell analyzer according to this aspect includes: a specimen preparation section configured to prepare a measurement specimen for classifying white blood cells, by mixing a sample with a reagent in order to hemolyze red blood cells contained in the sample and to fluorescently stain nucleic acid in white blood cells contained in the sample; a detection section configured to detect fluorescence emitted from each blood cell in the measurement specimen and two types of scattered light at respective different angles, and configured to output a fluorescence signal and two types of scattered light signals; and an information processing unit configured to classify the white blood cells into at least four groups and configured to detect neoplastic lymphocytes, by performing analysis using at least three types of parameters regarding the fluorescence and the two types of scattered light based on the fluorescence signal and the two types of scattered light signals.
- In the blood cell analyzer according to the present aspect, neoplastic lymphocytes are detected, separately from non-neoplastic other blood cells. Therefore, accuracy of classifying normal white blood cells can be increased, and diagnosis of disease based on the classification can be performed more appropriately. Further, since neoplastic lymphocytes are detected, separately from other blood cells, information useful for diagnosis of diseases such as chronic lymphocytic leukemia, malignant lymphoma, and the like can be provided to the user.
- As described above, according to the present invention, a method for analyzing blood cells and a blood cell analyzer that each allow easy detection of neoplastic lymphocytes and improvement of accuracy of classifying and counting normal white blood cells can be provided.
- The effects and the significance of the present invention will be further clarified by the description of the embodiment below. However, the embodiment below is merely an example for implementing the present invention. The present invention is not limited by the embodiment below in any way.
-
-
FIG. 1 is a perspective view showing an external view of a blood cell analyzer according to an embodiment; -
FIG. 2 is a schematic diagram showing a configuration of a measurement unit according to an embodiment; -
FIG. 3 is a schematic plan view showing a configuration of an optical detector according to an embodiment; -
FIG. 4 shows a configuration of an information processing unit according to an embodiment; -
FIG. 5A to 5C shows first scattergrams and clusters on the first scattergrams according to an embodiment; -
FIG. 6A and 6B shows flow charts of processes performed by a measurement unit and an information processing unit according to an embodiment and shows an example of a part where two clusters are close to each other on a first scattergram; -
FIG. 7A to 7C shows a three-dimensional scattergram and illustrates a second demarcation process according to an embodiment; -
FIG. 8 shows a configuration of an analysis result screen according to an embodiment; -
FIG. 9 shows a configuration of an analysis result screen according to an embodiment; and -
FIG. 10A to 10F shows first and second scattergrams displayed in an analysis result screen according to an embodiment. - The preferred embodiments of the present invention will be described hereinafter with reference to the drawings.
- The present embodiment is obtained by applying the present invention to a blood cell analyzer for performing tests and analysis regarding blood. Hereinafter, a blood cell analyzer according to the present embodiment will be described with reference to the drawings.
-
FIG. 1 is a perspective view showing an external view of ablood cell analyzer 1 according to the present embodiment. - The
blood cell analyzer 1 is a multi-item blood cell analyzer which detects white blood cells, red blood cells, platelets, and the like contained in a blood sample and which counts each type of blood cells. Theblood cell analyzer 1 includes ameasurement unit 2, a transportingunit 3 arranged to the front face side of themeasurement unit 2, and aninformation processing unit 4. A blood sample being peripheral blood collected from a patient is contained in a sample container (blood collecting tube) T. A plurality of sample containers T are held in a sample rack L, and the sample rack L is transported by the transportingunit 3, whereby blood samples are supplied to themeasurement unit 2. - The
information processing unit 4 includes adisplay unit 41 and aninput unit 42 and is communicably connected to themeasurement unit 2, the transportingunit 3, and a host computer 5 (seeFIG. 2 ). Theinformation processing unit 4 controls operation of themeasurement unit 2 and the transportingunit 3, performs analysis based on a result of measurement performed by themeasurement unit 2, and transmits an analysis result to the host computer 5 (seeFIG. 2 ). -
FIG. 2 is a schematic diagram showing a configuration of themeasurement unit 2. - The
measurement unit 2 includes ahand part 21, a samplecontainer setting part 22, abar code unit 23, asample aspirator 24, aspecimen preparation section 25, and adetection section 26. Thesample aspirator 24 includes apiercer 24a and aspirates a sample from a sample container T. Thespecimen preparation section 25 includes a mixing chamber MC and a heater H, and prepares a measurement specimen to be used in measurement, by mixing the sample with a reagent. Thedetection section 26 includes an optical detector D, and detects blood cells from the measurement specimen. Each component of themeasurement unit 2 is controlled by theinformation processing unit 4. - A sample container T located at a position P1 by the transporting
unit 3 is gripped by thehand part 21, and upwardly pulled out of the sample rack L. Then, by thehand part 21 being swung, the sample in the sample container T is stirred. The sample container T for which stirring has been completed is set, by thehand part 21, to the samplecontainer setting part 22 located at the position P1. Then, the sample container T is transported to a position P2 by the samplecontainer setting part 22. - When the sample container T is located at the position P2, the
bar code unit 23 provided at the vicinity of the position P2 reads a sample number from a bar code label attached to the sample container T. Then, the sample container T is transported to a position P3 by the samplecontainer setting part 22. When the sample container T is located at the position P3, a predetermined amount of the sample is aspirated from the sample container T by thesample aspirator 24 via thepiercer 24a. After the aspiration of the sample has been completed, the sample container T is transported forward by the samplecontainer setting part 22, and returned to the original holding position in the sample rack L by thehand part 21. After thepiercer 24a has been transferred to a position corresponding to the mixing chamber MC, the sample aspirated via thepiercer 24a is discharged by a predetermined amount into the mixing chamber MC by thesample aspirator 24. - The
specimen preparation section 25 is connected, via tubes, to areagent container 251 containing a first reagent, areagent container 252 containing a second reagent, and areagent container 253 containing a sheath fluid (diluent). Further, thespecimen preparation section 25 is connected to a compressor (not shown), and can receive an aliquot of each of the reagents from thereagent containers 251 to 253, by use of a pressure generated by this compressor. Thespecimen preparation section 25 mixes the blood sample, the first reagent, and the second reagent together in the mixing chamber MC, and heats the mixture solution for a predetermined time period by means of the heater H, to prepare a measurement specimen. The measurement specimen prepared by thespecimen preparation section 25 is supplied to the optical detector D of thedetection section 26. - The
detection section 26 is connected, via a tube, to thereagent container 253 containing the sheath fluid (diluent). Further, thedetection section 26 is connected to a compressor (not shown) and can receive an aliquot of the sheath fluid (diluent) from thereagent container 253 by use of a pressure generated by this compressor. -
FIG. 3 is a schematic diagram showing a configuration of the optical detector D. The optical detector D includes a flow cell D1, a sheath flow system D2, a beam spot formation system D3, a forward scattered light receiving system D4, a side scattered light receiving system D5, and a fluorescence receiving system D6. - The sheath flow system D2 is configured to send, into the flow cell D1, a measurement specimen surrounded in a sheath fluid, and to generate a fluid flow in the flow cell D1. The beam spot formation system D3 is configured such that light emitted from a semiconductor laser D31 advances through a collimator lens D32 and a condenser lens D33 to irradiate the flow cell D1. Accordingly, each blood cell contained in the fluid flow passing through the flow cell D1 is irradiated with a laser beam. Further, the beam spot formation system D3 includes a beam stopper D34.
- The forward scattered light receiving system D4 is configured to condense scattered light advancing forward (forward scattered light) with a forward condenser lens D41, and to receive light that has passed through a pinhole D42 with a photodiode D43. The photodiode D43 outputs a forward scattered light signal (FSC) based on a peak value of the received forward scattered light. The side scattered light receiving system D5 is configured to condense scattered light advancing sideways (side scattered light) with a side condenser lens D51, and to cause a part of the side scattered light to be reflected at a dichroic mirror D52 to be received by a photodiode D53. The photodiode D53 outputs a side scattered light signal (SSC) based on a peak value of the received side scattered light.
- Light scattering is a phenomenon that occurs when the advancing direction of light is changed due to the presence of a particle such as a blood cell as an obstacle in the advancing direction of the light. By detecting this scattered light, information regarding the size and the material of the particle can be obtained. In particular, from forward scattered light, information regarding the size of a particle (blood cell) can be obtained. Further, from side scattered light, information regarding the inside of a particle can be obtained. When a blood cell particle is irradiated with a laser beam, the intensity of side scattered light is dependent on the complexity (the shape, size, and density of the nucleus and the amount of granules) inside the cell.
- The fluorescence receiving system D6 is configured to allow light (fluorescence), of the side scattered light, that has transmitted through the dichroic mirror D52, to further pass through a spectrum filter D61 to be received by an avalanche photodiode D62. The avalanche photodiode D62 outputs a fluorescence signal (SFL) based on a peak value of the received fluorescence.
- When a blood cell stained by a fluorescent substance is irradiated with light, the blood cell emits fluorescence having a wavelength longer than the wavelength of the light that irradiated the blood cell. The intensity of fluorescence increases if the blood cell is well stained, and by measuring this fluorescence intensity, information regarding the stained degree of the blood cell can be obtained.
- With reference back to
FIG. 2 , the forward scattered light signal, the side scattered light signal, and the fluorescence signal, which have been obtained by the optical detector D, are transmitted to theinformation processing unit 4. Theinformation processing unit 4 performs analysis based on these received signals. In this analysis, white blood cells present in the blood sample are classified into four subclasses (lymphocyte (LYMPH), monocyte (MONO), blood cell group including neutrophil (NEUT) and basophil (BASO), and eosinophil (EO)). - Although description is omitted in the present embodiment, the
blood cell analyzer 1 mixes a blood sample with a predetermined reagent to prepare a measurement specimen for counting the number of white blood cells and individually detecting basophils. By measuring the measurement specimen using the optical detector D, the number of white blood cells can be obtained and classification of neutrophils and basophils can be performed. -
FIG. 4 shows a configuration of theinformation processing unit 4. - The
information processing unit 4 is implemented by a personal computer, and includes abody 40, thedisplay unit 41, and theinput unit 42. Thebody 40 includes aCPU 401, aROM 402, aRAM 403, ahard disk 404, areadout device 405, animage output interface 406, an input/output interface 407, and acommunication interface 408. - The
CPU 401 executes computer programs stored in theROM 402 and computer programs loaded onto theRAM 403. TheRAM 403 is used for reading out computer programs stored in theROM 402 and thehard disk 404. Further, theRAM 403 is also used as a work area for theCPU 401 when theCPU 401 executes these computer programs. - The
hard disk 404 has stored therein an operating system, computer programs to be executed by theCPU 401, and data used for execution of such computer programs. Further, thehard disk 404 has stored therein aprogram 404a to be executed by theCPU 401 for performing processes for theinformation processing unit 4 shown inFIG. 6A . Thereadout device 405 is implemented by a CD drive, a DVD drive, or the like, and can read out computer programs and data stored in astorage medium 405a. In a case where theprogram 404a is stored in thestorage medium 405a, theprogram 404a read out from thestorage medium 405a by thereadout device 405 is stored in thehard disk 404. - The
image output interface 406 outputs an image signal corresponding to image data to thedisplay unit 41, and thedisplay unit 41 displays an image based on the image signal outputted from theimage output interface 406. A user inputs an instruction via theinput unit 42, and the input/output interface 407 receives a signal inputted via theinput unit 42. Thecommunication interface 408 is connected to themeasurement unit 2, the transportingunit 3, and thehost computer 5, and theCPU 401 transmits/receives instruction signals and data to/from these apparatuses via thecommunication interface 408. - In the
specimen preparation section 25, in order to hemolyze red blood cells, and to damage cell membranes of white blood cells to an extent that a fluorescent dye can permeate therethrough to stain nucleic acid in the white blood cells, a blood sample and reagents are mixed together, whereby a measurement specimen is prepared. Specifically, the following first reagent and second reagent are mixed with a blood sample to prepare a measurement specimen. - The first reagent contains a fluorescent dye capable of staining nucleic acid and is a reagent for fluorescently staining nucleic acid in each nucleated cell contained in the blood specimen processed by the second reagent described later. By processing a blood specimen with the first reagent, blood cells containing nucleic acid, such as white blood cells, are stained.
- The fluorescent dye is not limited to a particular one as long as it can stain nucleic acid, and can be selected as appropriate in accordance with the wavelength of light emitted from a light source (the semiconductor laser D31). Examples of such a fluorescent dye include propidium iodide, ethidium bromide, ethidium-acridine heterodimer, ethidium diazide, ethidium homodimer-1, ethidium homodimer-2, ethidium monoazide, trimethylenebis[[3-[[4-[[(3-methylbenzothiazole-3-ium)-2-yl]methylene]-1,4-dihydroquinoline]-1-yl]propyl]dimethylaminium]·tetraiodide (TOTO-1), 4-[(3-methylbenzothiazole-2(3H)-ylidene)methyl]-1-[3-(trimethylaminio)propyl]quinolinium·diiodide (TO-PRO-1), N,N,N',N'-tetramethyl-N,N'-bis[3-[4-[3-[(3-methylbenzothiazole-3-ium)-2-yl]-2-propenylidene]-1,4-dihydroquinoline-1-yl]propyl]-1,3-propanediaminium·tetraiodide (TOTO-3), 2-[3-[[1-[3-(trimethylaminio)propyl]-1,4-dihydroquinoline]-4-ylidene]-1-propenyl]-3-methylbenzothiazole-3-ium·diiodide (TO-PRO-3), and fluorescent dyes represented by general formula (I) below. Among these examples, the fluorescent dyes represented by general formula (I) are preferable.

- In formula (I) above, R1 and R4 are the same with each other or different from each other, and each are a hydrogen atom, an alkyl group, an alkyl chain having a hydroxy group, an alkyl chain having an ether group, an alkyl chain having an ester group, or a benzyl group that may have a substituent. R2 and R3 are the same with each other or different from each other, and each are a hydrogen atom, a hydroxyl group, a halogen, an alkyl group, an alkenyl group, an alkynyl group, an alkoxy group, an alkyl sulfonyl group, or a phenyl group. Further, Z is a sulfur atom, an oxygen atom, or a carbon atom having a methyl group, n is 0, 1, 2, or 3, and X- is an anion.
- In the present embodiment, an alkyl group may be either linear or branched. Further, in formula (I) above, in a case where either one of R1 and R4 is an alkyl group having 6 to 18 carbon atoms, the other is preferably is an hydrogen atom or an alkyl group having fewer than 6 carbon atoms. Among alkyl groups having 6 to 18 carbon atoms, an alkyl group having 6, 8, or 10 carbon atoms is preferable.
- Further, examples of the substituent of the benzyl group represented by R1 and R4 in formula (I) above include alkyl groups having 1 to 20 carbon atoms, alkenyl groups having 2 to 20 carbon atoms, and alkynyl groups having 2 to 20 carbon atoms. Among these, a methyl group or an ethyl group is particularly preferable.
- Further, examples of the alkenyl group represented by R2 and R3 in formula (I) above include alkenyl groups having 2 to 20 carbon atoms. Examples of the alkoxy group represented by R2 and R3 include alkoxy groups having 1 to 20 carbon atoms. Among these, a methoxy group or an ethoxy group is particularly preferable.
- Further, examples of the anion X- in formula (I) above include halogen ions such as F-, Cl-, Br-, and I-, and CF3SO3 -, BF4 - and the like.
- Further, the fluorescent dye in the first reagent may include one, or two or more types of fluorescent dyes.
- The concentration of the fluorescent dye in the first reagent may be set as appropriate in accordance with the type of the fluorescent dye, and is normally 0.01 to 100 pg/µL, and preferably 0.1 to 10 pg/µL. For example, in a case where the fluorescent dye represented by formula (I) above is used as the fluorescent dye of the first reagent, the concentration of the fluorescent dye in the first reagent is preferably 0.2 to 0.6 pg/µL, and more preferably 0.3 to 0.5 pg/µL.
- The first reagent can be obtained by dissolving the fluorescent dye described above in an appropriate solvent at the concentration described above. The solvent is not limited to a particular one as long as it can dissolve the fluorescent dye described above. Examples of the solvent include water, an organic solvent, and a mixture of these. Examples of the organic solvent include alcohol, ethylene glycol, dimethyl sulfoxide (DMSO), and the like. There are cases where a fluorescent dye is not stable when preserved in an aqueous solution, and thus, the fluorescent dye is preferably dissolved in an organic solvent.
- Further, as the first reagent, a commercially-available staining reagent for classifying white blood cells may be used. Examples of such a staining reagent include Stromatolyser (registered trademark)-4DS manufactured by Sysmex Corporation. Stromatolyser-4DS is a staining reagent containing a fluorescent dye represented by formula (I) above.
- The second reagent contains a surfactant, i.e., a cationic surfactant and/or a nonionic surfactant, for hemolyzing red blood cells and for damaging cell membranes of white blood cells to an extent that the fluorescent dye in the first reagent can permeate therethrough. Further, the second reagent contains an aromatic organic acid at a concentration not lower than 20 mM and not higher than 50 mM. Here, with respect to the second reagent, in a case where the concentration of the aromatic organic acid is not lower than 20 mM and lower than 30 mM, pH of the second reagent is not lower than 5.5 and not higher than 6.4, and in a case where the concentration of the aromatic organic acid is not lower than 30 mM and not higher than 50 mM, pH of the second reagent is not lower than 5.5 and not higher than 7.0.
- In the present embodiment, in a case where the concentration of the aromatic organic acid in the second reagent is not lower than 20 mM and lower than 30 mM, pH of the second reagent is preferably not lower than 5.5 and not higher than 6.4, and more preferably, not lower than 5.5 and not higher than 6.2. Further, in a case where the concentration of the aromatic organic acid in the second reagent is not lower than 30 mM and not higher than 50 mM, preferably not lower than 40 mM and not higher than 50 mM, pH of the second reagent is not lower than 5.5 and not higher than 7.0. More preferably, in a case where the concentration of the aromatic organic acid in the second reagent is not lower than 40 mM and not higher than 50 mM, pH of the second reagent is not lower than 5.5 and not higher than 6.2.
- Further, in the present embodiment, the aromatic organic acid means an acid having at least one aromatic ring in the molecule or a salt thereof. Examples of the aromatic organic acid include aromatic carboxylic acids, aromatic sulfonic acids, and the like. In the present embodiment, phthalic acid, benzoic acid, salicylic acid, hippuric acid, p-aminobenzenesulfonic acid, benzenesulfonic acid, and salts thereof are preferably used. It should be noted that the aromatic organic acid in the second reagent may include one, or two or more types of aromatic organic acids. In a case where two or more types of aromatic organic acids are included in the second reagent, it is sufficient that the total of concentrations of these is not lower than 20 mM and not higher than 50 mM.
- As the cationic surfactant, a quaternary ammonium salt type surfactant or a pyridinium salt type surfactant can be used.
- Examples of the quaternary ammonium salt type surfactant include surfactants having 9 to 30 carbon atoms in total, represented by formula (II) below.


- In formula (II) above, R1 is an alkyl or alkenyl group having 6 to 18 carbon atoms. R2 and R3 are the same with each other or different from each other, and each are an alkyl or alkenyl group having 1 to 4 carbon atoms. R4 is an alkyl or alkenyl group having 1 to 4 carbon atoms, or a benzyl group, and X- is a halogen atom.
- In formula (II) above, R1 is preferably an alkyl or alkenyl group having 6, 8, 10, 12, or 14 carbon atoms, and in particular, a linear alkyl group is preferable. More specific examples of R1 include an octyl group, a decyl group, and a dodecyl group. R2 and R3 each are preferably a methyl group, an ethyl group, or a propyl group. R4 is preferably a methyl group, an ethyl group, or a propyl group.
- Examples of the pyridinium salt type surfactant include surfactants represented by formula (III) below.

- In formula (III) above, R1 is an alkyl or alkenyl group having 6 to 18 carbon atoms, and X- is a halogen atom.
- In formula (III) above, R1 is preferably an alkyl or alkenyl group having 6, 8, 10, 12, or 14 carbon atoms, and in particular, a linear alkyl group is preferable. More specific examples of R1 include an octyl group, a decyl group and a dodecyl group.
- The concentration of the cationic surfactant in the second reagent can be adjusted as appropriate in accordance with the type of the surfactant, and is normally 10 to 10000 ppm, and preferably 100 to 1000 ppm.
- As the nonionic surfactant, a polyoxyethylene-based nonionic surfactant represented by formula (VI) below is preferable.
R1-R2-(CH2CH2O)n-H (VI)
- In formula (VI) above, R1 is an alkyl, alkenyl, or alkynyl group having 8 to 25 carbon atoms, R2 is an oxygen atom, -COO-, or

- Specific examples of the nonionic surfactant above include polyoxyethylene alkyl ether, polyoxyethylene sterol, polyoxyethylene castor oil, polyoxyethylene sorbitol fatty acid ester, polyoxyethylene alkyl amine, polyoxyethylene polyoxypropylene alkyl ether, and the like.
- The concentration of the nonionic surfactant in the second reagent is normally 10 to 100000 ppm, preferably 100 to 10000 ppm, and more preferably 1000 to 5000 ppm.
- The second reagent may include a buffer agent in order to maintain constant pH. Examples of such a buffer agent include citrates, HEPES, phosphates, and the like. It should be noted that the aromatic organic acids described above may exhibit buffer action. In a case where such an aromatic organic acid is used, addition of a buffer agent to the second reagent is optional.
- The osmotic pressure of the second reagent is not limited to a particular one, but is preferably 20 to 150 mOsm/kg from the view point of efficiently hemolyzing red blood cells.
- The second reagent can be obtained by dissolving the surfactant and the aromatic organic acid or a salt thereof described above, optionally with the buffer agent described above, in an appropriate solvent at the concentration of the aromatic organic acid described above, and by adjusting pH using NaOH, HCl, or the like. The solvent is not limited to a particular one as long as it can dissolve the above components, and examples of the solvent include water, an organic solvent and a mixture thereof. Examples of the organic solvent include alcohol, methanol, ethylene glycol, DMSO, and the like.
- As the second reagent, a commercially available hemolyzing reagent for classifying white blood cells may be used. Examples of such a hemolyzing reagent include Stromatolyser-4DL manufactured by Sysmex Corporation. Stromatolyser-4DL is a hemolyzing reagent containing the cationic surfactant and the nonionic surfactant described above.
- By the second reagent composed as described above, red blood cells are hemolyzed and cell membranes of white blood cells are damaged to an extent that the fluorescent dye in the first reagent passes therethrough. Further, by the first reagent composed as described above, white blood cells whose cell membranes have been damaged by the second reagent are stained. Accordingly, the optical detector D can perform detection of the four subclasses of white blood cell.
- Procedures of classifying white blood cells in a blood sample obtained from a normal sample, the procedures being performed in analysis by the
information processing unit 4, will be described. - In the
information processing unit 4, a first scattergram as shown inFIG. 5A is created first. Specifically, based on a side scattered light signal and a fluorescence signal regarding each individual blood cell, the first scattergram is created by plotting a dot corresponding to each individual blood cell onto a two-dimensional distribution chart whose horizontal axis represents side scattered light signal and whose vertical axis represents fluorescence signal. Such a two-dimensional distribution chart including fluorescence signal as an axis is conventionally used in order to detect blood cells (such as juvenile blood cells and the like) whose nucleic acid is very active. - Next, from the dots plotted on the first scattergram, dots corresponding to red blood cell ghosts being hemolyzed red blood cells and the like are excluded. Specifically, dots included in a predetermined region AG1 set in advance as shown in the schematic diagram in
FIG. 5B are excluded. Subsequently, each dot on the first scattergram from which blood cells in the region AG1 have been excluded is classified into any of four clusters respectively corresponding to the four subclasses of white blood cell (a cluster A11 of lymphocytes, a cluster A12 of monocytes, a cluster A13 of the blood cell group including neutrophils and basophils, and a cluster A14 of eosinophils). - Specifically, based on the distance between a dot corresponding to each blood cell plotted on the first scattergram and the center of gravity of each cluster set in advance, the belonging degree of each blood cell to each cluster is obtained. Then, based on these belonging degrees, each blood cell is assigned to a corresponding cluster. Such a method for classifying blood cells is described in detail in Japanese Laid-Open Patent Publication No.
H5-149863 US5555196 ). All of the documents referred to herein are incorporated herein, in their entirety, by the reference. - When each blood cell is classified to any of the four clusters respectively corresponding to the four subclasses of white blood cell, dots plotted on the first scattergram shown in
FIG. 5A will be separated into the clusters A11 to A14 shown inFIG. 5B . - Here, there are cases where a blood sample collected from a patient includes neoplastic lymphocytes. For example, if a patient has chronic lymphocytic leukemia, malignant lymphoma, or the like, a blood sample obtained from this patient may include neoplastic lymphocytes.
-
FIG. 5C shows a first scattergram created based on a blood sample collected from a patient having adult T-cell leukemia-lymphoma (ATLL). Also in this case as in the case of a normal sample described above, each blood cell is classified to any of the four subclasses of white blood cell. However, the blood sample of the patient having adult T-cell leukemia-lymphoma (ATLL) may include neoplastic lymphocytes. In such a case, dots corresponding to neoplastic lymphocytes appear in the region shown by a dashed line inFIG. 5B , and are included in the cluster A11 or the cluster A12 as dots corresponding to normal lymphocytes or monocytes. Thus, neoplastic lymphocytes alone cannot be separately detected. Moreover, neither normal lymphocytes alone can be separated, nor monocytes alone can be separated. - Therefore, the inventors of the present application conceived an idea of not plotting dots corresponding to blood cells in two-dimensional space defined by axes of side scattered light signal and fluorescence signal as described above, but of plotting them in three-dimensional space defined by axes of forward scattered light signal, side scattered light signal, and fluorescence signal. Then, as a result of examining data based on a clinical sample, the inventors of the present application found that, in three-dimensional space defined by axes of the above three types of signals, the position of neoplastic lymphocytes are distanced from those of other blood cells. In this manner, the inventors of the present application was successful in accurately isolating neoplastic lymphocytes, by separating blood cells in the three-dimensional space, based on the fact that the positions of neoplastic lymphocytes are distanced from those of other blood cells in the three-dimensional space above. Hereinafter, a technique of isolating neoplastic lymphocytes and separating blood cells into the four subclasses of white blood cell by use of a three-dimensional distribution chart defined by axes of the three types of signals above will be described.
-
FIG. 6A is a flow chart showing processes performed by themeasurement unit 2 and theinformation processing unit 4. - First, in order to hemolyze red blood cells contained in a blood sample and to fluorescently stain nucleic acid in white blood cells contained in the blood sample, the
measurement unit 2 performs a process of preparing a measurement specimen (S1). Specifically, as described above, a blood sample, the first reagent, and the second reagent are mixed together and this mixture solution is heated by the heater H, whereby a measurement specimen is prepared. Subsequently, themeasurement unit 2 performs a process of detecting blood cells based on the measurement specimen (S2). Specifically, as described above, the optical detector D obtains a forward scattered light signal, a side scattered light signal, and a fluorescence signal regarding each blood cell. Signals obtained by themeasurement unit 2 are transmitted to the information processing unit 4 (S3). - Next, as described above, the
CPU 401 of theinformation processing unit 4 receives the forward scattered light signal, the side scattered light signal, and the fluorescence signal regarding each blood cell from the measurement unit 2 (S11), and stores the received signals in thehard disk 404. Subsequently, theCPU 401 creates a first scattergram based on the received signals, and performs a first demarcation process on the created first scattergram (S12). The first demarcation process is performed according to the technique described with reference toFIGS. 5A to C . - Subsequently, the
CPU 401 sets the value of a determination flag stored in theRAM 403 or thehard disk 404 to 0 (S13). Then, theCPU 401 determines whether re-demarcation is necessary, by determining whether the cluster A11 of lymphocytes and the cluster A12 of monocytes, which each have been created in the first demarcation process, are close to each other (S14). -
FIG. 6B shows an example of a part where the clusters A11 and A12 are close to each other on the first scattergram. It should be noted that round dots on the left represent dots included in the cluster A11, that is, dots classified as lymphocytes in the first demarcation process, and rectangular dots on the right represent dots included in the cluster A12, that is, dots classified as monocytes in the first demarcation process. - In the above determination of closeness, first, with respect to each of all dots classified as lymphocytes (all dots in the cluster A11), it is determined whether the dot is adjacent to a dot classified as a monocyte. For example, a dot P11 classified as a lymphocyte is adjacent to a dot P21 classified as a monocyte, whereas a dot P12 classified as a lymphocyte is adjacent to none of dots classified as monocytes. In this manner, with respect to each of all dots classified as lymphocytes, it is determined whether the dot is adjacent to a dot classified as a monocyte, and based on the number of dots each determined as being adjacent to a dot classified as a monocyte, whether the clusters A11 and A12 are close to each other is determined.
- With reference back to
FIG. 6A , in a case where the clusters A11 and A12 are not close to each other, as inFIG. 5A and 5B , for example, theCPU 401 determine as NO in S14, that is, determines that this blood sample is normal. Then, theCPU 401 counts the number of dots included in each of the clusters A11 to A14 (the number of blood cells belonging to each cluster) (S15). As a result, the numbers of lymphocytes, monocytes, blood cells in the blood cell group including neutrophils and basophils, and eosinophils are obtained. - On the other hand, in a case where the clusters A11 and A12 are close to each other, as in
FIG. 5C , for example, theCPU 401 determines as YES in S14, that is, determines that this blood sample has a possibility of including neoplastic lymphocytes. In this case, theCPU 401 sets the value of the determination flag to 1 (S16). Then, based on the signals received in S11, theCPU 401 creates a three-dimensional distribution chart (hereinafter, referred to as "three-dimensional scattergram" defined by axes of forward scattered light signal, side scattered light signal, and fluorescence signal, and performs a second demarcation process on the created three-dimensional scattergram (S17). -
FIG. 7A shows a three-dimensional scattergram andFIG. 7B illustrates the second demarcation process. - With reference to
FIG. 7A , based on a forward scattered light signal, a side scattered light signal, and a fluorescence signal regarding each individual blood cell, a three-dimensional scattergram is created by plotting a dot corresponding to each individual blood cell onto a position on a three-dimensional distribution chart that corresponds to the signals. It should be noted that the three axes shown inFIG. 7A are set as shown inFIG. 7C. FIG. 7A shows the inside ofFIG. 7C , without the three planes indicated by solid lines inFIG. 7C . - Next, from the dots plotted on the three-dimensional scattergram, dots corresponding to red blood cell ghosts being hemolyzed red blood cells and the like are excluded, as in the first demarcation process above. Specifically, dots included in a predetermined region AG2 set in advance as shown in the schematic diagram in
FIG. 7B are excluded. It should be noted thatFIG. 7B is a perspective view of the inside of the box ofFIG. 7C . Subsequently, each dot on the three-dimensional scattergram from which blood cells in the region AG2 have been excluded is classified into any of four clusters respectively corresponding to the four subclasses of white blood cell (a cluster A21 of lymphocytes, a cluster A22 of monocytes, a cluster A23 of the blood cell group including neutrophils and basophils, and a cluster A24 of eosinophils), and a cluster A25 corresponding to neoplastic lymphocytes. - Specifically, based on the distance between a dot corresponding to each blood cell plotted on the three-dimensional scattergram and the center of gravity of each cluster set in advance, the belonging degree of each blood cell to each cluster is obtained. Here, not only with respect to each of the four clusters respectively corresponding to the four subclasses of white blood cell (the cluster A21 of lymphocytes, the cluster A22 of monocytes, the cluster A23 of the blood cell group including neutrophils and basophils, and the cluster A24 of eosinophils), but also with respect to the cluster A25 corresponding to neoplastic lymphocytes, the center of gravity is set in advance on the three-dimensional space. Then, based on the distance between these centers of gravity and a dot corresponding to each blood cell plotted on the three-dimensional scattergram, the belonging degree of each blood cell to each cluster is obtained. Calculation of the belonging degree is performed by extensionally applying the technique of calculating a belonging degree on a two-dimensional plane described in Japanese Laid-Open Patent Publication No.
H5-149863 US5555196 ), onto three-dimensional space. - When each blood cell has been classified to any of the four subclasses of white blood cell and neoplastic lymphocyte, dots plotted on the three-dimensional scattergram shown in
FIG. 7A are separated into the clusters A21 to A25 shown inFIG. 7B . Further, inFIG. 7B , although there are parts where the clusters A21 to A25 seem to overlap adjacent clusters, they do not actually overlap one another in the three-dimensional space. Further, the clusters A21 to A25 are not close to one another as shown inFIG. 6B in the three-dimensional space. - With reference back to
FIG. 6A , when the second demarcation process on the three-dimensional scattergram has been completed, theCPU 401 counts the number of dots included in each of the clusters A21 to A25 (the number of blood cells belonging to each cluster) (S18). Then, theCPU 401 determines whether the number of neoplastic lymphocytes (the number of dots included in the cluster A25) is greater than or equal to a predetermined value (S19). When the number of neoplastic lymphocytes is greater than or equal to the predetermined value (S19: YES), theCPU 401 determines that this blood sample may include neoplastic lymphocytes, and sets the value of the determination flag to 2 (S20). On the other hand, when the number of neoplastic lymphocytes is smaller than the predetermined value (S19: NO), theCPU 401 determines that this blood sample does not include neoplastic lymphocytes, and the processing is advanced to S21. It should be noted that, in S19, it may be determined that the blood sample may include neoplastic lymphocytes when the proportion of neoplastic lymphocytes relative to all blood cells exceeds a predetermined threshold value. - Next, the
CPU 401 displays an analysis result screen 6 as shown inFIG. 8 or9 on the display unit 41 (S21). The analysis result screen 6 includesregions 61 to 65. Theregion 61 is a region for displaying the number of white blood cells (WBC) and the number of each of neutrophils (NEUT), normal lymphocytes (LYMPH), monocytes (MONO), eosinophils (EO), and basophils (BASO), and their respective proportions relative to the number of white blood cells. Theregion 62 is a region for displaying the number of neoplastic lymphocytes, and the proportion thereof relative to the number of white blood cells. Then, theCPU 401 displays the analysis result screen 6 in accordance with the value of the determination flag. - In a case where the value of the determination flag is 2 (S22: YES), the
CPU 401 displays an alarm indicating that neoplastic lymphocytes may be included, in theregion 63 as shown inFIG. 8 (S23). Then, based on the result of the counting performed in S18, theCPU 401 displays measurement results in theregions regions FIG. 8 (S24). It should be noted that the second scattergram is created in substantially the same manner as that of the first scattergram. That is, based on a side scattered light signal and a forward scattered light signal regarding each individual blood cell, the second scattergram is created by plotting a dot corresponding to each individual blood cell onto a two-dimensional distribution chart whose horizontal axis represents side scattered light signal and whose vertical axis represents forward scattered light signal. - In a case where the value of the determination flag is 1 (S25: YES), the
CPU 401 does not perform display of theregion 63 as shown inFIG. 9 , but displays measurement results in theregions regions FIG. 8 (S24). In a case where the value of the determination flag is 0 (S25: NO), theCPU 401 does not perform display of theregions region 61 based on the result of the counting performed in S12, and displays first and second scattergrams in theregions FIG. 9 (S26). - It should be noted that when displaying the first and second scattergrams in the
regions CPU 401 displays, based on the result of the counting performed in S18, dots in the respective clusters A21 to A25 in colors such that classification of dots included in the respective clusters A21 to A25 can be recognized. Further, when displaying the first and second scattergrams in theregions CPU 401 displays, based on the result of the counting performed in S15, dots in the respective clusters A11 to A14 in colors such that classification of dots included in the respective clusters A11 to A14 can be recognized. -
FIGS. 10A, 10C, and 10E each show a first scattergram displayed in theregion 64 of the analysis result screen 6, andFIGS. 10B, 10D, and 10F each show a second scattergram displayed in theregion 65 of the analysis result screen 6. -
FIGS. 10A and 10B are first and second scattergrams, respectively, created based on a normal blood sample. In this case, each dot is classified into any of the clusters A11 to A14 as a result of the first demarcation process in S12 shown inFIG. 6A . The first scattergram is a scattergram in which the clusters A11 to A14 are displayed on a two-dimensional space defined by axes of side scattered light signal (SSC) and fluorescence signal (SFL). The second scattergram is a scattergram in which the clusters A11 to A14 are displayed on two-dimensional space defined by axes of side scattered light signal (SSC) and forward scattered light signal (FSC). - At this time, dots included in each of the clusters A11 to A14 displayed on the first scattergram shown in
FIG. 10A are displayed in a color different from cluster to cluster. For example, dots included in each of the clusters A11 to A14 are displayed in purple, yellow-green, light blue, or brown. Further, dots included in each of the clusters A11 to A14 displayed on the second scattergram shown inFIG. 10B are also displayed in the same color as that of dots included in a corresponding one of the clusters A11 to A14 shown inFIG. 10A . -
FIGS. 10C and 10D are first and second scattergrams, respectively, created based on a blood sample from a patient having an adult T-cell leukemia-lymphoma (ATLL). In this case, each dot is classified into any of the clusters A21 to A25 as a result of the second demarcation process in S17 shown inFIG. 6A . The first scattergram is a scattergram in which the clusters A21 to A25 are displayed on two-dimensional space defined by axes of side scattered light signal (SSC) and fluorescence signal (SFL), and the second scattergram is a scattergram in which the clusters A21 to A25 are displayed on two-dimensional space defined by axes of side scattered light signal (SSC) and forward scattered light signal (FSC). - At this time, dots included in each of the clusters A21 to A25 displayed on the first scattergram shown in
FIG. 10C are displayed in a color different from cluster to cluster. For example, dots included in each of the clusters A21 to A25 are displayed in purple, yellow-green, light blue, brown, or red. Further, dots included in each of the clusters A21 to A25 displayed on the second scattergram shown inFIG. 10D are also displayed in the same color as that of dots included in a corresponding one of the clusters A21 to A25 shown inFIG. 10C . - As described above, in a case where neoplastic lymphocytes are included in a blood sample, in the three-dimensional scattergram, dots corresponding to blood cells are separated into the clusters A21 to A25 shown in
FIG. 7B . In this case, with reference to the first scattergram shown inFIG. 10C , the user cannot view the clusters A21 to A25, which are separated in five groups on the three-dimensional scattergram, in a state where the clusters A21 to A25 are isolated from one another. However, with reference to the second scattergram shown inFIG. 10D , the user can view the clusters A21 to A25, which are separated into five groups on the three-dimensional scattergram, in a state where the clusters A21 to A25 are isolated from one another. -
FIGS. 10E and 10F are first and second scattergrams, respectively, created based on a blood sample of a patient having diffuse large B-cell lymphoma (DLBCL). Also in this case, each dot is classified into any of the clusters A21 to A25 as a result of the second demarcation process. At this time, dots included in each of the clusters A21 to A25 displayed on the first scattergram shown inFIG. 10E are displayed in a color different from cluster to cluster. Dots included in each of the clusters A21 to A25 displayed on the second scattergram shown inFIG. 10F are also displayed in the same color as that of dots included in a corresponding one of the clusters A21 to A25 shown inFIG. 10E . - Also in this case, with reference to the first scattergram shown in
FIG. 10E , the user cannot view the clusters A21 to A25, which are separated in five groups on the three-dimensional scattergram, in a state where the clusters A21 to A25 are isolated from one another. However, with reference to the second scattergram shown inFIG. 10F , the user can view the clusters A21 to A25, which are separated in five groups on the three-dimensional scattergram, in a state where the clusters A21 to A25 are isolated from one another. - As described above, according to the present embodiment, in such a case where the clusters A11 and A12 are close to each other (S14: YES), dots on the three-dimensional scattergram shown in
FIG. 7A are separated into the clusters A21 to A25 as shown inFIG. 7B . Accordingly, neoplastic lymphocytes contained in a blood sample can be differentiated from other blood cells to be detected. Accordingly, accuracy of classifying normal white blood cells (lymphocytes, monocytes, the blood cell group including neutrophils and basophils, and eosinophils) can be increased, and diagnosis of disease based on the classification can be performed more appropriately. Further, information useful for diagnosis of diseases such as chronic lymphocytic leukemia, malignant lymphoma, and the like can be provided to the user. - According to the present embodiment, necessity/unnecessity of re-demarcation, that is, whether there is a possibility of neoplastic lymphocytes being included, is determined based on the first demarcation process (S14). When re-demarcation is necessary (S14: YES), the second demarcation process is performed on a three-dimensional scattergram (S17). Accordingly, when there is no possibility of neoplastic lymphocytes being included, the second demarcation process, which is three-dimensional analysis, is not performed. Thus, burden of processing for classifying white blood cells can be reduced.
- According to the present embodiment, neoplastic lymphocytes contained in a blood sample are detected, differentiated from other blood cells, and blood cells contained in the blood sample can be classified into the four subclasses of white blood cell. The detection and classification in this case can be performed by using only a measurement specimen prepared by mixing a blood sample with the first reagent and the second reagent. That is, without separately preparing a measurement specimen in order to detect neoplastic lymphocytes, the above detection and classification can be performed by use of the measurement specimen prepared for classifying white blood cells.
- According to the present embodiment, in a case where neoplastic lymphocytes are contained (see
FIG. 5C ), neoplastic lymphocytes may be classified as normal lymphocytes in the first demarcation process in S12 as shown inFIG. 5B . However, in the second demarcation process in S17, neoplastic lymphocytes are classified separately from normal lymphocytes. Therefore, normal lymphocytes can be classified appropriately, and accuracy of classifying white blood cells can be increased. - According to the present embodiment, the first and second scattergrams are displayed on the analysis result screen 6. Accordingly, by referring to the first and second scattergrams, the user can easily understand the distribution state of each classified blood cell, and thus, information useful for diagnosis can be smoothly obtained.
- According to the present embodiment, the first scattergram is a two-dimensional distribution chart defined by axes of side scattered light signal and fluorescence signal, and the second scattergram is a two-dimensional distribution chart defined by axes of side scattered light signal and forward scattered light signal. Since combinations of signals that are used are different in this manner, the user can further easily understand the distribution state of white blood cells.
- According to the present embodiment, since the vertical axis of the first scattergram is fluorescence signal, distribution of blood cells whose nucleic acid is very active (for example, juvenile blood cells and the like) and which can be detected by use of fluorescence can be displayed. Further, with reference to the second scattergram shown in
FIGS. 10D and 10F , the user can view the clusters A21 to A25, which are separated in five groups as shown inFIG. 7B , in a state where the clusters A21 to A25 are isolated from one another. - According to the present embodiment, in the first and second scattergrams displayed on the analysis result screen 6, as described with reference to
FIGS. 10A to 10F , each dot corresponding to a blood cell is displayed in a color which differs in accordance with its classification. Accordingly, distribution of blood cells that have been classified can be more easily understood. Further, in this case, since dots corresponding to neoplastic lymphocytes are displayed in a color (red) different from other blood cells, distribution of neoplastic lymphocytes are more easily understood, and diagnosis of disease such as chronic lymphocytic leukemia, malignant lymphoma, and the like can be more easily performed. - It should be noted that since neoplastic lymphocyte also is a type of lymphocyte, dots corresponding to neoplastic lymphocytes may be displayed in the same color as that of dots corresponding to normal lymphocytes. That is, in the second scattergram shown in
FIGS. 10D and 10F , dots included in the cluster A25 may be displayed in the same color as that of dots included in the cluster A21. - According to the present embodiment, in S15 and S18, the number of blood cells included in each classification is counted. Further, the number and the proportion of blood cells classified into each of the four subclasses of white blood cell are displayed in the
region 61 of the analysis result screen 6, and the number and the proportion of blood cells classified as neoplastic lymphocytes are displayed in theregion 62 of the analysis result screen 6. Accordingly, the user can quantitatively understand how much blood cells classified in the four subclasses of white blood cell are contained in the measurement specimen, and how much neoplastic lymphocytes are contained in the measurement specimen. - In the present embodiment, in the
region 61, the number and the proportion of normal lymphocytes excluding neoplastic lymphocytes are displayed as the number of lymphocytes. However, the present invention is not limited thereto. Normal lymphocytes and neoplastic lymphocytes are collectively counted as lymphocytes, and in theregion 61, the total of the number of neoplastic lymphocytes and the number of normal lymphocytes may be displayed as the number of lymphocytes, and the proportion of this total number relative to all blood cells may be displayed as the proportion of lymphocytes. - According to the present embodiment, in S19, when the number of neoplastic lymphocytes is greater than or equal to a predetermined value, information indicating that the blood sample has a possibility of including neoplastic lymphocytes is displayed in the
region 63 of the analysis result screen 6. Accordingly, the user can further easily confirm a possibility of disease based on neoplastic lymphocytes. - An embodiment of the present invention has been described. However, the embodiment of the present invention is not limited thereto.
- For example, in the above embodiment, irrespective of the value of the determination flag, the first and second scattergrams are displayed on the analysis result screen 6. However, in accordance with the value of the determination flag, either of the first and second scattergrams may be displayed. Further, in a case where the second demarcation process has been performed on the three-dimensional scattergram, the three-dimensional scattergram may be displayed on the analysis result screen 6. Each dot on the three-dimensional scattergram in this case is displayed in a color corresponding to its classification, as in the case of
FIGS. 10C to 10F . - In the above embodiment, when the second demarcation process has been performed on the three-dimensional scattergram (S17), dots included in each of the clusters A21 to A25 are counted (S18), and based on the result of this counting, the number and the proportion of blood cells included in each of the four subclasses of white blood cell, and the number and the proportion of neoplastic lymphocytes are displayed on the analysis result screen 6 (S24). However, instead of this, on the three-dimensional scattergram, only dots included in the cluster A25, which correspond to neoplastic lymphocytes, are extracted and these dots are excluded from the first scattergram, whereby a first scattergram not including neoplastic lymphocytes can be re-configured. In this case, the above first demarcation process may be performed again on this re-configured first scattergram, and dots included in each of the clusters respectively corresponding to the four subclasses of white blood cell may be determined again. Then, dots included in these clusters and dots included in the cluster A25 of the three-dimensional scattergram are counted, and based on the result of this counting, the number and the proportion of each type of blood cells may be displayed on the analysis result screen 6.
- In the above embodiment, with reference to the second scattergram, the user can view the clusters A21 to A25, which are separated in five groups on the three-dimensional scattergram, in a state where the clusters A21 to A25 are isolated from one another, as shown in
FIGS. 10D and 10F . Therefore, in S17 inFIG. 6A , instead of the second demarcation process performed on the three-dimensional scattergram, a demarcation process on the second scattergram may be performed. It should be noted that, in order to accurately perform classification among the four subclasses of white blood cell and neoplastic lymphocyte, it is preferable to perform the second demarcation process based on the three-dimensional scattergram as in the above embodiment. - In the above embodiment, a measurement specimen is prepared by use of the first reagent for staining nucleic acid and the second reagent for hemolyzing red blood cells and damaging cell membranes of white blood cells to an extent that the fluorescent dye can permeate therethrough. However, the present invention is not limited thereto. The measurement specimen may be prepared by use of one reagent that can stain nucleic acid and that can hemolyze red blood cells and damage cell membranes of white blood cells.
- In addition to the above, various modifications of the embodiment of the present invention can be made as appropriate without departing from the scope of the technical idea defined by the claims.
Claims (14)
- A method for analyzing blood cells comprising:preparing a measurement specimen (S1) for classifying white blood cells, by mixing a sample with a reagent in order to hemolyze red blood cells contained in the sample and to fluorescently stain nucleic acid in white blood cells contained in the sample;detecting (S2), by flowing the measurement specimen in a flow cell, fluorescence emitted from each blood cell in the measurement specimen and two types of scattered light at respective different angles, and obtaining a fluorescence signal and two types of scattered light signals;characterized by further comprising:
creating a three-dimensional distribution chart (S17) defined by axes of forward scattered light signal, side scattered light signal, and fluorescence signal and classifying each dot corresponding to each blood cell using the three-dimensional distribution chart into any of four groups respectively corresponding to four subclasses of white blood cell or a cluster corresponding to neoplastic lymphocytes (A25), the four subclasses corresponding to a cluster of lymphocytes (A21), a cluster of monocytes (A22), a cluster of a blood cell group including neutrophils and basophils (A23), and a cluster of eosinophils (A24). - The method for analyzing blood cells of claim 1, wherein the two types of scattered light comprise first scattered light and second scattered light; and
the classifying comprises:first classification of classifying the white blood cells through analysis using parameters regarding the fluorescence and the first scattered light; andsecond classification of classifying the white blood cells and detecting the neoplastic lymphocytes through analysis using parameters regarding the fluorescence, the first scattered light, and the second scattered light. - The method for analyzing blood cells of claim 2, wherein
the second classification is performed in accordance with a result of the first classification. - The method for analyzing blood cells of claim 1, further comprising:
displaying a result of the classifying on a display unit (41). - The method for analyzing blood cells of claim 4, wherein
the displaying comprises displaying, on the display unit (41), a white blood cell distribution chart in two or more dimensions, as the result of the classifying. - The method for analyzing blood cells of claim 5, wherein
the displaying comprises displaying, on the display unit (41), a first white blood cell distribution chart based on a combination of two types of parameters selected from the three types of parameters, and a second white blood cell distribution chart based on a combination of two types of parameters different from the aforesaid combination, as the result of the classifying. - The method for analyzing blood cells of claim 6, whereinthe first white blood cell distribution chart is based on at least a parameter regarding the fluorescence, andthe second white blood cell distribution chart is based on at least parameters regarding the two types of scattered light.
- The method for analyzing blood cells of claim 5, wherein
in the white blood cell distribution chart, distribution of the white blood cells is shown in colors which are different in accordance with classifications of the white blood cells. - The method for analyzing blood cells of claim 8, wherein
in the white blood cell distribution chart, distribution of the neoplastic lymphocytes is shown in a color identical to a color for normal lymphocytes. - The method for analyzing blood cells of claim 8, wherein
in the white blood cell distribution chart, distribution of the neoplastic lymphocytes is shown in a color different from colors for other blood cells. - The method for analyzing blood cells of claim 4, whereinthe classifying comprises counting the number of blood cells included in each classification, andthe displaying displays, on the display unit (41), information regarding the counted number of blood cells included in each classification.
- The method for analyzing blood cells of claim 11, whereinthe classifying comprises counting the number of the neoplastic lymphocytes, andthe displaying displays, on the display unit (41), information regarding a result of the counting of the number of the neoplastic lymphocytes.
- The method for analyzing blood cells of claim 12, wherein
the displaying displays, on the display unit (41), information indicating that the sample has a possibility of including the neoplastic lymphocytes, in accordance with the result of the counting of the number of the neoplastic lymphocytes. - A blood cell analyzer comprising:a specimen preparation section (25) configured to prepare a measurement specimen for classifying white blood cells, by mixing a sample with a reagent in order to hemolyze red blood cells contained in the sample and to fluorescently stain nucleic acid in white blood cells contained in the sample;a detection section (26) configured to detect fluorescence emitted from each blood cell in the measurement specimen and two types of scattered light at respective different angles, and configured to output a fluorescence signal and two types of scattered light signals;characterized by further comprising:
an information processing unit (4) configured to create a three-dimensional distribution chart defined by axes of forward scattered light signal, side scattered light signal, and fluorescence signal and classifying each dot corresponding to each blood cell using the three-dimensional distribution chart into any of four groups respectively corresponding to four subclasses of white blood cell or a cluster corresponding to neoplastic lymphocytes (A25), the four subclasses corresponding to a cluster of lymphocytes (A21), a cluster of monocytes (A22), a cluster of a blood cell group including neutrophils and basophils (A23), and a cluster of eosinophils (A24).
Applications Claiming Priority (1)
| Application Number | Priority Date | Filing Date | Title |
|---|---|---|---|
| JP2012258004A JP6001425B2 (en) | 2012-11-26 | 2012-11-26 | Blood cell analysis method, blood cell analyzer and program |
Publications (3)
| Publication Number | Publication Date |
|---|---|
| EP2735859A2 EP2735859A2 (en) | 2014-05-28 |
| EP2735859A3 EP2735859A3 (en) | 2018-01-03 |
| EP2735859B1 true EP2735859B1 (en) | 2020-02-12 |
Family
ID=49596180
Family Applications (1)
| Application Number | Title | Priority Date | Filing Date |
|---|---|---|---|
| EP13193634.6A Active EP2735859B1 (en) | 2012-11-26 | 2013-11-20 | Method for analyzing blood cells and blood cell analyzer |
Country Status (4)
| Country | Link |
|---|---|
| US (1) | US9329172B2 (en) |
| EP (1) | EP2735859B1 (en) |
| JP (1) | JP6001425B2 (en) |
| CN (1) | CN103837502B (en) |
Families Citing this family (27)
| Publication number | Priority date | Publication date | Assignee | Title |
|---|---|---|---|---|
| JP6461494B2 (en) * | 2014-06-19 | 2019-01-30 | シスメックス株式会社 | Blood analyzer, blood analysis method and blood analysis program |
| JP6318026B2 (en) * | 2014-06-26 | 2018-04-25 | アズビル株式会社 | Particle detection apparatus and particle detection method |
| US10625259B1 (en) | 2014-11-26 | 2020-04-21 | Medica Corporation | Automated microscopic cell analysis |
| US20170328924A1 (en) | 2014-11-26 | 2017-11-16 | Ronald Jones | Automated microscopic cell analysis |
| US11478789B2 (en) | 2014-11-26 | 2022-10-25 | Medica Corporation | Automated microscopic cell analysis |
| US20160238627A1 (en) | 2015-02-13 | 2016-08-18 | Abbott Laboratories | Decapping and capping apparatus, systems and methods for use in diagnostic analyzers |
| JP6622007B2 (en) * | 2015-05-29 | 2019-12-18 | オリンパス株式会社 | Cell evaluation method |
| JP6680492B2 (en) * | 2015-09-11 | 2020-04-15 | シスメックス株式会社 | Cell analyzer and cell analysis method |
| JP6710512B2 (en) * | 2015-09-14 | 2020-06-17 | シスメックス株式会社 | Blood analysis device, blood analysis method, and computer program |
| CN108072637B (en) * | 2016-11-15 | 2023-05-26 | 深圳市帝迈生物技术有限公司 | Flow quantum dot blood multi-component analysis system and analysis method |
| KR101871897B1 (en) * | 2017-02-23 | 2018-07-02 | (주)바이오액츠 | A reagent for analysis of blood and preparation method therof |
| CN110023760B (en) * | 2017-06-02 | 2023-04-14 | 李宗均 | Diagnostic tool for evaluating immunity and providing colorectal cancer morbidity information by using distribution difference of immune cells in peripheral blood of colorectal cancer patients and normal people |
| JP6903494B2 (en) * | 2017-06-09 | 2021-07-14 | シスメックス株式会社 | Particle analysis methods for identifying infectious diseases |
| JP7002245B2 (en) | 2017-08-10 | 2022-01-20 | シスメックス株式会社 | Blood analyzers, blood analysis methods and programs |
| US11047845B1 (en) | 2017-11-15 | 2021-06-29 | Medica Corporation | Control material and methods for cell analyzers |
| CN108169081B (en) * | 2017-12-14 | 2021-06-04 | 四川大学华西医院 | Differential value checking method for blood cell analysis and application method thereof |
| CN111684263A (en) * | 2018-04-28 | 2020-09-18 | 深圳迈瑞生物医疗电子股份有限公司 | Blood analysis system, blood analyzer, blood analysis method, and storage medium |
| CN111656188B (en) * | 2018-04-28 | 2021-10-12 | 深圳迈瑞生物医疗电子股份有限公司 | Reagent, method for analyzing platelet and blood cell analyzer |
| CN109239016B (en) * | 2018-09-11 | 2021-03-26 | 深圳市国赛生物技术有限公司 | Blood sample detection method and device and readable storage medium |
| JP7352365B2 (en) * | 2019-03-22 | 2023-09-28 | シスメックス株式会社 | Cell analysis method, deep learning algorithm training method, cell analysis device, deep learning algorithm training device, cell analysis program, and deep learning algorithm training program |
| CN111274949B (en) * | 2020-01-19 | 2023-05-30 | 重庆医科大学附属第一医院 | Blood disease white blood cell scatter diagram similarity analysis method based on structural analysis |
| CN114252386A (en) * | 2020-09-23 | 2022-03-29 | 深圳迈瑞生物医疗电子股份有限公司 | Sample detection method and sample analyzer |
| CN115885166A (en) * | 2020-09-24 | 2023-03-31 | 深圳迈瑞生物医疗电子股份有限公司 | Sample analyzer, sample analyzing method, and computer-readable storage medium |
| CN114281283B (en) * | 2020-09-27 | 2023-03-24 | 深圳市帝迈生物技术有限公司 | Display method of scattered point image, sample analysis equipment and related device |
| JP7374943B2 (en) | 2021-02-26 | 2023-11-07 | シスメックス株式会社 | Display method and sample analyzer |
| CN113218847A (en) * | 2021-04-12 | 2021-08-06 | 武汉凯普瑞生物技术有限公司 | Hemolytic agent for flow cytometry analysis and preparation method and application method thereof |
| EP4174488A4 (en) * | 2021-08-31 | 2023-10-11 | Shenzhen Mindray Animal Medical Technology Co., Ltd. | Specimen analysis apparatus and specimen analysis method |
Citations (1)
| Publication number | Priority date | Publication date | Assignee | Title |
|---|---|---|---|---|
| US20110027788A1 (en) * | 2009-07-31 | 2011-02-03 | Shenzhen Mindray Bio-Medical Electronics Co., Ltd. | Reagent and kit for classifying and counting leukocytes, the preparation thereof, and process for classifying and counting leukocytes |
Family Cites Families (14)
| Publication number | Priority date | Publication date | Assignee | Title |
|---|---|---|---|---|
| JP3076118B2 (en) | 1991-11-27 | 2000-08-14 | シスメックス株式会社 | Particle counting method |
| DE69327775T2 (en) * | 1992-11-19 | 2000-06-21 | Sysmex Corp | Pretreatment procedure for blood analysis |
| JP2007024844A (en) * | 2005-07-21 | 2007-02-01 | Sysmex Corp | Method and system for hemanalysis |
| JP4248017B2 (en) | 2005-10-28 | 2009-04-02 | シスメックス株式会社 | White blood cell classification and counting method and white blood cell classification and counting reagent kit |
| JP4976038B2 (en) | 2006-03-29 | 2012-07-18 | シスメックス株式会社 | Method for measuring hematological samples |
| JP4796443B2 (en) | 2006-06-08 | 2011-10-19 | シスメックス株式会社 | Reagent for sample analysis, reagent kit for sample analysis, and sample analysis method |
| JP4806334B2 (en) * | 2006-11-27 | 2011-11-02 | シスメックス株式会社 | Method and apparatus for measuring hematological samples |
| JP5259305B2 (en) | 2007-10-03 | 2013-08-07 | シスメックス株式会社 | Cell analysis apparatus and cell analysis method |
| EP2280278A4 (en) * | 2008-05-09 | 2015-04-08 | Sysmex Corp | Blood analyzer, blood analysis method and hemolytic agent |
| JP5166208B2 (en) | 2008-10-28 | 2013-03-21 | シスメックス株式会社 | Sample analyzer, calibration method for sample analyzer, and computer program |
| JP5452058B2 (en) | 2009-03-31 | 2014-03-26 | シスメックス株式会社 | Blood analyzer |
| CN102472738B (en) | 2009-07-03 | 2014-08-06 | 希森美康株式会社 | Blood analyzer and blood analyzing method |
| JP5943909B2 (en) * | 2011-04-28 | 2016-07-05 | シスメックス株式会社 | Blood analyzer, blood analysis method, and computer program |
| EP2520926B1 (en) * | 2011-05-05 | 2022-06-15 | Sysmex Corporation | Blood analyzer, blood analysis method, and computer program product |
-
2012
- 2012-11-26 JP JP2012258004A patent/JP6001425B2/en active Active
-
2013
- 2013-11-19 US US14/084,022 patent/US9329172B2/en active Active
- 2013-11-20 CN CN201310584768.3A patent/CN103837502B/en active Active
- 2013-11-20 EP EP13193634.6A patent/EP2735859B1/en active Active
Patent Citations (1)
| Publication number | Priority date | Publication date | Assignee | Title |
|---|---|---|---|---|
| US20110027788A1 (en) * | 2009-07-31 | 2011-02-03 | Shenzhen Mindray Bio-Medical Electronics Co., Ltd. | Reagent and kit for classifying and counting leukocytes, the preparation thereof, and process for classifying and counting leukocytes |
Also Published As
| Publication number | Publication date |
|---|---|
| EP2735859A3 (en) | 2018-01-03 |
| US20140147837A1 (en) | 2014-05-29 |
| JP2014106059A (en) | 2014-06-09 |
| CN103837502A (en) | 2014-06-04 |
| US9329172B2 (en) | 2016-05-03 |
| CN103837502B (en) | 2018-09-11 |
| EP2735859A2 (en) | 2014-05-28 |
| JP6001425B2 (en) | 2016-10-05 |
Similar Documents
| Publication | Publication Date | Title |
|---|---|---|
| EP2735859B1 (en) | Method for analyzing blood cells and blood cell analyzer | |
| EP2520926B1 (en) | Blood analyzer, blood analysis method, and computer program product | |
| US20160202170A1 (en) | Blood analyzer, blood analysis method, and computer program product | |
| US9453790B2 (en) | Blood analyzer, blood analyzing method, and computer program product | |
| EP2237019B1 (en) | Blood analyzer, method and computer program for determining existence and nonexistence of lymphoblasts in blood sample | |
| US8524505B2 (en) | Blood analyzer and blood analyzing method | |
| US7892850B2 (en) | Apparatus and method for measuring immature platelets | |
| US20200326332A1 (en) | Method for classifying/counting leukocytes, reagent kit for classifying leukocytes, and reagent for classifying leukocytes | |
| EP2587262B1 (en) | Detection method of activated neutrophils and apparatus therefor | |
| JP6092132B2 (en) | Blood cell analyzer | |
| EP3141884B1 (en) | Tumor cell analyzer and tumor cell analyzing method | |
| US20230296522A1 (en) | Measurement apparatus and analysis method | |
| JP2023137147A (en) | Method for classifying leucocyte to subset |
Legal Events
| Date | Code | Title | Description |
|---|---|---|---|
| PUAI | Public reference made under article 153(3) epc to a published international application that has entered the european phase |
Free format text: ORIGINAL CODE: 0009012 |
|
| 17P | Request for examination filed |
Effective date: 20131120 |
|
| AK | Designated contracting states |
Kind code of ref document: A2 Designated state(s): AL AT BE BG CH CY CZ DE DK EE ES FI FR GB GR HR HU IE IS IT LI LT LU LV MC MK MT NL NO PL PT RO RS SE SI SK SM TR |
|
| AX | Request for extension of the european patent |
Extension state: BA ME |
|
| PUAL | Search report despatched |
Free format text: ORIGINAL CODE: 0009013 |
|
| AK | Designated contracting states |
Kind code of ref document: A3 Designated state(s): AL AT BE BG CH CY CZ DE DK EE ES FI FR GB GR HR HU IE IS IT LI LT LU LV MC MK MT NL NO PL PT RO RS SE SI SK SM TR |
|
| AX | Request for extension of the european patent |
Extension state: BA ME |
|
| RIC1 | Information provided on ipc code assigned before grant |
Ipc: G01N 15/10 20060101ALN20171129BHEP Ipc: G01N 15/00 20060101ALN20171129BHEP Ipc: G01N 33/50 20060101ALI20171129BHEP Ipc: G01N 15/14 20060101AFI20171129BHEP |
|
| STAA | Information on the status of an ep patent application or granted ep patent |
Free format text: STATUS: REQUEST FOR EXAMINATION WAS MADE |
|
| R17P | Request for examination filed (corrected) |
Effective date: 20180607 |
|
| RBV | Designated contracting states (corrected) |
Designated state(s): AL AT BE BG CH CY CZ DE DK EE ES FI FR GB GR HR HU IE IS IT LI LT LU LV MC MK MT NL NO PL PT RO RS SE SI SK SM TR |
|
| STAA | Information on the status of an ep patent application or granted ep patent |
Free format text: STATUS: EXAMINATION IS IN PROGRESS |
|
| 17Q | First examination report despatched |
Effective date: 20180807 |
|
| RIC1 | Information provided on ipc code assigned before grant |
Ipc: G01N 33/50 20060101ALI20180731BHEP Ipc: G01N 15/00 20060101ALN20180731BHEP Ipc: G01N 15/10 20060101ALN20180731BHEP Ipc: G01N 15/14 20060101AFI20180731BHEP |
|
| GRAP | Despatch of communication of intention to grant a patent |
Free format text: ORIGINAL CODE: EPIDOSNIGR1 |
|
| STAA | Information on the status of an ep patent application or granted ep patent |
Free format text: STATUS: GRANT OF PATENT IS INTENDED |
|
| RIC1 | Information provided on ipc code assigned before grant |
Ipc: G01N 15/10 20060101ALN20190919BHEP Ipc: G01N 15/14 20060101AFI20190919BHEP Ipc: G01N 15/00 20060101ALN20190919BHEP Ipc: G01N 33/50 20060101ALI20190919BHEP |
|
| INTG | Intention to grant announced |
Effective date: 20191016 |
|
| GRAS | Grant fee paid |
Free format text: ORIGINAL CODE: EPIDOSNIGR3 |
|
| GRAA | (expected) grant |
Free format text: ORIGINAL CODE: 0009210 |
|
| STAA | Information on the status of an ep patent application or granted ep patent |
Free format text: STATUS: THE PATENT HAS BEEN GRANTED |
|
| AK | Designated contracting states |
Kind code of ref document: B1 Designated state(s): AL AT BE BG CH CY CZ DE DK EE ES FI FR GB GR HR HU IE IS IT LI LT LU LV MC MK MT NL NO PL PT RO RS SE SI SK SM TR |
|
| REG | Reference to a national code |
Ref country code: GB Ref legal event code: FG4D |
|
| REG | Reference to a national code |
Ref country code: CH Ref legal event code: EP |
|
| REG | Reference to a national code |
Ref country code: AT Ref legal event code: REF Ref document number: 1232782 Country of ref document: AT Kind code of ref document: T Effective date: 20200215 |
|
| REG | Reference to a national code |
Ref country code: IE Ref legal event code: FG4D |
|
| REG | Reference to a national code |
Ref country code: DE Ref legal event code: R096 Ref document number: 602013065649 Country of ref document: DE |
|
| PG25 | Lapsed in a contracting state [announced via postgrant information from national office to epo] |
Ref country code: FI Free format text: LAPSE BECAUSE OF FAILURE TO SUBMIT A TRANSLATION OF THE DESCRIPTION OR TO PAY THE FEE WITHIN THE PRESCRIBED TIME-LIMIT Effective date: 20200212 Ref country code: NO Free format text: LAPSE BECAUSE OF FAILURE TO SUBMIT A TRANSLATION OF THE DESCRIPTION OR TO PAY THE FEE WITHIN THE PRESCRIBED TIME-LIMIT Effective date: 20200512 Ref country code: RS Free format text: LAPSE BECAUSE OF FAILURE TO SUBMIT A TRANSLATION OF THE DESCRIPTION OR TO PAY THE FEE WITHIN THE PRESCRIBED TIME-LIMIT Effective date: 20200212 |
|
| REG | Reference to a national code |
Ref country code: LT Ref legal event code: MG4D |
|
| REG | Reference to a national code |
Ref country code: NL Ref legal event code: MP Effective date: 20200212 |
|
| PG25 | Lapsed in a contracting state [announced via postgrant information from national office to epo] |
Ref country code: HR Free format text: LAPSE BECAUSE OF FAILURE TO SUBMIT A TRANSLATION OF THE DESCRIPTION OR TO PAY THE FEE WITHIN THE PRESCRIBED TIME-LIMIT Effective date: 20200212 Ref country code: GR Free format text: LAPSE BECAUSE OF FAILURE TO SUBMIT A TRANSLATION OF THE DESCRIPTION OR TO PAY THE FEE WITHIN THE PRESCRIBED TIME-LIMIT Effective date: 20200513 Ref country code: SE Free format text: LAPSE BECAUSE OF FAILURE TO SUBMIT A TRANSLATION OF THE DESCRIPTION OR TO PAY THE FEE WITHIN THE PRESCRIBED TIME-LIMIT Effective date: 20200212 Ref country code: LV Free format text: LAPSE BECAUSE OF FAILURE TO SUBMIT A TRANSLATION OF THE DESCRIPTION OR TO PAY THE FEE WITHIN THE PRESCRIBED TIME-LIMIT Effective date: 20200212 Ref country code: IS Free format text: LAPSE BECAUSE OF FAILURE TO SUBMIT A TRANSLATION OF THE DESCRIPTION OR TO PAY THE FEE WITHIN THE PRESCRIBED TIME-LIMIT Effective date: 20200612 Ref country code: BG Free format text: LAPSE BECAUSE OF FAILURE TO SUBMIT A TRANSLATION OF THE DESCRIPTION OR TO PAY THE FEE WITHIN THE PRESCRIBED TIME-LIMIT Effective date: 20200512 |
|
| PG25 | Lapsed in a contracting state [announced via postgrant information from national office to epo] |
Ref country code: NL Free format text: LAPSE BECAUSE OF FAILURE TO SUBMIT A TRANSLATION OF THE DESCRIPTION OR TO PAY THE FEE WITHIN THE PRESCRIBED TIME-LIMIT Effective date: 20200212 |
|
| PG25 | Lapsed in a contracting state [announced via postgrant information from national office to epo] |
Ref country code: ES Free format text: LAPSE BECAUSE OF FAILURE TO SUBMIT A TRANSLATION OF THE DESCRIPTION OR TO PAY THE FEE WITHIN THE PRESCRIBED TIME-LIMIT Effective date: 20200212 Ref country code: CZ Free format text: LAPSE BECAUSE OF FAILURE TO SUBMIT A TRANSLATION OF THE DESCRIPTION OR TO PAY THE FEE WITHIN THE PRESCRIBED TIME-LIMIT Effective date: 20200212 Ref country code: RO Free format text: LAPSE BECAUSE OF FAILURE TO SUBMIT A TRANSLATION OF THE DESCRIPTION OR TO PAY THE FEE WITHIN THE PRESCRIBED TIME-LIMIT Effective date: 20200212 Ref country code: EE Free format text: LAPSE BECAUSE OF FAILURE TO SUBMIT A TRANSLATION OF THE DESCRIPTION OR TO PAY THE FEE WITHIN THE PRESCRIBED TIME-LIMIT Effective date: 20200212 Ref country code: LT Free format text: LAPSE BECAUSE OF FAILURE TO SUBMIT A TRANSLATION OF THE DESCRIPTION OR TO PAY THE FEE WITHIN THE PRESCRIBED TIME-LIMIT Effective date: 20200212 Ref country code: DK Free format text: LAPSE BECAUSE OF FAILURE TO SUBMIT A TRANSLATION OF THE DESCRIPTION OR TO PAY THE FEE WITHIN THE PRESCRIBED TIME-LIMIT Effective date: 20200212 Ref country code: PT Free format text: LAPSE BECAUSE OF FAILURE TO SUBMIT A TRANSLATION OF THE DESCRIPTION OR TO PAY THE FEE WITHIN THE PRESCRIBED TIME-LIMIT Effective date: 20200705 Ref country code: SM Free format text: LAPSE BECAUSE OF FAILURE TO SUBMIT A TRANSLATION OF THE DESCRIPTION OR TO PAY THE FEE WITHIN THE PRESCRIBED TIME-LIMIT Effective date: 20200212 Ref country code: SK Free format text: LAPSE BECAUSE OF FAILURE TO SUBMIT A TRANSLATION OF THE DESCRIPTION OR TO PAY THE FEE WITHIN THE PRESCRIBED TIME-LIMIT Effective date: 20200212 |
|
| REG | Reference to a national code |
Ref country code: DE Ref legal event code: R097 Ref document number: 602013065649 Country of ref document: DE |
|
| REG | Reference to a national code |
Ref country code: AT Ref legal event code: MK05 Ref document number: 1232782 Country of ref document: AT Kind code of ref document: T Effective date: 20200212 |
|
| PLBE | No opposition filed within time limit |
Free format text: ORIGINAL CODE: 0009261 |
|
| STAA | Information on the status of an ep patent application or granted ep patent |
Free format text: STATUS: NO OPPOSITION FILED WITHIN TIME LIMIT |
|
| 26N | No opposition filed |
Effective date: 20201113 |
|
| PG25 | Lapsed in a contracting state [announced via postgrant information from national office to epo] |
Ref country code: AT Free format text: LAPSE BECAUSE OF FAILURE TO SUBMIT A TRANSLATION OF THE DESCRIPTION OR TO PAY THE FEE WITHIN THE PRESCRIBED TIME-LIMIT Effective date: 20200212 Ref country code: IT Free format text: LAPSE BECAUSE OF FAILURE TO SUBMIT A TRANSLATION OF THE DESCRIPTION OR TO PAY THE FEE WITHIN THE PRESCRIBED TIME-LIMIT Effective date: 20200212 |
|
| PG25 | Lapsed in a contracting state [announced via postgrant information from national office to epo] |
Ref country code: PL Free format text: LAPSE BECAUSE OF FAILURE TO SUBMIT A TRANSLATION OF THE DESCRIPTION OR TO PAY THE FEE WITHIN THE PRESCRIBED TIME-LIMIT Effective date: 20200212 Ref country code: SI Free format text: LAPSE BECAUSE OF FAILURE TO SUBMIT A TRANSLATION OF THE DESCRIPTION OR TO PAY THE FEE WITHIN THE PRESCRIBED TIME-LIMIT Effective date: 20200212 |
|
| PG25 | Lapsed in a contracting state [announced via postgrant information from national office to epo] |
Ref country code: MC Free format text: LAPSE BECAUSE OF FAILURE TO SUBMIT A TRANSLATION OF THE DESCRIPTION OR TO PAY THE FEE WITHIN THE PRESCRIBED TIME-LIMIT Effective date: 20200212 |
|
| REG | Reference to a national code |
Ref country code: CH Ref legal event code: PL |
|
| PG25 | Lapsed in a contracting state [announced via postgrant information from national office to epo] |
Ref country code: LU Free format text: LAPSE BECAUSE OF NON-PAYMENT OF DUE FEES Effective date: 20201120 |
|
| REG | Reference to a national code |
Ref country code: BE Ref legal event code: MM Effective date: 20201130 |
|
| PG25 | Lapsed in a contracting state [announced via postgrant information from national office to epo] |
Ref country code: LI Free format text: LAPSE BECAUSE OF NON-PAYMENT OF DUE FEES Effective date: 20201130 Ref country code: CH Free format text: LAPSE BECAUSE OF NON-PAYMENT OF DUE FEES Effective date: 20201130 |
|
| PG25 | Lapsed in a contracting state [announced via postgrant information from national office to epo] |
Ref country code: IE Free format text: LAPSE BECAUSE OF NON-PAYMENT OF DUE FEES Effective date: 20201120 |
|
| PG25 | Lapsed in a contracting state [announced via postgrant information from national office to epo] |
Ref country code: TR Free format text: LAPSE BECAUSE OF FAILURE TO SUBMIT A TRANSLATION OF THE DESCRIPTION OR TO PAY THE FEE WITHIN THE PRESCRIBED TIME-LIMIT Effective date: 20200212 Ref country code: MT Free format text: LAPSE BECAUSE OF FAILURE TO SUBMIT A TRANSLATION OF THE DESCRIPTION OR TO PAY THE FEE WITHIN THE PRESCRIBED TIME-LIMIT Effective date: 20200212 Ref country code: CY Free format text: LAPSE BECAUSE OF FAILURE TO SUBMIT A TRANSLATION OF THE DESCRIPTION OR TO PAY THE FEE WITHIN THE PRESCRIBED TIME-LIMIT Effective date: 20200212 |
|
| PG25 | Lapsed in a contracting state [announced via postgrant information from national office to epo] |
Ref country code: MK Free format text: LAPSE BECAUSE OF FAILURE TO SUBMIT A TRANSLATION OF THE DESCRIPTION OR TO PAY THE FEE WITHIN THE PRESCRIBED TIME-LIMIT Effective date: 20200212 Ref country code: AL Free format text: LAPSE BECAUSE OF FAILURE TO SUBMIT A TRANSLATION OF THE DESCRIPTION OR TO PAY THE FEE WITHIN THE PRESCRIBED TIME-LIMIT Effective date: 20200212 |
|
| PG25 | Lapsed in a contracting state [announced via postgrant information from national office to epo] |
Ref country code: BE Free format text: LAPSE BECAUSE OF NON-PAYMENT OF DUE FEES Effective date: 20201130 |
|
| PGFP | Annual fee paid to national office [announced via postgrant information from national office to epo] |
Ref country code: GB Payment date: 20230928 Year of fee payment: 11 |
|
| PGFP | Annual fee paid to national office [announced via postgrant information from national office to epo] |
Ref country code: FR Payment date: 20230929 Year of fee payment: 11 |
|
| PGFP | Annual fee paid to national office [announced via postgrant information from national office to epo] |
Ref country code: DE Payment date: 20230929 Year of fee payment: 11 |