EP2700038B1 - Analyzing the expression of biomarkers in cells with moments - Google Patents
Analyzing the expression of biomarkers in cells with moments Download PDFInfo
- Publication number
- EP2700038B1 EP2700038B1 EP12717662.6A EP12717662A EP2700038B1 EP 2700038 B1 EP2700038 B1 EP 2700038B1 EP 12717662 A EP12717662 A EP 12717662A EP 2700038 B1 EP2700038 B1 EP 2700038B1
- Authority
- EP
- European Patent Office
- Prior art keywords
- cell
- view
- moments
- biomarkers
- association
- Prior art date
- Legal status (The legal status is an assumption and is not a legal conclusion. Google has not performed a legal analysis and makes no representation as to the accuracy of the status listed.)
- Active
Links
- 239000000090 biomarker Substances 0.000 title claims description 92
- 238000000034 method Methods 0.000 claims description 99
- 230000004083 survival effect Effects 0.000 claims description 42
- 201000010099 disease Diseases 0.000 claims description 33
- 208000037265 diseases, disorders, signs and symptoms Diseases 0.000 claims description 33
- 230000000877 morphologic effect Effects 0.000 claims description 21
- 238000003745 diagnosis Methods 0.000 claims description 15
- 230000004044 response Effects 0.000 claims description 15
- 238000004393 prognosis Methods 0.000 claims description 14
- 238000003860 storage Methods 0.000 claims description 14
- 238000013145 classification model Methods 0.000 claims description 10
- 238000003384 imaging method Methods 0.000 claims description 6
- 210000004027 cell Anatomy 0.000 description 256
- 210000001519 tissue Anatomy 0.000 description 60
- 206010028980 Neoplasm Diseases 0.000 description 37
- 201000011510 cancer Diseases 0.000 description 31
- 238000005259 measurement Methods 0.000 description 29
- 238000004458 analytical method Methods 0.000 description 25
- 239000012528 membrane Substances 0.000 description 21
- 239000000523 sample Substances 0.000 description 21
- 210000004940 nucleus Anatomy 0.000 description 19
- 210000000805 cytoplasm Anatomy 0.000 description 18
- 239000003550 marker Substances 0.000 description 14
- 206010060862 Prostate cancer Diseases 0.000 description 10
- 208000000236 Prostatic Neoplasms Diseases 0.000 description 10
- 238000004422 calculation algorithm Methods 0.000 description 9
- 230000008569 process Effects 0.000 description 9
- 238000007637 random forest analysis Methods 0.000 description 9
- 238000001914 filtration Methods 0.000 description 8
- 238000003908 quality control method Methods 0.000 description 8
- 238000010186 staining Methods 0.000 description 8
- 238000012360 testing method Methods 0.000 description 7
- 210000004379 membrane Anatomy 0.000 description 6
- 230000000007 visual effect Effects 0.000 description 6
- 238000004061 bleaching Methods 0.000 description 5
- 238000004138 cluster model Methods 0.000 description 5
- 238000001356 surgical procedure Methods 0.000 description 5
- AVPYQKSLYISFPO-UHFFFAOYSA-N 4-chlorobenzaldehyde Chemical compound ClC1=CC=C(C=O)C=C1 AVPYQKSLYISFPO-UHFFFAOYSA-N 0.000 description 4
- 102000015735 Beta-catenin Human genes 0.000 description 4
- 108060000903 Beta-catenin Proteins 0.000 description 4
- 102100036360 Cadherin-3 Human genes 0.000 description 4
- 101000714553 Homo sapiens Cadherin-3 Proteins 0.000 description 4
- 238000013528 artificial neural network Methods 0.000 description 4
- 210000003855 cell nucleus Anatomy 0.000 description 4
- 238000007621 cluster analysis Methods 0.000 description 4
- 238000001506 fluorescence spectroscopy Methods 0.000 description 4
- 238000010606 normalization Methods 0.000 description 4
- 230000011218 segmentation Effects 0.000 description 4
- 238000012549 training Methods 0.000 description 4
- 206010006187 Breast cancer Diseases 0.000 description 3
- 208000026310 Breast neoplasm Diseases 0.000 description 3
- 102000011782 Keratins Human genes 0.000 description 3
- 108010076876 Keratins Proteins 0.000 description 3
- 238000013459 approach Methods 0.000 description 3
- 238000004364 calculation method Methods 0.000 description 3
- 210000000170 cell membrane Anatomy 0.000 description 3
- 238000013264 cohort analysis Methods 0.000 description 3
- 230000000694 effects Effects 0.000 description 3
- 230000006870 function Effects 0.000 description 3
- 238000011065 in-situ storage Methods 0.000 description 3
- 238000012545 processing Methods 0.000 description 3
- 102000004169 proteins and genes Human genes 0.000 description 3
- 108090000623 proteins and genes Proteins 0.000 description 3
- 239000000126 substance Substances 0.000 description 3
- FWBHETKCLVMNFS-UHFFFAOYSA-N 4',6-Diamino-2-phenylindol Chemical compound C1=CC(C(=N)N)=CC=C1C1=CC2=CC=C(C(N)=N)C=C2N1 FWBHETKCLVMNFS-UHFFFAOYSA-N 0.000 description 2
- WSFSSNUMVMOOMR-UHFFFAOYSA-N Formaldehyde Chemical compound O=C WSFSSNUMVMOOMR-UHFFFAOYSA-N 0.000 description 2
- 208000008839 Kidney Neoplasms Diseases 0.000 description 2
- 206010038389 Renal cancer Diseases 0.000 description 2
- 238000013103 analytical ultracentrifugation Methods 0.000 description 2
- 230000001413 cellular effect Effects 0.000 description 2
- 238000010224 classification analysis Methods 0.000 description 2
- 238000004891 communication Methods 0.000 description 2
- 201000010982 kidney cancer Diseases 0.000 description 2
- 238000007477 logistic regression Methods 0.000 description 2
- 230000003287 optical effect Effects 0.000 description 2
- 230000002093 peripheral effect Effects 0.000 description 2
- 210000002307 prostate Anatomy 0.000 description 2
- 230000035945 sensitivity Effects 0.000 description 2
- 102000008394 Immunoglobulin Fragments Human genes 0.000 description 1
- 108010021625 Immunoglobulin Fragments Proteins 0.000 description 1
- -1 PI3Kp110a Proteins 0.000 description 1
- 208000018737 Parkinson disease Diseases 0.000 description 1
- 238000007475 c-index Methods 0.000 description 1
- 230000015556 catabolic process Effects 0.000 description 1
- 238000004113 cell culture Methods 0.000 description 1
- 238000012937 correction Methods 0.000 description 1
- 230000001351 cycling effect Effects 0.000 description 1
- 230000001086 cytosolic effect Effects 0.000 description 1
- 102000052116 epidermal growth factor receptor activity proteins Human genes 0.000 description 1
- 108700015053 epidermal growth factor receptor activity proteins Proteins 0.000 description 1
- 230000007274 generation of a signal involved in cell-cell signaling Effects 0.000 description 1
- 238000005286 illumination Methods 0.000 description 1
- 238000010191 image analysis Methods 0.000 description 1
- 238000003364 immunohistochemistry Methods 0.000 description 1
- 238000001727 in vivo Methods 0.000 description 1
- 230000003902 lesion Effects 0.000 description 1
- 230000004807 localization Effects 0.000 description 1
- 238000010801 machine learning Methods 0.000 description 1
- 238000010339 medical test Methods 0.000 description 1
- YOHYSYJDKVYCJI-UHFFFAOYSA-N n-[3-[[6-[3-(trifluoromethyl)anilino]pyrimidin-4-yl]amino]phenyl]cyclopropanecarboxamide Chemical compound FC(F)(F)C1=CC=CC(NC=2N=CN=C(NC=3C=C(NC(=O)C4CC4)C=CC=3)C=2)=C1 YOHYSYJDKVYCJI-UHFFFAOYSA-N 0.000 description 1
- 210000000056 organ Anatomy 0.000 description 1
- 239000012188 paraffin wax Substances 0.000 description 1
- 238000011160 research Methods 0.000 description 1
- 238000012827 research and development Methods 0.000 description 1
- 238000005070 sampling Methods 0.000 description 1
- 238000002560 therapeutic procedure Methods 0.000 description 1
- 238000012800 visualization Methods 0.000 description 1
Images


Classifications
-
- G—PHYSICS
- G01—MEASURING; TESTING
- G01N—INVESTIGATING OR ANALYSING MATERIALS BY DETERMINING THEIR CHEMICAL OR PHYSICAL PROPERTIES
- G01N33/00—Investigating or analysing materials by specific methods not covered by groups G01N1/00 - G01N31/00
- G01N33/48—Biological material, e.g. blood, urine; Haemocytometers
- G01N33/50—Chemical analysis of biological material, e.g. blood, urine; Testing involving biospecific ligand binding methods; Immunological testing
- G01N33/53—Immunoassay; Biospecific binding assay; Materials therefor
- G01N33/574—Immunoassay; Biospecific binding assay; Materials therefor for cancer
- G01N33/57407—Specifically defined cancers
- G01N33/57434—Specifically defined cancers of prostate
-
- G—PHYSICS
- G01—MEASURING; TESTING
- G01N—INVESTIGATING OR ANALYSING MATERIALS BY DETERMINING THEIR CHEMICAL OR PHYSICAL PROPERTIES
- G01N33/00—Investigating or analysing materials by specific methods not covered by groups G01N1/00 - G01N31/00
- G01N33/48—Biological material, e.g. blood, urine; Haemocytometers
- G01N33/50—Chemical analysis of biological material, e.g. blood, urine; Testing involving biospecific ligand binding methods; Immunological testing
- G01N33/5005—Chemical analysis of biological material, e.g. blood, urine; Testing involving biospecific ligand binding methods; Immunological testing involving human or animal cells
- G01N33/5091—Chemical analysis of biological material, e.g. blood, urine; Testing involving biospecific ligand binding methods; Immunological testing involving human or animal cells for testing the pathological state of an organism
-
- G—PHYSICS
- G06—COMPUTING; CALCULATING OR COUNTING
- G06F—ELECTRIC DIGITAL DATA PROCESSING
- G06F18/00—Pattern recognition
- G06F18/20—Analysing
- G06F18/21—Design or setup of recognition systems or techniques; Extraction of features in feature space; Blind source separation
- G06F18/211—Selection of the most significant subset of features
- G06F18/2115—Selection of the most significant subset of features by evaluating different subsets according to an optimisation criterion, e.g. class separability, forward selection or backward elimination
-
- G—PHYSICS
- G06—COMPUTING; CALCULATING OR COUNTING
- G06V—IMAGE OR VIDEO RECOGNITION OR UNDERSTANDING
- G06V10/00—Arrangements for image or video recognition or understanding
- G06V10/70—Arrangements for image or video recognition or understanding using pattern recognition or machine learning
- G06V10/77—Processing image or video features in feature spaces; using data integration or data reduction, e.g. principal component analysis [PCA] or independent component analysis [ICA] or self-organising maps [SOM]; Blind source separation
- G06V10/771—Feature selection, e.g. selecting representative features from a multi-dimensional feature space
-
- G—PHYSICS
- G06—COMPUTING; CALCULATING OR COUNTING
- G06V—IMAGE OR VIDEO RECOGNITION OR UNDERSTANDING
- G06V20/00—Scenes; Scene-specific elements
- G06V20/60—Type of objects
- G06V20/69—Microscopic objects, e.g. biological cells or cellular parts
- G06V20/698—Matching; Classification
-
- G—PHYSICS
- G01—MEASURING; TESTING
- G01N—INVESTIGATING OR ANALYSING MATERIALS BY DETERMINING THEIR CHEMICAL OR PHYSICAL PROPERTIES
- G01N2800/00—Detection or diagnosis of diseases
- G01N2800/52—Predicting or monitoring the response to treatment, e.g. for selection of therapy based on assay results in personalised medicine; Prognosis
-
- G—PHYSICS
- G01—MEASURING; TESTING
- G01N—INVESTIGATING OR ANALYSING MATERIALS BY DETERMINING THEIR CHEMICAL OR PHYSICAL PROPERTIES
- G01N2800/00—Detection or diagnosis of diseases
- G01N2800/56—Staging of a disease; Further complications associated with the disease
-
- G—PHYSICS
- G01—MEASURING; TESTING
- G01N—INVESTIGATING OR ANALYSING MATERIALS BY DETERMINING THEIR CHEMICAL OR PHYSICAL PROPERTIES
- G01N2800/00—Detection or diagnosis of diseases
- G01N2800/60—Complex ways of combining multiple protein biomarkers for diagnosis
Definitions
- the invention relates generally to analyzing and visualizing the expression of biomarkers in individual cells, wherein the cells are examined in situ in their tissue of origin, to identify and understand patterns of expression that have an association with a diagnosis, a prognosis, or a response to treatment of a condition or a disease.
- tissue specimens that have been treated to reveal the expression of biomarkers is a known tool for biological research and clinical studies.
- One such treatment involves the use of antibodies or antibody surrogates, such as antibody fragments, that are specific for the biomarkers, commonly proteins, of interest.
- Such antibodies or antibody surrogates can be directly or indirectly labeled with a moiety capable, under appropriate conditions, of generating a signal.
- a fluorescent moiety can be attached to the antibody to interrogate the treated tissue for fluorescence.
- the signal obtained is commonly indicative of not only the presence but also the amount of biomarker present.
- tissue treatment and examination have been refined so that the level of expression of a given biomarker in a particular cell or even a compartment of the given cell such as the nucleus, cytoplasm or membrane can be quantitatively determined.
- the boundaries of these compartments or the cell as a whole are located using known histological stains.
- the treated tissue is examined with digital imaging and the level of different signals emanating from different biomarkers can consequently be readily quantified.
- a technique has further been developed which allows testing a given tissue specimen for the expression of numerous biomarkers.
- this technique involves staining the specimen with a fluorophore labeled probe to generate signal for one or more probe bound biomarkers, chemically bleaching these signals and re-staining the specimen to generate signals for some further biomarkers.
- the chemical bleaching step is convenient because there are only a limited number of signals that can be readily differentiated from each other so only a limited number of biomarkers can be examined in a particular step. But with bleaching, the sample may be re-probed and re-evaluated for multiple steps.
- This cycling method may be used on formalin fixed paraffin embedded tissue (FFPE) samples and cells. Digital images of the specimen are collected after each staining step. The successive images of such a specimen can conveniently be kept in registry using morphological features such as DAPI stained cell nuclei, the signal of which is not modified by the chemical bleaching method.
- FFPE formalin fixed paraffin embedded tissue
- Another approach has been to examine frozen tissue specimens by staining them iteratively and photo bleaching the labels from the previous staining step before applying the next set of stains. The strength of the fluorescent signal associated with each biomarker evaluated is then extracted from the appropriate image.
- U.S. Patent Publication No. US2011/0091081 disclosed a process for acquiring data for analysis of the patterns of expression of multiple biomarkers in cells in their tissue of origin.
- the level of expression of multiple biomarkers in individual cells or in the subcellular compartments of the individual cells in situ in the tissue of origin of the cells was measured.
- the measurements could be conveniently made by treating the tissue specimens with antibodies or antibody surrogates specific to the biomarkers of interest.
- the antibodies or antibody surrogates were directly or indirectly labeled with moieties that give off optical signals when interrogated with light of the appropriate wavelength.
- the tissue specimens were repeatedly treated, with each treatment involving antibodies or antibody surrogates specific to different biomarkers than those involved in any other treatment and the signal generation from the immediately previous treatment was neutralized by optical or chemical means.
- the amount of each label bound to the biomarkers of interest by the antibodies or antibody surrogates was measured by subjecting the specimen to light of the appropriate wavelength and digitally imaging the response.
- the cells were conveniently segmented into individual cell units and their subcellular compartments (including membrane, cytoplasm and nucleus) were part of the data acquisition.
- the database stored the original measurement values and the location, cell or compartment of the cell, from which each measurement is drawn.
- U.S. Patent Publication No. US2011/0091081 also disclosed a process for analyzing data representative of the patterns of expression of multiple biomarkers in cells in their tissue of origin.
- the numerical methods used to interrogate the database involved assigning certain attributes to each cell of interest based upon the measurements of biomarker expression levels and grouping those cells together which have similar biomarker expression attributes.
- the grouping involved an algorithm that groups together those cells which have a minimum distance between them in attribute space, i.e. two cells are included in the same group based on their distance from each other in n-dimensional space wherein each attribute is assigned a dimension.
- U.S. Patent Publication No. US2011/0091081 further disclosed that groups of cells having similar patterns of expression of certain biomarkers could be a convenient basis for investigating associations between a biological condition and a given cell attribute. Each grouping could be examined to identify any cell attribute which is associated with the diagnoses or prognoses of a given condition or disease or with the response to a given therapy for a given condition or disease.
- U.S. Patent Publication No. US2011/0091081 disclosed a process for displaying one or more groups of cells having similar patterns of expression of certain biomarkers.
- the groupings could be visualized by an overlay over one or more of the digital images of a field of view utilized to make the measurements of the levels of expression of the biomarkers.
- the overlay could show where in the original image cells occur which possess the profile of a given group. Images from different tissue specimens with such overlays could be compared to determine if the patterns of cells with one or more profiles, i.e. patterns of cells which belong to one or more groups, are indicative of any biological condition or process.
- U.S. Patent Publication No. US2011/0091091 disclosed a process comprising measurement of the level of expression of multiple biomarkers in individual cells of a cellular sample, storing the measurement of biomarker expression of each cell as a data point in a database, and interrogating the database for data points having a similar pattern of biomarker expression using a computer algorithm where such similarity is determined by a numerical analysis that uses the level of expression of each biomarker as at least a semi-continuous variable.
- the data points with minimum variance were identified and grouped together.
- the group was assigned a new biomarker expression profile represented by a new data point, which is based on a central value for each attribute considered by the algorithm, thus forming a new data set.
- the steps were repeated with the new data set until a predetermined number of groups was generated.
- U.S. Patent Publication No. US2011/0091091 also disclosed a method for using the grouping data for displaying a group of cells having similar patterns of expression of certain biomarkers.
- the method involved creating an image of one or more groups in a field of view of a cellular sample, by which each cell in a group was given a visible designation that they belong to the same group.
- the new image was registered to the original image of the sample to allow the images of the groups in a field of view to be sequentially overlaid and analyzed and displayed.
- U.S. Patent Publication No. US2011/0091081 and U.S. Patent Publication No. US2011/0091091 failed to disclose how to select an appropriate number of groups for a specific data set to investigate a possible association.
- U.S. Patent Publication No. US2011/0091091 discloses generating a predetermined number of groups within a specific data set, but does not disclose how to select the number of groups to generate. Without an approach for selecting appropriate number of groups for a specific data set, an appropriate number of groups may not be selected. Too few groups may result in cells with important distinctive characteristics being grouped together. An association of a subset of the grouped cells may be more difficult or impossible to identify.
- Too many groups will result in the need for unnecessarily complicated calculations and analysis. Too many groups may result in over-fitting the data set such that cells with no important distinctive characteristics are grouped separately. An association with two groups of cells that have no important distinctive characteristics may be more difficult or impossible to identify.
- both U.S. Patent Publication No. US2011/0091081 and U.S. Patent Publication No. US2011/0091091 disclose limited techniques for displaying group-related information.
- Both publications disclose that the location of cells assigned to a group can be flagged within a much larger field of view.
- Both publications further disclose that cells within a much larger field of view can be flagged to indicate their assignment to one of a plurality of groups within the same view.
- Other than their relative location within a much larger field of view however, such displays offers limited insight into the characteristics of cells within any particular group.
- the groups resulting from multi-dimensional similarity grouping of cell may be inherently difficult for a medical practitioner to understand. Accordingly, embodiments taught herein involve distinct processes for analyzing a dataset.
- Embodiments taught herein leverage multiplexed biometric images that are generated through known techniques, such as through a multiplexing staining-destaining technique.
- the images illustrate the expression of biomarkers within individual cells that enables comparison of the individual cells to each other.
- the individual cells are part of a larger cell sample.
- the cell sample may be a group of cells from a cell culture, a tissue sample, organ, tumor, or lesion.
- the individual cells may also be part of a group of specimens of similar tissue from different subjects.
- These groups of cells may represent one or more disease or condition models, different stages within a disease or condition model, or one or more responses to treatment of a disease or condition.
- Images of each stained field of view are generated through known techniques, such as with a digital camera coupled with an appropriate microscope and appropriate quality control routines. Automated image registration and analysis may also be used to quantify the biomarker concentration levels for individual delineated cells, or even sub-cellular compartments, such as nucleus, cytoplasm, and membrane.
- the data values resulting from the multiplexing and image analysis of cells may be stored alone or in conjunction with data that is the result of further analysis.
- the database preserves the identity of the measurement of strength of the biomarker expression including the tissue and the location within the tissue from which it was drawn. The location should include the particular cell from which a particular measurement was drawn and may also include the compartment, nucleus, cytoplasm or membrane, associated with the measurement.
- the information is stored in a database which may be maintained in a storage device 116 or in a network device 126.
- FIG. 1 illustrates an exemplary computing environment suitable for practicing exemplary embodiments taught herein.
- the environment includes a computing device 100 with associated peripheral devices.
- Computing device 100 is programmable to implement executable code 150 for various methods as taught herein.
- Computing device 100 includes a storage device 116, such as a hard-drive, CD-ROM, or other non-transitory computer readable media.
- Storage device 116 stores an operating system 118 and other related software.
- Computing device 100 may further include memory 106.
- Memory 106 may comprise a computer system memory or random access memory, such as DRAM, SRAM, EDO RAM, etc.
- Memory 106 may comprise other types of memory as well, or combinations thereof.
- Computing device 100 may store, in storage device 116 and/or memory 106, instructions for implementing and processing every module of the executable code 150.
- Computing device 100 also includes processor 102 and, one or more processor(s) 102' for executing software stored in the memory 106, and other programs for controlling system hardware.
- Processor 102 and processor(s) 102' each can be a single core processor or multiple core (104 and 104') processor.
- Virtualization may be employed in computing device 100 so that infrastructure and resources in the computing device can be shared dynamically.
- Virtualized processors may also be used with executable analysis code 150 and other software in storage device 116.
- a virtual machine 114 may be provided to handle a process running on multiple processors so that the process appears to be using only one computing resource rather than multiple. Multiple virtual machines can also be used with one processor.
- a user may interact with computing device 100 through a visual display device 122, such as a computer monitor, which may display the user interfaces 124 or any other interface.
- the visual display device 122 may also display other aspects or elements of exemplary embodiments, e.g. an icon for storage device 116.
- Computing device 100 may include other I/O devices such a keyboard or a multi-point touch interface 108 and a pointing device 110, for example a mouse, for receiving input from a user.
- the keyboard 108 and the pointing device 110 may be connected to the visual display device 122.
- Computing device 100 may include other suitable conventional I/O peripherals.
- Computing device 100 may include a network interface 112 to interface with a network device 126 via a Local Area Network (LAN), Wide Area Network (WAN) or the Internet through a variety of connections including, but not limited to, standard telephone lines, LAN or WAN links (e.g., 802.11, T1, T3, 56kb, X.25), broadband connections (e.g., ISDN, Frame Relay, ATM), wireless connections, controller area network (CAN), or some combination of any or all of the above.
- LAN Local Area Network
- WAN Wide Area Network
- the Internet may include, but not limited to, standard telephone lines, LAN or WAN links (e.g., 802.11, T1, T3, 56kb, X.25), broadband connections (e.g., ISDN, Frame Relay, ATM), wireless connections, controller area network (CAN), or some combination of any or all of the above.
- broadband connections e.g., ISDN, Frame Relay, ATM
- CAN controller area network
- the network interface 112 may comprise a built-in network adapter, network interface card, PCMCIA network card, card bus network adapter, wireless network adapter, USB network adapter, modem or any other device suitable for enabling computing device 100 to interface with any type of network capable of communication and performing the operations described herein.
- computing device 100 may be any computer system such as a workstation, desktop computer, server, laptop, handheld computer or other form of computing or telecommunications device that is capable of communication and that has sufficient processor power and memory capacity to perform the operations described herein.
- Computing device 100 can be running any operating system 118 such as any of the versions of the Microsoft® Windows® operating systems, the different releases of the Unix and Linux operating systems, any version of the MacOS® for Macintosh computers, any embedded operating system, any real-time operating system, any open source operating system, any proprietary operating system, any operating systems for mobile computing devices, or any other operating system capable of running on the computing device and performing the operations described herein.
- the operating system may be running in native mode or emulated mode.
- FIG. 2 illustrates a method 200 of developing a model for identifying a predictive set of clusters of similar cells from a data set.
- the method leverages a data set that may be stored, for example, in storage device 116 or network device 126.
- the data set comprises cell profile data.
- the cell profile data includes multiplexed biometric images capturing the expression of a plurality of biomarkers with respect to a plurality of fields of view in which individual cells are delineated and segmenting into compartments.
- the cell profile data is generated from a plurality of tissue samples drawn from a cohort of patients having a commonality.
- the commonality may be, for example, that the patients share a disease or condition. Alternatively, the commonality may be, for example, that the patients share a preliminary diagnosis of the same disease or condition.
- the data set further comprises an association of the cell profile data with at least one piece of meta-information including a field of view level assessment or a patient-level assessment related to the commonality.
- the patient-level assessment may
- a plurality of sets of clusters of similar cells are generated from the data set.
- One or more processors such as processors 102, 102', generate the plurality of sets of clusters.
- Each of the plurality of sets of clusters generated comprises a unique number of clusters.
- Each cell is assigned to a single cluster in each of the plurality of sets of clusters.
- Each of the plurality of clusters in each of the plurality of sets of clusters comprises cells having a plurality of selected attributes more similar to the plurality of selected attributes of other cells in that cluster than to the plurality of selected attributes of cells in other clusters in the set.
- a cell attribute used for cluster generation in method 200 is a nucleus intensity ratio defined by subtracting half of the sum of the median intensity of the membrane and the median intensity of the cytoplasm from the median intensity of the cell nucleus's expression of at least one of the plurality of biomarkers.
- a cell attribute used for cluster generation in method 200 is a membrane intensity ratio defined by subtracting half of the sum of the median intensity of the nucleus and the median intensity of the cytoplasm from the median intensity of the cell membrane's expression of at least one of the plurality of biomarkers.
- a cell attribute used for cluster generation in method 200 is a cytoplasm intensity ratio defined by subtracting half of the sum of the median intensity of the membrane and the median intensity of the nucleus from the median intensity of the cell cytoplasm's expression of at least one of the plurality of biomarkers.
- a cell attribute used for cluster generation in method 200 is a median intensity of the whole cell.
- the nucleus intensity ratio for each of the plurality of biomarkers may be the basis for generating sets of clusters.
- Some embodiments of method 200 determine cell similarity at least in part from a comparison of two attributes of a cell based on the expression of at least one of the plurality of biomarkers. For example, a nucleus intensity ratio and a membrane intensity ratio for at least one of the plurality of biomarkers may be a basis for generating sets of clusters. Some embodiments of method 200, not covered by the claimed invention, determine cell similarity at least in part on a comparison of three attributes of a cell based on the expression of at least one of the plurality of biomarkers.
- a nucleus intensity ratio, a membrane intensity ratio, and a cytoplasm intensity ratio for at least one of the plurality of biomarkers may be a basis for generating sets of clusters.
- Some embodiments of method 200 determine cell similarity at least in part on a comparison of four attributes of a cell based on the expression of at least one of the plurality of biomarkers.
- a nucleus intensity ratio, a membrane intensity ratio, a cytoplasm intensity ratio, and a median intensity of the whole cell for at least one of the plurality of biomarkers may be a basis for generating sets of clusters.
- Embodiments of method 200, not covered by the claimed invention determine cell similarity from other combinations of attributes.
- Some embodiments of method 200, not covered by the claimed invention determine cell similarity from a comparison of more than four attributes of a cell based on the expression of at least one of the plurality of biomarkers.
- method 200 generate clusters of the similarity of cells by applying a K-medians clustering algorithm to the relevant set of cell attributes.
- analysis code 150 includes the clustering algorithm.
- the plurality of sets of clusters is generated from a normalized data set.
- Some embodiments, not covered by the claimed invention may normalize the measurement values to determine the mean and standard deviation of all the measurements associated with a given biomarker in a given study and subtract this mean value from each measurement value and then to divide the resultant difference by the standard deviation.
- the measurement values are expressed on a log scale of the intensity of the expression of a biomarker in the image. A subtraction in measurement values expressed in the log scale may correspond to a division in the original raw measurement scale.
- Other embodiments may normalize the measurement values to determine the median intensity of a whole cell's expression for all cells within a batch of measurements and subtract this median value from each measurement value in the batch. Such median intensity may apply to the expression of a specific biomarker.
- This normalized or standardized value may be stored in the database or generated as part of the processing of the data set in the database.
- the plurality of sets of clusters in some embodiments, not covered by the claimed invention, is generated from a filtered data set.
- Such filtering may be done as a quality control measure.
- Such filtering may exclude, for example, cell profile data related to cells comprising at least one compartment represented by fewer than a threshold number of pixels in the multiplexed image. Filtering may also be done for reasons beyond quality control.
- Such filtering may exclude, for example, cell profile data related to normal cells from the data set used to generate the plurality of sets of clusters of similar cells.
- a proportion of the cells assigned to each cluster within each of the plurality of sets of clusters is observed.
- the observed proportions are examined for an association with the at least one piece of meta-information including the field of view level assessment or the patient-level assessment related to the commonality.
- An association between observed proportions and a field of view level assessment or a patient-level assessment can be derived by fitting a classification model with the assessment as the outcome and proportions of observed clusters as the predictors.
- classification analysis frameworks exist, including random forests, neural networks, and logistic regression.
- an association between tissue grade and presence and number of cells observed from a given cell cluster is derived, in some embodiments not covered by the claimed invention, by fitting a random forest classification model with tissue grade as the outcome and proportions of observed clusters as the predictors.
- An association between tissue grade and presence and number of cells observed from a given cell cluster is derived, in other embodiments not covered by the claimed invention, by fitting a neural network classification model with tissue grade as the outcome and proportions of observed clusters as the predictors.
- the observed proportion of cells is the observed proportion of the cells of each field of view assigned to each cluster.
- the observed proportions are examined for an association with the field of view level assessment related to the commonality; and a predictive set of clusters is selected through on a comparison of the performance of the field of view level assessment models based on the plurality of sets of clusters.
- the observed proportion of cells is the observed proportion of the cells of each patient assigned to each cluster.
- the observed proportions are examined for an association with a prognosis of a condition or a disease and a plurality of sets of clusters is selected through on a comparison of a performance of a patient level assessment model based on the plurality of sets of clusters.
- the assessments are grouped.
- assessments resulting in a Gleason score of 2 or 3 may be grouped together.
- the plurality of sets of clusters are examined for an association with the grouped assessments related to the commonality of the patient cohorts. For example, combinations of attributes can be examined for an association with a low Gleason score where samples having a Gleason score of 2 or 3 are grouped together.
- Field of view level assessments of cohorts of other types of cancer may involve assessments of other types of tumors having their own relevant tumor grades.
- Other cancer grading systems include, for example, the Bloom-Richardson system for breast cancer and the Fuhrman system for kidney cancer. Whenever cancer or other diseases have assessments that may fall within more than two grades or categories, similar grades or categories may be grouped in some embodiments, not covered by the claimed invention.
- one of the plurality of sets of clusters is selected based on a comparison of the performance of at least one model of the plurality of sets of clusters.
- visual display device 122 enables the selection to be made.
- Similar classification models can be created for each of the plurality of sets of clusters.
- one or more processors such as processors 102, 102', create the classification models.
- Each model predicts an assessment based on cell cluster proportions in the corresponding set of clusters.
- each model predicts tissue grade based on cell cluster proportions in the corresponding set of clusters.
- the performance of the model of each set of clusters can be evaluated by various metrics of predictive performance in a test set of data not used for developing the model.
- Performance metrics that can be used to compare the sets of clusters based on the models include sensitivity, specificity, area under the receiver operating characteristic curve (also called concordance).
- the set of clusters to be used may then be selected based on one or more of the model performance metrics. For example, in some embodiments, not covered by the claimed invention, the set of clusters associated with the highest concordance is selected. In other embodiments, not covered by the claimed invention, the set of clusters associated with the highest concordance is not selected due to apparent over-fitting of the data.
- the selected set comprising a predictive set of clusters.
- Some embodiments of method 200, not covered by the claimed invention further comprise comparing the performance of at least one model with respect to the number of clusters in each of the plurality of sets of clusters.
- Some embodiments of method 200, not covered by the claimed invention, further comprise selecting a set of clusters having a number of clusters below which a greater number of clusters in the set of cluster provides a decrease in performance. Some embodiments of method 200, not covered by the claimed invention, further comprise selecting a set of clusters having a number of clusters above which a greater number of clusters in the set of cluster does not offer a statistically significant increase in performance. Some embodiments of method 200, not covered by the claimed invention, further comprise selecting a set of clusters based on a performance of the at least one model of the set of clusters corresponding to a performance metric greater than a pre-defined threshold, which may be for example a concordance of 0.85 or greater. Some embodiments of method 200, not covered by the claimed invention, further comprise identifying at least one predictive cluster from the predictive set of clusters.
- Some embodiments of method 200 not covered by the claimed invention, divide the cell data into training data and test data, generate the plurality of sets of clusters of similar cells from training data, and determine the performance of the at least one model from the testing data.
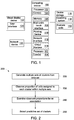
- FIG. 3 illustrates an exemplary method 300 of displaying cell cluster features.
- the method leverages a data set that may be stored, for example, in storage device 116 or network device 126.
- the data set comprises cell profile data.
- the cell profile data includes multiplexed biometric images capturing the expression of a plurality of biomarkers with respect to a plurality of fields of view in which individual cells are delineated and segmenting into compartments.
- a first cluster in a plurality of clusters of similar cells from the data set is identified. Each cell is assigned to one of the plurality of clusters. Each cluster in the plurality of clusters includes cells having a plurality of selected attributes more similar to the plurality of selected attributes of other cells in that cluster than to the plurality of selected attributes of cells in other clusters in the set. Cell similarity may be judged and clustering may done by any of the techniques discussed above with respect to 220.
- a montage of a first cell in the first cluster is created.
- One or more processors such as processors 102, 102', create the montage.
- the montage comprises a portion of at least some multiplexed images describing the first cell's expression of each of a plurality of biomarkers. Each portion of the at least some images includes the first cell and a small region of interest around the first cell.
- the montage of the first cell in the first cluster is displayed to enable a user to understand a feature of the first cluster.
- the montage is displayed on visual display device 122.
- the montage of the first cell displayed in some embodiments of method 300, not covered by the claimed invention comprises a series of juxtaposed portions of the at least some images of a field of view describing the first cell's expression of each of a plurality of biomarkers.
- the montage of the first cell displayed in other embodiments of method 300, not covered by the claimed invention comprises a series of superimposed portions of the at least some images of a field of view describing the first cell's expression of each of a plurality of biomarkers.
- Some embodiments of method 300 further include creating and displaying a montage of a second cell in the first cluster.
- the montage of the second cell comprises a portion of at least some images of a field of view describing the second cell's expression of each of a plurality of biomarkers.
- Each portion of the at least some images includes the second cell and a small region of interest around the second cell.
- FIG. 35 illustrates exemplary montages of two cells. Specifically, FIG. 35 illustrates a montage of a two cells, both in cluster 15 of a set of 20 clusters, where the left cell is taken from a normal field of view (GLO) whereas the right cell is from a Gleason grade 3 field of view (GL3).
- GLO normal field of view
- GL3 Gleason grade 3 field of view
- Some such embodiments of method 300 further include displaying the montage of the first cell in the first cluster and the montage of the second cell in the first cluster simultaneously to enable a user to understand the feature of the first cluster. Similarly, montages of additional cells in the first cluster can be created and displayed.
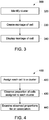
- FIG. 4 illustrates a method 400 of applying a modeled set of clusters to new cell profile data.
- the modeled set of clusters may be stored, for example, in storage device 116 or network device 126.
- the modeled set of clusters may be developed, for example, through method 200 taught herein.
- Method 400 involves cell profile data relating to at least one field of view of at least one tissue sample from a patient.
- the cell profile data includes a multiplexed biometric image capturing the expression of a plurality of biomarkers. Individual cells in the field of view are delineated and segmenting into compartments. The resulting information is also included in the cell profile data.
- the method cell profile data may be stored, for example, in storage device 116 or network device 126.
- Some embodiments of method 400, not covered by the claimed invention further include obtaining the at least one tissue sample from the patient. Some embodiments of method 400, not covered by the claimed invention, further include staining and imaging the at least one tissue sample from the patient. Some embodiments of method 400, not covered by the claimed invention, further include delineating individual cells of the at least one tissue sample from the patient based on multiplexed images capturing the expression of each of the plurality of biomarkers. Some embodiments of method 400, not covered by the claimed invention, further include segmenting individual cells of the at least one tissue sample from the patient into compartments based on multiplexed images capturing the expression of each of the plurality of biomarkers.
- the cells in the field of view of the at least one tissue sample are each assigned to a single cluster among a plurality of clusters of similar cells in a selected set of clusters.
- one or more processors such as processors 102, 102', assign the cells to the appropriate clusters.
- Each cluster in the selected set of clusters comprises cells having a plurality of selected attributes more similar to the plurality of selected attributes of other cells in that cluster than to the plurality of selected attributes of cells in other clusters in the set.
- Cell similarity may be judged and clustering may done by any of the techniques discussed above with respect to 220.
- analysis code 150 includes the clustering algorithm. The set of clusters may have been selected by any of the techniques discussed above with respect to method 200.
- a proportion of the cells assigned to each cluster in the selected set of clusters is observed.
- the observed proportion of cells is the observed proportion of the cells of each field of view assigned to each cluster.
- the observed proportion of cells is the observed proportion of the cells of each patient assigned to each cluster.
- the observed proportions are examined for an association with a diagnosis, a prognosis, or a response to treatment of a condition or a disease.
- the association can be derived from a known association of the selected set of clusters with at least one piece of meta-information including a field of view level assessment or a patient-level assessment.
- the association may become known, for example, through analysis in accordance with method 200.
- the association is an association with a Gleason tissue grade.
- the association is an association with a disease or condition survival time.
- method 400 further comprise examining the observed proportions in the selected set of clusters for a univariate association that can be derived from a known univariate association of the selected set of clusters.
- Other embodiments of method 400, not covered by the claimed invention further comprise examining the observed proportions in the selected set of clusters for a multivariate association that can be derived from a known multivariate association of the selected set of clusters.
- FIG. 5 illustrates a method 500 of developing a model for identifying a predictive set of moments of cell features from a data set in accordance with embodiments taught herein.
- the method leverages a data set that may be stored, for example, in storage device 116 or network device 126.
- the data set comprises cell profile data.
- the cell profile data includes multiplexed biometric images capturing the expression of a plurality of biomarkers with respect to a plurality of fields of view in which individual cells are delineated and segmenting into compartments.
- the cell profile data is generated from a plurality of tissue samples drawn from a cohort of patients having a commonality. The commonality may be, for example, that the patients share a disease or condition.
- the commonality may be, for example, that the patients share a preliminary diagnosis of the same disease or condition.
- the data set further comprises an association of the cell profile data with at least one piece of meta-information including a field of view level assessment or a patient-level assessment related to the commonality.
- the patient-level assessment may be, for example, survival time after surgery.
- At least one cell feature is calculated based on the cell's expression of each of the plurality of biomarkers.
- the cell profile data may be normalized prior to calculating at least one cell feature. Some embodiments may normalize the measurement values to determine the mean and standard deviation of all the measurements associated with a given biomarker in a given study and subtract this mean value from each measurement value and then to divide the resultant difference by the standard deviation.
- the measurement values are expressed on a log scale of the intensity of the expression of a biomarker in the image. A subtraction in measurement values expressed in the log scale in these embodiments may correspond to a division in the original raw measurement scale.
- Other embodiments may normalize the measurement values to determine the median intensity of a whole cell's expression for all cells within a batch of measurements and subtract this median value from each measurement value in the batch. Such median intensity may apply to the expression of a specific biomarker.
- This normalized or standardized value may be stored in the database or generated as part of the processing of the data set in the database.
- calculating at least one cell feature Prior to calculating at least one cell feature, some embodiments filter a subset of the cell profile data from further calculations. Such filtering may be done as a quality control measure. Such filtering may exclude cell profile data related to cells comprising at least one compartment represented by fewer than a threshold number of pixels in the multiplexed image. Filtering may also be done for reasons beyond quality control. Such filtering may exclude the expression of each of the plurality of morphological biomarkers from further calculations. Accordingly, in some embodiments taught herein, calculating at least one cell feature involves calculating at least one cell feature based on the cell's expression of each of the plurality of non-morphological biomarkers.
- Some embodiments of method 500 involve calculating two, three, four, or more cell features based on the cell's expression of each of the plurality of non-morphological biomarkers.
- one or more processors such as processors 102, 102', calculate the cell features.
- analysis code 150 includes a definition for each cell feature.
- Cell features in some embodiments include a nucleus intensity ratio defined by subtracting half of the sum of the median intensity of the membrane and the median intensity of the cytoplasm from the median intensity of the cell nucleus's expression of at least one of the plurality of biomarkers.
- Cell features in some embodiments include a membrane intensity ratio defined by subtracting half of the sum of the median intensity of the nucleus and the median intensity of the cytoplasm from the median intensity of the cell membrane's expression of at least one of the plurality of biomarkers.
- Cell features in some embodiments include cytoplasm intensity ratio defined by subtracting half of the sum of the median intensity of the membrane and the median intensity of the nucleus from the median intensity of the cell cytoplasm's expression of at least one of the plurality of biomarkers.
- a first moment is calculated for each of the plurality of fields of view from each of the cell features.
- one or more processors such as processors 102, 102', calculate the first moment of the cell feature.
- Embodiments taught herein may further involve calculating a second moment and/or a third moment for each of the plurality of fields of view from each of the cell features.
- a plurality of combinations of attributes are examined for an association with the at least one piece of meta-information including the field of view level assessment or the patient-level assessment related to the commonality.
- the plurality of combinations of attributes at least include the calculated first moments.
- An association between the observed first moments of all biomarkers in a field of view and a field of view level assessment or a patient-level assessment can be derived by fitting a classification model with the assessment as the outcome and the biomarker first moments as the predictors.
- classification analysis frameworks exist, including random forests, neural networks, and logistic regression.
- an association between tissue grade and the observed first moments of all biomarkers in a field of view is derived, in some embodiments, by fitting a random forest classification model with tissue grade as the outcome and the biomarker first moments as the predictors.
- An association between tissue grade and the observed first moments of all biomarkers in a field of view is derived, in other embodiments, by fitting a neural network classification model with tissue grade as the outcome and the biomarker first moments as the predictors.
- the association is an association with the field of view level assessment of the sample, such a specific Gleason grade.
- the association is an association with the patient-level assessment, such as a disease or condition survival time.
- one or more processors examine the combinations.
- examining in 540 involves examining a plurality of combinations of attributes comprising the calculated first and second moments for an association with the at least one piece of meta-information including the field of view level assessment or the patient-level assessment related to the commonality.
- examining in 540 involves examining a plurality of combinations of attributes comprising the calculated first and third moments for an association with the at least one piece of meta-information including the field of view level assessment or the patient-level assessment related to the commonality.
- Some embodiments further involve examining the calculated first, second and third moments.
- the examining in 540 involves examining the calculated moments for a univariate association with the at least one piece of meta-information including the field of view level assessment or the patient-level assessment related to the commonality. In some embodiments, the examining in 540 involves examining the calculated moments for a multivariate association with the at least one piece of meta-information including the field of view level assessment or the patient-level assessment related to the commonality. In embodiment of method 500 in which second and/or third moments are calculated, the calculated moments can be examined for either a univariate or a multivariate association with the at least one piece of meta-information including the field of view level assessment or the patient-level assessment related to the commonality.
- the field of view level assessments are grouped. In cohorts of prostate cancer patients, for example, assessments resulting in a Gleason score of 2 or 3 may be grouped together.
- the plurality of combinations of attributes are examined for an association with the grouped field of view level assessment related to the commonality of the patient cohorts. For example, combinations of attributes can be examined for an association with a low Gleason score where samples having a Gleason score of 2 or 3 are grouped together.
- Field of view level assessments of cohorts of other types of cancer may involve assessments of other types of tumors having their own relevant tumor grades. Other cancer grading systems include, for example, the Bloom-Richardson system for breast cancer and the Fuhrman system for kidney cancer. Whenever cancer or other diseases have assessments that may fall within more than two grades or categories, similar grades or categories may be grouped in some embodiments.
- one of the plurality of combinations of attributes is selected based on a comparison of the performance of at least one model of the plurality of combinations of attributes.
- visual display device 122 enables the selection to be made.
- Similar classification models can be created for each of the plurality of combinations of attributes.
- one or more processors such as processors 102, 102', create the classification models.
- Each model predicts an assessment based on the corresponding combination of attributes.
- each model predicts tissue grade based on a corresponding set of attributes.
- the performance of the model of each combination of attributes can be evaluated by various metrics of predictive performance in a test set of data not used for developing the model.
- Performance metrics that can be used to compare the combinations of attributes based on the models include sensitivity, specificity, and area under the receiver operating characteristic curve (also called concordance).
- the combination of attributes to be used may then be selected based on one or more of the model performance metrics. For example, in some embodiments, the combination of attributes associated with the highest concordance is selected. In other embodiments, the combination of attributes associated with the highest concordance is not selected due to apparent over-fitting of the data. For example, some embodiments involve selecting a combination of attributes based on a performance of the at least one model of the combination of attributes corresponding to a performance metric greater than a pre-defined threshold, which may be for example a concordance of 0.85 or greater.
- Embodiments of method 500 may involve selecting a combination based on the performance of a model of that combination in comparison with performance of models of other combinations.
- the selected combination of attributes comprises a predictive combination of attributes.
- Embodiments of method 500 may further include identifying at least one predictive non-morphological marker from the moments model.
- FIG. 6 illustrates a method 600 of applying a model set of moments to new cell profile data in accordance with embodiments taught herein.
- the model set of moments may be stored, for example, in storage device 116 or network device 126.
- the model set of moments may be developed, for example, through any embodiments of method 500 taught herein.
- Method 600 involves cell profile data relating to at least one field of view of at least one tissue sample from a patient.
- the cell profile data includes a multiplexed biometric image capturing the expression of a plurality of biomarkers. Individual cells in the field of view are delineated and segmenting into compartments. The resulting information is also included in the cell profile data.
- the cell profile data may be stored, for example, in storage device 116 or network device 126.
- Some embodiments of method 600 further include obtaining the at least one tissue sample from the patient. Some embodiments of method 600 further include staining and imaging the at least one tissue sample from the patient. Some embodiments of method 600 further include delineating individual cells of the at least one tissue sample from the patient based on multiplexed images capturing the expression of each of the plurality of biomarkers. Some embodiments of method 600 further include segmenting individual cells of the at least one tissue sample from the patient into compartments based on multiplexed images capturing the expression of each of the plurality of biomarkers.
- At least one cell feature is calculated based on the cell's expression of each of the plurality of biomarkers.
- one or more processors such as processors 102, 102', calculate at least one cell feature.
- analysis code 150 includes a definition for each cell feature.
- the cell feature may be any cell feature discussed with respect to method 500.
- Some embodiments of method 600 further include calculating a plurality of cell features, which may include any combination of cell features discussed with respect to method 500.
- the cell features may be calculated from the cell's expression of non-morphological biomarkers.
- a first moment is calculated for each cell feature for each of field of view.
- one or more processors such as processors 102, 102', calculate the first moment of the cell feature.
- method 600 may further include calculating a second and/or third moment for each cell feature.
- the calculated first moments is examined for an association with a diagnosis, a prognosis, or a response to treatment of a condition or a disease.
- the association may be known from the model set of moments based on the existing data set, for example, such as described with respect to method 500.
- the association is an association with a cell grade, such a specific Gleason grade.
- the association is an association with a disease or condition survival time.
- examining in 640 involves examining the calculated first and second moments for an association with a diagnosis, a prognosis, or a response to treatment of a condition or a disease.
- examining in 640 involves examining the calculated first and third moments for an association with a diagnosis, a prognosis, or a response to treatment of a condition or a disease.
- Some embodiments further involve examining the calculated first, second and third moments.
- one or more processors examine the calculated first moments.
- examining in 640 involves examining the calculated first moments for a univariate association with a diagnosis, a prognosis, or a response to treatment of a condition or a disease.
- examining in 640 involves examining the calculated first moments for a multivariate association with a diagnosis, a prognosis, or a response to treatment of a condition or a disease.
- the calculated moments can be examined for either a univariate or a multivariate association with a diagnosis, a prognosis, or a response to treatment of a condition or a disease.
- Tissue samples may be defined as tissue cultures and include in vivo samples. Prostate tissue samples from 80 people were available for analysis. Of the contributing population, 62 had prostate cancer. Of those 62 prostate cancer patients, 11 were still alive at follow-up, 22 had died of the disease, and the remaining 29 had died of other causes. Table 1 gives population statistics for the contributing population on age, survival time and pathologist derived Gleason score for our data.
- tissue samples from a cohort of patients may involve tissue samples taken from a cohort of patients to determine if they had another form of cancer, such as breast cancer.
- other embodiments of the invention involve larger or smaller cohorts of patients.
- the tissue samples were processed using fluorescence-based multiplexed immunohistochemistry. Fourteen biomarkers were used in the analysis. Five of the 14 biomarkers were used for segmentation and compartmentalization of individual cells: NaKATPase, PCAD, DAPI, S6, and Keratin. The remaining markers were AR, pmTOR, PI3Kp110a, PI3Kp85a, BetaCatenin, EGFR, CleavedCaspase3, pGSK3a, and CleavedPARP. All of the biomarkers passed a qualitative staining quality checks.
- the data included the median intensity for each protein image in the three compartments of each segmented cell in each field of view in all subjects.
- Cells were quality controlled by applying the following filters:
- Gleason scores were manually recorded for all fields of view by the team pathologist (QL) on a scale from 0 to 5. Due to scarcity of Gleason grade 2 data, the grade 2 fields of view were combined with Gleason grade 3 fields of view. Table 2 gives summaries of the fields of view-level Gleason grades.
- Table 2 FOV-level Gleason Grades Died of Cancer No Yes Age (years) 48-72 73-94 48-72 73-94 Survival Time (years) 0-6 7-21 0-6 7-21 0-6 7-21 Spot Gleason Grade 0 64 304 99 29 7 18 63 36 2-3 32 54 36 10 9 3 13 9 4 34 73 24 1 8 11 125 38 5 11 3 3 0 0 6 120 20
- inventions may involve different field of view level assessments, which may be appropriate to the disease or condition affecting the relevant cohort of patients.
- Table 3 gives the Gleason score breakdown relative to the five batches, where entries are counts of tissue samples. Due to some subjects being analyzed in multiple batches, Table 3 includes 63 total tissue samples from the 54 unique subjects. Nine subjects had multiple tissue samples: 4 of these subjects were run in 2 batches, 2 were run in 3 batches, and 2 were run twice in a single batch. The last subject was run in 4 different batches. Table 3: Subject-level Gleason scores in the 5 batches. Gleason Score Batch 1 Batch 2 Batch 3 Batch 4 Batch 5 Total 0 1 0 1 4 4 10 2-4 3 0 0 0 1 4 5-6 4 4 3 2 1 14 7 3 1 3 2 0 9 8-10 4 7 9 4 2 26 Total 15 12 16 12 8 63
- Disease-free survival was defined as time between surgery and death or follow-up. This measure was treated as right-censored if either the subject was alive at follow-up or died of a cause other than prostate cancer. Eighteen of the patient subjects died of prostate cancer before follow-up. The available post-surgery survival time for each patient subjects was also added to the data set thereby completing the raw data set.
- Other embodiments of the invention may involve different patient level assessments, which may be appropriate to the disease or condition affecting the relevant cohort of patients.
- Whole cell and compartment median intensities were normalized within each batch by subtracting the median of all whole-cell measurements for all cells in all subjects in the batch. For the 8 subjects who were analyzed in multiple batches, fields of view were batch-normalized, and then subsequently treated the same as subjects analyzed in a single batch. Other embodiments of the invention may involve more normalization, less normalization, different normalization, or no normalization of the data collected.
- the four cell features were calculated from the cell level data.
- the four features each defined on a log2 scale, were the median intensity of the whole cell, a nucleus intensity ratio, a membrane intensity ratio, and a cytoplasm intensity ratio.
- the three compartment ratios relate the median intensity of the expression of the nucleus, membrane, or cytoplasm to the average median intensity of the other two compartments.
- the compartment marker expression levels e.g. membrane NaKATPase, were interpreted as the ratio of one compartment to the average of the other two as described.
- Other embodiments of the invention may involve more, less, or different cell features.
- embodiments of the invention applied a Random Forest classifier, such as described in L. Breiman's "Random Forests" in Machine Learning 45(1), 5-32 (2001 ), with features described above.
- the outcome was two separate models related to the field of view Gleason grades.
- the first model distinguished Gleason grades (i.e., 2, 3, 4, or 5) fields of view from fields of view with Gleason grade 0.
- the second model distinguished Gleason grades 4 or 5 fields of view from Gleason grades 2 or 3 fields of view.
- fields of view with Gleason grade 0 were removed from analysis.
- the random Forest package (v. 4.5-36) for R (v. 2.11.0) was used with default settings.
- Out-of-bag error rates converged after 200 trees were constructed, so 500 trees were used for the classifier.
- data was sampled and stratified by subject (using the strata argument to random Forest) to avoid overweighting subjects with an abundance of fields of view.
- Receiver Operating Characteristic (ROC) analysis were conducted by thresholding the predicted class probabilities from the out-of-bag predictions.
- AUC area under the ROC curve
- Variable importance results were based on decrease in classification accuracy when data from a given variable is scrambled.
- Variable dependence plots were based on predicted class log probabilities.
- Other embodiments of the invention may use more, less, or different field of view level assessment models.
- embodiments of the invention applied a random survival forest model, such as disclosed in H. Ishwaran et al.'s "Random Survival Forests” in the Ann. App. Statist. 2:841-860 (2008 ).
- the random Survival Forest package (v. 3.6.3) for R (v. 2.11.0) was used with default arguments. Five thousand trees were used to build the model.
- the error metric tabulated was one minus Harrell's concordance index the probability that, in a randomly selected pair of subjects, the subject that dies first had a worse model-predicted outcome. According to Harrell, F.E. et al. in "Evaluating the Yield of Medical Tests," J. Amer. Med. Assoc. 247:2543-2546 (1982 ), 50% error is the random model, 0% is a perfect model.
- Other embodiments of the invention may use more, less, or different patient level assessment models.
- This error metric was estimated on out-of-bag samples. Variable importance results were based on increase in concordance error for a given feature when random daughter assignments were used on tree nodes concerning a feature. Partial variable dependence plots were based on relative mortality, which is the predicted death rate in the population as a function of a given feature observed consistently in every subject in the population. Further, 3 separate binary classification models were fit to the survival data by setting a time threshold at 3, 5, and 10 years, and classifying whether the patient died of prostate cancer before the threshold.
- the four cell level features were summarized into field-of-view level statistics for association with the FOV-level Gleason grades. Based on the population of cells in the field of view, the mean, standard deviation, and skewness of all four expression-level features for all 14 markers were recorded. For association with the FOV grade, all 14 markers, including structural and target, were considered as predictors. This resulted in three moments for each of the four cell features for each of 14 biomarkers-for a total of168 FOV attributes. Other embodiments of the invention may involve more, less, or different field of view level attributes.
- the following cell morphological features from the single cell segmentation may be included in the moments-based models in various embodiments: Eccentricity_Cell, Solidity_Cell MajorAxisLength_Cell, MajorAxisAngle_Cell, Perimeter_Cell, Area_Cell, Area_Nuclei, Area_Mem, and Area_Cyto.
- Table 4 gives the performance of the classifiers comparing cancerous (Gleason 2, 3, 4, or 5) versus normal grade (Gleason 0) fields of view based on different moments-based feature sets. Multiple combinations of FOV attributes were tried all including at least one of the order of moments (ml, m12, or m123). Some combinations included the fluorescence marker data, and some included the cell morphology features. The Area Under the ROC Curve (AUC) was at least 98% for all models that included at least the first moment of the fluorescent marker data. The morphological features increased the AUC only slightly. Table 4: Performance of Moments based classifiers on Cancer vs.
- Table 5 gives the performance of the classifiers comparing high grade (Gleason 4 or 5) versus low grade (Gleason 2 or 3) cancerous fields of view. Again, AUC suffered in models which did not include at least the first moment of the fluorescent marker data.
- Table 5 Performance of Moments based classifiers on high grade vs. low grade Cancer Fields of View Moments Included Fluorescence Features Included Morphological Features Included AUC m12 Yes No 0.929 m12 Yes Yes Yes 0.928 m1 Yes No 0.928 m123 Yes Yes 0.928 m1 Yes Yes 0.926 m123 Yes No 0.926 m12 No Yes 0.834 m123 No Yes 0.817 m1 No Yes 0.781
- the ROC curves for the top models are given in FIGS. 7 and 8 .
- the variable importance plots for the top models are given in FIGS. 9 and 10 .
- the top features are related to NaKATPase, either being quantified outside the membrane or having high FOV-level standard deviation.
- the first morphological feature in the cancer/ normal classifier is area of the nucleus at 24th on the list.
- Table 6 shows performance metrics for all the moments-based models fitted to the whole patient dataset.
- the code “inv-norm” means that the feature used for the subject was the difference between the average seen in their invasive fields of view minus the average observed in their normal fields of view.
- the model with only age and Gleason score was fit 11 times and these rows are highlighted in bold. The different results for the 11 bold rows are related to random sampling error inherent to the random survival forest and random forest procedures.
- the model with marker first moments in invasive fields of view and no morphological features was the preferred model. Although there are models which exceed it on RSF concordance metric, this model has better 3 year and 10 year AUC, and is only 0.8% less than the model which includes first and second moments. Further, this model increases the 5 year AUC over the null model from 73% to 93%. None of the models strongly exceed the null model's RSF concordance.
- Table 7 gives the same performance metrics on models applied to the patient dataset excluding patients with Gleason scores greater than 0.
- the rows of Table 7 highlighted in bold are those for which only age and Gleason score were included.
- FIG. 14 shows that stronger membrane abundance of PI3Kp110 and pGSK3a, as well as low whole cell PCAD abundance, may be associated with shorter survival.
- the list of important features was similar, as seen in FIGS. 15 and 16 .
- cells were clustered into K groups based on the 14 markers and the 4 cell-level features, a 56 dimensional marker space, using K-medians clustering on 20,000 cells sampled from the whole cohort stratified by subject.
- the stepFlexclust function of flexclust library (v. 1.3-1) for R (v. 2.11.0) was run with 20 replicates assuming K ranged between 2 and 50. Then every cell in the whole cohort was associated with one of the K clusters by computing distances from the cluster centroids. This was accomplished using the predict function in flexclust.
- FOV-level cell cluster features were then defined as the proportion of cells in the FOV belonging to each of the K clusters.
- the performance of both the cancer versus normal field of view and the high grade versus low grade cancer field of view classifiers stabilized after including approximately 20 cell clusters, as seen in FIGS. 18 and 19 .
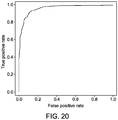
- the normal versus cancer classifier AUCs were 96.1% and 95.7% in training and test sets, respectively.
- the high grade versus low grade cancer classifier AUCs were lower: 88.0% in training and 88.7% in test sets. Morphological features were not included in these models.
- the ROC curves for the 20 cell cluster models are given in FIGS. 20 and 21 .
- the single cluster 7 stands out as being highly predictive of FOV grade, as shown in FIGS. 22 and 23 .
- Cluster 7 is an indication of normal tissue as are the rest of the top 4 features in both models; see FIGS. 24 and 25 .
- the pattern of lower abundance of cluster 7 cells in higher grade cancers was evident in all 5 batches, see FIG. 26 .
- the signature of cluster 7 is plotted in FIG. 27 . Significant features of this cluster are increased nuclear and membrane abundance of both NaKATPase and beta Catenin with associated decrease in cytoplasmic abundance of both.
- survival time concordance metric and 5- and 10-year death classification rates are better than the null model when including at least 5 cell clusters, see FIG. 29 . Survival time concordance rises until approximately 20 clusters are included, whereas 5 year death is best classified with as few as 5 clusters. Including features from normal FOVs does not generally improve model performance.
- variable importance plot for the model which included 6 clusters in invasive tissues applied to the whole cohort shows that cluster 6 is much more predictive than any of the other 5 clusters in the model.
- Cluster 6 is associated with shorter survival time, as shown in FIG. 31 .
- FIG. 32 is the variable importance of the survival model on the Gleason score greater than 0 cohort. Cluster 7 is associated with longer survival time, whereas cluster 1 is associated with shorter survival time.
- FIG. 33 is the partial dependence of the top four features in the 20 cluster model of the Gleason score greater than 0 cohort
- clusters 6/6 and 1/20 are given in FIG. 34 . These two clusters show similar signatures which are marked by accentuated localization in NaKATPase, S6, BetaCatenin, PCAD, PI3Kp110a, and Keratin. They also show somewhat low whole cell NaKATPase, BetaCatenin, and Keratin.
Landscapes
- Engineering & Computer Science (AREA)
- Health & Medical Sciences (AREA)
- Life Sciences & Earth Sciences (AREA)
- Theoretical Computer Science (AREA)
- Immunology (AREA)
- General Physics & Mathematics (AREA)
- Physics & Mathematics (AREA)
- Biomedical Technology (AREA)
- Molecular Biology (AREA)
- General Health & Medical Sciences (AREA)
- Hematology (AREA)
- Chemical & Material Sciences (AREA)
- Urology & Nephrology (AREA)
- Computer Vision & Pattern Recognition (AREA)
- Evolutionary Computation (AREA)
- Data Mining & Analysis (AREA)
- Artificial Intelligence (AREA)
- Multimedia (AREA)
- Medicinal Chemistry (AREA)
- Microbiology (AREA)
- Analytical Chemistry (AREA)
- Biochemistry (AREA)
- Cell Biology (AREA)
- Biotechnology (AREA)
- Pathology (AREA)
- Food Science & Technology (AREA)
- Software Systems (AREA)
- General Engineering & Computer Science (AREA)
- Databases & Information Systems (AREA)
- Hospice & Palliative Care (AREA)
- Computing Systems (AREA)
- Oncology (AREA)
- Bioinformatics & Cheminformatics (AREA)
- Bioinformatics & Computational Biology (AREA)
- Evolutionary Biology (AREA)
- Medical Informatics (AREA)
- Physiology (AREA)
- Tropical Medicine & Parasitology (AREA)
- Investigating Or Analysing Biological Materials (AREA)
- Image Processing (AREA)
Applications Claiming Priority (6)
| Application Number | Priority Date | Filing Date | Title |
|---|---|---|---|
| US201161478224P | 2011-04-22 | 2011-04-22 | |
| US13/252,078 US20120269419A1 (en) | 2011-04-22 | 2011-10-03 | Analyzing the expression of biomarkers in cells with moments |
| US13/252,080 US20120271553A1 (en) | 2011-04-22 | 2011-10-03 | Analyzing the expression of biomarkers in cells with clusters |
| US13/252,069 US20120270752A1 (en) | 2011-04-22 | 2011-10-03 | Analyzing the expression of biomarkers in cells with moments |
| US13/252,072 US20120269418A1 (en) | 2011-04-22 | 2011-10-03 | Analyzing the expression of biomarkers in cells with clusters |
| PCT/EP2012/057387 WO2012143556A2 (en) | 2011-04-22 | 2012-04-23 | Analyzing the expression of biomarkers in cells with moments |
Publications (2)
| Publication Number | Publication Date |
|---|---|
| EP2700038A2 EP2700038A2 (en) | 2014-02-26 |
| EP2700038B1 true EP2700038B1 (en) | 2021-04-21 |
Family
ID=47021377
Family Applications (4)
| Application Number | Title | Priority Date | Filing Date |
|---|---|---|---|
| EP12716027.3A Withdrawn EP2700036A2 (en) | 2011-04-22 | 2012-04-23 | Analyzing the expression of biomarkers in cells with clusters |
| EP12716028.1A Withdrawn EP2700037A2 (en) | 2011-04-22 | 2012-04-23 | Analyzing the expression of biomarkers in cells with clusters |
| EP12719316.7A Active EP2700042B1 (en) | 2011-04-22 | 2012-04-23 | Analyzing the expression of biomarkers in cells with moments |
| EP12717662.6A Active EP2700038B1 (en) | 2011-04-22 | 2012-04-23 | Analyzing the expression of biomarkers in cells with moments |
Family Applications Before (3)
| Application Number | Title | Priority Date | Filing Date |
|---|---|---|---|
| EP12716027.3A Withdrawn EP2700036A2 (en) | 2011-04-22 | 2012-04-23 | Analyzing the expression of biomarkers in cells with clusters |
| EP12716028.1A Withdrawn EP2700037A2 (en) | 2011-04-22 | 2012-04-23 | Analyzing the expression of biomarkers in cells with clusters |
| EP12719316.7A Active EP2700042B1 (en) | 2011-04-22 | 2012-04-23 | Analyzing the expression of biomarkers in cells with moments |
Country Status (8)
| Country | Link |
|---|---|
| US (5) | US20120270752A1 (ja) |
| EP (4) | EP2700036A2 (ja) |
| JP (4) | JP6063446B2 (ja) |
| BR (4) | BR112013027124A2 (ja) |
| CA (4) | CA2833428A1 (ja) |
| RU (3) | RU2013145162A (ja) |
| SG (4) | SG194594A1 (ja) |
| WO (4) | WO2012143556A2 (ja) |
Cited By (3)
| Publication number | Priority date | Publication date | Assignee | Title |
|---|---|---|---|---|
| EP4224488A1 (en) | 2022-02-02 | 2023-08-09 | Aizoon S.r.l. | Method for the prognosis of a disease following upon a therapeutic treatment, and corresponding system and computer program product |
| IT202200005861A1 (it) | 2022-03-24 | 2023-09-24 | Aizoon S R L | Procedimento per stimare una variabile di interesse associata ad una data malattia in funzione di una pluralità di diversi dati omici, relativo dispositivo e prodotto informatico |
| EP4312230A1 (en) | 2022-07-25 | 2024-01-31 | Aizoon S.r.l. | Method for providing a clinical decision support, corresponding system for providing a clinical decision support, and computer program product |
Families Citing this family (23)
| Publication number | Priority date | Publication date | Assignee | Title |
|---|---|---|---|---|
| GB201111594D0 (en) * | 2011-07-06 | 2011-08-24 | Equateq Ltd | New improved process |
| US9836865B2 (en) | 2012-12-06 | 2017-12-05 | Ge Healthcare Biosciences Corp. | Systems and methods for split screen display of biological specimen and for capturing records thereof |
| US9488639B2 (en) * | 2013-02-25 | 2016-11-08 | Flagship Biosciences, Inc. | Cell-based tissue analysis |
| US8995740B2 (en) * | 2013-04-17 | 2015-03-31 | General Electric Company | System and method for multiplexed biomarker quantitation using single cell segmentation on sequentially stained tissue |
| US20160146789A1 (en) * | 2013-07-03 | 2016-05-26 | Coyne Scientific, Llc | Methods for Predicting Responses to Chemical or Biological Substances |
| US9322051B2 (en) | 2013-10-07 | 2016-04-26 | General Electric Company | Probing of biological samples |
| US9298968B1 (en) * | 2014-09-12 | 2016-03-29 | Flagship Biosciences, Inc. | Digital image analysis of inflammatory cells and mediators of inflammation |
| EP3248110A4 (en) * | 2015-01-22 | 2018-07-04 | The Board of Trustees of The Leland Stanford Junior University | Methods and systems for determining proportions of distinct cell subsets |
| US10672505B2 (en) | 2015-06-03 | 2020-06-02 | General Electric Company | Biological data annotation and visualization |
| US9953133B2 (en) | 2015-06-03 | 2018-04-24 | General Electric Company | Biological data annotation and visualization |
| EP3395937A4 (en) * | 2015-12-22 | 2019-08-21 | Nikon Corporation | IMAGE PROCESSING APPARATUS |
| US20180032681A1 (en) * | 2016-07-29 | 2018-02-01 | General Electric Company | Biological feature analysis technique |
| US11436719B2 (en) | 2017-02-16 | 2022-09-06 | Kyoto University | Cell evaluation method, cell evaluation device, and recording medium storing cell evaluation program |
| US10127696B2 (en) * | 2017-03-22 | 2018-11-13 | Sas Institute Inc. | Computer system to generate scalable plots using clustering |
| CA3058195A1 (en) * | 2017-04-28 | 2018-11-01 | 4D Path Inc. | Apparatus, systems, and methods for rapid cancer detection |
| KR101990430B1 (ko) * | 2017-06-22 | 2019-06-18 | 한국과학기술원 | 암의 재발 예후 예측을 위한 바이오마커 발굴 시스템 및 방법 |
| US10706328B2 (en) * | 2018-05-07 | 2020-07-07 | Google Llc | Focus-weighted, machine learning disease classifier error prediction for microscope slide images |
| US10971255B2 (en) * | 2018-09-14 | 2021-04-06 | Zasti Inc. | Multimodal learning framework for analysis of clinical trials |
| WO2020068684A2 (en) | 2018-09-24 | 2020-04-02 | Krishnan Ramanathan | Hybrid analysis framework for prediction of outcomes in clinical trials |
| CA3120716A1 (en) * | 2018-11-29 | 2020-06-04 | Somalogic, Inc. | Methods for determining disease risk combining downsampling of class-imbalanced sets with survival analysis |
| US11128667B2 (en) * | 2018-11-29 | 2021-09-21 | Rapid7, Inc. | Cluster detection and elimination in security environments |
| CN113158982A (zh) * | 2021-05-17 | 2021-07-23 | 广东中卡云计算有限公司 | 一种半介入式的目标关键点标注方法 |
| WO2023033056A1 (ja) * | 2021-09-01 | 2023-03-09 | イミュニティリサーチ株式会社 | 細胞集団同定システム、方法、およびプログラム |
Citations (3)
| Publication number | Priority date | Publication date | Assignee | Title |
|---|---|---|---|---|
| US20080118934A1 (en) * | 2006-11-16 | 2008-05-22 | General Electric Company | Sequential analysis of biological samples |
| US20100184093A1 (en) * | 2008-07-25 | 2010-07-22 | Aureon Laboratories, Inc. | Systems and methods for treating, diagnosing and predicting the occurrence of a medical condition |
| US20110091081A1 (en) * | 2009-10-16 | 2011-04-21 | General Electric Company | Method and system for analyzing the expression of biomarkers in cells in situ in their tissue of origin |
Family Cites Families (21)
| Publication number | Priority date | Publication date | Assignee | Title |
|---|---|---|---|---|
| US6463438B1 (en) * | 1994-06-03 | 2002-10-08 | Urocor, Inc. | Neural network for cell image analysis for identification of abnormal cells |
| US5740269A (en) * | 1994-09-20 | 1998-04-14 | Neopath, Inc. | Method and apparatus for robust biological specimen classification |
| US6996549B2 (en) * | 1998-05-01 | 2006-02-07 | Health Discovery Corporation | Computer-aided image analysis |
| US6282305B1 (en) * | 1998-06-05 | 2001-08-28 | Arch Development Corporation | Method and system for the computerized assessment of breast cancer risk |
| US6337472B1 (en) * | 1998-10-19 | 2002-01-08 | The University Of Texas System Board Of Regents | Light imaging microscope having spatially resolved images |
| WO2002059377A2 (en) * | 2001-01-24 | 2002-08-01 | Protein Design Labs | Methods of diagnosis of breast cancer, compositions and methods of screening for modulators of breast cancer |
| JP2005534912A (ja) * | 2002-07-30 | 2005-11-17 | ドイチェス クレブスフォルシュングスツェントルム | 複数粒子を多重標識して検出および評価するための方法および装置 |
| US20040121413A1 (en) * | 2002-12-20 | 2004-06-24 | Aebersold Rudolf H. | Androgen-regulated genes and uses for diagnosis, prognosis and treatment of prostate neoplastic conditions |
| US20050265588A1 (en) * | 2004-02-03 | 2005-12-01 | Bioimagene, Inc. | Method and system for digital image based flourescent in situ hybridization (FISH) analysis |
| WO2006113747A2 (en) * | 2005-04-19 | 2006-10-26 | Prediction Sciences Llc | Diagnostic markers of breast cancer treatment and progression and methods of use thereof |
| US8041090B2 (en) * | 2005-09-10 | 2011-10-18 | Ge Healthcare Uk Limited | Method of, and apparatus and computer software for, performing image processing |
| US7933435B2 (en) * | 2005-11-21 | 2011-04-26 | Vala Sciences, Inc. | System, method, and kit for processing a magnified image of biological material to identify components of a biological object |
| US8114615B2 (en) * | 2006-05-17 | 2012-02-14 | Cernostics, Inc. | Method for automated tissue analysis |
| US8019134B2 (en) * | 2006-11-16 | 2011-09-13 | Definiens Ag | Automatic image analysis and quantification for fluorescence in situ hybridization |
| JP2010522554A (ja) * | 2007-03-27 | 2010-07-08 | ロゼッタ ゲノミックス エルティーディー. | 癌の分類のための遺伝子発現サイン |
| CA2683134A1 (en) * | 2007-05-07 | 2008-11-13 | Ge Healthcare Bio-Sciences Corp. | System and method for the automated analysis of cellular assays and tissues |
| WO2008143849A2 (en) * | 2007-05-14 | 2008-11-27 | Historx, Inc. | Compartment segregation by pixel characterization using image data clustering |
| JP2010538609A (ja) * | 2007-09-06 | 2010-12-16 | バイオセラノスティクス,インコーポレイティド | 腫瘍グレード分類と癌の予後診断 |
| WO2010011356A2 (en) * | 2008-07-25 | 2010-01-28 | Aureon Laboratories, Inc. | Systems and methods of treating, diagnosing and predicting the occurrence of a medical condition |
| US8320655B2 (en) | 2009-10-16 | 2012-11-27 | General Electric Company | Process and system for analyzing the expression of biomarkers in cells |
| WO2011087778A1 (en) * | 2009-12-22 | 2011-07-21 | The Children's Hospital Of Philadelphia | Automated quantitative multidimensional volumetric analysis and visualization |
-
2011
- 2011-10-03 US US13/252,069 patent/US20120270752A1/en not_active Abandoned
- 2011-10-03 US US13/252,078 patent/US20120269419A1/en not_active Abandoned
- 2011-10-03 US US13/252,072 patent/US20120269418A1/en not_active Abandoned
- 2011-10-03 US US13/252,080 patent/US20120271553A1/en not_active Abandoned
-
2012
- 2012-04-23 EP EP12716027.3A patent/EP2700036A2/en not_active Withdrawn
- 2012-04-23 RU RU2013145162/15A patent/RU2013145162A/ru not_active Application Discontinuation
- 2012-04-23 JP JP2014505669A patent/JP6063446B2/ja active Active
- 2012-04-23 SG SG2013078753A patent/SG194594A1/en unknown
- 2012-04-23 JP JP2014505671A patent/JP6063447B2/ja active Active
- 2012-04-23 BR BR112013027124A patent/BR112013027124A2/pt not_active IP Right Cessation
- 2012-04-23 CA CA2833428A patent/CA2833428A1/en not_active Abandoned
- 2012-04-23 EP EP12716028.1A patent/EP2700037A2/en not_active Withdrawn
- 2012-04-23 BR BR112013027122A patent/BR112013027122A2/pt not_active IP Right Cessation
- 2012-04-23 CA CA2833497A patent/CA2833497A1/en not_active Abandoned
- 2012-04-23 BR BR112013027123A patent/BR112013027123A2/pt not_active IP Right Cessation
- 2012-04-23 WO PCT/EP2012/057387 patent/WO2012143556A2/en unknown
- 2012-04-23 BR BR112013027125A patent/BR112013027125A2/pt not_active IP Right Cessation
- 2012-04-23 SG SG2013078738A patent/SG194592A1/en unknown
- 2012-04-23 JP JP2014505668A patent/JP6163152B2/ja active Active
- 2012-04-23 CA CA2833295A patent/CA2833295A1/en not_active Abandoned
- 2012-04-23 CA CA2833804A patent/CA2833804A1/en not_active Abandoned
- 2012-04-23 RU RU2013145154/15A patent/RU2013145154A/ru not_active Application Discontinuation
- 2012-04-23 SG SG2013078712A patent/SG194590A1/en unknown
- 2012-04-23 EP EP12719316.7A patent/EP2700042B1/en active Active
- 2012-04-23 EP EP12717662.6A patent/EP2700038B1/en active Active
- 2012-04-23 SG SG2013078688A patent/SG194588A1/en unknown
- 2012-04-23 WO PCT/EP2012/057395 patent/WO2012143562A2/en unknown
- 2012-04-23 JP JP2014505670A patent/JP6143743B2/ja active Active
- 2012-04-23 RU RU2013145151/15A patent/RU2013145151A/ru not_active Application Discontinuation
- 2012-04-23 WO PCT/EP2012/057390 patent/WO2012143558A2/en unknown
- 2012-04-23 WO PCT/EP2012/057394 patent/WO2012143561A2/en unknown
-
2014
- 2014-03-05 US US14/197,558 patent/US20140185905A1/en not_active Abandoned
Patent Citations (3)
| Publication number | Priority date | Publication date | Assignee | Title |
|---|---|---|---|---|
| US20080118934A1 (en) * | 2006-11-16 | 2008-05-22 | General Electric Company | Sequential analysis of biological samples |
| US20100184093A1 (en) * | 2008-07-25 | 2010-07-22 | Aureon Laboratories, Inc. | Systems and methods for treating, diagnosing and predicting the occurrence of a medical condition |
| US20110091081A1 (en) * | 2009-10-16 | 2011-04-21 | General Electric Company | Method and system for analyzing the expression of biomarkers in cells in situ in their tissue of origin |
Non-Patent Citations (1)
| Title |
|---|
| GEORGE GLASS ET AL: "Simple: A Sequential Immunoperoxidase Labeling and Erasing Method", JOURNAL OF HISTOCHEMISTRY AND CYTOCHEMISTRY, vol. 57, no. 10, 13 April 2009 (2009-04-13), US, pages 899 - 905, XP055676909, ISSN: 0022-1554, DOI: 10.1369/jhc.2009.953612 * |
Cited By (4)
| Publication number | Priority date | Publication date | Assignee | Title |
|---|---|---|---|---|
| EP4224488A1 (en) | 2022-02-02 | 2023-08-09 | Aizoon S.r.l. | Method for the prognosis of a disease following upon a therapeutic treatment, and corresponding system and computer program product |
| IT202200005861A1 (it) | 2022-03-24 | 2023-09-24 | Aizoon S R L | Procedimento per stimare una variabile di interesse associata ad una data malattia in funzione di una pluralità di diversi dati omici, relativo dispositivo e prodotto informatico |
| EP4250301A1 (en) | 2022-03-24 | 2023-09-27 | Aizoon S.r.l. | Method for estimating a variable of interest associated to a given disease as a function of a plurality of different omics data, corresponding device, and computer program product |
| EP4312230A1 (en) | 2022-07-25 | 2024-01-31 | Aizoon S.r.l. | Method for providing a clinical decision support, corresponding system for providing a clinical decision support, and computer program product |
Also Published As
Similar Documents
| Publication | Publication Date | Title |
|---|---|---|
| EP2700038B1 (en) | Analyzing the expression of biomarkers in cells with moments | |
| US8885912B2 (en) | Generate percentage of positive cells for biomarkers by normalizing and autothresholding the image intensity produced by immunohistochemistry technique | |
| US11315774B2 (en) | Big-data analyzing Method and mass spectrometric system using the same method | |
| JP4963721B2 (ja) | 疾患を有する患者に薬物が有効かどうかを決定するための方法およびシステム | |
| US20230282362A1 (en) | Systems and methods for determining breast cancer prognosis and associated features | |
| Zhang et al. | Predicting IHC staining classes of NF1 using features in the hematoxylin channel | |
| WO2011119967A2 (en) | System,method and computer-accessible medium for evaluating a maliganacy status in at-risk populations and during patient treatment management | |
| Shvetsov et al. | Fast TILs estimation in lung cancer WSIs based on semi-stochastic patch sampling | |
| Ramkumar et al. | Experimental Analysis on Breast Cancer Using Random Forest Classifier on Histopathological Images | |
| Selcuk et al. | Automated HER2 Scoring in Breast Cancer Images Using Deep Learning and Pyramid Sampling | |
| Li | Novel Population Specific Computational Pathology-based Prognostic and Predictive Biomarkers for Breast Cancer | |
| Zubek et al. | Aggregating Multiple Biological Measurements Per Patient |
Legal Events
| Date | Code | Title | Description |
|---|---|---|---|
| PUAI | Public reference made under article 153(3) epc to a published international application that has entered the european phase |
Free format text: ORIGINAL CODE: 0009012 |
|
| 17P | Request for examination filed |
Effective date: 20131119 |
|
| AK | Designated contracting states |
Kind code of ref document: A2 Designated state(s): AL AT BE BG CH CY CZ DE DK EE ES FI FR GB GR HR HU IE IS IT LI LT LU LV MC MK MT NL NO PL PT RO RS SE SI SK SM TR |
|
| DAX | Request for extension of the european patent (deleted) | ||
| STAA | Information on the status of an ep patent application or granted ep patent |
Free format text: STATUS: EXAMINATION IS IN PROGRESS |
|
| 17Q | First examination report despatched |
Effective date: 20190717 |
|
| RAP1 | Party data changed (applicant data changed or rights of an application transferred) |
Owner name: GLOBAL LIFE SCIENCES SOLUTIONS USA LLC |
|
| GRAP | Despatch of communication of intention to grant a patent |
Free format text: ORIGINAL CODE: EPIDOSNIGR1 |
|
| STAA | Information on the status of an ep patent application or granted ep patent |
Free format text: STATUS: GRANT OF PATENT IS INTENDED |
|
| INTG | Intention to grant announced |
Effective date: 20201201 |
|
| GRAS | Grant fee paid |
Free format text: ORIGINAL CODE: EPIDOSNIGR3 |
|
| GRAA | (expected) grant |
Free format text: ORIGINAL CODE: 0009210 |
|
| STAA | Information on the status of an ep patent application or granted ep patent |
Free format text: STATUS: THE PATENT HAS BEEN GRANTED |
|
| AK | Designated contracting states |
Kind code of ref document: B1 Designated state(s): AL AT BE BG CH CY CZ DE DK EE ES FI FR GB GR HR HU IE IS IT LI LT LU LV MC MK MT NL NO PL PT RO RS SE SI SK SM TR |
|
| REG | Reference to a national code |
Ref country code: GB Ref legal event code: FG4D |
|
| REG | Reference to a national code |
Ref country code: CH Ref legal event code: EP |
|
| REG | Reference to a national code |
Ref country code: DE Ref legal event code: R096 Ref document number: 602012075293 Country of ref document: DE Ref country code: IE Ref legal event code: FG4D |
|
| REG | Reference to a national code |
Ref country code: AT Ref legal event code: REF Ref document number: 1385412 Country of ref document: AT Kind code of ref document: T Effective date: 20210515 |
|
| RAP2 | Party data changed (patent owner data changed or rights of a patent transferred) |
Owner name: LEICA MICROSYSTEMS CMS GMBH |
|
| REG | Reference to a national code |
Ref country code: LT Ref legal event code: MG9D |
|
| REG | Reference to a national code |
Ref country code: AT Ref legal event code: MK05 Ref document number: 1385412 Country of ref document: AT Kind code of ref document: T Effective date: 20210421 |
|
| REG | Reference to a national code |
Ref country code: NL Ref legal event code: MP Effective date: 20210421 |
|
| PG25 | Lapsed in a contracting state [announced via postgrant information from national office to epo] |
Ref country code: LT Free format text: LAPSE BECAUSE OF FAILURE TO SUBMIT A TRANSLATION OF THE DESCRIPTION OR TO PAY THE FEE WITHIN THE PRESCRIBED TIME-LIMIT Effective date: 20210421 Ref country code: NL Free format text: LAPSE BECAUSE OF FAILURE TO SUBMIT A TRANSLATION OF THE DESCRIPTION OR TO PAY THE FEE WITHIN THE PRESCRIBED TIME-LIMIT Effective date: 20210421 Ref country code: FI Free format text: LAPSE BECAUSE OF FAILURE TO SUBMIT A TRANSLATION OF THE DESCRIPTION OR TO PAY THE FEE WITHIN THE PRESCRIBED TIME-LIMIT Effective date: 20210421 Ref country code: BG Free format text: LAPSE BECAUSE OF FAILURE TO SUBMIT A TRANSLATION OF THE DESCRIPTION OR TO PAY THE FEE WITHIN THE PRESCRIBED TIME-LIMIT Effective date: 20210721 Ref country code: AT Free format text: LAPSE BECAUSE OF FAILURE TO SUBMIT A TRANSLATION OF THE DESCRIPTION OR TO PAY THE FEE WITHIN THE PRESCRIBED TIME-LIMIT Effective date: 20210421 Ref country code: HR Free format text: LAPSE BECAUSE OF FAILURE TO SUBMIT A TRANSLATION OF THE DESCRIPTION OR TO PAY THE FEE WITHIN THE PRESCRIBED TIME-LIMIT Effective date: 20210421 |
|
| REG | Reference to a national code |
Ref country code: DE Ref legal event code: R079 Ref document number: 602012075293 Country of ref document: DE Free format text: PREVIOUS MAIN CLASS: G06K0009000000 Ipc: G06V0010000000 |
|
| PG25 | Lapsed in a contracting state [announced via postgrant information from national office to epo] |
Ref country code: GR Free format text: LAPSE BECAUSE OF FAILURE TO SUBMIT A TRANSLATION OF THE DESCRIPTION OR TO PAY THE FEE WITHIN THE PRESCRIBED TIME-LIMIT Effective date: 20210722 Ref country code: LV Free format text: LAPSE BECAUSE OF FAILURE TO SUBMIT A TRANSLATION OF THE DESCRIPTION OR TO PAY THE FEE WITHIN THE PRESCRIBED TIME-LIMIT Effective date: 20210421 Ref country code: IS Free format text: LAPSE BECAUSE OF FAILURE TO SUBMIT A TRANSLATION OF THE DESCRIPTION OR TO PAY THE FEE WITHIN THE PRESCRIBED TIME-LIMIT Effective date: 20210821 Ref country code: RS Free format text: LAPSE BECAUSE OF FAILURE TO SUBMIT A TRANSLATION OF THE DESCRIPTION OR TO PAY THE FEE WITHIN THE PRESCRIBED TIME-LIMIT Effective date: 20210421 Ref country code: SE Free format text: LAPSE BECAUSE OF FAILURE TO SUBMIT A TRANSLATION OF THE DESCRIPTION OR TO PAY THE FEE WITHIN THE PRESCRIBED TIME-LIMIT Effective date: 20210421 Ref country code: ES Free format text: LAPSE BECAUSE OF FAILURE TO SUBMIT A TRANSLATION OF THE DESCRIPTION OR TO PAY THE FEE WITHIN THE PRESCRIBED TIME-LIMIT Effective date: 20210421 Ref country code: PL Free format text: LAPSE BECAUSE OF FAILURE TO SUBMIT A TRANSLATION OF THE DESCRIPTION OR TO PAY THE FEE WITHIN THE PRESCRIBED TIME-LIMIT Effective date: 20210421 Ref country code: NO Free format text: LAPSE BECAUSE OF FAILURE TO SUBMIT A TRANSLATION OF THE DESCRIPTION OR TO PAY THE FEE WITHIN THE PRESCRIBED TIME-LIMIT Effective date: 20210721 Ref country code: PT Free format text: LAPSE BECAUSE OF FAILURE TO SUBMIT A TRANSLATION OF THE DESCRIPTION OR TO PAY THE FEE WITHIN THE PRESCRIBED TIME-LIMIT Effective date: 20210823 |
|
| PG25 | Lapsed in a contracting state [announced via postgrant information from national office to epo] |
Ref country code: LU Free format text: LAPSE BECAUSE OF NON-PAYMENT OF DUE FEES Effective date: 20210423 |
|
| REG | Reference to a national code |
Ref country code: BE Ref legal event code: MM Effective date: 20210430 |
|
| REG | Reference to a national code |
Ref country code: DE Ref legal event code: R097 Ref document number: 602012075293 Country of ref document: DE |
|
| PG25 | Lapsed in a contracting state [announced via postgrant information from national office to epo] |
Ref country code: EE Free format text: LAPSE BECAUSE OF FAILURE TO SUBMIT A TRANSLATION OF THE DESCRIPTION OR TO PAY THE FEE WITHIN THE PRESCRIBED TIME-LIMIT Effective date: 20210421 Ref country code: CZ Free format text: LAPSE BECAUSE OF FAILURE TO SUBMIT A TRANSLATION OF THE DESCRIPTION OR TO PAY THE FEE WITHIN THE PRESCRIBED TIME-LIMIT Effective date: 20210421 Ref country code: DK Free format text: LAPSE BECAUSE OF FAILURE TO SUBMIT A TRANSLATION OF THE DESCRIPTION OR TO PAY THE FEE WITHIN THE PRESCRIBED TIME-LIMIT Effective date: 20210421 Ref country code: SM Free format text: LAPSE BECAUSE OF FAILURE TO SUBMIT A TRANSLATION OF THE DESCRIPTION OR TO PAY THE FEE WITHIN THE PRESCRIBED TIME-LIMIT Effective date: 20210421 Ref country code: SK Free format text: LAPSE BECAUSE OF FAILURE TO SUBMIT A TRANSLATION OF THE DESCRIPTION OR TO PAY THE FEE WITHIN THE PRESCRIBED TIME-LIMIT Effective date: 20210421 Ref country code: RO Free format text: LAPSE BECAUSE OF FAILURE TO SUBMIT A TRANSLATION OF THE DESCRIPTION OR TO PAY THE FEE WITHIN THE PRESCRIBED TIME-LIMIT Effective date: 20210421 Ref country code: CH Free format text: LAPSE BECAUSE OF NON-PAYMENT OF DUE FEES Effective date: 20210430 Ref country code: LI Free format text: LAPSE BECAUSE OF NON-PAYMENT OF DUE FEES Effective date: 20210430 Ref country code: MC Free format text: LAPSE BECAUSE OF FAILURE TO SUBMIT A TRANSLATION OF THE DESCRIPTION OR TO PAY THE FEE WITHIN THE PRESCRIBED TIME-LIMIT Effective date: 20210421 |
|
| PLBE | No opposition filed within time limit |
Free format text: ORIGINAL CODE: 0009261 |
|
| STAA | Information on the status of an ep patent application or granted ep patent |
Free format text: STATUS: NO OPPOSITION FILED WITHIN TIME LIMIT |
|
| 26N | No opposition filed |
Effective date: 20220124 |
|
| PG25 | Lapsed in a contracting state [announced via postgrant information from national office to epo] |
Ref country code: IE Free format text: LAPSE BECAUSE OF NON-PAYMENT OF DUE FEES Effective date: 20210423 |
|
| PG25 | Lapsed in a contracting state [announced via postgrant information from national office to epo] |
Ref country code: IS Free format text: LAPSE BECAUSE OF FAILURE TO SUBMIT A TRANSLATION OF THE DESCRIPTION OR TO PAY THE FEE WITHIN THE PRESCRIBED TIME-LIMIT Effective date: 20210821 Ref country code: AL Free format text: LAPSE BECAUSE OF FAILURE TO SUBMIT A TRANSLATION OF THE DESCRIPTION OR TO PAY THE FEE WITHIN THE PRESCRIBED TIME-LIMIT Effective date: 20210421 |
|
| PG25 | Lapsed in a contracting state [announced via postgrant information from national office to epo] |
Ref country code: IT Free format text: LAPSE BECAUSE OF FAILURE TO SUBMIT A TRANSLATION OF THE DESCRIPTION OR TO PAY THE FEE WITHIN THE PRESCRIBED TIME-LIMIT Effective date: 20210421 Ref country code: BE Free format text: LAPSE BECAUSE OF NON-PAYMENT OF DUE FEES Effective date: 20210430 |
|
| REG | Reference to a national code |
Ref country code: DE Ref legal event code: R081 Ref document number: 602012075293 Country of ref document: DE Owner name: LEICA MICROSYSTEMS CMS GMBH, DE Free format text: FORMER OWNER: GLOBAL LIFE SCIENCES SOLUTIONS USA LLC, MARLBOROUGH, MA, US |
|
| REG | Reference to a national code |
Ref country code: GB Ref legal event code: 732E Free format text: REGISTERED BETWEEN 20230119 AND 20230125 |
|
| PG25 | Lapsed in a contracting state [announced via postgrant information from national office to epo] |
Ref country code: HU Free format text: LAPSE BECAUSE OF FAILURE TO SUBMIT A TRANSLATION OF THE DESCRIPTION OR TO PAY THE FEE WITHIN THE PRESCRIBED TIME-LIMIT; INVALID AB INITIO Effective date: 20120423 Ref country code: CY Free format text: LAPSE BECAUSE OF FAILURE TO SUBMIT A TRANSLATION OF THE DESCRIPTION OR TO PAY THE FEE WITHIN THE PRESCRIBED TIME-LIMIT Effective date: 20210421 |
|
| P01 | Opt-out of the competence of the unified patent court (upc) registered |
Effective date: 20230414 |
|
| PGFP | Annual fee paid to national office [announced via postgrant information from national office to epo] |
Ref country code: FR Payment date: 20230421 Year of fee payment: 12 Ref country code: DE Payment date: 20230427 Year of fee payment: 12 |
|
| PGFP | Annual fee paid to national office [announced via postgrant information from national office to epo] |
Ref country code: GB Payment date: 20230418 Year of fee payment: 12 |
|
| PG25 | Lapsed in a contracting state [announced via postgrant information from national office to epo] |
Ref country code: MK Free format text: LAPSE BECAUSE OF FAILURE TO SUBMIT A TRANSLATION OF THE DESCRIPTION OR TO PAY THE FEE WITHIN THE PRESCRIBED TIME-LIMIT Effective date: 20210421 |