EP2626695A1 - Analysis method, adhesive tape, and pen - Google Patents
Analysis method, adhesive tape, and pen Download PDFInfo
- Publication number
- EP2626695A1 EP2626695A1 EP11830706.5A EP11830706A EP2626695A1 EP 2626695 A1 EP2626695 A1 EP 2626695A1 EP 11830706 A EP11830706 A EP 11830706A EP 2626695 A1 EP2626695 A1 EP 2626695A1
- Authority
- EP
- European Patent Office
- Prior art keywords
- calibration reagent
- adhesive tape
- pen
- analysis method
- sample
- Prior art date
- Legal status (The legal status is an assumption and is not a legal conclusion. Google has not performed a legal analysis and makes no representation as to the accuracy of the status listed.)
- Withdrawn
Links
Images





Classifications
-
- H—ELECTRICITY
- H01—ELECTRIC ELEMENTS
- H01J—ELECTRIC DISCHARGE TUBES OR DISCHARGE LAMPS
- H01J49/00—Particle spectrometers or separator tubes
- H01J49/0027—Methods for using particle spectrometers
-
- H—ELECTRICITY
- H01—ELECTRIC ELEMENTS
- H01J—ELECTRIC DISCHARGE TUBES OR DISCHARGE LAMPS
- H01J49/00—Particle spectrometers or separator tubes
- H01J49/0009—Calibration of the apparatus
-
- H—ELECTRICITY
- H01—ELECTRIC ELEMENTS
- H01J—ELECTRIC DISCHARGE TUBES OR DISCHARGE LAMPS
- H01J49/00—Particle spectrometers or separator tubes
- H01J49/02—Details
- H01J49/10—Ion sources; Ion guns
- H01J49/14—Ion sources; Ion guns using particle bombardment, e.g. ionisation chambers
Definitions
- the present invention relates to an analysis method, an adhesive tape, and a pen.
- DART is a method that adds protons (being generated by Penning ionization of atoms or molecules in which atoms or molecules of an electronic excited state collide with water in the atmosphere) to a sample and ionizes the sample.
- protons being generated by Penning ionization of atoms or molecules in which atoms or molecules of an electronic excited state collide with water in the atmosphere
- a sample M can be ionized by performing the following. He(2 3 S))+H 2 O ⁇ H 2 O + *+He(1 1 S)+e - H 2 O + *+H 2 O ⁇ H 3 O + +OH* H 3 O + +nH 2 O ⁇ [(H 2 O) n H] + [(H 2 O) n H] + +M ⁇ MH + +nH 2 O
- He(2 3 S) indicates helium of a triplet metastable excited state
- H 2 O + * indicates a radical of H 2 O
- MH + is an example of an object ionized by adding protons to a sample.
- DESI is a method that adheres an ionized solution to a sample and desorbs ions.
- the present invention is aimed to provide an analysis method, an adhesive tape and a pen used for the analysis method that allow setting a reference position for detecting a position of a chemical substance adhered to a sample using DART or DESI and allowing calibration of a mass spectrometer.
- an analysis method is characterized by including the steps of forming a layer including a calibration reagent, that can generate ions by using a DART ion source apparatus, in a predetermined area of a sample, and performing mass spectrometry on the ions generated from an area of the sample including the layer by using DART or DESI while moving the sample having the layer formed therein.
- the present invention is characterized by including forming the layer including the calibration agent by adhering an adhesive tape including the calibration reagent.
- a third feature of the present invention is characterized by including forming the layer including the calibration agent by using a pen filled with an ink including the calibration reagent.
- the calibration reagent includes one or both of polyethylene glycol having a mass spectrum including equally spaced peaks (PEG 60 - PEG 2000) or a fatty acid having a carbon number of 4 - 36.
- an adhesive tape is characterized by including a calibration reagent that can generate ions by using a DART ion source apparatus.
- the calibration reagent includes one or both of polyethylene glycol having a mass spectrum including equally spaced peaks (PEG 60 - PEG 2000) or a fatty acid having a carbon number of 4 - 36.
- a pen is characterized by including an ink filled in the pen and including a calibration reagent that can generate ions by using a DART ion source apparatus.
- the calibration reagent includes one or both of polyethylene glycol having a mass spectrum including equally spaced peaks (PEG 60 - PEG 2000) or a fatty acid having a carbon number of 4 - 36.
- the present invention can provide an analysis method, an adhesive tape and a pen used for the analysis method that allow setting a reference position for detecting a position of a chemical substance adhered to a sample using DART or DESI and allowing calibration of a mass spectrometer.
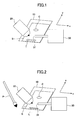
- Fig. 1 illustrates an example of an analysis method of the present invention.
- a rectangular flat plate B having a chemical substance C adhered thereto is placed on a sample stage 10 that is capable of moving in an x-axis direction and a y-axis direction.
- an adhesive tape T including a calibration reagent is adhered to an area included in the flat plate B (in the x-axis direction) that contains the chemical substance C.
- ions are generated by adding protons (which are generated by Penning ionization in which metastable excited helium (He (2 3 S)) from a DART ion source apparatus 20 are caused to collide with water in the atmosphere while the sample stage 10 is moved in the y-axis direction) to the chemical substance C of the flat plate B and the calibration reagent included in the adhesive tape T, and guided into an ion entrance port 31 of a mass spectrometer 30, to thereby perform mass spectrometry.
- protons which are generated by Penning ionization in which metastable excited helium (He (2 3 S)) from a DART ion source apparatus 20 are caused to collide with water in the atmosphere while the sample stage 10 is moved in the y-axis direction
- protons which are generated by Penning ionization in which metastable excited helium (He (2 3 S)
- He (2 3 S) metastable excited helium
- the mass spectrometer 30 can be calibrated by using a mass spectrum of a peak derived from the calibration reagent of the mass chromatogram.
- the calibration reagent is not limited in particular as long as ions can be generated by using the DART ion source apparatus 20. However, in view of the accuracy of calibration, it is preferable to use, for example, polyethylene glycol having a mass spectrum including equally spaced peaks (PEG 60 - PEG 2000) or a fatty acid having a carbon number of 4 - 36, or use two or more types of the above.
- the adhesive tape T including the calibration reagent may be obtained by, for example, applying a solution having a calibration reagent dissolved in a solvent to a commonly known adhesive tape.
- neon of a metastable excited state argon of a metastable excited state, or nitrogen of a metastable excited state may be used instead of helium (He (2 3 S)) of a metastable excited state.
- helium He (2 3 S)
- the sample is not limited to the rectangular flat plate B having the chemical substance C adhered thereto as long as ions can be generated by using the DART ion source apparatus 20.
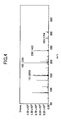
- Fig. 2 illustrates another example of an analysis method of the present invention.
- the rectangular flat plate B having the chemical substance C adhered thereto is placed on the sample stage 10 that is capable of moving in an x-axis direction and a y-axis direction.
- a pen P filled with an ink including a calibration reagent a reference line L is drawn in an area included in the flat plate B (in the x-axis direction) that contains the chemical substance C.
- ions are generated by adding protons (which are generated by Penning ionization in which metastable excited helium (He (2 3 S)) are caused to collide with water in the atmosphere by using the DART ion source apparatus 20 while the sample stage 10 is moved) to the chemical substance C of the flat plate B and the calibration reagent included in the reference line L, and guided into the ion entrance port 31 of the mass spectrometer 30, to thereby perform mass spectrometry.
- protons which are generated by Penning ionization in which metastable excited helium (He (2 3 S)
- He metastable excited helium
- the ink including the calibration reagent is obtained by adding, for example, a solution having a calibration reagent dissolved in a solvent to a commonly known ink.
- the pen P may be obtained by, for example, filling the ink including the calibration reagent into a commonly known pen.
- the present invention is not limited to the methods illustrated in Fig. 1 or Fig. 2 .
- Other methods may be, for example, coating with a brush.
- ions may be desorbed by adding an ionized solvent to a sample by using a DESI ion source instead of using the DART ion source apparatus 20.
- the solvent for ionization is not limited in particular, the solvent may be, for example, methanol, a methanol solution, acetonitrile, or an acetonitrile solution.
- the solvent for ionization may include an acidic substance or a basic substance.
- the calibration reagent is not limited in particular as long as ions can be generated by using a DESI ion source. However, in view of the accuracy of calibration, it is preferable to use, for example, polyethylene glycol having a mass spectrum including equally spaced peaks (PEG 60 - PEG 2000) or a fatty acid having a carbon number of 4 - 36), or use two or more types of the above.
- the sample is not limited in particular as long as ions can be generated by using the DESI ion source.
- the obtained ink is filled into an Artline Wetrite (red) (Shachihata Kogyo Co., Ltd.). Thereby, the pen P is obtained.
- an external pharmaceutical preparation 1 including urea, lidocaine, and diphenhydramine is applied to a slide glass. More specifically, after placing the slide glass applied with the external pharmaceutical preparation 1 on the sample stage 10, the adhesive tape T is adhered to an area of the slide glass (in the x-axis direction) to which the external pharmaceutical preparation 1 is applied, so that the interval of an intermediate point between the area to which the external pharmaceutical preparation 1 is applied and the adhesive tape T in the y-axis direction becomes 48 mm.
- ions are generated by adding protons (which are generated by Penning ionization in which metastable excited helium (He (2 3 S)) are caused to collide with water in the atmosphere by using the DART ion source apparatus 20 while the sample stage 10 is moved in the y-axis direction at a speed of 0.2 mm/s) to the urea, lidocaine, and diphenhydramine included in the external pharmaceutical preparation 1 of the slide glass, and guided into the ion entrance port 31 of the mass spectrometer 30, to thereby perform mass spectrometry.
- protons which are generated by Penning ionization in which metastable excited helium (He (2 3 S)
- He metastable excited helium
- a DART SVP (manufactured by AMR Inc.) is used as the DART ion source apparatus 20, and the temperature of a gas heater is set to 500 °C.
- a MicrOTOFQII (manufactured by Bruker Daltonics K.K.) is used as the mass spectrometer 30, and the measurement mode is set to positive ion mode.
- the highest point of a peak derived from polyethylene glycol, the starting point of a peak derived from urea, the starting point of a peak derived from lidocaine, and the starting point of a peak derived from diphenhydramine is 1 min, 5 min, 5 min, and 5 min, respectively.
- the interval of the intermediate point between the area to which the external pharmaceutical preparation 1 is applied and the adhesive tape T in the y-axis direction becomes 48 mm. Thus, measurement can be performed with high accuracy.
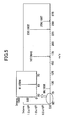
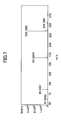
- Figs. 4 and 5 illustrate a mass spectrum corresponding to 1.0 min of Fig. 3 and a mass spectrum corresponding to 5.5 min of Fig. 3 , respectively.
- Analysis is performed in a similar manner as the first embodiment except that the adhesive tape T is adhered to a work glove instead of the slide glass, so that the interval of the intermediate point between the area to which the external pharmaceutical preparation 1 is applied in the y-axis direction and the adhesive tape T in the y-axis direction becomes 24 mm.
- the highest point of a peak derived from polyethylene glycol, the starting point of a peak derived from urea, the starting point of a peak derived from lidocaine, and the starting point of a peak derived from diphenhydramine is 1 min, 3 min, 3 min, and 3 min, respectively.
- the interval of the intermediate point between the area to which the external pharmaceutical preparation 1 is applied and the adhesive tape T in the y-axis direction becomes 24 mm. Thus, measurement can be performed with high accuracy.
- Fig. 7 illustrates a mass spectrum corresponding to 3.2 min of Fig. 6 .
- Analysis is performed in a similar manner as the first embodiment except that a box is used instead of the slide glass and an external pharmaceutical preparation 2 including diphenhydramine is used instead of the external pharmaceutical preparation 1, so that the interval of the intermediate point between the area to which the external pharmaceutical preparation 2 is applied in the y-axis direction and the adhesive tape T in the y-axis direction becomes 40.8 mm.
- the highest point of a peak derived from polyethylene glycol and the starting point of a peak derived from diphenhydramine is 1.3 min and 4.7 min, respectively.
- the interval of the intermediate point between the area to which the external pharmaceutical preparation 2 is applied and the adhesive tape T in the y-axis direction becomes 40.8 mm.
- Fig. 9 illustrates a mass spectrum corresponding to 5.2 min of Fig. 8 .
- solution 1 10 ⁇ L of a methanol solution (1 g/L) of dimethyl phthalate (hereinafter referred to as "solution 1")
- solution 2 10 ⁇ L of a methanol solution (1 g/L) of diethyl phthalate
- solution 3 10 ⁇ L of a methanol solution (1 g/L) of di-isopropyl phthalate
- a reference line L is drawn in an area of the slide glass (in the x-axis direction) to which the solutions 1-3 are applied, so that the interval of the intermediate point between the area to which the solution 1 is applied and the reference line L in the y-axis direction becomes 7.2 mm.
- ions are generated by adding protons (which are generated by Penning ionization in which metastable excited helium (He (2 3 S)) are caused to collide with water in the atmosphere by using the DART ion source apparatus 20 while the sample stage 10 is moved in the y-axis direction at a speed of 0.2 mm/s) to the dimethyl phthalate, the diethyl phthalate, and the di-isopropyl phthalate of the slide glass and the polyethylene glycol included in the reference line L, and guided into the ion entrance port 31 of the mass spectrometer 30, to thereby perform mass spectrometry.
- protons which are generated by Penning ionization in which metastable excited helium (He (2 3 S)
- He metastable excited helium
- the highest point of a peak derived from polyethylene glycol, the starting point of a peak derived from dimethyl phthalate, the starting point of a peak derived from diethyl phthalate, and the starting point of a peak derived from di-isopropyl phthalate is 1.1 min, 1.7 min, 3.7 min, and 5.7 min, respectively.
- the interval of the intermediate point between the areas to which solution 1, solution 2, and solution 3 are applied and the reference line L in the y-axis direction becomes 7.2 mm, 31.2 mm, and 55.2 mm, respectively, and the solutions 1, 2, and 3 are applied at intervals of 24 mm.
- measurement can be performed with high accuracy.
- Figs. 11 and 12 illustrate a mass spectrum corresponding to 1.1 min of Fig. 10 and a mass spectrum corresponding to 2.0 min of Fig. 10 , respectively.
Landscapes
- Chemical & Material Sciences (AREA)
- Analytical Chemistry (AREA)
- Other Investigation Or Analysis Of Materials By Electrical Means (AREA)
Abstract
There is provided an analysis method including the steps of forming a layer including a calibration reagent, that can generate ions by using a DART ion source apparatus, in a predetermined area of a sample, and performing mass spectrometry on the ions generated from an area of the sample including the layer by using DART or DESI while moving the sample having the layer formed therein.
Description
- The present invention relates to an analysis method, an adhesive tape, and a pen.
- Although many methods for atmospheric pressure ionization are known, methods as DART (Direct Analysis in Real Time) (Registered U.S. Trademark) or DESI (Desorption Electrospray Ionization) is recently drawing attention (see Patent Document 1).
- DART is a method that adds protons (being generated by Penning ionization of atoms or molecules in which atoms or molecules of an electronic excited state collide with water in the atmosphere) to a sample and ionizes the sample. For example, in a case of using helium (He (23S) of a metastable excited state, a sample M can be ionized by performing the following.
He(23S))+H2O→H2O+*+He(11S)+e-
H2O+*+H2O→H3O++OH*
H3O++nH2O→[(H2O)nH]+
[(H2O)nH]++M→MH++nH2O
- Here, "He(23S)" indicates helium of a triplet metastable excited state, "H2O+*" indicates a radical of H2O, and "MH+" is an example of an object ionized by adding protons to a sample.
- DESI is a method that adheres an ionized solution to a sample and desorbs ions.
- When measuring a sample by using DART or DESI, there is a case where a mass spectrometer is to be calibrated by using a calibration reagent. Further, when detecting a position of a chemical substance while moving a sample to which the chemical substance is adhered by using DART or DESI, there is a case where a reference position cannot be arbitrarily set.
-
- Patent Document 1: Japanese Laid-Open Patent Publication No.
2008-180659 - In view of the above-described conventional art, the present invention is aimed to provide an analysis method, an adhesive tape and a pen used for the analysis method that allow setting a reference position for detecting a position of a chemical substance adhered to a sample using DART or DESI and allowing calibration of a mass spectrometer.
- According to a first feature of the present invention, an analysis method is characterized by including the steps of forming a layer including a calibration reagent, that can generate ions by using a DART ion source apparatus, in a predetermined area of a sample, and performing mass spectrometry on the ions generated from an area of the sample including the layer by using DART or DESI while moving the sample having the layer formed therein.
- According to a second feature of the present invention, it is characterized by including forming the layer including the calibration agent by adhering an adhesive tape including the calibration reagent.
- According to a third feature of the present invention, it is characterized by including forming the layer including the calibration agent by using a pen filled with an ink including the calibration reagent.
- According to a fourth feature of the present invention, it is characterized in that the calibration reagent includes one or both of polyethylene glycol having a mass spectrum including equally spaced peaks (PEG 60 - PEG 2000) or a fatty acid having a carbon number of 4 - 36.
- According to a fifth feature of the present invention, an adhesive tape is characterized by including a calibration reagent that can generate ions by using a DART ion source apparatus.
- According to a sixth feature of the present invention, it is characterized in that the calibration reagent includes one or both of polyethylene glycol having a mass spectrum including equally spaced peaks (PEG 60 - PEG 2000) or a fatty acid having a carbon number of 4 - 36.
- According to a seventh feature of the present invention, a pen is characterized by including an ink filled in the pen and including a calibration reagent that can generate ions by using a DART ion source apparatus.
- According to an eighth feature of the present invention, it is characterized in that the calibration reagent includes one or both of polyethylene glycol having a mass spectrum including equally spaced peaks (PEG 60 - PEG 2000) or a fatty acid having a carbon number of 4 - 36.
- The present invention can provide an analysis method, an adhesive tape and a pen used for the analysis method that allow setting a reference position for detecting a position of a chemical substance adhered to a sample using DART or DESI and allowing calibration of a mass spectrometer.
-
-
Fig. 1 is schematic diagram illustrating an example of an analysis method of the present invention; -
Fig. 2 is a schematic diagram illustrating another example of the analysis method of the present invention; -
Fig. 3 is a diagram illustrating a mass chromatogram according to a first embodiment; -
Fig. 4 is a diagram illustrating a mass spectrum in 1.0 min ofFig. 3 ; -
Fig. 5 is a diagram illustrating a mass spectrum in 5.5 min ofFig. 3 ; -
Fig. 6 is a diagram illustrating a mass chromatogram according to a second embodiment; -
Fig. 7 is a diagram illustrating a mass spectrum in 3.2 min ofFig. 6 ; -
Fig. 8 is a diagram illustrating a mass chromatogram according to a third embodiment; -
Fig. 9 is a diagram illustrating a mass spectrum in 5.2 min ofFig. 8 ; -
Fig. 10 is a diagram illustrating a mass chromatogram according to a fourth embodiment; -
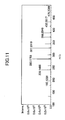
Fig. 11 is a diagram illustrating a mass spectrum in 1.1 min ofFig. 10 ; and -
Fig. 12 is a diagram illustrating a mass spectrum in 2.0 min ofFig. 10 . - Next, embodiments for carrying the present invention are described with reference to the accompanying drawings.
-
Fig. 1 illustrates an example of an analysis method of the present invention. First, a rectangular flat plate B having a chemical substance C adhered thereto is placed on asample stage 10 that is capable of moving in an x-axis direction and a y-axis direction. Then, an adhesive tape T including a calibration reagent is adhered to an area included in the flat plate B (in the x-axis direction) that contains the chemical substance C. Then, ions are generated by adding protons (which are generated by Penning ionization in which metastable excited helium (He (23S)) from a DARTion source apparatus 20 are caused to collide with water in the atmosphere while thesample stage 10 is moved in the y-axis direction) to the chemical substance C of the flat plate B and the calibration reagent included in the adhesive tape T, and guided into anion entrance port 31 of amass spectrometer 30, to thereby perform mass spectrometry. Here, an interval gi of an intermediate point between the chemical substance C and the adhesive tape T with respect to the chemical substance C and the adhesive tape T where x = xi is expressed as
in a case where "v[mm/s]" is the speed of moving thesample stage 10 in the y-axis direction, "yi0[s]" is the highest point of a peak derived from the calibration reagent of a mass chromatogram where x = xi, and "yi[s]" is a starting point of a peak derived from the chemical substance. Here, themass spectrometer 30 can be calibrated by using a mass spectrum of a peak derived from the calibration reagent of the mass chromatogram. - The calibration reagent is not limited in particular as long as ions can be generated by using the DART
ion source apparatus 20. However, in view of the accuracy of calibration, it is preferable to use, for example, polyethylene glycol having a mass spectrum including equally spaced peaks (PEG 60 - PEG 2000) or a fatty acid having a carbon number of 4 - 36, or use two or more types of the above. - The adhesive tape T including the calibration reagent may be obtained by, for example, applying a solution having a calibration reagent dissolved in a solvent to a commonly known adhesive tape.
- For example, neon of a metastable excited state, argon of a metastable excited state, or nitrogen of a metastable excited state may be used instead of helium (He (23S)) of a metastable excited state.
- The sample is not limited to the rectangular flat plate B having the chemical substance C adhered thereto as long as ions can be generated by using the DART
ion source apparatus 20. -
Fig. 2 illustrates another example of an analysis method of the present invention. First, the rectangular flat plate B having the chemical substance C adhered thereto is placed on thesample stage 10 that is capable of moving in an x-axis direction and a y-axis direction. Then, by using a pen P filled with an ink including a calibration reagent, a reference line L is drawn in an area included in the flat plate B (in the x-axis direction) that contains the chemical substance C. Then, ions are generated by adding protons (which are generated by Penning ionization in which metastable excited helium (He (23S)) are caused to collide with water in the atmosphere by using the DARTion source apparatus 20 while thesample stage 10 is moved) to the chemical substance C of the flat plate B and the calibration reagent included in the reference line L, and guided into theion entrance port 31 of themass spectrometer 30, to thereby perform mass spectrometry. - The ink including the calibration reagent is obtained by adding, for example, a solution having a calibration reagent dissolved in a solvent to a commonly known ink. Further, the pen P may be obtained by, for example, filling the ink including the calibration reagent into a commonly known pen.
- As a method for forming a layer including a calibration reagent, the present invention is not limited to the methods illustrated in
Fig. 1 or Fig. 2 . Other methods may be, for example, coating with a brush. - Further, ions may be desorbed by adding an ionized solvent to a sample by using a DESI ion source instead of using the DART
ion source apparatus 20. - Although the solvent for ionization is not limited in particular, the solvent may be, for example, methanol, a methanol solution, acetonitrile, or an acetonitrile solution.
- It is to be noted that the solvent for ionization may include an acidic substance or a basic substance.
- The calibration reagent is not limited in particular as long as ions can be generated by using a DESI ion source. However, in view of the accuracy of calibration, it is preferable to use, for example, polyethylene glycol having a mass spectrum including equally spaced peaks (PEG 60 - PEG 2000) or a fatty acid having a carbon number of 4 - 36), or use two or more types of the above.
- The sample is not limited in particular as long as ions can be generated by using the DESI ion source. Embodiments
- After forming multiple 1 mm X 17 mm incisions in a label sheet for an inkjet printer (manufactured by Kokuyo Co., Ltd.), a mixture of 5 mL of a methanol solution (1 g/L) of polyethylene glycol 200 (manufactured by Wako Pure Chemical Industries, Ltd.) having an average molecular weight of 180-220 and 5 mL of a methanol solution (1 g/L) of a polyethylene glycol 400 (manufactured by Kanto Chemical Co. Inc.) having an average molecular weight of 380-420 is evenly sprayed to the label sheet. Thereby, the adhesive tape T is obtained.
- 0.5 mL of polyethylene glycol 200 (manufactured by Wako Pure Chemical Industries, Ltd.) having an average molecular weight of 180-220 and 0.5 mL of polyethylene glycol 400 (manufactured by Kanto Chemical Co. Inc.) having an average molecular weight of 380-420 are added to a supplementary ink for an Artline Wetrite (red) (Shachihata Kogyo Co., Ltd.) and agitated. Thereby, ink is obtained.
- The obtained ink is filled into an Artline Wetrite (red) (Shachihata Kogyo Co., Ltd.). Thereby, the pen P is obtained.
- After applying an external pharmaceutical preparation 1 including urea, lidocaine, and diphenhydramine to a slide glass, analysis is performed using the analysis method of
Fig. 1 . More specifically, after placing the slide glass applied with the external pharmaceutical preparation 1 on thesample stage 10, the adhesive tape T is adhered to an area of the slide glass (in the x-axis direction) to which the external pharmaceutical preparation 1 is applied, so that the interval of an intermediate point between the area to which the external pharmaceutical preparation 1 is applied and the adhesive tape T in the y-axis direction becomes 48 mm. Then, ions are generated by adding protons (which are generated by Penning ionization in which metastable excited helium (He (23S)) are caused to collide with water in the atmosphere by using the DARTion source apparatus 20 while thesample stage 10 is moved in the y-axis direction at a speed of 0.2 mm/s) to the urea, lidocaine, and diphenhydramine included in the external pharmaceutical preparation 1 of the slide glass, and guided into theion entrance port 31 of themass spectrometer 30, to thereby perform mass spectrometry. - Here, a DART SVP (manufactured by AMR Inc.) is used as the DART
ion source apparatus 20, and the temperature of a gas heater is set to 500 °C. Further, a MicrOTOFQII (manufactured by Bruker Daltonics K.K.) is used as themass spectrometer 30, and the measurement mode is set to positive ion mode. -
Fig. 3 illustrates obtained mass chromatograms. It is to be noted that (a), (b), (c), and (d) ofFig. 3 are mass chromatograms corresponding to polyethylene glycol (m/z = 195), urea (m/z = 61), lidocaine (m/z = 235), and diphenhydramine (m/z = 256), respectively. - It can be understood from
Fig. 3 that, the highest point of a peak derived from polyethylene glycol, the starting point of a peak derived from urea, the starting point of a peak derived from lidocaine, and the starting point of a peak derived from diphenhydramine is 1 min, 5 min, 5 min, and 5 min, respectively. According to the above, the interval of the intermediate point between the area to which the external pharmaceutical preparation 1 is applied and the adhesive tape T in the y-axis direction becomes 48 mm. Thus, measurement can be performed with high accuracy. -
Figs. 4 and5 illustrate a mass spectrum corresponding to 1.0 min ofFig. 3 and a mass spectrum corresponding to 5.5 min ofFig. 3 , respectively. - It can be understood from
Fig. 4 that, peaks derived from polyethylene glycol (m/z = 151, 195, 239, 283) exist. It is to be noted that themass spectrometer 30 is calibrated by using the peaks. - It can be understood from
Fig. 5 that, a peak derived from urea (m/z = 61), a peak derived from lidocaine (m/z = 235), and a peak derived from diphenhydramine (m/z = 256) exists, respectively. - Analysis is performed in a similar manner as the first embodiment except that the adhesive tape T is adhered to a work glove instead of the slide glass, so that the interval of the intermediate point between the area to which the external pharmaceutical preparation 1 is applied in the y-axis direction and the adhesive tape T in the y-axis direction becomes 24 mm.
-
Fig. 6 illustrates obtained mass chromatograms. It is to be noted that (a), (b), (c), and (d) ofFig. 6 are mass chromatograms corresponding to polyethylene glycol (m/z = 195), urea (m/z = 61), lidocaine (m/z = 235), and diphenhydramine (m/z = 256), respectively. - It can be understood from
Fig. 6 that, the highest point of a peak derived from polyethylene glycol, the starting point of a peak derived from urea, the starting point of a peak derived from lidocaine, and the starting point of a peak derived from diphenhydramine is 1 min, 3 min, 3 min, and 3 min, respectively. According to the above, the interval of the intermediate point between the area to which the external pharmaceutical preparation 1 is applied and the adhesive tape T in the y-axis direction becomes 24 mm. Thus, measurement can be performed with high accuracy. -
Fig. 7 illustrates a mass spectrum corresponding to 3.2 min ofFig. 6 . - It can be understood from
Fig. 7 that, a peak derived from urea (m/z = 61), a peak derived from lidocaine (m/z = 235), and a peak derived from diphenhydramine (m/z = 256) exists, respectively. - Analysis is performed in a similar manner as the first embodiment except that a box is used instead of the slide glass and an
external pharmaceutical preparation 2 including diphenhydramine is used instead of the external pharmaceutical preparation 1, so that the interval of the intermediate point between the area to which theexternal pharmaceutical preparation 2 is applied in the y-axis direction and the adhesive tape T in the y-axis direction becomes 40.8 mm. -
Fig. 8 illustrates obtained mass chromatograms. It is to be noted that (a) and (b) ofFig. 8 are mass chromatograms corresponding to polyethylene glycol (m/z = 195) and diphenhydramine (m/z = 256), respectively. - It can be understood from
Fig. 8 that, the highest point of a peak derived from polyethylene glycol and the starting point of a peak derived from diphenhydramine is 1.3 min and 4.7 min, respectively. According to the above, the interval of the intermediate point between the area to which theexternal pharmaceutical preparation 2 is applied and the adhesive tape T in the y-axis direction becomes 40.8 mm. Thus, measurement can be performed with high accuracy. -
Fig. 9 illustrates a mass spectrum corresponding to 5.2 min ofFig. 8 . - It can be understood from
Fig. 9 that, a peak derived from diphenhydramine (m/z = 256) exists. - 10 µL of a methanol solution (1 g/L) of dimethyl phthalate (hereinafter referred to as "solution 1"), 10 µL of a methanol solution (1 g/L) of diethyl phthalate (hereinafter referred to as "
solution 2"), and 10 µL of a methanol solution (1 g/L) of di-isopropyl phthalate (hereinafter referred to as "solution 3") are applied to a slide glass in a straight-line manner at intervals of 24 mm. Then, analysis is performed by using the analysis method illustrated inFig. 2 . More specifically, first, a slide glass applied with the solutions 1-3 is placed on thesample stage 10. Then, by using the pen P, a reference line L is drawn in an area of the slide glass (in the x-axis direction) to which the solutions 1-3 are applied, so that the interval of the intermediate point between the area to which the solution 1 is applied and the reference line L in the y-axis direction becomes 7.2 mm. Then, ions are generated by adding protons (which are generated by Penning ionization in which metastable excited helium (He (23S)) are caused to collide with water in the atmosphere by using the DARTion source apparatus 20 while thesample stage 10 is moved in the y-axis direction at a speed of 0.2 mm/s) to the dimethyl phthalate, the diethyl phthalate, and the di-isopropyl phthalate of the slide glass and the polyethylene glycol included in the reference line L, and guided into theion entrance port 31 of themass spectrometer 30, to thereby perform mass spectrometry. -
Fig. 10 illustrates obtained mass chromatograms. It is to be noted that (a), (b), (c), and (d) ofFig. 10 are mass chromatograms corresponding to polyethylene glycol (m/z = 327), dimethyl phthalate (m/z = 195), diethyl phthalate (m/z = 223), and di-isopropyl phthalate (m/z = 251), respectively. - It can be understood from
Fig. 10 that, the highest point of a peak derived from polyethylene glycol, the starting point of a peak derived from dimethyl phthalate, the starting point of a peak derived from diethyl phthalate, and the starting point of a peak derived from di-isopropyl phthalate is 1.1 min, 1.7 min, 3.7 min, and 5.7 min, respectively. According to the above, the interval of the intermediate point between the areas to which solution 1,solution 2, and solution 3 are applied and the reference line L in the y-axis direction becomes 7.2 mm, 31.2 mm, and 55.2 mm, respectively, and thesolutions 1, 2, and 3 are applied at intervals of 24 mm. Thus, measurement can be performed with high accuracy. -
Figs. 11 and12 illustrate a mass spectrum corresponding to 1.1 min ofFig. 10 and a mass spectrum corresponding to 2.0 min ofFig. 10 , respectively. - It can be understood from
Fig. 11 that, peaks derived from polyethylene glycol (m/z = 195, 239, 283, 327) exist. It is to be noted that themass spectrometer 30 is calibrated by using the peaks. - It can be understood from
Fig. 12 that, a peak derived from dimethyl phthalate (m/z = 195) exists. - Further, the present invention is not limited to these embodiments, but variations and modifications may be made without departing from the scope of the present invention.
- The present application is based on Japanese Priority Application No.
2010-227728 filed on October 7, 2010 -
- 10
- sample stage
- 20
- DART ion source apparatus
- 30
- mass spectrometer
- 31
- ion entrance port
- B
- flat plate
- C
- chemical substance
- T
- adhesive tape
- L
- reference line
- P
- pen
Claims (8)
- An analysis method characterized by comprising the steps of:forming a layer including a calibration reagent, that can generate ions by using a DART ion source apparatus, in a predetermined area of a sample; andperforming mass spectrometry on the ions generated from an area of the sample including the layer by using DART or DESI while moving the sample having the layer formed therein.
- The analysis method as claimed in claim 1, characterized by comprising: forming the layer including the calibration agent by adhering an adhesive tape including the calibration reagent.
- The analysis method as claimed in claim 1, characterized by comprising: forming the layer including the calibration agent by using a pen filled with an ink including the calibration reagent.
- The analysis method as claimed in claim 1, characterized in that the calibration reagent includes one or both of polyethylene glycol having a mass spectrum including equally spaced peaks (PEG 60 - PEG 2000) or a fatty acid having a carbon number of 4 - 36.
- An adhesive tape characterized by comprising:a calibration reagent that can generate ions by using a DART ion source apparatus.
- The adhesive tape as claimed in claim 5, characterized in that the calibration reagent includes one or both of polyethylene glycol having a mass spectrum including equally spaced peaks (PEG 60 - PEG 2000) or a fatty acid having a carbon number of 4 - 36.
- A pen characterized by comprising:an ink filled in the pen and including a calibration reagent that can generate ions by using a DART ion source apparatus.
- The pen as claimed in claim 7, characterized in that the calibration reagent includes one or both of polyethylene glycol having a mass spectrum including equally spaced peaks (PEG 60 - PEG 2000) or a fatty acid having a carbon number of 4 - 36.
Applications Claiming Priority (2)
| Application Number | Priority Date | Filing Date | Title |
|---|---|---|---|
| JP2010227728A JP5756611B2 (en) | 2010-10-07 | 2010-10-07 | Analysis method |
| PCT/JP2011/072993 WO2012046774A1 (en) | 2010-10-07 | 2011-10-05 | Analysis method, adhesive tape, and pen |
Publications (1)
| Publication Number | Publication Date |
|---|---|
| EP2626695A1 true EP2626695A1 (en) | 2013-08-14 |
Family
ID=45927769
Family Applications (1)
| Application Number | Title | Priority Date | Filing Date |
|---|---|---|---|
| EP11830706.5A Withdrawn EP2626695A1 (en) | 2010-10-07 | 2011-10-05 | Analysis method, adhesive tape, and pen |
Country Status (4)
| Country | Link |
|---|---|
| US (1) | US9040904B2 (en) |
| EP (1) | EP2626695A1 (en) |
| JP (1) | JP5756611B2 (en) |
| WO (1) | WO2012046774A1 (en) |
Cited By (1)
| Publication number | Priority date | Publication date | Assignee | Title |
|---|---|---|---|---|
| GB2541004A (en) * | 2015-08-05 | 2017-02-08 | Micromass Ltd | Second ion source for lockmass calibration of matrix assisted laser desorption ionisation mass spectrometer |
Families Citing this family (6)
| Publication number | Priority date | Publication date | Assignee | Title |
|---|---|---|---|---|
| JP6006548B2 (en) * | 2012-07-04 | 2016-10-12 | 株式会社 資生堂 | Component distribution visualization device, component distribution visualization method, and component distribution visualization program |
| JP6230282B2 (en) * | 2012-07-12 | 2017-11-15 | キヤノン株式会社 | Mass spectrometer |
| WO2015102053A1 (en) * | 2014-01-06 | 2015-07-09 | 株式会社島津製作所 | Mass spectrometer |
| GB2598632A (en) * | 2020-09-08 | 2022-03-09 | Npl Management Ltd | Calibration and tuning method for mass spectrometer |
| JP7206365B1 (en) | 2021-12-22 | 2023-01-17 | 浜松ホトニクス株式会社 | sample support |
| CN115389607A (en) * | 2022-07-25 | 2022-11-25 | 司法鉴定科学研究院 | Ink classification and tracing method |
Family Cites Families (13)
| Publication number | Priority date | Publication date | Assignee | Title |
|---|---|---|---|---|
| JPS6423158A (en) * | 1987-07-20 | 1989-01-25 | Terumo Corp | Test piece |
| JP3411470B2 (en) * | 1997-04-18 | 2003-06-03 | 松下電器産業株式会社 | Protein immobilization method |
| NO314206B1 (en) * | 2001-04-30 | 2003-02-10 | Erling Sundrehagen | Quantitative chemical analysis method, device / device, and application of said method and analysis set |
| US7825375B2 (en) | 2005-11-14 | 2010-11-02 | Nec Corporation | Microchip, method for using such microchip and mass spectrometry system |
| JP4833708B2 (en) * | 2006-02-22 | 2011-12-07 | 日本電子株式会社 | Atmospheric pressure ionization method and sample holding device |
| JP2007298328A (en) * | 2006-04-28 | 2007-11-15 | Shunichi Nakai | Photocatalyst activity evaluation device |
| EP2035121A4 (en) * | 2006-05-26 | 2010-04-28 | Ionsense Inc | APPARATUS FOR SUPPORTING SOLIDS FOR USE WITH SURFACE IONIZATION TECHNOLOGY |
| JP2008139130A (en) * | 2006-12-01 | 2008-06-19 | Hitachi Ltd | Real-time analysis apparatus and method |
| JP5020648B2 (en) * | 2007-01-26 | 2012-09-05 | 日本電子株式会社 | Atmospheric pressure ionization method and sample holder |
| US7815803B2 (en) * | 2007-06-14 | 2010-10-19 | Roche Diagnostics Operations, Inc. | Preparation of samples for LC-MS/MS using magnetic particles |
| JP2010227728A (en) | 2007-06-26 | 2010-10-14 | Metawater Co Ltd | N2O removal method in exhaust gas from sewage sludge incinerator |
| JP5072682B2 (en) | 2008-03-28 | 2012-11-14 | 富士フイルム株式会社 | Device for mass spectrometry, mass spectrometer using the same, and mass spectrometry method |
| AU2010229490B2 (en) * | 2009-03-24 | 2015-02-12 | University Of Chicago | Slip chip device and methods |
-
2010
- 2010-10-07 JP JP2010227728A patent/JP5756611B2/en not_active Expired - Fee Related
-
2011
- 2011-10-05 US US13/877,360 patent/US9040904B2/en active Active
- 2011-10-05 EP EP11830706.5A patent/EP2626695A1/en not_active Withdrawn
- 2011-10-05 WO PCT/JP2011/072993 patent/WO2012046774A1/en not_active Ceased
Non-Patent Citations (1)
| Title |
|---|
| See references of WO2012046774A1 * |
Cited By (2)
| Publication number | Priority date | Publication date | Assignee | Title |
|---|---|---|---|---|
| GB2541004A (en) * | 2015-08-05 | 2017-02-08 | Micromass Ltd | Second ion source for lockmass calibration of matrix assisted laser desorption ionisation mass spectrometer |
| GB2541004B (en) * | 2015-08-05 | 2022-01-19 | Micromass Ltd | Second ion source for lockmass calibration of matrix assisted laser desorption ionisation mass spectrometer |
Also Published As
| Publication number | Publication date |
|---|---|
| WO2012046774A1 (en) | 2012-04-12 |
| JP2012083138A (en) | 2012-04-26 |
| US20130187034A1 (en) | 2013-07-25 |
| US9040904B2 (en) | 2015-05-26 |
| JP5756611B2 (en) | 2015-07-29 |
Similar Documents
| Publication | Publication Date | Title |
|---|---|---|
| US9040904B2 (en) | Analysis method, adhesive tape, and pen | |
| CN110892503B (en) | Mobility and mass measurements using time-varying electric fields | |
| US7547878B2 (en) | Neutral/Ion reactor in adiabatic supersonic gas flow for ion mobility time-of-flight mass spectrometry | |
| US8884221B2 (en) | High performance ion mobility spectrometer apparatus and methods | |
| US10388499B2 (en) | Confirmation using multiple collision cross section (“CCS”) measurements | |
| DE112015002734B4 (en) | SELF-CALIBRATION OF SPECTRA USING MOLECULAR WEIGHT DIFFERENCES BASED ON KNOWN CHARGE STATES | |
| EP3014648B1 (en) | Dual polarity spark ion source | |
| Ennis et al. | A hollow cathode proton transfer reaction time of flight mass spectrometer | |
| Syage et al. | A man‐portable, photoionization time‐of‐flight mass spectrometer | |
| ITRM20070312A1 (en) | SAMPLE HOLDER DEVICE FOR ROOMS FOR IONIZATION OF MASS SPECTROMETERS | |
| CN103901145A (en) | Normal-pressure micro-glow discharge desorption mass spectrum ion source and mass spectrometry device composed of ion source | |
| Frey et al. | Controlling gas-phase reactions for efficient charge reduction electrospray mass spectrometry of intact proteins | |
| US9188564B2 (en) | Ionisation method for a universal gas analyzer | |
| WO2004013602A3 (en) | Combined chemical/biological agent detection system and method utilizing mass spectrometry | |
| Basurto et al. | Electron swarm coefficients and the limiting field strength of SF6–N2O mixtures | |
| JP2008180659A (en) | Atmospheric pressure ionization method and sample holder | |
| US9983172B2 (en) | Mass determination using ion mobility measurements | |
| JP2013015516A (en) | Analysis method and analysis kit | |
| Kuki et al. | In-source collision induced dissociation study of polyethers cationized by alkali metal ions | |
| Hendricks et al. | Performance of a low voltage ion trap | |
| Tang et al. | Experimental and simulation research on the influence of voltage amplitude, frequency and carrier gas flow rate on the performance of FAIMS | |
| CN210668276U (en) | A multi-segment quadrupole electrode system | |
| JPWO2007029431A1 (en) | Detection mass calibration method of mass spectrometer | |
| GB2527876A (en) | Confirmation using multiple collision cross section ("CCS") Measurements | |
| Norwood et al. | Analytical techniques for identification and quantitation of extractables and leachables |
Legal Events
| Date | Code | Title | Description |
|---|---|---|---|
| PUAI | Public reference made under article 153(3) epc to a published international application that has entered the european phase |
Free format text: ORIGINAL CODE: 0009012 |
|
| 17P | Request for examination filed |
Effective date: 20130405 |
|
| AK | Designated contracting states |
Kind code of ref document: A1 Designated state(s): AL AT BE BG CH CY CZ DE DK EE ES FI FR GB GR HR HU IE IS IT LI LT LU LV MC MK MT NL NO PL PT RO RS SE SI SK SM TR |
|
| DAX | Request for extension of the european patent (deleted) | ||
| STAA | Information on the status of an ep patent application or granted ep patent |
Free format text: STATUS: REQUEST FOR EXAMINATION WAS MADE |
|
| STAA | Information on the status of an ep patent application or granted ep patent |
Free format text: STATUS: THE APPLICATION IS DEEMED TO BE WITHDRAWN |
|
| 18D | Application deemed to be withdrawn |
Effective date: 20170503 |