EP2546637B1 - Verfahren und Vorrichtung zur Bestimmung von Antikoagulanstherapiefaktoren - Google Patents
Verfahren und Vorrichtung zur Bestimmung von Antikoagulanstherapiefaktoren Download PDFInfo
- Publication number
- EP2546637B1 EP2546637B1 EP12163048.7A EP12163048A EP2546637B1 EP 2546637 B1 EP2546637 B1 EP 2546637B1 EP 12163048 A EP12163048 A EP 12163048A EP 2546637 B1 EP2546637 B1 EP 2546637B1
- Authority
- EP
- European Patent Office
- Prior art keywords
- clotting
- fibrinogen
- sample
- value
- time
- Prior art date
- Legal status (The legal status is an assumption and is not a legal conclusion. Google has not performed a legal analysis and makes no representation as to the accuracy of the status listed.)
- Not-in-force
Links
Images


Classifications
-
- G—PHYSICS
- G01—MEASURING; TESTING
- G01N—INVESTIGATING OR ANALYSING MATERIALS BY DETERMINING THEIR CHEMICAL OR PHYSICAL PROPERTIES
- G01N21/00—Investigating or analysing materials by the use of optical means, i.e. using sub-millimetre waves, infrared, visible or ultraviolet light
- G01N21/75—Systems in which material is subjected to a chemical reaction, the progress or the result of the reaction being investigated
- G01N21/77—Systems in which material is subjected to a chemical reaction, the progress or the result of the reaction being investigated by observing the effect on a chemical indicator
- G01N21/82—Systems in which material is subjected to a chemical reaction, the progress or the result of the reaction being investigated by observing the effect on a chemical indicator producing a precipitate or turbidity
-
- G—PHYSICS
- G01—MEASURING; TESTING
- G01N—INVESTIGATING OR ANALYSING MATERIALS BY DETERMINING THEIR CHEMICAL OR PHYSICAL PROPERTIES
- G01N33/00—Investigating or analysing materials by specific methods not covered by groups G01N1/00 - G01N31/00
- G01N33/48—Biological material, e.g. blood, urine; Haemocytometers
- G01N33/483—Physical analysis of biological material
- G01N33/487—Physical analysis of biological material of liquid biological material
- G01N33/49—Blood
- G01N33/4905—Determining clotting time of blood
-
- G—PHYSICS
- G01—MEASURING; TESTING
- G01N—INVESTIGATING OR ANALYSING MATERIALS BY DETERMINING THEIR CHEMICAL OR PHYSICAL PROPERTIES
- G01N33/00—Investigating or analysing materials by specific methods not covered by groups G01N1/00 - G01N31/00
- G01N33/48—Biological material, e.g. blood, urine; Haemocytometers
- G01N33/50—Chemical analysis of biological material, e.g. blood, urine; Testing involving biospecific ligand binding methods; Immunological testing
- G01N33/86—Chemical analysis of biological material, e.g. blood, urine; Testing involving biospecific ligand binding methods; Immunological testing involving blood coagulating time or factors, or their receptors
-
- G—PHYSICS
- G01—MEASURING; TESTING
- G01N—INVESTIGATING OR ANALYSING MATERIALS BY DETERMINING THEIR CHEMICAL OR PHYSICAL PROPERTIES
- G01N2333/00—Assays involving biological materials from specific organisms or of a specific nature
- G01N2333/435—Assays involving biological materials from specific organisms or of a specific nature from animals; from humans
- G01N2333/745—Assays involving non-enzymic blood coagulation factors
- G01N2333/75—Fibrin; Fibrinogen
-
- G—PHYSICS
- G01—MEASURING; TESTING
- G01N—INVESTIGATING OR ANALYSING MATERIALS BY DETERMINING THEIR CHEMICAL OR PHYSICAL PROPERTIES
- G01N2333/00—Assays involving biological materials from specific organisms or of a specific nature
- G01N2333/90—Enzymes; Proenzymes
- G01N2333/914—Hydrolases (3)
- G01N2333/948—Hydrolases (3) acting on peptide bonds (3.4)
- G01N2333/968—Plasmin, i.e. fibrinolysin
Definitions
- This invention relates to analyzing blood for carrying out coagulation studies and other chemistry procedures, including monitoring oral anticoagulant therapy to take into account the platelet count in determining prothrombin times (PT), and providing new Anticoagulant Therapy Factors that are useful in diagnosing and treating individuals in relation to blood conditions.
- PT prothrombin times
- Oral anticoagulant therapy generally involves the use of oral anticoagulants - a class of drugs which inhibit blood clotting.
- strict monitoring is accomplished and is more fully described in various medical technical literature, such as the articles entitled "PTs, PR, ISIs and INRs: A Primer on Prothrombin Time Reporting Parts I and II" respectively published November, 1993 and December, 1993 issues of Clinical Hemostasis Review .
- anticoagulant therapy monitoring takes into account three parameters which are: International Normalized Ratio (INR), International Sensitivity Index (ISI) and prothrombin time (PT), reported in seconds.
- the prothrombin time (PT) indicates the level of prothrombin and blood factors V, VII, and X in a plasma sample and is a measure of the coagulation response of a patient. Also affecting this response may be plasma coagulation inhibitors, such as, for example, protein C and protein S. Some individuals have deficiencies of protein C and protein S.
- the INR and ISI parameters are needed so as to take into account various differences in instrumentation, methodologies and in thromboplastins' (Tps) sensitivities used in anticoagulant therapy.
- thromboplastins used in North America are derived from rabbit brain, those previously used in Great Britain from human brain, and those used in Europe from either rabbit brain or bovine brain.
- the INR and ISI parameters take into account all of these various factors, such as the differences in thromboplastins (Tps), to provide a standardized system for monitoring oral anticoagulant therapy to reduce serious problems related to prior, during and after surgery, such as excessive bleeding or the formation of blood clots.
- the ISI itself according to the WHO 1999 guidelines, Publication no. 889-1999, have coefficients of variation ranging from 1.7% to 8.1%. Therefore, if the ISI is used exponentially to determine the INR of a patient, then the coefficients of variation for the INR's must be even greater than those for the ISI range.
- INR International Normalized Ratio
- ISI International Sensitivity Index
- PT patient's prothrombin time
- ISI International Normalized Ratio
- This invention relates to the inventions disclosed in U.S. Patent Nos. 3,905,769 ('769) of Sep. 16, 1975; 5,197,017 ('017) dated Mar. 23, 1993; and 5,502,651 ('651) dated Mar. 26, 1996, all issued to Wallace E. Carroll and R. David Jackson.
- the present invention provides apparatus and methods for monitoring anticoagulant therapy.
- the present invention relates to a method for determining a coagulation parameter for a blood or blood component of a living being according to appended claims 1-7.
- the apparatus and methods may be used to determine anticoagulant therapy factors which are designated herein, in particular, to determine new Anticoagulant Therapy Factors (nATF's) which preferably may replace International Normalized Ratio (INR) in anticoagulation therapy management.
- anticoagulation therapy involved the use of International Normalized Ratios (INR's).
- the International Normalized Ratio (INR) was utilized in order to arrive at an anticoagulant therapy factor (ATF).
- the INR based ATF was dependent on the prothrombin time (PT), the prothrombin ratio (PR), a fibrinogen transformation rate (FTR), and a maximum acceleration point (MAP) having an associated time to maximum acceleration (TMA).
- a new anticoagulant therapy factor is based upon a determination of the fibrinogen transformation rate (FTR) which, in turn, is dependent on a maximum acceleration point (MAP) for fibrinogen (FBG) conversion.
- FTR fibrinogen transformation rate
- MAP maximum acceleration point
- FBG fibrinogen
- the nATF quantity is also based upon the time to maximum acceleration from the time of reagent injection (TX) into a plasma sample, but does not require the difficulty of obtaining prior art International Normalized Ratio (INR) and International Sensitivity Index (ISI) parameters.
- INR International Normalized Ratio
- methods and apparatus are provided for determining an anticoagulation therapy factor, which do not require the use of a mean normal prothrombin time (MNPT) and ISI data.
- MNPT mean normal prothrombin time
- ISI ISI data
- the invention provides methods and apparatus for determining an anticoagulant therapy factor or INR, such as INRn, from the derivation of clotting curve values in connection with a designated area defined by clotting curve data.
- INR anticoagulant therapy factor
- An area defined by clotting curve data that corresponds with the area of a trapezoid formed along the clotting curve is used.
- the methods and apparatus determine an anticoagulant therapy factor or INR, such as INRs, from the derivation of clotting curve values in connection with a designated area defined by clotting curve data that may be utilized to determine an anticoagulant therapy factor.
- An area defined by clotting curve data corresponds with a clotting area that is derived derived from values represented by the optical activity (such as absorbance values) and time intervals at which that ativity occurs.
- a multiplier is applied to an area value to adjust the area, for example, to account for pixel parity and sampling time.
- INR an empirically-derived INR
- PT Quick prothrombin time
- MNPT mean normal prothrombin time
- the present methods and devices provide improved alternative INR determinations.
- an INR value is determined using a standard curve that is created with fibrinogen standards, such as, for example, using FDA-cleared high and low fibrinogen standards and three fibrinogen / INR controls of levels 1, 2 and 3.
- the INR (standard) value is obtained for the standards and a hypothetical or theoretical clotting AREA value (A) is calculated for each of the tested thromboplastin standards.
- the resultant Area and INR values are related to determine a power regression, in which the determination of patient samples using the same thromboplastin reagent as that used for the standards may be carried out by determining the clotting area for the sample, and applying the power regression expression to derive an INRs value for the sample based on the sample's clotting area (A).
- the method and apparatus may provide INRs/ATFs coagulation values that may be used to determine a course of treatment for a patient.
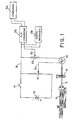
- a light source 4 which may be a low power gas laser, or other light producing device, producing a beam of light 6 which passes through a sample test tube, such as the container 8, and is received by detection means which is preferably a silicon or selenium generating photocell 10 (photovoltaic cell).
- Battery 12 acts as a constant voltage DC source. Its negative terminal is connected through switch 14 to one end of variable resistor 16 and its positive terminal is connected directly to the opposite end of variable resistor 16.
- the combination of battery 12 and variable resistor 16 provides a variable DC voltage source, the variable voltage being derivable between line 18 at the upper terminal of resistor 16 and wiper 20.
- variable DC voltage source is connected in series with detection means photocell 10, the positive output of detection means photocell 10 being connected to the wiper 20 of variable resistor 16 so that the voltage produced by the variable voltage DC source opposes the voltage produced by the detection means photocell 10.
- the negative output of detection means photocell 10 is connected through variable resistor 22 to line 18.
- the voltage across variable resistor 22 is the difference between the voltage produced by the variable voltage DC source and the voltage produced by the photovoltaic cell 10.
- the output of the electrical network is taken between line 18 and wiper 24 of variable resistor 22.
- variable resistor 22 acts as a multiplier, multiplying the voltage produced as a result of the aforesaid subtraction by a selective variable depending on the setting of variable resistor 22.
- the potentiophotometer just described embodies the electrical-analog solution to Beer's Law and its output is expressed directly in the concentration of the substance being measured.
- Wiper 24 is illustrated placed at a position to give a suitable output and is not varied during the running of the test.
- the output between line 18 and wiper 24 is delivered to an A/D converter 26 and digital recorder 28.
- the A/D converter 26 and the digital recorder 28 may be combined into one piece of equipment and may, for example, be a device sold commercially by National Instrument of Austin, Texas as their type Lab-PC+.
- the signal across variable resistor 22 is an analog signal and hence the portion of the signal between leads 18 and wiper 24, which is applied to the A/D converter 26 and digital recorder 28, is also analog.
- a computer 30 is connected to the output of the A/D converter 26, is preferably IBM compatible, and is programmed in a manner described hereinafter.
- the detector cell 10 is positioned adjacent an opposite wall of the sample container 8, and the emitter light source 4 positioned adjacent on opposite wall, so the light 6 emitted from the light source 4 passes through the container 8.
- the light source 4 is preferably selected to produce light 6 which can be absorbed by one or more components which are to be measured.
- the apparatus can be used to carry out coagulation studies in accordance with the invention.
- the light source 4 may, for example, comprise a light emitting diode (LED) emitting a predetermined wavelength, such as for example, a wavelength of 660 nm
- the detector cell 10 may, for example, comprise a silicon photovoltaic cell detector.
- a bar code reader may also be provided to read bar code labels placed on the sample container 8. The bar code reader may produce a signal which can be read by the computer 30 to associate a set of data with a particular sample container 8.
- the citrated blood is separated from the red blood cell component of the blood.
- Conventional methods of separation which include centrifugation, may be employed.
- the use of a container device such as that disclosed in our issued U.S. Patent 6,706,536 , may also be used, and the method disclosed therein for reading the plasma volume relative to the sample volume may also be employed.
- Illustrative of an apparatus and method according to one embodiment is a coagulation study which can be carried out therewith.
- a reagent such as, for example, Thromboplastin-Calcium (Tp-Ca)
- Tp-Ca Thromboplastin-Calcium
- the reagent addition is done by dispensing an appropriate amount of the reagent into the plasma portion of the blood.
- the plasma portion may be obtained by any suitable separation technique, such as for example, centrifugation.
- the container 8 is vented when reagent is added.
- the reagent for example, may comprise thromboplastin, which is added in an amount equal to twice the volume of the plasma.
- the reagent is mixed with the plasma. It is preferable to minimize air bubbles so as not to interfere with the results.
- the plasma sample to which the reagent has been added is heated to maintain a 37°C temperature, which, for example, may be done by placing the container holding the plasma and reagent in a heating chamber (not shown).
- Readings are taken of the optical activity of the components in the sample container 8.
- Reaction kinematics may be studied by observing changes in the optical density of the plasma layer.
- an amount of reagent such as Thromboplastin-Calcium (Tp-Ca)
- Tp-Ca Thromboplastin-Calcium
- the plasma sample in the container may comprise a known amount of volume. Alternately, the plasma volume may be ascertained through the method and apparatus described in our U.S. Patent 6,706,536 .
- a controlled amount of Tp-Ca reagent is added to the plasma sample.
- the amount of reagent added corresponds to the amount of plasma volume.
- the detector cell 10 and emitter light source 4 are preferably positioned so the absorbance of the plasma sample may be read, including when the reagent is added and the sample volume is thereby increased.
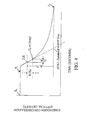
- Fig. 2 shows a graph of a plot of the various phases of the fibrinogen concentration occurring in a typical plasma clotting process. The change in optical density of the plasma level occurs after reagents have been added. The optical density of the plasma sample is monitored, as optically clear fibrinogen converts to turbid fibrin.
- MAP Maximum Acceleration Point A point where the fibrinogen conversion achieves maximum acceleration and begins to decelerate. EOT End of Test Point where there is no appreciable change in the polymerization of fibrin.
- TEOT Theoretical End Of Test The time to convert all fibrinogen based on the time to convert the fibrinogen during the simulated Zero Order Kinetic rate. TX (or T 2 ) Time to Map Time to reach the Maximum Acceleration Point (MAP) from point of injection. MNTX Mean Normal Time to Map The mean of the times of at least 20 normal people to reach then Maximum Acceleration Point (MAP). FTR Fibrinogen Transformation Ratio The amount of fibrinogen converted during a particular time period. This is a percentage of the total Fibrinogen.
- ATF Anticoagulation Therapy Factor The calculated value used to monitor the uses of an anticoagulant without a need for an International Sensitivity Index (ISI) of a thromboplastin.
- ISI International Sensitivity Index
- nATF new Anticoagulation Therapy Factor A replacement for the INR to provide a standardized system for monitoring oral anticoagulant therapy.
- Amso expressed as ATFt and ATFz PR Prothrombin Ratio A value computed by dividing a sample PT by the geometric mean of at least 20 normal people (MNPT).
- INR International Normalized Ratio A parameter which takes into account the various factors involved in anticoagulation therapy monitoring to provide a standardized system for monitoring oral anticoagulant therapy.
- ATFt Anticoagulation Therapy Factor Theoretical Utilizing a calculated Theoretical End Of Test value and the Natural Log “e” to removed the need for an MNPT.
- XR Time to MAP Ratio The value computed by dividing a sample "TX” by the geometric mean of at least 20 normal people "MNTX”.
- INR International Normalized Ratio
- PT patient is the prothrombin time (PT) as an absolute value in seconds for a patient
- PT geometric mean is the mean, a presumed number of normal patients.
- the International Sensitivity Index (ISI) is an equalizing number which a reagent manufacturer of thromboplastin specifies.
- the ISI is a value which is obtained through calibration against a World Health Organization primary reference thromboplastin standard.
- Local ISI (LSI) values have also been used to provide a further refinement of the manufacturer-assigned ISI of the referenced thromboplastin in order to provide local calibration of the ISI value.
- the present invention can be employed for accurate determination of a new Anticoagulant Therapy Factor (nATF) from a human blood sample, for use during the monitoring of oral anticoagulant therapy, without the need for an ISI or LSI value, and without the need for an INR value as traditionally determined from the above equation (using a patient's prothrombin time and the prothrombin time from a geometric mean of individuals).
- nATF Anticoagulant Therapy Factor
- blood clotting Factors I, II, V, VII, VIII, IX and X are associated with platelets (Bounameaux, 1957); and, among these, Factors II, VII, IX and X are less firmly attached, since they are readily removed from the platelets by washing (Betterle, Fabris et al, 1977).
- the role of these platelet-involved clotting factors in blood coagulation is not, however, defined.
- the present invention provides a method and apparatus for a new Anticoagulant Therapy Factor (nATF) which may be used for anticoagulant therapy monitoring without the need for INR.
- nATF Anticoagulant Therapy Factor
- the International Normalized Ratio is previously discussed in reference technical articles entitled " PTs, PRs, ISIs and INRs: A Primer on Prothrombin Time Reporting Part I and II respectively," published in November, 1993 and December, 1993 issues of Clinical Hemostasis Review .
- the illustrative example of an analysis which is carried out employing the present invention relies upon the maximum acceleration point (MAP) at which fibrinogen conversion achieves a maximum and from there decelerates, the time to reach the MAP (TX), and the mean normal time to MAP (MNTX), and a fibrinogen transformation rate (FTR), that is, the thrombin activity in which fibrinogen (FBG) is converted to fibrin to cause clotting in blood plasma.
- MAP maximum acceleration point
- TX time to reach the MAP
- MNTX mean normal time to MAP
- FTR fibrinogen transformation rate
- a thromboplastin activates factor VII which, activates factor X, which, in turn, under catalytic action of factor V, activates factor II (sometimes referred to as prothrombin) to cause factor IIa (sometimes referred to as thrombin) that converts fibrinogen (FBG) to fibrin with resultant turbidity activity which is measured, in a manner as to be described hereinafter, when the reaction is undergoing simulated zero-order kinetics.
- the thromboplastin (Tp) does not take part in the reaction where factor IIa (thrombin) converts fibrinogen (FBG) to fibrin which is deterministic of the clotting of the plasma of the patient under consideration.
- the thromboplastin (Tp) only acts to activate factor VII to start the whole cascade rolling.
- differing thromboplastins (Tps) have differing rates of effect on factor VII, so the rates of enzyme factor reactions up to II - IIa (the PT) will vary.
- thromboplastins Tps
- ILR International Normalized Ratio
- ISI International Sensitivity Index
- the thromboplastin (Tp) is needed therefore only to start the reactions that give factor IIa. Once the factor IIa is obtained, fibrinogen (FBG) to fibrin conversion goes on its own independent of the thromboplastin (Tp) used.
- the present method and apparatus has use, for example, in coagulation studies where fibrinogen (FBG) standard solutions and a control solution are employed, wherein the fibrinogen standard solutions act as dormant references to which solutions analyzed with the present invention are compared, whereas the control solution acts as a reagent that is used to control a reaction.
- the fibrinogen standards include both high and low solutions, whereas the control solution is particularly used to control clotting times and fibrinogens of blood samples. It is only necessary to use fibrinogen standards when PT-derived fibrinogens (FBG's) are determined. In connection with other embodiments of the invention, fibrinogen (FBG) standards are not necessary for the INR determination (such as for example INRz described herein).
- Another embodiment provides a method and apparatus for determining an anticoagulation therapy factor which does not require the use of fibrinogen standard solutions.
- the apparatus and method may be carried out without the need to ascertain the mean normal prothrombin time (MNPT) of 20 presumed normal patients.
- MNPT mean normal prothrombin time
- a fibrinogen (FBG) solution of about 10 g/l may be prepared from a cryoprecipitate.
- the cryoprecipitate may be prepared by freezing plasma, letting the plasma thaw in a refrigerator and then, as known in the art, expressing off the plasma so as to leave behind the residue cryoprecipitate.
- the gathered cryoprecipitate should contain a substantial amount of both desired fibrinogen (FBG) and factor VIII (antihemophilic globulin), along with other elements that are not of particular concern to the present invention.
- the 10 g/l fibrinogen (FBG) solution after further treatment, serves as the source for the high fibrinogen (FBG) standard.
- an Owren's Veronal Buffer pH 7.35
- normal saline solution which, after further treatment, may serve as a source of the low fibrinogen (FBG) standard.
- the fibrinogen standard can be created by adding fibrinogen to normal plasma in an empty container.
- the fibrinogen standard is formed from a 1:1 fibrinogen to normal plasma solution.
- 0.5 ml of fibrinogen and 0.5 ml of plasma can be added together in an empty container.
- Thromboplastin calcium is then added to the fibrinogen standard.
- twice the amount by volume of thromboplastin is added into the container per volume amount of fibrinogen standard which is present in the container. The reaction is watched with the apparatus 10.
- FBG fibrinogen
- a chemical method to determine fibrinogen (FBG) is used, such as, the Ware method to clot, collect and wash the fibrin clot and the Ratnoff method to dissolve the clot and measure the fibrinogen (FBG) by its tyrosine content.
- the Ware method is used to obtain the clot and generally involves collecting blood using citrate, oxalate or disodium ethylenediaminetetraacetate as anticoagulant, typically adding 1.0 ml to about 30 ml 0.85% or 0.90% sodium chloride (NaCl) in a flask containing 1 ml M/5 phosphate buffer and 0.5 ml 1% calcium chloride CaCl 2 , and then adding 0.2 ml (100 units) of a thrombin solution.
- the solution is mixed and allowed to stand at room temperature for fifteen minutes, the fibrin forming in less than one minute forming a solid gel if the fibrinogen concentration is normal.
- a glass rod may be introduced into the solution and the clot wound around the rod. See Richard J. Henry, M.D., et al., Clinical Chemistry: Principals and Techniques (2nd Edition) 1974, Harper and Row, pp. 458-459 .
- the Ratnoff method may be utilized to dissolve the clot and measure the fibrinogen (FBG) by its tyrosine content. See " A New Method for the Determination of Fibrinogen in Small Samples of Plasma", Oscar D. Ratnoff, M.D. et al., J. Lab. Clin. Med., 1951: V.37 pp. 316-320 .
- the Ratnoff method relies on the optical density of the developed color being proportional to the concentration of fibrinogen or tyrosine and sets forth a calibration curve for determining the relationship between optical density and concentration of fibrinogen.
- the addition of a fibrinogen standard preferably is added to the plasma sample based on the volume of the plasma.
- the addition of the reagent Thromboplastin C serves as a coagulant to cause clotting to occur within a sample of citrated blood under test which may be contained in a container 8.
- the A/D converter 26 of Fig. 1 will count and produce a digital value of voltage at a predetermined period, such as once every 0.05 or 0.01 seconds.
- these voltage values are stored and then printed by the recorder as an array of numbers, the printing being from left to right and line by line, top to bottom. There are typically one hundred numbers in the five groups representing voltage values every second and hence, one line represents one-fifth of a second in time (20x0.01 seconds).
- Fig. 2 illustrates the data point locations of a clotting curve related to a coagulation study which illustrates the activation and conversion of fibrinogen to fibrin.
- Fig. 2 illustrates a "clot slope" method that may be used in a blood coagulation study carried out for determining a new anticoagulant therapy factor (nATFa).
- nATFa new anticoagulant therapy factor
- the first delta (IUX) represents the fibrinogen (FBG) for MAP (-a number of seconds) to MAP (+a number of seconds) (that is the fibrinogen (FBG) converted from t ⁇ MAp to T MAP on Fig. 2 ).
- the (IUT) represents fibrinogen converted from c 1 to c EOT (that is the fibrinogen converted from t 1 to T EOT , see Fig. 2 ).
- the quantities given along the Y-axis of Fig. 2 are values (+and-) that may be displayed by the digital recorder 28.
- the "clot slope” method comprises detection of the rate or the slope of the curve associated with the formation of fibrin from fibrinogen.
- the "clot slope” method takes into account the time to maximum acceleration (TX) which is the point at which fibrinogen conversion achieves a maximum and from there decelerates.
- the thromboplastin/calcium ion reagent is introduced into the blood plasma which causes a disturbance to the composition of the plasma sample which, in turn, causes the optical density of the plasma sample to increase momentarily.
- the digital quantity of the recorder 28 of Fig. 1 rapidly increases and then levels off in a relatively smooth manner and then continues along until the quantity c 1 is reached at a time t 1 .
- the time which elapses between the injection of thromboplastin at to and the instant time t 1 of the quantity c 1 is the prothrombin time (PT) and is indicated in Fig. 2 by the symbol PT.
- PT prothrombin time
- Fig. 2 the baseline that develops after the thromboplastin (TP) is introduced or injected into the sample generally is thought to represent the "lag phase" of all of the enzymes preceding prothrombin converting to fibrin.
- the enzymes types and amounts may vary from person to person, and thus, this would demonstrate the potential for prothrombin times to vary between individuals.
- nATF anticoagulant therapy factor
- the optical density of a quantity c 1 directly corresponds to a specified minimum amount of fibrinogen (FBG) that must be present for a measuring system, such as the circuit arrangement of Fig. 1 , to detect in the plasma sample that a clot is being formed, i.e., through the transformation of fibrinogen to fibrin.
- the quantities shown in Fig. 2 are of optical densities, which may be measured in instrument units, that are directly correlatable to fibrinogen concentration values.
- the quantity c 1 may vary from one clot detection system to another, but for the potentiophotometer system of Fig. 1 , this minimum is defined by units of mass having a value of about 0.05 grams/liter (g/l).
- a first predetermined quantity c 1 is illustrated occurring at a corresponding time t 1 , which is the start of the clotting process.
- this process may be monitored with the apparatus of Fig.1 for determining a new anticoagulant therapy factor (nATF).
- the time t 1 is the beginning point of the fibrinogen formation, that is, it is the point that corresponds to the beginning of the acceleration of the fibrinogen conversion that lasts for a predetermined time,
- the acceleration of the fibrinogen conversion proceeds from time (t 1 ) and continues until a time t MAP , having a corresponding quantity c MAP .
- the time t MAP is of primary importance because it is the point of maximum acceleration of the fibrinogen (FBG) to fibrin conversion and is also the point where deceleration of fibrinogen (FBG) to fibrin conversion begins.
- the elapsed time from to to t MAP is a time to maximum acceleration from reagent injection (TX), shown in Fig. 2 .
- TX time to maximum acceleration from reagent injection
- the conversion of fibrinogen to fibrin is quantified every 0.1 seconds.
- the time to maximum acceleration from reagent injection (TX) is defined as the point on the clotting curve time line where this conversion has reached its maximum value for the last time, simulating a zero-order kinetic rate.
- the delta value of two points at a fixed interval may be measured until this value begins to decrease. This value is tracked for a period of time, such as for example five seconds, after the first decreasing value has been determined. This facilitates ascertainment of the last point of what may be referred to as a simulated zero-order kinetic rate. Referring to Fig. 3 , a zero order kinetic rate is illustrated by the line (L).
- a quantity c MAP and a corresponding time t MAP define a maximum acceleration point (MAP). Fibrin formation, after a short lag phase before the MAP, occurs for a period of time, in a linear manner. Fibrinogen (FBG) is in excess during this lag phase, and fibrin formation appears linear up to the MAP.
- FBG Fibrinogen
- the deceleration of fibrinogen (FBG) to fibrin conversion continues until a quantity c EOT is reached at a time T EOT .
- the time T EOT is the point where the deceleration of the fibrinogen (FBG) to fibrin conversion corresponds to a value which is less than the required amount of fibrinogen (FBG) that was present in order to start the fibrinogen (FBG) to fibrin conversion process.
- the time T EOT represents the ending point of the fibrinogen (FBG) to fibrin conversion in accordance with the coagulation study exemplified herein, which may be referred to as the end of the test (EOT).
- the fibrinogen (FBG) to fibrin conversion has a starting point of t 1 and an ending point of T EOT .
- the differential of these times, t 1 and T EOT define a second delta (IUT).
- the fibrinogen (FBG) to fibrin conversion is defined, in part, by the point (T EOT ) where the deceleration of conversion becomes less than the instrument value of about 0.05 g/l that is used to detect the clot point (t 1 ).
- T EOT the point where the deceleration of conversion becomes less than the instrument value of about 0.05 g/l that is used to detect the clot point (t 1 ).
- a specific amount of fibrinogen needs to be present in order to detect a clot forming.
- Adhering to the four given critical parameters is an example of how the present apparatus and method may be used to carry out a coagulation study to determine a specific quantity of fibrinogen. In order for that specific amount of fibrinogen to be determined, it is first necessary to detect a clot point (t 1 ).
- the apparatus may comprise a computer which is programmed to record, store and process data.
- the zero order rate may be determined by ascertaining data from analyzing the sample, and optical density properties.
- One example of how this may be accomplished is using two arrays, a data array and a sub array.
- a data array may be ascertained by collecting data over a time interval.
- the data array may comprise a sequential list of optical densities, taken of a sample by an optical analytical instrument, such as, for example, a spectrophotometer, for a frequency of time.
- the frequency of sample data is taken every 100 th of a second.
- a computer is programmed to record the optical density of the sample, every 100 th of a second.
- NOW and THEN Two values, NOW and THEN, for the data array are provided for ascertaining the Prothrombin Time (PT) (which is the time point T 1 ), maximum acceleration point (MAP), and end of test point (EOT).
- PT Prothrombin Time
- MAP maximum acceleration point
- EOT end of test point
- Two time definitions may be specified, one being the interval between NOW and THEN on the clotting curve, which may be 2.72 seconds (272/100 th of a second), the second being the size of the filter used for signal averaging.
- NOW is the sum of the last 20 optical densities and THEN is the sum of the 10 prior data points 2.72 seconds prior to NOW.
- a graphical illustration is provided in Fig. 5 . As illustrated in Fig. 5 , four values are defined: SUM(NOW), SUM(THEN), AVERAGE(NOW) and AVERAGE(THEN). The average is the sum divided by the filter value.
- the sub array may be defined as a sequential list of delta absorbance units. This may begin at T 1 , the prothrombin time (PT), and continue until the last highest delta absorbance (delta A) has been detected, then continues an additional five (5) seconds to insure the last delta A has been found.
- T 2 S may be accomplished by locating within the sub array, the first occurrence of when the sub array delta value is greater than or equal to 80% of the highest delta absorbance units.
- the first derivative is ascertained by computing the difference between (NOW) and (THEN).
- the PT is ascertained by determining the point prior to the positive difference between AVERAGE(THEN) and AVERAGE(NOW) for a period of 2.72 seconds or 272 ticks.
- the MAP is the point where the last highest difference between SUM(THEN) and SUM(NOW) has occurred.
- the computer may be programmed to store this delta A value in the sub array.
- the EOT may be ascertained by determining the point prior to where the difference between SUM(THEN) and SUM(NOW) is less than one.
- Table 2 illustrates examples of samples, identified by ID numbers, along with corresponding data which compares the ATF values obtained for an ATF determined through the prior method, using ISI and INR values (represented as ATFa), an ATF determined through the use of a zero order kinetic reaction using the MNTX (nATFz), and an ATF determined without using the MNXT or ISI (nATFt).
- the data in table 2 represents universal laboratory data from combined locations for the patients listed. The data is based on analysis of absorbance data, storage of the data by the computer, such as, for example, with a storage device, like a hard drive, and retrieving the data and processing the data.
- the data, in the example represented in Table 2 was processed using the definitions and NOW and THEN intervals.
- AINR in Table 2 represents the INR value obtained pursuant to the World Health Organization (WHO), using expressions (A) and (B) above.
- GINR and MINR correspond to INR values used to determine the comparison data set forth in Tables 4 and 5.
- the determination of the new anticoagulant therapy factor may be carried out with a computer.
- the gathering, storing, and manipulation of the data generally illustrated in Fig. 4 may be accomplished by computer 30 of Fig. 1 that receives digital voltage values converted, by the A/D converter 26, from analog voltage quantities of the photocell 10 detection means.
- the IBM-compatible computer 30 of Fig. 1 stores and manipulates these digital values corresponding to related data of Fig. 4 and may be programmed as follows:
- the computer 30 may be used to manipulate and derive the quantities of expression (4) to determine a new anticoagulant therapy factor nATFt utilizing known programming routines and techniques.
- the data collected by a computer 30 may be used to manipulate and derive the new anticoagulant therapy factor (nATFt) of expression (4).
- nATFt new anticoagulant therapy factor
- using known mathematical techniques may derive the theoretical end of test TEOT of expression (5) and the second value VALUE 2 of expression (7) which, in turn, are used to determine the new anticoagulant therapy (nATFt) of expression (4).
- the determination is based on the patient's own sample, and does not rely on the determination of normal prothrombin times for the reagent used (e.g., thromboplastin, innovin or the like). With the nATFt, no longer does the accuracy of the quantities determined depend, in whole or part, on the number of specimens used, that is, the number of stable (or presumed stable) patients.
- the reagent used e.g., thromboplastin, innovin or the like.
- the new anticoagulation therapy factor (nATFt) does not require an ISI value, as was previously used to determine anticoagulation therapy factors.
- the new anticoagulation therapy factor (nATFt) uses for its ascertainment the values extracted from the clotting curve (see Fig. 4 ), in particular T 2 S, Tmap, TEOT, c T2S , cmap and ceot.
- the ISI is not required, nor is the MNPT, or the need to obtain and calculate the prothrombin times (PT's) for 20 presumed normal patients.
- the new anticoagulant therapy factor (nATFt) may replace INR in anticoagulant therapy management.
- the computer 30 has knowledge of the values obtained for the fibrinogen reaction, to ascertain the (nATFt).
- the present invention provides an apparatus and method for obtaining a new anticoagulant therapy factor (nATF) without encountering the complications involved with obtaining the prior art quantities International Normalized Ratio (INR) and International Sensitivity Index (ISI).
- INR International Normalized Ratio
- ISI International Sensitivity Index
- the new anticoagulant therapy factor preferably is a replacement for the International Normalized Ratio (INR).
- INR International Normalized Ratio
- Existing medical literature, instrumentation, and methodologies are closely linked to the International Normalized Ratio (INR).
- the nATFt was compared for correlation with the INR by comparative testing, to INR quantities, even with the understanding that the INR determination may have an error of about +/- 15%, at a 95% confidence interval, which needs to be taken into account to explain certain inconsistencies.
- nATFt new anticoagulant therapy factor
- Table 3 (Part A) and Table 3 (Part B) provide corresponding data for a coagulation study.
- Table 3 (Part A and B) the following references are used: Column Label Definition A ID Sample ID B OD@T 2 S OD at the start of Zero Order Kinetic C OD@Map OD at the Maximum Acceleration Point (MAP) D OD@Eot OD at the END OF TEST (Eot) E ⁇ T 2 SMap Delta of Column B and C creating the IUXz F ⁇ T 2 SEot Delta of Column B and D creating the IUTz G FTR od Ratio of Column E divided by F The FTR od is subtracted from 2 creating the Exponent that replaces the ISI H Time@T 2 S Time at the start of Zero Order Kinetics I Time@Map Time at the Maximum Acceleration Point (MAP) J Time@TEot Time at the Theoretical End of Test (TEOT) K ⁇ T 2 SMap Delta of Column H and I creating the IUXz (and ZTM) L
- an article may be provided to derive an anticoagulant therapy factor (ATF).
- the article may comprise stored instructions on a storage media which can be read and processed with a processor.
- the computer may be provided with a stored set of instructions, or chip, which is programmed to determine a new ATF for the spectral data obtained from the coagulation activity of a sample.
- the computer chip may be preprogrammed with a set of instructions for cooperating with the output of a photodetection device, such as, the device shown and described in Fig. 1 , which provides electrical data to said computer processor and/or storage device as a function of the optical density for a sample being analyzed.
- the chip may be employed in, or used with, an apparatus having input means and storage means for storing data.
- the set of instructions on the chip includes instructions for carrying out the steps of determining one or more anticoagulant therapy factors based on the expressions disclosed herein.
- an anticoagulant therapy factor is provided to derive an INR.
- the customary classical INR also referred to herein as INR m
- INR m has been the laboratory standard of care for monitoring oral anticoagulant therapies, such as, for example, coumarin therapy, for 25 years.
- the classical INR (INRm) which is discussed in the background, above, is cumbersome, and suffers from exponential inaccuracies.
- the exponent-derived INR m that is, the manufacturer's INR
- the alternate INR may be determined by computing the representative area of a trapezoid formed within the clotting curve absorbance, as determined by the absorbance values for the clotting reaction of a patient sample.
- the trapezoidal area is provided to approximate area under the clotting curve.
- the ISI and MNPT are eliminated.
- the sample of a person's blood or blood component is obtained and reacted with the coagulant, such as thromboplastin C, and the corresponding time and absorbance values for the clotting reaction of the sample are recorded.
- the INRn may be used to determine and regulate treatment for a patient, including administration of anticoagulant therapy, and other blood therapy applications.
- obtaining values for an area in connection with a blood clotting analysis is used to derive a corresponding INR value (INRn) (e.g., a value that may be used as the INR value is used).
- INRn INR value
- an Area T which may be made up of two sides S1 and S2, an upper base S3 and a lower base S4, may be derived to generate an INR value, INRn.
- An INRn value is derived from clotting curve data, wherein one or more locations along the clotting curve is be used to determine values corresponding to a designated area represented by a trapezoidal area, such as that area represented by Area T.
- the area is a two dimensional planar location, and, for example, may comprise a designated area located in a quadrant of an ordinate and abscissa corresponding with clotting curve time and absorbance values.
- the clotting curve and absorbance values preferably, may be obtained with the use of a photodetection apparatus, and a computer that records the electrical output of the detection components.
- a linear-output photo-optical coagulometer may be used to obtain optically responsive signal data from the sample, as the clotting reaction takes place.
- This reaction and absorbance data collection may be conducted as described herein in conjunction with the use of a coagulometer, such as the instrument illustrated in Fig.1 , or other suitable absorbance measuring device.
- Preferred devices are described herein and may be configured with the instructions to provide the INRn.
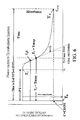
- a clotting curve is shown.
- An Area T is identified in the first quadrant where the clotting curve of a coagulation reaction is illustrated.
- the Area T derivation may be used to derive a corresponding INRn value for the patient sample that generated the information represented by the clotting curve.
- the INRn values obtained by the method and apparatus are useful in determining the treatment course for an individual, based on the INRn value.
- INRn Area T * MUL
- the MUL is a multiplier that is based on two relationships that are addressed by the multiplier.
- MUL relates the sampling rate of the instrument and the pixel parity of the x-y axis.
- the instrument used to measure the optical changes in the sample generates values, and preferably, the values, or signals are taken at a particular frequency.
- a preferred sampling rate for the clotting curve reaction of a patient blood or blood component sample may be a number of optical absorbance values in a particular time interval.
- a preferred rate for example, may be 100 optical absorbance values (or samples) per second, expressed 100/second.
- the sample rate preferably is used to derive a multiplier component, MUL.
- the parity value is a multiplier utilized to create x-y pixel parity for the clotting curve information (that is shown expressed on the clotting curve graph, see Fig. 6 ).
- the sampling rate used was 100 values per second.
- the pixel parity multiplier was 0.535.
- the multiplier, according to this example, is 0.535 (pixel parity value)/ 100 (the number of samples reflected in a second).
- the clotting curve is considered, and the theoretical or hypothetical zero order kinetic line, or line L as it is referred to and appears on the Figures, provides an (x,y) coordinate of (TEOT, 0), where the time value at which the clotting reaction, if theorized from the slope or line taken between the point where the maximum acceleration of the conversion rate of fibrinogen transformation begins (T2S) and the end of the maximum conversion (which is the last highest delta value of conversion rate), which is T2 or Tmap.
- the value, TEOT is a time value, and generally, for example, may be expressed in seconds.
- the right side S2 may be designated to correspond with the line formed between the point (t1, c1) and TEOT.
- the slope of the line L may corresponds with the slope of the side S2 of trapezoidal Area T.
- the line L may form the side S2 of the trapezoid whose area is illustrated as Area T.
- a segment of the line from TEOT and the point on the clotting curve T1 forms the trapezoid side S2.
- the lower base, S4, of the trapezoid TP is the time value of the theoretical or hypothetical end of the coagulation test, TEOT.
- the time value component TEOT includes the time value of T2 plus the time value (Tiut) to convert the remainder of the fibrinogen in the sample that is considered to provide active optical activity (by the theoretical time value of the end of the test, TEOT).
- Both the Teot and TSot are values that are determined from the absorbance readings for a sample in a coagulation reaction.
- the TEot also may be referred to herein as a theoretical end of test.
- the time that it takes to convert the IU @T1 to IU @T2S (which may be expressed as the difference between T1 and T2S (the value Tcon)) may be determined using the same rate of change.
- the TSot is determined by subtracting the time (Tcon) from T2S to give the TSot.
- the TSot may come before or after T1 and the TEot will always come before T3.
- an upper base, S3, is indicated to correspond with the time of the start of the clot formation when the coagulation reaction is carried out.
- the start time of the clotting is represented by the time, T1, as shown in Fig. 6 .
- the S3,S4 average may be used to derive a trapezoidal area, such as, for example, Area T, represented by the clotting absorbance signal data.
- the altitude S 1 (or height) of the trapezoidal area, Area T is derived by the value of the point of time (T1) where the beginning of the conversion of fibrinogen to fibrin for the patient sample is determined. That point is represented as time value T 1 on Figs. 6 and 7 .
- the height component of the trapezoid represented by Area T is designated to correspond with the side S 1.
- the height component is assigned the value T1 * MUL (T1 multiplied by the multiplier).
- the INRn may be determined for a patient sample by determining (i) when the clot formation begins, which is represented by the time value T1, (ii) when the clotting commences a maximum conversion rate (of conversion of fibrinogen to fibrin in the patient sample), which is represented by the time value T2, and (iii) the end of the maximum conversion rate, represented by the time value T3 (the end of the maximum conversion rate).
- a new INR determination that, through the transformation of information may be derived by (i) determining the start of the clotting when a reagent (such as, for example, thromboplastin C) is reacted with a blood or blood component sample of a person (by determining the length of time from the introduction of the reagent and sample to the time clotting begins, which is T1), (ii) determining the start of the maximum acceleration rate of conversion for the clotting reaction that began at time T1) which is represented by the time T2, and (ii) determining the value of the end of the maximum conversion rate for the clotting reaction, which is represented by the value T3.
- a reagent such as, for example, thromboplastin C
- the present method and apparatus may be used to derive an INR, INRn, which does not utilize exponential components, and therefore, is not subject to exponential inaccuracies that have previously been experienced in connection with traditional INR determinations.
- the INRn value may be used to monitor a patient's blood or blood components for administration of oral anticoagulant therapy, such as, for example, coumarin, and other treatment agents, including those discussed herein.
- the present method and apparatus where INRn is derived may be used for treatment administration of anticoagulant therapy.
- the clotting curve illustrates a representation of absorbance values for a clotting reaction where substantially optically clear fibrinogen converts to turbid fibrin, hence reducing the absorbance unit values, as indicated on the abscissa.
- the point of intersection of the line L with the x-axis, or the time axis preferably, may be derived using the value T2S and adding to that time value, the time required to convert additional fibrinogen in the sample, which is the time value corresponding with the absorbance value IUT (in instrument units).
- the TEOT value may be derived from the intercept that the slope of the line L defined by T2S and T2 makes with the x-axis.
- the IUT value is the difference between instrument units (or IU) at T2S (IU@T2S) and instrument units at T3 (IU@T3).
- a method was carried out using the Dade Behring Thromboplastin C Plus (Dade TPC+) as the reagent. The number of patient samples that were reacted and used to obtain the following data was 218.
- the WHO INR the World Health Organization INR is the average of INR values from five different thromboplastins.
- the INRm is the manufacturer's INR.
- INRz is the INR that is derived using the exponent (2-FTR) instead of the ISI (as described herein (see formulae (1), (2), (3), (3.1), above).
- Coagulation reactions were carried out for a number of individuals, using the blood samples from the individuals, prepared as indicated herein in connection with clotting reactions, where a clotting reagent is added to the blood sample, and preferably a blood plasma sample.
- the absorbance values (measured in instrument units) were obtained for the sample throughout the coagulation reaction using a linear-output photo-optical coagulometer, POTENS+.
- the clotting agent used was thromboplastin reagent (Tp) which was injected into citrated human blood plasma.
- the clotting curve absorbance values were tracked as optically-clear fibrinogen (Fg) (also referred to as FBG herein) converts into turbid fibrin.
- Fg optically-clear fibrinogen
- Table 12 provides comparative data for INRm, INRz and INRn values compared with INR values calculated by the INR WHO method (which is also represented as INRw):
- the INR obtained using the WHO method (INRw) was compared with each of the alternate INR determinations, including INRm (using the manufacturer's INR), INRz, using the expressions of the above formulae (1), (2), (3), (3.1), as discussed herein, and INRn, using the expressions of the above formulae (10), (11), (12).
- Table 14 provides corresponding data for a coagulation study.
- Tables 14 and 15 the following references are used, and may be further identified by reference to Fig. 8 :
- the IBM-compatible computer 30 of Fig. 1 stores and manipulates these digital values corresponding to the clotting curve represented in Fig. 6 and the related data provided in Tables 14 and 15.
- the computer may be programmed as follows:
- the computer 30 may be used to manipulate and derive the quantities of expression (11) to determine a new INR (INRn) utilizing known programming routines and techniques.
- the data collected by a computer 30 may be used to manipulate and derive INRn of expression (11).
- using known mathematical techniques may derive the theoretical end of test TEOT of expression (5), and using the TEOT value in expression (11), in turn, may determine the new INR, INRn of expression (12).
- the determination is based on the patient's own sample, and does not rely on the determination of normal prothrombin times for the reagent used (e.g., thromboplastin, innovin or the like). With the INRn determination method, no longer does the accuracy of the quantities determined depend, in whole or part, on the number of specimens used, that is, the number of stable (or presumed stable) patients.
- the new anticoagulation therapy value (INRn) does not require an ISI value, as was previously used to determine anticoagulation therapy factors.
- the new anticoagulation therapy value INRn uses for its ascertainment the values extracted from the clotting curve (see Fig. 6 ), in particular T 2 S, Tmap, TEOT, c1, c T2S , ct2 and ceot.
- the ISI is not required, nor is the MNPT, or the need to obtain and calculate the prothrombin times (PT's) for 20 presumed normal patients.
- the new anticoagulant therapy factor INRn may replace the INR traditionally used in anticoagulant therapy management (such as INR WHO and INRm).
- the computer 30 has knowledge of the values obtained for the fibrinogen reaction, to ascertain the INRn.
- An alternate embodiment for determining an anticoagulant therapy factor is provided and is based on determinations made during the clotting reaction of fibrinogen for a sample of a patient's blood.
- This alternate embodiment utilizes a theoretical clotting area.
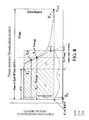
- a clotting curve is shown where optical activity in instrument units is plotted against time (in seconds). Time values are indicated on the x axis, and optical activity values, such as absorbance values are indicated on the y axis.
- the optical activity values are measured with an instrument that detects changes in the optical activity (e.g., absorbance), and are recorded with their corresponding time values in order to derive a corresponding anticoagulant therapy factor value, ATFs or INRs.
- the INRs value is a value determined for the patient sample that generated the information represented by the clotting curve.
- the ATFs/INRs values obtained are useful in determining the treatment course for an individual, in particular where the individual has a blood disorder.
- the alternate embodiment determines an ATF value that utilizes the clotting curve information represented by the graph illustrated in Fig. 6 .
- the clotting curve represents the optical activity for the coagulant reaction where the fibrinogen in the sample and a clotting agent are combined and the fibrinogen is transformed to fibrin.
- the clotting curve defines an area below it and there also is a portion of the clotting area that is above the clotting curve.
- the alternate method is used for determining the INR for the sample, where the INR is an anticoagulant therapy factor and is represented by ATFs or INRs.
- the theoretical clotting area is derived to determine the INRs, and, according to the preferred alternate embodiment, utilizes an area defined by the time measurements at which certain functions of the clotting reaction occur.
- an instrument is programmed with instructions for implementing processing of the signals based on the photodetection output of a photocell, such as, for example, the photocell of a spectrophotometer.
- the instrument described and shown in connection with Fig. 1 herein may be utilized to carry out the ATFs/INRs determination.
- the spectrometric devices shown and described in connection with a copending application from the present applicant filed on March 7, 2011, may be used in connection with the method disclosed herein for determining the theoretical clotting area (A), shown in Fig. 7 being represented by area (A1) and area (A2), using the formulas set forth in expression (13), below.
- Optical activity is determined for times corresponding with the time that the reagent is combined with the sample containing fibrinogen (To), and the time that represents the theoretical end of the test (TEOT).
- Fig. 6 illustrates a graph of the clotting curve and shows To, which is where the clotting agent, such as TPC or other clotting agent, is combined with the sample.
- the TEOT is also identified on Fig. 6 .
- the times T1 and TEOT are measured from the time To.
- the area (A) corresponds with the INRs.
- the INRs is derived by utilizing a parity parameter to bring the time values in parity with the optical density measurements (such as absorbance values) that are recorded at the corresponding times.
- the TEOT is determined as set forth herein in connection with the embodiments discussed herein where the zero order kinetic line L is determined, and where the TEOT is derived.
- the slope of maximum acceleration on the clotting curve that corresponds with the maximum rate of formation of fibrin during the reaction of the fibrinogen in the sample with a clotting agent is determined. Determining the slope is by determining the maximum acceleration point (identified as T2 or Tmap on Fig. 6 ).
- the method involves sampling optical activity values (e.g., such as absorbance values) of the sample and clotting agent as the clotting reaction takes place to determine the last highest delta of an increasing rate of fibrinogen transformation.
- the MUL is a multiplier that is based on two relationships that are addressed by the multiplier.
- MUL relates the sampling rate of the instrument and the pixel parity of the x-y axis.
- the instrument used to measure the optical changes in the sample generates values, and preferably, the values, or signals are taken at a particular frequency.
- a preferred sampling rate for the clotting curve reaction of a patient blood or blood component sample may be a number of optical absorbance values in a particular time interval.
- a preferred rate for example, may be 100 optical absorbance values (or samples) per second, expressed 100/second.
- the sample rate preferably is used to derive a multiplier component, MUL.
- the parity value is a multiplier utilized to create x-y pixel parity for the clotting curve information (that is shown expressed on the clotting curve graph, see Fig. 6 ).
- the sampling rate used was 100 values per second.
- the pixel parity multiplier was 0.535.
- the multiplier, according to this example, is 0.535 (pixel parity value)/100 (the number of samples reflected in a second).
- the clotting curve is considered, and the theoretical or hypothetical zero order kinetic line, or line L as it is referred to and appears on the Figures, provides an (x,y) coordinate of (TEOT, 0), where the time value at which the clotting reaction, if theorized from the slope or line taken between the point where the maximum acceleration of the conversion rate of fibrinogen transformation begins (T2S) and the end of the maximum conversion (which, according to preferred embodiments, may be determined as the last highest delta value of conversion rate), which is T2 or Tmap.
- the value, TEOT is a time value, and generally, for example, may be expressed in seconds.
- the INRs value preferably is determined using a clotting agent that reacts with the fibrinogen in the sample to provide a clotting reaction, such as the clotting reactions represented by the graph in Fig. 6 .
- the clotting agents may be those discussed herein.
- the ATFs/INRs was determined for a number of patient samples. INRs/ATFs derivations were carried out using the data for the patient samples contained in Table 17. The INRs was determined as discussed herein by determining the PT for a sample, which is the value T1 (the time from the addition of the reagent to the time of the first clot, e.g., between T0 and T1 on Fig. 6 ). The clotting begins (at T1) and accelerates where the maximum conversion rate is determined at T2 (the maximum acceleration point or map). The coagulation reaction continues until reaching the end of test time, which is represented by time T3. The time T2S on the graph of Fig.
- the determination of the ATFs/INRs may be accomplished.
- an instrument that has means for measuring the optical activity of the sample as the sample undergoes the coagulation reaction.
- a spectrophotometer such as, for example, the apparatus shown in Fig. 1 and described herein, may be used to provide optical activity data.
- a photocell and light source may be configured and arranged to provide information corresponding with the optical activity of a sample.
- the light source such as an LED light or other source, may be used to provide a beam that passes through the sample tube.
- the light beam may be configurable by providing a variable power supply to operate the light source, as described in a co-pending patent application from the present applicants filed on March 7, 2011.
- the optical path output may be adjusted, e.g., increased or decreased, through the regulation of the light source power supply adjustment.
- a photocell preferably may be arranged to receive the light beam.
- the photocell preferably may be provided in an electric circuit that may be operated with a computer.
- the computer may be configured with a program that records the signals from the photocell over the time of the coagulation reaction.
- the photocell output is part of a circuit.
- the circuit also may utilize a variable resistor and the variable resistor may be controlled though a computer.
- the computer may be operated with inputs from a keyboard or other input device to control the resistance.
- the negative output of the photocell also may be connected in the circuit though a variable resistor that may be controlled using the computer.
- the computer is programmed with software to implement the changes in the voltage so that the voltage is set to a level that will provide a baseline for the sample, and the computer may implement a routine that derives a voltage that will provide an appropriate scale for the optical activity measurements.
- the voltage setting may also be determined by blanking, where a blank of the sample container with water (or other material), or may be set to a baseline by determining the voltage corresponding to the optical activity of the sample itself, before the clotting agent addition.
- the reference voltage may be utilized by the computer, so that instructions are implemented to subtract the reference or baseline voltage from subsequent readings.
- the data from the photocell may be digitized so that the voltage readings may then be stored and manipulated.
- Table 17 shows data for samples corresponding to a sample ID A001 through A225, with some gaps in the sample numbers. Gaps in sample numbers indicate occurrences where a sample was not able to be tested because they were beyond three standard deviations.
- the INR values were determined based on the coagulation data for the sample. Each sample was reacted in a coagulation reaction with a clotting agent, which, for determination of the values in Table 17, was Thromboplastin C.
- the start of the recording of optical density values is represented by the start time (T0) (see Fig. 6 ) which corresponds with the time of the Thromboplastin C reagent addition to the sample.
- time value (T3) represents the end of test time where the fibrinogen transformation to fibrin in the sample has completed.
- the time (EtTm) represents the time of the end of the recording, which is later than the end of test time (T3), and which may be used to verify that the fibrinogen transformation has completed.
- the instrument units corresponding with the time T1 (or prothrombin time PT) are provided in Table 17 as the value CT1.
- the instrument unit value StV1 is a value determined using the MAP and by proceeding from the MAP and reverting to a point along the baseline of the clotting curve before the acceleration of the fibrinogen transformation takes place.
- the StV1 value may be used as a check for the PT, and corresponds with the time value StTm (which is a value that approximates the PT).
- the FTR is also reported in Table 17 and represents the fibrinogen transformation rate, which was derived using the expression IUX/IUT, which was determined for the reported INRz values in Table 17.
- the Area represents the area determined in accordance with expression T1*TEOT.
- the Area is multiplied by the multiplier MUL (which in this example was 1/187 or 0.00535) in order to determine the INRs.
- the INRs values in Table 17 represent the Area *MUL.
- the values To, T1, Tmap and T2S preferably are determined as described herein and are recorded, and the corresponding associated instrument unit values CT0, CT1, CMAP and CT2S, respectively are determined and recorded.
- a computer was provided with software containing instructions for obtaining the information from the coagulation reaction, including optical activity during the time of the coagulation reaction.
- the software also included instructions for recording and storing the data. Preferably, readings were taken every 1/100 th of a second, or 100 readings every second. The time values were recorded, and the corresponding optical activity values (in instrument units) at those respective times also were recorded.
- the multiplier value (MUL) was utilized based on the pixel parity and sampling rate, which for the values in Table 17, was 1/187, or 0.00535.
- the INRs may be determined.
- the instrument pixel parity and sampling rate multiplier preferably is applied to the product of T1 and TEOT to provide the resultant INRs.
- a multiplier (MUL) (1/187 or 0.00535) that takes into account the pixel parity was applied to the area by multiplying the multiplier (MUL) and the area to obtain the INRs.
- MUL multiplier
- the area included in the preferred INR determination, where INRs is derived includes area portions above and below the clotting curve.
- Comparative INR values also were determined using the values obtained in Table 17.
- the comparative results between the INR values derived from the data reported in Table 17 are presented in Table 18.
- the hereinbefore description of the new anticoagulant therapy factor does correlate at least as well as, and preferably better than, studies carried out using the International Normalized Ratio (INR) and International Sensitivity Index (ISI) for the INR values obtained using the World Health Organization (WHO) values, represented in Table 18 as INRm, and studies carried out using INR/ATF determinations using methods where the mean normal prothrombin time of a number of individuals having presumed normal coagulation functions must be determined, as with INRz.
- the inventive method represented by the formula in expression (14) and expressed herein as INRs and/or ATFs is an improvement over the prior methods.
- the Area is determined as discussed herein using expression (13), and a multiplier is applied with the use of a power regression.
- the results in Table 17 include values for an Area for each respective sample.
- the PT or T1 is the prothrombin time, which is the point where the conversion of fibrinogen to fibrin begins to decay after achieving the maximum rate. This, as discussed herein, is referred to as the maximum acceleration point (MAP).
- MAP maximum acceleration point
- MNXT mean normal maximum time
- MNPT mean normal maximum time
- the MNXT is used to derive the INRm, which is the WHO INR determination, where the mean of a number of presumed normal coagulation patients is used.
- the INRm the WHO INR
- the present invention provides an area determination which represents a hypothetical or theoretical clotting area.
- the clotting area has two sides, as shown in Fig. 7 .
- Using each sample's maximum fibrinogen conversion rate the time to convert all of the fibrinogen to fibrin in a sample using this rate is determined. This time to convert the fibrinogen to fibrin in the sample defines a hypothetical or theoretical end of test (TEOT) (or HEOT as it also may be referred to).
- TEOT is designated as the height of the area.
- the other side of the area is the time required to convert sufficient prothrombin to thrombin, thus beginning the conversion of fibrinogen to fibrin.
- the time required for the conversion of prothrombin to thrombin is represented by the value T1 (or PT) and is designated as the length of the area. In this area determination, the two sides are not parallel.
- an expression is derived to enable the use of a power progression expression to determine the INRs for a sample.
- the INRs may be related to the INRm (WHO determined INR value) by utilization of a power regression that relates the clotting area (A) with the INRs of the sample.
- the relationship of the INRm values determined for fibrinogen standards may be used to provide an expression or formula from which determinations of an INRs for patient samples may be done by determining the clotting area for the patient sample.
- the patient sample clotting area determination is made using the same thromboplastin, and more preferably, the same batch of thromboplastin, and the same instrument, so that the patient samples may be reacted in a coagulation reaction with a coagulation reagent, and the clotting area (A) determined, and an INRs for the patient sample determined using the power regression obtained with the fibrinogen standard samples (for the thromboplastin reagent and the instrument).
- a number of fibrinogen standards are run and the respective area for each fibrinogen standard is determined. From these determinations, an expression was derived for determining the INRs value using the thromboplastin for which the fibrinogen standard determinations were made.
- One preferred method involves utilizing five fibrinogen standards, a high fibrinogen standard, a low fibrinogen standard and three fibrinogen/INR control levels 1, 2 and 3. For each of the five samples, an Area value and an INR value are calculated and plotted.
- three thromboplastins e.g., TPC, BPT and Innovin
- INR MAP / MNXT ISI
- MAP the point in time that is where maximum rate of conversion of fibrinogen to fibrin occurs
- MNXT the mean normal maximum time
- ISI an exponent that is the ISI (international sensitivity index) of the manufacturer for the clotting reagent used (e.g., thromboplastin).
- a solution curve for each thromboplastin using the five levels of standards and controls was created.
- the Area is plotted on the "x" axis and the INR is plotted on the "y” axis.
- the power regression is implemented to provide a result that relates the INRs to an INRm for a particular thromboplastin, such as, for example, TPC thromboplastin (and for a particular batch of thromboplastin.
- a clotting reagent e.g., thromboplastin
- the INRs may therefore be substituted in the expression as "x”, and a corresponding INRm may be determined by solving for "y".
- the use of this method provides a way to determine the correlation of the INRs with the WHO determined INRm.
- the INR is calculated by a standard method, where the INR is the international normalized ratio and the ISI is the international sensitivity index.
- the prothrombin ratio (PR) is a sample's prothrombin time divided by a mean normal prothrombin time (MNPT) created by using 20-plus presumed normal samples.
- INR Prothrombin Ratio ⁇ ISI .
- the method for determining an INRs value for a patient blood sample was carried out as follows. A standard curve was created with fibrinogen standards, and, preferably, as in this example, using FDA-cleared high and low fibrinogen standards and three fibrinogen / INR controls of levels 1, 2 and 3.
- clotting area (A) was determined by obtaining values for the time and optical activity as discussed herein.
- a spectrophotometric device was used, and the output of the spectrophotometric device was provided to a computer.
- the computer was programmed with software, and the software included instructions to record, store and manipulate the time and absorbance data to provide the INR, area and INRs values.
- the fibrinogen sample was reacted by introducing by injection a clotting reagent into the sample, while the sample was in position on the spectrophotometer device so that time and optical dentisy values could be obtained for the sample and recorded, as the fibrinogen transformation to fibrin was occurring.
- a determination was made to record the occurrence of the prothrombin time (T1). The time and absorbance values continued to be recorded.
- a maximum acceleration point (MAP) was determined for the rate of fibrinogen conversion. This is the point where the conversion of fibrinogen to fibrin begins to decay after achieving a maximum rate. This is called the maximum acceleration point (MAP) and is used to determine a mean normal maximum time (MNXT).
- A hypothetical or theoretical clotting area
- the conversion time By using each fibrinogen standard sample's maximum fibrinogen conversion rate, we determined the conversion time by calculating the time to convert all of the fibrinogen to fibrin in a sample using this rate. This time defines a hypothetical or theoretical end of test (TEOT) and is designated as the height of the clotting area (A). The other side is the time required to convert sufficient prothrombin to thrombin (which is represented as the time value T1 in Figs. 6 , 7 and 8 ), thus beginning the conversion of fibrinogen to fibrin. This time is represented and referred to as the prothrombin time (T1) and is designated the length of the area (A).
- these two sides are not parallel lines, but rather, are defining two sides of an event creating a hypothetical or theoretical clotting area (A).
- the method illustrated according to this example utilizes the Area of the fibrinogen standard samples and the INR(standard) values determined for the fibrinogen standard samples to derive an equation, which comprises a power regression.
- the INR area method was compared and related to the reference INR(standard) values obtained using the method of expression (15).
- a solution curve for each thromboplastin (which in this example included TPC, BPT and Innovin) using the 5 levels of fibrinogen standards and controls was created.
- the AREA is plotted on the 'x' axis and the INR area method is plotted on the 'y' axis. To solve for 'y', and because the INR value uses an exponent, the solution is to solve for an exponent.
- the INRs determination made using the power regression may be implemented utilizing the computer in the manner described herein in connection with determinations made of the zero order kinetic reactions and determinations of the time and optical activity values.
- the INRs of a patient sample may be derived using the power regression expression, and substituting for the A value the clotting area of the patient sample (from conducting a clotting reaction with the thromboplastin) and solving the expression for the INRs.
- the present methods including, in particular, the INRs determination, provide resultant INR values (INRs value) for a patient blood sample (or blood component sample) which may be used to determine treatments for a patient, such as, for example, blood therapy treatments.
- the methods herein may include administering to a living being, such as, for example, a patient, a course of treatment.
- the course of treatment may involve a treatment agent for regulating the clotting activity of blood and administering that blood treatment agent to the patient.
- the INR value, (INRs) corresponds with the clotting activity of the blood of the living being and therefore provides a reference for the amount of treatment agent to be administered.
- the INRs may be determined for the patient at intervals, and administering the treatement may be done at intervals.
- the treatment agent may comprise an anticoagulant, such as, coumadin or warfarin.
- the present invention provides apparatus and methods for obtaining an new anticoagulant therapy value, INRs, without encountering the complications involved with obtaining the prior art quantities International Normalized Ratio (INR) and International Sensitivity Index (ISI).
- INR International Normalized Ratio
- ISI International Sensitivity Index
- T1 or PT prothrombin time
- TEOT hypothetical or theoretical end of test
- the new International Normalized Ratio preferably is a replacement for the International Normalized Ratio (INR) such as that of the WHO, or the manufacturers of the clotting reagent that may provide an ISI for use with their particular clotting reagent.
- the invention determines an INRs value, which is derived by determining a clotting area. The clotting area is adjusted with a multiplier to provide an INRs value.
- Another example utilizes fibrinogen standard solutions, and provides a power regression obtained from the standards that relates the clotting area of the standard samples, so that an expression may be used to determine patient INRs values based on the clotting area determined for those patient samples.
- sample container used to contain the sample may comprise a vial, or cuvette, including, for example, the sample container disclosed in our U.S. Patent 6,706,536 .
- sample container used to contain the sample
- the sample container used to contain the sample may comprise a vial, or cuvette, including, for example, the sample container disclosed in our U.S. Patent 6,706,536 .
- the present invention has applicability to veterinary procedures, as well, where fluids are to be measured or analyzed.
- Various modifications and changes may occur to those skilled in the art without departing from the scope of the invention described herein and as defined by the appended claims
Landscapes
- Health & Medical Sciences (AREA)
- Life Sciences & Earth Sciences (AREA)
- Engineering & Computer Science (AREA)
- Chemical & Material Sciences (AREA)
- Hematology (AREA)
- Biomedical Technology (AREA)
- Physics & Mathematics (AREA)
- Immunology (AREA)
- Pathology (AREA)
- Urology & Nephrology (AREA)
- Molecular Biology (AREA)
- Analytical Chemistry (AREA)
- Biochemistry (AREA)
- General Health & Medical Sciences (AREA)
- General Physics & Mathematics (AREA)
- Food Science & Technology (AREA)
- Medicinal Chemistry (AREA)
- Biophysics (AREA)
- Ecology (AREA)
- Biotechnology (AREA)
- Cell Biology (AREA)
- Microbiology (AREA)
- Chemical Kinetics & Catalysis (AREA)
- Plasma & Fusion (AREA)
- Investigating Or Analysing Biological Materials (AREA)
Claims (16)
- Ein Verfahren zur Bestimmung eines Gerinnungsparameters für Blut oder einen Blutbestandteil eines Lebewesens, bestehend aus:der Reaktion einer Fibrinogen enthaltenden Blutprobe oder eines Fibrinogen enthaltenden Blutbestandteils mit einem Gerinnungsmittel, das durch die Verbindung der genannten Blutprobe mit dem genannten Gerinnungsmittel Fibrinogen in Fibrin umwandelt;der Protokollierung mit Erfassungsmitteln (28, 26, 30) für die Durchführung optischer Messungen, von Werten für Zeit und optische Dichte für die Probe, die der optischen Aktivität der Fibrinogen-Aktivität während der Reaktion mit dem Gerinnungsmittel entsprechen, wobei die Werte der optischen Dichte, die mit ihren entsprechenden übereinstimmenden Zeiten im Verlauf der Reaktion grafisch dargestellt werden, eine Gerinnungskurve darstellen;der Bestimmung der Zeit, zu der die Probe und das damit kombinierte Gerinnungsmittel beginnt, eine Änderung der Gerinnungsaktivität zu bilden, wobei (T1) die Zeit darstellt, zu der die Probe und das damit gemischte Gerinnungsmittel eine Änderung der Gerinnungsaktivität zu bilden beginnen und wobei (c1) einen Wert der optischen Dichte der Probe zum Zeitpunkt (T1) darstellt, zu dem die Probe und das damit kombinierte Gerinnungsmittel eine Änderung der Gerinnungsaktivität zu bilden beginnen;der Bestimmung einer Steigung, die der maximalen Beschleunigungsrate der Umwandlung von Fibrinogen in Fibrin während der Gerinnungsreaktion entspricht:der Bestimmung eines Endes der Messzeit (TEOT), das einem Wert der optischen Dichte (cEOT) entspricht, der einen im Wesentlichen Abschluss der Reaktion des Fibrinogen der Probe und des Gerinnungsmittels zur Umformung des Fibrinogen in der Probe in Fibrin angibt, wobei der besagte Zeitpunkt (TEOT) demjenigen Zeitpunkt entspricht, zu dem eine Linie der Steigung, die die Rate der maximalen Beschleunigung der Gerinnungsaktivität auf der Basis der optischen Aktivität der Gerinnungsreaktion darstellt, den besagten Wert der optischen Dichte bei c=(cEOT) schneidet;der Bestimmung eines INR-Werts, INRs, für die Probe, wobei INRs einer Gerinnungsfläche (A) entspricht, die durch die Zeit (T1), zu dem die Probe und das damit kombinierte Gerinnungsmittel beginnen, eine Veränderung der Gerinnungsaktivität zu bilden und der dem Ende des Testwerts entsprechenden Zeit (TEOT) dargestellt wird;wobei die Gerinnungsfläche (A) durch zwei Seiten festgelegt ist, wobei eine Seite, die die besagte Gerinnungsfläche (A) definiert, durch den Wert (T1) dargestellt wird und wobei die Seite, die die besagte Gerinnungsfläche definiert, durch den Wert (TEOT) dargestellt wird;wobei die besagte Gerinnungsfläche skaliert ist, um den besagten INRs zu definieren;wobei für die besagte Skalierung ein Multiplikator verwendet wird, der sich auf die Abtastrate bezieht, zu der die Messungen von Zeit und optischer Aktivität gemäß dem Pixel-Paritätswert aufgezeichnet werden, bei dem es sich um einen Multiplikator handelt, der zur Schaffung einer x-y-Pixel-Parität der x-y-Achse der Informationen aus der Gerinnungskurve benutzt wird; undwobei die besagte Bestimmung eines INRs-Werts durch die folgende Beziehung ausgedrückt wird: INRs = (T1 * TEOT) * MUL, wobei MUL einen Skalierwert darstellt.
- Verfahren nach Anspruch 1, wobei der Skalierwert MUL auf einem Wert beruht, der der Parität der Fibrinogen-Umwandlung pro Zeiteinheit entspricht.
- Verfahren nach einem der Ansprüche 1-2, wobei die besagte Steigung, die die Höchstbeschleunigung der Gerinnungsaktivität auf der Grundlage der optischen Aktivität der Gerinnungsreaktion darstellt und die den besagten Wert der optischen Dichte (cEOT) schneidet, durch eine Steigung der Linie zwischen Punkten entlang der Gerinnungskurve, (T2S) und Tmap), definiert ist, wobei T2S die Zeit ist, zu der die höchste Beschleunigung der Umwandlungsrate der Fibrinogenumwandlung beginnt.
- Verfahren nach einem der Ansprüche 1-3, wobei, wobei die Protokollierung mit Aufzeichnungsmitteln (28, 26, 30) zur Durchführung optischer Messungen, Werten für Zeit und optische Dichte für die Probe während der Reaktion mit dem Gerinnungsmittel die Entwicklung einer Reihe von analogen elektrischen Spannungssignalen beinhaltet, deren Spannungsamplituden proportional zu einer optischen Dichte eines Gerinnungsbestandteils der besagten Probe sind.
- Verfahren nach einem der Ansprüche 1-4, wobei der Gerinnungsbestandteil Fibrinogen enthält.
- Verfahren nach einem der Ansprüche 1-5, wobei die besagte Bestimmung eines INRs-Werts durch die folgende Beziehung ausgedrückt wird: INRs = T1*TEOT * MUL; wobei die besagte Gerinnungsfläche (A) durch eine erste Teilfläche (A1) definiert ist, die durch das Quadrat von (T1) dargestellt wird, und eine zweite Fläche (A2), die durch den rechtwinkligen Flächenteil dargestellt wird, der durch das Produkt aus (T1) und (TEOT) definiert ist, wobei die besagte Gerinnungsfläche einen ersten Teil an der Stelle, die unter der Gerinnungskurve und zwischen der optischen Dichte c=cEOT dargestellt ist, und einen zweiten Teil über der Gerinnungskurve umfasst.
- Verfahren nach einem der Ansprüche 1-6, wobei die Aufzeichnungsmittel (28, 26, 30) ein Instrument umfassen und wobei der Multiplikator MUL der Abtastrate des Instruments und der Pixel-Parität der x-y-Achse zugeordnet ist, wobei die y-Achse die optische Dichte und die x-Achse die Zeit darstellt.
- Vorrichtung zur Bestimmung eines neuen Antikoagulans-Therapiefaktors (INRs), bestehend aus:a. Mittel umfassend eine Lichtquelle (4), eine Teströhre (8), eine Fotozelle (10), eine Batterie (12) und einen Regelwiderstand (22), sämtlich zur Erzeugung eines analogen elektrischen Spannungssignals mit einer Amplitude, die sich proportional zu einer optischen Dichte einer flüssigen Probe verhält, die Fibrinogen enthält;b. Mittel umfassend einen A/D-Wandler (26) und einen Computer (30), die beide bei der Umwandlung und Aufnahme des entstehenden Analogsignals in eine Reihe von digitalen Spannungssignalwerten mitwirken;c. Mittel zum Einspritzen eines Koagulationsmittels in eine flüssige Probe, wobei eine abrupte Veränderung der optischen Dichte der flüssigen Probe entsteht und die besagte abrupte Veränderung eine Veränderung der Amplitude des elektrischen Analogsignals erzeugt, die wiederum eine abrupte Veränderung des Werts des besagten digitalen Spannungssignals hervorruft, wobei der Wert des besagten digitalen Spannungssignals direkt auf die Fibrinogenkonzentration in der Substanzprobe hinweist;d. Mittel, umfassend einen Computer (30), umfassend Software mit Anleitung zur Durchführung der Überwachung des besagten digitalen Spannungssignals, das der optischen Dichte der flüssigen Probe entspricht und die Gerinnungsaktivität darstellt und zur Verarbeitung der digitalen Signalwerte;e. Mittel, umfassend den besagten Computer (30), zur Aufnahme einer Zeit (T1), dem Beginn einer kinetischen Umwandlungsrate nullter Ordnung des Fibrinogen in Fibrin bei einer Reaktion eines Reagens, das mit Fibrinogen reagiert, welches in der Körperflüssigkeitsprobe vorhanden ist, um das Fibrinogen in Fibrin umzuwandeln und eines Wertes, der der Startzeit (T1) entspricht;f. Mittel, umfassend den besagten Computer (30), zur Aufnahme einer Zeit bis zur Höchstbeschleunigung (Tmap) für die Umwandlungsrate von Fibrinogen in Fibrin bei der Körperflüssigkeitsprobe;g. Mittel, umfassend den besagten Computer (30), zur Überwachung von digitalen Spannungssignalwerten bei Zeiten (T1) und der Zeit bis zur Höchstbeschleunigung (Tmap) für entsprechende Mengen der Fibrinogenkonzentration (CT1) und (CTmap) auf der Grundlage der entsprechenden optischen Dichten der Probe zu diesen Zeiten und der entsprechenden digitalen Spannungssignale:h. Mittel, umfassend den besagten Computer (30), zur Bestimmung einer Steigung, die die Höchstbeschleunigungsrate der Gerinnungsaktivität auf der Grundlage der optischen Aktivität der Gerinnungsreaktion darstellt und zur Bestimmung eines Abschlusses der Messzeit (TEOT), der einem Wert der optischen Dichte (cEOT) entspricht, der auf einen im Wesentlichen Abschluss der Reaktion des Fibrinogen der Probe und des Gerinnungsmittels hinweist, wobei die besagte Zeit (TEOT) der Zeit entspricht, zu dem eine Linie der besagten Steigung, die die Höchstbeschleunigungsrate der Gerinnungsaktivität auf der Grundlage der optischen Aktivität der Gerinnungsreaktion entspricht, den besagten Wert der optischen Dichte bei c=(cEOT) schneidet;i. Mittel, umfassend den besagten Computer (30), zur Bestimmung eines Antikoagulans-Therapiefaktors (INRs) für die Probe auf der Grundlage einer Gerinnungsfläche, die durch die Verwendung des Produkts von (T1) und (TEOT) und Multiplikation des besagten Produkts mit einem Multiplikator MUL definiert ist, wobei der besagte Multiplikator MUL einen Wert auf der Grundlage der Abtastrate und des Pixel-Paritätswerts darstellt und wobei der besagte Multiplikator MUL durch den Pixel-Paritätswert geteilt durch die Abtastrate ausgedrückt wird, und wobei der besagte INRs-Wert durch die folgende Beziehung ausgedrückt wird: INRs = (T1 * TEOT) * MUL, wobei MUL ein Multiplikator ist, der sich auf die Abtastrate bezieht, zu der Zeit und Messungen der optischen Dichte mit dem Pixel-Paritätswert aufgezeichnet werden, der ein zur Schaffung der x-y-Pixel-Parität der x-y-Achse der Gerinnungskurve verwendeter Multiplikator ist.
- Verfahren nach einem der Ansprüche 1-7, wobei besagter (INRs) durch die Zuordnung eines Werts für MUL von 1/187 oder etwa 0,00535 bestimmt wird.
- Verfahren nach einem der Ansprüche 1-7 oder 9, wobei das Verfahren die Anpassung der Gerinnungsfläche (A) in Abhängigkeit von einem Leistungsrückgang beinhaltet, die die Gerinnungsfläche (A) mit einem bekannten Standard zur Bestimmung eines INRs für die Probe in Beziehung setzt.
- Verfahren nach einem der Ansprüche 1-7 oder 9-10, umfassend die Bestimmung der Gerinnungsfläche (A) für eine Vielzahl an Fibrinogen-Standardproben, deren Fibrinogenkonzentrationen bekannt sind.
- Verfahren nach einem der Ansprüche 1-7 oder 9-11, wobei die besagten Fibrinogen-Standardproben mindestens einen hohen Fibrinogen-Standard und mindestens einen niedrigen Fibrinogen-Standard beinhalten.
- Verfahren nach einem der Ansprüche 1-7 oder 9-12, wobei die besagten Fibrinogen-Standards mindestens eine Vielzahl an Fibrinogen-Standards zwischen dem besagten hohen Fibrinogen-Standard und dem besagten niedrigen Fibrinogen-Standard beinhalten.
- Verfahren nach einem der Ansprüche 1-7 oder 9-13, wobei das Verfahren die Bestimmung eines INR-Werts für die besagten bekannten Fibrinogen-Standardproben durch Durchführung einer Gerinnungsreaktion unter Verwendung jeder einzelnen Fibrinogen-Standardprobe und eines Gerinnungsreagens umfasst und für jede Fibrinogenprobe die Bestimmung der Zeit bis zur Höchstbeschleunigung (XT) für jede Fibrinogen-Standardprobe umfasst, und die Bestimmung der Höchstbeschleunigungsrate (MNXT) durch die Bestimmung einer Steigung umfasst, die der maximalen Beschleunigungsrate der Umwandlung von Fibrinogen in Fibrin während der Gerinnungsreaktion der Fibrinogen-Standardprobe entspricht, und die Bestimmung des INR-Werts für die Fibrinogen-Standardprobe, nach dem Ausdruck INR (Standard) = (XT/MNXT)ISI umfasst, wobei ISI ein Exponent ist und der ISI-Wert des Herstellers für das Gerinnungsmittel ist, das zur Durchführung der Gerinnungsreaktion verwendet wird.
- Verfahren nach einem der Ansprüche 1-7 oder 9-14, umfassend die Ableitung des INRs für eine Patientenprobe durch Bestimmung eines Ausdrucks auf der Grundlage der INR-Werte, die für jede Fibrinogen-Standardprobe erhalten wurden, einschließlich der Bestimmung des Ausdrucks eines Leistungsrückgangs aus der besagten Gerinnungsfläche (A) für jede Fibrinogen-Standardprobe und dem INR-Wert für jede Fibrinogen-Standardprobe, wobei y = m* A^e ist, wobei y der INRs ist, m eine Konstante ist, A die Gerinnungsfläche ist und e eine weitere Konstante ist, die einen Exponenten darstellt und wobei der Erhalt des INRs für eine Patientenprobe die Bestimmung der Gerinnungsfläche A aus der Patientenprobe das Erheben der Fläche A zum Exponenten e und das Multiplizieren des Werts mit der Konstanten m zum Erhalt der INRs umfasst.
- Verfahren nach einem der Ansprüche 1-7 oder 9-15, wobei die Leistungsrückgang-Konstanten m und e unter Verwendung des INR(Standard)-Werts erhalten werden und die Gerinnungsfläche A für jede Fibrinogen-Standardprobe gemäß dem Ausdruck INR(Standard) = m*A^e bestimmt wird.
Applications Claiming Priority (2)
| Application Number | Priority Date | Filing Date | Title |
|---|---|---|---|
| US12/932,822 US8445287B2 (en) | 2009-02-14 | 2011-03-07 | Method and apparatus for determining anticoagulant therapy factors |
| EP12158401 | 2012-03-07 |
Related Parent Applications (2)
| Application Number | Title | Priority Date | Filing Date |
|---|---|---|---|
| EP12158401.5 Division | 2012-03-07 | ||
| EP12158401 Division | 2011-03-07 | 2012-03-07 |
Publications (2)
| Publication Number | Publication Date |
|---|---|
| EP2546637A1 EP2546637A1 (de) | 2013-01-16 |
| EP2546637B1 true EP2546637B1 (de) | 2014-05-14 |
Family
ID=47324591
Family Applications (1)
| Application Number | Title | Priority Date | Filing Date |
|---|---|---|---|
| EP12163048.7A Not-in-force EP2546637B1 (de) | 2011-03-07 | 2012-03-07 | Verfahren und Vorrichtung zur Bestimmung von Antikoagulanstherapiefaktoren |
Country Status (1)
| Country | Link |
|---|---|
| EP (1) | EP2546637B1 (de) |
Families Citing this family (3)
| Publication number | Priority date | Publication date | Assignee | Title |
|---|---|---|---|---|
| CN107209192B (zh) * | 2014-12-18 | 2019-06-11 | 皇家飞利浦有限公司 | 用于确定血液样本中的纤维蛋白原水平的装置、系统和方法 |
| EP3225998A1 (de) * | 2016-03-31 | 2017-10-04 | Siemens Healthcare Diagnostics Products GmbH | Verfahren zur bestimmung von fibrinogen |
| CN112038655B (zh) * | 2020-09-10 | 2021-07-27 | 广州云也科技有限公司 | 一种具有双极板密封结构的燃料电池 |
Family Cites Families (5)
| Publication number | Priority date | Publication date | Assignee | Title |
|---|---|---|---|---|
| US3905769A (en) | 1974-02-28 | 1975-09-16 | Bagley Wallace E | Method and apparatus for measuring prothrombin time and the like |
| US5197017A (en) | 1990-09-27 | 1993-03-23 | Carroll Wallace E | Potentiophotometric fibrinogen determination |
| US5502651A (en) | 1994-05-02 | 1996-03-26 | Jackson; R. David | Potentiophotometric fibrinogen determination |
| CN1309770A (zh) | 1998-07-31 | 2001-08-22 | 华莱士·E·卡罗尔 | 确定抗凝治疗因子的设备和方法 |
| US6706536B1 (en) | 2000-11-28 | 2004-03-16 | Wada, Inc. | Method and apparatus for processing coagulation studies, chemistry procedures and the like |
-
2012
- 2012-03-07 EP EP12163048.7A patent/EP2546637B1/de not_active Not-in-force
Also Published As
| Publication number | Publication date |
|---|---|
| EP2546637A1 (de) | 2013-01-16 |
Similar Documents
| Publication | Publication Date | Title |
|---|---|---|
| US5981285A (en) | Method and apparatus for determining anticoagulant therapy factors | |
| US8445287B2 (en) | Method and apparatus for determining anticoagulant therapy factors | |
| US4047890A (en) | Method and apparatus for determining deficiencies in enzymatic reactors particularly clotting factor levels in blood plasmas | |
| Van den Besselar | A comparison of INRs determined with a whole blood prothrombin time device and two international reference preparations for thromboplastin | |
| US20100235103A1 (en) | Method and apparatus for evaluating prothrombotic conditions | |
| Braun et al. | Performance evaluation of the new CoaguChek XS system compared with the established CoaguChek system by patients experienced in INR-self management | |
| Yang et al. | Home prothrombin time monitoring: a literature analysis | |
| CN105264385A (zh) | 用于抗因子Xa试验通用校准的工具和方法 | |
| Niederdöckl et al. | Point‐of‐care PT and aPTT in patients with suspected deficiencies of coagulation factors | |
| EP2546637B1 (de) | Verfahren und Vorrichtung zur Bestimmung von Antikoagulanstherapiefaktoren | |
| van den Besselaar | Accuracy, precision, and quality control for point-of-care testing of oral anticoagulation | |
| EP1907866B1 (de) | Verfahren und vorrichtung zur bestimmung von antikoagulantientherapiefaktoren | |
| US7901694B2 (en) | Method and apparatus for determining anticoagulant therapy factors | |
| Leichsenring et al. | Multicentre ISI assignment and calibration of the INR measuring range of a new point-of-care system designed for home monitoring of oral anticoagulation therapy | |
| Tripodi et al. | Oral anticoagulant monitoring by laboratory or near-patient testing: what a clinician should be aware of | |
| Huber et al. | Automation in haemostasis | |
| EP1188060B1 (de) | Verfahren und apparatur zum präsentieren von daten von thrombose- und haemostaseassays | |
| US20040219680A1 (en) | Method and apparatus for determining anticoagulant therapy factors | |
| Bazaev et al. | Modern methods for measuring parameters of blood coagulation | |
| Sever et al. | Portable optical coagulation analyzer based on real-time image processing algorithm | |
| Oertel | International normalized ratio (INR): an improved way to monitor oral anticoagulant therapy | |
| US20240077504A1 (en) | Method for estimating cause of prolonged coagulation time | |
| Zams | Medicine, Medical University of Vienna, Vienna, Austria Coagulation Center Mannheim, Mannheim, Germany | |
| Introcaso et al. | Mathematical derivative applied to international normalised ratio and analytical variations in oral anticoagulant therapy control | |
| AU2004201011B2 (en) | Method and apparatus for presenting thrombosis and hemostasis assay data |
Legal Events
| Date | Code | Title | Description |
|---|---|---|---|
| PUAI | Public reference made under article 153(3) epc to a published international application that has entered the european phase |
Free format text: ORIGINAL CODE: 0009012 |
|
| AK | Designated contracting states |
Kind code of ref document: A1 Designated state(s): AL AT BE BG CH CY CZ DE DK EE ES FI FR GB GR HR HU IE IS IT LI LT LU LV MC MK MT NL NO PL PT RO RS SE SI SK SM TR |
|
| AX | Request for extension of the european patent |
Extension state: BA ME |
|
| 17P | Request for examination filed |
Effective date: 20130705 |
|
| RBV | Designated contracting states (corrected) |
Designated state(s): AL AT BE BG CH CY CZ DE DK EE ES FI FR GB GR HR HU IE IS IT LI LT LU LV MC MK MT NL NO PL PT RO RS SE SI SK SM TR |
|
| GRAP | Despatch of communication of intention to grant a patent |
Free format text: ORIGINAL CODE: EPIDOSNIGR1 |
|
| GRAJ | Information related to disapproval of communication of intention to grant by the applicant or resumption of examination proceedings by the epo deleted |
Free format text: ORIGINAL CODE: EPIDOSDIGR1 |
|
| GRAP | Despatch of communication of intention to grant a patent |
Free format text: ORIGINAL CODE: EPIDOSNIGR1 |
|
| INTG | Intention to grant announced |
Effective date: 20131016 |
|
| INTG | Intention to grant announced |
Effective date: 20131028 |
|
| GRAS | Grant fee paid |
Free format text: ORIGINAL CODE: EPIDOSNIGR3 |
|
| GRAA | (expected) grant |
Free format text: ORIGINAL CODE: 0009210 |
|
| AK | Designated contracting states |
Kind code of ref document: B1 Designated state(s): AL AT BE BG CH CY CZ DE DK EE ES FI FR GB GR HR HU IE IS IT LI LT LU LV MC MK MT NL NO PL PT RO RS SE SI SK SM TR |
|
| RAP1 | Party data changed (applicant data changed or rights of an application transferred) |
Owner name: CARROLL, WALLACE E. Owner name: JACKSON, R. DAVID |
|
| REG | Reference to a national code |
Ref country code: GB Ref legal event code: FG4D |
|
| RIN1 | Information on inventor provided before grant (corrected) |
Inventor name: JACKSON, R. DAVID Inventor name: CARROLL, WALLIS E. |
|
| REG | Reference to a national code |
Ref country code: AT Ref legal event code: REF Ref document number: 668641 Country of ref document: AT Kind code of ref document: T Effective date: 20140615 |
|
| REG | Reference to a national code |
Ref country code: IE Ref legal event code: FG4D |
|
| REG | Reference to a national code |
Ref country code: DE Ref legal event code: R096 Ref document number: 602012001673 Country of ref document: DE Effective date: 20140626 |
|
| REG | Reference to a national code |
Ref country code: NL Ref legal event code: VDEP Effective date: 20140514 Ref country code: AT Ref legal event code: MK05 Ref document number: 668641 Country of ref document: AT Kind code of ref document: T Effective date: 20140514 |
|
| REG | Reference to a national code |
Ref country code: LT Ref legal event code: MG4D |
|
| PG25 | Lapsed in a contracting state [announced via postgrant information from national office to epo] |
Ref country code: GR Free format text: LAPSE BECAUSE OF FAILURE TO SUBMIT A TRANSLATION OF THE DESCRIPTION OR TO PAY THE FEE WITHIN THE PRESCRIBED TIME-LIMIT Effective date: 20140815 Ref country code: FI Free format text: LAPSE BECAUSE OF FAILURE TO SUBMIT A TRANSLATION OF THE DESCRIPTION OR TO PAY THE FEE WITHIN THE PRESCRIBED TIME-LIMIT Effective date: 20140514 Ref country code: IS Free format text: LAPSE BECAUSE OF FAILURE TO SUBMIT A TRANSLATION OF THE DESCRIPTION OR TO PAY THE FEE WITHIN THE PRESCRIBED TIME-LIMIT Effective date: 20140914 Ref country code: CY Free format text: LAPSE BECAUSE OF FAILURE TO SUBMIT A TRANSLATION OF THE DESCRIPTION OR TO PAY THE FEE WITHIN THE PRESCRIBED TIME-LIMIT Effective date: 20140514 Ref country code: NO Free format text: LAPSE BECAUSE OF FAILURE TO SUBMIT A TRANSLATION OF THE DESCRIPTION OR TO PAY THE FEE WITHIN THE PRESCRIBED TIME-LIMIT Effective date: 20140814 Ref country code: LT Free format text: LAPSE BECAUSE OF FAILURE TO SUBMIT A TRANSLATION OF THE DESCRIPTION OR TO PAY THE FEE WITHIN THE PRESCRIBED TIME-LIMIT Effective date: 20140514 |
|
| PG25 | Lapsed in a contracting state [announced via postgrant information from national office to epo] |
Ref country code: AT Free format text: LAPSE BECAUSE OF FAILURE TO SUBMIT A TRANSLATION OF THE DESCRIPTION OR TO PAY THE FEE WITHIN THE PRESCRIBED TIME-LIMIT Effective date: 20140514 Ref country code: RS Free format text: LAPSE BECAUSE OF FAILURE TO SUBMIT A TRANSLATION OF THE DESCRIPTION OR TO PAY THE FEE WITHIN THE PRESCRIBED TIME-LIMIT Effective date: 20140514 Ref country code: PL Free format text: LAPSE BECAUSE OF FAILURE TO SUBMIT A TRANSLATION OF THE DESCRIPTION OR TO PAY THE FEE WITHIN THE PRESCRIBED TIME-LIMIT Effective date: 20140514 Ref country code: ES Free format text: LAPSE BECAUSE OF FAILURE TO SUBMIT A TRANSLATION OF THE DESCRIPTION OR TO PAY THE FEE WITHIN THE PRESCRIBED TIME-LIMIT Effective date: 20140514 Ref country code: SE Free format text: LAPSE BECAUSE OF FAILURE TO SUBMIT A TRANSLATION OF THE DESCRIPTION OR TO PAY THE FEE WITHIN THE PRESCRIBED TIME-LIMIT Effective date: 20140514 Ref country code: LV Free format text: LAPSE BECAUSE OF FAILURE TO SUBMIT A TRANSLATION OF THE DESCRIPTION OR TO PAY THE FEE WITHIN THE PRESCRIBED TIME-LIMIT Effective date: 20140514 Ref country code: HR Free format text: LAPSE BECAUSE OF FAILURE TO SUBMIT A TRANSLATION OF THE DESCRIPTION OR TO PAY THE FEE WITHIN THE PRESCRIBED TIME-LIMIT Effective date: 20140514 |
|
| PG25 | Lapsed in a contracting state [announced via postgrant information from national office to epo] |
Ref country code: PT Free format text: LAPSE BECAUSE OF FAILURE TO SUBMIT A TRANSLATION OF THE DESCRIPTION OR TO PAY THE FEE WITHIN THE PRESCRIBED TIME-LIMIT Effective date: 20140915 |
|
| PG25 | Lapsed in a contracting state [announced via postgrant information from national office to epo] |
Ref country code: BE Free format text: LAPSE BECAUSE OF FAILURE TO SUBMIT A TRANSLATION OF THE DESCRIPTION OR TO PAY THE FEE WITHIN THE PRESCRIBED TIME-LIMIT Effective date: 20140514 Ref country code: EE Free format text: LAPSE BECAUSE OF FAILURE TO SUBMIT A TRANSLATION OF THE DESCRIPTION OR TO PAY THE FEE WITHIN THE PRESCRIBED TIME-LIMIT Effective date: 20140514 Ref country code: CZ Free format text: LAPSE BECAUSE OF FAILURE TO SUBMIT A TRANSLATION OF THE DESCRIPTION OR TO PAY THE FEE WITHIN THE PRESCRIBED TIME-LIMIT Effective date: 20140514 Ref country code: DK Free format text: LAPSE BECAUSE OF FAILURE TO SUBMIT A TRANSLATION OF THE DESCRIPTION OR TO PAY THE FEE WITHIN THE PRESCRIBED TIME-LIMIT Effective date: 20140514 Ref country code: SK Free format text: LAPSE BECAUSE OF FAILURE TO SUBMIT A TRANSLATION OF THE DESCRIPTION OR TO PAY THE FEE WITHIN THE PRESCRIBED TIME-LIMIT Effective date: 20140514 |
|
| REG | Reference to a national code |
Ref country code: DE Ref legal event code: R097 Ref document number: 602012001673 Country of ref document: DE |
|
| PG25 | Lapsed in a contracting state [announced via postgrant information from national office to epo] |
Ref country code: NL Free format text: LAPSE BECAUSE OF FAILURE TO SUBMIT A TRANSLATION OF THE DESCRIPTION OR TO PAY THE FEE WITHIN THE PRESCRIBED TIME-LIMIT Effective date: 20140514 |
|
| PLBE | No opposition filed within time limit |
Free format text: ORIGINAL CODE: 0009261 |
|
| STAA | Information on the status of an ep patent application or granted ep patent |
Free format text: STATUS: NO OPPOSITION FILED WITHIN TIME LIMIT |
|
| 26N | No opposition filed |
Effective date: 20150217 |
|
| PG25 | Lapsed in a contracting state [announced via postgrant information from national office to epo] |
Ref country code: IT Free format text: LAPSE BECAUSE OF FAILURE TO SUBMIT A TRANSLATION OF THE DESCRIPTION OR TO PAY THE FEE WITHIN THE PRESCRIBED TIME-LIMIT Effective date: 20140514 |
|
| REG | Reference to a national code |
Ref country code: DE Ref legal event code: R097 Ref document number: 602012001673 Country of ref document: DE Effective date: 20150217 |
|
| PG25 | Lapsed in a contracting state [announced via postgrant information from national office to epo] |
Ref country code: SI Free format text: LAPSE BECAUSE OF FAILURE TO SUBMIT A TRANSLATION OF THE DESCRIPTION OR TO PAY THE FEE WITHIN THE PRESCRIBED TIME-LIMIT Effective date: 20140514 |
|
| REG | Reference to a national code |
Ref country code: DE Ref legal event code: R119 Ref document number: 602012001673 Country of ref document: DE |
|
| PG25 | Lapsed in a contracting state [announced via postgrant information from national office to epo] |
Ref country code: MC Free format text: LAPSE BECAUSE OF FAILURE TO SUBMIT A TRANSLATION OF THE DESCRIPTION OR TO PAY THE FEE WITHIN THE PRESCRIBED TIME-LIMIT Effective date: 20140514 Ref country code: LU Free format text: LAPSE BECAUSE OF FAILURE TO SUBMIT A TRANSLATION OF THE DESCRIPTION OR TO PAY THE FEE WITHIN THE PRESCRIBED TIME-LIMIT Effective date: 20150307 |
|
| REG | Reference to a national code |
Ref country code: CH Ref legal event code: PL |
|
| REG | Reference to a national code |
Ref country code: FR Ref legal event code: ST Effective date: 20151130 |
|
| REG | Reference to a national code |
Ref country code: IE Ref legal event code: MM4A |
|
| PG25 | Lapsed in a contracting state [announced via postgrant information from national office to epo] |
Ref country code: DE Free format text: LAPSE BECAUSE OF NON-PAYMENT OF DUE FEES Effective date: 20151001 Ref country code: LI Free format text: LAPSE BECAUSE OF NON-PAYMENT OF DUE FEES Effective date: 20150331 Ref country code: IE Free format text: LAPSE BECAUSE OF NON-PAYMENT OF DUE FEES Effective date: 20150307 Ref country code: CH Free format text: LAPSE BECAUSE OF NON-PAYMENT OF DUE FEES Effective date: 20150331 |
|
| PG25 | Lapsed in a contracting state [announced via postgrant information from national office to epo] |
Ref country code: FR Free format text: LAPSE BECAUSE OF NON-PAYMENT OF DUE FEES Effective date: 20150331 |
|
| GBPC | Gb: european patent ceased through non-payment of renewal fee |
Effective date: 20160307 |
|
| PG25 | Lapsed in a contracting state [announced via postgrant information from national office to epo] |
Ref country code: MT Free format text: LAPSE BECAUSE OF FAILURE TO SUBMIT A TRANSLATION OF THE DESCRIPTION OR TO PAY THE FEE WITHIN THE PRESCRIBED TIME-LIMIT Effective date: 20140514 |
|
| PG25 | Lapsed in a contracting state [announced via postgrant information from national office to epo] |
Ref country code: GB Free format text: LAPSE BECAUSE OF NON-PAYMENT OF DUE FEES Effective date: 20160307 |
|
| PG25 | Lapsed in a contracting state [announced via postgrant information from national office to epo] |
Ref country code: RO Free format text: LAPSE BECAUSE OF FAILURE TO SUBMIT A TRANSLATION OF THE DESCRIPTION OR TO PAY THE FEE WITHIN THE PRESCRIBED TIME-LIMIT Effective date: 20140514 Ref country code: SM Free format text: LAPSE BECAUSE OF FAILURE TO SUBMIT A TRANSLATION OF THE DESCRIPTION OR TO PAY THE FEE WITHIN THE PRESCRIBED TIME-LIMIT Effective date: 20140514 Ref country code: HU Free format text: LAPSE BECAUSE OF FAILURE TO SUBMIT A TRANSLATION OF THE DESCRIPTION OR TO PAY THE FEE WITHIN THE PRESCRIBED TIME-LIMIT; INVALID AB INITIO Effective date: 20120307 Ref country code: BG Free format text: LAPSE BECAUSE OF FAILURE TO SUBMIT A TRANSLATION OF THE DESCRIPTION OR TO PAY THE FEE WITHIN THE PRESCRIBED TIME-LIMIT Effective date: 20140514 |
|
| PG25 | Lapsed in a contracting state [announced via postgrant information from national office to epo] |
Ref country code: TR Free format text: LAPSE BECAUSE OF FAILURE TO SUBMIT A TRANSLATION OF THE DESCRIPTION OR TO PAY THE FEE WITHIN THE PRESCRIBED TIME-LIMIT Effective date: 20140514 |
|
| PG25 | Lapsed in a contracting state [announced via postgrant information from national office to epo] |
Ref country code: MK Free format text: LAPSE BECAUSE OF FAILURE TO SUBMIT A TRANSLATION OF THE DESCRIPTION OR TO PAY THE FEE WITHIN THE PRESCRIBED TIME-LIMIT Effective date: 20140514 |
|
| PG25 | Lapsed in a contracting state [announced via postgrant information from national office to epo] |
Ref country code: AL Free format text: LAPSE BECAUSE OF FAILURE TO SUBMIT A TRANSLATION OF THE DESCRIPTION OR TO PAY THE FEE WITHIN THE PRESCRIBED TIME-LIMIT Effective date: 20140514 |