EP2545481B1 - Verfahren, anordnung und computerprogrammprodukt zur analyse einer biologischen oder medizinischen probe - Google Patents
Verfahren, anordnung und computerprogrammprodukt zur analyse einer biologischen oder medizinischen probe Download PDFInfo
- Publication number
- EP2545481B1 EP2545481B1 EP11752918.0A EP11752918A EP2545481B1 EP 2545481 B1 EP2545481 B1 EP 2545481B1 EP 11752918 A EP11752918 A EP 11752918A EP 2545481 B1 EP2545481 B1 EP 2545481B1
- Authority
- EP
- European Patent Office
- Prior art keywords
- tissue
- gene
- expression
- score
- query sample
- Prior art date
- Legal status (The legal status is an assumption and is not a legal conclusion. Google has not performed a legal analysis and makes no representation as to the accuracy of the status listed.)
- Active
Links
Images


Classifications
-
- G—PHYSICS
- G06—COMPUTING OR CALCULATING; COUNTING
- G06F—ELECTRIC DIGITAL DATA PROCESSING
- G06F16/00—Information retrieval; Database structures therefor; File system structures therefor
- G06F16/20—Information retrieval; Database structures therefor; File system structures therefor of structured data, e.g. relational data
- G06F16/28—Databases characterised by their database models, e.g. relational or object models
- G06F16/284—Relational databases
- G06F16/285—Clustering or classification
-
- C—CHEMISTRY; METALLURGY
- C12—BIOCHEMISTRY; BEER; SPIRITS; WINE; VINEGAR; MICROBIOLOGY; ENZYMOLOGY; MUTATION OR GENETIC ENGINEERING
- C12Q—MEASURING OR TESTING PROCESSES INVOLVING ENZYMES, NUCLEIC ACIDS OR MICROORGANISMS; COMPOSITIONS OR TEST PAPERS THEREFOR; PROCESSES OF PREPARING SUCH COMPOSITIONS; CONDITION-RESPONSIVE CONTROL IN MICROBIOLOGICAL OR ENZYMOLOGICAL PROCESSES
- C12Q1/00—Measuring or testing processes involving enzymes, nucleic acids or microorganisms; Compositions therefor; Processes of preparing such compositions
- C12Q1/68—Measuring or testing processes involving enzymes, nucleic acids or microorganisms; Compositions therefor; Processes of preparing such compositions involving nucleic acids
- C12Q1/6876—Nucleic acid products used in the analysis of nucleic acids, e.g. primers or probes
- C12Q1/6883—Nucleic acid products used in the analysis of nucleic acids, e.g. primers or probes for diseases caused by alterations of genetic material
- C12Q1/6886—Nucleic acid products used in the analysis of nucleic acids, e.g. primers or probes for diseases caused by alterations of genetic material for cancer
-
- G—PHYSICS
- G06—COMPUTING OR CALCULATING; COUNTING
- G06F—ELECTRIC DIGITAL DATA PROCESSING
- G06F16/00—Information retrieval; Database structures therefor; File system structures therefor
- G06F16/20—Information retrieval; Database structures therefor; File system structures therefor of structured data, e.g. relational data
- G06F16/24—Querying
- G06F16/245—Query processing
- G06F16/2457—Query processing with adaptation to user needs
- G06F16/24578—Query processing with adaptation to user needs using ranking
-
- G—PHYSICS
- G16—INFORMATION AND COMMUNICATION TECHNOLOGY [ICT] SPECIALLY ADAPTED FOR SPECIFIC APPLICATION FIELDS
- G16B—BIOINFORMATICS, i.e. INFORMATION AND COMMUNICATION TECHNOLOGY [ICT] SPECIALLY ADAPTED FOR GENETIC OR PROTEIN-RELATED DATA PROCESSING IN COMPUTATIONAL MOLECULAR BIOLOGY
- G16B20/00—ICT specially adapted for functional genomics or proteomics, e.g. genotype-phenotype associations
- G16B20/20—Allele or variant detection, e.g. single nucleotide polymorphism [SNP] detection
-
- G—PHYSICS
- G16—INFORMATION AND COMMUNICATION TECHNOLOGY [ICT] SPECIALLY ADAPTED FOR SPECIFIC APPLICATION FIELDS
- G16B—BIOINFORMATICS, i.e. INFORMATION AND COMMUNICATION TECHNOLOGY [ICT] SPECIALLY ADAPTED FOR GENETIC OR PROTEIN-RELATED DATA PROCESSING IN COMPUTATIONAL MOLECULAR BIOLOGY
- G16B25/00—ICT specially adapted for hybridisation; ICT specially adapted for gene or protein expression
-
- G—PHYSICS
- G16—INFORMATION AND COMMUNICATION TECHNOLOGY [ICT] SPECIALLY ADAPTED FOR SPECIFIC APPLICATION FIELDS
- G16B—BIOINFORMATICS, i.e. INFORMATION AND COMMUNICATION TECHNOLOGY [ICT] SPECIALLY ADAPTED FOR GENETIC OR PROTEIN-RELATED DATA PROCESSING IN COMPUTATIONAL MOLECULAR BIOLOGY
- G16B25/00—ICT specially adapted for hybridisation; ICT specially adapted for gene or protein expression
- G16B25/10—Gene or protein expression profiling; Expression-ratio estimation or normalisation
-
- G—PHYSICS
- G16—INFORMATION AND COMMUNICATION TECHNOLOGY [ICT] SPECIALLY ADAPTED FOR SPECIFIC APPLICATION FIELDS
- G16B—BIOINFORMATICS, i.e. INFORMATION AND COMMUNICATION TECHNOLOGY [ICT] SPECIALLY ADAPTED FOR GENETIC OR PROTEIN-RELATED DATA PROCESSING IN COMPUTATIONAL MOLECULAR BIOLOGY
- G16B40/00—ICT specially adapted for biostatistics; ICT specially adapted for bioinformatics-related machine learning or data mining, e.g. knowledge discovery or pattern finding
-
- G—PHYSICS
- G16—INFORMATION AND COMMUNICATION TECHNOLOGY [ICT] SPECIALLY ADAPTED FOR SPECIFIC APPLICATION FIELDS
- G16B—BIOINFORMATICS, i.e. INFORMATION AND COMMUNICATION TECHNOLOGY [ICT] SPECIALLY ADAPTED FOR GENETIC OR PROTEIN-RELATED DATA PROCESSING IN COMPUTATIONAL MOLECULAR BIOLOGY
- G16B40/00—ICT specially adapted for biostatistics; ICT specially adapted for bioinformatics-related machine learning or data mining, e.g. knowledge discovery or pattern finding
- G16B40/10—Signal processing, e.g. from mass spectrometry [MS] or from PCR
-
- G—PHYSICS
- G16—INFORMATION AND COMMUNICATION TECHNOLOGY [ICT] SPECIALLY ADAPTED FOR SPECIFIC APPLICATION FIELDS
- G16B—BIOINFORMATICS, i.e. INFORMATION AND COMMUNICATION TECHNOLOGY [ICT] SPECIALLY ADAPTED FOR GENETIC OR PROTEIN-RELATED DATA PROCESSING IN COMPUTATIONAL MOLECULAR BIOLOGY
- G16B40/00—ICT specially adapted for biostatistics; ICT specially adapted for bioinformatics-related machine learning or data mining, e.g. knowledge discovery or pattern finding
- G16B40/20—Supervised data analysis
-
- G—PHYSICS
- G16—INFORMATION AND COMMUNICATION TECHNOLOGY [ICT] SPECIALLY ADAPTED FOR SPECIFIC APPLICATION FIELDS
- G16B—BIOINFORMATICS, i.e. INFORMATION AND COMMUNICATION TECHNOLOGY [ICT] SPECIALLY ADAPTED FOR GENETIC OR PROTEIN-RELATED DATA PROCESSING IN COMPUTATIONAL MOLECULAR BIOLOGY
- G16B50/00—ICT programming tools or database systems specially adapted for bioinformatics
- G16B50/30—Data warehousing; Computing architectures
-
- G—PHYSICS
- G16—INFORMATION AND COMMUNICATION TECHNOLOGY [ICT] SPECIALLY ADAPTED FOR SPECIFIC APPLICATION FIELDS
- G16B—BIOINFORMATICS, i.e. INFORMATION AND COMMUNICATION TECHNOLOGY [ICT] SPECIALLY ADAPTED FOR GENETIC OR PROTEIN-RELATED DATA PROCESSING IN COMPUTATIONAL MOLECULAR BIOLOGY
- G16B20/00—ICT specially adapted for functional genomics or proteomics, e.g. genotype-phenotype associations
-
- G—PHYSICS
- G16—INFORMATION AND COMMUNICATION TECHNOLOGY [ICT] SPECIALLY ADAPTED FOR SPECIFIC APPLICATION FIELDS
- G16B—BIOINFORMATICS, i.e. INFORMATION AND COMMUNICATION TECHNOLOGY [ICT] SPECIALLY ADAPTED FOR GENETIC OR PROTEIN-RELATED DATA PROCESSING IN COMPUTATIONAL MOLECULAR BIOLOGY
- G16B50/00—ICT programming tools or database systems specially adapted for bioinformatics
-
- Y—GENERAL TAGGING OF NEW TECHNOLOGICAL DEVELOPMENTS; GENERAL TAGGING OF CROSS-SECTIONAL TECHNOLOGIES SPANNING OVER SEVERAL SECTIONS OF THE IPC; TECHNICAL SUBJECTS COVERED BY FORMER USPC CROSS-REFERENCE ART COLLECTIONS [XRACs] AND DIGESTS
- Y10—TECHNICAL SUBJECTS COVERED BY FORMER USPC
- Y10S—TECHNICAL SUBJECTS COVERED BY FORMER USPC CROSS-REFERENCE ART COLLECTIONS [XRACs] AND DIGESTS
- Y10S707/00—Data processing: database and file management or data structures
- Y10S707/912—Applications of a database
- Y10S707/941—Human sciences
Definitions
- the invention relates to the area of bioinformatics. More specifically, the invention relates to analysis method of genetic data for e.g. cancer diagnostics purposes.
- microarray data analysis approaches are based on a case-control study design, for example comparing treated and untreated cells or matched disease and control tissues.
- characteristic subsets of genes or classifiers are built and tested for specific purposes, such as the differential diagnosis of diseases.
- significant numbers of samples from the case and control groups are expected in order to arrive at statistically significant interpretation of differentially expressed genes.
- Interpretation of data from individual samples is often not possible with these approaches. For example, samples from disease tissues, such as tumors, are often readily available, whereas the corresponding normal tissue samples may be much harder to obtain.
- an appropriate control group is hard to define and challenging to acquire, particularly from human tissues. For example, in studies of stem cells, their differentiation patterns should be followed up in comparison to multiple differentiated cell and tissue types to provide a comprehensive understanding of the differentiation patterns of the cells.
- microarray databases e.g. GeneSapiens, Oncomine, connectivity map, gene expression omnibus, Array-express
- analyses of such metadata are increasingly recognized as a powerful means to study gene networks and gene regulation, and to identify tissue- or disease-specific gene expression patterns.
- Availability of these microarray databases would also provide an opportunity to use a comprehensive collection of reference samples as a means of guiding the interpretation of new microarray data produced by investigators from test samples. This is particularly appealing for the analysis and interpretation of data from individual samples.
- BLAST Altschul et al., Basic local alignment search tool, J Mol Biol, 1990 ] program for matching an unknown test DNA sequence against a comprehensive reference database of previously sequenced samples.
- cancer is a genetic disease on a cellular level and should be treated and diagnosed as such.
- OncotypeDX, MammaPrint, TargetNow are based on unsupervised methods where a group of pre-defined gene expression values, among other possible sample analysis techniques, are used to diagnose cancer, typically by using a dedicated chip manufactured for that purpose only to measure pre-set 80-100 genes.
- supervised methods some machine learning method is used where computer is taught to recognize certain features of the training data and then subsequently it is able to classify novel data based on these features.
- cancer diagnostics is done by pathologists performing visual inspection of the histology of the biopsy. Even though this is an indispensable part of the diagnostic procedure it is subject to errors and in some cases visual features cannot reveal the exact nature of the cancer. More advanced methods are based on measuring pre-determined genes that are identified from prior research, and prescribing medication to diagnoses derived from those specific genes.
- One problem with the current diagnostic methodologies is that, e.g. because of omitting a number of genes from the scope of the method, they lose information that may be needed for diagnostic and treatment decisions and may even cause a wrong diagnosis if wrong genes are measured. As a result, the diagnostics process is inefficient and may produce only partial, or even wrong, results.
- One further problem with the current diagnostic methodologies is that they are not particularly suitable for identifying a primary tumour of a metastasized cancer disease.
- US patent application 2003/0073083 discloses a method for classifying the classes for samples based on gene expression. The classification is based on predicting whether a sample is treatment sensitive or treatment predictive.
- PCT application WO2008045389 teaches an improved computerized decision support system and apparatus incorporating bioinformatics software for selecting the optimum treatment for a cancerous condition in a human patient.
- the system comprises a PCR kit or a gene chip, an integrated detector, a detector for accepting receipt of the gene chip toward analyzing the patient's genotype, a database describing the correlation of patient genotypes and the efficacy and toxicity of various anti-cancer drugs used in treating patients with a particular cancerous condition and a computerized decision support system.
- PCT application WO2009131710 teaches a method for identifying genomic signatures linked to survival specific for a disease.
- the method comprises performing data analysis comprising bioinformatics and computational methodology to identify copy number abnormalities and altered expression of disease candidate genes.
- PCT application WO2006135904 teaches a method for producing an improved gene expression profile (GEP) for one or more cell samples.
- the method involves determining one or more particular gene (PG) improved results (IR) for the cell sample, and compiling the PG IR values to produce one or more forms of improved GEP for the cell sample.
- PG particular gene
- IR improved results
- PCT application WO2007137187 teaches a method involving performing a test for a gene and a test for a gene expressed protein from a biological sample of a diseased individual. A determination is made to detect which genes and/or gene expressed proteins exhibit a change in expression compared to a reference. A drug therapy used to interact with the genes and/or gene expressed proteins that exhibited a change in expression that is not single disease restricted, is identified from an automated review of an extensive literature database and data generated from clinical trials.
- PCT application WO2009132928 teaches a method for predicting an outcome of a patient suffering from or at risk of developing a neoplastic disease.
- the method comprises the steps of quantifiably determining the gene expression levels of genes, thus obtaining a pattern of expression levels of the genes, comparing the pattern of expression levels with known, pre-defined reference patterns of expression levels indicative of the outcomes and predicting an outcome of a patient from the comparison using a mathematical function to determine the similarity of the pattern of expression levels with the first reference pattern and the second reference pattern.
- the method depends on disease candidate genes as the starting point of forming the prediction.
- PCT Application WO2009125065 teaches a computer-implemented method for correcting data sets from measurements of properties of biological samples.
- the method comprises the steps of determining first and second property-specific distribution parameters for each property, determining a property-specific correction element for each version of the parallel measurement device based on the discrepancy between the property-specific distribution parameters, correcting the property value and outputting the property's corrected property value to a physical memory and/or display.
- PCT Application WO2008066596 discloses a gene expression barcode for normal and diseased tissue classification.
- the computer-based method includes the steps of determining threshold of active gene expression across a collection of reference categories each consisting of a plurality of samples.
- the gene specific thresholds are then used to characterize which genes are in active or inactive states in each of the reference categories. These are defined as the gene expression barcodes of the reference categories.
- the method is unable to identify genes, which are the most significant ones in the process of identifying a tissue type.
- the method merely identifies genes whose expression level exceeds a threshold value for the gene. The number of those genes may be very high, making the interpretation of the result very difficult and deteriorates the reliability of the result. Additionally, the method relies on the predefined set of genes, the barcode, for tissue classification. Overall the method assumes each gene to have only two informative expression states, which further limits the predictive potential of the method.
- the invention relates to analysis method of comparing single sample against reference database of samples in order to understand and interpret the biological or medical information of the single sample for both biological- or medical research, diagnosis and therapy.
- the sample(s) and the reference database may be derived from measurement of any quantifiable biological entities of the biological sample(s).
- An illustrative but non-restrictive list of such biological entities includes genes, splice variants of genes, micro-RNAs and other types of ribo- or deoxyribonucleic acid sequence combinations, proteins, any quantifiable stages, modifications, conformations or combinations of proteins, sugars, lipids, and any metabolites derived from any biochemical reactions.
- the present invention relates to a method for aligning and quantitatively comparing new microarray data (test sample, query sample) against reference gene expression profiles from a large collection of e.g. healthy and pathological in vivo and/or in vitro samples.
- the method compares expression profiles of the test samples with those in the reference data and returns the likelihood of the profile representing each of the known reference data categories as well as the sets of genes that define such similarities.
- the method is referred to as Alignment of Gene Expression Profiles (AGEP). It may be useful for the classification of microarray data from different healthy and disease tissue types as well as quantification of cell differentiation states.
- the first aspect of the invention is a computer executable method for characterizing, utilizing a reference database, a query sample based on the gene expression data of the sample.
- the method is mainly characterized in that the method comprises building expression level density estimates for each gene of a tissue category of the reference database, calculating for the genes of the query sample and for a plurality of tissue categories in the reference database an expression match score for each gene with respect to each tissue category indicating the likelihood of having a gene expression level observed in the query sample in each of the tissue categories of the reference database.
- tissue specificity score for each gene with respect to each tissue category that expresses how uniquely a gene identifies the query sample as belonging to the tissue category, the tissue specificity score being calculated by comparing each expression match score for each gene for all tissues.
- tissue similarity score that indicates the overall similarity of the query sample in relation to a tissue category of the reference database.
- At least some resulting characterization data comprising at least one identified tissue category identified using the tissue similarity score and/or at least one gene identified using the tissue specificity score or the expression match score is stored to a memory device or outputting the data to an output device of a computer.
- the at least one identified tissue category characterizes biological properties of the query sample.
- the calculation of the expression match score of a gene of the query sample vis-à-vis a tissue category in the reference database comprises:
- the calculation of the tissue specificity score of a gene comprises the steps of: calculating ratio-weighted difference values of a plurality of pairs of expression match scores, of which scores one represents the expression match score for the gene in the query tissue and the other one represents the expression match score for the same gene in a tissue other than the query tissue, and calculating the tissue specificity score to be the mean of the ratio-weighted difference values.
- the tissue similarity score is calculated to be the mean of the tissue specificity scores or mean of the expression match scores of the genes of the query sample vis-à-vis a tissue category.
- the method comprises the step of characterizing the query sample using the categorization data from at least one identified tissue category of the reference database.
- the characterization data comprises information about a patient of the tissue, the information comprising at least one of a diagnosis of the patient, medication of the patient, predicted clinical outcome of the patient or actual clinical outcome of the patient, the method comprising the steps of identifying a patient based on the identified tissue category, and performing, based on the information of the patient, at least the of the following: establishing a diagnosis of the disease, recommending a medication for the disease, and estimating clinical outcomes with a suggested medication.
- the diagnosis may be performed without advance knowledge about the identity of any particular gene of the tissue.
- knowledge about any pre-defined "candidate genes", “control genes”, “housekeeping genes” or “important genes” or any pre-defined “cutoff” value for an expression of a gene, which are identified by e.g. the research community and which are known to contribute to a disease is not necessarily needed for the diagnosis. Consequently, a tissue may be identified and characterized without any advance knowledge or assumptions about the tissue. For example, no advance assumption is required about possible type of cancer when analysing a cancer tissue.
- the tissue characterization method is able to find, with a good probability, the right reference tissue categories that together may characterize e.g. the biological properties and behaviour of the query sample.
- the annotation information of the matching tissues may comprise information e.g. about the probable biological properties and behaviour of the tissue, effective treatments and medications and probable outcome of the treatment.
- the known properties of the matching categories may thus provide a foundation for e.g. diagnosis, treatment recommendations and prognosis of a disease, e.g. cancer.
- the inventors speculate that a proper diagnosis may be possible even in cases where the exact disease is not yet known e.g. in the research community.
- the method is able to identify on one hand (in a multi-modal manner) a plurality of tissue categories with which the sample tissue has significant similarity and on the other hand the genes significantly contributing to the similarity, valuable information about the important properties, like various aspects about the biological properties and behaviour of the tissue, may be obtained from a plurality of matching tissue categories even if the patient's tissue resembles no tissue category representing a known disease.
- the expression match score and/or tissue specificity score may be calculated for at least one, preferably a plurality, most preferably at least 70%, 80%, 90%, 95% or essentially all of the genes of the sample tissue.
- the expression match score (em-score) describes the likelihood of obtaining a worse matching expression for the gene within a tissue category than the one in input sample. More generally, the em-score expresses similarity between an expression value of a sample tissue and a plurality of reference tissues in a manner that is independent from any external context, e.g. from the measurement scales of expression values used.
- the ts-score expresses how uniquely a gene identifies the query sample as belonging to a certain reference data category, e.g. tissue category.
- a tissue of the reference database may belong to at least one tissue category.
- a tissue belongs to a plurality of tissue categories.
- Tissue categories may be formed e.g. using the annotation data of the tissue samples of the reference database.
- a tissue category may thus represent at least one, preferably a plurality of tissues having a feature described by the annotation data.
- a tissue may be annotated using any number of annotation data items and it may thus belong to any number of categories.
- Tissue specificity scores (ts-scores) for each gene from the test sample for each tissue in the reference database may be calculated from the em-score matrix. Ts-scores may range e.g. from -1 to 1 and express how uniquely a gene identifies the test sample as belonging to a certain tissue category. Similarity of the input sample at the level of tissues is calculated from tissue specificity scores, resulting in one tissue similarity score per each tissue category. The tissue similarity score may be specific e.g. to a tissue category. The tissue may thus have at least one biological property or behaviour particular, typical or possible to the category.
- a high tissue similarity score of sample tissue A in relation to category X of the reference database may indicate that the sample tissue A may, at least with some probability, have a property particular, typical or possible to tissues of category X.
- the characterization of a tissue sample may be performed in a multi-modal manner utilizing the properties of at least one tissue category, preferably a plurality of tissue categories, of a reference database.
- An aspect of the present invention may be used for identifying tissue specific genes, i.e. genes whose properties, e.g. expression levels, best characterize a tissue.
- tissue specific genes i.e. genes whose properties, e.g. expression levels, best characterize a tissue.
- the uniqueness of the measurable activity of a single measurable entity, e.g. gene expression level, with regards to a single category in any categorization may be calculated e.g. by subtracting the maximum of the density estimates in each evaluation point for the entity in other categories from the density estimate of the entity in the category under study. This results in a number between 0 and 1, which tells us how big a proportion of the observed (measured) quantity of the entity is unique to the category.
- a (reference) tissue category may comprise information of at least one tissue.
- a tissue category comprises information about a plurality of tissues having some common aspect or feature.
- the common aspect or feature may be described using the annotation data of the tissue samples of the reference database.
- Any of the methods mentioned herein may utilize a reference database that comprises gene expression activity level estimates, where each estimate describes the distribution of expression levels of a specific gene in a specific tissue category of the reference database.
- the tissue characterization data may be used for e.g. providing information suitable for diagnostics purposes, e.g. for determining the type of a cancer, clinical outcomes of the sample patient and best-matching treatments.
- the tissue categorization data and/or the tissue annotation data may comprise e.g. any of the following: diagnostic classification data, e.g. information about the type and/or subtype of cancer, type of illness other than cancer, tissue type information, data about observed biological properties or behaviour of the tissue, e.g. epigenetic status or a pathologist's statement, information about the origin, e.g. a patient, of the tissue.
- the information about the origin may comprise e.g. any of the following: age, sex and ethnicity of the patient, species from which the sample was obtained from, a symptom of the patient, a diagnosis of the patient, medication of the patient, predicted clinical outcome of the patient, actual clinical outcome of the patient, progress of a disease of the patient. Any of the abovementioned data may be associated with in vitro grown samples as well as samples derived by biopsy, purification or any other method of biological sample extraction.
- the categorization of tissue data may be multi-modal categorization.
- An aspect of the present disclosure may be a computer executable method suitable for e.g. providing a diagnosis for a patient.
- the method may comprise any, any combination or all of the steps of:
- the first tissue sample may be e.g. of a cancer tissue.
- the second tissue sample may be e.g. of a healthy tissue.
- Forming additional reference groups e.g. by combining existing reference groups may allow alignment and analysis of the query sample against all possible combinations of categorization of the reference data collection. For example, forming a category by combining all categories of cancers forming a metastasis and the subsequent alignment of the query sample against all categories may allow interpretation of the query sample's profile that it resembles more metastatic cancers in general than any particular cancer type. This may indicate, for example, that the sample is particularly anaplastic and dedifferentiated and the patient has high risk of developing metastatic disease. Categories formed from existing categories can be utilized in all aspects of the invention.
- An aspect of the present disclosure may be a method of building a reference database comprising gene expression data for the purpose of characterizing a test sample tissue.
- the method may comprise any, any combination or all of the steps of:
- the accuracy of the annotation of the reference database may be estimated and/or enhanced by characterizing each tissue of the reference database utilizing e.g. the method of the first aspect of the present invention.
- the accuracy of the annotation may be thus confirmed by the tissue similarity score calculated for a query sample vis-à-vis a tissue category in a reference category.
- annotation data of the gene expression data may comprise e.g. any of the following:
- the gene expression data of a tissue sample may comprise expression level information of at least 10000, 15000, 20000, 22000 genes.
- the expression data comprises the expression level information essentially about the entire genome, e.g. human genome, e.g. at least 95 %, 98% or 99% of the genes. Broad coverage of genome is preferred over limited coverage as one of the ideas behind the invention is the principle of not excluding any genes from the analysis on a pre-determined basis. The method will identify for each analysis which genes are probably meaningful for each tissue characterization and which probably are not.
- the invention also relates to a computer arrangement comprising means for performing all of the steps of the claimed method.
- the invention also relates to a computer program product comprising computer executable instructions for performing all of the steps of the claimed method.
- Some aspects of the invention may be suitable for identifying the primary tumor of a patient based on the expression profile of the analysed (metastatized) tumor.
- a tumor tissue sample taken from liver may exhibit similar expression profile and/or tissue similarity of a pancreatic cancer tissue.
- the primary tumor of the cancer may be suspected to reside in pancreas.
- Such definition may be e.g. achieved by building, using e.g. kernel density with Gaussian window, expression level density estimates (activity level estimates) for each gene in a plurality of tissue categories. These expression density estimates are then used to align a single query sample profile to the reference database and identify which genes of the query profile have expression levels that resemble expression states of which tissue types (categories).
- Another aspect of the invention in this embodiment is the ability of the method to define the similarity of the query sample and reference data tissue categories in terms of likelihood of having expression level observed (in the query sample) in the reference data categories.
- Gene expression levels are relative values, which are not directly interpretable in terms of biological significance even in the rare case where reference point is absolutely known.
- any attempt to describe similarity between two gene expression values by using conventional distance metrics e.g. Euclidean distance
- the present invention circumvents this problem by providing similarity measure, which is more biologically interpretable as it describes the likelihood of having the observed expression level in the reference tissue category.
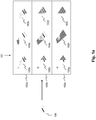
- FIG. 1a and 1b depict the principle of the AGEP method which is one preferred embodiment of the present invention.
- microarray data from one test sample 100 is compared to samples 103a-i of a large reference database 101 of different tissue/cell types (categories) 102a-c.
- samples 103a-i of a large reference database 101 of different tissue/cell types (categories) 102a-c There are thus, for example, a plurality of tissue samples 103a-c belonging to a tissue category 102a (and 103d-f belonging to category 102b and 103g-i belonging to category 102c).
- a tissue sample of the reference database may belong to a plurality of categories. This makes the multi-modal similarity analysis of a tissue sample possible.
- "Large” here means a database that contains expression data of e.g. at least 100, 1000 or 10000 tissue samples.
- a generalized workflow of the AGEP process comprises the following steps. First, the expression profile of a test sample is first transformed into a format compatible with reference data. Such normalization methods are known to a person skilled in the art. One example about a suitable method is provided in WO2009125065 . Moving to figure 1b , the expression level density estimates 115 have been pre-calculated for each gene in each reference tissue category. Then, each gene's data from the test sample is aligned with the density estimate for that same gene in each reference tissue as follows: density of expression values (y-axis 117) in the tissue is estimated in 512 evaluation points (x-axis 116) between the minimum and maximum (in all tissues) expression levels of the gene.
- the expression value of the gene in the test sample is then compared to the density estimate and a corresponding density value (y-axis 117) is identified.
- the fraction of evaluation points having lower density ( ⁇ ) forms the expression match score (em-score), describing the likelihood of obtaining a worse matching expression for the gene than the one in input sample.
- the em-score matrix 110 contains an em-score value for each gene 111 of each tissue category 112.
- An em-score of 1 means that the gene in the input sample had the best matching expression level for the tissue in question, in other words expression of the input sample matched the highest density peak.
- An em-score of 0 on the other hand means that input sample had an expression level that did not match the tissue at all.
- tissue specificity scores for each gene from the test sample for each tissue in the reference database are calculated 113 from the em-score matrix 110. This calculation results as the ts-score matrix 120 which also has a value for each tissue 122 category and gene 121. Ts-scores range from -1 to 1 and tell us how uniquely a gene identifies the test sample as belonging to a certain tissue.
- similarity of the input sample at the level of tissues is calculated 123 from tissue specificity scores, resulting in one tissue similarity score 130 per each tissue category of the reference database.
- Expression match score describes, suitably on the scale of 0 to 1, the likelihood of obtaining less matching expression level for the gene in the particular tissue.
- em-score 0 for a gene means that all other expression levels for the gene match better in the particular tissue than the one in query sample.
- em-score 1 means that none of the expression levels for the gene match better than the one in query sample.
- Genes may be labelled as either "typical” or “atypical” for each tissue. This is done by comparing the query sample's em-score for the gene against the range of em-scores for the same gene gained when the tissue is compared against itself. If the em-score from the comparison is higher than e.g. the lowest 5% from the tissue vs. self-spread, the gene may be termed typical, otherwise it is atypical. This is done because the em-score itself does not tell the spread of expression values a gene has in a tissue. This spread affects the range of expected em-scores when a sample of the tissue is compared against itself. For a gene with a very tight spread, one may expect much higher em-scores than for those with a more loose spread.
- Tissue specificity score (ts-score), on the scale of -1 to 1, is further calculated from em-scores to provide insight into whether the gene is expressed at the level unique for the particular tissue.
- Ts-score 1 for a gene means that the gene has unique expression level on that tissue and in the query sample the expression was on that level.
- -1 means that the gene has unique expression level but in the query sample expression was not at that level.
- the mean of the ts-scores of all genes in the particular tissue is used as a similarity score for that tissue.
- Expression data to be analyzed against the reference data typically needs to be transformed into compatible form by following procedure using a method known to a person skilled in the art.
- One such method is taught e.g. in patent publication WO2009125065A1 .
- the density of expression values of each gene in each tissue type may be calculated e.g. as follows: For computational efficiency fast Fourier transformation may be used based approximation to calculate kernel density estimates. Kernel densities may be calculated by using Gaussian window. Density is estimated from 0 to maximum expression value in the entire dataset with 512 equally spaced points.
- the modality of gene expression estimates may be calculated by searching for peaks having at least 0.1 of the total area of the density estimate. Some, preferably low percentage, e.g. 10-20%, of the genes may be excluded from the analysis e.g. due to the ambiguous modality of expression distributions. Modality of the expression profiles of genes can be used to further categorize reference data as well as to assign the query sample into the specific categories based on one or multiple genes.
- Gene and tissue specific expression value density estimates are used to calculate likelihood of obtaining expression values observed in a query profile from each tissue type. For a gene g in tissue t this is done as follows: The value of the density diagram for gene g in tissue t corresponding the expression value of gene g in the query sample is determined. Then that density value is compared to the density values of the 512 evaluation points of the density diagram of gene g in tissue t and the fraction of lower density values is calculated. This is called the expression match score (em-score), with 1 meaning perfect match between the query and tissue for expression of the gene and 0 meaning expression of the gene in the query profile is at non-typical level for tissue.
- em-score the expression match score
- a lower limit for the expected expression match score is calculated for each gene in each tissue type of the reference data to reflect the natural variability of expression of each gene in each tissue. This lower limit may be defined e.g. as the value under which the lowest 5% of em-scores for the gene would settle when a sample from the tissue is compared against itself.
- the lower limit for the expected expression match score for a gene in a particular tissue is calculated by evaluating the em-scores for all evaluation points, and weighting the abundance of that em-score by the value of the density diagram at that point. The sum of the weights is then normalized to 1.
- tissue specificity score (ts-score) for each gene in each tissue is calculated as follows (Equation 2):
- T non ⁇ t tissues
- f t x g ⁇ 1 ⁇ 1.25 ems x g + 0.25 ems t g + 0.25 ⁇ 0.2
- ems t g ⁇ ems x g ems ( t, g ) expression match score for tissue t,
- the expression match score for the gene g in tissue t and the expression match score for gene g in a tissue other than t is taken, and e.g. 0.25 is added to both numbers. The smaller number is divided by the larger number, resulting in a score between 0.2 and 1. This number is then scaled to range 0 - 1, and is subtracted from 1. If the expression match score for tissue t was the lower of the two, the score is multiplied by -1. In essence, what this does is give a ratio-weighted difference of the two expression match scores. This calculation is done for all tissue pairs ⁇ t , not t ⁇ , resulting in n - 1 values, where n is the amount of tissues the query sample is compared to.
- tissue specificity score for gene g in tissue t is the mean of these values. It varies between 1 and -1 and describes how well gene g classifies the query profile into tissue t .
- a score of 1 means the gene has a unique level of expression in the tissue and the query profile has expression level matching it perfectly. 0 means that the expression level observed in the query sample cannot differentiate the tissue from other tissues.
- -1 means gene has a unique level of expression for the tissue and the query profile does not have that specific expression level.
- the mean of tissue specificity scores is used as similarity score at the tissue level (Equation 3):
- the accuracy of the annotation (e.g. tissue categorization) of the reference database may be validated by e.g. performing a leave-one-out validation by using e.g. a number of healthy samples, e.g. more than 1000 samples, from the reference data. From the results the accuracy of identifying correct tissue type as first hit and distribution of first and secondary hits per each tissue may be calculated.
- a leave-one-out validation by using e.g. a number of healthy samples, e.g. more than 1000 samples, from the reference data. From the results the accuracy of identifying correct tissue type as first hit and distribution of first and secondary hits per each tissue may be calculated.
- tissue t true negatives are non- t tissue samples that match non- t tissues
- false negatives are tissue t samples that match a non- t tissue
- true positives are tissue t samples that matched t
- false positives were non- t tissue samples that matched t.
- Sensitivity was defined as tp /( tp + fn ) and specificity as tn ( tn + fp ) .
- the average expression of each gene on each tissue may be calculated to form tissue average profiles. Samples are classified as the tissue having smallest Euclidean distance to the sample in question. A separate classification may be made by classifying samples to the tissue with the highest Pearson correlation coefficient. In all cases, the sample in question is preferably excluded from the calculation of average profiles.
- the AGEP method taught herein is based on the use of kernel density with a Gaussian window to build density estimates for expression (activity) levels of each gene across reference sample types that correspond to different normal human tissues. The resulting density estimates make it possible to define which expression levels, or expression states, are characteristic for each gene in each tissue type. The combination of such gene expression density estimates across the genome can then be used to compare gene expression profiles between test and reference samples as well as to identify genes that define such similarities (see e.g. figure 1a ).
- the gene and tissue specific density estimates allow defining which expression levels are most characteristic for each gene in each tissue. Some genes may also be observed to have bi- or multimodal distribution even within individual tissues, highlighting the biological variability even in samples from same anatomical/histological annotation and perhaps suggesting different but distinct activity levels for a gene.
- the essential features of kernel density estimate in characterizing the expression of a gene are its ability to accept multiple expression levels per tissue, and the ability to recognize how narrow or broad these expression levels are. These two attributes are particularly useful when one realizes that all groups (tissues, cell types, etc.) formed from more than one sample are necessarily heterogeneous. If all possible annotation factors were taken into account, each sample would be unique. Also, annotation for some samples may be rather superficial.
- the kernel density method is capable of handling both these faults and still producing accurate results.
- the AGEP method makes it possible to compare a single sample to a reference database in two important ways. First, it is possible to determine how well a gene's expression matches the expression profile of the same gene in all tissues in the reference database. This similarity is quantified by a number, called the expression match score (em-score), ranging from 0 to 1. A score of zero indicates no match, and 1 is a perfect match. At this point it may also be determined if the gene's expression level is typical for each tissue. This is done by comparing the aligned sample's em-score for the gene against the range of expected em-scores gained from comparing the tissue against itself. If the em-score is higher than e.g.
- tissue specificities for each gene by calculating the extent to which that gene identifies a sample as belonging to a certain tissue. For example, if a gene is expressed at an ambient, low level in a multitude of tissues, even though in the sample we are aligning its expression level might perfectly match that basal level, the specificity of the gene for any of those tissues is low because the same expression level matches many other tissues. Specificity is given as the tissue specificity score (ts-score), which is calculated by comparing the em-scores of the gene for all tissues.
- Ts-scores range from -1 to 1, with a negative score meaning that the expression level matches other tissues better than this one, a positive one meaning it matches this tissue better than others.
- a score close to zero means the gene's expression value is inconclusive for determining a tissue.
- this approach will become more and more powerful and informative.
- This approach has significant utility in the analysis of tissue/cell type of origin of samples, as well as in the mapping of differentiation-associated gene expression changes e.g. in stem cells.
- Most microarray analyses are usually interpreted only in the context of the original study design and the samples available to the investigator at a given time, resulting in most cases in a case vs. control comparison of two groups of samples.
- the AGEP approach provides an opportunity for a multi-modal comparison of test samples with a comprehensive collection of different cell/tissue types previously studied by microarrays by the entire research community. This approach is therefore likely to provide a deeper view with more information content. Many previously applied statistical methods also restrict the information content in the genome based on an upfront selection of gene sets or diagnostic classifiers. These selected genes are then only informative in the identical study setting and in the case of very defined questions (like diagnostic/prognostic classifiers). AGEP does not depend on any a priori assumptions of subsets of genes being more informative and diagnostic than others, but nevertheless allows analysis of the similarity at any level between tissue and individual genes to facilitate the interpretation of the expression profile of a sample.
- AGEP method is particularly powerful, when a deeper interpretation of microarray results is needed for individual samples for which no specific control tissue is available, cannot be sampled or would not be an appropriate control. While the availability of reference database information may not replace the appropriate control sample in typical case-control studies, it may provide a different angle for data analysis and interpretation of microarray data from many different sample types (e.g. comparisons across different normal tissue/cell types or analyses of stem cells, or cancers whose normal tissue is not available, not known or not informative).
- An embodiment of the method of the present invention depends on a kernel density algorithm to assess the similarity of individual samples against a reference database and it can be implemented on any suitable large and integrated reference datasets. Bimodal or even multi-modal distributions of gene expression levels are common in normal, and particularly disease tissues. Due to the common outlier gene profiles in different tissue/cell samples, linear similarity metrics (such as Euclidean distance) often become unreliable. In contrast, AGEP analysis provides biologically significant information as uniquely high or low expression values in a subpopulation of reference samples is taken into account. Furthermore, AGEP may be able to deal with missing values easily, which is not the case for several other methods. AGEP not only provides a metric of the sample similarities, but also defines those specific genes that are informative in comparison to other reference samples.
- Samples from a differentiation series of mesenchymal stem cells transforming into adipocytes were compared to reference data containing mesenchymal stem cell and adipose tissue samples. It was shown that the method is able to both show progression of differentiation and the genes whose expression level changes with the progression.
- adipose tissue specific biomarkers such as the ADIPOQ gene
- a basal expression level in the 0h samples common to the majority of tissues, but in the 7d samples their expression was elevated to adipose tissue specific levels.
- Figure 2a where y-axis shows the expression of ADIPOQ gene across the reference tissues on the x-axis, show how ADIPOQ gene expression change during the differentiation (200) and differentiated stem cells reach the adipose tissue specific expression range (201). While this particular gene is already known to relate adipose tissue differentiation the presented method allows quantification of matching expression levels of all genes against all reference tissues and therefore entirely characterizes changes in the transcriptomic program.
- Dystrophic muscle One purpose of the invention is to provide meaningful interpretation for the gene expression of pathological samples for diagnostic and/or therapeutic purposes. For example when comparing dystrophic muscle samples to healthy striated muscle reference data one can provide molecular level interpretation of the patient. Muscle samples from patients suffering from Duchenne Muscular Dystrophy (DMD) were analyzed, with the reference data containing a large amount of healthy muscle samples.
- DMD Duchenne Muscular Dystrophy
Landscapes
- Engineering & Computer Science (AREA)
- Health & Medical Sciences (AREA)
- Life Sciences & Earth Sciences (AREA)
- Physics & Mathematics (AREA)
- Theoretical Computer Science (AREA)
- Medical Informatics (AREA)
- Bioinformatics & Cheminformatics (AREA)
- Spectroscopy & Molecular Physics (AREA)
- Biophysics (AREA)
- General Health & Medical Sciences (AREA)
- Biotechnology (AREA)
- Evolutionary Biology (AREA)
- Bioinformatics & Computational Biology (AREA)
- Databases & Information Systems (AREA)
- Data Mining & Analysis (AREA)
- Genetics & Genomics (AREA)
- Molecular Biology (AREA)
- Bioethics (AREA)
- Chemical & Material Sciences (AREA)
- Artificial Intelligence (AREA)
- Public Health (AREA)
- Evolutionary Computation (AREA)
- Software Systems (AREA)
- Epidemiology (AREA)
- Computer Vision & Pattern Recognition (AREA)
- Proteomics, Peptides & Aminoacids (AREA)
- Analytical Chemistry (AREA)
- General Engineering & Computer Science (AREA)
- Organic Chemistry (AREA)
- General Physics & Mathematics (AREA)
- Immunology (AREA)
- Pathology (AREA)
- Zoology (AREA)
- Wood Science & Technology (AREA)
- Signal Processing (AREA)
- Computational Linguistics (AREA)
- Hospice & Palliative Care (AREA)
- Microbiology (AREA)
- Biochemistry (AREA)
- Oncology (AREA)
Claims (7)
- Computer-ausführbares Verfahren zur Charakterisierung einer Abfrageprobe unter Nutzung einer Referenzdatenbank anhand der Genexpressionsdaten der Probe, dadurch gekennzeichnet, dass das Verfahren die Schritte umfasst:a. Bilden von Schätzungen der Expressionsratendichte für jedes Gen einer Gewebekategorie der Referenzdatenbank,b. für die Gene der Abfrageprobe und für mehrere Gewebekategorien in der Referenzdatenbank, Berechnen einer Expressionsübereinstimmungsquote für jedes Gen in Bezug auf jede Gewebekategorie, die anzeigt, mit welcher Wahrscheinlichkeit eine in der Abfrageprobe beobachtete Genexpressionsrate in jeder der Gewebekategorien der Referenzdatenbank vorliegt,c. für die Gene der Abfrageprobe und für mehrere Gewebekategorien der Referenzdatenbank, mit Hilfe der Expressionsübereinstimmungsquote, Berechnen einer Gewebespezifizitätsquote für jedes Gen in Bezug auf jede Gewebekategorie, die ausdrückt, wie einzigartig ein Gen die Abfrageprobe als zur Gewebekategorie zugehörig identifiziert, wobei die Gewebespezifizitätsquote durch Vergleichen der Expressionsübereinstimmungsquote für das Gen bei allen Geweben berechnet wird,d. mit Hilfe der Gewebespezifizitätsquoten, Berechnen einer Gewebeähnlichkeitsquote, die die Gesamtähnlichkeit der Abfrageprobe im Verhältnis zu einer Gewebekategorie der Referenzdatenbank anzeigt,e. Speichern mindestens einiger resultierender Charakterisierungsdaten, die mindestens eine identifizierte Gewebekategorie, die mit Hilfe der Gewebeähnlichkeitsquote identifiziert wurde, und/oder mindestens ein Gen, das mit Hilfe der Gewebespezifizitätsquote oder der Expressionsübereinstimmungsquote identifiziert wurde, umfassen, in einer Speichereinrichtung oder Ausgeben der Daten an eine Ausgabeeinrichtung eines Computers, wobei die mindestens eine identifizierte Gewebekategorie biologische Eigenschaften der Abfrageprobe charakterisiert,dadurch gekennzeichnet, dass
die Berechnung der Expressionsübereinstimmungsquote eines Gens der Abfrageprobe gegenüber einer Gewebekategorie in der Referenzdatenbank umfasst:- Vergleichen des Expressionswertes des Gens in der Abfrageprobe mit der Dichteschätzung für das gleiche Gen in der Gewebekategorie in Bewertungspunkten, die zwischen der Mindest- und der Höchstexpressionsrate des Gens liegen,- Identifizieren eines entsprechenden Dichtewerts für das Gen der Abfrageprobe, und- Berechnen der Expressionsübereinstimmungsquote als Fraktion von Bewertungspunkten mit einer Dichte, die niedriger als die Dichte der Abfrageprobe ist. - Verfahren nach Anspruch 1, dadurch gekennzeichnet, dass die Berechnung der Gewebespezifizitätsquote eines Gens die Schritte umfasst:a. Berechnen von anteilsgewichteten Differenzwerten einer Mehrzahl von Paaren von Expressionsübereinstimmungsquoten, von denen die eine Quote die Expressionsübereinstimmungsquote für das Gen im Abfragegewebe darstellt und die andere Quote die Expressionsübereinstimmungsquote für das gleiche Gen in einem vom Abfragegewebe verschiedenen Gewebe darstellt, undb. Berechnen des Mittelwerts der anteilsgewichteten Differenzwerte.
- Verfahren nach Anspruch 1, dadurch gekennzeichnet, dass die Gewebeähnlichkeitsquote als Mittelwert der Gewebespezifizitätsquoten oder als Mittelwert der Expressionsübereinstimmungsquoten der Gene der Abfrageprobe gegenüber einer Gewebekategorie berechnet wird.
- Verfahren nach Anspruch 1, dadurch gekennzeichnet, dass das Verfahren den Schritt umfasst: Charakterisieren der Abfrageprobe mit Hilfe der Charakterisierungsdaten aus mindestens einer identifizierten Gewebekategorie der Referenzdatenbank.
- Verfahren nach Anspruch 1, dadurch gekennzeichnet, dass die Charakterisierungsdaten Informationen über einen Patienten des Gewebes umfassen, wobei die Informationen eine Diagnose des Patienten, eine Medikation des Patienten, ein prognostiziertes klinisches Ergebnis des Patienten und/oder das tatsächliche klinische Ergebnis des Patienten umfassen, wobei das Verfahren die Schritte umfasst:a. Identifizieren eines Patienten anhand der identifizierten Gewebekategorie, undb. Ausführen von mindestens den folgenden Schritten anhand der Informationen des Patienten:i. Erstellen einer Diagnose der Erkrankung,ii. Empfehlen einer Medikation für die Erkrankung, undiii. Schätzen der klinischen Ergebnisse mit einer vorgeschlagenen Medikation.
- Computer-Anordnung zur Charakterisierung einer Abfrageprobe unter Nutzung einer Referenzdatenbank anhand der Genexpressionsdaten der Probe, dadurch gekennzeichnet, dass die Anordnung Mittel zur Ausführung der folgenden Schritte umfasst:a. Bilden von Schätzungen der Expressionsratendichte für jedes Gen einer Gewebekategorie der Referenzdatenbank,b. für die Gene der Abfrageprobe und für mehrere Gewebekategorien in der Referenzdatenbank, Berechnen einer Expressionsübereinstimmungsquote für jedes Gen in Bezug auf jede Gewebekategorie, die anzeigt, mit welcher Wahrscheinlichkeit eine in der Abfrageprobe beobachtete Genexpressionsrate in jeder der Gewebekategorien der Referenzdatenbank vorliegt,c. für die Gene der Abfrageprobe und für mehrere Gewebekategorien der Referenzdatenbank, mit Hilfe der Expressionsübereinstimmungsquote, Berechnen einer Gewebespezifizitätsquote für jedes Gen in Bezug auf jede Gewebekategorie, die ausdrückt, wie einzigartig ein Gen die Abfrageprobe als zur Gewebekategorie zugehörig identifiziert, wobei die Gewebespezifizitätsquote durch Vergleichen der Expressionsübereinstimmungsquote für das Gen bei allen Geweben berechnet wird,d. mit Hilfe der Gewebespezifizitätsquoten, Berechnen einer Gewebeähnlichkeitsquote, die die Gesamtähnlichkeit der Abfrageprobe im Verhältnis zu einer Gewebekategorie der Referenzdatenbank anzeigt, unde. Speichern mindestens einiger resultierender Charakterisierungsdaten, die mindestens eine identifizierte Gewebekategorie, die mit Hilfe der Gewebeähnlichkeitsquote identifiziert wurde, und/oder mindestens ein Gen, das mit Hilfe der Gewebespezifizitätsquote oder der Expressionsübereinstimmungsquote identifiziert wurde, umfassen, in einer Speichereinrichtung oder Ausgeben der Daten an eine Ausgabeeinrichtung eines Computers, wobei die mindestens eine identifizierte Gewebekategorie biologische Eigenschaften der Abfrageprobe charakterisiert,
dadurch gekennzeichnet, dass
die Berechnung der Expressionsübereinstimmungsquote eines Gens der Abfrageprobe gegenüber einer Gewebekategorie in einer Referenzdatenbank umfasst:- Vergleichen des Expressionswertes des Gens in der Abfrageprobe mit der Dichteschätzung für das gleiche Gen in der Gewebekategorie in Bewertungspunkten, die zwischen der Mindest- und der Höchstexpressionsrate des Gens liegen,- Identifizieren eines entsprechenden Dichtewerts für das Gen der Abfrageprobe, und- Berechnen der Expressionsübereinstimmungsquote als Fraktion von Bewertungspunkten mit einer Dichte, die niedriger als die Dichte der Abfrageprobe ist. - Computerprogrammprodukt zur Charakterisierung einer Abfrageprobe unter Nutzung einer Referenzdatenbank anhand der Genexpressionsdaten der Probe, dadurch gekennzeichnet, dass das Computerprogrammprodukt Computer-ausführbare Anweisungen umfasst, die, wenn das Programm von einem Computer ausgeführt wird, den Computer zum Ausführen der folgenden Schritte veranlassen:a. Bilden von Schätzungen der Expressionsratendichte für jedes Gen einer Gewebekategorie der Referenzdatenbank,b. für die Gene der Abfrageprobe und für mehrere Gewebekategorien in der Referenzdatenbank, Berechnen einer Expressionsübereinstimmungsquote für jedes Gen in Bezug auf jede Gewebekategorie, die anzeigt, mit welcher Wahrscheinlichkeit eine in der Abfrageprobe beobachtete Genexpressionsrate in jeder der Gewebekategorien der Referenzdatenbank vorliegt,c. für die Gene der Abfrageprobe und für mehrere Gewebekategorien der Referenzdatenbank, mit Hilfe der Expressionsübereinstimmungsquote, Berechnen einer Gewebespezifizitätsquote für jedes Gen in Bezug auf jede Gewebekategorie, die ausdrückt, wie einzigartig ein Gen die Abfrageprobe als zur Gewebekategorie zugehörig identifiziert, wobei die Gewebespezifizitätsquote durch Vergleichen der Expressionsübereinstimmungsquote für das Gen bei allen Geweben berechnet wird,d. mit Hilfe der Gewebespezifizitätsquoten, Berechnen einer Gewebeähnlichkeitsquote, die die Gesamtähnlichkeit der Abfrageprobe im Verhältnis zu einer Gewebekategorie der Referenzdatenbank anzeigt, unde. Speichern mindestens einiger resultierender Charakterisierungsdaten, die mindestens eine identifizierte Gewebekategorie, die mit Hilfe der Gewebeähnlichkeitsquote identifiziert wurde, und/oder mindestens ein Gen, das mit Hilfe der Gewebespezifizitätsquote oder der Expressionsübereinstimmungsquote identifiziert wurde, umfassen, in einer Speichereinrichtung oder Ausgeben der Daten an eine Ausgabeeinrichtung eines Computers, wobei die mindestens eine identifizierte Gewebekategorie biologische Eigenschaften der Abfrageprobe charakterisiert,
dadurch gekennzeichnet, dass
die Berechnung der Expressionsübereinstimmungsquote eines Gens der Abfrageprobe gegenüber einer Gewebekategorie in einer Referenzdatenbank umfasst:- Vergleichen des Expressionswertes des Gens in der Abfrageprobe mit der Dichteschätzung für das gleiche Gen in der Gewebekategorie in Bewertungspunkten, die zwischen der Mindest- und der Höchstexpressionsrate des Gens liegen,- Identifizieren eines entsprechenden Dichtewerts für das Gen der Abfrageprobe, und- Berechnen der Expressionsübereinstimmungsquote als Fraktion von Bewertungspunkten mit einer Dichte, die niedriger als die Dichte der Abfrageprobe ist.
Applications Claiming Priority (3)
| Application Number | Priority Date | Filing Date | Title |
|---|---|---|---|
| US31320710P | 2010-03-12 | 2010-03-12 | |
| FI20105252A FI20105252A0 (fi) | 2010-03-12 | 2010-03-12 | Menetelmä, järjestely ja tietokoneohjelmatuote biologisen tai lääketieteellisen näytteen analysoimiseen |
| PCT/FI2011/050216 WO2011110751A1 (en) | 2010-03-12 | 2011-03-11 | A method, an arrangement and a computer program product for analysing a biological or medical sample |
Publications (3)
| Publication Number | Publication Date |
|---|---|
| EP2545481A1 EP2545481A1 (de) | 2013-01-16 |
| EP2545481A4 EP2545481A4 (de) | 2015-09-09 |
| EP2545481B1 true EP2545481B1 (de) | 2020-02-19 |
Family
ID=42074366
Family Applications (1)
| Application Number | Title | Priority Date | Filing Date |
|---|---|---|---|
| EP11752918.0A Active EP2545481B1 (de) | 2010-03-12 | 2011-03-11 | Verfahren, anordnung und computerprogrammprodukt zur analyse einer biologischen oder medizinischen probe |
Country Status (4)
| Country | Link |
|---|---|
| US (2) | US9020934B2 (de) |
| EP (1) | EP2545481B1 (de) |
| FI (1) | FI20105252A0 (de) |
| WO (1) | WO2011110751A1 (de) |
Families Citing this family (9)
| Publication number | Priority date | Publication date | Assignee | Title |
|---|---|---|---|---|
| US9563741B2 (en) * | 2014-05-16 | 2017-02-07 | Battelle Memorial Institute | Constructing custom knowledgebases and sequence datasets with publications |
| US9544321B2 (en) * | 2015-01-30 | 2017-01-10 | Securonix, Inc. | Anomaly detection using adaptive behavioral profiles |
| US20190080051A1 (en) * | 2015-11-11 | 2019-03-14 | Northeastern University | Methods And Systems For Profiling Personalized Biomarker Expression Perturbations |
| JP7057913B2 (ja) * | 2016-06-09 | 2022-04-21 | 株式会社島津製作所 | ビッグデータ解析方法及び該解析方法を利用した質量分析システム |
| US10636512B2 (en) | 2017-07-14 | 2020-04-28 | Cofactor Genomics, Inc. | Immuno-oncology applications using next generation sequencing |
| US20200357484A1 (en) * | 2017-11-08 | 2020-11-12 | Koninklijke Philips N.V. | Method for simultaneous multivariate feature selection, feature generation, and sample clustering |
| CN107967410B (zh) * | 2017-11-27 | 2021-07-30 | 电子科技大学 | 一种面向基因表达与甲基化数据的融合方法 |
| CN118133039A (zh) * | 2018-05-01 | 2024-06-04 | 谷歌有限责任公司 | 加速大规模相似性计算 |
| CN113241183B (zh) * | 2021-04-30 | 2024-03-29 | 深圳睿心智能医疗科技有限公司 | 治疗方案预测方法及装置 |
Family Cites Families (14)
| Publication number | Priority date | Publication date | Assignee | Title |
|---|---|---|---|---|
| US7324926B2 (en) | 1999-04-09 | 2008-01-29 | Whitehead Institute For Biomedical Research | Methods for predicting chemosensitivity or chemoresistance |
| US20020042681A1 (en) * | 2000-10-03 | 2002-04-11 | International Business Machines Corporation | Characterization of phenotypes by gene expression patterns and classification of samples based thereon |
| US20030225526A1 (en) * | 2001-11-14 | 2003-12-04 | Golub Todd R. | Molecular cancer diagnosis using tumor gene expression signature |
| WO2004081564A1 (en) * | 2003-03-14 | 2004-09-23 | Peter Maccallum Cancer Institute | Expression profiling of tumours |
| US8335694B2 (en) * | 2004-07-09 | 2012-12-18 | Bruce Reiner | Gesture-based communication and reporting system |
| US20060159325A1 (en) * | 2005-01-18 | 2006-07-20 | Trestle Corporation | System and method for review in studies including toxicity and risk assessment studies |
| WO2006135904A2 (en) | 2005-06-13 | 2006-12-21 | Kohne David E | Method for producing improved results for applications which directly or indirectly utilize gene expression assay results |
| WO2007137187A2 (en) | 2006-05-18 | 2007-11-29 | Molecular Profiling Institute, Inc. | System and method for determining individualized medical intervention for a disease state |
| WO2008045389A2 (en) | 2006-10-05 | 2008-04-17 | Genetics Development Corporation | An improved molecular diagnostic and computerized decision support system incorporating bioinformatic software for selecting the optimum treatment for human cancer |
| US20080274911A1 (en) | 2006-11-07 | 2008-11-06 | Burington Bart E | Gene expression profiling based identification of genomic signature of high-risk multiple myeloma and uses thereof |
| US20100094795A1 (en) * | 2006-11-30 | 2010-04-15 | Johns Hopkins University | Gene expression barcode for normal and diseased tissue classification |
| WO2009067655A2 (en) * | 2007-11-21 | 2009-05-28 | University Of Florida Research Foundation, Inc. | Methods of feature selection through local learning; breast and prostate cancer prognostic markers |
| FI20085302A0 (fi) | 2008-04-10 | 2008-04-10 | Valtion Teknillinen | Rinnakkaisilta mittalaitteilta tulevan biologisten signaalien mittausten korjaaminen |
| WO2009132928A2 (en) | 2008-05-02 | 2009-11-05 | Siemens Healthcare Diagnostics Gmbh | Molecular markers for cancer prognosis |
-
2010
- 2010-03-12 FI FI20105252A patent/FI20105252A0/fi not_active Application Discontinuation
-
2011
- 2011-03-11 WO PCT/FI2011/050216 patent/WO2011110751A1/en not_active Ceased
- 2011-03-11 EP EP11752918.0A patent/EP2545481B1/de active Active
- 2011-03-11 US US13/583,138 patent/US9020934B2/en not_active Expired - Fee Related
-
2015
- 2015-03-23 US US14/665,437 patent/US9940383B2/en not_active Expired - Fee Related
Non-Patent Citations (1)
| Title |
|---|
| None * |
Also Published As
| Publication number | Publication date |
|---|---|
| FI20105252A0 (fi) | 2010-03-12 |
| US9020934B2 (en) | 2015-04-28 |
| US20150199477A1 (en) | 2015-07-16 |
| EP2545481A1 (de) | 2013-01-16 |
| WO2011110751A1 (en) | 2011-09-15 |
| EP2545481A4 (de) | 2015-09-09 |
| US20130066860A1 (en) | 2013-03-14 |
| US9940383B2 (en) | 2018-04-10 |
Similar Documents
| Publication | Publication Date | Title |
|---|---|---|
| US9940383B2 (en) | Method, an arrangement and a computer program product for analysing a biological or medical sample | |
| Rahnenführer et al. | Statistical analysis of high-dimensional biomedical data: a gentle introduction to analytical goals, common approaches and challenges | |
| US12242943B2 (en) | Generating machine learning models using genetic data | |
| US8515680B2 (en) | Analysis of transcriptomic data using similarity based modeling | |
| US20220044762A1 (en) | Methods of assessing breast cancer using machine learning systems | |
| CN107301331A (zh) | 一种基于基因芯片数据的疾病影响因素的挖掘方法 | |
| Vijayan et al. | Blood-based transcriptomic signature panel identification for cancer diagnosis: benchmarking of feature extraction methods | |
| US20180181705A1 (en) | Method, an arrangement and a computer program product for analysing a biological or medical sample | |
| Sundar et al. | An intelligent prediction model for target protein identification in hepatic carcinoma using novel graph theory and ann model | |
| Vishwakarma et al. | Classification algorithm for high‐dimensional protein markers in time‐course data | |
| US20240266002A1 (en) | Chromosome based cancer diagnosis | |
| CN121002198A (zh) | 用于鉴别一种或多种预测性生物标志物的人工智能 | |
| US10083274B2 (en) | Non-hypergeometric overlap probability | |
| AU2021100434A4 (en) | A system and method for predicting bipolar disorder and schizophrenia based on non-overlapping genetic phenotypes | |
| CN120283286A (zh) | 疾病表征 | |
| Sunny et al. | Classification of Cancer Stages Using Machine Learning on Numerical Biomarker Data | |
| Geetanjali et al. | Identifying Biomarkers for Papillary Thyroid Carcinoma Using Machine Learning | |
| WO2011124758A1 (en) | A method, an arrangement and a computer program product for analysing a cancer tissue | |
| US20090006055A1 (en) | Automated Reduction of Biomarkers | |
| US20240203521A1 (en) | Evaluation and improvement of genetic screening tests using receiver operating characteristic curves | |
| Chitraju | Predictive Modeling of Drug Response and Resistance Pathways in Human Cancer Cells Using Machine Learning | |
| Kho | Sample Mislabeling Detection and Correction in Bioinformatics Experimental Data | |
| WO2022165205A1 (en) | Systems and methods for diagnosing neurodegenerative diseases | |
| Mohammed | A Comparison of Cancer Classification Methods Based on Microarray Data | |
| Valenzuela Cansino et al. | New Advances in Bioinformatics and Biomedical Engineering Using Machine Learning Techniques, IWBBIO-2022 |
Legal Events
| Date | Code | Title | Description |
|---|---|---|---|
| PUAI | Public reference made under article 153(3) epc to a published international application that has entered the european phase |
Free format text: ORIGINAL CODE: 0009012 |
|
| 17P | Request for examination filed |
Effective date: 20121010 |
|
| AK | Designated contracting states |
Kind code of ref document: A1 Designated state(s): AL AT BE BG CH CY CZ DE DK EE ES FI FR GB GR HR HU IE IS IT LI LT LU LV MC MK MT NL NO PL PT RO RS SE SI SK SM TR |
|
| DAX | Request for extension of the european patent (deleted) | ||
| RA4 | Supplementary search report drawn up and despatched (corrected) |
Effective date: 20150807 |
|
| RIC1 | Information provided on ipc code assigned before grant |
Ipc: G06F 19/20 20110101ALI20150803BHEP Ipc: G06F 19/24 20110101AFI20150803BHEP |
|
| STAA | Information on the status of an ep patent application or granted ep patent |
Free format text: STATUS: EXAMINATION IS IN PROGRESS |
|
| 17Q | First examination report despatched |
Effective date: 20190104 |
|
| REG | Reference to a national code |
Ref country code: DE Ref legal event code: R079 Ref document number: 602011065093 Country of ref document: DE Free format text: PREVIOUS MAIN CLASS: G06F0019200000 Ipc: G16B0020000000 |
|
| GRAP | Despatch of communication of intention to grant a patent |
Free format text: ORIGINAL CODE: EPIDOSNIGR1 |
|
| STAA | Information on the status of an ep patent application or granted ep patent |
Free format text: STATUS: GRANT OF PATENT IS INTENDED |
|
| RIC1 | Information provided on ipc code assigned before grant |
Ipc: G06F 16/2457 20190101ALI20190802BHEP Ipc: C12Q 1/6886 20180101ALI20190802BHEP Ipc: G06F 16/28 20190101ALI20190802BHEP Ipc: G16B 40/00 20190101ALI20190802BHEP Ipc: G16B 25/10 20190101ALN20190802BHEP Ipc: G16B 20/00 20190101AFI20190802BHEP |
|
| INTG | Intention to grant announced |
Effective date: 20190910 |
|
| GRAS | Grant fee paid |
Free format text: ORIGINAL CODE: EPIDOSNIGR3 |
|
| GRAA | (expected) grant |
Free format text: ORIGINAL CODE: 0009210 |
|
| STAA | Information on the status of an ep patent application or granted ep patent |
Free format text: STATUS: THE PATENT HAS BEEN GRANTED |
|
| RAP1 | Party data changed (applicant data changed or rights of an application transferred) |
Owner name: MEDISAPIENS OY |
|
| RIN1 | Information on inventor provided before grant (corrected) |
Inventor name: PISTO, TOMMI Inventor name: OJALA, KALLE Inventor name: KILPINEN, SAMI Inventor name: AHOPELTO, TIMO |
|
| AK | Designated contracting states |
Kind code of ref document: B1 Designated state(s): AL AT BE BG CH CY CZ DE DK EE ES FI FR GB GR HR HU IE IS IT LI LT LU LV MC MK MT NL NO PL PT RO RS SE SI SK SM TR |
|
| REG | Reference to a national code |
Ref country code: GB Ref legal event code: FG4D |
|
| REG | Reference to a national code |
Ref country code: CH Ref legal event code: EP |
|
| REG | Reference to a national code |
Ref country code: DE Ref legal event code: R096 Ref document number: 602011065093 Country of ref document: DE |
|
| REG | Reference to a national code |
Ref country code: AT Ref legal event code: REF Ref document number: 1235882 Country of ref document: AT Kind code of ref document: T Effective date: 20200315 |
|
| REG | Reference to a national code |
Ref country code: IE Ref legal event code: FG4D |
|
| REG | Reference to a national code |
Ref country code: FI Ref legal event code: FGE |
|
| REG | Reference to a national code |
Ref country code: NL Ref legal event code: MP Effective date: 20200219 |
|
| PG25 | Lapsed in a contracting state [announced via postgrant information from national office to epo] |
Ref country code: NO Free format text: LAPSE BECAUSE OF FAILURE TO SUBMIT A TRANSLATION OF THE DESCRIPTION OR TO PAY THE FEE WITHIN THE PRESCRIBED TIME-LIMIT Effective date: 20200519 Ref country code: RS Free format text: LAPSE BECAUSE OF FAILURE TO SUBMIT A TRANSLATION OF THE DESCRIPTION OR TO PAY THE FEE WITHIN THE PRESCRIBED TIME-LIMIT Effective date: 20200219 |
|
| PGFP | Annual fee paid to national office [announced via postgrant information from national office to epo] |
Ref country code: FI Payment date: 20200514 Year of fee payment: 10 |
|
| REG | Reference to a national code |
Ref country code: LT Ref legal event code: MG4D |
|
| PG25 | Lapsed in a contracting state [announced via postgrant information from national office to epo] |
Ref country code: HR Free format text: LAPSE BECAUSE OF FAILURE TO SUBMIT A TRANSLATION OF THE DESCRIPTION OR TO PAY THE FEE WITHIN THE PRESCRIBED TIME-LIMIT Effective date: 20200219 Ref country code: SE Free format text: LAPSE BECAUSE OF FAILURE TO SUBMIT A TRANSLATION OF THE DESCRIPTION OR TO PAY THE FEE WITHIN THE PRESCRIBED TIME-LIMIT Effective date: 20200219 Ref country code: LV Free format text: LAPSE BECAUSE OF FAILURE TO SUBMIT A TRANSLATION OF THE DESCRIPTION OR TO PAY THE FEE WITHIN THE PRESCRIBED TIME-LIMIT Effective date: 20200219 Ref country code: BG Free format text: LAPSE BECAUSE OF FAILURE TO SUBMIT A TRANSLATION OF THE DESCRIPTION OR TO PAY THE FEE WITHIN THE PRESCRIBED TIME-LIMIT Effective date: 20200519 Ref country code: IS Free format text: LAPSE BECAUSE OF FAILURE TO SUBMIT A TRANSLATION OF THE DESCRIPTION OR TO PAY THE FEE WITHIN THE PRESCRIBED TIME-LIMIT Effective date: 20200619 Ref country code: GR Free format text: LAPSE BECAUSE OF FAILURE TO SUBMIT A TRANSLATION OF THE DESCRIPTION OR TO PAY THE FEE WITHIN THE PRESCRIBED TIME-LIMIT Effective date: 20200520 |
|
| PG25 | Lapsed in a contracting state [announced via postgrant information from national office to epo] |
Ref country code: NL Free format text: LAPSE BECAUSE OF FAILURE TO SUBMIT A TRANSLATION OF THE DESCRIPTION OR TO PAY THE FEE WITHIN THE PRESCRIBED TIME-LIMIT Effective date: 20200219 |
|
| REG | Reference to a national code |
Ref country code: DE Ref legal event code: R119 Ref document number: 602011065093 Country of ref document: DE |
|
| PG25 | Lapsed in a contracting state [announced via postgrant information from national office to epo] |
Ref country code: RO Free format text: LAPSE BECAUSE OF FAILURE TO SUBMIT A TRANSLATION OF THE DESCRIPTION OR TO PAY THE FEE WITHIN THE PRESCRIBED TIME-LIMIT Effective date: 20200219 Ref country code: CZ Free format text: LAPSE BECAUSE OF FAILURE TO SUBMIT A TRANSLATION OF THE DESCRIPTION OR TO PAY THE FEE WITHIN THE PRESCRIBED TIME-LIMIT Effective date: 20200219 Ref country code: ES Free format text: LAPSE BECAUSE OF FAILURE TO SUBMIT A TRANSLATION OF THE DESCRIPTION OR TO PAY THE FEE WITHIN THE PRESCRIBED TIME-LIMIT Effective date: 20200219 Ref country code: SK Free format text: LAPSE BECAUSE OF FAILURE TO SUBMIT A TRANSLATION OF THE DESCRIPTION OR TO PAY THE FEE WITHIN THE PRESCRIBED TIME-LIMIT Effective date: 20200219 Ref country code: DK Free format text: LAPSE BECAUSE OF FAILURE TO SUBMIT A TRANSLATION OF THE DESCRIPTION OR TO PAY THE FEE WITHIN THE PRESCRIBED TIME-LIMIT Effective date: 20200219 Ref country code: LT Free format text: LAPSE BECAUSE OF FAILURE TO SUBMIT A TRANSLATION OF THE DESCRIPTION OR TO PAY THE FEE WITHIN THE PRESCRIBED TIME-LIMIT Effective date: 20200219 Ref country code: PT Free format text: LAPSE BECAUSE OF FAILURE TO SUBMIT A TRANSLATION OF THE DESCRIPTION OR TO PAY THE FEE WITHIN THE PRESCRIBED TIME-LIMIT Effective date: 20200712 Ref country code: SM Free format text: LAPSE BECAUSE OF FAILURE TO SUBMIT A TRANSLATION OF THE DESCRIPTION OR TO PAY THE FEE WITHIN THE PRESCRIBED TIME-LIMIT Effective date: 20200219 Ref country code: EE Free format text: LAPSE BECAUSE OF FAILURE TO SUBMIT A TRANSLATION OF THE DESCRIPTION OR TO PAY THE FEE WITHIN THE PRESCRIBED TIME-LIMIT Effective date: 20200219 |
|
| REG | Reference to a national code |
Ref country code: CH Ref legal event code: PL |
|
| REG | Reference to a national code |
Ref country code: AT Ref legal event code: MK05 Ref document number: 1235882 Country of ref document: AT Kind code of ref document: T Effective date: 20200219 |
|
| PG25 | Lapsed in a contracting state [announced via postgrant information from national office to epo] |
Ref country code: MC Free format text: LAPSE BECAUSE OF FAILURE TO SUBMIT A TRANSLATION OF THE DESCRIPTION OR TO PAY THE FEE WITHIN THE PRESCRIBED TIME-LIMIT Effective date: 20200219 |
|
| REG | Reference to a national code |
Ref country code: BE Ref legal event code: MM Effective date: 20200331 |
|
| PLBE | No opposition filed within time limit |
Free format text: ORIGINAL CODE: 0009261 |
|
| STAA | Information on the status of an ep patent application or granted ep patent |
Free format text: STATUS: NO OPPOSITION FILED WITHIN TIME LIMIT |
|
| PG25 | Lapsed in a contracting state [announced via postgrant information from national office to epo] |
Ref country code: LU Free format text: LAPSE BECAUSE OF NON-PAYMENT OF DUE FEES Effective date: 20200311 |
|
| 26N | No opposition filed |
Effective date: 20201120 |
|
| PG25 | Lapsed in a contracting state [announced via postgrant information from national office to epo] |
Ref country code: IE Free format text: LAPSE BECAUSE OF NON-PAYMENT OF DUE FEES Effective date: 20200311 Ref country code: CH Free format text: LAPSE BECAUSE OF NON-PAYMENT OF DUE FEES Effective date: 20200331 Ref country code: IT Free format text: LAPSE BECAUSE OF FAILURE TO SUBMIT A TRANSLATION OF THE DESCRIPTION OR TO PAY THE FEE WITHIN THE PRESCRIBED TIME-LIMIT Effective date: 20200219 Ref country code: LI Free format text: LAPSE BECAUSE OF NON-PAYMENT OF DUE FEES Effective date: 20200331 Ref country code: DE Free format text: LAPSE BECAUSE OF NON-PAYMENT OF DUE FEES Effective date: 20201001 Ref country code: AT Free format text: LAPSE BECAUSE OF FAILURE TO SUBMIT A TRANSLATION OF THE DESCRIPTION OR TO PAY THE FEE WITHIN THE PRESCRIBED TIME-LIMIT Effective date: 20200219 |
|
| PG25 | Lapsed in a contracting state [announced via postgrant information from national office to epo] |
Ref country code: PL Free format text: LAPSE BECAUSE OF FAILURE TO SUBMIT A TRANSLATION OF THE DESCRIPTION OR TO PAY THE FEE WITHIN THE PRESCRIBED TIME-LIMIT Effective date: 20200219 Ref country code: SI Free format text: LAPSE BECAUSE OF FAILURE TO SUBMIT A TRANSLATION OF THE DESCRIPTION OR TO PAY THE FEE WITHIN THE PRESCRIBED TIME-LIMIT Effective date: 20200219 Ref country code: BE Free format text: LAPSE BECAUSE OF NON-PAYMENT OF DUE FEES Effective date: 20200331 |
|
| GBPC | Gb: european patent ceased through non-payment of renewal fee |
Effective date: 20200519 |
|
| PG25 | Lapsed in a contracting state [announced via postgrant information from national office to epo] |
Ref country code: GB Free format text: LAPSE BECAUSE OF NON-PAYMENT OF DUE FEES Effective date: 20200519 |
|
| REG | Reference to a national code |
Ref country code: FI Ref legal event code: MAE |
|
| PG25 | Lapsed in a contracting state [announced via postgrant information from national office to epo] |
Ref country code: FI Free format text: LAPSE BECAUSE OF NON-PAYMENT OF DUE FEES Effective date: 20210311 |
|
| PG25 | Lapsed in a contracting state [announced via postgrant information from national office to epo] |
Ref country code: TR Free format text: LAPSE BECAUSE OF FAILURE TO SUBMIT A TRANSLATION OF THE DESCRIPTION OR TO PAY THE FEE WITHIN THE PRESCRIBED TIME-LIMIT Effective date: 20200219 Ref country code: MT Free format text: LAPSE BECAUSE OF FAILURE TO SUBMIT A TRANSLATION OF THE DESCRIPTION OR TO PAY THE FEE WITHIN THE PRESCRIBED TIME-LIMIT Effective date: 20200219 Ref country code: CY Free format text: LAPSE BECAUSE OF FAILURE TO SUBMIT A TRANSLATION OF THE DESCRIPTION OR TO PAY THE FEE WITHIN THE PRESCRIBED TIME-LIMIT Effective date: 20200219 |
|
| PG25 | Lapsed in a contracting state [announced via postgrant information from national office to epo] |
Ref country code: MK Free format text: LAPSE BECAUSE OF FAILURE TO SUBMIT A TRANSLATION OF THE DESCRIPTION OR TO PAY THE FEE WITHIN THE PRESCRIBED TIME-LIMIT Effective date: 20200219 Ref country code: AL Free format text: LAPSE BECAUSE OF FAILURE TO SUBMIT A TRANSLATION OF THE DESCRIPTION OR TO PAY THE FEE WITHIN THE PRESCRIBED TIME-LIMIT Effective date: 20200219 |
|
| PG25 | Lapsed in a contracting state [announced via postgrant information from national office to epo] |
Ref country code: FR Free format text: LAPSE BECAUSE OF NON-PAYMENT OF DUE FEES Effective date: 20200331 |