EP2498083B1 - Method of processing a current measurement for calculating a glucose concentration - Google Patents
Method of processing a current measurement for calculating a glucose concentration Download PDFInfo
- Publication number
- EP2498083B1 EP2498083B1 EP12171146.9A EP12171146A EP2498083B1 EP 2498083 B1 EP2498083 B1 EP 2498083B1 EP 12171146 A EP12171146 A EP 12171146A EP 2498083 B1 EP2498083 B1 EP 2498083B1
- Authority
- EP
- European Patent Office
- Prior art keywords
- current
- test
- conversions
- time interval
- meter
- Prior art date
- Legal status (The legal status is an assumption and is not a legal conclusion. Google has not performed a legal analysis and makes no representation as to the accuracy of the status listed.)
- Active
Links
Images




Classifications
-
- G—PHYSICS
- G01—MEASURING; TESTING
- G01N—INVESTIGATING OR ANALYSING MATERIALS BY DETERMINING THEIR CHEMICAL OR PHYSICAL PROPERTIES
- G01N27/00—Investigating or analysing materials by the use of electric, electrochemical, or magnetic means
- G01N27/26—Investigating or analysing materials by the use of electric, electrochemical, or magnetic means by investigating electrochemical variables; by using electrolysis or electrophoresis
- G01N27/28—Electrolytic cell components
- G01N27/30—Electrodes, e.g. test electrodes; Half-cells
- G01N27/327—Biochemical electrodes, e.g. electrical or mechanical details for in vitro measurements
- G01N27/3271—Amperometric enzyme electrodes for analytes in body fluids, e.g. glucose in blood
- G01N27/3274—Corrective measures, e.g. error detection, compensation for temperature or hematocrit, calibration
Definitions
- the invention generally relates to a system for managing health care and, in particular, to a system for filtering electrical signals generated by a voltage provided to a test strip for testing physiological fluid in a test meter.
- Diabetes is a chronic disease that requires continued monitoring and controlling of health parameters such as blood glucose levels, medication, nutritional condition, and weight and exercise data. Also, patients with cardiovascular disease may require the monitoring of cholesterol levels. Because of the chronic nature of such diseases, health parameters must be measured on a continual periodic basis by the patients themselves outside a clinical setting.
- the test strip may be designed to include two or more electrodes connectable with a meter and used to develop an electrical pathway through the sample. The meter is then able to determine the electrical characteristics of the sample and through known correlations may be able to deduce the concentration of a particular analyte in the sample.
- A/D converter samples the voltage, which is generated from an electronic circuit, connected to the test strip.
- the current generated in the strip is very low, only a few microamperes and the resolution of the signal should be as high as possible to achieve a high resolution blood glucose signal.
- noise sources may include signals from light switches, mobile phones, electrostatic discharge pulses, power supplies connected to mains, etc. These disturbances add to the signal and falsify the measurement result.
- One example of a hardware solution may be to integrate the signal by, for example, using an R-C (resistor - capacitor) combination circuit.
- R-C resistor - capacitor
- Such a circuit may be used to smooth the signal and improve the signal to noise ratio.
- the application of such a circuit introduces delays and reduces bandwidth.
- the software averaging algorithm, described above, alone may not be sufficient to filter noise and provide a preferred level of performance because a "glitch" or noise disturbance, which does not accurately represent the electrical characteristics of the sample, may be so large as to dominate the smaller measured values which are closely representative of the true electrical characteristics of the sample. Accordingly, there is a need for an alternative filtering method which is tailored to eliminate "glitches” or noise disturbances like those generated from light switches, electrostatic discharge, switching power supplies, and also from the meter electronics itself , which may have microcontrollers with external address and data bus devices with switching frequencies in the megahertz (MHz) range.
- MHz megahertz
- a method for reducing the noise in a data acquisition process includes sampling an analog signal a plurality of times during a given time period.
- the plurality of analog to digital (A/D) conversions are ranked based on their magnitude and instead of averaging all of the plurality of A/D conversions, specific samples are selected and discarded.
- An average of the remaining A/D conversions is then computed.
- the present invention comprises steps to discard at least a highest magnitude A/D conversion and at least a lowest magnitude A/D conversion. Alternatively, a number of highest conversions and a number of lowest conversions may be discarded.
- This filtering process has the effect of making the computed average more robust to extreme outliers that may be caused by environmental noise, such as, but not limited to electrostatic discharge. Accordingly, the resultant computed average is more accurate than a simple averaging methodology.
- Figure 1 is a perspective view of an exemplary test meter 200.
- Test meter 200 includes a housing 201, a display 202, an OK button 204, a down button 206, a back button 208, an up button 210, a light emitting diode (LED) 212, and a strip port connector (SPC) 214.
- Display 202 may be a liquid crystal display (LCD) to show both textual and graphical information to a user.
- a user interface (UI) may be software driven menu that is shown on display 202 that enables the user to operate test meter 200. A user can navigate through the UI using up button 210, down button 206, OK button 204, and back button 208.
- Test meter 200 is an example of one configuration of a test meter; there may be many others.
- Housing 201 may be formed from any of a variety of materials, including but not limited to polymeric materials, metals and metal alloys, etc.
- Display 202 may be any variety of display devices, including, but not limited to LCD displays, LED displays, OLED displays, and other types of displays which may be heretofore developed. Further, display 202 may be a series of lights and/or simple readouts as opposed to a single integrated display screen.
- LED 212 may be any other variety of indicators, including, but not limited to LED's, other types of light devices, sound devices, vibration devices, etc.
- Strip port connector 214 is used to accept and to electrically connect a test strip to test meter 200 however other configurations of interfacing devices may also be used.
- Buttons 204, 206, 208, and 210 may be any of a variety of buttons or other user input devices including, but not limited to touch sensitive devices. Further, buttons 204, 206, 208, and 210 may be replaced a user interface on display 202 or a speech recognition device built into test meter 200.
- Display 202 may also include a touch sensitive screen which overlays display 202 and allows a user to provide input to test meter 200 via the touch screen. The touch sensitive screen may be used with a user's finger, a separate stylus or other touching device.
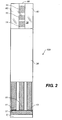
- Test strip 100 suitable for use in test meter 200 is shown in Figure 2 .
- Test strip 100 includes a conductive layer comprising electrically isolated portions that are conventionally printed onto a substrate 5.
- the conductive layer includes a first contact 13, a second contact 15, a reference contact 11, and a strip detection bar 17 which may be used to electrically connect to strip port connector 214.
- the conductive layer further includes a first working electrode 12, a second working electrode 14, and a reference electrode 10 which are electrically connected, respectively, to first contact 13, second contact 15, and reference contact 11. Contacts to the electrodes connect within the meter to apply a voltage across electrodes selectively under control of the meter.
- Test strip 100 further includes, but is not limited to, a clear hydrophilic film 36 which is bound by an adhesive 60 that forms a sample receiving chamber that allows blood to be dosed at an inlet 90.
- Film 36 may cover the entire end of the test strip thereby forming the visible sample chamber between the adhesion zones shown as 60 in Figure 2 .
- An opaque film 38 is also bound by adhesive 60 to show contrast for guiding user to dose blood at inlet 90.
- Substrate 5 may be formed of a variety of materials including, but not limited to polymeric materials or other insulating materials.
- the material substrate 5 may be formed from a polyester material (such as, but not limited to Meline ST328), which is manufactured by DuPont Teijin Films.
- Substrate 5 may be supplied in a roll of material, which may be, for example, nominally 350 microns thick by 370 millimeters wide and approximately 660 meters in length.
- Conductive layers, such as layers 10, 11, 12, 13, 14, 15, and 17 may be formed from any of a variety of conductive materials such as, but not limited to metals and metal alloys which may be deposited on substrate 5 via any of a number of manufacturing processes.
- Opaque film 38 is used for the convenience of a user to provide contrast but may be substituted by any of a number of methods, such as printed textual indicators, to guide the user to dose blood at inlet 90.
- An example of test strip 100 is OneTouch Ultra which is available from LifeScan, Inc. (Milpitas, California, USA).
- a reagent layer may be disposed on first working electrode 12, second working electrode 14, and reference electrode 10 within the sample chamber or cavity.
- Reagent layer may include chemicals such as a redox enzyme and mediator which selectively reacts with glucose.
- Examples of reagent formulations or inks suitable for use in making reagent layer 22 can be found in U.S. Patent No.'s 5,708,247 and 6,046,051 ; Published International Applications WO01/67099 and WO01/73124 .
- any of a variety of other reagent layers and reagent chemicals may be used.
- test strip 100 may be electrically connected to test meter 200 through strip port connector 214, a user may apply a physiological fluid to inlet 90.
- test meter 200 may have different types of connectors as opposed to strip port connector 214.
- Physiological fluid may be applied to test strip 100 in a variety of ways.
- the fluid sample may be taken from a droplet of blood on the skin surface, or from a receptacle.
- a physiological fluid sample may also be taken directly from the body by using a needle or microneedle.
- the physiological fluid causes the reagent layer to dissolve and enzymatically generate a proportional amount of reduced mediator which correlates to a glucose concentration.
- Test meter 200 may apply a test voltage of about +0.4 Volts, for example, between first working electrode 12 and reference electrode 10.
- the test meter can also apply a test voltage of about +0.4 Volts between second working electrode 14 and reference electrode 10. This will enable the reduced mediator to be proportionally measured as a test current, which in this case is an oxidation current measured at first working electrode 12 and at second working electrode 14.
- the test voltage that is applied may be any of a variety of test voltages. The test voltages are not limited to the 0.4 Volts described above. Further, it may not be necessary to apply test voltages between both a first electrode and the reference electrode and a second electrode and the reference electrode. It may be desirable only to have a system which measures voltages between the first electrode and the reference electrode, thereby simplifying the system.
- Figure 3 is an exemplary chart showing a test voltage applied by test meter 200 to test strip 100 for a test time interval T 1 .
- test meter 200 Before the physiological fluid is applied, test meter 200 would be in a fluid detection mode in which the test voltage is +0.4V.
- the fluid detection mode is indicated in Figure 3 as a fluid detection time interval T FD and as indicated is a time period before or less than a zero (0) reference time.
- test meter 200 determines when a fluid is applied to inlet 90 such that both first working electrode 12 and reference electrode 10 are wetted with a fluid. Note that first working electrode 12 and reference electrode 10 are effectively short-circuited when the physiological fluid contiguously covers first working electrode 12 and reference electrode 10.
- test meter 200 recognizes that the physiological fluid has been applied because of a sufficient increase in the measured test current between electrodes 10 and 12, test meter 200 assigns a zero second marker and starts the test time interval T 1 .
- Other methods of determining the presence of a physiological fluid on the test strip may be used.
- other methods of detecting the presence of a fluid on the test strip may be used.
- test time interval T 1 may be about 5.4 seconds.
- the sample current is measured and the data collected to determine the glucose concentration in the sample.
- the test voltage is removed. While an effective test time has been shown to be 5.4 seconds, any of a variety of test times may be used.
- Test strip 100 will carry a test current when the test voltage is sufficiently positive with respect to a redox potential of the mediator.
- a redox potential describes a mediator's intrinsic affinity to accept or donate electrons when sufficiently close to an electrode having a nominal potential.
- Figure 4 is an exemplary chart showing the test current detected flowing through the sample on test strip 100 for test time interval T 1 .
- the meter coupled to test strip 100 is configured to measure the current in the circuit formed by the two electrodes and the sample in the sample area.
- the test current rapidly increases when test strip 100 is initially wetted with the physiological fluid causing a peak to be formed which is followed by a gradual decrease in the test current.
- Figure 4 represents a typical test, other response curves may be observed, especially but not only, in the testing for other analytes besides glucose as well as the presence of other noise disturbances.
- test current in Figure 4 is an analog signal that may be converted to a digital signal for processing the test current into a glucose concentration.
- Test meter 200 may include a Texas Instrument mixed signal processor (e.g. TI MSP 430) having a twelve bit A/D converter for converting the analog test current into a digital test current.
- Texas Instrument mixed signal processor e.g. TI MSP 430
- Other A/D converting circuits may similarly be used, including those with more or less bits providing differing accuracy and resolution, and those made or provided by different manufacturers.
- S/N ratios may be used, not limited to those explicitly provided. Further, although characterized by % CV, other characterizations of S/N ratio may also be used. A method will be described that reduces the noise in sampling the test current using an A/D converter.
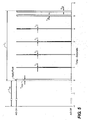
- Test time interval T 1 may include an aggregate of shorter time intervals which are a current reading time interval T 3 , an electrostatic discharge (ESD) check time interval T ESD , a final current value time interval for first working electrode T 2a , and a final current value time interval for second working electrode T 2b .
- ESD electrostatic discharge
- T ESD electrostatic discharge
- a final current value time interval for first working electrode T 2a a final current value time interval for second working electrode T 2b
- other combinations of time intervals may be used having differing relative lengths. Further, some time intervals may be omitted.
- the A/D may toggle relatively quickly between the On and Off state during a given time interval, typically on the order of milliseconds or, on the order of microseconds.
- Figure 6 is an expanded simplified view of final current value time interval for first working electrode T 2a and final current value time interval for second working electrode T 2b .
- final current value time interval for first working electrode T 2a starts at about 5 seconds and has a duration of about 80 milliseconds.
- final current value time interval for second working electrode T 2b starts at about 5.3 seconds and has a duration of about 80 milliseconds.
- Final current value time interval for first working electrode T 2a may include, for example, five consecutive current reading time intervals T 3 .
- final current value time interval for the second working electrode T 2b may include, for example, five current reading time intervals T 3 .
- Current reading time interval T 3 may be, for example, about 18 milliseconds as shown in Figure 6 and 7 . The invention is not limited to the numbers of current reading time intervals disclosed nor to the reading time interval disclosed.
- FIG. 7 is an expanded simplified view of a current reading time interval T 3 which includes eight consecutive current sample time intervals T 4 .
- a LOW period reading time interval T 3L that represents a period of time in which the A/D is Off after acquiring the A/D conversions, for example, for eight current sample time intervals T 4 .
- the microprocessor has a free time period to perform data calculations such as, for example, a summation or average of the A/D conversions acquired during current reading time interval T 3 .
- the microprocessor may initiate another current reading time interval T 3 .
- the invention is not limited to the time intervals shown and disclosed nor to the number of A/D conversions shown and disclosed.
- Current sample time interval T 4 may be, for example, about 2 milliseconds as shown in Figures 7 and 8 .
- Current sample time interval T 4 includes a HIGH period sample time interval T 4H and a LOW period sample time interval T 4L .
- HIGH period sample time interval T 4H may be a period of time in which the A/D is On for acquiring A/D conversions.
- LOW period sample time interval T 4L may be a period of time in which the A/D is Off after acquiring the required A/D conversions during HIGH period sample time interval T 4H .
- HIGH period sample time interval T 4H may be, for example, about 0.4 milliseconds and LOW period sample time interval T 4L maybe, for example, about 1.6 milliseconds as shown in Figures 7 and 8 .
- the microprocessor has a free time period to perform data calculations on the acquired A/D conversions acquired during HIGH period sample time interval T 4H such as, for example, ranking, filtering, summations, averaging and/or combinations thereof of the A/D conversions or other needed calculations and data manipulations.
- the microprocessor may initiate another current sample time interval T 4 .
- the sample time interval magnitudes shown and described are not limited. Any time intervals maybe used which would provide desired performance.
- Figure 8 is an expanded view of an exemplary current sample time interval T 4 which includes 16 consecutive A/D conversion time intervals T 5 .
- the test current may be sampled at a pre-determined sampling rate during HIGH period sample time interval T 4H .
- the pre-determined sampling rate may be, for example, about 40 Kilohertz as shown in Figure 8 .
- a single A/D conversion may be acquired during A/D conversion time interval T 5 which in this case may be about, for example, 25 microseconds as shown in Figure 8 .
- An A/D conversion would be a digital number having a magnitude which is proportional to the test current at the point in time in which the A/D conversion was taken.
- A/D conversions may also be referred to as a glucose signal because the magnitude of the A/D conversion in this case is proportional to the glucose concentration.
- 16 A/D conversions may be acquired during current sample time interval T 4 and stored in a memory portion of test meter 200. A current sample may then be calculated using either an average or summation of the 16 A/D conversions acquired during current sample time interval T 4 . In order to reduce noise, a current sample may be calculated using either an average or summation of a subset of the 16 A/D conversions acquired during current sample time interval T 4 .
- a method will be described that shows how to select a subset of the 16 A/D conversions for reducing the noise when measuring a "current reading.” may be desirable to use more or less than 16 A/D conversions to meet desired performance goals and statistically significant objectives.
- an exemplary method for reducing noise is to average a plurality of A/D conversions.
- averaging will effectively reduce noise when it follows a Gaussian distribution.
- non-parametric methods may be used to help reduce noise.
- An example of noise which does not follow a Gaussian distribution may be an electrostatic discharge event, signals from light switches, and mobile phones.
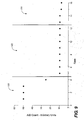
- sixteen A/D conversions collected during a current sample time interval T 4 may be ranked based on their magnitude as shown in Figure 9 . Instead of simply averaging all sixteen A/D conversions, at least a highest magnitude A/D conversion and a lowest magnitude A/D conversion may be filtered leaving a plurality of accepted A/D conversions.
- a four highest A/D conversions and a four lowest A/D conversions may be filtered leaving eight accepted A/D conversions as shown in Figure 9.
- Figure 9 depicts high and low filtered zones 120 and an accepted zone 122.
- Filtered zone 122 shows the eight remaining samples that will be used for averaging while zones 120 show the eight samples which will be discarded.
- the microprocessor of test meter 200 may calculate a current sample by averaging or summing together the 8 accepted A/D conversions acquired during current sample time interval T 4 .
- a current reading may be calculated by averaging or summing together 8 current samples (of time T 4 , which in this case is a total of 64 A/D conversions) all acquired within current reading time interval T 3 .
- a final current value may be calculated by averaging or summing together 5 current readings (which in this case is a total of 320 A/D conversions) all acquired within final current value time interval for first working electrode T 2a or final current value time interval for second working electrode T 2b .
- Methods will be described for using current readings and final current values for determining whether a test strip has been dosed with a physiological fluid, calculating a glucose concentration, performing error trapping procedures, and preventing a glucose test from initiating when ESD is injected into the test meter. Further, different numbers of A/D conversions, samples, and reading may be used.
- a final current value for first working electrode and a final current value for second working electrode may be summed together to give a grand summation.
- a glucose algorithm may include the steps of subtracting a background value (which is representative of general background noise and therefore represents a bias) from the grand summation followed by a division of a calibration slope (which calibrates the device to known glucose concentration / current curves or data) to generate a glucose concentration which can be outputted onto display 202.
- the test current measured for a test strip 100 may have a characteristic shape as shown in Figure 2 that is usually present when testing with a physiological fluid. If the characteristic shape is not present, then this is usually indicative of a system defect or a user error. More particularly, Figure 2 shows an example of a test current that forms a maximum peak value followed by a gradual decay.
- An error trapping method may include verifying that the test current does not increase after the maximum peak time T p .
- the error trapping method may include determining a maximum peak value time and measuring a current reading at one second intervals as shown in Figure 5 after applying fluid to test strip 100. The error trapping method may determine that there is no defect if a current reading minus an immediately previous current reading is less than an error threshold such as for example, about 100 nanoampres.
- This error trapping method may be performed on all current readings measured at one second intervals so long as the immediately previous current reading was measured after the maximum peak value time.
- I CRk -I CRk-1 100 nanoampres
- test meter 200 should output an error message on display 202 and not output a glucose concentration.
- other data integrity or error trapping methods may be applied.
- a simplified error trapping method may be used.
- only two current readings are used at four seconds and at five seconds. The current reading at four seconds may be subtracted from the current reading at five seconds. If I CR5 -I CR4 ⁇ 100 nanoampres, then there is no error due to the non-characteristic increase in current with time, where I CR5 is the current reading at 5 seconds and I CR4 is the current reading at 4 seconds. However, if I CR5 - I CR4 > 100 nanoampres, then test meter 200 should output an error message on display 202 and not output a glucose concentration. In this simplified exemplary embodiment, current readings are not used at one, two, and three seconds so as to simplify the error trapping algorithm. Additionally, maximum peak time T p is also not calculated in this embodiment.
- Extraneous signals can come from a variety of sources, events, or conditions and typically occur during the normal use of a test meter such as the test meter 200.
- Exemplary extraneous events include electrostatic discharge and electromagnetic emission such as radio-frequency or microwave frequency emission, for example.
- Use of an electronic device such as a phone, microwave oven, radio, or other household appliance can potentially cause an extraneous signal.
- common events such as switching of light switches, switching of thermostats, and other activities were an electronic relay or the like turns on an off can cause extraneous signals.
- a particular extraneous signal can be characterized in some way and used to distinguish the extraneous signal from a desired signal. Characterization in this way preferably relates to the magnitude, duration, and timing (independently or in combination) of an extraneous signal. Generally, a characteristic behavior of an extraneous signal or event can be used to identify the signal as extraneous. This behavior may be a specific value or may relate to a trend or changing condition over time, for example.
- One type of extraneous signal is related to electrostatic discharge.
- a user Under certain conditions, such as where low relative humidity exists, a user can carry a significant amount of electrostatic charge. Thus, such a user may potentially inject electrostatic energy into the test meter, when touching a test strip connected to a test meter. This unexpected energy can cause the meter to measure a sufficiently large current that can cause the meter to initiate and perform a glucose test on a dry test strip. Because there is no glucose in the test strip, the meter should output an error message because the measured test current will be too low. Typically, a user will be instructed to discard the test strip when the meter generates an error message. This is highly undesirable where ESD falsely triggers a glucose test because the dry test strip is actually not defective and thus would be thrown away unnecessarily.
- test meter 200 preferably starts a fluid detection mode once test strip 100 is inserted into strip port connector 214. During the fluid detection mode, test meter 200 preferably applies a test potential of between at least the first working electrode 12 and the reference electrode 10.
- the test voltage used generally depends of the particular test meter and test strip used and a suitable test voltage for the illustrated meter 200 is about 400 millivolts.
- the fluid detection mode time interval TFD includes the time before physiological fluid is applied to inlet 90 and is represented as the time interval that is less than zero as illustrated in Figure 5 .
- test meter 200 will preferably continuously measure a current reading at a predetermined frequency until a single current reading is found to exceed a threshold value.
- a measurement frequency ranging from about once every 20 milliseconds to about once every 100 milliseconds can be used.
- a threshold value that can be used for testing blood is about 150 nanoampres.
- test meter 200 When test strip 100 is initially dry, test meter 200 will measure a zero test current value or a small test current value which is below the threshold. Once fluid is applied, the test meter will measure an increase in a current reading due to a decrease in resistance between the first working electrode 12 and reference electrode 10. This current increase will cause the meter to start test time interval T1 as shown in Figure 5 .
- test meter 200 preferably enters an ESD check mode once test meter 200 measures at least one current reading greater than the threshold as shown in Fig. 5 .
- test meter 200 preferably continues to apply a potential for an ESD check time interval TESD.
- test meter 200 preferably continuously measures a current reading on a predetermined schedule. For example, a measurement once every 20 milliseconds can be used. If any of the current readings measured during ESD check time interval TESD are less than the threshold, then test meter 200 preferably returns back to the fluid detection mode. If all of the current readings measured during ESD check time interval TESD are greater than the threshold, then test meter 200 will continue the glucose test.
- test meter 200 will measure an increase in a current reading of greater than about 150 nanoampres due to a decrease in resistance between the first working 12 electrode and reference electrode 10. This will preferably cause the meter to go from the fluid detection mode to the ESD check mode.
- the test current will stay greater than 150 nanoampres for the ESD check time interval TESD allowing the glucose test to proceed through the test time interval T1.
- a current reading may be measured that is greater than the threshold causing the meter to go from the fluid detection mode to the ESD check mode.
- a test current generated by ESD dissipates quickly producing a transient spike that typically decays within about a 100 millisecond range. This contrasts with the increase in the test current caused by a test fluid such as blood where the test current continues to increase beyond a threshold of 150 nanoampres for a known time for the particular fluid (about 1 second for blood).
- the ESD check time interval TESD expires, the flag is checked and if set, operation reverts back to looking for sample again. If the flag is not set, fluid measurement preferably continues as described below.
- ESD check time interval TESD ranges from about 100 milliseconds to about 1 second, and preferably be about 200 milliseconds.
- the low end of ESD check time interval TESD is based on a typical dissipation time of ESD, which is about 100 milliseconds but may be based on a typical characteristic such as a dissipation time for any desired extraneous event.
- the high end of ESD check time interval TESD is preferably based on the amount of available time before test meter 200 needs to notify a user that the test is in progress.
- test time interval T1 is typically outputted onto a display of the test meter 200 in integer values. After one second has elapsed on the display, the user will believe that the glucose test is in progress. Therefore, when a sufficiently large amount of ESD is injected into test meter 200, it needs to determine that it must go back to the fluid detect mode before the user has any indication that the test is in progress such as when the display shows that one second of the glucose test has elapsed.
- a meter such as the meter 200, can be programmed so that after a first trigger reading (a measurement above a predetermined threshold) the meter continues to monitor the current for some predetermined period of time.
- the threshold may be a current level indicative of the presence of a sample for example. If during the monitoring period the current falls below the trigger threshold, the meter will set a flag. When the monitoring time expires, the flag will be checked and if set, operation will revert back to looking for sample again. If the current remains above the threshold for the whole of this period then the test sample current readings can be processed as normal. Monitoring the current for the whole of the ESD check period instead of reverting back once ESD is first detected can ensure that any ringing of the ESD pulse has time to decay before the meter attempts another reading.
- time intervals and current magnitudes disclosed relating to the ESD check are not limited to those disclosed. Other values may be used without departing from the scope of the invention.
Landscapes
- Health & Medical Sciences (AREA)
- Chemical & Material Sciences (AREA)
- Hematology (AREA)
- Life Sciences & Earth Sciences (AREA)
- Analytical Chemistry (AREA)
- Chemical Kinetics & Catalysis (AREA)
- Electrochemistry (AREA)
- Physics & Mathematics (AREA)
- Molecular Biology (AREA)
- Biochemistry (AREA)
- General Health & Medical Sciences (AREA)
- General Physics & Mathematics (AREA)
- Immunology (AREA)
- Pathology (AREA)
- Investigating Or Analysing Biological Materials (AREA)
- Measurement Of The Respiration, Hearing Ability, Form, And Blood Characteristics Of Living Organisms (AREA)
- Measuring Or Testing Involving Enzymes Or Micro-Organisms (AREA)
Description
- The invention generally relates to a system for managing health care and, in particular, to a system for filtering electrical signals generated by a voltage provided to a test strip for testing physiological fluid in a test meter.
- Diabetes is a chronic disease that requires continued monitoring and controlling of health parameters such as blood glucose levels, medication, nutritional condition, and weight and exercise data. Also, patients with cardiovascular disease may require the monitoring of cholesterol levels. Because of the chronic nature of such diseases, health parameters must be measured on a continual periodic basis by the patients themselves outside a clinical setting.
- Conventionally electronic meters are used to measure glucose from a test strip when a patient applies blood to it. The test strip may be designed to include two or more electrodes connectable with a meter and used to develop an electrical pathway through the sample. The meter is then able to determine the electrical characteristics of the sample and through known correlations may be able to deduce the concentration of a particular analyte in the sample.
- Conventional methods for the measurement of blood glucose response current, e.g known from
US 2004/0132203 , use an analog to digital (A/D) converter. The A/D converter samples the voltage, which is generated from an electronic circuit, connected to the test strip. The current generated in the strip is very low, only a few microamperes and the resolution of the signal should be as high as possible to achieve a high resolution blood glucose signal. Because of all kinds of noise from the environment, measuring a very small signal with a high resolution by nature leads to technical difficulties. Such noise sources may include signals from light switches, mobile phones, electrostatic discharge pulses, power supplies connected to mains, etc. These disturbances add to the signal and falsify the measurement result. - Conventionally, there are hardware and software solutions to solving the noise problem. One example of a hardware solution may be to integrate the signal by, for example, using an R-C (resistor - capacitor) combination circuit. Such a circuit may be used to smooth the signal and improve the signal to noise ratio. However, the application of such a circuit introduces delays and reduces bandwidth.
- An example of a software solution is to sample the signal as often as possible and then calculate an average of all values sampled. The principle is similar to the hardware integration, however it "weights" every sample the same. Accordingly, a very short glitch, which may occur just when the sampling starts, is given too much weight thereby overshadowing other signal changes during the conversion period and those signal changes may be ignored. Nevertheless, such a software solution usually reduces the noise to an acceptable "quasi noise-free" value, especially when it has to eliminate "white noise" effects. This principle however is limited when there is not sufficient time to take enough A/D readings or the noise is not "white noise". As more readings are being averaged, the final result will be more accurate. However, taking too many readings takes a significant amount of time. Also for the software solution to calculate the average produces a phase shifting of the real signal versus the average result. For example, taking readings from a constant changing signal like the blood glucose transient over a period of, for example, 200ms will give an average value that is available 100ms delayed and also corresponds to the mean value over the last 200ms.
- In blood glucose monitoring, the software averaging algorithm, described above, alone may not be sufficient to filter noise and provide a preferred level of performance because a "glitch" or noise disturbance, which does not accurately represent the electrical characteristics of the sample, may be so large as to dominate the smaller measured values which are closely representative of the true electrical characteristics of the sample. Accordingly, there is a need for an alternative filtering method which is tailored to eliminate "glitches" or noise disturbances like those generated from light switches, electrostatic discharge, switching power supplies, and also from the meter electronics itself , which may have microcontrollers with external address and data bus devices with switching frequencies in the megahertz (MHz) range. Thus, there is a need for a filtering algorithm which analyzes those values before a noise disturbance, which may only take a few microseconds, and may cause only one or two A/D readings to be wrong (usually extremely high or low) and identifies these "wrong" or "extreme" readings and filters them out before the average is calculated over the remaining value. Such a system would have a significant advantage over conventional methods, because less A/D readings would be required to come to a "quasi noise-free" result and thus much less time would be needed to take a sufficient number of samples. Such a methodology would also have the effect of reducing the phase delay.
-
-
Figure 1 is a perspective view of a test meter ; -
Figure 2 is a plan view of a test strip suitable for use in the test meter as shown inFigure 1 ; -
Figure 3 is a chart showing a test voltage applied by the test meter to the test strip for a test time interval T1 ; -
Figure.4 is a chart showing a test current generated by the test strip for test time interval T1; -
Figure 5 is a simplified chart showing a plurality of time intervals for sampling the test current for a glucose test; -
Figure 6 is an expanded simplified view of a final current value time interval for first working electrode T2a and a final current value time interval for second working electrode T2b , where each final current value time interval includes five consecutive current reading time intervals T3 ; -
Figure 7 is an expanded simplified view of a current reading time interval T3 which includes eight consecutive current sample time intervals T4 ; -
Figure 8 is an expanded view of a current sample time interval T4 which includes 16 consecutive A/D conversion time intervals T5 ; and -
Figure 9 is a chart showing a non-parametric method of filtering 16 A/D conversions which were acquired during current sample time interval T4 according to an exemplary embodiment. - What is provided is a method as defined in
claim 1. - Generally a method for reducing the noise in a data acquisition process is disclosed. The method includes sampling an analog signal a plurality of times during a given time period. The plurality of analog to digital (A/D) conversions are ranked based on their magnitude and instead of averaging all of the plurality of A/D conversions, specific samples are selected and discarded. An average of the remaining A/D conversions is then computed. In particular, the present invention comprises steps to discard at least a highest magnitude A/D conversion and at least a lowest magnitude A/D conversion. Alternatively, a number of highest conversions and a number of lowest conversions may be discarded. This filtering process has the effect of making the computed average more robust to extreme outliers that may be caused by environmental noise, such as, but not limited to electrostatic discharge. Accordingly, the resultant computed average is more accurate than a simple averaging methodology.
-
Figure 1 is a perspective view of anexemplary test meter 200.Test meter 200 includes ahousing 201, adisplay 202, anOK button 204, adown button 206, aback button 208, anup button 210, a light emitting diode (LED) 212, and a strip port connector (SPC) 214.Display 202 may be a liquid crystal display (LCD) to show both textual and graphical information to a user. A user interface (UI) may be software driven menu that is shown ondisplay 202 that enables the user to operatetest meter 200. A user can navigate through the UI using upbutton 210, downbutton 206,OK button 204, andback button 208.Test meter 200 is an example of one configuration of a test meter; there may be many others.Housing 201 may be formed from any of a variety of materials, including but not limited to polymeric materials, metals and metal alloys, etc.Display 202 may be any variety of display devices, including, but not limited to LCD displays, LED displays, OLED displays, and other types of displays which may be heretofore developed. Further,display 202 may be a series of lights and/or simple readouts as opposed to a single integrated display screen.LED 212 may be any other variety of indicators, including, but not limited to LED's, other types of light devices, sound devices, vibration devices, etc.Strip port connector 214 is used to accept and to electrically connect a test strip to testmeter 200 however other configurations of interfacing devices may also be used.Buttons buttons display 202 or a speech recognition device built intotest meter 200.Display 202 may also include a touch sensitive screen which overlaysdisplay 202 and allows a user to provide input to testmeter 200 via the touch screen. The touch sensitive screen may be used with a user's finger, a separate stylus or other touching device. - A
test strip 100 suitable for use intest meter 200 is shown inFigure 2 .Test strip 100 includes a conductive layer comprising electrically isolated portions that are conventionally printed onto asubstrate 5. The conductive layer includes afirst contact 13, asecond contact 15, areference contact 11, and astrip detection bar 17 which may be used to electrically connect to stripport connector 214. The conductive layer further includes a first workingelectrode 12, a second workingelectrode 14, and areference electrode 10 which are electrically connected, respectively, tofirst contact 13,second contact 15, andreference contact 11. Contacts to the electrodes connect within the meter to apply a voltage across electrodes selectively under control of the meter.Test strip 100 further includes, but is not limited to, a clearhydrophilic film 36 which is bound by an adhesive 60 that forms a sample receiving chamber that allows blood to be dosed at aninlet 90.Film 36 may cover the entire end of the test strip thereby forming the visible sample chamber between the adhesion zones shown as 60 inFigure 2 . Anopaque film 38 is also bound by adhesive 60 to show contrast for guiding user to dose blood atinlet 90.Substrate 5 may be formed of a variety of materials including, but not limited to polymeric materials or other insulating materials. Thematerial substrate 5 may be formed from a polyester material (such as, but not limited to Meline ST328), which is manufactured by DuPont Teijin Films.Substrate 5 may be supplied in a roll of material, which may be, for example, nominally 350 microns thick by 370 millimeters wide and approximately 660 meters in length. Conductive layers, such aslayers substrate 5 via any of a number of manufacturing processes.Opaque film 38 is used for the convenience of a user to provide contrast but may be substituted by any of a number of methods, such as printed textual indicators, to guide the user to dose blood atinlet 90. An example oftest strip 100 is OneTouch Ultra which is available from LifeScan, Inc. (Milpitas, California, USA). - A reagent layer (not shown) may be disposed on first working
electrode 12, second workingelectrode 14, andreference electrode 10 within the sample chamber or cavity. Reagent layer may include chemicals such as a redox enzyme and mediator which selectively reacts with glucose. Examples of reagent formulations or inks suitable for use in making reagent layer 22 can be found inU.S. Patent No.'s 5,708,247 and6,046,051 ; Published International ApplicationsWO01/67099 WO01/73124 electrodes - Once
test strip 100 is electrically connected to testmeter 200 throughstrip port connector 214, a user may apply a physiological fluid toinlet 90. Alternatively,test meter 200 may have different types of connectors as opposed to stripport connector 214. Physiological fluid may be applied totest strip 100 in a variety of ways. The fluid sample may be taken from a droplet of blood on the skin surface, or from a receptacle. A physiological fluid sample may also be taken directly from the body by using a needle or microneedle. The physiological fluid causes the reagent layer to dissolve and enzymatically generate a proportional amount of reduced mediator which correlates to a glucose concentration.Test meter 200 may apply a test voltage of about +0.4 Volts, for example, between first workingelectrode 12 andreference electrode 10. The test meter can also apply a test voltage of about +0.4 Volts between second workingelectrode 14 andreference electrode 10. This will enable the reduced mediator to be proportionally measured as a test current, which in this case is an oxidation current measured at first workingelectrode 12 and at second workingelectrode 14. The test voltage that is applied may be any of a variety of test voltages. The test voltages are not limited to the 0.4 Volts described above. Further, it may not be necessary to apply test voltages between both a first electrode and the reference electrode and a second electrode and the reference electrode. It may be desirable only to have a system which measures voltages between the first electrode and the reference electrode, thereby simplifying the system. -
Figure 3 is an exemplary chart showing a test voltage applied bytest meter 200 totest strip 100 for a test time interval T1 . Before the physiological fluid is applied,test meter 200 would be in a fluid detection mode in which the test voltage is +0.4V. The fluid detection mode is indicated inFigure 3 as a fluid detection time interval TFD and as indicated is a time period before or less than a zero (0) reference time. In the fluid detection mode,test meter 200 determines when a fluid is applied toinlet 90 such that both first workingelectrode 12 andreference electrode 10 are wetted with a fluid. Note that first workingelectrode 12 andreference electrode 10 are effectively short-circuited when the physiological fluid contiguously covers first workingelectrode 12 andreference electrode 10. Oncetest meter 200 recognizes that the physiological fluid has been applied because of a sufficient increase in the measured test current betweenelectrodes test meter 200 assigns a zero second marker and starts the test time interval T1. Other methods of determining the presence of a physiological fluid on the test strip may be used. For example, other methods of detecting the presence of a fluid on the test strip may be used. Further, it may be possible to manually indicate to the test meter when to start the test time interval. Accordingly, although the described methodology for detecting an applied fluid and for determining when to start the test time interval, may be effective, other methods either known or later developed may be used. - For instance , test time interval T1 may be about 5.4 seconds. During the first time interval, the sample current is measured and the data collected to determine the glucose concentration in the sample. Upon the completion of the test time interval T1 , the test voltage is removed. While an effective test time has been shown to be 5.4 seconds, any of a variety of test times may be used.
-
Test strip 100 will carry a test current when the test voltage is sufficiently positive with respect to a redox potential of the mediator. Note that a redox potential describes a mediator's intrinsic affinity to accept or donate electrons when sufficiently close to an electrode having a nominal potential.Figure 4 is an exemplary chart showing the test current detected flowing through the sample ontest strip 100 for test time interval T1 . The meter coupled totest strip 100 is configured to measure the current in the circuit formed by the two electrodes and the sample in the sample area. In general, the test current rapidly increases whentest strip 100 is initially wetted with the physiological fluid causing a peak to be formed which is followed by a gradual decrease in the test current. WhileFigure 4 represents a typical test, other response curves may be observed, especially but not only, in the testing for other analytes besides glucose as well as the presence of other noise disturbances. - It should be noted that the test current in
Figure 4 is an analog signal that may be converted to a digital signal for processing the test current into a glucose concentration.Test meter 200 may include a Texas Instrument mixed signal processor (e.g. TI MSP 430) having a twelve bit A/D converter for converting the analog test current into a digital test current. Other A/D converting circuits may similarly be used, including those with more or less bits providing differing accuracy and resolution, and those made or provided by different manufacturers. The test current must be measured with a sufficiently high signal to noise (S/N) ratio such that a variation of the acquired digital signal may be less than about 5% CV (coefficient of variation, % CV = {one standard deviation / average} x 100), preferably less than about 3% CV, more preferably less than about 1% CV, and even more preferably less than about 0.1 % CV. Other S/N ratios may be used, not limited to those explicitly provided. Further, although characterized by % CV, other characterizations of S/N ratio may also be used. A method will be described that reduces the noise in sampling the test current using an A/D converter. -
Figure 5 is an exemplary simplified chart showing a plurality of time intervals for sampling the test current for a glucose test. Test time interval T1 may include an aggregate of shorter time intervals which are a current reading time interval T3 , an electrostatic discharge (ESD) check time interval TESD , a final current value time interval for first working electrode T2a , and a final current value time interval for second working electrode T2b . Alternatively, other combinations of time intervals may be used having differing relative lengths. Further, some time intervals may be omitted. InFigure 5 , the A/D may toggle relatively quickly between the On and Off state during a given time interval, typically on the order of milliseconds or, on the order of microseconds. However, inFigure 5 the shorter time intervals are shown as being continuously On because the time scale of the chart cannot clearly show a relatively high toggle rate. Note thatFigures 6 to 8 show expanded portions of T2a , T2b , and T3 to illustrate more accurately if a particular time interval has a higher switching frequency of the A/D conversions between the On and Off state. It should be noted that the sampling frequencies are not limited to those depicted, rather any frequencies may be used that yield desired performance. -
Figure 6 is an expanded simplified view of final current value time interval for first working electrode T2a and final current value time interval for second working electrode T2b. For instance, final current value time interval for first working electrode T2a starts at about 5 seconds and has a duration of about 80 milliseconds. Similarly, final current value time interval for second working electrode T2b starts at about 5.3 seconds and has a duration of about 80 milliseconds. There may be a measurement delay time interval TMD of about 300 milliseconds between final current value time interval for first working electrode T2a and final current value time interval for second working electrode T2b . Any time periods provided above, rather any time periods may be used that yield desired performance. - Final current value time interval for first working electrode T2a may include, for example, five consecutive current reading time intervals T3 . Similarly, final current value time interval for the second working electrode T2b may include, for example, five current reading time intervals T3 . Current reading time interval T3 may be, for example, about 18 milliseconds as shown in
Figure 6 and7 . The invention is not limited to the numbers of current reading time intervals disclosed nor to the reading time interval disclosed. -
Figure 7 is an expanded simplified view of a current reading time interval T3 which includes eight consecutive current sample time intervals T4 . There is a LOW period reading time interval T3L that represents a period of time in which the A/D is Off after acquiring the A/D conversions, for example, for eight current sample time intervals T4 . During LOW period reading time interval T3L , the microprocessor has a free time period to perform data calculations such as, for example, a summation or average of the A/D conversions acquired during current reading time interval T3 . At the end of LOW period reading time interval T3L , the microprocessor may initiate another current reading time interval T3 . Again, the invention is not limited to the time intervals shown and disclosed nor to the number of A/D conversions shown and disclosed. - Current sample time interval T4 may be, for example, about 2 milliseconds as shown in
Figures 7 and8 . Current sample time interval T4 includes a HIGH period sample time interval T4H and a LOW period sample time interval T4L . HIGH period sample time interval T4H may be a period of time in which the A/D is On for acquiring A/D conversions. LOW period sample time interval T4L may be a period of time in which the A/D is Off after acquiring the required A/D conversions during HIGH period sample time interval T4H . HIGH period sample time interval T4H may be, for example, about 0.4 milliseconds and LOW period sample time interval T4L maybe, for example, about 1.6 milliseconds as shown inFigures 7 and8 . During LOW period sample time interval T4L , the microprocessor has a free time period to perform data calculations on the acquired A/D conversions acquired during HIGH period sample time interval T4H such as, for example, ranking, filtering, summations, averaging and/or combinations thereof of the A/D conversions or other needed calculations and data manipulations. At the end of LOW period sample time interval T4L , the microprocessor may initiate another current sample time interval T4 . The sample time interval magnitudes shown and described are not limited. Any time intervals maybe used which would provide desired performance. -
Figure 8 is an expanded view of an exemplary current sample time interval T4 which includes 16 consecutive A/D conversion time intervals T5 . The test current may be sampled at a pre-determined sampling rate during HIGH period sample time interval T4H . The pre-determined sampling rate may be, for example, about 40 Kilohertz as shown inFigure 8 . A single A/D conversion may be acquired during A/D conversion time interval T5 which in this case may be about, for example, 25 microseconds as shown inFigure 8 . An A/D conversion would be a digital number having a magnitude which is proportional to the test current at the point in time in which the A/D conversion was taken. A/D conversions may also be referred to as a glucose signal because the magnitude of the A/D conversion in this case is proportional to the glucose concentration. Thus, 16 A/D conversions may be acquired during current sample time interval T4 and stored in a memory portion oftest meter 200. A current sample may then be calculated using either an average or summation of the 16 A/D conversions acquired during current sample time interval T4 . In order to reduce noise, a current sample may be calculated using either an average or summation of a subset of the 16 A/D conversions acquired during current sample time interval T4. In accordance with the invention, a method will be described that shows how to select a subset of the 16 A/D conversions for reducing the noise when measuring a "current reading." may be desirable to use more or less than 16 A/D conversions to meet desired performance goals and statistically significant objectives. - In general, an exemplary method for reducing noise is to average a plurality of A/D conversions. However, averaging will effectively reduce noise when it follows a Gaussian distribution. For situations in which the noise does not follow a Gaussian distribution, non-parametric methods may be used to help reduce noise. An example of noise which does not follow a Gaussian distribution may be an electrostatic discharge event, signals from light switches, and mobile phones. In an exemplary embodiment, sixteen A/D conversions collected during a current sample time interval T4 may be ranked based on their magnitude as shown in
Figure 9 . Instead of simply averaging all sixteen A/D conversions, at least a highest magnitude A/D conversion and a lowest magnitude A/D conversion may be filtered leaving a plurality of accepted A/D conversions. Only the accepted A/D conversions would be averaged or summed together. Because the highest and lowest A/D conversions are discarded, this makes the average more robust to extreme outliers which may be caused by short term events such as electrostatic discharge. In general, extreme outliers tend to significantly perturb averages making Gaussian statistics ineffectual. Although 16 samples provide good performance in the system described, the invention is not limited to 16 samples. Depending on the desired performance and the application of the filter other numbers of samples may be found to be more or less effective. - In another exemplary embodiment, a four highest A/D conversions and a four lowest A/D conversions may be filtered leaving eight accepted A/D conversions as shown in
Figure 9. Figure 9 depicts high and lowfiltered zones 120 and an acceptedzone 122. Filteredzone 122 shows the eight remaining samples that will be used for averaging whilezones 120 show the eight samples which will be discarded. The microprocessor oftest meter 200 may calculate a current sample by averaging or summing together the 8 accepted A/D conversions acquired during current sample time interval T4 . Next, a current reading may be calculated by averaging or summing together 8 current samples (of time T4, which in this case is a total of 64 A/D conversions) all acquired within current reading time interval T3 . After calculating the current reading, a final current value may be calculated by averaging or summing together 5 current readings (which in this case is a total of 320 A/D conversions) all acquired within final current value time interval for first working electrode T2a or final current value time interval for second working electrode T2b . Methods will be described for using current readings and final current values for determining whether a test strip has been dosed with a physiological fluid, calculating a glucose concentration, performing error trapping procedures, and preventing a glucose test from initiating when ESD is injected into the test meter. Further, different numbers of A/D conversions, samples, and reading may be used. - A final current value for first working electrode and a final current value for second working electrode may be summed together to give a grand summation. A glucose algorithm may include the steps of subtracting a background value (which is representative of general background noise and therefore represents a bias) from the grand summation followed by a division of a calibration slope (which calibrates the device to known glucose concentration / current curves or data) to generate a glucose concentration which can be outputted onto
display 202. By using a method of an exemplary embodiment of filtering the four highest and four lowest A/D conversion in the calculation of a current sample, a glucose concentration can be calculated that is sufficiently accurate and precise. Although this is one method of determining the glucose concentration, other methods may be applied to provide the final calculation, including look-up tables and other mathematical formulations. Similarly other processes may be used for different types of analytes. - The test current measured for a
test strip 100 may have a characteristic shape as shown inFigure 2 that is usually present when testing with a physiological fluid. If the characteristic shape is not present, then this is usually indicative of a system defect or a user error. More particularly,Figure 2 shows an example of a test current that forms a maximum peak value followed by a gradual decay. An error trapping method may include verifying that the test current does not increase after the maximum peak time Tp. The error trapping method may include determining a maximum peak value time and measuring a current reading at one second intervals as shown inFigure 5 after applying fluid totest strip 100. The error trapping method may determine that there is no defect if a current reading minus an immediately previous current reading is less than an error threshold such as for example, about 100 nanoampres. This error trapping method may be performed on all current readings measured at one second intervals so long as the immediately previous current reading was measured after the maximum peak value time. As an example, if ICRk-ICRk-1 ≤ 100 nanoampres, then there is no error due to a non-characteristic increase in current with time where ICRk is the current reading at k seconds and ICRk-1 is the current reading at k-1 seconds. However, if ICRk - ICRk-1 > 100 nanoampres, then testmeter 200 should output an error message ondisplay 202 and not output a glucose concentration. Likewise, other data integrity or error trapping methods may be applied. - A simplified error trapping method may be used. In this simplified embodiment, only two current readings are used at four seconds and at five seconds. The current reading at four seconds may be subtracted from the current reading at five seconds. If ICR5-ICR4 ≤ 100 nanoampres, then there is no error due to the non-characteristic increase in current with time, where ICR5 is the current reading at 5 seconds and ICR4 is the current reading at 4 seconds. However, if ICR5 - ICR4 > 100 nanoampres, then test
meter 200 should output an error message ondisplay 202 and not output a glucose concentration. In this simplified exemplary embodiment, current readings are not used at one, two, and three seconds so as to simplify the error trapping algorithm. Additionally, maximum peak time Tp is also not calculated in this embodiment. - The invention is particularly useful for distinguishing current signals caused by extraneous events from a current signal that provides desired information such as one indicative of a measurement error. Extraneous signals can come from a variety of sources, events, or conditions and typically occur during the normal use of a test meter such as the
test meter 200. Exemplary extraneous events include electrostatic discharge and electromagnetic emission such as radio-frequency or microwave frequency emission, for example. Use of an electronic device such as a phone, microwave oven, radio, or other household appliance can potentially cause an extraneous signal. Also, common events such as switching of light switches, switching of thermostats, and other activities were an electronic relay or the like turns on an off can cause extraneous signals. - A particular extraneous signal can be characterized in some way and used to distinguish the extraneous signal from a desired signal. Characterization in this way preferably relates to the magnitude, duration, and timing (independently or in combination) of an extraneous signal. Generally, a characteristic behavior of an extraneous signal or event can be used to identify the signal as extraneous. This behavior may be a specific value or may relate to a trend or changing condition over time, for example.
- One type of extraneous signal is related to electrostatic discharge. Under certain conditions, such as where low relative humidity exists, a user can carry a significant amount of electrostatic charge. Thus, such a user may potentially inject electrostatic energy into the test meter, when touching a test strip connected to a test meter. This unexpected energy can cause the meter to measure a sufficiently large current that can cause the meter to initiate and perform a glucose test on a dry test strip. Because there is no glucose in the test strip, the meter should output an error message because the measured test current will be too low. Typically, a user will be instructed to discard the test strip when the meter generates an error message. This is highly undesirable where ESD falsely triggers a glucose test because the dry test strip is actually not defective and thus would be thrown away unnecessarily.
- In another exemplary embodiment, a method for preventing ESD from triggering a glucose test will be described. This material is also described in Post-published
US 2007/0084734 . In use,test meter 200 preferably starts a fluid detection mode oncetest strip 100 is inserted intostrip port connector 214. During the fluid detection mode,test meter 200 preferably applies a test potential of between at least the first workingelectrode 12 and thereference electrode 10. The test voltage used generally depends of the particular test meter and test strip used and a suitable test voltage for the illustratedmeter 200 is about 400 millivolts. The fluid detection mode time interval TFD includes the time before physiological fluid is applied toinlet 90 and is represented as the time interval that is less than zero as illustrated inFigure 5 . During fluid detection mode time interval TFD,test meter 200 will preferably continuously measure a current reading at a predetermined frequency until a single current reading is found to exceed a threshold value. As an example a measurement frequency ranging from about once every 20 milliseconds to about once every 100 milliseconds can be used. A threshold value that can be used for testing blood is about 150 nanoampres. Whentest strip 100 is initially dry,test meter 200 will measure a zero test current value or a small test current value which is below the threshold. Once fluid is applied, the test meter will measure an increase in a current reading due to a decrease in resistance between the first workingelectrode 12 andreference electrode 10. This current increase will cause the meter to start test time interval T1 as shown inFigure 5 . - As a precautionary measure,
test meter 200 preferably enters an ESD check mode oncetest meter 200 measures at least one current reading greater than the threshold as shown inFig. 5 . In the ESD check mode,test meter 200 preferably continues to apply a potential for an ESD check time interval TESD. During the ESD check mode,test meter 200 preferably continuously measures a current reading on a predetermined schedule. For example, a measurement once every 20 milliseconds can be used. If any of the current readings measured during ESD check time interval TESD are less than the threshold, then testmeter 200 preferably returns back to the fluid detection mode. If all of the current readings measured during ESD check time interval TESD are greater than the threshold, then testmeter 200 will continue the glucose test. - For the case in which a physiological fluid such as blood is applied to
test strip 100, a test current will be seen to increase for about 1 second as shown inFigure 4 . Therefore,test meter 200 will measure an increase in a current reading of greater than about 150 nanoampres due to a decrease in resistance between the first working 12 electrode andreference electrode 10. This will preferably cause the meter to go from the fluid detection mode to the ESD check mode. Typically, the test current will stay greater than 150 nanoampres for the ESD check time interval TESD allowing the glucose test to proceed through the test time interval T1. - For the case in which a sufficiently large ESD is injected into
test meter 200, a current reading may be measured that is greater than the threshold causing the meter to go from the fluid detection mode to the ESD check mode. Typically, a test current generated by ESD dissipates quickly producing a transient spike that typically decays within about a 100 millisecond range. This contrasts with the increase in the test current caused by a test fluid such as blood where the test current continues to increase beyond a threshold of 150 nanoampres for a known time for the particular fluid (about 1 second for blood). Thus, when ESD is injected intotest meter 200, at least one of the current readings measured during ESD check time interval TESD should be less than the threshold. When the ESD check time interval TESD expires, the flag is checked and if set, operation reverts back to looking for sample again. If the flag is not set, fluid measurement preferably continues as described below. - Preferably, where a fluid such as blood is being measured, ESD check time interval TESD ranges from about 100 milliseconds to about 1 second, and preferably be about 200 milliseconds. The low end of ESD check time interval TESD is based on a typical dissipation time of ESD, which is about 100 milliseconds but may be based on a typical characteristic such as a dissipation time for any desired extraneous event. The high end of ESD check time interval TESD is preferably based on the amount of available time before
test meter 200 needs to notify a user that the test is in progress. For example, when a test meter performs a glucose test, a countdown of test time interval T1 is typically outputted onto a display of thetest meter 200 in integer values. After one second has elapsed on the display, the user will believe that the glucose test is in progress. Therefore, when a sufficiently large amount of ESD is injected intotest meter 200, it needs to determine that it must go back to the fluid detect mode before the user has any indication that the test is in progress such as when the display shows that one second of the glucose test has elapsed. - A meter, such as the
meter 200, can be programmed so that after a first trigger reading (a measurement above a predetermined threshold) the meter continues to monitor the current for some predetermined period of time. The threshold may be a current level indicative of the presence of a sample for example. If during the monitoring period the current falls below the trigger threshold, the meter will set a flag. When the monitoring time expires, the flag will be checked and if set, operation will revert back to looking for sample again. If the current remains above the threshold for the whole of this period then the test sample current readings can be processed as normal. Monitoring the current for the whole of the ESD check period instead of reverting back once ESD is first detected can ensure that any ringing of the ESD pulse has time to decay before the meter attempts another reading. - It should be noted that the time intervals and current magnitudes disclosed relating to the ESD check are not limited to those disclosed. Other values may be used without departing from the scope of the invention.
Claims (12)
- A method to determine analyte concentration in a fluid sample in contact with electrodes (10, 12, 14) of a test strip (100), the method comprising:wetting the test strip (100) with a fluid sample;applying a voltage to the electrodes (10, 12, 14) of the test strip (100);sampling the magnitude of current generated in the fluid sample to provide a plurality of analog-to-digital (A/D) conversions;characterised in that a first subset of the plurality of A/D conversions is sampled from a first pair of electrodes (12, 10) of the test strip (100) and a second subset of the plurality of A/D conversions is sampled from a second pair of electrodes (14, 10) of the test strip (100); and bydiscarding at least a highest magnitude A/D conversion and a lowest magnitude A/D conversion of the first subset and at least a highest magnitude A/D conversion and a lowest magnitude A/D conversion of the second subset; andgenerating an analyte concentration based on the calculation of an average or a summation of remaining A/D conversions.
- The method of claim 1, further comprising:determining a maximum current peak time;determining a change in current after the maximum current peak time during a time interval; andselectively indicating an error based on the change in current.
- The method of claim 1, wherein the step of generating an analyte concentration based on the remaining A/D conversions comprises converting said average or said summation into an analyte concentration.
- The method of claim 1, further comprising:repeating the steps of sampling, discarding and generating more than once to calculate a total more than one samples; andsumming together said more than one current samples to form a current reading.
- The method of claim 4, further comprising:forming at least two current readings;summing together said at least two current readings to form a final current value; andcalculating a glucose concentration based on said final current value.
- The method of claim 1, wherein the step of sampling comprises sampling 16 A/D conversions during a current time sampling interval.
- The method of claim 6, wherein the step of discarding comprises filtering out four highest A/D conversions and four lowest A/D conversions so as to provide eight A/D conversions for determination of analyte concentration.
- The method of claim 1, further comprising the steps of
receiving, by a test meter (200), the fluid sample. - The method of claim 6, wherein the step of discarding comprises filtering out at least a highest magnitude A/D conversion and a lowest magnitude A/D conversion leaving a plurality of accepted A/D conversions.
- The method of claim 8, wherein the analyte concentration is glucose.
- The method of claim 7, further comprising summing the eight A/D conversions together.
- The method of claim 7, further comprising averaging the eight A/D conversions.
Applications Claiming Priority (2)
| Application Number | Priority Date | Filing Date | Title |
|---|---|---|---|
| US11/252,216 US7468125B2 (en) | 2005-10-17 | 2005-10-17 | System and method of processing a current sample for calculating a glucose concentration |
| EP06255300.3A EP1775587B1 (en) | 2005-10-17 | 2006-10-16 | A system and method of processing a current sample for calculating a glucose concentration |
Related Parent Applications (1)
| Application Number | Title | Priority Date | Filing Date |
|---|---|---|---|
| EP06255300.3A Division EP1775587B1 (en) | 2005-10-17 | 2006-10-16 | A system and method of processing a current sample for calculating a glucose concentration |
Publications (2)
| Publication Number | Publication Date |
|---|---|
| EP2498083A1 EP2498083A1 (en) | 2012-09-12 |
| EP2498083B1 true EP2498083B1 (en) | 2015-07-01 |
Family
ID=37726975
Family Applications (2)
| Application Number | Title | Priority Date | Filing Date |
|---|---|---|---|
| EP06255300.3A Active EP1775587B1 (en) | 2005-10-17 | 2006-10-16 | A system and method of processing a current sample for calculating a glucose concentration |
| EP12171146.9A Active EP2498083B1 (en) | 2005-10-17 | 2006-10-16 | Method of processing a current measurement for calculating a glucose concentration |
Family Applications Before (1)
| Application Number | Title | Priority Date | Filing Date |
|---|---|---|---|
| EP06255300.3A Active EP1775587B1 (en) | 2005-10-17 | 2006-10-16 | A system and method of processing a current sample for calculating a glucose concentration |
Country Status (5)
| Country | Link |
|---|---|
| US (2) | US7468125B2 (en) |
| EP (2) | EP1775587B1 (en) |
| JP (2) | JP4914170B2 (en) |
| CN (2) | CN102520029B (en) |
| ES (2) | ES2438220T3 (en) |
Families Citing this family (172)
| Publication number | Priority date | Publication date | Assignee | Title |
|---|---|---|---|---|
| US6391005B1 (en) | 1998-03-30 | 2002-05-21 | Agilent Technologies, Inc. | Apparatus and method for penetration with shaft having a sensor for sensing penetration depth |
| US8641644B2 (en) | 2000-11-21 | 2014-02-04 | Sanofi-Aventis Deutschland Gmbh | Blood testing apparatus having a rotatable cartridge with multiple lancing elements and testing means |
| US9795747B2 (en) | 2010-06-02 | 2017-10-24 | Sanofi-Aventis Deutschland Gmbh | Methods and apparatus for lancet actuation |
| US8337419B2 (en) | 2002-04-19 | 2012-12-25 | Sanofi-Aventis Deutschland Gmbh | Tissue penetration device |
| US9226699B2 (en) | 2002-04-19 | 2016-01-05 | Sanofi-Aventis Deutschland Gmbh | Body fluid sampling module with a continuous compression tissue interface surface |
| JP4209767B2 (en) | 2001-06-12 | 2009-01-14 | ペリカン テクノロジーズ インコーポレイテッド | Self-optimized cutting instrument with adaptive means for temporary changes in skin properties |
| US7981056B2 (en) | 2002-04-19 | 2011-07-19 | Pelikan Technologies, Inc. | Methods and apparatus for lancet actuation |
| ATE485766T1 (en) | 2001-06-12 | 2010-11-15 | Pelikan Technologies Inc | ELECTRICAL ACTUATING ELEMENT FOR A LANCET |
| US7025774B2 (en) | 2001-06-12 | 2006-04-11 | Pelikan Technologies, Inc. | Tissue penetration device |
| AU2002348683A1 (en) | 2001-06-12 | 2002-12-23 | Pelikan Technologies, Inc. | Method and apparatus for lancet launching device integrated onto a blood-sampling cartridge |
| US9427532B2 (en) | 2001-06-12 | 2016-08-30 | Sanofi-Aventis Deutschland Gmbh | Tissue penetration device |
| US7909778B2 (en) | 2002-04-19 | 2011-03-22 | Pelikan Technologies, Inc. | Method and apparatus for penetrating tissue |
| US8784335B2 (en) | 2002-04-19 | 2014-07-22 | Sanofi-Aventis Deutschland Gmbh | Body fluid sampling device with a capacitive sensor |
| US7297122B2 (en) | 2002-04-19 | 2007-11-20 | Pelikan Technologies, Inc. | Method and apparatus for penetrating tissue |
| US7674232B2 (en) | 2002-04-19 | 2010-03-09 | Pelikan Technologies, Inc. | Method and apparatus for penetrating tissue |
| US7547287B2 (en) | 2002-04-19 | 2009-06-16 | Pelikan Technologies, Inc. | Method and apparatus for penetrating tissue |
| US8221334B2 (en) | 2002-04-19 | 2012-07-17 | Sanofi-Aventis Deutschland Gmbh | Method and apparatus for penetrating tissue |
| US7901362B2 (en) | 2002-04-19 | 2011-03-08 | Pelikan Technologies, Inc. | Method and apparatus for penetrating tissue |
| US7976476B2 (en) | 2002-04-19 | 2011-07-12 | Pelikan Technologies, Inc. | Device and method for variable speed lancet |
| US7331931B2 (en) | 2002-04-19 | 2008-02-19 | Pelikan Technologies, Inc. | Method and apparatus for penetrating tissue |
| US9248267B2 (en) | 2002-04-19 | 2016-02-02 | Sanofi-Aventis Deustchland Gmbh | Tissue penetration device |
| US8360992B2 (en) | 2002-04-19 | 2013-01-29 | Sanofi-Aventis Deutschland Gmbh | Method and apparatus for penetrating tissue |
| US7491178B2 (en) | 2002-04-19 | 2009-02-17 | Pelikan Technologies, Inc. | Method and apparatus for penetrating tissue |
| US7229458B2 (en) | 2002-04-19 | 2007-06-12 | Pelikan Technologies, Inc. | Method and apparatus for penetrating tissue |
| US8267870B2 (en) | 2002-04-19 | 2012-09-18 | Sanofi-Aventis Deutschland Gmbh | Method and apparatus for body fluid sampling with hybrid actuation |
| US8702624B2 (en) | 2006-09-29 | 2014-04-22 | Sanofi-Aventis Deutschland Gmbh | Analyte measurement device with a single shot actuator |
| US8372016B2 (en) | 2002-04-19 | 2013-02-12 | Sanofi-Aventis Deutschland Gmbh | Method and apparatus for body fluid sampling and analyte sensing |
| US9314194B2 (en) | 2002-04-19 | 2016-04-19 | Sanofi-Aventis Deutschland Gmbh | Tissue penetration device |
| US7232451B2 (en) | 2002-04-19 | 2007-06-19 | Pelikan Technologies, Inc. | Method and apparatus for penetrating tissue |
| US8579831B2 (en) | 2002-04-19 | 2013-11-12 | Sanofi-Aventis Deutschland Gmbh | Method and apparatus for penetrating tissue |
| US7175642B2 (en) | 2002-04-19 | 2007-02-13 | Pelikan Technologies, Inc. | Methods and apparatus for lancet actuation |
| US7892183B2 (en) | 2002-04-19 | 2011-02-22 | Pelikan Technologies, Inc. | Method and apparatus for body fluid sampling and analyte sensing |
| US9795334B2 (en) | 2002-04-19 | 2017-10-24 | Sanofi-Aventis Deutschland Gmbh | Method and apparatus for penetrating tissue |
| US7713214B2 (en) | 2002-04-19 | 2010-05-11 | Pelikan Technologies, Inc. | Method and apparatus for a multi-use body fluid sampling device with optical analyte sensing |
| US8574895B2 (en) | 2002-12-30 | 2013-11-05 | Sanofi-Aventis Deutschland Gmbh | Method and apparatus using optical techniques to measure analyte levels |
| EP2238892A3 (en) | 2003-05-30 | 2011-02-09 | Pelikan Technologies Inc. | Apparatus for body fluid sampling |
| ES2490740T3 (en) | 2003-06-06 | 2014-09-04 | Sanofi-Aventis Deutschland Gmbh | Apparatus for blood fluid sampling and analyte detection |
| US8460243B2 (en) | 2003-06-10 | 2013-06-11 | Abbott Diabetes Care Inc. | Glucose measuring module and insulin pump combination |
| WO2006001797A1 (en) | 2004-06-14 | 2006-01-05 | Pelikan Technologies, Inc. | Low pain penetrating |
| US7722536B2 (en) | 2003-07-15 | 2010-05-25 | Abbott Diabetes Care Inc. | Glucose measuring device integrated into a holster for a personal area network device |
| US20190357827A1 (en) | 2003-08-01 | 2019-11-28 | Dexcom, Inc. | Analyte sensor |
| EP1671096A4 (en) | 2003-09-29 | 2009-09-16 | Pelikan Technologies Inc | METHOD AND APPARATUS FOR AN IMPROVED SAMPLING INTERFERENCE DEVICE |
| WO2005037095A1 (en) | 2003-10-14 | 2005-04-28 | Pelikan Technologies, Inc. | Method and apparatus for a variable user interface |
| US8668656B2 (en) | 2003-12-31 | 2014-03-11 | Sanofi-Aventis Deutschland Gmbh | Method and apparatus for improving fluidic flow and sample capture |
| US7822454B1 (en) | 2005-01-03 | 2010-10-26 | Pelikan Technologies, Inc. | Fluid sampling device with improved analyte detecting member configuration |
| US8828203B2 (en) | 2004-05-20 | 2014-09-09 | Sanofi-Aventis Deutschland Gmbh | Printable hydrogels for biosensors |
| US9775553B2 (en) | 2004-06-03 | 2017-10-03 | Sanofi-Aventis Deutschland Gmbh | Method and apparatus for a fluid sampling device |
| US9820684B2 (en) | 2004-06-03 | 2017-11-21 | Sanofi-Aventis Deutschland Gmbh | Method and apparatus for a fluid sampling device |
| CA2572455C (en) | 2004-06-04 | 2014-10-28 | Therasense, Inc. | Diabetes care host-client architecture and data management system |
| US9788771B2 (en) | 2006-10-23 | 2017-10-17 | Abbott Diabetes Care Inc. | Variable speed sensor insertion devices and methods of use |
| US7697967B2 (en) | 2005-12-28 | 2010-04-13 | Abbott Diabetes Care Inc. | Method and apparatus for providing analyte sensor insertion |
| US8652831B2 (en) | 2004-12-30 | 2014-02-18 | Sanofi-Aventis Deutschland Gmbh | Method and apparatus for analyte measurement test time |
| US7468125B2 (en) * | 2005-10-17 | 2008-12-23 | Lifescan, Inc. | System and method of processing a current sample for calculating a glucose concentration |
| US8066866B2 (en) * | 2005-10-17 | 2011-11-29 | Lifescan, Inc. | Methods for measuring physiological fluids |
| US11298058B2 (en) | 2005-12-28 | 2022-04-12 | Abbott Diabetes Care Inc. | Method and apparatus for providing analyte sensor insertion |
| US7885698B2 (en) | 2006-02-28 | 2011-02-08 | Abbott Diabetes Care Inc. | Method and system for providing continuous calibration of implantable analyte sensors |
| US9675290B2 (en) | 2012-10-30 | 2017-06-13 | Abbott Diabetes Care Inc. | Sensitivity calibration of in vivo sensors used to measure analyte concentration |
| US8346335B2 (en) | 2008-03-28 | 2013-01-01 | Abbott Diabetes Care Inc. | Analyte sensor calibration management |
| US8473022B2 (en) | 2008-01-31 | 2013-06-25 | Abbott Diabetes Care Inc. | Analyte sensor with time lag compensation |
| US8374668B1 (en) | 2007-10-23 | 2013-02-12 | Abbott Diabetes Care Inc. | Analyte sensor with lag compensation |
| US8219173B2 (en) | 2008-09-30 | 2012-07-10 | Abbott Diabetes Care Inc. | Optimizing analyte sensor calibration |
| US7630748B2 (en) | 2006-10-25 | 2009-12-08 | Abbott Diabetes Care Inc. | Method and system for providing analyte monitoring |
| US7618369B2 (en) | 2006-10-02 | 2009-11-17 | Abbott Diabetes Care Inc. | Method and system for dynamically updating calibration parameters for an analyte sensor |
| US8140312B2 (en) | 2007-05-14 | 2012-03-20 | Abbott Diabetes Care Inc. | Method and system for determining analyte levels |
| US9339217B2 (en) | 2011-11-25 | 2016-05-17 | Abbott Diabetes Care Inc. | Analyte monitoring system and methods of use |
| US8529751B2 (en) | 2006-03-31 | 2013-09-10 | Lifescan, Inc. | Systems and methods for discriminating control solution from a physiological sample |
| US8224415B2 (en) | 2009-01-29 | 2012-07-17 | Abbott Diabetes Care Inc. | Method and device for providing offset model based calibration for analyte sensor |
| US7653425B2 (en) | 2006-08-09 | 2010-01-26 | Abbott Diabetes Care Inc. | Method and system for providing calibration of an analyte sensor in an analyte monitoring system |
| WO2008040990A2 (en) | 2006-10-05 | 2008-04-10 | Lifescan Scotland Limited | Methods for determining an analyte concentration using signal processing algorithms |
| WO2008040982A1 (en) | 2006-10-05 | 2008-04-10 | Lifescan Scotland Limited | Method for determining hematocrit corrected analyte concentrations |
| EP2082222B1 (en) * | 2006-10-05 | 2012-11-21 | Lifescan Scotland Limited | Systems and methods for determining a substantially hematocrit independent analyte concentration |
| US9046480B2 (en) | 2006-10-05 | 2015-06-02 | Lifescan Scotland Limited | Method for determining hematocrit corrected analyte concentrations |
| CA2683953C (en) | 2007-04-14 | 2016-08-02 | Abbott Diabetes Care Inc. | Method and apparatus for providing data processing and control in medical communication system |
| CA2683959C (en) * | 2007-04-14 | 2017-08-29 | Abbott Diabetes Care Inc. | Method and apparatus for providing data processing and control in medical communication system |
| CA2683962C (en) | 2007-04-14 | 2017-06-06 | Abbott Diabetes Care Inc. | Method and apparatus for providing data processing and control in medical communication system |
| US8239166B2 (en) | 2007-05-14 | 2012-08-07 | Abbott Diabetes Care Inc. | Method and apparatus for providing data processing and control in a medical communication system |
| US9125548B2 (en) | 2007-05-14 | 2015-09-08 | Abbott Diabetes Care Inc. | Method and apparatus for providing data processing and control in a medical communication system |
| US8260558B2 (en) | 2007-05-14 | 2012-09-04 | Abbott Diabetes Care Inc. | Method and apparatus for providing data processing and control in a medical communication system |
| US8103471B2 (en) | 2007-05-14 | 2012-01-24 | Abbott Diabetes Care Inc. | Method and apparatus for providing data processing and control in a medical communication system |
| US8600681B2 (en) | 2007-05-14 | 2013-12-03 | Abbott Diabetes Care Inc. | Method and apparatus for providing data processing and control in a medical communication system |
| US8444560B2 (en) | 2007-05-14 | 2013-05-21 | Abbott Diabetes Care Inc. | Method and apparatus for providing data processing and control in a medical communication system |
| US8560038B2 (en) | 2007-05-14 | 2013-10-15 | Abbott Diabetes Care Inc. | Method and apparatus for providing data processing and control in a medical communication system |
| US8160900B2 (en) | 2007-06-29 | 2012-04-17 | Abbott Diabetes Care Inc. | Analyte monitoring and management device and method to analyze the frequency of user interaction with the device |
| US8834366B2 (en) | 2007-07-31 | 2014-09-16 | Abbott Diabetes Care Inc. | Method and apparatus for providing analyte sensor calibration |
| US8778168B2 (en) | 2007-09-28 | 2014-07-15 | Lifescan, Inc. | Systems and methods of discriminating control solution from a physiological sample |
| US8409093B2 (en) | 2007-10-23 | 2013-04-02 | Abbott Diabetes Care Inc. | Assessing measures of glycemic variability |
| RU2491549C2 (en) | 2007-12-10 | 2013-08-27 | БАЙЕР ХЕЛТКЭА ЭлЭлСи | Amperometry with strobing and fast reading |
| AU2013202702B2 (en) * | 2008-01-17 | 2015-03-12 | Lifescan, Inc. | System and method for measuring an analyte in a sample |
| US8603768B2 (en) | 2008-01-17 | 2013-12-10 | Lifescan, Inc. | System and method for measuring an analyte in a sample |
| USD612279S1 (en) | 2008-01-18 | 2010-03-23 | Lifescan Scotland Limited | User interface in an analyte meter |
| USD612275S1 (en) | 2008-03-21 | 2010-03-23 | Lifescan Scotland, Ltd. | Analyte test meter |
| USD615431S1 (en) | 2008-03-21 | 2010-05-11 | Lifescan Scotland Limited | Analyte test meter |
| USD611853S1 (en) | 2008-03-21 | 2010-03-16 | Lifescan Scotland Limited | Analyte test meter |
| IL197532A0 (en) | 2008-03-21 | 2009-12-24 | Lifescan Scotland Ltd | Analyte testing method and system |
| US9386944B2 (en) | 2008-04-11 | 2016-07-12 | Sanofi-Aventis Deutschland Gmbh | Method and apparatus for analyte detecting device |
| US8591410B2 (en) | 2008-05-30 | 2013-11-26 | Abbott Diabetes Care Inc. | Method and apparatus for providing glycemic control |
| US8924159B2 (en) | 2008-05-30 | 2014-12-30 | Abbott Diabetes Care Inc. | Method and apparatus for providing glycemic control |
| US8551320B2 (en) | 2008-06-09 | 2013-10-08 | Lifescan, Inc. | System and method for measuring an analyte in a sample |
| USD611151S1 (en) | 2008-06-10 | 2010-03-02 | Lifescan Scotland, Ltd. | Test meter |
| USD611489S1 (en) | 2008-07-25 | 2010-03-09 | Lifescan, Inc. | User interface display for a glucose meter |
| USD611372S1 (en) | 2008-09-19 | 2010-03-09 | Lifescan Scotland Limited | Analyte test meter |
| US8986208B2 (en) | 2008-09-30 | 2015-03-24 | Abbott Diabetes Care Inc. | Analyte sensor sensitivity attenuation mitigation |
| US9326707B2 (en) | 2008-11-10 | 2016-05-03 | Abbott Diabetes Care Inc. | Alarm characterization for analyte monitoring devices and systems |
| US9375169B2 (en) | 2009-01-30 | 2016-06-28 | Sanofi-Aventis Deutschland Gmbh | Cam drive for managing disposable penetrating member actions with a single motor and motor and control system |
| US20100198034A1 (en) | 2009-02-03 | 2010-08-05 | Abbott Diabetes Care Inc. | Compact On-Body Physiological Monitoring Devices and Methods Thereof |
| WO2010121084A1 (en) | 2009-04-15 | 2010-10-21 | Abbott Diabetes Care Inc. | Analyte monitoring system having an alert |
| US8597274B2 (en) | 2009-05-22 | 2013-12-03 | Abbott Diabetes Care Inc. | Usability features for integrated insulin delivery system |
| ES2884623T3 (en) | 2009-07-23 | 2021-12-10 | Abbott Diabetes Care Inc | Manufacturing procedure and continuous analyte measurement system |
| ES2912584T3 (en) | 2009-08-31 | 2022-05-26 | Abbott Diabetes Care Inc | A glucose monitoring system and method |
| EP2482720A4 (en) | 2009-09-29 | 2014-04-23 | Abbott Diabetes Care Inc | Method and apparatus for providing notification function in analyte monitoring systems |
| US8185181B2 (en) | 2009-10-30 | 2012-05-22 | Abbott Diabetes Care Inc. | Method and apparatus for detecting false hypoglycemic conditions |
| EP4434458A3 (en) | 2010-03-24 | 2024-12-18 | Abbott Diabetes Care, Inc. | Medical device inserters |
| US8965476B2 (en) | 2010-04-16 | 2015-02-24 | Sanofi-Aventis Deutschland Gmbh | Tissue penetration device |
| US8239582B2 (en) | 2010-05-27 | 2012-08-07 | Cilag Gmbh International | Hand-held test meter with disruption avoidance circuitry |
| US10092229B2 (en) | 2010-06-29 | 2018-10-09 | Abbott Diabetes Care Inc. | Calibration of analyte measurement system |
| CA3059188A1 (en) * | 2010-09-28 | 2012-04-05 | Lifescan Scotland Limited | Analyte measurement method and system with error trapping |
| US9028661B2 (en) | 2011-01-05 | 2015-05-12 | Microchip Technology Incorporated | Glucose measurement using a current source |
| US20120187001A1 (en) | 2011-01-26 | 2012-07-26 | Lifescan, Inc. | Hand-held test meter with deep power conservation mode via direct or generated signal application and method for employing such a meter |
| US10136845B2 (en) | 2011-02-28 | 2018-11-27 | Abbott Diabetes Care Inc. | Devices, systems, and methods associated with analyte monitoring devices and devices incorporating the same |
| WO2012134890A1 (en) * | 2011-03-25 | 2012-10-04 | Cilag Gmbh International | System and method for measuring an analyte in a sample and correcting for interferents |
| US20120265036A1 (en) | 2011-04-15 | 2012-10-18 | Dexcom, Inc. | Advanced analyte sensor calibration and error detection |
| US9546973B2 (en) | 2011-05-27 | 2017-01-17 | Lifescan Scotland Limited | Peak offset correction for analyte test strip |
| EP4122384A1 (en) | 2011-06-16 | 2023-01-25 | Abbott Diabetes Care, Inc. | Temperature-compensated analyte monitoring devices, systems, and methods thereof |
| US20130002266A1 (en) | 2011-06-28 | 2013-01-03 | Lifescan, Inc. | Hand-held test meter with electromagnetic interference detection circuit |
| US20130006536A1 (en) | 2011-06-28 | 2013-01-03 | Lifescan, Inc. | Hand-held test meter with unpowered usb connection detection circuit |
| US8580576B2 (en) | 2011-08-04 | 2013-11-12 | Cilag Gmbh International | Method for bodily fluid sample transfer during analyte determination |
| US8475733B2 (en) | 2011-08-04 | 2013-07-02 | Cilag Gmbh International | Hand-held test meter and analytical test strip cartridge assembly with desiccant vial |
| US8623660B2 (en) | 2011-09-30 | 2014-01-07 | Lifescan Scotland Limited | Hand-held test meter with phase-shift-based hematocrit measurement circuit |
| WO2013066849A1 (en) | 2011-10-31 | 2013-05-10 | Abbott Diabetes Care Inc. | Model based variable risk false glucose threshold alarm prevention mechanism |
| US8710993B2 (en) | 2011-11-23 | 2014-04-29 | Abbott Diabetes Care Inc. | Mitigating single point failure of devices in an analyte monitoring system and methods thereof |
| DK3831283T3 (en) | 2011-12-11 | 2023-05-30 | Abbott Diabetes Care Inc | Analyte sensor devices, compounds and methods |
| US9572922B2 (en) | 2012-12-21 | 2017-02-21 | Larry Leonard | Inventive diabetic systems, tools, kits, and supplies for better diabetic living and mobility |
| US9903830B2 (en) | 2011-12-29 | 2018-02-27 | Lifescan Scotland Limited | Accurate analyte measurements for electrochemical test strip based on sensed physical characteristic(s) of the sample containing the analyte |
| CN102841117A (en) * | 2012-04-18 | 2012-12-26 | 江苏学府医疗科技有限公司 | Portable blood glucometer subsection statistical averaging and measuring method capable of improving detection accuracy |
| US9128038B2 (en) | 2012-06-21 | 2015-09-08 | Lifescan Scotland Limited | Analytical test strip with capillary sample-receiving chambers separated by a physical barrier island |
| US8877023B2 (en) | 2012-06-21 | 2014-11-04 | Lifescan Scotland Limited | Electrochemical-based analytical test strip with intersecting sample-receiving chambers |
| EP2890297B1 (en) | 2012-08-30 | 2018-04-11 | Abbott Diabetes Care, Inc. | Dropout detection in continuous analyte monitoring data during data excursions |
| WO2014052136A1 (en) | 2012-09-26 | 2014-04-03 | Abbott Diabetes Care Inc. | Method and apparatus for improving lag correction during in vivo measurement of analyte concentration with analyte concentration variability and range data |
| GB2509146B (en) * | 2012-12-21 | 2014-11-05 | Lifescan Scotland Ltd | Hand-held test meter with low-distortion signal generation circuit block |
| WO2014152034A1 (en) | 2013-03-15 | 2014-09-25 | Abbott Diabetes Care Inc. | Sensor fault detection using analyte sensor data pattern comparison |
| US9474475B1 (en) | 2013-03-15 | 2016-10-25 | Abbott Diabetes Care Inc. | Multi-rate analyte sensor data collection with sample rate configurable signal processing |
| US10433773B1 (en) | 2013-03-15 | 2019-10-08 | Abbott Diabetes Care Inc. | Noise rejection methods and apparatus for sparsely sampled analyte sensor data |
| US20140353176A1 (en) | 2013-06-04 | 2014-12-04 | Lifescan Scotland Limited | Hand-held test meter with time-multiplexed phase detection |
| CN105378467B (en) | 2013-07-08 | 2018-06-19 | 普和希控股公司 | The measurement device of blood constituent, the assay method of blood constituent |
| US9243276B2 (en) | 2013-08-29 | 2016-01-26 | Lifescan Scotland Limited | Method and system to determine hematocrit-insensitive glucose values in a fluid sample |
| US9459231B2 (en) | 2013-08-29 | 2016-10-04 | Lifescan Scotland Limited | Method and system to determine erroneous measurement signals during a test measurement sequence |
| US9291593B2 (en) * | 2013-11-22 | 2016-03-22 | Cilag Gmbh International | Dual-chamber analytical test strip |
| US20150176049A1 (en) | 2013-12-23 | 2015-06-25 | Cilag Gmbh International | Determining usability of analytical test strip |
| EP3125761B1 (en) | 2014-03-30 | 2020-09-30 | Abbott Diabetes Care Inc. | Method and apparatus for determining meal start and peak events in analyte monitoring systems |
| US20150330937A1 (en) | 2014-05-16 | 2015-11-19 | Lifescan Scotland Limited | Hand-held test meter with body portion proximity sensor module |
| US9470649B2 (en) | 2014-06-10 | 2016-10-18 | Lifescan Scotland Limited | Hand-held test mester with low-distortion signal generation circuit |
| US9759713B2 (en) | 2014-07-30 | 2017-09-12 | Lifescan Scotland Limited | Hand-held test meter with test strip simulation passive circuit block |
| GB201419799D0 (en) * | 2014-11-06 | 2014-12-24 | Inside Biometrics Ltd | A test device and method of using a test device |
| US9423374B2 (en) * | 2015-01-26 | 2016-08-23 | Lifescan Scotland Limited | Reference electrode error trap determined from a specified sampling time and a pre-determined sampling time |
| EP3294134B1 (en) | 2015-05-14 | 2020-07-08 | Abbott Diabetes Care Inc. | Inserter system for a compact medical device and corresponding method |
| US10213139B2 (en) | 2015-05-14 | 2019-02-26 | Abbott Diabetes Care Inc. | Systems, devices, and methods for assembling an applicator and sensor control device |
| CA2991716C (en) | 2015-07-10 | 2026-05-12 | Abbott Diabetes Care Inc. | System, device and method of dynamic glucose profile response to physiological parameters |
| US20170023516A1 (en) * | 2015-07-22 | 2017-01-26 | Lifescan Scotland Limited | Hand-held test meter with fluid ingress detection circuit |
| TWI729002B (en) * | 2015-09-16 | 2021-06-01 | 安盛生科股份有限公司 | Method and apparatus for improving usability and accuracy for physiological measurement on mobile device |
| CN105388276B (en) * | 2016-01-01 | 2017-08-04 | 河南科技大学第一附属医院 | A blood reagent analysis system and analysis method |
| US10183588B2 (en) | 2016-01-06 | 2019-01-22 | Johnson Controls Technology Company | Battery module lithium plating reduction |
| EP3570735A4 (en) | 2017-01-23 | 2020-10-21 | Abbott Diabetes Care Inc. | SYSTEMS, DEVICES AND METHODS FOR ANALYTICAL SENSOR USE |
| EP3600014B1 (en) | 2017-03-21 | 2025-07-30 | Abbott Diabetes Care Inc. | Devices and system for providing diabetic condition diagnosis |
| US11331022B2 (en) | 2017-10-24 | 2022-05-17 | Dexcom, Inc. | Pre-connected analyte sensors |
| CN111246797B (en) | 2017-10-24 | 2025-09-09 | 德克斯康公司 | Pre-attached analyte sensor |
| EP4585143A3 (en) | 2018-06-07 | 2025-10-01 | Abbott Diabetes Care, Inc. | Focused sterilization and sterilized sub-assemblies for analyte monitoring systems |
| MX2021007294A (en) | 2018-12-21 | 2021-07-15 | Abbott Diabetes Care Inc | Systems, devices, and methods for analyte sensor insertion. |
| MY192294A (en) | 2020-08-31 | 2022-08-17 | Abbott Diabetes Care Inc | Systems, devices, and methods for analyte sensor insertion |
| CA3186905A1 (en) | 2020-09-15 | 2022-03-24 | Abbott Diabetes Care Inc. | Systems, devices, and methods for an analyte sensor |
| EP4413917B1 (en) | 2020-09-15 | 2025-12-03 | Abbott Diabetes Care Inc. | Systems, devices, and methods for analyte monitoring |
| EP4370029A1 (en) | 2021-07-16 | 2024-05-22 | Abbott Diabetes Care Inc. | Systems, devices, and methods for analyte monitoring |
| US12702332B2 (en) | 2022-01-04 | 2026-08-11 | Abbott Diabetes Care Inc. | Systems, devices, and methods for analyte monitoring |
Family Cites Families (46)
| Publication number | Priority date | Publication date | Assignee | Title |
|---|---|---|---|---|
| JPH07107531B2 (en) * | 1987-06-18 | 1995-11-15 | ダイキン工業株式会社 | Signal processing device in biosensor |
| JPH0820412B2 (en) * | 1990-07-20 | 1996-03-04 | 松下電器産業株式会社 | Quantitative analysis method and device using disposable sensor |
| US5112455A (en) * | 1990-07-20 | 1992-05-12 | I Stat Corporation | Method for analytically utilizing microfabricated sensors during wet-up |
| CN2107020U (en) * | 1991-08-23 | 1992-06-10 | 蔡云涛 | Data testing and analysing instrument for biochemical sensors |
| JPH0685668A (en) * | 1992-09-01 | 1994-03-25 | Nec Corp | A/d conversion circuit |
| US5366609A (en) * | 1993-06-08 | 1994-11-22 | Boehringer Mannheim Corporation | Biosensing meter with pluggable memory key |
| US5352351A (en) * | 1993-06-08 | 1994-10-04 | Boehringer Mannheim Corporation | Biosensing meter with fail/safe procedures to prevent erroneous indications |
| JPH07128338A (en) * | 1993-11-02 | 1995-05-19 | Kyoto Daiichi Kagaku:Kk | Data management method in simple blood glucose meter and simple blood glucose meter using the data management method |
| JP3061351B2 (en) * | 1994-04-25 | 2000-07-10 | 松下電器産業株式会社 | Method and apparatus for quantifying specific compounds |
| FI96384C (en) * | 1994-10-18 | 1996-06-25 | Instrumentarium Oy | Apparatus for filling an anesthesia vaporizer |
| US5650062A (en) * | 1995-03-17 | 1997-07-22 | Matsushita Electric Industrial Co., Ltd. | Biosensor, and a method and a device for quantifying a substrate in a sample liquid using the same |
| US6241862B1 (en) * | 1996-02-14 | 2001-06-05 | Inverness Medical Technology, Inc. | Disposable test strips with integrated reagent/blood separation layer |
| US5708247A (en) * | 1996-02-14 | 1998-01-13 | Selfcare, Inc. | Disposable glucose test strips, and methods and compositions for making same |
| JP2005099047A (en) * | 1996-04-17 | 2005-04-14 | Matsushita Electric Ind Co Ltd | Temperature detector |
| US6558351B1 (en) * | 1999-06-03 | 2003-05-06 | Medtronic Minimed, Inc. | Closed loop system for controlling insulin infusion |
| US6046051A (en) * | 1997-06-27 | 2000-04-04 | Hemosense, Inc. | Method and device for measuring blood coagulation or lysis by viscosity changes |
| US6071391A (en) * | 1997-09-12 | 2000-06-06 | Nok Corporation | Enzyme electrode structure |
| US6233471B1 (en) * | 1998-05-13 | 2001-05-15 | Cygnus, Inc. | Signal processing for measurement of physiological analysis |
| JP2000258338A (en) * | 1999-03-08 | 2000-09-22 | Matsushita Electric Ind Co Ltd | Urine testing equipment |
| US6193873B1 (en) | 1999-06-15 | 2001-02-27 | Lifescan, Inc. | Sample detection to initiate timing of an electrochemical assay |
| DE19936693A1 (en) * | 1999-08-04 | 2001-02-08 | Lre Technology Partner Gmbh | Instrument for the measurement of blood sugar concentrations has a test field with electrodes for the test strip and a circuit for measurement/evaluation of the current strength for display |
| US6733655B1 (en) * | 2000-03-08 | 2004-05-11 | Oliver W. H. Davies | Measurement of substances in liquids |
| ES2228924T3 (en) * | 2000-03-22 | 2005-04-16 | All Medicus Co., Ltd | ELECTROCHEMICAL BIOSENSOR TEST BAND WITH RECOGNITION ELECTRODE AND READING DEVICE USED BY THIS TEST BAND. |
| KR100340173B1 (en) * | 2000-03-22 | 2002-06-12 | 이동준 | Electrochemical Biosensor Readout Meter |
| US20020092612A1 (en) * | 2000-03-28 | 2002-07-18 | Davies Oliver William Hardwicke | Rapid response glucose sensor |
| ATE406571T1 (en) | 2000-03-28 | 2008-09-15 | Diabetes Diagnostics Inc | TIMER WITH FAST RESPONSIVE GLUCOSE SENSOR |
| WO2002057768A1 (en) * | 2001-01-17 | 2002-07-25 | Arkray, Inc. | Quantitative analyzing method and quantitative analyzer using sensor |
| JP2002257782A (en) * | 2001-03-05 | 2002-09-11 | Nec Corp | Electrochemical sensor measuring device |
| JP4272524B2 (en) * | 2001-10-26 | 2009-06-03 | アークレイ株式会社 | Concentration measuring method and concentration measuring device for specific component |
| US6872299B2 (en) | 2001-12-10 | 2005-03-29 | Lifescan, Inc. | Passive sample detection to initiate timing of an assay |
| US6856125B2 (en) | 2001-12-12 | 2005-02-15 | Lifescan, Inc. | Biosensor apparatus and method with sample type and volume detection |
| JP3863429B2 (en) * | 2002-01-04 | 2006-12-27 | 学校法人東京電機大学 | Linear vibration actuator |
| US8010174B2 (en) * | 2003-08-22 | 2011-08-30 | Dexcom, Inc. | Systems and methods for replacing signal artifacts in a glucose sensor data stream |
| US6946299B2 (en) * | 2002-04-25 | 2005-09-20 | Home Diagnostics, Inc. | Systems and methods for blood glucose sensing |
| US6743635B2 (en) * | 2002-04-25 | 2004-06-01 | Home Diagnostics, Inc. | System and methods for blood glucose sensing |
| US6964871B2 (en) * | 2002-04-25 | 2005-11-15 | Home Diagnostics, Inc. | Systems and methods for blood glucose sensing |
| JP4242217B2 (en) * | 2002-07-18 | 2009-03-25 | パナソニック株式会社 | Biosensor and measuring device for biosensor |
| ATE510208T1 (en) | 2002-07-25 | 2011-06-15 | Arkray Inc | SAMPLE ANALYSIS METHOD AND SAMPLE ANALYSIS DEVICE |
| US7736309B2 (en) * | 2002-09-27 | 2010-06-15 | Medtronic Minimed, Inc. | Implantable sensor method and system |
| TW557362B (en) * | 2002-12-31 | 2003-10-11 | Veutron Corp | Method for improving a reading resolution of a biosensor |
| US7132041B2 (en) * | 2003-02-11 | 2006-11-07 | Bayer Healthcare Llc | Methods of determining the concentration of an analyte in a fluid test sample |
| US6931327B2 (en) * | 2003-08-01 | 2005-08-16 | Dexcom, Inc. | System and methods for processing analyte sensor data |
| WO2005054846A1 (en) | 2003-12-03 | 2005-06-16 | Lifescan Scotland Limited | Improvements relating to hand held anaytical devices |
| US7410052B2 (en) * | 2005-10-14 | 2008-08-12 | Kimberly-Clark Worldwide, Inc. | Trial kit for dispensing toilet paper and moist wipes |
| US8066866B2 (en) * | 2005-10-17 | 2011-11-29 | Lifescan, Inc. | Methods for measuring physiological fluids |
| US7468125B2 (en) * | 2005-10-17 | 2008-12-23 | Lifescan, Inc. | System and method of processing a current sample for calculating a glucose concentration |
-
2005
- 2005-10-17 US US11/252,216 patent/US7468125B2/en not_active Expired - Lifetime
-
2006
- 2006-10-16 CN CN201110290346.6A patent/CN102520029B/en not_active Expired - Fee Related
- 2006-10-16 EP EP06255300.3A patent/EP1775587B1/en active Active
- 2006-10-16 ES ES06255300.3T patent/ES2438220T3/en active Active
- 2006-10-16 CN CN2006100640821A patent/CN1996000B/en not_active Expired - Fee Related
- 2006-10-16 JP JP2006281230A patent/JP4914170B2/en not_active Expired - Fee Related
- 2006-10-16 EP EP12171146.9A patent/EP2498083B1/en active Active
- 2006-10-16 ES ES12171146.9T patent/ES2548263T3/en active Active
-
2008
- 2008-06-30 US US12/164,925 patent/US8093903B2/en not_active Expired - Fee Related
-
2011
- 2011-08-23 JP JP2011181483A patent/JP5080671B2/en not_active Expired - Fee Related
Also Published As
| Publication number | Publication date |
|---|---|
| US7468125B2 (en) | 2008-12-23 |
| US20070087397A1 (en) | 2007-04-19 |
| JP2007114198A (en) | 2007-05-10 |
| HK1174388A1 (en) | 2013-06-07 |
| JP2011232360A (en) | 2011-11-17 |
| JP4914170B2 (en) | 2012-04-11 |
| CN102520029B (en) | 2015-05-20 |
| CN102520029A (en) | 2012-06-27 |
| EP1775587B1 (en) | 2013-10-02 |
| CN1996000B (en) | 2011-11-23 |
| CN1996000A (en) | 2007-07-11 |
| US20090322341A1 (en) | 2009-12-31 |
| ES2548263T3 (en) | 2015-10-15 |
| EP2498083A1 (en) | 2012-09-12 |
| ES2438220T3 (en) | 2014-01-16 |
| EP1775587A2 (en) | 2007-04-18 |
| US8093903B2 (en) | 2012-01-10 |
| JP5080671B2 (en) | 2012-11-21 |
| HK1103531A1 (en) | 2007-12-21 |
| EP1775587A3 (en) | 2009-11-18 |
Similar Documents
| Publication | Publication Date | Title |
|---|---|---|
| EP1775587B1 (en) | A system and method of processing a current sample for calculating a glucose concentration | |
| EP2261651B1 (en) | Method and apparatus for measuring physiological fluids | |
| US8234076B2 (en) | Abnormal output detection system for a biosensor | |
| CA2649644C (en) | Underfill detection system for an electrochemical biosensor | |
| US20110184265A1 (en) | Method and Apparatus for Providing Notification in Analyte Monitoring Systems | |
| JP2011502263A (en) | Test strip and system for measuring the concentration of an analyte in a liquid sample | |
| HK1174388B (en) | Method of processing a current measurement for calculating a glucose concentration | |
| HK1103531B (en) | A system and method of processing a current sample for calculating a glucose concentration | |
| EP2725978A1 (en) | Hand-held test meter with electro-magnetic interference detection circuit | |
| HK1150662B (en) | Method and apparatus for measuring physiological fluids | |
| HK1103797B (en) | Method and apparatus for measuring physiological fluids | |
| JP2022542576A (en) | Method for Determining Analyte Concentration of Sample | |
| US20170276632A1 (en) | Method and device for determining volumetric sufficiency in an electrochemical test strip | |
| MXPA06008846A (en) | Electrochemical biosensor |
Legal Events
| Date | Code | Title | Description |
|---|---|---|---|
| PUAI | Public reference made under article 153(3) epc to a published international application that has entered the european phase |
Free format text: ORIGINAL CODE: 0009012 |
|
| AC | Divisional application: reference to earlier application |
Ref document number: 1775587 Country of ref document: EP Kind code of ref document: P |
|
| AK | Designated contracting states |
Kind code of ref document: A1 Designated state(s): AT BE BG CH CY CZ DE DK EE ES FI FR GB GR HU IE IS IT LI LT LU LV MC NL PL PT RO SE SI SK TR |
|
| 17P | Request for examination filed |
Effective date: 20130306 |
|
| REG | Reference to a national code |
Ref country code: HK Ref legal event code: DE Ref document number: 1174388 Country of ref document: HK |
|
| 17Q | First examination report despatched |
Effective date: 20130508 |
|
| GRAP | Despatch of communication of intention to grant a patent |
Free format text: ORIGINAL CODE: EPIDOSNIGR1 |
|
| INTG | Intention to grant announced |
Effective date: 20150312 |
|
| RAP1 | Party data changed (applicant data changed or rights of an application transferred) |
Owner name: LIFESCAN, INC. |
|
| GRAS | Grant fee paid |
Free format text: ORIGINAL CODE: EPIDOSNIGR3 |
|
| GRAA | (expected) grant |
Free format text: ORIGINAL CODE: 0009210 |
|
| AC | Divisional application: reference to earlier application |
Ref document number: 1775587 Country of ref document: EP Kind code of ref document: P |
|
| AK | Designated contracting states |
Kind code of ref document: B1 Designated state(s): AT BE BG CH CY CZ DE DK EE ES FI FR GB GR HU IE IS IT LI LT LU LV MC NL PL PT RO SE SI SK TR |
|
| REG | Reference to a national code |
Ref country code: GB Ref legal event code: FG4D |
|
| REG | Reference to a national code |
Ref country code: AT Ref legal event code: REF Ref document number: 734255 Country of ref document: AT Kind code of ref document: T Effective date: 20150715 Ref country code: CH Ref legal event code: EP Ref country code: CH Ref legal event code: NV Representative=s name: E. BLUM AND CO. AG PATENT- UND MARKENANWAELTE , CH |
|
| REG | Reference to a national code |
Ref country code: IE Ref legal event code: FG4D |
|
| REG | Reference to a national code |
Ref country code: DE Ref legal event code: R096 Ref document number: 602006045868 Country of ref document: DE |
|
| REG | Reference to a national code |
Ref country code: ES Ref legal event code: FG2A Ref document number: 2548263 Country of ref document: ES Kind code of ref document: T3 Effective date: 20151015 |
|
| REG | Reference to a national code |
Ref country code: AT Ref legal event code: MK05 Ref document number: 734255 Country of ref document: AT Kind code of ref document: T Effective date: 20150701 |
|
| REG | Reference to a national code |
Ref country code: NL Ref legal event code: MP Effective date: 20150701 |
|
| REG | Reference to a national code |
Ref country code: LT Ref legal event code: MG4D |
|
| PG25 | Lapsed in a contracting state [announced via postgrant information from national office to epo] |
Ref country code: LT Free format text: LAPSE BECAUSE OF FAILURE TO SUBMIT A TRANSLATION OF THE DESCRIPTION OR TO PAY THE FEE WITHIN THE PRESCRIBED TIME-LIMIT Effective date: 20150701 Ref country code: LV Free format text: LAPSE BECAUSE OF FAILURE TO SUBMIT A TRANSLATION OF THE DESCRIPTION OR TO PAY THE FEE WITHIN THE PRESCRIBED TIME-LIMIT Effective date: 20150701 Ref country code: FI Free format text: LAPSE BECAUSE OF FAILURE TO SUBMIT A TRANSLATION OF THE DESCRIPTION OR TO PAY THE FEE WITHIN THE PRESCRIBED TIME-LIMIT Effective date: 20150701 Ref country code: GR Free format text: LAPSE BECAUSE OF FAILURE TO SUBMIT A TRANSLATION OF THE DESCRIPTION OR TO PAY THE FEE WITHIN THE PRESCRIBED TIME-LIMIT Effective date: 20151002 |
|
| PG25 | Lapsed in a contracting state [announced via postgrant information from national office to epo] |
Ref country code: AT Free format text: LAPSE BECAUSE OF FAILURE TO SUBMIT A TRANSLATION OF THE DESCRIPTION OR TO PAY THE FEE WITHIN THE PRESCRIBED TIME-LIMIT Effective date: 20150701 Ref country code: PL Free format text: LAPSE BECAUSE OF FAILURE TO SUBMIT A TRANSLATION OF THE DESCRIPTION OR TO PAY THE FEE WITHIN THE PRESCRIBED TIME-LIMIT Effective date: 20150701 Ref country code: IS Free format text: LAPSE BECAUSE OF FAILURE TO SUBMIT A TRANSLATION OF THE DESCRIPTION OR TO PAY THE FEE WITHIN THE PRESCRIBED TIME-LIMIT Effective date: 20151101 Ref country code: SE Free format text: LAPSE BECAUSE OF FAILURE TO SUBMIT A TRANSLATION OF THE DESCRIPTION OR TO PAY THE FEE WITHIN THE PRESCRIBED TIME-LIMIT Effective date: 20150701 Ref country code: PT Free format text: LAPSE BECAUSE OF FAILURE TO SUBMIT A TRANSLATION OF THE DESCRIPTION OR TO PAY THE FEE WITHIN THE PRESCRIBED TIME-LIMIT Effective date: 20151102 |
|
| REG | Reference to a national code |
Ref country code: DE Ref legal event code: R097 Ref document number: 602006045868 Country of ref document: DE |
|
| PG25 | Lapsed in a contracting state [announced via postgrant information from national office to epo] |
Ref country code: SK Free format text: LAPSE BECAUSE OF FAILURE TO SUBMIT A TRANSLATION OF THE DESCRIPTION OR TO PAY THE FEE WITHIN THE PRESCRIBED TIME-LIMIT Effective date: 20150701 Ref country code: EE Free format text: LAPSE BECAUSE OF FAILURE TO SUBMIT A TRANSLATION OF THE DESCRIPTION OR TO PAY THE FEE WITHIN THE PRESCRIBED TIME-LIMIT Effective date: 20150701 Ref country code: CZ Free format text: LAPSE BECAUSE OF FAILURE TO SUBMIT A TRANSLATION OF THE DESCRIPTION OR TO PAY THE FEE WITHIN THE PRESCRIBED TIME-LIMIT Effective date: 20150701 Ref country code: DK Free format text: LAPSE BECAUSE OF FAILURE TO SUBMIT A TRANSLATION OF THE DESCRIPTION OR TO PAY THE FEE WITHIN THE PRESCRIBED TIME-LIMIT Effective date: 20150701 |
|
| PLBE | No opposition filed within time limit |
Free format text: ORIGINAL CODE: 0009261 |
|
| STAA | Information on the status of an ep patent application or granted ep patent |
Free format text: STATUS: NO OPPOSITION FILED WITHIN TIME LIMIT |
|
| REG | Reference to a national code |
Ref country code: HK Ref legal event code: GR Ref document number: 1174388 Country of ref document: HK |
|
| PG25 | Lapsed in a contracting state [announced via postgrant information from national office to epo] |
Ref country code: LU Free format text: LAPSE BECAUSE OF FAILURE TO SUBMIT A TRANSLATION OF THE DESCRIPTION OR TO PAY THE FEE WITHIN THE PRESCRIBED TIME-LIMIT Effective date: 20151016 Ref country code: RO Free format text: LAPSE BECAUSE OF FAILURE TO SUBMIT A TRANSLATION OF THE DESCRIPTION OR TO PAY THE FEE WITHIN THE PRESCRIBED TIME-LIMIT Effective date: 20150701 |
|
| 26N | No opposition filed |
Effective date: 20160404 |
|
| PG25 | Lapsed in a contracting state [announced via postgrant information from national office to epo] |
Ref country code: MC Free format text: LAPSE BECAUSE OF FAILURE TO SUBMIT A TRANSLATION OF THE DESCRIPTION OR TO PAY THE FEE WITHIN THE PRESCRIBED TIME-LIMIT Effective date: 20150701 |
|
| PG25 | Lapsed in a contracting state [announced via postgrant information from national office to epo] |
Ref country code: SI Free format text: LAPSE BECAUSE OF FAILURE TO SUBMIT A TRANSLATION OF THE DESCRIPTION OR TO PAY THE FEE WITHIN THE PRESCRIBED TIME-LIMIT Effective date: 20150701 |
|
| REG | Reference to a national code |
Ref country code: FR Ref legal event code: PLFP Year of fee payment: 11 |
|
| PG25 | Lapsed in a contracting state [announced via postgrant information from national office to epo] |
Ref country code: BE Free format text: LAPSE BECAUSE OF FAILURE TO SUBMIT A TRANSLATION OF THE DESCRIPTION OR TO PAY THE FEE WITHIN THE PRESCRIBED TIME-LIMIT Effective date: 20150701 |
|
| PG25 | Lapsed in a contracting state [announced via postgrant information from national office to epo] |
Ref country code: BG Free format text: LAPSE BECAUSE OF FAILURE TO SUBMIT A TRANSLATION OF THE DESCRIPTION OR TO PAY THE FEE WITHIN THE PRESCRIBED TIME-LIMIT Effective date: 20150701 Ref country code: HU Free format text: LAPSE BECAUSE OF FAILURE TO SUBMIT A TRANSLATION OF THE DESCRIPTION OR TO PAY THE FEE WITHIN THE PRESCRIBED TIME-LIMIT; INVALID AB INITIO Effective date: 20061016 |
|
| PG25 | Lapsed in a contracting state [announced via postgrant information from national office to epo] |
Ref country code: NL Free format text: LAPSE BECAUSE OF FAILURE TO SUBMIT A TRANSLATION OF THE DESCRIPTION OR TO PAY THE FEE WITHIN THE PRESCRIBED TIME-LIMIT Effective date: 20150701 Ref country code: CY Free format text: LAPSE BECAUSE OF FAILURE TO SUBMIT A TRANSLATION OF THE DESCRIPTION OR TO PAY THE FEE WITHIN THE PRESCRIBED TIME-LIMIT Effective date: 20150701 |
|
| PG25 | Lapsed in a contracting state [announced via postgrant information from national office to epo] |
Ref country code: TR Free format text: LAPSE BECAUSE OF FAILURE TO SUBMIT A TRANSLATION OF THE DESCRIPTION OR TO PAY THE FEE WITHIN THE PRESCRIBED TIME-LIMIT Effective date: 20150701 |
|
| REG | Reference to a national code |
Ref country code: FR Ref legal event code: PLFP Year of fee payment: 12 |
|
| REG | Reference to a national code |
Ref country code: FR Ref legal event code: PLFP Year of fee payment: 13 |
|
| PGFP | Annual fee paid to national office [announced via postgrant information from national office to epo] |
Ref country code: IE Payment date: 20191010 Year of fee payment: 14 |
|
| PGFP | Annual fee paid to national office [announced via postgrant information from national office to epo] |
Ref country code: ES Payment date: 20191104 Year of fee payment: 14 Ref country code: IT Payment date: 20191009 Year of fee payment: 14 |
|
| PGFP | Annual fee paid to national office [announced via postgrant information from national office to epo] |
Ref country code: CH Payment date: 20191015 Year of fee payment: 14 |
|
| PGFP | Annual fee paid to national office [announced via postgrant information from national office to epo] |
Ref country code: GB Payment date: 20191018 Year of fee payment: 14 |
|
| REG | Reference to a national code |
Ref country code: CH Ref legal event code: PL |
|
| GBPC | Gb: european patent ceased through non-payment of renewal fee |
Effective date: 20201016 |
|
| PG25 | Lapsed in a contracting state [announced via postgrant information from national office to epo] |
Ref country code: GB Free format text: LAPSE BECAUSE OF NON-PAYMENT OF DUE FEES Effective date: 20201016 Ref country code: LI Free format text: LAPSE BECAUSE OF NON-PAYMENT OF DUE FEES Effective date: 20201031 Ref country code: CH Free format text: LAPSE BECAUSE OF NON-PAYMENT OF DUE FEES Effective date: 20201031 |
|
| PG25 | Lapsed in a contracting state [announced via postgrant information from national office to epo] |
Ref country code: IT Free format text: LAPSE BECAUSE OF NON-PAYMENT OF DUE FEES Effective date: 20201016 Ref country code: IE Free format text: LAPSE BECAUSE OF NON-PAYMENT OF DUE FEES Effective date: 20201016 |
|
| REG | Reference to a national code |
Ref country code: ES Ref legal event code: FD2A Effective date: 20220127 |
|
| PG25 | Lapsed in a contracting state [announced via postgrant information from national office to epo] |
Ref country code: ES Free format text: LAPSE BECAUSE OF NON-PAYMENT OF DUE FEES Effective date: 20201017 |
|
| PGFP | Annual fee paid to national office [announced via postgrant information from national office to epo] |
Ref country code: FR Payment date: 20230821 Year of fee payment: 18 |
|
| PG25 | Lapsed in a contracting state [announced via postgrant information from national office to epo] |
Ref country code: FR Free format text: LAPSE BECAUSE OF NON-PAYMENT OF DUE FEES Effective date: 20241031 |
|
| PGFP | Annual fee paid to national office [announced via postgrant information from national office to epo] |
Ref country code: DE Payment date: 20260225 Year of fee payment: 20 |