EP2498079A2 - Verfahren zur automatischen Durchführung der Leistungsdiagnose eines photometrischen Partikelanalysators - Google Patents
Verfahren zur automatischen Durchführung der Leistungsdiagnose eines photometrischen Partikelanalysators Download PDFInfo
- Publication number
- EP2498079A2 EP2498079A2 EP12158553A EP12158553A EP2498079A2 EP 2498079 A2 EP2498079 A2 EP 2498079A2 EP 12158553 A EP12158553 A EP 12158553A EP 12158553 A EP12158553 A EP 12158553A EP 2498079 A2 EP2498079 A2 EP 2498079A2
- Authority
- EP
- European Patent Office
- Prior art keywords
- light source
- wavelengths
- light
- sensor
- filter
- Prior art date
- Legal status (The legal status is an assumption and is not a legal conclusion. Google has not performed a legal analysis and makes no representation as to the accuracy of the status listed.)
- Granted
Links
Images
Classifications
-
- G—PHYSICS
- G01—MEASURING; TESTING
- G01N—INVESTIGATING OR ANALYSING MATERIALS BY DETERMINING THEIR CHEMICAL OR PHYSICAL PROPERTIES
- G01N21/00—Investigating or analysing materials by the use of optical means, i.e. using sub-millimetre waves, infrared, visible or ultraviolet light
- G01N21/17—Systems in which incident light is modified in accordance with the properties of the material investigated
- G01N21/25—Colour; Spectral properties, i.e. comparison of effect of material on the light at two or more different wavelengths or wavelength bands
- G01N21/27—Colour; Spectral properties, i.e. comparison of effect of material on the light at two or more different wavelengths or wavelength bands using photo-electric detection ; circuits for computing concentration
- G01N21/274—Calibration, base line adjustment, drift correction
-
- G—PHYSICS
- G01—MEASURING; TESTING
- G01N—INVESTIGATING OR ANALYSING MATERIALS BY DETERMINING THEIR CHEMICAL OR PHYSICAL PROPERTIES
- G01N15/00—Investigating characteristics of particles; Investigating permeability, pore-volume or surface-area of porous materials
- G01N15/10—Investigating individual particles
- G01N15/1012—Calibrating particle analysers; References therefor
-
- G—PHYSICS
- G01—MEASURING; TESTING
- G01N—INVESTIGATING OR ANALYSING MATERIALS BY DETERMINING THEIR CHEMICAL OR PHYSICAL PROPERTIES
- G01N15/00—Investigating characteristics of particles; Investigating permeability, pore-volume or surface-area of porous materials
- G01N15/06—Investigating concentration of particle suspensions
- G01N15/0606—Investigating concentration of particle suspensions by collecting particles on a support
- G01N15/0618—Investigating concentration of particle suspensions by collecting particles on a support of the filter type
-
- G—PHYSICS
- G01—MEASURING; TESTING
- G01N—INVESTIGATING OR ANALYSING MATERIALS BY DETERMINING THEIR CHEMICAL OR PHYSICAL PROPERTIES
- G01N21/00—Investigating or analysing materials by the use of optical means, i.e. using sub-millimetre waves, infrared, visible or ultraviolet light
- G01N21/17—Systems in which incident light is modified in accordance with the properties of the material investigated
- G01N21/59—Transmissivity
-
- G—PHYSICS
- G01—MEASURING; TESTING
- G01N—INVESTIGATING OR ANALYSING MATERIALS BY DETERMINING THEIR CHEMICAL OR PHYSICAL PROPERTIES
- G01N15/00—Investigating characteristics of particles; Investigating permeability, pore-volume or surface-area of porous materials
- G01N15/06—Investigating concentration of particle suspensions
- G01N15/0606—Investigating concentration of particle suspensions by collecting particles on a support
- G01N15/0618—Investigating concentration of particle suspensions by collecting particles on a support of the filter type
- G01N15/0625—Optical scan of the deposits
-
- G—PHYSICS
- G01—MEASURING; TESTING
- G01N—INVESTIGATING OR ANALYSING MATERIALS BY DETERMINING THEIR CHEMICAL OR PHYSICAL PROPERTIES
- G01N2201/00—Features of devices classified in G01N21/00
- G01N2201/06—Illumination; Optics
- G01N2201/062—LED's
- G01N2201/0627—Use of several LED's for spectral resolution
Definitions
- the present invention generally relates to calibration methods, and more particularly to a method to automatically diagnose photometric particle analyzers.
- AETHALOMETER® optical photometric particle analyzer
- the AETHALOMETER® collects particles suspended in an air stream by continuous filtration of the air through a porous, fibrous substrate, such as a quartz fiber filter. Simultaneously, the optical transmission of the filter is continuously measured by illumination of the upper surface, and detection of the light transmitted through various portions of the filter to its underside.
- the accumulation on the filter will contain a mass of material (including the "Black Carbon” component, denoted "BC") that will absorb some of the incident light, and reduce the amount of light transmitted through the filter.
- the AETHALOMETER® precisely measures the intensity of light transmitted through the "sensing" portion of filter material, on which particles are collected, and compares this with the intensity of light emanating from the same source but passing through a "reference" portion of the same filter material but which is not subject to the collection of particles.
- the AETHALOMETER® may function, for example, by using photo-detectors to accurately measure the intensity of light transmitted through various portions of an "optical analysis head.”
- the illuminating light is provided by a multiplicity of light-emitting diode (LED) sources emitting at a variety of wavelengths.
- LED light-emitting diode
- the ratio of these intensities leads to the calculation of optical absorption, since the common denominator is the intensity of light produced by the source.
- the relation between optical absorption and mass of BC determined by separate laboratory techniques, allows the increase in optical absorption between one measurement and the next to be interpreted as the accumulation of a certain amount of BC during the measurement period.
- the concentration of BC in the sample air stream can be calculated, given a simultaneous measurement of the air flow rate by a separate sensor.
- the AETHALOMETER® offers a real-time measurement of the concentration of BC particles in an air stream.
- the present invention overcomes the disadvantages of prior art photometric particle analyzers by determining when the operation is degraded from normal operating conditions.
- the operation of an instrument may be automatically checked, and the result displayed locally as well as being transmitted to a remote observer.
- the present invention may be used by optical photometric particle analyzers, or by analyzers that measure other properties of particles collected on filters.
- Certain embodiments overcomes the limitations of the prior art by controlling the intensity of light sources at one or at multiple optical wavelengths and using control electronics and hardware.
- the method requires only added control software and numerical analysis of the measured results.
- the method produces both a validation of the instrument's analytical performance, as well as a measure of the degree and optical nature of contamination that will permit a determination of the need for intervention, remedy or cleaning.
- a method is provided to perform an automatic performance diagnosis and calibration of photometric particle analyzers that operate on the principle of measuring the absorption of light transmitted through a deposit of particles collected on a filter.
- a method is provided to test the response of the light source and the light detectors of a photometric particle analyzer, and provide a quantitative measure of a standardized response of the instrument that may be used to verify the analytical performance of the instrument.
- one method determines the presence of contamination within the optical elements of the instrument, and to enable a tentative identification of the nature of said contamination, and does so with no physical intervention with the instrument.
- a method is provided to test the response of the light source and the light detectors of a photometric particle analyzer, and provide a quantitative measure of a standardized response of the instrument that may be used to verify the analytical performance of the instrument, where the method may be activated either by remote control or by a predetermined routine internal to the instrument, and the results may be transmitted by a data link to a remote observer or controller, either human or automatic.
- This permits the automatic external or self-diagnosis of an analyzer that may be located remotely, and allows for human operators or automatic systems to determine the need for intervention, remedy or cleaning.
- a method is provided to validate the performance of instruments used for the analysis of the concentration of particles suspended in an air flow stream.
- the method can provide an indication of any degradation in performance due to internal contamination, and thereby remotely and automatically indicate the need for intervention and service. Both of these actions increase the utility of the instrument, by allowing it to be installed remotely and yet, by means of a data link, have its performance checked by an agent at another location, either human or automatic.
- Certain embodiments provide a method of testing a photometric particle analyzer, where the photometric particle analyzer includes a light source having light with a plurality of wavelengths, each with a controllable intensity, a filter to collect particles, a first light path from the light source through a filter that may be exposed to particle laden-air to a first sensor that produces a first signal, a second light path from the light source through a reference filter portion to a second sensor that produces a second signal, and a third light path from the light source to a third sensor without passing through a filter, where said third sensor produces a third signal.
- the method includes obtaining a baseline measurement of the first, second, and third signals with the photometric particle analyzer having clean optics and filter by: operating the light source at individual wavelengths of the plurality of wavelengths, and recording the baseline measurement; using the photometric particle analyzer to sample particle-laden air; obtaining a test measurement of the first, second, and third signals for the photometric particle analyzer after using the photometric particle analyzer to sample particle-laden air by: replacing the collecting filter portion with a filter that has not been used to collect particles, operating the light source at individual wavelengths of the plurality of wavelengths, and recording the test measurement; and generating an output from a comparison of said baseline measurement and said test measurement, where said output is a diagnostic of the operation of the photometric particle analyzer.
- Certain other embodiments provide a method of testing a photometric particle analyzer having a light source and a stored baseline measurement.
- the method includes providing light from the light source through a collecting filter that may be exposed to particle laden-air to a first sensor that produces a first signal; providing light from the light source through a reference filter portion to a second sensor that produces a second signal; providing light from the light source through a third sensor without passing through a filter, where said third sensor produces a third signal; and generating an output from a comparison of said first signal, said second signal, said third signal and the stored baseline measurement, where said output is a diagnostic of the operation of the photometric particle analyzer.
- FIG. 1 a schematic of the cross-section of one embodiment of a photometric particle analyzer
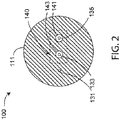
- FIG. 2 is a sectional view 2-2 of FIG. 1 .
- Various embodiments described herein are directed to methods for operating analytic instruments that permit the identification, characterization, or quantification of one or more constituents of interest, such as particulates.
- the following description includes a description of an apparatus that is meant to provide an understanding of the methods of the present invention, and is not meant to limit the scope of the invention.
- the method of the present invention is described using the example an optical analysis of airborne particles for carbon content, but may be applied to other photometric analyzers.
- the various embodiments described above thus provide a means whereby a photometric particle analyzer can be controlled to perform an automatic self-diagnosis of the optics, yielding quantitative numerical results.
- the diagnostic procedure may be instigated either manually, by an operator at the site of the instrument; remotely, by command transmitted by communication; or automatically on a programmed time sequence.
- the results of the diagnostic procedure may be displayed locally to an operator at the site of the instrument; may be transmitted to a remote receiver for examination elsewhere, either by expert automatic systems or by human operators; or may be stored in a data file retained within the instrument.
- the raw, unprocessed photometric data may be compared between the time of testing; the time of any prior test during the instrument's use; and the original time of manufacture of the instrument; in order to determine any gradual change in performance.
- the diagnostic data may be analyzed to infer the possible presence of contamination of the optics of the instrument, where the contamination may be distinguished between reasonably likely categories such as the internal deposition of dust or aerosol particles; the internal deposition of a film derived from semi-volatile vapors; or the presence of macroscopic fragments or items drawn into the optics by the suction of air flow into the sample inlet.
- the diagnostic data may be analyzed to infer the possible degradation of efficiency of the light sources, where each source providing illumination at each of the multiplicity of operational wavelengths may be tested separately.
- the diagnostic data may also be analyzed to infer the possible degradation of linearity of response of the instrument's photo-detectors, and that the non-linearity, if any, may be quantified in the same units as the fundamental output of the instrument.
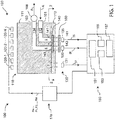
- FIG. 1 is a schematic of the cross-section of one embodiment of a photometric particle analyzer 100 and Figure 2 is a sectional view 2-2 of the embodiment of FIG. 1 .
- Photometric particle analyzer 100 is a general description of an embodiment of a photometric particle analyzer that is not meant to limit the scope of the present invention.
- photometric particle analyzer 100 is an analytical instrument that performs measurements on filter 140, which is positioned to collect particles from an air stream A.
- filter 140 is illuminated by a plurality of light sources 120, and light that is transmitted through the filter is detected by sensors 130, which produce readings proportional to the amount of particulates deposited on filter 140.
- sensors 140 may be calibrated to provide an estimate of fluid concentration of particulates based on light absorption through filters 140.
- the calibration is linear with the logarithm of light absorption, for example. It is known that for some measurements such as optical transmission through a filter with carbon black deposits, calibrations hold for low amount of particulate loading, and that the instruments produce errors in particulate concentration as that depends on the type of particulates and their density on the filter.
- Photometric particle analyzer 100 includes an optical element 110, plurality of light sources 120, sensors 130, a filter 140, a computer 150, an optional calibrated optical absorber, such as a neutral density filter 160, and a light source controller 170. As described subsequently, light from the plurality of light sources 120 is transmitted through optical element 110 to individual ones of the sensors 130. Some of the sensors detect light passing through filter 140, which may include collected particles or not, and some detect light that does not pass through a filter. Optional optical absorber 160 may be placed in the optical path for certain calibration purposes.
- light sources 120 are provide with drive currents by computer 150 according to the wavelength of the individual source.
- light sources 120 may include sources having M discrete and controllable wavelengths, where each source controlled by software in computer 150.
- Sensors 130 detect the light from light sources 120, and the sensor output is read by computer 150.
- Optical element 110 includes an upper portion 111 and 113, both of which are formed from a transparent material, which may be for example and without limitation glass, quartz, polycarbonate plastic, acrylic plastic, etc.
- Upper portion 111 includes internal passages for the flow of air, which are shown as air passage volume 112 having an inlet 101 at one end and air passage volume 114 having an outlet 103 at one end.
- Filter 140 is a fibrous, porous filter material that is sandwiched between portions 111 and 113 with a filter area 141 near a second end of volume 112 and a filter area 143 near a second end of volume 114. As described subsequently, filter 140 may collect particles from particle-laden air, and is it the change in optical properties from the collected particles that form the basis of the analysis of particulate-laden air flows. Filter 140 may be furnished in the form of a continuous strip of tape, or a discrete inserted element. The use of discrete disks of filter material is used in early AETHALOMETER® instruments, and is still used in current models of the "Particle Soot Absorption Photometer” (Radiance Research, Washington). The use of continuous tape filters is used in current models of the AETHALOMETER®, the “Multi-Angle Absorption Photometer” (ThermoFisher, Massachusetts), the “COSMOS” analyzer (Kanomax, Japan), and others.
- Outlet 103 may also be provided with a pump 108, which may be operated by computer 150, and which can draw air from inlet 101, through volume 112 and filter area 141, through filter 140, and then through filter area 143, and volume 114 to outlet 103.
- Photometric particle analyzer 100 may also include flow meters and/or mass flow controllers to measure or control flow F.
- light sources 120 are dispersed along housing 110 to provide uniform, dispersed illumination to sensors 130.
- M may be 2, 3, 4, 5, 6, 7, 8, 9, or 10 or more wavelengths, ranging from the near-infrared (which may be, for example and without limitation, near 950 nm) to the near-ultraviolet (which may be, for example and without limitation, near 370 nm.
- each light source 120-n is powered by a current Pm from light source controller 170 according to the light source wavelength.
- each light source 120-n emitting at a wavelength ⁇ (m) is powered by current Pm.
- Light source controller 170 thus provides M wavelength currents for powering N light sources, according to their wavelength according to a signal from computer 150. It is therefore possible to control the wavelength of light reaching sensors 130 using computer 150.
- one or more of the plurality light sources 120-n are selected to provide light at one of m wavelengths of light, and are each powered by the same signal Pm.
- Power controller 170 is thus capable of accepting an signal from computer 150 and controlling the power delivered according the wavelength of light from the plurality of light sources 120.
- Examples of light sources 120 include, but are not limited to light-emitting diode (“LED”) elements.
- FIG. 1 also shows light paths F, S, and R, which are, respectively and for example as: path F from light sources 120 to sensor 131, as path S from light sources 120 through filter portion 141 and optional calibrated optical absorber 160 to sensor 133, and as path R from light sources 120 through filter portion 143 and optional calibrated optical absorber 160 to sensor 145.
- path F from light sources 120 to sensor 131
- path S from light sources 120 through filter portion 141 and optional calibrated optical absorber 160 to sensor 133
- path R from light sources 120 through filter portion 143 and optional calibrated optical absorber 160 to sensor 145.
- sensors 130 include, but are not limited to: optical sensors for the measurement of transmission through and/or reflection from particulate filters.
- One class of instruments is differential photometric analyzers, wherein the differences between sequential optical measurements are used to estimate particulate concentrations.
- Photometric particle analyzer 100 may be the differential photometric analyzer trademarked as the AETHALOMETER® (Magee Scientific Company, Berkeley CA) (see for example, United States Patent No.
- An optional calibrated optical absorber 160 which may be a neutral density filter, may be placed in the optical path to reduce the light reaching sensor 133 and 135 by a known, traceable and reproducible amount.
- Photometric particle analyzer 100 also includes a computer 150 includes a processor 151 and a memory 153.
- Memory 153 includes programming to control the operation and received data from light sources 120 and sensors 130.
- Memory 153 may also store, for example and without limitation, previous sensor outputs, including but not limited to background readings (without a filter, or with a fresh filter having no deposits), the results of previous measurements, and programming to permit computer 150 to execute mathematical algorithms to convert the sensor output into some indication of one or more constituents of interest.
- Computer 150 may also include display 157 to present an indication of a constituent of interest, which may be for example and without limitation, a concentration of a constituent of interest or a direct or indirect measurement related to the constituent of interest.
- Computer 150 may further include communications interface 155 which may be used to transmit an indication of a constituent of interest to another computer or system, either wirelessly or over a wired network.
- Computer 150 may also accept provide signals to control pump 108 and/or to accept input from flow controllers that may be associated with the pumps.
- Computer 150 can, in addition to controlling light sources 120, control the air flow according to the speed of pump 108. Certain models can control whether the air stream flowing through the sample collecting spots contains particles, or has been pre-filtered; those models not fitted with that option can instruct the external user to attach a particle filter. Models equipped with continuous-roll tape feed can advance the filter tape, thereby inserting fresh material into the optical path; models not fitted with that option can instruct the operator to insert a fresh filter.
- a baseline measurement is obtained with one or more sensors 130, where the optics and filter between light source 120 and the corresponding sensors 130 are clean. This baseline measurement may then be stored in memory 153.
- sensor 131 collects light as shown schematically as light path F
- sensor 133 collects light as shown schematically as light path R
- sensor 135 collects light as shown schematically as light path S.
- Signals generated by one or more of sensors 131, 133, and 135 from each of these paths may be stored in memory 153 and may used in various embodiments of the present invention, as follows. It is understood that certain methods described herein utilize the outputs from some or all of sensors 130, and thus certain methods may require that less than all of the outputs from all sensors 130 be stored in memory 153.
- Sensor 131 receives light from sources 120 that passes through optical element 110 without passing through volumes 112 or 114 or filter 140, as indicated as light path F.
- Sensor 131 provides an output SF maybe used to provide an indication of the intensity of light sources 120 to memory 153 of computer 150 which, may in turn, adjust drive currents to sources 120 to maintain a precisely fixed level of illumination intensity.
- Sensor 133 is located underneath filter area 143.
- Light from sources 120 passes through optical element 110, including volumes 112 and 114, and through filter area 143 and optional calibrated optical absorber, as indicated by light path R.
- Sensor 133 provides an output SR to memory 153 of computer 150, which may be used to provide an indication of light that passes though filter area 143. Since filter portion 141 collects nearly all of the particulates, there are little or no particulates for collection on filter area 143. Filter portion 143 is, however, subjected to a similar temperature and humidity as filter portion 141. Consequently, any effects of temperature or humidity on the optical properties of the filter material are common to all signals from which the aerosol concentration will be derived.
- Sensor 135 is located underneath filter area 141. Light from sources 120 passes through optical element 110, including volumes 112 and 114, and through filter area 141 and optional calibrated optical absorber, as indicated by light path S. Filter area 141 collects nearly all of the particulates in the air flow. Sensor 135 provides an output SS to memory 153 of computer 150, which may be used to provide an indication of light that passes though a collection of particles on filter area 141. The signal from sensor 135 is much less than that of sensor 131 or 133 due to optical absorption and/or scattering from filter area 141 and any particles collected thereon, and decreases with time as filter becomes progressively loaded with particles.
- certain embodiments of the present invention may automatically test the system response, such as the response of the light source and the light detectors, of an optical photometric particle analyzer, and provide a quantitative measure of a standardized response of the instrument that may be used to verify the analytical performance.
- the method may also provide a determination of the presence of contamination within the optical elements of the instrument, and enable a tentative identification of the nature of the contamination.
- Certain other embodiments of the present invention may thus be used to validate the performance of instruments used for the analysis of the concentration of particles suspended in an air flow stream. This can provide for an indication of any degradation in performance due to internal contamination, and thereby remotely and automatically indicate the need for intervention and service. Both of these actions increase the utility of the instrument, by allowing it to be installed remotely and yet, by means of a data link, have its performance checked by an agent at another location, either human or automatic.
- This invention achieves its result by an internal manipulation of the intensity of the light sources at one or at multiple optical wavelengths, using existing control electronics and hardware, requiring only added control software and numerical analysis of the measured results.
- the method produces both a validation of the instrument's analytical performance, as well as a measure of the degree and optical nature of contamination that will permit a determination of the need for intervention, remedy or cleaning.
- the performance test described herein requires no physical intervention with the instrument; may be activated either by remote control or by a predetermined routine internal to the instrument; and the results may be transmitted by a data link to a remote observer or controller, either human or automatic. This permits the automatic external or self-diagnosis of an analyzer that may be located remotely, and allows for human operators or automatic systems to determine the need for intervention, remedy or cleaning.
- AETHALOMETER® There are several conditions which affect the performance of a photometric particle analyzer such as the AETHALOMETER®. These include, but are not limited to: contamination of the instrument's optics, degradation of the output of the instrument's light sources, and changes in the response function of the instrument.
- Contamination of the instrument's optics may occur in many ways since the instruments typically include light sources that transmit light through several optical elements which permit the flow of the air stream containing the particles to be measured.
- the surfaces of these optical elements may gradually become contaminated with a deposit of dust from the air stream; precipitated or deposited films of compounds passing through in a semi-volatile vapor phase; or the drawing in through the suction port of macroscopic contaminants such as small pieces of foreign materials including leaf fragments, feather fragments, small insects and other items that may have been suspended in the air near the intake sampling tube of the instrument.
- the presence of any of these contaminants on the surfaces of the optical elements will reduce the intensity of light reaching the filtration areas of interest.
- Degradation of the instrument's light sources occurs over time as the performance of the light source, such as the output of LEDs can degrade. If the source efficiency gradually decreases, then the same level of drive current power will produce less light and more heat within the LED chip element. Self- heating of the source will accentuate this effect and will lead to a loss of linearity between the drive current input and the light flux output.
- a change in the instrument's response function is another source of potential error.
- the AETHALOMETER® derives its data from precise measurements of optical intensity signals. It is necessary to assume that the electronic signal from the detectors is indeed precisely proportional to the intensity of light incident on the detector. To validate the principle of the instrument, this assumption must be tested and verified. This validation is performed by switching the LED light sources on and then inserting into the optical path an absorbing element of known optical density, which is known to pass only a certain fraction of the light incident on it. Detector signals are measured with the calibrated absorber either inserted into the optical path or removed, and the proportionality of detector response may be verified. This process requires manual intervention and disruption of the routine operation of the instrument.
- the following illustrates the use of the outputs SF, SR, and SS for testing the performance of photometric particle analyzer 100 to determine contamination of optics due to dust (secton 1A), deposition of vapor films (section 1B), "macroscopic" items (section 1C), to determine degradation of optical sources (section 2), and to verify calibration and linearity of detectors (section 3). It is to be understood that each of these tests is or may be independent of the others, and that certain embodiments of the present invention require the programming and storage of information in photometric particle analyzer 100 corresponding to the test being performed. Alterneratively, photometric particle analyzer 100 may be configures to perform all of the tests described subseqently.
- Fresh filter areas 141 and 143 are provided to photometric particle analyzer 100. If filter 140 is in the form of a roll that can be progressively moved through photometric particle analyzer 100 by the action of computer 150, the photometric particle analyzer advances filter 140 to provide a fresh, clean, particle-free areas 141 and 143. If using individually-placed filters, the photometric particle analyzer 100 will instruct the operator to insert a fresh filter 140.
- Filtered air is provided to inlet 101, either by the photometric particle analyzer 100 instructing the operator to attach an external air filter, or by switching flow through an air filter, if one is provided with the photometric particle analyzer 100.
- Air flow is then stopped in the photometric particle analyzer 100, which may occur, for example, by computer 150 instructing pump 108 to stop.
- the purpose of stopping the flow this is to eliminate any possibility of the incremental collection of any particles during the test sequence; and also to eliminate any perturbations to the filter optical properties due to active air flow.
- Light sources 120 are illuminated according to their wavelength.
- computer 150 instructs 170 to apply current drive levels Pm to each wavelength M in a sequence of steps, starting from a zero light source output to 100% of a maximum light source output.
- the light sources may be driven with currents ranging from 0% to 100% of a maximum drive current level. These currents may, for example but not necessarily, be in the sequence of 0% - 10% - 20% - 30% - ... - 90% - 100%.
- the light sources may be conditioned to their microscopic temperature, for example with the power sequence preceding each analytical power level with a certain time at 100% power, in order to heat each light source to its normal operating temperature.
- the power sequence may therefore be, for example but not necessarily: 0%; 100%; 10%; 100%; 20%; 100%; 30%; .... 100%; 80%; 100%; 90%; 100%.
- the diagnostic data array Y is then processed in computer 150 by an algorithm to yield a report or analytical result locally.
- the array Y of raw diagnostic data values may be saved, either locally within computer 150, or remotely, by transmission of data; together with other instrumental operational parameters such as date, time, operational history, total flow of air through the instrument, total flow of Black Carbon content, and any other information that may be relevant to an assessment of the performance and condition of the instrument.
- This data may be compared with diagnostic data previously collected at an earlier time, to determine any change in the result which may indicate a possible deterioration of the instrument; the ingress of contamination; or any other performance metric whose tracking permits assessment of the need for intervention or service.
- Diagnostic data array Y may be recorded and stored in computer 150 as a baseline measurement in a diagnostic array Y0 when photometric particle analyzer 100 is first manufactured - that is with clean optics and filter. As discussed subsequently, different outputs (combinations of SF, SR, and SS) may be used for different diagnostics or calibrations. It will be understood that all of the information from diagnostic data array may thus be stored, or some subset may be stored, as needed. Diagnostic data array Y may be processed in many different ways, which may be for example and without limitation as follows:
- the diagnostic routine may be performed. This will establish a baseline diagnostic data array, Y0(i,m,j).
- the ratios may (or may not) be different for the different wavelengths M, since the light at different wavelengths is emitted from different source elements at different positions on the source assembly. It is therefore expected that the intensity ratios SS/SF and SR/SF will be different for the different wavelengths M. These ratios will be recorded when the instrument is first manufactured and all internal optical components are scrupulously clean.
- the data processing routine of computer 150 may determine the signal ratios SS/SF and SR/SF as a function of wavelength M when the optical sources are operated at their normal power level. These ratios measured at the time of the performance test will be compared against the baseline ratios stored from measurements made when the instrument was first constructed and all optical elements were perfectly clean (that is, as calculated from baseline diagnostic array Y0).
- Dust or precipitated aerosol particles scatter light. Dust may be present in volume 112, but will not be present in volume 114, since filter 140 removes dust from air flow A. Consequently, contamination effects will be observed primarily in the SS signal. It should be noted that the scattering of light from the inner surfaces of the air passages may affect the general distribution of light within the optical insert, and therefore the SR signal may also be affected, although to a lesser degree. This scattering of light will increase at shorter wavelengths. For particles much smaller than the wavelength of the incident light, scattering is proportional to the 5 th power of the inverse wavelength. For particles much larger than the wavelength of the incident light, scattering is proportional to the 2 nd power of the inverse wavelength. These relationships transition smoothly in such a way that the reduction in relative light intensity will be a smooth function of wavelength for the various sources M, yet increasing greatly towards the shorter wavelengths of the range spanned by the optical source.
- Contamination by "dust” will therefore show a characteristic signature, being notable in the SS signal; greatly reduced if apparent at all in the SR signal; and with a steady increase in effect from longer to shorter wavelengths.
- a model of the effect of dust may thus be used to generate an output indicative of the presence of dust.
- the ratio of the signals SS/SF that is, ⁇ Y(3,m,j)/Y(1,m,j) ⁇ / ⁇ Y0(3,m,j)/Y0(1,m,j) ⁇ for some value of power (j) varies with wavelength ( ⁇ (m)) by an inverse power of 2 to 5, then a diagnostic signal indicating the presence of dust may be provided by computer 150.
- pollutants include cigarette smoke, and the smoke from biomass combustion.
- These vapors can deposit onto surfaces and, over time, can create a film on the interior of the air passages within the optical insert of an Aethalometer.
- These vapors will pass into volume 112 and 114. Consequently, there is the possibility of the deposition of a film of material on all air passages within the optical element.
- the optical absorption of these materials will typically be very small at longer wavelengths, from the infra-red to the yellow portion of the spectrum; but increasing very rapidly at the shorter wavelengths from the blue to the near-ultraviolet.
- a film of organic material is deposited within the optics due to the passage of smokes containing volatile components, this will be expected to have a characteristic spectral signature that will aid in its identification.
- the ratio of the signals SS/SF that is, ⁇ Y(3,m,j)/Y(1,m,j) ⁇ / ⁇ Y0(3,m,j)/Y0(1,m,j) ⁇ for some value of power (j) varies with wavelength ( ⁇ (m)) showing little wavelength dependence at longer wavelengths (infra-red to yellow); but strongly increasing absorption at the shortest wavelengths (blue to ultra-violet); a diagnostic signal indicating the presence of a deposited organic film may be provided by computer 150.
- Particles of visible size can be drawn into photometric particle analyzer 100 by pump 108. Examples that have been observed include fragments of leaves; fragments of feathers; small insects; visible specks of material; and other items that could have been suspended in the air in the immediate vicinity of the sample inlet hose. If items of this nature become lodged and/or move through photometric particle analyzer 100, they may create very large perturbations is signals SR and SS that may change significantly over time. Particles of visible size are expected to only be measured in the SS signal, as the air must pass through the filter 140 before entering volume 114.
- Particles of visible size may block the transmission of light equally at all wavelengths M.
- the characteristic signature of the presence of a piece of macroscopic contamination will be a large change in SS; relatively uniform for all wavelengths M, and no change in SR. Because of the possibility of movement of the macroscopic item under the influence of air flow, it is desirable that the diagnostic test be performed at zero air flow.
- a diagnostic signal indicating the presence of macroscopic particles may be provided by computer 150.
- the detector signal SF is expected to be a monotonic function of the power level (that is, j index) although not necessarily perfectly linear, depending on the internal characteristics of the light source 120 elements which may include a temperature dependence affected by self-heating.
- the original signals SF 0 (m,j) will be recorded for each M wavelength at each power level, j.
- the same routine will be followed and the array of signals SF(m, j) will be recorded.
- Other effects such as changes in relative mechanical positioning or alignment; aging of the transparent material of the optical element; etc.; may lead to overall changes in the scaling magnitude of these signals.
- the progression of intensities should not change as a function of drive current power level j.
- Changes in the emission characteristics of the sources may be detected by monitoring the intensities at the time of subsequent testing relative to the intensities measured at the time of the initial measurement, and interpreting the change in this relative parameter as a possible indication of the degradation of sources.
- This ratio is expected to be equal to 1 if the optical source output as a function of drive current has not changed from the time of manufacture to the time of test.
- This test can be performed for all light sources 120, as a function of wavelength m across the range of drive current power levels j to determine any changes in performance of the optical source elements. In this way, aging or loss of intensity of the sources can be detected. Thus, for example and without limitation, if ⁇ Y(1,m,j)/Y0(1,m,j) ⁇ / ⁇ Y(1,m,1)/Y0(1,m,1) ⁇ is greater than 1.01 or less than 0.99 then a diagnostic signal indicating the degradation of optical source 120 may be provided by computer 150.
- Sensors 131, 133, and 135 each receive light emanating from the source assembly. Sensors 133 and 135 are located underneath filter 140; sensor 131 is located to the side of filter 140. It was noted above that the presence of contamination in the optical element is expected to reduce the intensity signals SS and SR channels relative to SF, and with a wavelength dependence that may be indicative of the nature of the contamination. Consequently, it is not possible to use the relative intensities of signals SF, SR, or SF at any given drive current power level to deduce the detectors' performance, since the absolute intensities will be affected by the presence of contamination.
- a calibrated optical element for example neutral density filter 160
- the intensity of light reaching sensors 133 and 135 will be reduced, while the intensity of light reaching sensor 131 will be unaffected.
- the following routine may then be performed on a brand-new instrument to establish a baseline response of sensors 130, where deviations from the original values may be interpreted as changes in the performance of sensors 130.
- comparison of the results from the subsequent automatic diagnostic routine with those from the initial optical calibration routine using the known optical absorber (for example neutral density filter 160 ) permit a verification of the continuing performance of the sensors 130 that may be referenced back to the known and traceable properties of the calibrator.
- the optical drive current level Pm is ramped up in steps from zero to its maximum level.
- the signals Y0(i,m,j) are recorded for each sensor 130.
- a mathematical relation, such as a polynomial fit, will be calculated for the relationship between Y0(i,m,j) and the drive current Pm for each sensor 130 at each wavelength m ( ⁇ (m)). This fit may or may not be perfectly linear; and may or may not contain a zero offset intercept representing the digital signal reported to the electronics even at zero optical drive current.
- the functions may then be averaged over the number of all sensors 130 to yield a composite response of the average sensor 130 as a function of drive current.
- the deviations between any individual detector signal Y0(i,m,j) relative to the average Y 0,av (j) are calculated and saved.
- the signals from the "shaded" sensors 133 and 135 are reduced relative to the signal from the "unshaded” sensor 131.
- the same mathematical relations, such as the polynomial fits, are performed on data Y(i,m,j) as a function of drive current Pm(j).
- the relationship of this reduction in intensity to the known and traceable property of neutral density filter 160 provides a calibration of the relationship between optical signal reported and a known degree of Optical Density. This constitutes the primary photometric calibration photometric particle analyzer 100. This relation may be different for the different wavelengths m, but is expected to be repeatable.
- the relative values of the "shaded" to "unshaded” signals such as the ratio ⁇ Y(i,m,j)/Y(1,m,j) ⁇ are calculated after subtraction of the zero offset intercepts. From the polynomial fit parameters, the proportional increase in drive current that would be required to bring the signal to its previous level may be calculated, before the insertion of neutral density filter 160. This proportion factor is calculated for the "shaded” signal R and S for the lower ranges of drive power (small j's) such that the calculated drive current remains within the operating range.
- the average of this calculation establishes the relationship between the known degree of absorption due to the Optical Density of neutral density filter 160, and the proportional increase in optical source drive current required to overcome the absorption and restore the signals to their previous levels.
- step (i) the optical drive current level Pm is ramped up in steps from zero to its maximum level.
- the optical sources are conditioned at 100% power before being reverted for testing at the j th level power.
- the signals Y2(i,m,j) are recorded for each sensor 130.
- a mathematical polynomial fit may then be calculated for the relationship between Y2(i,m,j) and the drive current Pm for each sensor 130 at each wavelength m.
- the effects of degradation of the optical sources may reduce the intensity of the signal Y2 (1,m,j) from sensor 131, as a function of drive current power Pm for the various wavelength sources M.
- the relationship between emitted intensity and drive current Pm can not be expected to remain constant.
- the effects of contamination may reduce the magnitude of the signals from the S and R detectors relative to the emitted source intensity, to a degree that may differ between the three detectors and which will be a function of wavelength.
- the fractional loss of signal intensity due to contamination is not expected to be a function of the optical intensity level itself, i.e. will not be a function of optical drive current Pm. Therefore, the relative proportionality between any of the detectors' signals and their geometric mean will not be expected to be a function of drive level Pm, unless there is a loss of linearity.
- the mathematical processing will therefore consist of calculating a polynomial fit to Y2(i,m,j) as a function of Pm(j), subtracting the zero offset intercept, and calculating the geometric mean of the signals at each power level Pm(j).
- the ratio of each individual signal to this mean ⁇ Y2(i,m,j)/Y2(mean) (m,j) ⁇ may be a constant factor but should not be a function of drive level, j, unless there is the onset of non-linearity in one of the detectors.
- any deviation in a signal detector's output as a function of optical intensity - i.e. any non-linearity - can be converted to an equivalent fractional increase in optical drive that would be necessary to overcome it, given the mathematical fit to signal versus drive current.
- This can be converted to an equivalent effect of change in intensity due to the effect of a known, calibrated and traceable amount of Optical Density due to the insertion of an optical absorber (for example a neutral density filter 160 ).
- an optical absorber for example a neutral density filter 160
- any deviation in linearity of any photo-detector can be expressed in terms that can be related to an external standard.
- the linearity of the system can be remotely checked and verified to meet required performance standards by means of the operations described above of increasing, or ramping, the optical drive current through a sequence of steps and recording the signals from the photo-detectors.
- a diagnostic signal indicating the onset of non-linearity in one of the sensors 130 is provided by computer 150.
- each of the methods described herein is in the form of a computer program that executes on a processing system, e.g., a one or more processors.
- a processing system e.g., a one or more processors.
- embodiments of the present invention may be embodied as a method, an apparatus such as a special purpose apparatus, an apparatus such as a data processing system, or a carrier medium, e.g., a computer program product.
- the carrier medium carries one or more computer readable code segments for controlling a processing system to implement a method.
- aspects of the present invention may take the form of a method, an entirely hardware embodiment, an entirely software embodiment or an embodiment combining software and hardware aspects.
- the present invention may take the form of carrier medium (e.g., a computer program product on a computer-readable storage medium) carrying computer-readable program code segments embodied in the medium.
- carrier medium e.g., a computer program product on a computer-readable storage medium
- Any suitable computer readable medium may be used including a magnetic storage device such as a diskette or a hard disk, or an optical storage device such as a CD-ROM.
- the invention is not limited to a specific coding method. Furthermore, the invention is not limited to any one type of network architecture and method of encapsulation, and thus may be utilized in conjunction with one or a combination of other network architectures/protocols.
Landscapes
- Physics & Mathematics (AREA)
- Chemical & Material Sciences (AREA)
- Immunology (AREA)
- Biochemistry (AREA)
- Pathology (AREA)
- Health & Medical Sciences (AREA)
- Life Sciences & Earth Sciences (AREA)
- General Physics & Mathematics (AREA)
- Analytical Chemistry (AREA)
- General Health & Medical Sciences (AREA)
- Dispersion Chemistry (AREA)
- Theoretical Computer Science (AREA)
- Mathematical Physics (AREA)
- Engineering & Computer Science (AREA)
- Spectroscopy & Molecular Physics (AREA)
- Investigating Or Analysing Materials By Optical Means (AREA)
Applications Claiming Priority (1)
| Application Number | Priority Date | Filing Date | Title |
|---|---|---|---|
| US201161450536P | 2011-03-08 | 2011-03-08 |
Publications (3)
| Publication Number | Publication Date |
|---|---|
| EP2498079A2 true EP2498079A2 (de) | 2012-09-12 |
| EP2498079A3 EP2498079A3 (de) | 2017-11-15 |
| EP2498079B1 EP2498079B1 (de) | 2018-12-19 |
Family
ID=45976653
Family Applications (1)
| Application Number | Title | Priority Date | Filing Date |
|---|---|---|---|
| EP12158553.3A Active EP2498079B1 (de) | 2011-03-08 | 2012-03-08 | Verfahren zur automatischen Durchführung der Leistungsdiagnose eines photometrischen Partikelanalysators |
Country Status (2)
| Country | Link |
|---|---|
| US (2) | US9018583B2 (de) |
| EP (1) | EP2498079B1 (de) |
Families Citing this family (15)
| Publication number | Priority date | Publication date | Assignee | Title |
|---|---|---|---|---|
| US8411272B2 (en) * | 2008-08-04 | 2013-04-02 | Magee Scientific Corporation | Method and apparatus for the analysis of materials |
| US20120096925A1 (en) * | 2010-10-22 | 2012-04-26 | Magee Scientific Corporation | Method and analyzer for determining the content of carbon-containing particles filtered from an air stream |
| DE102011079938A1 (de) * | 2011-07-27 | 2013-01-31 | Endress + Hauser Conducta Gesellschaft für Mess- und Regeltechnik mbH + Co.KG | Optikmodul zur Bestimmung zumindest einer physikalischen oder chemischen Prozessgröße, insbesondere der Konzentration zumindest einer Komponente eines Mediums |
| JP6207321B2 (ja) * | 2013-09-26 | 2017-10-04 | ローム株式会社 | 光センサ装置 |
| EP2937680B1 (de) * | 2014-04-24 | 2017-12-27 | Aerosol d.o.o. | Verfahren und vorrichtung zur analyse von materialien |
| US10495573B1 (en) | 2018-06-13 | 2019-12-03 | Julien J. Caubel | Instrument for measuring airborne particulate matter |
| WO2019006017A1 (en) * | 2017-06-28 | 2019-01-03 | Caubel Julien J | INSTRUMENT FOR MEASURING AIRBORNE PARTICULATE MATTER |
| US11479158B2 (en) * | 2017-10-04 | 2022-10-25 | Fg Products, Inc. | Divider panel systems and methods for their manufacturing and installation |
| WO2019115690A1 (en) * | 2017-12-15 | 2019-06-20 | Ams International Ag | Integrated filter-based particulate matter sensors |
| KR101960226B1 (ko) * | 2018-10-15 | 2019-03-20 | 주식회사 신코 | 블랙카본 측정장치 |
| US11492967B2 (en) | 2019-07-03 | 2022-11-08 | Raytheon Technologies Corporation | Particulate ingestion sensor for gas turbine engines |
| US10845294B1 (en) * | 2019-07-03 | 2020-11-24 | Raytheon Technologies Corporation | Systems and methods for particulate ingestion sensing in gas turbine engines |
| CN116583735A (zh) * | 2020-10-30 | 2023-08-11 | 贝克顿·迪金森公司 | 用于表征和编码光检测系统的方法和系统 |
| CN115876653A (zh) * | 2021-09-29 | 2023-03-31 | 佛山市顺德区美的洗涤电器制造有限公司 | 检测工装和标定方法 |
| TWI856387B (zh) | 2022-10-07 | 2024-09-21 | 新加坡商兆晶生物科技股份有限公司(新加坡) | 光學分析系統及光學分析方法 |
Citations (2)
| Publication number | Priority date | Publication date | Assignee | Title |
|---|---|---|---|---|
| US4893934A (en) | 1988-01-25 | 1990-01-16 | The United States Of America As Represented By The United States Department Of Energy | Aethalometer |
| US7038765B2 (en) | 2002-08-28 | 2006-05-02 | Deutsches Zentrum für Luft- und Raumfahet e.V. | Method of optically measuring black carbon in the atmosphere and apparatus for carrying out the method |
Family Cites Families (7)
| Publication number | Priority date | Publication date | Assignee | Title |
|---|---|---|---|---|
| US4231663A (en) * | 1979-03-16 | 1980-11-04 | Phillippi Conrad M | Device for calibrating the photometric linearity of optical instruments |
| US7788969B2 (en) * | 2006-11-28 | 2010-09-07 | Cummins Filtration Ip, Inc. | Combination contaminant size and nature sensing system and method for diagnosing contamination issues in fluids |
| US7605920B2 (en) * | 2007-01-29 | 2009-10-20 | Ge Homeland Protection, Inc. | Detector system for unidentified substances |
| US8411272B2 (en) * | 2008-08-04 | 2013-04-02 | Magee Scientific Corporation | Method and apparatus for the analysis of materials |
| US20100111792A1 (en) * | 2008-09-19 | 2010-05-06 | Nelson Edward D | Atmospheric molecular respirator |
| US8319183B2 (en) * | 2008-10-31 | 2012-11-27 | Corning Incorporated | Methods of characterizing and measuring particulate filter accumulation |
| US8531671B1 (en) * | 2009-12-05 | 2013-09-10 | Magee Scientific Corporation | Apparatus and methods for determining the concentration of black carbon particles in a combustion exhaust |
-
2012
- 2012-03-06 US US13/413,580 patent/US9018583B2/en active Active
- 2012-03-08 EP EP12158553.3A patent/EP2498079B1/de active Active
-
2015
- 2015-04-17 US US14/690,288 patent/US20160069787A1/en not_active Abandoned
Patent Citations (2)
| Publication number | Priority date | Publication date | Assignee | Title |
|---|---|---|---|---|
| US4893934A (en) | 1988-01-25 | 1990-01-16 | The United States Of America As Represented By The United States Department Of Energy | Aethalometer |
| US7038765B2 (en) | 2002-08-28 | 2006-05-02 | Deutsches Zentrum für Luft- und Raumfahet e.V. | Method of optically measuring black carbon in the atmosphere and apparatus for carrying out the method |
Non-Patent Citations (1)
| Title |
|---|
| BOND, T.C.; ANDERSON, T.L.; CAMPBELL, D.: "Calibration and intercomparison of filter-based measurements of visible light absorption by aerosols", AEROSOL SCIENCE AND TECHNOLOGY, vol. 30, 1999, pages 582 - 600, XP009122915 |
Also Published As
| Publication number | Publication date |
|---|---|
| US20120229798A1 (en) | 2012-09-13 |
| US20160069787A1 (en) | 2016-03-10 |
| EP2498079A3 (de) | 2017-11-15 |
| EP2498079B1 (de) | 2018-12-19 |
| US9018583B2 (en) | 2015-04-28 |
Similar Documents
| Publication | Publication Date | Title |
|---|---|---|
| EP2498079B1 (de) | Verfahren zur automatischen Durchführung der Leistungsdiagnose eines photometrischen Partikelanalysators | |
| US9804082B2 (en) | Method for automatic performance diagnosis and calibration of a photometric particle analyzer | |
| US8351035B2 (en) | Particulate detection and calibration of sensors | |
| CN101201319B (zh) | 近红外光谱仪 | |
| US6055052A (en) | System for, and method of, monitoring airborne particulate, including particulate of the PM2.5 class | |
| US8379202B2 (en) | Method for detecting contaminants | |
| CN106461539A (zh) | 具有可变光学路径长度池的分光光度计 | |
| US8411272B2 (en) | Method and apparatus for the analysis of materials | |
| CN101403689A (zh) | 一种植物叶片生理指标无损检测方法 | |
| SE468782B (sv) | Gasanalysator | |
| CN100590416C (zh) | 双光路光电探测器及其检测光衰减量的方法 | |
| US12253461B2 (en) | Open-loop/closed-loop process control on the basis of a spectroscopic determination of undetermined substance concentrations | |
| US9671324B2 (en) | Method and apparatus to compensate analytical devices that collect constituents of interest on a filter for the effect of filter loading | |
| CN111929269A (zh) | 抗水汽干扰的三通道红外甲烷探测器 | |
| CN111751483A (zh) | 一种基于多波长光源的有机碳-元素碳浓度的监测设备 | |
| CN114813611B (zh) | 一种自动化植物净固碳能力测定系统及测定方法 | |
| CN202149879U (zh) | 多组分油烟浓度定量分析装置 | |
| CN201555801U (zh) | 一种液体样本特征光谱采集装置 | |
| CN109211744B (zh) | 光学法颗粒状物质测定装置及方法 | |
| EP3502658A1 (de) | Vorrichtung zur bestimmung der eigenschaften eines probenstroms | |
| CN219084697U (zh) | 一种黑碳气溶胶测量系统 | |
| CN114486654B (zh) | 粉尘仪及其工作方法 | |
| KR20170100907A (ko) | 블랙카본 측정 장치 | |
| JP2016050888A (ja) | 大気中浮遊微粒子濃度測定方法及び装置 | |
| GB2470595A (en) | Method and apparatus for determining the mass of a sample of gas entrained particles |
Legal Events
| Date | Code | Title | Description |
|---|---|---|---|
| PUAI | Public reference made under article 153(3) epc to a published international application that has entered the european phase |
Free format text: ORIGINAL CODE: 0009012 |
|
| AK | Designated contracting states |
Kind code of ref document: A2 Designated state(s): AL AT BE BG CH CY CZ DE DK EE ES FI FR GB GR HR HU IE IS IT LI LT LU LV MC MK MT NL NO PL PT RO RS SE SI SK SM TR |
|
| AX | Request for extension of the european patent |
Extension state: BA ME |
|
| PUAL | Search report despatched |
Free format text: ORIGINAL CODE: 0009013 |
|
| AK | Designated contracting states |
Kind code of ref document: A3 Designated state(s): AL AT BE BG CH CY CZ DE DK EE ES FI FR GB GR HR HU IE IS IT LI LT LU LV MC MK MT NL NO PL PT RO RS SE SI SK SM TR |
|
| AX | Request for extension of the european patent |
Extension state: BA ME |
|
| RIC1 | Information provided on ipc code assigned before grant |
Ipc: G01N 15/10 20060101ALI20171009BHEP Ipc: G01N 21/59 20060101ALI20171009BHEP Ipc: G01N 21/27 20060101ALI20171009BHEP Ipc: G01J 1/00 20060101ALI20171009BHEP Ipc: G01N 21/25 20060101ALI20171009BHEP Ipc: G01N 15/06 20060101AFI20171009BHEP |
|
| STAA | Information on the status of an ep patent application or granted ep patent |
Free format text: STATUS: REQUEST FOR EXAMINATION WAS MADE |
|
| 17P | Request for examination filed |
Effective date: 20180515 |
|
| RBV | Designated contracting states (corrected) |
Designated state(s): AL AT BE BG CH CY CZ DE DK EE ES FI FR GB GR HR HU IE IS IT LI LT LU LV MC MK MT NL NO PL PT RO RS SE SI SK SM TR |
|
| GRAP | Despatch of communication of intention to grant a patent |
Free format text: ORIGINAL CODE: EPIDOSNIGR1 |
|
| STAA | Information on the status of an ep patent application or granted ep patent |
Free format text: STATUS: GRANT OF PATENT IS INTENDED |
|
| RIC1 | Information provided on ipc code assigned before grant |
Ipc: G01J 1/00 20060101ALI20180605BHEP Ipc: G01N 21/59 20060101ALI20180605BHEP Ipc: G01N 15/06 20060101AFI20180605BHEP Ipc: G01N 21/27 20060101ALI20180605BHEP Ipc: G01N 15/10 20060101ALI20180605BHEP Ipc: G01N 21/25 20060101ALI20180605BHEP |
|
| INTG | Intention to grant announced |
Effective date: 20180628 |
|
| GRAS | Grant fee paid |
Free format text: ORIGINAL CODE: EPIDOSNIGR3 |
|
| GRAA | (expected) grant |
Free format text: ORIGINAL CODE: 0009210 |
|
| STAA | Information on the status of an ep patent application or granted ep patent |
Free format text: STATUS: THE PATENT HAS BEEN GRANTED |
|
| AK | Designated contracting states |
Kind code of ref document: B1 Designated state(s): AL AT BE BG CH CY CZ DE DK EE ES FI FR GB GR HR HU IE IS IT LI LT LU LV MC MK MT NL NO PL PT RO RS SE SI SK SM TR |
|
| REG | Reference to a national code |
Ref country code: GB Ref legal event code: FG4D |
|
| REG | Reference to a national code |
Ref country code: CH Ref legal event code: EP |
|
| REG | Reference to a national code |
Ref country code: IE Ref legal event code: FG4D |
|
| REG | Reference to a national code |
Ref country code: DE Ref legal event code: R096 Ref document number: 602012054770 Country of ref document: DE |
|
| REG | Reference to a national code |
Ref country code: AT Ref legal event code: REF Ref document number: 1079246 Country of ref document: AT Kind code of ref document: T Effective date: 20190115 |
|
| REG | Reference to a national code |
Ref country code: NL Ref legal event code: MP Effective date: 20181219 |
|
| PG25 | Lapsed in a contracting state [announced via postgrant information from national office to epo] |
Ref country code: BG Free format text: LAPSE BECAUSE OF FAILURE TO SUBMIT A TRANSLATION OF THE DESCRIPTION OR TO PAY THE FEE WITHIN THE PRESCRIBED TIME-LIMIT Effective date: 20190319 Ref country code: NO Free format text: LAPSE BECAUSE OF FAILURE TO SUBMIT A TRANSLATION OF THE DESCRIPTION OR TO PAY THE FEE WITHIN THE PRESCRIBED TIME-LIMIT Effective date: 20190319 Ref country code: HR Free format text: LAPSE BECAUSE OF FAILURE TO SUBMIT A TRANSLATION OF THE DESCRIPTION OR TO PAY THE FEE WITHIN THE PRESCRIBED TIME-LIMIT Effective date: 20181219 Ref country code: LT Free format text: LAPSE BECAUSE OF FAILURE TO SUBMIT A TRANSLATION OF THE DESCRIPTION OR TO PAY THE FEE WITHIN THE PRESCRIBED TIME-LIMIT Effective date: 20181219 Ref country code: LV Free format text: LAPSE BECAUSE OF FAILURE TO SUBMIT A TRANSLATION OF THE DESCRIPTION OR TO PAY THE FEE WITHIN THE PRESCRIBED TIME-LIMIT Effective date: 20181219 Ref country code: FI Free format text: LAPSE BECAUSE OF FAILURE TO SUBMIT A TRANSLATION OF THE DESCRIPTION OR TO PAY THE FEE WITHIN THE PRESCRIBED TIME-LIMIT Effective date: 20181219 |
|
| REG | Reference to a national code |
Ref country code: LT Ref legal event code: MG4D |
|
| REG | Reference to a national code |
Ref country code: AT Ref legal event code: MK05 Ref document number: 1079246 Country of ref document: AT Kind code of ref document: T Effective date: 20181219 |
|
| PG25 | Lapsed in a contracting state [announced via postgrant information from national office to epo] |
Ref country code: GR Free format text: LAPSE BECAUSE OF FAILURE TO SUBMIT A TRANSLATION OF THE DESCRIPTION OR TO PAY THE FEE WITHIN THE PRESCRIBED TIME-LIMIT Effective date: 20190320 Ref country code: AL Free format text: LAPSE BECAUSE OF FAILURE TO SUBMIT A TRANSLATION OF THE DESCRIPTION OR TO PAY THE FEE WITHIN THE PRESCRIBED TIME-LIMIT Effective date: 20181219 Ref country code: RS Free format text: LAPSE BECAUSE OF FAILURE TO SUBMIT A TRANSLATION OF THE DESCRIPTION OR TO PAY THE FEE WITHIN THE PRESCRIBED TIME-LIMIT Effective date: 20181219 Ref country code: SE Free format text: LAPSE BECAUSE OF FAILURE TO SUBMIT A TRANSLATION OF THE DESCRIPTION OR TO PAY THE FEE WITHIN THE PRESCRIBED TIME-LIMIT Effective date: 20181219 |
|
| PG25 | Lapsed in a contracting state [announced via postgrant information from national office to epo] |
Ref country code: NL Free format text: LAPSE BECAUSE OF FAILURE TO SUBMIT A TRANSLATION OF THE DESCRIPTION OR TO PAY THE FEE WITHIN THE PRESCRIBED TIME-LIMIT Effective date: 20181219 |
|
| PG25 | Lapsed in a contracting state [announced via postgrant information from national office to epo] |
Ref country code: PL Free format text: LAPSE BECAUSE OF FAILURE TO SUBMIT A TRANSLATION OF THE DESCRIPTION OR TO PAY THE FEE WITHIN THE PRESCRIBED TIME-LIMIT Effective date: 20181219 Ref country code: IT Free format text: LAPSE BECAUSE OF FAILURE TO SUBMIT A TRANSLATION OF THE DESCRIPTION OR TO PAY THE FEE WITHIN THE PRESCRIBED TIME-LIMIT Effective date: 20181219 Ref country code: PT Free format text: LAPSE BECAUSE OF FAILURE TO SUBMIT A TRANSLATION OF THE DESCRIPTION OR TO PAY THE FEE WITHIN THE PRESCRIBED TIME-LIMIT Effective date: 20190419 Ref country code: CZ Free format text: LAPSE BECAUSE OF FAILURE TO SUBMIT A TRANSLATION OF THE DESCRIPTION OR TO PAY THE FEE WITHIN THE PRESCRIBED TIME-LIMIT Effective date: 20181219 Ref country code: ES Free format text: LAPSE BECAUSE OF FAILURE TO SUBMIT A TRANSLATION OF THE DESCRIPTION OR TO PAY THE FEE WITHIN THE PRESCRIBED TIME-LIMIT Effective date: 20181219 |
|
| PG25 | Lapsed in a contracting state [announced via postgrant information from national office to epo] |
Ref country code: IS Free format text: LAPSE BECAUSE OF FAILURE TO SUBMIT A TRANSLATION OF THE DESCRIPTION OR TO PAY THE FEE WITHIN THE PRESCRIBED TIME-LIMIT Effective date: 20190419 Ref country code: SM Free format text: LAPSE BECAUSE OF FAILURE TO SUBMIT A TRANSLATION OF THE DESCRIPTION OR TO PAY THE FEE WITHIN THE PRESCRIBED TIME-LIMIT Effective date: 20181219 Ref country code: RO Free format text: LAPSE BECAUSE OF FAILURE TO SUBMIT A TRANSLATION OF THE DESCRIPTION OR TO PAY THE FEE WITHIN THE PRESCRIBED TIME-LIMIT Effective date: 20181219 Ref country code: SK Free format text: LAPSE BECAUSE OF FAILURE TO SUBMIT A TRANSLATION OF THE DESCRIPTION OR TO PAY THE FEE WITHIN THE PRESCRIBED TIME-LIMIT Effective date: 20181219 Ref country code: EE Free format text: LAPSE BECAUSE OF FAILURE TO SUBMIT A TRANSLATION OF THE DESCRIPTION OR TO PAY THE FEE WITHIN THE PRESCRIBED TIME-LIMIT Effective date: 20181219 |
|
| REG | Reference to a national code |
Ref country code: DE Ref legal event code: R097 Ref document number: 602012054770 Country of ref document: DE |
|
| PLBE | No opposition filed within time limit |
Free format text: ORIGINAL CODE: 0009261 |
|
| STAA | Information on the status of an ep patent application or granted ep patent |
Free format text: STATUS: NO OPPOSITION FILED WITHIN TIME LIMIT |
|
| PG25 | Lapsed in a contracting state [announced via postgrant information from national office to epo] |
Ref country code: DK Free format text: LAPSE BECAUSE OF FAILURE TO SUBMIT A TRANSLATION OF THE DESCRIPTION OR TO PAY THE FEE WITHIN THE PRESCRIBED TIME-LIMIT Effective date: 20181219 Ref country code: AT Free format text: LAPSE BECAUSE OF FAILURE TO SUBMIT A TRANSLATION OF THE DESCRIPTION OR TO PAY THE FEE WITHIN THE PRESCRIBED TIME-LIMIT Effective date: 20181219 Ref country code: MC Free format text: LAPSE BECAUSE OF FAILURE TO SUBMIT A TRANSLATION OF THE DESCRIPTION OR TO PAY THE FEE WITHIN THE PRESCRIBED TIME-LIMIT Effective date: 20181219 |
|
| REG | Reference to a national code |
Ref country code: CH Ref legal event code: PL |
|
| 26N | No opposition filed |
Effective date: 20190920 |
|
| PG25 | Lapsed in a contracting state [announced via postgrant information from national office to epo] |
Ref country code: LU Free format text: LAPSE BECAUSE OF NON-PAYMENT OF DUE FEES Effective date: 20190308 |
|
| REG | Reference to a national code |
Ref country code: BE Ref legal event code: MM Effective date: 20190331 |
|
| PG25 | Lapsed in a contracting state [announced via postgrant information from national office to epo] |
Ref country code: LI Free format text: LAPSE BECAUSE OF NON-PAYMENT OF DUE FEES Effective date: 20190331 Ref country code: CH Free format text: LAPSE BECAUSE OF NON-PAYMENT OF DUE FEES Effective date: 20190331 Ref country code: IE Free format text: LAPSE BECAUSE OF NON-PAYMENT OF DUE FEES Effective date: 20190308 |
|
| PG25 | Lapsed in a contracting state [announced via postgrant information from national office to epo] |
Ref country code: BE Free format text: LAPSE BECAUSE OF NON-PAYMENT OF DUE FEES Effective date: 20190331 Ref country code: SI Free format text: LAPSE BECAUSE OF FAILURE TO SUBMIT A TRANSLATION OF THE DESCRIPTION OR TO PAY THE FEE WITHIN THE PRESCRIBED TIME-LIMIT Effective date: 20181219 |
|
| PG25 | Lapsed in a contracting state [announced via postgrant information from national office to epo] |
Ref country code: TR Free format text: LAPSE BECAUSE OF FAILURE TO SUBMIT A TRANSLATION OF THE DESCRIPTION OR TO PAY THE FEE WITHIN THE PRESCRIBED TIME-LIMIT Effective date: 20181219 |
|
| PG25 | Lapsed in a contracting state [announced via postgrant information from national office to epo] |
Ref country code: MT Free format text: LAPSE BECAUSE OF NON-PAYMENT OF DUE FEES Effective date: 20190308 |
|
| PG25 | Lapsed in a contracting state [announced via postgrant information from national office to epo] |
Ref country code: CY Free format text: LAPSE BECAUSE OF FAILURE TO SUBMIT A TRANSLATION OF THE DESCRIPTION OR TO PAY THE FEE WITHIN THE PRESCRIBED TIME-LIMIT Effective date: 20181219 |
|
| PG25 | Lapsed in a contracting state [announced via postgrant information from national office to epo] |
Ref country code: HU Free format text: LAPSE BECAUSE OF FAILURE TO SUBMIT A TRANSLATION OF THE DESCRIPTION OR TO PAY THE FEE WITHIN THE PRESCRIBED TIME-LIMIT; INVALID AB INITIO Effective date: 20120308 |
|
| PG25 | Lapsed in a contracting state [announced via postgrant information from national office to epo] |
Ref country code: MK Free format text: LAPSE BECAUSE OF FAILURE TO SUBMIT A TRANSLATION OF THE DESCRIPTION OR TO PAY THE FEE WITHIN THE PRESCRIBED TIME-LIMIT Effective date: 20181219 |
|
| PGFP | Annual fee paid to national office [announced via postgrant information from national office to epo] |
Ref country code: DE Payment date: 20250324 Year of fee payment: 14 |
|
| PGFP | Annual fee paid to national office [announced via postgrant information from national office to epo] |
Ref country code: FR Payment date: 20250312 Year of fee payment: 14 |
|
| PGFP | Annual fee paid to national office [announced via postgrant information from national office to epo] |
Ref country code: GB Payment date: 20250319 Year of fee payment: 14 |