EP2395332A1 - Spectroscopic analyzer and spectroscopic analysis method - Google Patents
Spectroscopic analyzer and spectroscopic analysis method Download PDFInfo
- Publication number
- EP2395332A1 EP2395332A1 EP20110169445 EP11169445A EP2395332A1 EP 2395332 A1 EP2395332 A1 EP 2395332A1 EP 20110169445 EP20110169445 EP 20110169445 EP 11169445 A EP11169445 A EP 11169445A EP 2395332 A1 EP2395332 A1 EP 2395332A1
- Authority
- EP
- European Patent Office
- Prior art keywords
- spectrum
- infrared
- infrared region
- sample
- measurement
- Prior art date
- Legal status (The legal status is an assumption and is not a legal conclusion. Google has not performed a legal analysis and makes no representation as to the accuracy of the status listed.)
- Withdrawn
Links
Images


Classifications
-
- G—PHYSICS
- G01—MEASURING; TESTING
- G01J—MEASUREMENT OF INTENSITY, VELOCITY, SPECTRAL CONTENT, POLARISATION, PHASE OR PULSE CHARACTERISTICS OF INFRARED, VISIBLE OR ULTRAVIOLET LIGHT; COLORIMETRY; RADIATION PYROMETRY
- G01J3/00—Spectrometry; Spectrophotometry; Monochromators; Measuring colours
- G01J3/28—Investigating the spectrum
- G01J3/457—Correlation spectrometry, e.g. of the intensity
-
- G—PHYSICS
- G01—MEASURING; TESTING
- G01N—INVESTIGATING OR ANALYSING MATERIALS BY DETERMINING THEIR CHEMICAL OR PHYSICAL PROPERTIES
- G01N21/00—Investigating or analysing materials by the use of optical means, i.e. using sub-millimetre waves, infrared, visible or ultraviolet light
- G01N21/17—Systems in which incident light is modified in accordance with the properties of the material investigated
- G01N21/25—Colour; Spectral properties, i.e. comparison of effect of material on the light at two or more different wavelengths or wavelength bands
- G01N21/31—Investigating relative effect of material at wavelengths characteristic of specific elements or molecules, e.g. atomic absorption spectrometry
- G01N21/35—Investigating relative effect of material at wavelengths characteristic of specific elements or molecules, e.g. atomic absorption spectrometry using infrared light
- G01N21/359—Investigating relative effect of material at wavelengths characteristic of specific elements or molecules, e.g. atomic absorption spectrometry using infrared light using near infrared light
-
- G—PHYSICS
- G01—MEASURING; TESTING
- G01N—INVESTIGATING OR ANALYSING MATERIALS BY DETERMINING THEIR CHEMICAL OR PHYSICAL PROPERTIES
- G01N21/00—Investigating or analysing materials by the use of optical means, i.e. using sub-millimetre waves, infrared, visible or ultraviolet light
- G01N21/17—Systems in which incident light is modified in accordance with the properties of the material investigated
- G01N21/55—Specular reflectivity
- G01N21/552—Attenuated total reflection
-
- G—PHYSICS
- G01—MEASURING; TESTING
- G01N—INVESTIGATING OR ANALYSING MATERIALS BY DETERMINING THEIR CHEMICAL OR PHYSICAL PROPERTIES
- G01N21/00—Investigating or analysing materials by the use of optical means, i.e. using sub-millimetre waves, infrared, visible or ultraviolet light
- G01N21/17—Systems in which incident light is modified in accordance with the properties of the material investigated
- G01N21/25—Colour; Spectral properties, i.e. comparison of effect of material on the light at two or more different wavelengths or wavelength bands
- G01N21/31—Investigating relative effect of material at wavelengths characteristic of specific elements or molecules, e.g. atomic absorption spectrometry
- G01N21/314—Investigating relative effect of material at wavelengths characteristic of specific elements or molecules, e.g. atomic absorption spectrometry with comparison of measurements at specific and non-specific wavelengths
- G01N2021/3155—Measuring in two spectral ranges, e.g. UV and visible
-
- G—PHYSICS
- G01—MEASURING; TESTING
- G01N—INVESTIGATING OR ANALYSING MATERIALS BY DETERMINING THEIR CHEMICAL OR PHYSICAL PROPERTIES
- G01N21/00—Investigating or analysing materials by the use of optical means, i.e. using sub-millimetre waves, infrared, visible or ultraviolet light
- G01N21/17—Systems in which incident light is modified in accordance with the properties of the material investigated
- G01N21/25—Colour; Spectral properties, i.e. comparison of effect of material on the light at two or more different wavelengths or wavelength bands
- G01N21/31—Investigating relative effect of material at wavelengths characteristic of specific elements or molecules, e.g. atomic absorption spectrometry
- G01N21/35—Investigating relative effect of material at wavelengths characteristic of specific elements or molecules, e.g. atomic absorption spectrometry using infrared light
- G01N2021/3595—Investigating relative effect of material at wavelengths characteristic of specific elements or molecules, e.g. atomic absorption spectrometry using infrared light using FTIR
-
- G—PHYSICS
- G01—MEASURING; TESTING
- G01N—INVESTIGATING OR ANALYSING MATERIALS BY DETERMINING THEIR CHEMICAL OR PHYSICAL PROPERTIES
- G01N21/00—Investigating or analysing materials by the use of optical means, i.e. using sub-millimetre waves, infrared, visible or ultraviolet light
- G01N21/84—Systems specially adapted for particular applications
- G01N21/85—Investigating moving fluids or granular solids
- G01N21/8507—Probe photometers, i.e. with optical measuring part dipped into fluid sample
Definitions
- the present disclosure relates to a spectroscopic analyzer and a spectroscopic analysis method using near-infrared light and infrared light.
- the spectroscopic analyzer is an apparatus which analyzes the characteristics (contained component and the like) of a sample from the spectrum acquired by irradiating the sample with near-infrared light (with a wavelength of 0.7 to 2.5 [ ⁇ m]) or infrared light (with a wavelength of 2.5 to 25 [ ⁇ m]).
- the spectroscopic analyzer using infrared light is characterized in that highly precise analysis can be performed because a sharp spectrum with good separation depending on sample components is acquired, but only a sample which is so thin that infrared light can be transmitted therethrough can be analyzed.
- the spectroscopic analyzer using near-infrared light is characterized in that a thick sample can be analyzed as the transmittance of near-infrared light is higher than that of infrared light, but it is not easy to assign the spectrum peak depending on a sample component as the widths of acquired spectra are large and overlap each other.
- the use of a spectroscopic analyzer differs depending on the required accuracy or application.
- the spectroscopic analyzer using infrared light is widely used in a lab in which it is necessary to measure components contained in a very small amount of sample with high precision.
- the spectroscopic analyzer using near-infrared light is an instrument, such as a brixmeter which measures the amount of sugar in fruit, and is widely used when measuring and analyzing a sample without breaking it.
- Patent Document 1 discloses a spectroscopic analyzer capable of analyzing the characteristics of a sample in a wavelength region of near-infrared light to infrared light on its own.
- the analysis results of spectroscopic analyzers used in a lab and the like are just collected as data indicating the characteristics of a sample. Accordingly, no particular problem occurs even if spectrum measurement is separately performed with the spectroscopic analyzer using infrared light and the spectroscopic analyzer using near-infrared light and the characteristics of a sample is analyzed by a computer after the end of the measurement as described above.
- an analysis result of a spectroscopic analyzer provided at the production site such as a factory, is fed back and used in order to improve the production efficiency while maintaining the quality of products. For this reason, in the spectroscopic analyzer provided at the production site, the characteristics of products need to be analyzed in approximately real time.
- Exemplary embodiments of the present invention provide a spectroscopic analyzer and a spectroscopic analysis method capable of analyzing the characteristics of a sample easily and in a short time even if there is not enough knowledge about the spectra of near-infrared region and infrared region.
- the integrated spectrum data is acquired by combining of the spectrum of near-infrared region measured by the first measurement section and the spectrum of infrared region measured by the second measurement section, and then the difference spectrum data of the reference spectrum data measured in advance and the integrated spectrum data is calculated.
- the two-dimensional correlation operation is performed to acquire the correlation (two-dimensional correlation) between the spectrum of near-infrared region and the spectrum of infraredregion.
- Fig. 1 is a view showing the configuration of a spectrum measuring section provided in the spectroscopic analyzer according to an embodiment of the invention.
- the spectroscopic analyzer of the present embodiment is largely divided into a spectrum measuring section shown in Fig. 1 and an analysis section which performs analysis using the measurement result of the spectrum measuring section, the analysis section is not shown in Fig. 1 .
- the spectrum measuring section provided in the spectroscopic analyzer I of the present embodiment includes an FTIR (Fourier Transform Infrared Spectroscopy) 10, an optical switch 20, an infrared spectrum measuring section 30 (second measurement section), and a near-Infrared spectrum measuring section 40 (first measurement section).
- the spectrum measuring section provided in the spectroscopic analyzer 1 of the present embodiment measures the spectrum of near-infrared region and the spectrum of infrared region by irradiating a sample (not shown in Fig. 1 ), which is an object to be analyzed, with near-infrared light and infrared light.
- the FTIR 10 is a broad-band FTIR with a wave number of 12000 to 1200 [cm -1 ], for example.
- the FTIR 10 is connected to the optical switch 20 and emits light, which includes a near-infrared light component and an infrared light component, toward the optical switch 20.
- the optical switch 20 is connected to the infrared spectrum measuring section 30 and the near-infrared spectrum measuring section 40 and switches the destination of light emitted from the FTIR 10 to the infrared spectrum measuring section 30 or the near-infrared spectrum measuring section 40.
- the infrared spectrum measuring section 30 includes light pipes 31 and 32, an ATR (Attenuated Total Reflection) probe 33, a light pipe 34, and an infrared detector 35 and measures the spectrum of infrared region by irradiating a sample with light from the FTIR 10.
- the light pipes 31, 32, and 34 are connected between the optical switch 20 and the ATR probe 33 and are also connected between the ATR probe 33 and the infrared detector 35.
- the ATR probe 33 has a distal end immersed in a sample, such as liquid which is an object to be analyzed, and guides light, which is emitted from the FTIR 10 and transmitted sequentially through the optical switch 20 and the light pipes 31 and 32, to the sample and also guides light reflected by the sample to the light pipe 32.
- the infrared detector 35 performs photoelectric conversion of the light, which has been guided from the ATR probe 33 to the light pipe 32 and transmitted through the light pipe 34, and outputs a signal (interferogram) showing the spectrum of infrared region included in the light.
- the near-infrared spectrum measuring section 40 includes a light pipe 41, an optical fiber 42, a near-infrared probe 43, an optical fiber 44, and a near-infrared detector 45 and measures the spectrum of near-infrared region by irradiating a sample with light from the FTIR 10.
- the light pipe 41 is connected between the optical switch 20 and the optical fiber 42.
- the optical fiber 42 is connected between the light pipe 41 and the near-infrared probe 43.
- the near-infrared probe 43 has a distal end immersed in a sample and guides light, which is emitted from the FTIR 10 and transmitted sequentially through the optical switch 20, the light pipe 41, and the optical fiber 42, to the sample and also reflects transmitted light of the sample by a mirror in order to guide it to the optical fiber 44.
- the ATR probe 33 and the near-infrared probe 43 are immersed in the same sample.
- the optical fiber 44 is connected between the near-infrared probe 43 and the near-infrared detector 45.
- the near-infrared detector 45 performs photoelectric conversion of the light, which has been guided from the near-infrared probe 43 to the optical fiber 44, and outputs a signal (interferogram) showing the spectrum of near-infrared region included in the light.
- the destination of the light is switched to the infrared spectrum measuring section 30 or the near-infrared spectrum measuring section 40 by the optical switch 20.
- the light emitted from the FTIR 10 is incident on the ATR probe 33 after being transmitted through the light pipes 31 and 32 sequentially and is reflected by the sample.
- This reflected light is incident on the infrared detector 35 for photoelectric conversion after being transmitted through the light pipes 32 and 34 sequentially, and a signal showing the spectrum of infrared region included in the reflected light is output from the infrared detector 35.
- the light emitted from the FTIR 10 is incident on the near-infrared probe 43 after being transmitted through the light pipe 41 and the optical fiber 42 sequentially and is transmitted through the sample.
- the transmitted light of this sample is reflected by the mirror provided in the near-infrared probe 43.
- This reflected light is guided to the optical fiber 44 and is then incident on the near-infrared detector 45 for photoelectric conversion, and a signal showing the spectrum of near-infrared region included in the reflected light is output from the near-infrared detector 45. In this way, the spectra of near-infrared region and infrared region are measured.
- Fig. 2 is a block diagram showing the entire configuration of the spectroscopic analyzer according to an embodiment of the invention.
- the spectroscopic analyzer I includes the FTIR 10, the optical switch 20, the infrared spectrum measuring section 30, the near-infrared spectrum measuring section 40, a switch 50, an AD (Analog to Digital) converter 60, and a PC (Personal Computer: analysis section) 70.
- AD Analog to Digital
- the FTIR 10 includes a controller 11 and an interference device 12.
- the controller 11 controls each section in the FTIR 10 on the basis of a control signal output from the PC 70 and also controls switching of the optical switch 20 and the switch 50.
- the interference device 12 is an interferometer (for example, Michelson interferometer) including an optical system of a light source, a half mirror, and the like and emits light for spectrum measurement.
- the light source provided in the interference device 12 is a tungsten lamp, a ceramic rod, or a halogen lamp, for example, and emits light including both near-infrared light and infrared light.
- the half mirror provided in the interference device 12 is formed of CaF 2 (calcium fluoride), for example.
- the light emitted from the light source and interfered by the optical system is pure light of which Fourier transform is possible.
- the infrared spectrum measuring section 30 includes the ATR probe 33, the infrared detector 35, and the like described above and measures the spectrum of infrared region by irradiating a sample with light which is emitted from the FTIR 10 and transmitted through the optical switch 20.
- the near-infrared spectrum measuring section 40 includes the near-infrared probe 43, the near-infrared detector 45, and the like described above and measures the spectrum of near-infrared region by irradiating a sample with light which is emitted from the FTIR 10 and transmitted through the optical switch 20.
- the spectroscopic analyzer I of the present embodiment can measure the spectrum of infrared region with the infrared spectrum measuring section 30 and can measure the spectrum of near-infrared region with the near-infrared spectrum measuring section 40 just by performing switching of the optical switch 20 without changing the light source of the interference device 12.
- the switch 50 includes an input terminal 50a connected to the infrared detector 35, an input terminal 50b connected to the near-infrared detector 45, and an output terminal 50c connected to the AD converter 60 and performs switching between the input terminals 50a and 50b connected to the output terminal 50c under control of the controller 11.
- the infrared detector 35 is connected to the AD converter 60.
- the near-infrared detector 45 is connected to the AD converter 60.
- the AD converter 60 converts the analog signal, which is output from the infrared detector 35 or the near-infrared detector 45 through the switch 50, into a digital signal and outputs it to the PC 70.
- the PC 70 analyzes the characteristics of the sample by performing various kinds of operations, which will be described below, on the digital signal output from the AD converter 60.
- Fig. 3 is a block diagram showing the main configuration of the PC 70 provided in the spectroscopic analyzer according to the embodiment of the invention.
- the PC 70 includes an input section 71, a display section 72, a memory 73, a communication section 75, I/Fs (interfaces) 76 and 77, and a CPU (Central Processing Unit) 78.
- the above-described blocks provided in the PC 70 are connected to each other through a bus B.
- the input section 71 has a pointing device, such as a keyboard or a mouse, and receives a key operation input and a position operation input from a user and outputs the operation input signal to the CPU 78.
- the display section 72 includes a display device, such as a CRT (Cathode Ray Tube) or a liquid crystal display, and displays an image corresponding to the image signal output from the CPU 78 (for example, an image showing the analysis result of a sample).
- the memory 73 is a memory represented by an HDD, and stores various kinds of data and programs. Specifically, a system program such as an OS (Operating System), a spectrum measuring program which will be described later, a reference spectrum calculation program, and an application program such as an analysis program are stored in the memory 73. An infrared spectrum storage region 73a, a near-infrared spectrum storage region 73b, a integrated spectrum storage region 73c, a reference spectrum storage region 73d, and a difference spectrum storage region 73e are set in the memory 73.
- OS Operating System
- a near-infrared spectrum storage region 73b a near-infrared spectrum storage region 73b
- a integrated spectrum storage region 73c a reference spectrum storage region 73d
- a difference spectrum storage region 73e are set in the memory 73.
- the infrared spectrum storage region 73a is a region where the spectrum data of infrared region output from the AD converter 60 is stored
- the near-infrared spectrum storage region 73b is a region where the spectrum data of near-infrared region output from the AD converter 60 is stored.
- the spectrum data of infrared region and near-infrared region is stored in the infrared spectrum storage region 73a or the near-infrared spectrum storage region 73b so as to match the spectrum data measurement time of the infrared spectrum measuring section 30 or the near-infrared spectrum measuring section 40.
- the integrated spectrum storage region 73c is a region where the integrated spectrum data obtained by combining the spectrum data of infrared region and the spectrum data of near-infrared region is stored.
- the reference spectrum storage region 73d is a region where the reference spectrum data is stored.
- the reference spectrum data is average data of a plurality of integrated spectrum data items obtained by irradiating a sample with infrared light and near-infrared light in advance before starting the analysis of the sample so that the infrared spectrum measuring section 30 and the near-infrared spectrum measuring section 40 measure the spectrum a plural number of times (for example, about 5 times).
- the difference spectrum storage region 73e is a region where the difference spectrum data, which shows a difference between the integrated spectrum data acquired after analysis of a sample is started and the reference spectrum data stored in the reference spectrum storage region 73d, is stored.
- the difference spectrum data which shows a difference between the integrated spectrum data acquired after analysis of a sample is started and the reference spectrum data stored in the reference spectrum storage region 73d.
- the communication section 75 is connected to a communication network, such as a LAN (Local Area Network), and transmits or receives various kinds of information to or from an external device on the communication network.
- the 1/F 76 is an interface connected to the AD converter 60.
- the spectrum data of infrared region or near-infrared region input from the AD converter 60 is input to the CPU 78 through the I/F 76.
- the I/F 77 is an interface connected to the FTIR 10.
- a control signal for control of the FTIR 10 and the like, which is output from the CPU 78, is output to the controller 11 of the FTIR 10 through the I/F 77.
- the CPU 78 performs overall control of each section of the PC 70 described above.
- the CPU 78 executes various kinds of processing, such as processing of analyzing the characteristics of a sample, by reading a designated program among system programs and application programs stored in the memory 73 and loading it to the memory 73 to execute it.
- the CPU 78 performs processing of obtaining the integrated spectrum data by combining the spectrum data of infrared region and the spectrum data of near-infrared region described above, processing of calculating the difference spectrum data described above, and processing of calculating the correlation between the spectrum of infrared region and the spectrum of near-infrared region by performing a two-dimensional correlation operation using the difference spectrum data.
- the CPU 78 performs processing of calculating the reference spectrum data described above.
- the CPU 78 performs spectrum analysis processing and calibration model creation processing on the basis of the integrated spectrum data.
- the spectrum analysis processing indicates chemometrics using a statistical analysis method, for example.
- the CPU 78 uses the integrated spectrum data obtained by combining the infrared spectrum data and the near-infrared spectrum data to perform analysis for creating the calibration model which predicts the concentration of a sample from the spectrum by statistical analysis processing.
- the calibration model represents the relational expression showing the relationship between the concentration of a sample and the optical absorbance of the sample. Using this calibration model, the concentration of a sample with unknown concentration can be predicted.
- the CPU 78 also controls the FTIR 10, the optical switch 20, and the switch 50.
- Fig. 4 is a flow chart showing the operation of the spectroscopic analyzer according to an embodiment of the invention. As shown in Fig. 4 , the operation of the spectroscopic analyzer 1 is largely divided into an initial measurement process S1 of calculating the reference spectrum and a measurement analysis process S2 of actually analyzing the characteristics of a sample. Hereinafter, details of processing performed in each of these processes will be described in order.
- the system program and the application program stored in the memory 73 provided in the PC 70 are read by the CPU 78 and loaded into the memory 73 appropriately.
- the reference spectrum measuring program loaded into the memory 73 is executed to start the initial measurement process S1.
- process S11 spectrum measurement using infrared light and near-infrared light is first performed (process S11). Specifically, the CPU 78 of the PC 70 generates a control signal of the optical switch 20 and the switch 50 and transmits it to the controller 11 of the FTIR 10 through the I/F 77. After this control signal is received by the controller 11, switching of the optical switch 20 is performed and measurement of the spectrum of infrared region in the infrared spectrum measuring section 30 and measurement of the spectrum of near-infrared region in the near-infrared spectrum measuring section 40 are sequentially performed.
- switching of the switch 50 is also performed in synchronization with the switching of the optical switch 20, an interferogram of the infrared spectrum and an interferogram of the near-infrared spectrum are output in order through the switch 50.
- the interferogram of the infrared spectrum and the interferogram of the near-infrared spectrum, which have been output from the switch 50, are converted into digital signals by the AD converter 60 and are then input to the PC 70. Then, the Fourier transform thereof is performed by FFT (Fast Fourier Transform) in order to obtain the spectrum.
- FFT Fast Fourier Transform
- the spectrum data of infrared region and the spectrum data of near-infrared region are stored in the infrared spectrum storage region 73a and the near-infrared spectrum storage region 73b, respectively, together with the respective measurement time.
- the infrared spectrum data stored in the infrared spectrum storage region 73a of the memory 73 and the near-infrared spectrum data stored in the near-infrared spectrum storage region 73b are read by the CPU 78 to be combined (step S12).
- the integrated spectrum data acquired by this processing is stored in the integrated spectrum storage region 73c of the memory 73.
- Fig. 5 is a view for explaining a method of calculating the integrated spectrum data in the spectroscopic analyzer according to an embodiment of the invention.
- the characters "NIR" in Fig. 5 indicate the near-infrared spectrum data acquired by measurement of the near-infrared spectrum measuring section 40, and the characters "IR” indicate the infrared spectrum data acquired by measurement of the infrared spectrum measuring section 30.
- NIR near-infrared spectrum data acquired by measurement of the near-infrared spectrum measuring section 40
- IR infrared spectrum data acquired by measurement of the infrared spectrum measuring section 30.
- the near-infrared spectrum data and the infrared spectrum data are spectrum distribution data of the light absorbance relating to the wave number.
- the near-infrared spectrum data and the infrared spectrum data are stored in the near-infrared spectrum storage region 73b and the infrared spectrum storage region 73a of the memory 73, respectively, in a state that these data are matched to the corresponding measurement time.
- the CPU 78 combines the spectrum data of near-infrared region and infrared region stored in the memory 73 while interpolating it.
- the interpolation method is not limited to this example.
- near-infrared spectrum data al infrared spectrum data b1, near-infrared spectrum data a2, infrared spectrum data b2, ... are stored in the memory 73 in order from the oldest measurement time.
- the CPU 78 reads the near-infrared spectrum data a1 acquired immediately before the infrared spectrum data b1 and the near-infrared spectrum data a2 acquired immediately after the infrared spectrum data b1 and calculates the average near-infrared spectrum data c1 indicating their average value.
- the characters "average NIR" in Fig. 5 indicate the average near-infrared spectrum data.
- the CPU 78 generates the integrated spectrum data e1 by reading the infrared spectrum data b1 and adding the average near-infrared spectrum data cl.
- the integrated spectrum data e1 is data for interpolating the near-infrared spectrum data at the time when the infrared spectrum data b1 is measured.
- the CPU 78 reads the infrared spectrum data b1 acquired immediately before the near-infrared spectrum data a2 and the infrared spectrum data b2 acquired immediately after the near-infrared spectrum data a2 and calculates the average Infrared spectrum data d1 indicating their average value.
- the characters "average IR" in Fig. 5 indicate the average infrared spectrum data.
- the CPU 78 generates the integrated spectrum data e2 by reading the near-infrared spectrum data a2 and adding the average infrared spectrum data d1.
- the integrated spectrum data e2 is data for interpolating the infrared spectrum data at the time when the near-infrared spectrum data a2 is measured.
- the integrated spectrum data obtained by combining the spectrum data of infrared region and the spectrum data of near-infrared region is calculated.
- the integrated spectrum acquired in this way is stored in the integrated spectrum storage region 73c of the memory 73.
- the CPU 78 determines whether or not the spectrum measurement using infrared light and near-infrared light has been performed a set number of times (for example, 5 times) set in advance (step S13). When it is determined that the spectrum measurement has not been performed a set number of times (when the determination result is "NO"), the spectrum measurement using infrared light and near-infrared light is performed again (step S11). In contrast, when it is determined that the spectrum measurement has been performed a set number of times (when the determination result is "YES"), the CPU 78 calculates the reference spectrum data (step S14).
- the initial measurement step S1 ends.
- step S2 When a measurement analysis instruction from a user is input through the input section 71 of the PC 70 after the initial measurement step S1 ends, the spectrum measuring program and the analysis program loaded into the memory 73 are executed to start a measurement analysis step S2.
- the measurement analysis step S2 starts, spectrum measurement using infrared light and near-infrared light is first performed (step S21). Specifically, similar to step S11 of the initial measurement step S1, a control signal generated in the CPU 78 of the PC 70 is transmitted to the controller 11 and the optical switch 20 and the switch 50 are switched in synchronization with each other.
- the interferogram of the infrared spectrum and the interferogram of the near-infrared spectrum, which have been output from the switch 50, are converted into digital signals by the AD converter 60 and then the Fourier transform of the signals is performed by the PC 70.
- the spectrum data of infrared region and the spectrum data of near-infrared region are stored in the infrared spectrum storage region 73a and the near-infrared spectrum storage region 73b of the memory 73, respectively, together with the respective measurement time.
- the infrared spectrum data stored in the infrared spectrum storage region 73a of the memory 73 and the near-infrared spectrum data stored in the near-infrared spectrum storage region 73b are read by the CPU 78 and combined by the same method as the method described using Fig. 5 .
- the integrated spectrum is acquired (step S22: first calculation module, first step).
- the integrated spectrum data acquired by this processing is stored in the integrated spectrum storage region 73c of the memory 73.
- step S23 prediction module
- the predicted value of the concentration calculated by the CPU 78 is stored in the memory 73.
- the predicted value and the integrated spectrum data may be output to an external device through the communication section 75.
- step S24 the predicted value calculated in the last measurement and the predicted value calculated in this measurement are read from the memory 73 into the CPU 78, and the CPU 78 determines whether or not the difference between these predicted values is equal to or larger than a threshold value set in advance.
- the processing of step S24 is omitted, and processing (adding processing) of calculating the difference spectrum data and storing it in the difference spectrum storage region 73d of the memory 73 is performed by the CPU 78 (step S25: second calculation module, second step).
- the difference spectrum data is acquired.
- the difference spectrum data calculated by the CPU 78 is stored in the difference spectrum storage region 73e of the memory 73.
- the CPU 78 determines whether or not the data number (number of times of spectrum measurement using infrared light and near-infrared light) of the spectrum is equal to or larger than a set value (for example, "3") set in advance (step S26).
- a set value for example, "3" set in advance
- step S26 since the spectrum measurement of step S21 is performed only once, the determination result in step S26 is "NO". Accordingly, spectrum measurement is performed again (step S21), the integrated spectrum data is calculated (step S22), and the predicted value of the concentration of a sample is calculated using the calibration model (step S23).
- the spectrum data, the integrated spectrum data, and the predicted value of concentration acquired by the above processing are stored in the memory 73.
- the predicted value calculated in the last measurement and the predicted value calculated in this measurement are read from the memory 73 into the CPU 78, and the CPU 78 determines whether or not the difference between these predicted values is equal to or larger than a threshold value set in advance (step S24).
- the process returns to step S21 to perform spectrum measurement.
- the CPU 78 performs processing of calculating the difference spectrum data and adding it in the difference spectrum storage region 73d of the memory 73 (step S25).
- the difference spectrum data is calculated and added in the difference spectrum storage region 73d of the memory 73. This is for improving the accuracy of correlation (correlation between the spectrum of infrared region and the spectrum of near-infrared region) calculated by the two-dimensional correlation operation performed in step S27, which will be described later, while reducing the time required for the operation as much as possible by suppressing the data number of difference spectrum data.
- the accuracy of the correlation calculated by the two-dimensional correlation operation is improved by increasing the data number of difference spectrum data when a predicted concentration change is large, and the time required for the two-dimensional correlation operation is reduced as much as possible by not increasing the data number of difference spectrum data when the predicted concentration change is small.
- the threshold value of the predicted value from the measured spectrum is used as a reference herein, there are a number of determination methods in chemometrics. For example, it is possible to use outlier detection for determining whether or not the measured spectrum is abnormal from the shape prediction value of a spectrum and the like.
- step S26 the determination result in step S26 is "YES". Accordingly, the difference spectrum data stored in the difference spectrum storage region 73e of the memory 73 is read by the CPU 78, and the two-dimensional correlation operation disclosed in Non-patent Documents 1 and 2 described above is performed to calculate the spectrum of near-infrared region and the spectrum of infrared region based on the difference spectrum data (step S27: third calculation module, third step).
- the correlation between the spectrum of near-infrared region and the spectrum of infrared region can be calculated even if the integrated spectrum data calculated in step S22 is used.
- the correlation between the spectrum of near-infrared region and the spectrum of infrared region is calculated using the difference spectrum data indicating the difference between the integrated spectrum data and the reference spectrum data in order to catch subtle changes in the characteristics (for example, concentration) of a sample with high sensitivity.
- the CPU 78 After the two-dimensional correlation operation ends, the CPU 78 creates a graph showing the correlation between the spectrum of near-infrared region and the spectrum of infrared region, which is an operation result of the two-dimensional correlation operation, and displays it on the display section 72 (step S28).
- the CPU 78 determines whether or not an analysis end instruction from the user has been input through the input section 71 of the PC 70 (step S29). When the analysis end instruction has not yet been input (when the determination result in step S29 is "NO"), the process returns to step S21 to perform spectrum measurement again. In contrast, when the analysis end instruction has been input (when the determination result in step S29 is "YES”), the series of processings shown in Fig. 4 ends.
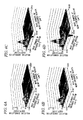
- Figs. 6A to 6D are views showing an example of the analysis result of the spectroscopic analyzer according to the embodiment of the invention.
- Figs. 6A to 6D are graphs showing the two-dimensional correlation acquired when a boric acid solution whose concentration changes is used as a sample.
- Fig. 6A is a graph when the concentration of boric acid is 1 wt%
- Fig. 6B is a graph when the concentration of boric acid is 2 wt%
- Fig. 6C is a graph when the concentration of boric acid is 4 wt%
- Fig. 6D is a graph when the concentration of a boric acid is 5 wt%.
- Figs. 6A to 6D it can be seen that there is correlation between a portion whose wave number of the infrared region is near 1400 [cm -1 ] and a portion whose wave number of the near-infrared region is near 4500 [cm -1 ] and the correlation becomes strong gradually as the concentration of the boric acid increases.
- the chemical formula for the boric acid is expressed as H 3 BO 3 , and the peak of absorption by single bond (B-O) between a boron atom and an oxygen atom appears at the wave number of the infrared region near 1400 [cm -1 ].
- B-O peak of absorption by single bond
- the portion whose wave number of the near-infrared region is near 4500 [cm -1 ] is correlated with the portion whose wave number of the infrared region is near 1400 [cm -1 ]. Accordingly, it can be predicted that the peak of absorption appearing at the wave number of the near-infrared region near 4500 [cm -1 ] is based on the bond (B-OH) between a boron atom and a hydroxyl group.
- the integrated spectrum data is acquired by combining the spectrum of infrared region measured by the infrared spectrum measuring section 30 and the spectrum of near-infrared region measured by the near-infrared spectrum measuring section 40, and then the difference spectrum data of the reference spectrum data measured in advance and the integrated spectrum data is calculated. Then, by performing the two-dimensional correlation operation using the difference spectrum data, correlation (two-dimensional correlation) between the spectrum of near-infrared region and the spectrum of infrared region is calculated.
- the characteristics of a sample can be analyzed in a short time since the two-dimensional correlation operation is executed while spectrum measurement is being performed. Accordingly, when the spectroscopic analyzer 1 is installed at the production site, such as a factory, an analysis result can be fed back quickly and accurately. As a result, production efficiency can be improved while maintaining the quality of products.
- the invention is not necessarily limited to the above embodiment and may be freely changed within the scope of the invention.
- the invention may also be applied to a case of calculating two-dimensional correlation (two-dimensional different-time correlation) of the spectra calculated at a different time.
- a two-dimensional correlation method it is also possible to use perturbation-correlation two-dimensional correlation spectroscopy and the like.
- the ATR probe 33 and the near-infrared probe 43 are immersed in the same sample and the spectrum of infrared region and the spectrum of near-infrared region are measured.
- a process of measuring the spectrum of infrared region and a process of measuring the spectrum of near-infrared region may be set to be different.
- the spectrum of infrared region may be measured in a previous process of a drying process of drying products, and the spectrum of near-infrared region may be measured in a subsequent process of the drying process.
- the difference spectrum data is acquired by calculating the difference between the integrated spectrum data and the reference spectrum data.
- similar effects can be expected even if the difference spectrum data obtained by differentiating the integrated spectrum data is used instead of using the difference spectrum data.
- the effect is large if a difference of differential spectra and a reference spectra (for example, which is average data of a plurality of differential spectrum calculated before starting the analysis of the sample) is used.
- the light pipe is used as the second measurement section configured to measure a spectrum of infrared region by irradiating the sample with infrared light.
- an infrared light fiber chalcogenide fiber, sliver halide fiber, a hollow fiber, and the like
- the second measurement section may be used as the second measurement section.
Landscapes
- Physics & Mathematics (AREA)
- Spectroscopy & Molecular Physics (AREA)
- General Physics & Mathematics (AREA)
- Health & Medical Sciences (AREA)
- Life Sciences & Earth Sciences (AREA)
- Chemical & Material Sciences (AREA)
- Analytical Chemistry (AREA)
- Biochemistry (AREA)
- General Health & Medical Sciences (AREA)
- Immunology (AREA)
- Pathology (AREA)
- Investigating Or Analysing Materials By Optical Means (AREA)
Abstract
A spectroscopic analyzer includes a first measurement section (40) which measures a spectrum of near-infrared region by irradiating a sample with near-infrared light, a second measurement section (30) which measures a spectrum of infrared region by irradiating the sample with infrared light, and an analysis section which analyzes characteristics of the sample using the spectra measured by the first and second measurement sections. The analysis section includes a first calculation module which acquires a integrated spectrum by combining the spectrum of near-infrared region and the spectrum of infrared region, a second calculation module which calculates a difference spectrum of a reference spectrum measured in advance and the integrated spectrum, and a third calculation module which calculates correlation between the spectrum of near-infrared region and the spectrum of infrared region by performing a two-dimensional correlation operation using the difference spectrum.
Description
- The present disclosure relates to a spectroscopic analyzer and a spectroscopic analysis method using near-infrared light and infrared light.
- The spectroscopic analyzer is an apparatus which analyzes the characteristics (contained component and the like) of a sample from the spectrum acquired by irradiating the sample with near-infrared light (with a wavelength of 0.7 to 2.5 [µm]) or infrared light (with a wavelength of 2.5 to 25 [µm]). The spectroscopic analyzer using infrared light is characterized in that highly precise analysis can be performed because a sharp spectrum with good separation depending on sample components is acquired, but only a sample which is so thin that infrared light can be transmitted therethrough can be analyzed. In contrast, the spectroscopic analyzer using near-infrared light is characterized in that a thick sample can be analyzed as the transmittance of near-infrared light is higher than that of infrared light, but it is not easy to assign the spectrum peak depending on a sample component as the widths of acquired spectra are large and overlap each other.
- Due to the above characteristics, the use of a spectroscopic analyzer differs depending on the required accuracy or application. For example, the spectroscopic analyzer using infrared light is widely used in a lab in which it is necessary to measure components contained in a very small amount of sample with high precision. In contrast, the spectroscopic analyzer using near-infrared light is an instrument, such as a brixmeter which measures the amount of sugar in fruit, and is widely used when measuring and analyzing a sample without breaking it.
- When it was necessary to analyze the characteristics of a sample in a wavelength region of near-infrared light to infrared light in the related art, measurement of a spectrum was separately performed using two spectroscopic analyzers of the above spectroscopic analyzer using infrared light and the above spectroscopic analyzer using near-infrared light. Then, the data of the spectrum acquired by each spectroscopic analyzer was downloaded to a computer, and the characteristics of the sample were analyzed by calculating the correlation of the respective spectra using the two-dimensional spectroscopy disclosed in the following Non-patent
Documents Patent Document 1 discloses a spectroscopic analyzer capable of analyzing the characteristics of a sample in a wavelength region of near-infrared light to infrared light on its own. -
- [Patent Document 1]
JP-A-2009-168711 -
- [Non-patent Document 1] Toru Amari et al., "Generalized Two-Dimensional Attenuated Total Reflection/Infrared and Near-Infrared Correlation Spectroscopy Studies of Real-Time Monitoring of the Initial Oligomerization of Bis(hydroxyethyl terephthalate)", Macromolecules, 2002, 35, p.8020-8028
- [Non-patent Document 2] 1. Noda et al., "Generalized Two-Dimensional Correlation Spectroscopy", Applied Spectroscopy, Vol. 54, Issue 7, p.236A-248A
- Incidentally, since the above-described spectroscopic analyzer disclosed in Patent Document I can treat the spectrum of near-infrared region and the spectrum of infrared region as one spectrum, it is advantageous in that handling becomes easy compared with a case of performing analysis using two spectroscopic analyzers. However, if there is not enough knowledge about both the characteristic of the spectrum of near-infrared region and the characteristic of the spectrum of infrared region, there is a problem in that an analysis result in the wavelength region of near-infrared light to infrared light of the above spectroscopic analyzer disclosed in
Patent Document 1 cannot be effectively used. - In addition, basically, the analysis results of spectroscopic analyzers used in a lab and the like are just collected as data indicating the characteristics of a sample. Accordingly, no particular problem occurs even if spectrum measurement is separately performed with the spectroscopic analyzer using infrared light and the spectroscopic analyzer using near-infrared light and the characteristics of a sample is analyzed by a computer after the end of the measurement as described above. However, an analysis result of a spectroscopic analyzer provided at the production site, such as a factory, is fed back and used in order to improve the production efficiency while maintaining the quality of products. For this reason, in the spectroscopic analyzer provided at the production site, the characteristics of products need to be analyzed in approximately real time.
- Exemplary embodiments of the present invention provide a spectroscopic analyzer and a spectroscopic analysis method capable of analyzing the characteristics of a sample easily and in a short time even if there is not enough knowledge about the spectra of near-infrared region and infrared region.
- A spectroscopic analyzer according to an exemplary embodiment of the invention includes:
- a first measurement section configured to measure a spectrum of near-infrared region by irradiating a sample with near-infrared light;
- a second measurement section configured to measure a spectrum of infrared region by irradiating the sample with infrared light; and
- an analysis section configured to analyze characteristics of the sample using the spectra measured by the first and second measurement sections,
- wherein the analysis section includes
- a first calculation module configured to acquire a integrated spectrum by combining the spectrum of near-infrared region measured by the first measurement section and the spectrum of infrared region measured by the second measurement section,
- a second calculation module configured to calculate a difference spectrum of a reference spectrum measured in advance and the integrated spectrum, and
- a third calculation module configured to calculate correlation between the spectrum of near-infrared region and the spectrum of infrared region by performing a two-dimensional correlation operation using the difference spectrum calculated by the second calculation module.
According to the aspect of the invention, the integrated spectrum data is acquired by combining of the spectrum of near-infrared region measured by the first measurement section and the spectrum of infrared region measured by the second measurement section, and then the difference spectrum data of the reference spectrum data measured in advance and the integrated spectrum data is calculated. Using the difference spectrum data, a two-dimensional correlation operation is performed to acquire the correlation (two-dimensional correlation) between the spectrum of near-infrared region and the spectrum of infrared region.
The second calculation module may be configured to calculate the difference spectrum whenever measurement of a spectrum is performed by the first and second measurement sections.
The analysis section may further include a prediction module configured to calculate a predicted value of concentration of the sample from the integrated spectrum acquired by the first calculation module using a calibration model showing relationship between concentration and optical absorbance of the sample calculated in advance, and
the second calculation module may be configured to calculate the difference spectrum when a difference between the predicted value calculated previously by the prediction module and the newly calculated predicted value is equal to or larger than a predetermined threshold value set in advance.
The second calculation module may be configured to perform an outlier detection for determining whether or not the integrated spectrum acquired by the first calculation module is abnormal using chemometrics and to calculate the difference spectrum based on the integrated spectrum determined to be abnormal.
The reference spectrum may be a spectrum obtained by averaging the integrated spectra acquired by the first calculation module when the first and second measurement sections have measured spectra a plural number of times by irradiating the sample with near-infrared light and infrared light in advance before analysis of the sample starts.
A spectroscopic analysis method according to an exemplary embodiment of the invention is a spectroscopic analysis method used in a spectroscopic analyzer including a first measurement section configured to measure a spectrum of near-infrared region by irradiating a sample with near-infrared light and a second measurement section configured to measure a spectrum of infrared region by irradiating the sample with infrared light, the spectroscopic analysis method including;- acquiring a integrated spectrum by combining the spectrum of near-infrared region measured by the first measurement section and the spectrum of infrared region measured by the second measurement section;
- calculating a difference spectrum of a reference spectrum measured in advance and the integrated spectrum; and
- calculating correlation between the spectrum of near-infrared region and the spectrum of infrared region by performing a two-dimensional correlation operation using the difference spectrum.
- According to the invention, the integrated spectrum data is acquired by combining of the spectrum of near-infrared region measured by the first measurement section and the spectrum of infrared region measured by the second measurement section, and then the difference spectrum data of the reference spectrum data measured in advance and the integrated spectrum data is calculated. Using the difference spectrum data, the two-dimensional correlation operation is performed to acquire the correlation (two-dimensional correlation) between the spectrum of near-infrared region and the spectrum of infraredregion. For this reason, even a user who does not have enough knowledge about the spectrum of near-infrared region and the spectrum of infrared region can easily understand the relationship between the spectrum of near-infrared region and the spectrum of infrared region just by referring to the graph showing the two-dimensional correlation between the spectrum of near-infrared region and the spectrum of infrared region.
-
-
Fig. 1 is a view showing the configuration of a spectrum measuring section provided in a spectroscopic analyzer according to an embodiment of the invention. -
Fig. 2 is a block diagram showing the entire configuration of the spectroscopic analyzer. -
Fig. 3 is a block diagram showing the main configuration of aPC 70 provided in the spectroscopic analyzer. -
Fig. 4 is a flow chart showing the operation of the spectroscopic analyzer. -
Fig. 5 is a view for explaining a method of calculating the integrated spectrum data in the spectroscopic analyzer. -
Figs. 6A to 6D are views showing an example of the analysis result of the spectroscopic analyzer. - Hereinafter, a spectroscopic analyzer and a spectroscopic analysis method according to an embodiment of the invention will be described in detail with reference to the accompanying drawings.
Fig. 1 is a view showing the configuration of a spectrum measuring section provided in the spectroscopic analyzer according to an embodiment of the invention. In addition, although the spectroscopic analyzer of the present embodiment is largely divided into a spectrum measuring section shown inFig. 1 and an analysis section which performs analysis using the measurement result of the spectrum measuring section, the analysis section is not shown inFig. 1 . - As shown in
Fig. 1 , the spectrum measuring section provided in the spectroscopic analyzer I of the present embodiment includes an FTIR (Fourier Transform Infrared Spectroscopy) 10, anoptical switch 20, an infrared spectrum measuring section 30 (second measurement section), and a near-Infrared spectrum measuring section 40 (first measurement section). In addition, the spectrum measuring section provided in thespectroscopic analyzer 1 of the present embodiment measures the spectrum of near-infrared region and the spectrum of infrared region by irradiating a sample (not shown inFig. 1 ), which is an object to be analyzed, with near-infrared light and infrared light. - The
FTIR 10 is a broad-band FTIR with a wave number of 12000 to 1200 [cm-1], for example. TheFTIR 10 is connected to theoptical switch 20 and emits light, which includes a near-infrared light component and an infrared light component, toward theoptical switch 20. Theoptical switch 20 is connected to the infraredspectrum measuring section 30 and the near-infraredspectrum measuring section 40 and switches the destination of light emitted from theFTIR 10 to the infraredspectrum measuring section 30 or the near-infraredspectrum measuring section 40. - The infrared
spectrum measuring section 30 includeslight pipes probe 33, alight pipe 34, and aninfrared detector 35 and measures the spectrum of infrared region by irradiating a sample with light from theFTIR 10. Thelight pipes optical switch 20 and theATR probe 33 and are also connected between theATR probe 33 and theinfrared detector 35. - The
ATR probe 33 has a distal end immersed in a sample, such as liquid which is an object to be analyzed, and guides light, which is emitted from theFTIR 10 and transmitted sequentially through theoptical switch 20 and thelight pipes light pipe 32. Theinfrared detector 35 performs photoelectric conversion of the light, which has been guided from theATR probe 33 to thelight pipe 32 and transmitted through thelight pipe 34, and outputs a signal (interferogram) showing the spectrum of infrared region included in the light. - The near-infrared
spectrum measuring section 40 includes alight pipe 41, anoptical fiber 42, a near-infrared probe 43, anoptical fiber 44, and a near-infrared detector 45 and measures the spectrum of near-infrared region by irradiating a sample with light from theFTIR 10. Thelight pipe 41 is connected between theoptical switch 20 and theoptical fiber 42. Theoptical fiber 42 is connected between thelight pipe 41 and the near-infrared probe 43. - Similar to the
ATR probe 33, the near-infrared probe 43 has a distal end immersed in a sample and guides light, which is emitted from theFTIR 10 and transmitted sequentially through theoptical switch 20, thelight pipe 41, and theoptical fiber 42, to the sample and also reflects transmitted light of the sample by a mirror in order to guide it to theoptical fiber 44. In addition, theATR probe 33 and the near-infrared probe 43 are immersed in the same sample. Theoptical fiber 44 is connected between the near-infrared probe 43 and the near-infrared detector 45. The near-infrared detector 45 performs photoelectric conversion of the light, which has been guided from the near-infrared probe 43 to theoptical fiber 44, and outputs a signal (interferogram) showing the spectrum of near-infrared region included in the light. - In the configuration described above, when light including a near-infrared light component and an infrared light component is emitted from the
FTIR 10, the destination of the light is switched to the infraredspectrum measuring section 30 or the near-infraredspectrum measuring section 40 by theoptical switch 20. When the destination of light is switched to the infraredspectrum measuring section 30 side by theoptical switch 20, the light emitted from theFTIR 10 is incident on theATR probe 33 after being transmitted through thelight pipes infrared detector 35 for photoelectric conversion after being transmitted through thelight pipes infrared detector 35. - In contrast, when the destination of light is switched to the near-infrared
spectrum measuring section 40 side by theoptical switch 20, the light emitted from theFTIR 10 is incident on the near-infrared probe 43 after being transmitted through thelight pipe 41 and theoptical fiber 42 sequentially and is transmitted through the sample. The transmitted light of this sample is reflected by the mirror provided in the near-infrared probe 43. This reflected light is guided to theoptical fiber 44 and is then incident on the near-infrared detector 45 for photoelectric conversion, and a signal showing the spectrum of near-infrared region included in the reflected light is output from the near-infrared detector 45. In this way, the spectra of near-infrared region and infrared region are measured. - Next, the entire configuration of the
spectroscopic analyzer 1 including the spectrum measuring section described above and the analysis section, which is not shown inFig. 1 , will be described with reference toFig. 2. Fig. 2 is a block diagram showing the entire configuration of the spectroscopic analyzer according to an embodiment of the invention. As shown inFig. 2 , the spectroscopic analyzer I includes theFTIR 10, theoptical switch 20, the infraredspectrum measuring section 30, the near-infraredspectrum measuring section 40, aswitch 50, an AD (Analog to Digital)converter 60, and a PC (Personal Computer: analysis section) 70. - The
FTIR 10 includes acontroller 11 and aninterference device 12. Thecontroller 11 controls each section in theFTIR 10 on the basis of a control signal output from thePC 70 and also controls switching of theoptical switch 20 and theswitch 50. Theinterference device 12 is an interferometer (for example, Michelson interferometer) including an optical system of a light source, a half mirror, and the like and emits light for spectrum measurement. The light source provided in theinterference device 12 is a tungsten lamp, a ceramic rod, or a halogen lamp, for example, and emits light including both near-infrared light and infrared light. In addition, the half mirror provided in theinterference device 12 is formed of CaF2 (calcium fluoride), for example. In theinterference device 12, the light emitted from the light source and interfered by the optical system is pure light of which Fourier transform is possible. - The infrared
spectrum measuring section 30 includes theATR probe 33, theinfrared detector 35, and the like described above and measures the spectrum of infrared region by irradiating a sample with light which is emitted from theFTIR 10 and transmitted through theoptical switch 20. The near-infraredspectrum measuring section 40 includes the near-infrared probe 43, the near-infrared detector 45, and the like described above and measures the spectrum of near-infrared region by irradiating a sample with light which is emitted from theFTIR 10 and transmitted through theoptical switch 20. That is, the spectroscopic analyzer I of the present embodiment can measure the spectrum of infrared region with the infraredspectrum measuring section 30 and can measure the spectrum of near-infrared region with the near-infraredspectrum measuring section 40 just by performing switching of theoptical switch 20 without changing the light source of theinterference device 12. - The
switch 50 includes aninput terminal 50a connected to theinfrared detector 35, aninput terminal 50b connected to the near-infrared detector 45, and anoutput terminal 50c connected to theAD converter 60 and performs switching between theinput terminals output terminal 50c under control of thecontroller 11. When theinput terminal 50a is connected to theoutput terminal 50c, theinfrared detector 35 is connected to theAD converter 60. When theinput terminal 50b is connected to theoutput terminal 50c, the near-infrared detector 45 is connected to theAD converter 60. TheAD converter 60 converts the analog signal, which is output from theinfrared detector 35 or the near-infrared detector 45 through theswitch 50, into a digital signal and outputs it to thePC 70. ThePC 70 analyzes the characteristics of the sample by performing various kinds of operations, which will be described below, on the digital signal output from theAD converter 60. -
Fig. 3 is a block diagram showing the main configuration of thePC 70 provided in the spectroscopic analyzer according to the embodiment of the invention. As shown inFig. 3 , thePC 70 includes aninput section 71, adisplay section 72, amemory 73, acommunication section 75, I/Fs (interfaces) 76 and 77, and a CPU (Central Processing Unit) 78. In addition, the above-described blocks provided in thePC 70 are connected to each other through a bus B. - The
input section 71 has a pointing device, such as a keyboard or a mouse, and receives a key operation input and a position operation input from a user and outputs the operation input signal to theCPU 78. Thedisplay section 72 includes a display device, such as a CRT (Cathode Ray Tube) or a liquid crystal display, and displays an image corresponding to the image signal output from the CPU 78 (for example, an image showing the analysis result of a sample). - The
memory 73 is a memory represented by an HDD, and stores various kinds of data and programs. Specifically, a system program such as an OS (Operating System), a spectrum measuring program which will be described later, a reference spectrum calculation program, and an application program such as an analysis program are stored in thememory 73. An infraredspectrum storage region 73a, a near-infraredspectrum storage region 73b, a integratedspectrum storage region 73c, a referencespectrum storage region 73d, and a differencespectrum storage region 73e are set in thememory 73. - The infrared
spectrum storage region 73a is a region where the spectrum data of infrared region output from theAD converter 60 is stored, and the near-infraredspectrum storage region 73b is a region where the spectrum data of near-infrared region output from theAD converter 60 is stored. In addition, the spectrum data of infrared region and near-infrared region is stored in the infraredspectrum storage region 73a or the near-infraredspectrum storage region 73b so as to match the spectrum data measurement time of the infraredspectrum measuring section 30 or the near-infraredspectrum measuring section 40. - The integrated
spectrum storage region 73c is a region where the integrated spectrum data obtained by combining the spectrum data of infrared region and the spectrum data of near-infrared region is stored. The referencespectrum storage region 73d is a region where the reference spectrum data is stored. Here, the reference spectrum data is average data of a plurality of integrated spectrum data items obtained by irradiating a sample with infrared light and near-infrared light in advance before starting the analysis of the sample so that the infraredspectrum measuring section 30 and the near-infraredspectrum measuring section 40 measure the spectrum a plural number of times (for example, about 5 times). - The difference
spectrum storage region 73e is a region where the difference spectrum data, which shows a difference between the integrated spectrum data acquired after analysis of a sample is started and the reference spectrum data stored in the referencespectrum storage region 73d, is stored. In addition, combining of the spectrum data of infrared region and the spectrum data of near-infrared region described above, calculation of the reference spectrum data described above, and calculation of the difference spectrum data are performed by theCPU 78, and detailed explanations thereof will be described later. - The
communication section 75 is connected to a communication network, such as a LAN (Local Area Network), and transmits or receives various kinds of information to or from an external device on the communication network. The 1/F 76 is an interface connected to theAD converter 60. The spectrum data of infrared region or near-infrared region input from theAD converter 60 is input to theCPU 78 through the I/F 76. The I/F 77 is an interface connected to theFTIR 10. A control signal for control of theFTIR 10 and the like, which is output from theCPU 78, is output to thecontroller 11 of theFTIR 10 through the I/F 77. - The
CPU 78 performs overall control of each section of thePC 70 described above. In addition, theCPU 78 executes various kinds of processing, such as processing of analyzing the characteristics of a sample, by reading a designated program among system programs and application programs stored in thememory 73 and loading it to thememory 73 to execute it. Specifically, theCPU 78 performs processing of obtaining the integrated spectrum data by combining the spectrum data of infrared region and the spectrum data of near-infrared region described above, processing of calculating the difference spectrum data described above, and processing of calculating the correlation between the spectrum of infrared region and the spectrum of near-infrared region by performing a two-dimensional correlation operation using the difference spectrum data. In addition, theCPU 78 performs processing of calculating the reference spectrum data described above. - In addition to the above processing, the
CPU 78 performs spectrum analysis processing and calibration model creation processing on the basis of the integrated spectrum data. Here, the spectrum analysis processing indicates chemometrics using a statistical analysis method, for example. Using the integrated spectrum data obtained by combining the infrared spectrum data and the near-infrared spectrum data, theCPU 78 performs analysis for creating the calibration model which predicts the concentration of a sample from the spectrum by statistical analysis processing. Here, the calibration model represents the relational expression showing the relationship between the concentration of a sample and the optical absorbance of the sample. Using this calibration model, the concentration of a sample with unknown concentration can be predicted. In addition, theCPU 78 also controls theFTIR 10, theoptical switch 20, and theswitch 50. - Next, the operation of the
spectroscopic analyzer 1 with the above-described configuration will be described.Fig. 4 is a flow chart showing the operation of the spectroscopic analyzer according to an embodiment of the invention. As shown inFig. 4 , the operation of thespectroscopic analyzer 1 is largely divided into an initial measurement process S1 of calculating the reference spectrum and a measurement analysis process S2 of actually analyzing the characteristics of a sample. Hereinafter, details of processing performed in each of these processes will be described in order. - When power is supplied, the system program and the application program stored in the
memory 73 provided in thePC 70 are read by theCPU 78 and loaded into thememory 73 appropriately. When a reference spectrum calculation instruction from a user is input through theinput section 71 of thePC 70 after the above preparation ends, the reference spectrum measuring program loaded into thememory 73 is executed to start the initial measurement process S1. - When the initial measurement process S1 starts, spectrum measurement using infrared light and near-infrared light is first performed (process S11). Specifically, the
CPU 78 of thePC 70 generates a control signal of theoptical switch 20 and theswitch 50 and transmits it to thecontroller 11 of theFTIR 10 through the I/F 77. After this control signal is received by thecontroller 11, switching of theoptical switch 20 is performed and measurement of the spectrum of infrared region in the infraredspectrum measuring section 30 and measurement of the spectrum of near-infrared region in the near-infraredspectrum measuring section 40 are sequentially performed. Here, since switching of theswitch 50 is also performed in synchronization with the switching of theoptical switch 20, an interferogram of the infrared spectrum and an interferogram of the near-infrared spectrum are output in order through theswitch 50. - The interferogram of the infrared spectrum and the interferogram of the near-infrared spectrum, which have been output from the
switch 50, are converted into digital signals by theAD converter 60 and are then input to thePC 70. Then, the Fourier transform thereof is performed by FFT (Fast Fourier Transform) in order to obtain the spectrum. In addition, the spectrum data of infrared region and the spectrum data of near-infrared region are stored in the infraredspectrum storage region 73a and the near-infraredspectrum storage region 73b, respectively, together with the respective measurement time. - After the above spectrum measurement ends, the infrared spectrum data stored in the infrared
spectrum storage region 73a of thememory 73 and the near-infrared spectrum data stored in the near-infraredspectrum storage region 73b are read by theCPU 78 to be combined (step S12). The integrated spectrum data acquired by this processing is stored in the integratedspectrum storage region 73c of thememory 73. - Here, processing of calculating the integrated spectrum data will be specifically described with reference to
Fig. 5 . Although the integrated spectrum data may be calculated by simply adding the infrared spectrum data and the near-infrared spectrum data, it is desirable to calculate the integrated spectrum data using the method shown inFig. 5. Fig. 5 is a view for explaining a method of calculating the integrated spectrum data in the spectroscopic analyzer according to an embodiment of the invention. - The characters "NIR" in
Fig. 5 indicate the near-infrared spectrum data acquired by measurement of the near-infraredspectrum measuring section 40, and the characters "IR" indicate the infrared spectrum data acquired by measurement of the infraredspectrum measuring section 30. In addition, here, an example where the near-infrared spectrum data is first measured will be described. In addition, the near-infrared spectrum data and the infrared spectrum data are spectrum distribution data of the light absorbance relating to the wave number. - The near-infrared spectrum data and the infrared spectrum data are stored in the near-infrared
spectrum storage region 73b and the infraredspectrum storage region 73a of thememory 73, respectively, in a state that these data are matched to the corresponding measurement time. TheCPU 78 combines the spectrum data of near-infrared region and infrared region stored in thememory 73 while interpolating it. In addition, although an example where interpolation is performed using two continuous sets of spectrum data of near-infrared region and infrared region is described herein, the interpolation method is not limited to this example. - Now, as shown in
Fig. 5 , near-infrared spectrum data al, infrared spectrum data b1, near-infrared spectrum data a2, infrared spectrum data b2, ... are stored in thememory 73 in order from the oldest measurement time. First, theCPU 78 reads the near-infrared spectrum data a1 acquired immediately before the infrared spectrum data b1 and the near-infrared spectrum data a2 acquired immediately after the infrared spectrum data b1 and calculates the average near-infrared spectrum data c1 indicating their average value. In addition, the characters "average NIR" inFig. 5 indicate the average near-infrared spectrum data. Then, theCPU 78 generates the integrated spectrum data e1 by reading the infrared spectrum data b1 and adding the average near-infrared spectrum data cl. The integrated spectrum data e1 is data for interpolating the near-infrared spectrum data at the time when the infrared spectrum data b1 is measured. - Then, the
CPU 78 reads the infrared spectrum data b1 acquired immediately before the near-infrared spectrum data a2 and the infrared spectrum data b2 acquired immediately after the near-infrared spectrum data a2 and calculates the average Infrared spectrum data d1 indicating their average value. In addition, the characters "average IR" inFig. 5 indicate the average infrared spectrum data. Then, theCPU 78 generates the integrated spectrum data e2 by reading the near-infrared spectrum data a2 and adding the average infrared spectrum data d1. The integrated spectrum data e2 is data for interpolating the infrared spectrum data at the time when the near-infrared spectrum data a2 is measured. Then, by repeating the same processing, the integrated spectrum data obtained by combining the spectrum data of infrared region and the spectrum data of near-infrared region is calculated. The integrated spectrum acquired in this way is stored in the integratedspectrum storage region 73c of thememory 73. - After the above processing ends, the
CPU 78 determines whether or not the spectrum measurement using infrared light and near-infrared light has been performed a set number of times (for example, 5 times) set in advance (step S13). When it is determined that the spectrum measurement has not been performed a set number of times (when the determination result is "NO"), the spectrum measurement using infrared light and near-infrared light is performed again (step S11). In contrast, when it is determined that the spectrum measurement has been performed a set number of times (when the determination result is "YES"), theCPU 78 calculates the reference spectrum data (step S14). Specifically, by reading a plurality of integrated spectra stored in the integratedspectrum storage region 73c of thememory 73 and averaging them, the reference spectrum data is calculated. The acquired reference spectrum data is stored in the referencespectrum storage region 73d of thememory 73. Thus, the initial measurement step S1 ends. - When a measurement analysis instruction from a user is input through the
input section 71 of thePC 70 after the initial measurement step S1 ends, the spectrum measuring program and the analysis program loaded into thememory 73 are executed to start a measurement analysis step S2. When the measurement analysis step S2 starts, spectrum measurement using infrared light and near-infrared light is first performed (step S21). Specifically, similar to step S11 of the initial measurement step S1, a control signal generated in theCPU 78 of thePC 70 is transmitted to thecontroller 11 and theoptical switch 20 and theswitch 50 are switched in synchronization with each other. Then, measurement of the spectrum of infrared region in the infraredspectrum measuring section 30 and measurement of the spectrum of near-infrared region in the near-infraredspectrum measuring section 40 are sequentially performed, and an interferogram of the infrared spectrum and an interferogram of the near-infrared spectrum are sequentially output through theswitch 50. - The interferogram of the infrared spectrum and the interferogram of the near-infrared spectrum, which have been output from the
switch 50, are converted into digital signals by theAD converter 60 and then the Fourier transform of the signals is performed by thePC 70. In addition, the spectrum data of infrared region and the spectrum data of near-infrared region are stored in the infraredspectrum storage region 73a and the near-infraredspectrum storage region 73b of thememory 73, respectively, together with the respective measurement time. - After the above spectrum measurement ends, the infrared spectrum data stored in the infrared
spectrum storage region 73a of thememory 73 and the near-infrared spectrum data stored in the near-infraredspectrum storage region 73b are read by theCPU 78 and combined by the same method as the method described usingFig. 5 . As a result, the integrated spectrum is acquired (step S22: first calculation module, first step). The integrated spectrum data acquired by this processing is stored in the integratedspectrum storage region 73c of thememory 73. - Then, the integrated spectrum data stored in the integrated
spectrum storage region 73c is read by theCPU 78, and the predicted value of the concentration of a sample is calculated using the calibration model created in advance using chemometrics (step S23: prediction module). In addition, since a known method can be used as the method of calculating the predicted value of the concentration using the calibration model, a detailed explanation thereof will be omitted herein. The predicted value of the concentration calculated by theCPU 78 is stored in thememory 73. In addition, the predicted value and the integrated spectrum data may be output to an external device through thecommunication section 75. - Then, the predicted value calculated in the last measurement and the predicted value calculated in this measurement are read from the
memory 73 into theCPU 78, and theCPU 78 determines whether or not the difference between these predicted values is equal to or larger than a threshold value set in advance (step S24). Here, since the spectrum measurement of step S21 is performed only once, the predicted value calculated in the last measurement is not present. Accordingly, the processing of step S24 is omitted, and processing (adding processing) of calculating the difference spectrum data and storing it in the differencespectrum storage region 73d of thememory 73 is performed by the CPU 78 (step S25: second calculation module, second step). - Specifically, by reading the integrated spectrum data stored in the integrated
spectrum storage region 73c of thememory 73 and the reference spectrum data stored in the referencespectrum storage region 73d and calculating the difference therebetween by theCPU 78, the difference spectrum data is acquired. The difference spectrum data calculated by theCPU 78 is stored in the differencespectrum storage region 73e of thememory 73. - After the difference spectrum data is calculated, the
CPU 78 determines whether or not the data number (number of times of spectrum measurement using infrared light and near-infrared light) of the spectrum is equal to or larger than a set value (for example, "3") set in advance (step S26). Here, since the spectrum measurement of step S21 is performed only once, the determination result in step S26 is "NO". Accordingly, spectrum measurement is performed again (step S21), the integrated spectrum data is calculated (step S22), and the predicted value of the concentration of a sample is calculated using the calibration model (step S23). In addition, the spectrum data, the integrated spectrum data, and the predicted value of concentration acquired by the above processing are stored in thememory 73. - After the above processing ends, the predicted value calculated in the last measurement and the predicted value calculated in this measurement are read from the
memory 73 into theCPU 78, and theCPU 78 determines whether or not the difference between these predicted values is equal to or larger than a threshold value set in advance (step S24). When the difference between the predicted values is smaller than the threshold value (when the determination result is "NO"), the process returns to step S21 to perform spectrum measurement. In contrast, when the difference between the predicted values is equal to or larger than the threshold value (when the determination result is "YES"), theCPU 78 performs processing of calculating the difference spectrum data and adding it in the differencespectrum storage region 73d of the memory 73 (step S25). - Thus, in the present embodiment, only when the difference between predicted values of concentration is equal to or larger than a threshold value (only when the determination result in step S24 is "YES"), the difference spectrum data is calculated and added in the difference
spectrum storage region 73d of thememory 73. This is for improving the accuracy of correlation (correlation between the spectrum of infrared region and the spectrum of near-infrared region) calculated by the two-dimensional correlation operation performed in step S27, which will be described later, while reducing the time required for the operation as much as possible by suppressing the data number of difference spectrum data. That is, the accuracy of the correlation calculated by the two-dimensional correlation operation is improved by increasing the data number of difference spectrum data when a predicted concentration change is large, and the time required for the two-dimensional correlation operation is reduced as much as possible by not increasing the data number of difference spectrum data when the predicted concentration change is small. In addition, although the threshold value of the predicted value from the measured spectrum is used as a reference herein, there are a number of determination methods in chemometrics. For example, it is possible to use outlier detection for determining whether or not the measured spectrum is abnormal from the shape prediction value of a spectrum and the like. - Now, it is assumed that the data number (number of times of spectrum measurement using infrared light and near-infrared light) of a spectrum is equal to or larger than the set value set in advance. Then, the determination result in step S26 is "YES". Accordingly, the difference spectrum data stored in the difference
spectrum storage region 73e of thememory 73 is read by theCPU 78, and the two-dimensional correlation operation disclosed inNon-patent Documents - Here, the correlation between the spectrum of near-infrared region and the spectrum of infrared region can be calculated even if the integrated spectrum data calculated in step S22 is used. In the present embodiment, the correlation between the spectrum of near-infrared region and the spectrum of infrared region is calculated using the difference spectrum data indicating the difference between the integrated spectrum data and the reference spectrum data in order to catch subtle changes in the characteristics (for example, concentration) of a sample with high sensitivity.
- After the two-dimensional correlation operation ends, the
CPU 78 creates a graph showing the correlation between the spectrum of near-infrared region and the spectrum of infrared region, which is an operation result of the two-dimensional correlation operation, and displays it on the display section 72 (step S28). After the above processing ends, theCPU 78 determines whether or not an analysis end instruction from the user has been input through theinput section 71 of the PC 70 (step S29). When the analysis end instruction has not yet been input (when the determination result in step S29 is "NO"), the process returns to step S21 to perform spectrum measurement again. In contrast, when the analysis end instruction has been input (when the determination result in step S29 is "YES"), the series of processings shown inFig. 4 ends. -
Figs. 6A to 6D are views showing an example of the analysis result of the spectroscopic analyzer according to the embodiment of the invention.Figs. 6A to 6D are graphs showing the two-dimensional correlation acquired when a boric acid solution whose concentration changes is used as a sample.Fig. 6A is a graph when the concentration of boric acid is 1 wt%,Fig. 6B is a graph when the concentration of boric acid is 2 wt%,Fig. 6C is a graph when the concentration of boric acid is 4 wt%, andFig. 6D is a graph when the concentration of a boric acid is 5 wt%. - Referring to
Figs. 6A to 6D , it can be seen that there is correlation between a portion whose wave number of the infrared region is near 1400 [cm-1] and a portion whose wave number of the near-infrared region is near 4500 [cm-1] and the correlation becomes strong gradually as the concentration of the boric acid increases. Here, the chemical formula for the boric acid is expressed as H3BO3, and the peak of absorption by single bond (B-O) between a boron atom and an oxygen atom appears at the wave number of the infrared region near 1400 [cm-1]. Referring toFigs. 6A to 6D , the portion whose wave number of the near-infrared region is near 4500 [cm-1] is correlated with the portion whose wave number of the infrared region is near 1400 [cm-1]. Accordingly, it can be predicted that the peak of absorption appearing at the wave number of the near-infrared region near 4500 [cm-1] is based on the bond (B-OH) between a boron atom and a hydroxyl group. - As described above, in the present embodiment, the integrated spectrum data is acquired by combining the spectrum of infrared region measured by the infrared
spectrum measuring section 30 and the spectrum of near-infrared region measured by the near-infraredspectrum measuring section 40, and then the difference spectrum data of the reference spectrum data measured in advance and the integrated spectrum data is calculated. Then, by performing the two-dimensional correlation operation using the difference spectrum data, correlation (two-dimensional correlation) between the spectrum of near-infrared region and the spectrum of infrared region is calculated. For this reason, even a user who does not have enough knowledge about the spectrum of near-infrared region and the spectrum of infrared region can easily analyze the near-infrared/infrared spectrum of a sample just by referring to the graph showing the two-dimensional correlation between the spectrum of near-infrared region and the spectrum of infrared region. - Moreover, in the
spectroscopic analyzer 1 of the present embodiment, the characteristics of a sample can be analyzed in a short time since the two-dimensional correlation operation is executed while spectrum measurement is being performed. Accordingly, when thespectroscopic analyzer 1 is installed at the production site, such as a factory, an analysis result can be fed back quickly and accurately. As a result, production efficiency can be improved while maintaining the quality of products. - As described above, although the spectroscopic analyzer and the spectroscopic analysis method according to the embodiment of the invention have been described, the invention is not necessarily limited to the above embodiment and may be freely changed within the scope of the invention. For example, although the example of calculating two-dimensional correlation (two-dimensional simultaneous correlation) of the spectrum data calculated simultaneously has been described in the above embodiment, the invention may also be applied to a case of calculating two-dimensional correlation (two-dimensional different-time correlation) of the spectra calculated at a different time. Moreover, as a two-dimensional correlation method, it is also possible to use perturbation-correlation two-dimensional correlation spectroscopy and the like.
- In addition, in the above embodiment, an example has been described in which the
ATR probe 33 and the near-infrared probe 43 are immersed in the same sample and the spectrum of infrared region and the spectrum of near-infrared region are measured. However, a process of measuring the spectrum of infrared region and a process of measuring the spectrum of near-infrared region may be set to be different. For example, the spectrum of infrared region may be measured in a previous process of a drying process of drying products, and the spectrum of near-infrared region may be measured in a subsequent process of the drying process. - Moreover, in the above embodiment, an example has been described in which the difference spectrum data is acquired by calculating the difference between the integrated spectrum data and the reference spectrum data. However, similar effects can be expected even if the difference spectrum data obtained by differentiating the integrated spectrum data is used instead of using the difference spectrum data. In addition, it is thought that even if the difference spectrum data is used, the effect is large if a difference of differential spectra and a reference spectra (for example, which is average data of a plurality of differential spectrum calculated before starting the analysis of the sample) is used.
- Further, in the above embodiment, the light pipe is used as the second measurement section configured to measure a spectrum of infrared region by irradiating the sample with infrared light. However, an infrared light fiber (chalcogenide fiber, sliver halide fiber, a hollow fiber, and the like) may be used as the second measurement section.
- While certain embodiments have been described, these embodiments have been presented by way of example only, and are not intended to limit the scope of the invention. Indeed, the novel apparatus and method described herein may be embodied in a variety of other forms; furthermore, various omissions, substitutions and changes in the form of the apparatus and method, described herein may be made without departing from the sprit of the invention. The accompanying claims and their equivalents are intended to cover such forms or modifications as would fall within the scope and sprit of the invention.
Claims (6)
- A spectroscopic analyzer comprising:a first measurement section configured to measure a spectrum of near-infrared region by irradiating a sample with near-infrared light;a second measurement section configured to measure a spectrum of infrared region by irradiating the sample with infrared light; andan analysis section configured to analyze characteristics of the sample using the spectra measured by the first and second measurement sections,wherein the analysis section includesa first calculation module configured to acquire a integrated spectrum by combining the spectrum of near-infrared region measured by the first measurement section and the spectrum of infrared region measured by the second measurement section,a second calculation module configured to calculate a difference spectrum of a reference spectrum measured in advance and the integrated spectrum, anda third calculation module configured to calculate correlation between the spectrum of near-infrared region and the spectrum of infrared region by performing a two-dimensional correlation operation using the difference spectrum calculated by the second calculation module.
- The spectroscopic analyzer according to claim 1,
wherein the second calculation module is configured to calculate the difference spectrum whenever measurement of a spectrum is performed by the first and second measurement sections. - The spectroscopic analyzer according to claim 1,
wherein the analysis section further includes a prediction module configured to calculate a predicted value of concentration of the sample from the integrated spectrum acquired by the first calculation module using a calibration model showing relationship between concentration and optical absorbance of the sample calculated in advance, and
wherein the second calculation module is configured to calculate the difference spectrum when a difference between the predicted value calculated previously by the prediction module and the newly calculated predicted value is equal to or larger than a predetermined threshold value set in advance. - The spectroscopic analyzer according to claim 1,
wherein the second calculation module is configured to perform an outlier detection for determining whether or not the integrated spectrum acquired by the first calculation module is abnormal using chemometrics and to calculate the difference spectrum based on the integrated spectrum determined to be abnormal. - The spectroscopic analyzer according to any one of claims 1 to 4,
wherein the reference spectrum is a spectrum obtained by averaging the integrated spectra acquired by the first calculation module when the first and second measurement sections have measured spectra a plural number of times by irradiating the sample with near-infrared light and infrared light in advance before analysis of the sample starts. - A spectroscopic analysis method used in a spectroscopic analyzer including a first measurement section configured to measure a spectrum of near-infrared region by irradiating a sample with near-infrared light and a second measurement section configured to measure a spectrum of infrared region by irradiating the sample with infrared light, the spectroscopic analysis method comprising:acquiring a integrated spectrum by combining the spectrum of near-infrared region measured by the first measurement section and the spectrum of infrared region measured by the second measurement section;calculating a difference spectrum of a reference spectrum measured in advance and the integrated spectrum; andcalculating correlation between the spectrum of near-infrared region and the spectrum of infrared region by performing a two-dimensional correlation operation using the difference spectrum.
Applications Claiming Priority (1)
| Application Number | Priority Date | Filing Date | Title |
|---|---|---|---|
| JP2010133211A JP4997652B2 (en) | 2010-06-10 | 2010-06-10 | Spectroscopic analyzer |
Publications (1)
| Publication Number | Publication Date |
|---|---|
| EP2395332A1 true EP2395332A1 (en) | 2011-12-14 |
Family
ID=44588280
Family Applications (1)
| Application Number | Title | Priority Date | Filing Date |
|---|---|---|---|
| EP20110169445 Withdrawn EP2395332A1 (en) | 2010-06-10 | 2011-06-10 | Spectroscopic analyzer and spectroscopic analysis method |
Country Status (4)
| Country | Link |
|---|---|
| US (1) | US20110307187A1 (en) |
| EP (1) | EP2395332A1 (en) |
| JP (1) | JP4997652B2 (en) |
| CN (1) | CN102364328A (en) |
Cited By (3)
| Publication number | Priority date | Publication date | Assignee | Title |
|---|---|---|---|---|
| GB2504928A (en) * | 2012-08-06 | 2014-02-19 | Perkinelmer Uk Ltd | Diamond attenuated total reflectance spectrum artefact correction |
| CN103868881A (en) * | 2012-12-13 | 2014-06-18 | 中国石油化工股份有限公司 | Method for test of wax content in asphalt |
| CN110927097A (en) * | 2019-11-21 | 2020-03-27 | 中国人民解放军总医院第五医学中心 | A kind of detection method and application of near-infrared spectrum of rhubarb formula granules |
Families Citing this family (12)
| Publication number | Priority date | Publication date | Assignee | Title |
|---|---|---|---|---|
| CN102207761A (en) * | 2010-03-29 | 2011-10-05 | 鸿富锦精密工业(深圳)有限公司 | temperature monitoring system |
| US20150141847A1 (en) * | 2013-11-20 | 2015-05-21 | The George Washington University | Systems and methods for hyperspectral analysis of cardiac tissue |
| KR101574895B1 (en) * | 2014-06-26 | 2015-12-04 | 제주대학교 산학협력단 | Method for predicting sugar contents and acidity of citrus using ft-ir fingerprinting combined by multivariate analysis |
| CN110632024B (en) * | 2019-10-29 | 2022-06-24 | 五邑大学 | Quantitative analysis method, device and equipment based on infrared spectrum and storage medium |
| AT523187A1 (en) * | 2019-11-28 | 2021-06-15 | Anton Paar Gmbh | Determination of an impairment of an optical surface for IR spectroscopy |
| CN112881334B (en) * | 2021-01-20 | 2022-08-26 | 山东非金属材料研究所 | Method for detecting itaconic acid content in poly (acrylonitrile-itaconic acid) |
| CN114018861B (en) * | 2021-10-28 | 2023-07-07 | 四川启睿克科技有限公司 | Spectral reconstruction method based on characteristic peaks |
| CN114279962B (en) * | 2021-12-21 | 2023-07-25 | 四川启睿克科技有限公司 | Illumination self-adaption method based on portable near infrared spectrometer |
| CN114354537B (en) * | 2022-01-14 | 2023-07-25 | 四川启睿克科技有限公司 | Abnormal spectrum discrimination method based on American ginseng |
| US20240019305A1 (en) * | 2022-07-15 | 2024-01-18 | Verity Instruments, Inc. | System and method for fault detection and operational readiness for optical instruments for semiconductor processes |
| CN116559108B (en) * | 2023-05-19 | 2024-01-12 | 中国科学院地理科学与资源研究所 | Near infrared spectrum diagnosis index extraction method for low-concentration petroleum hydrocarbon contaminated soil |
| CN118032695B (en) * | 2024-04-02 | 2024-09-20 | 山东创宇能源科技股份有限公司 | Nitrogen-sulfur in-situ measurement method and system based on differential ultraviolet spectrum technology |
Citations (1)
| Publication number | Priority date | Publication date | Assignee | Title |
|---|---|---|---|---|
| JP2009168711A (en) | 2008-01-18 | 2009-07-30 | Yokogawa Electric Corp | Near-infrared light and infrared light spectrometer |
Family Cites Families (3)
| Publication number | Priority date | Publication date | Assignee | Title |
|---|---|---|---|---|
| US3976883A (en) * | 1973-05-10 | 1976-08-24 | Honeywell Inc. | Infrared analyzer |
| CN1201144C (en) * | 2003-04-26 | 2005-05-11 | 清华大学 | Multistage macroscopical fingerprint method for identifying non-separated extracted infrared spectrum of medicinal materials in Chinese traditional medicine |
| JP2006112996A (en) * | 2004-10-18 | 2006-04-27 | Yokogawa Electric Corp | Near-infrared spectrometer |
-
2010
- 2010-06-10 JP JP2010133211A patent/JP4997652B2/en active Active
-
2011
- 2011-06-10 US US13/157,523 patent/US20110307187A1/en not_active Abandoned
- 2011-06-10 EP EP20110169445 patent/EP2395332A1/en not_active Withdrawn
- 2011-06-10 CN CN2011101575746A patent/CN102364328A/en active Pending
Patent Citations (1)
| Publication number | Priority date | Publication date | Assignee | Title |
|---|---|---|---|---|
| JP2009168711A (en) | 2008-01-18 | 2009-07-30 | Yokogawa Electric Corp | Near-infrared light and infrared light spectrometer |
Non-Patent Citations (13)
| Title |
|---|
| "Two-dimensional correlation analysis", WIKIPEDIA, 22 May 2010 (2010-05-22), pages 1 - 7, XP055007799, Retrieved from the Internet <URL:http://en.wikipedia.org/w/index.php?title=Special:Book&bookcmd=download&collection_id=5b04f7e1384fbbd4&writer=rl&return_to=Two-dimensional correlation analysis> [retrieved on 20110922] * |
| "Two-dimensional correlation spectroscopy - applications in vibrational and optical spectroscopy", 1 January 2004, JOHN WILEY & SONS, LTD., article I NODA ET AL: "Application of heterospectral correlation analysis", pages: 257 - 269, XP055007857 * |
| "Two-dimensional correlation spectroscopy - applications in vibrational and optical spectroscopy", 1 January 2004, JOHN WILEY & SONS, LTD., article I NODA ET AL: "Generalized Two-dimensional Correlation Spectroscopy in Practice", pages: 47 - 64, XP055007862 * |
| CZARNECKI M A: "INTERPRETATION OF TWO-DIMENSIONAL CORRELATION SPECTRA: SCIENCE OR ART?", APPLIED SPECTROSCOPY, THE SOCIETY FOR APPLIED SPECTROSCOPY. BALTIMORE, US, vol. 52, no. 12, 1 December 1998 (1998-12-01), pages 1583 - 1590, XP000804268, ISSN: 0003-7028, DOI: 10.1366/0003702981943086 * |
| CZARNIK-MATUSEWICZ B ET AL: "Temperature-dependent water structural transitions examined by near-IR and mid-IR spectra analyzed by multivariate curve resolution and two-dimensional correlation spectroscopy", ANALYTICA CHIMICA ACTA, ELSEVIER, AMSTERDAM, NL, vol. 544, no. 1-2, 15 July 2005 (2005-07-15), pages 15 - 25, XP027182669, ISSN: 0003-2670, [retrieved on 20050615] * |
| HAUFA K Z ET AL: "Effect of temperature and water content on the structure of 1,2-propanediol and 1,3-propanediol: Near-infrared spectroscopic study", VIBRATIONAL SPECTROSCOPY, ELSEVIER SCIENCE, AMSTERDAM, NL, vol. 51, no. 1, 18 September 2009 (2009-09-18), pages 80 - 85, XP026235747, ISSN: 0924-2031, [retrieved on 20081107], DOI: 10.1016/J.VIBSPEC.2008.10.013 * |
| MIROSLAW A CZARNECKI ET AL: "2D FT-NIR and FT-IR correlation analysis of temperature-induced changes of nylon12", CHEMICAL PHYSICS LETTERS, vol. 283, no. 5-6, 13 February 1998 (1998-02-13), pages 326 - 332, XP055007766, ISSN: 0009-2614, DOI: 10.1016/S0009-2614(97)01397-3 * |
| MIROSLAW A CZARNECKI: "Two-Dimensional Correlation Spectroscopy: Effect of Reference Spectrum on Noise-Free and Noisy Spectra", APPLIED SPECTROSCOPY, vol. 57, no. 8, 1 August 2003 (2003-08-01), pages 991 - 995, XP055007815 * |
| NODA ET AL.: "Generalized Two-Dimensional Correlation Spectroscopy", APPLIED SPECTROSCOPY, vol. 54, no. 7, pages 236A - 248A |
| NODA ET AL: "Progress in two-dimensional (2D) correlation spectroscopy", JOURNAL OF MOLECULAR STRUCTURE, ELSEVIER, AMSTERDAM, NL, vol. 799, no. 1-3, 6 November 2006 (2006-11-06), pages 2 - 15, XP025186666, ISSN: 0022-2860, [retrieved on 20061106], DOI: 10.1016/J.MOLSTRUC.2006.03.053 * |
| PETER J. TANDLER ET AL: "Effects of static spectrum removal and noise on 2D-correlation spectra of kinetic data", ANALYTICA CHIMICA ACTA, vol. 368, no. 1-2, 1 July 1998 (1998-07-01), pages 45 - 57, XP055007822, ISSN: 0003-2670, DOI: 10.1016/S0003-2670(98)00195-0 * |
| ROBERT A. COCCIARDI ET AL: "Heterospectral Two-Dimensional Correlation Spectroscopy of Mid-Infrared and Fourier Self-Deconvolved Near-Infrared Spectra of Sugar Solutions", JOURNAL OF AGRICULTURAL AND FOOD CHEMISTRY, vol. 54, no. 18, 1 September 2006 (2006-09-01), pages 6475 - 6481, XP055007800, ISSN: 0021-8561, DOI: 10.1021/jf060266a * |
| TORU AMARI ET AL.: "Generalized Two-Dimensional Attenuated Total Reflection/Infrared and Near-Infrared Correlation Spectroscopy Studies of Real-Time Monitoring of the Initial Oligomerization of Bis(hydroxyethyl terephthalate", MACROMOLECULES, vol. 35, 2002, pages 8020 - 8028 |
Cited By (4)
| Publication number | Priority date | Publication date | Assignee | Title |
|---|---|---|---|---|
| GB2504928A (en) * | 2012-08-06 | 2014-02-19 | Perkinelmer Uk Ltd | Diamond attenuated total reflectance spectrum artefact correction |
| US10018561B2 (en) | 2012-08-06 | 2018-07-10 | Perkinelmer Singapore Pte Ltd | Diamond ATR artefact correction |
| CN103868881A (en) * | 2012-12-13 | 2014-06-18 | 中国石油化工股份有限公司 | Method for test of wax content in asphalt |
| CN110927097A (en) * | 2019-11-21 | 2020-03-27 | 中国人民解放军总医院第五医学中心 | A kind of detection method and application of near-infrared spectrum of rhubarb formula granules |
Also Published As
| Publication number | Publication date |
|---|---|
| US20110307187A1 (en) | 2011-12-15 |
| JP4997652B2 (en) | 2012-08-08 |
| JP2011257306A (en) | 2011-12-22 |
| CN102364328A (en) | 2012-02-29 |
Similar Documents
| Publication | Publication Date | Title |
|---|---|---|
| US20110307187A1 (en) | Spectroscopic analyzer and spectroscopic analysis method | |
| TWI468666B (en) | Monitoring, detecting and quantifying chemical compounds in a sample | |
| EP3951366A1 (en) | Product inspection method and product inspection device | |
| CN113252634A (en) | Real-time monitoring of wine fermentation characteristics using raman spectroscopy | |
| JP5201214B2 (en) | Spectrophotometer | |
| WO2015145429A1 (en) | A system for a stimulated raman scattering (srs) spectrophotometer and a method of use thereof | |
| JP5181689B2 (en) | Near-infrared light and infrared light spectrometer | |
| JP2016191677A (en) | Specimen analyzer, blood coagulation analyzer, specimen analysis method and computer program | |
| CN109154489A (en) | Use the Precision Position Location System of Wavelength tunable laser | |
| CN118500594B (en) | Terahertz time domain undersampling spectrum method and system for stress measurement | |
| Zhou et al. | A rapid determination of wheat flours components based on near infrared spectroscopy and chemometrics | |
| RU2571185C2 (en) | Method to compensate for amplitude drift in spectrometer and spectrometer realising specified method | |
| CN109991181A (en) | Adaptive surface absorption spectrum analyzing method, system, storage medium, equipment | |
| JP2022050277A (en) | Spectroscopic measurement method, spectroscopic measurement device, product inspection method, product inspection device and product selection device | |
| CN111579526B (en) | A method for characterizing near-infrared instrument variance and correction | |
| US20210055096A1 (en) | Digitizer for an optical coherence tomography imager | |
| CN119534381A (en) | A rapid detection method and system for evaluating sesame oil quality | |
| Yue et al. | Benchtop and different miniaturized near-infrared spectrometers application study: Calibration transfer and 2D-COS for in-situ analysis of moisture content in HPMC | |
| CN118671026A (en) | Polymerization reaction monomer conversion rate on-line monitoring method and device | |
| JP4722513B2 (en) | Apparatus and method for measuring the concentration of an acid solution containing peracetic acid | |
| Kuligowski et al. | An infrared spectroscopic tool for process monitoring: Sugar contents during the production of a depilatory formulation | |
| CN107894406B (en) | Control method, device, storage medium and computer equipment of Fourier transform infrared spectrometer | |
| Kasemsumran et al. | Moving window cross validation: A new cross validation method for the selection of a rational number of components in a partial least squares calibration model | |
| JP2018040648A (en) | Laser type gas analysis device | |
| US20250389584A1 (en) | Spectroscopic analysis apparatus, spectroscopic analysis method, and spectroscopic analysis program |
Legal Events
| Date | Code | Title | Description |
|---|---|---|---|
| AK | Designated contracting states |
Kind code of ref document: A1 Designated state(s): AL AT BE BG CH CY CZ DE DK EE ES FI FR GB GR HR HU IE IS IT LI LT LU LV MC MK MT NL NO PL PT RO RS SE SI SK SM TR |
|
| AX | Request for extension of the european patent |
Extension state: BA ME |
|
| PUAI | Public reference made under article 153(3) epc to a published international application that has entered the european phase |
Free format text: ORIGINAL CODE: 0009012 |
|
| 17P | Request for examination filed |
Effective date: 20120613 |
|
| STAA | Information on the status of an ep patent application or granted ep patent |
Free format text: STATUS: THE APPLICATION HAS BEEN WITHDRAWN |
|
| 18W | Application withdrawn |
Effective date: 20140203 |