EP2381257B1 - Sequential analysis of biological samples - Google Patents
Sequential analysis of biological samples Download PDFInfo
- Publication number
- EP2381257B1 EP2381257B1 EP11175116.0A EP11175116A EP2381257B1 EP 2381257 B1 EP2381257 B1 EP 2381257B1 EP 11175116 A EP11175116 A EP 11175116A EP 2381257 B1 EP2381257 B1 EP 2381257B1
- Authority
- EP
- European Patent Office
- Prior art keywords
- sample
- signal
- antibody
- probe
- targets
- Prior art date
- Legal status (The legal status is an assumption and is not a legal conclusion. Google has not performed a legal analysis and makes no representation as to the accuracy of the status listed.)
- Active
Links
- 239000012472 biological sample Substances 0.000 title claims abstract description 134
- 238000012882 sequential analysis Methods 0.000 title 1
- 239000000523 sample Substances 0.000 claims abstract description 408
- 238000000034 method Methods 0.000 claims abstract description 124
- 230000027455 binding Effects 0.000 claims abstract description 84
- 239000007800 oxidant agent Substances 0.000 claims abstract description 69
- 239000000243 solution Substances 0.000 claims description 118
- MHAJPDPJQMAIIY-UHFFFAOYSA-N Hydrogen peroxide Chemical group OO MHAJPDPJQMAIIY-UHFFFAOYSA-N 0.000 claims description 42
- 238000007254 oxidation reaction Methods 0.000 claims description 18
- 239000003637 basic solution Substances 0.000 claims description 15
- 230000003647 oxidation Effects 0.000 claims description 13
- JHWIEAWILPSRMU-UHFFFAOYSA-N 2-methyl-3-pyrimidin-4-ylpropanoic acid Chemical compound OC(=O)C(C)CC1=CC=NC=N1 JHWIEAWILPSRMU-UHFFFAOYSA-N 0.000 claims description 5
- 239000012286 potassium permanganate Substances 0.000 claims description 5
- WKBOTKDWSSQWDR-UHFFFAOYSA-N Bromine atom Chemical compound [Br] WKBOTKDWSSQWDR-UHFFFAOYSA-N 0.000 claims description 4
- GDTBXPJZTBHREO-UHFFFAOYSA-N bromine Substances BrBr GDTBXPJZTBHREO-UHFFFAOYSA-N 0.000 claims description 4
- 229910052794 bromium Inorganic materials 0.000 claims description 4
- CIHOLLKRGTVIJN-UHFFFAOYSA-N tert‐butyl hydroperoxide Chemical compound CC(C)(C)OO CIHOLLKRGTVIJN-UHFFFAOYSA-N 0.000 claims description 4
- 239000003638 chemical reducing agent Substances 0.000 claims description 3
- DKNPRRRKHAEUMW-UHFFFAOYSA-N Iodine aqueous Chemical compound [K+].I[I-]I DKNPRRRKHAEUMW-UHFFFAOYSA-N 0.000 claims description 2
- 230000000415 inactivating effect Effects 0.000 claims description 2
- 239000004094 surface-active agent Substances 0.000 claims description 2
- ANRHNWWPFJCPAZ-UHFFFAOYSA-M thionine Chemical compound [Cl-].C1=CC(N)=CC2=[S+]C3=CC(N)=CC=C3N=C21 ANRHNWWPFJCPAZ-UHFFFAOYSA-M 0.000 claims 1
- 239000007850 fluorescent dye Substances 0.000 abstract description 23
- HEMHJVSKTPXQMS-UHFFFAOYSA-M Sodium hydroxide Chemical compound [OH-].[Na+] HEMHJVSKTPXQMS-UHFFFAOYSA-M 0.000 description 206
- 210000001519 tissue Anatomy 0.000 description 113
- 239000011230 binding agent Substances 0.000 description 109
- 239000000975 dye Substances 0.000 description 99
- 238000010186 staining Methods 0.000 description 63
- 230000006378 damage Effects 0.000 description 56
- FWBHETKCLVMNFS-UHFFFAOYSA-N 4',6-Diamino-2-phenylindol Chemical compound C1=CC(C(=N)N)=CC=C1C1=CC2=CC=C(C(N)=N)C=C2N1 FWBHETKCLVMNFS-UHFFFAOYSA-N 0.000 description 51
- 238000003384 imaging method Methods 0.000 description 50
- 108091006146 Channels Proteins 0.000 description 41
- 230000000877 morphologic effect Effects 0.000 description 39
- 239000000427 antigen Substances 0.000 description 38
- 102000036639 antigens Human genes 0.000 description 38
- 108091007433 antigens Proteins 0.000 description 38
- 230000006870 function Effects 0.000 description 37
- 238000001000 micrograph Methods 0.000 description 37
- -1 -D-galactosidase Proteins 0.000 description 34
- 102000004190 Enzymes Human genes 0.000 description 34
- 108090000790 Enzymes Proteins 0.000 description 34
- 238000000862 absorption spectrum Methods 0.000 description 34
- 229940088598 enzyme Drugs 0.000 description 34
- 102000004169 proteins and genes Human genes 0.000 description 34
- 108090000623 proteins and genes Proteins 0.000 description 34
- 210000004027 cell Anatomy 0.000 description 33
- 239000013043 chemical agent Substances 0.000 description 31
- 238000001514 detection method Methods 0.000 description 31
- QGKMIGUHVLGJBR-UHFFFAOYSA-M (4z)-1-(3-methylbutyl)-4-[[1-(3-methylbutyl)quinolin-1-ium-4-yl]methylidene]quinoline;iodide Chemical compound [I-].C12=CC=CC=C2N(CCC(C)C)C=CC1=CC1=CC=[N+](CCC(C)C)C2=CC=CC=C12 QGKMIGUHVLGJBR-UHFFFAOYSA-M 0.000 description 30
- 230000004048 modification Effects 0.000 description 26
- 238000012986 modification Methods 0.000 description 26
- XLYOFNOQVPJJNP-UHFFFAOYSA-N water Substances O XLYOFNOQVPJJNP-UHFFFAOYSA-N 0.000 description 26
- 238000004458 analytical method Methods 0.000 description 25
- 238000002835 absorbance Methods 0.000 description 23
- 102000039446 nucleic acids Human genes 0.000 description 23
- 108020004707 nucleic acids Proteins 0.000 description 23
- 150000007523 nucleic acids Chemical class 0.000 description 23
- 239000000758 substrate Substances 0.000 description 23
- 241000283074 Equus asinus Species 0.000 description 20
- 238000011534 incubation Methods 0.000 description 19
- 102000005962 receptors Human genes 0.000 description 18
- 108020003175 receptors Proteins 0.000 description 18
- 230000000694 effects Effects 0.000 description 17
- 230000003993 interaction Effects 0.000 description 17
- 239000007787 solid Substances 0.000 description 17
- 238000001228 spectrum Methods 0.000 description 16
- 108020004414 DNA Proteins 0.000 description 15
- 150000001412 amines Chemical class 0.000 description 14
- JQWHASGSAFIOCM-UHFFFAOYSA-M sodium periodate Chemical compound [Na+].[O-]I(=O)(=O)=O JQWHASGSAFIOCM-UHFFFAOYSA-M 0.000 description 14
- 238000011282 treatment Methods 0.000 description 14
- 241000283707 Capra Species 0.000 description 13
- 108010001336 Horseradish Peroxidase Proteins 0.000 description 13
- 206010028980 Neoplasm Diseases 0.000 description 13
- 238000003364 immunohistochemistry Methods 0.000 description 13
- 210000003719 b-lymphocyte Anatomy 0.000 description 12
- 102000015735 Beta-catenin Human genes 0.000 description 11
- 108060000903 Beta-catenin Proteins 0.000 description 11
- 241000283973 Oryctolagus cuniculus Species 0.000 description 11
- 150000001448 anilines Chemical class 0.000 description 11
- 210000000481 breast Anatomy 0.000 description 11
- GNBHRKFJIUUOQI-UHFFFAOYSA-N fluorescein Chemical compound O1C(=O)C2=CC=CC=C2C21C1=CC=C(O)C=C1OC1=CC(O)=CC=C21 GNBHRKFJIUUOQI-UHFFFAOYSA-N 0.000 description 11
- LFQSCWFLJHTTHZ-UHFFFAOYSA-N Ethanol Chemical compound CCO LFQSCWFLJHTTHZ-UHFFFAOYSA-N 0.000 description 10
- 201000010099 disease Diseases 0.000 description 10
- 208000037265 diseases, disorders, signs and symptoms Diseases 0.000 description 10
- 210000002307 prostate Anatomy 0.000 description 10
- 108091003079 Bovine Serum Albumin Proteins 0.000 description 9
- 102100025475 Carcinoembryonic antigen-related cell adhesion molecule 5 Human genes 0.000 description 9
- 102000011782 Keratins Human genes 0.000 description 9
- 108010076876 Keratins Proteins 0.000 description 9
- 239000002585 base Substances 0.000 description 9
- 229940098773 bovine serum albumin Drugs 0.000 description 9
- 230000001590 oxidative effect Effects 0.000 description 9
- 238000005406 washing Methods 0.000 description 9
- 108010022366 Carcinoembryonic Antigen Proteins 0.000 description 8
- WZUVPPKBWHMQCE-UHFFFAOYSA-N Haematoxylin Chemical compound C12=CC(O)=C(O)C=C2CC2(O)C1C1=CC=C(O)C(O)=C1OC2 WZUVPPKBWHMQCE-UHFFFAOYSA-N 0.000 description 8
- CDBYLPFSWZWCQE-UHFFFAOYSA-L Sodium Carbonate Chemical compound [Na+].[Na+].[O-]C([O-])=O CDBYLPFSWZWCQE-UHFFFAOYSA-L 0.000 description 8
- 150000001298 alcohols Chemical class 0.000 description 8
- 238000006243 chemical reaction Methods 0.000 description 8
- 210000001072 colon Anatomy 0.000 description 8
- 238000010790 dilution Methods 0.000 description 8
- 239000012895 dilution Substances 0.000 description 8
- 238000002156 mixing Methods 0.000 description 8
- 239000000203 mixture Substances 0.000 description 8
- 210000000056 organ Anatomy 0.000 description 8
- 108090000765 processed proteins & peptides Proteins 0.000 description 8
- 239000000126 substance Substances 0.000 description 8
- 108091023037 Aptamer Proteins 0.000 description 7
- 108050007957 Cadherin Proteins 0.000 description 7
- 102000000905 Cadherin Human genes 0.000 description 7
- UIIMBOGNXHQVGW-UHFFFAOYSA-M Sodium bicarbonate Chemical compound [Na+].OC([O-])=O UIIMBOGNXHQVGW-UHFFFAOYSA-M 0.000 description 7
- 239000000872 buffer Substances 0.000 description 7
- 230000001413 cellular effect Effects 0.000 description 7
- 239000003153 chemical reaction reagent Substances 0.000 description 7
- 239000003795 chemical substances by application Substances 0.000 description 7
- 230000000875 corresponding effect Effects 0.000 description 7
- 239000012188 paraffin wax Substances 0.000 description 7
- 102000013415 peroxidase activity proteins Human genes 0.000 description 7
- 108040007629 peroxidase activity proteins Proteins 0.000 description 7
- 230000002829 reductive effect Effects 0.000 description 7
- HOZOZZFCZRXYEK-HNHWXVNLSA-M scopolamine butylbromide Chemical compound [Br-].C1([C@@H](CO)C(=O)OC2C[C@@H]3[N+]([C@H](C2)[C@@H]2[C@H]3O2)(C)CCCC)=CC=CC=C1 HOZOZZFCZRXYEK-HNHWXVNLSA-M 0.000 description 7
- 108091032973 (ribonucleotides)n+m Proteins 0.000 description 6
- LOPCOKFMJOYXHI-UHFFFAOYSA-N Cy7 dye Chemical compound C1=C(S([O-])(=O)=O)C=C2CC(C=CC=CC=CC=C3N(C4=CC=C(C=C4C3)S(O)(=O)=O)CC)=[N+](CCCCCC(O)=O)C2=C1 LOPCOKFMJOYXHI-UHFFFAOYSA-N 0.000 description 6
- 108060003951 Immunoglobulin Proteins 0.000 description 6
- 229910021578 Iron(III) chloride Inorganic materials 0.000 description 6
- HQABUPZFAYXKJW-UHFFFAOYSA-N butan-1-amine Chemical compound CCCCN HQABUPZFAYXKJW-UHFFFAOYSA-N 0.000 description 6
- 238000000354 decomposition reaction Methods 0.000 description 6
- 230000005284 excitation Effects 0.000 description 6
- 125000000524 functional group Chemical group 0.000 description 6
- 102000018358 immunoglobulin Human genes 0.000 description 6
- RBTARNINKXHZNM-UHFFFAOYSA-K iron trichloride Chemical compound Cl[Fe](Cl)Cl RBTARNINKXHZNM-UHFFFAOYSA-K 0.000 description 6
- 150000002632 lipids Chemical class 0.000 description 6
- 238000005259 measurement Methods 0.000 description 6
- 238000002493 microarray Methods 0.000 description 6
- 150000002978 peroxides Chemical class 0.000 description 6
- 150000002989 phenols Chemical class 0.000 description 6
- NLKNQRATVPKPDG-UHFFFAOYSA-M potassium iodide Substances [K+].[I-] NLKNQRATVPKPDG-UHFFFAOYSA-M 0.000 description 6
- 150000003573 thiols Chemical class 0.000 description 6
- 108010085238 Actins Proteins 0.000 description 5
- 102000007469 Actins Human genes 0.000 description 5
- OHOQEZWSNFNUSY-UHFFFAOYSA-N Cy3-bifunctional dye zwitterion Chemical compound O=C1CCC(=O)N1OC(=O)CCCCCN1C2=CC=C(S(O)(=O)=O)C=C2C(C)(C)C1=CC=CC(C(C1=CC(=CC=C11)S([O-])(=O)=O)(C)C)=[N+]1CCCCCC(=O)ON1C(=O)CCC1=O OHOQEZWSNFNUSY-UHFFFAOYSA-N 0.000 description 5
- 102000003886 Glycoproteins Human genes 0.000 description 5
- 108090000288 Glycoproteins Proteins 0.000 description 5
- 102000008394 Immunoglobulin Fragments Human genes 0.000 description 5
- 108010021625 Immunoglobulin Fragments Proteins 0.000 description 5
- 210000001744 T-lymphocyte Anatomy 0.000 description 5
- 238000004061 bleaching Methods 0.000 description 5
- 230000000903 blocking effect Effects 0.000 description 5
- 239000007853 buffer solution Substances 0.000 description 5
- 208000029742 colonic neoplasm Diseases 0.000 description 5
- 230000002596 correlated effect Effects 0.000 description 5
- 239000003446 ligand Substances 0.000 description 5
- 235000013336 milk Nutrition 0.000 description 5
- 239000008267 milk Substances 0.000 description 5
- 210000004080 milk Anatomy 0.000 description 5
- 210000003470 mitochondria Anatomy 0.000 description 5
- 238000002360 preparation method Methods 0.000 description 5
- PYWVYCXTNDRMGF-UHFFFAOYSA-N rhodamine B Chemical compound [Cl-].C=12C=CC(=[N+](CC)CC)C=C2OC2=CC(N(CC)CC)=CC=C2C=1C1=CC=CC=C1C(O)=O PYWVYCXTNDRMGF-UHFFFAOYSA-N 0.000 description 5
- 238000012360 testing method Methods 0.000 description 5
- AGBWDHTZUCGTAI-UHFFFAOYSA-N 1-(cycloundecen-1-yl)-3-diazocycloundecene Chemical compound [N-]=[N+]=C1CCCCCCCCC(C=2CCCCCCCCCC=2)=C1 AGBWDHTZUCGTAI-UHFFFAOYSA-N 0.000 description 4
- 102100029855 Caspase-3 Human genes 0.000 description 4
- 102000016362 Catenins Human genes 0.000 description 4
- 108010067316 Catenins Proteins 0.000 description 4
- 108050006400 Cyclin Proteins 0.000 description 4
- 102100038595 Estrogen receptor Human genes 0.000 description 4
- 102100025756 Keratin, type II cytoskeletal 5 Human genes 0.000 description 4
- 108010070553 Keratin-5 Proteins 0.000 description 4
- 102100036691 Proliferating cell nuclear antigen Human genes 0.000 description 4
- 206010060862 Prostate cancer Diseases 0.000 description 4
- 108010072866 Prostate-Specific Antigen Proteins 0.000 description 4
- 102100038358 Prostate-specific antigen Human genes 0.000 description 4
- 208000000236 Prostatic Neoplasms Diseases 0.000 description 4
- DZBUGLKDJFMEHC-UHFFFAOYSA-N acridine Chemical compound C1=CC=CC2=CC3=CC=CC=C3N=C21 DZBUGLKDJFMEHC-UHFFFAOYSA-N 0.000 description 4
- 238000013019 agitation Methods 0.000 description 4
- 150000001299 aldehydes Chemical class 0.000 description 4
- 150000001413 amino acids Chemical group 0.000 description 4
- 229940046836 anti-estrogen Drugs 0.000 description 4
- 230000001833 anti-estrogenic effect Effects 0.000 description 4
- VHRGRCVQAFMJIZ-UHFFFAOYSA-N cadaverine Chemical compound NCCCCCN VHRGRCVQAFMJIZ-UHFFFAOYSA-N 0.000 description 4
- 239000007795 chemical reaction product Substances 0.000 description 4
- 150000001875 compounds Chemical class 0.000 description 4
- 210000000805 cytoplasm Anatomy 0.000 description 4
- 230000003247 decreasing effect Effects 0.000 description 4
- YQGOJNYOYNNSMM-UHFFFAOYSA-N eosin Chemical compound [Na+].OC(=O)C1=CC=CC=C1C1=C2C=C(Br)C(=O)C(Br)=C2OC2=C(Br)C(O)=C(Br)C=C21 YQGOJNYOYNNSMM-UHFFFAOYSA-N 0.000 description 4
- 239000000328 estrogen antagonist Substances 0.000 description 4
- 238000012744 immunostaining Methods 0.000 description 4
- 230000000670 limiting effect Effects 0.000 description 4
- 230000004807 localization Effects 0.000 description 4
- 230000003287 optical effect Effects 0.000 description 4
- 102000040430 polynucleotide Human genes 0.000 description 4
- 108091033319 polynucleotide Proteins 0.000 description 4
- 239000002157 polynucleotide Substances 0.000 description 4
- 230000008569 process Effects 0.000 description 4
- BBEAQIROQSPTKN-UHFFFAOYSA-N pyrene Chemical compound C1=CC=C2C=CC3=CC=CC4=CC=C1C2=C43 BBEAQIROQSPTKN-UHFFFAOYSA-N 0.000 description 4
- 239000002096 quantum dot Substances 0.000 description 4
- 230000002285 radioactive effect Effects 0.000 description 4
- 210000002966 serum Anatomy 0.000 description 4
- 229910000030 sodium bicarbonate Inorganic materials 0.000 description 4
- 229910000029 sodium carbonate Inorganic materials 0.000 description 4
- 230000009870 specific binding Effects 0.000 description 4
- 108010047303 von Willebrand Factor Proteins 0.000 description 4
- 102100036537 von Willebrand factor Human genes 0.000 description 4
- 229960001134 von willebrand factor Drugs 0.000 description 4
- MJKVTPMWOKAVMS-UHFFFAOYSA-N 3-hydroxy-1-benzopyran-2-one Chemical compound C1=CC=C2OC(=O)C(O)=CC2=C1 MJKVTPMWOKAVMS-UHFFFAOYSA-N 0.000 description 3
- QTBSBXVTEAMEQO-UHFFFAOYSA-N Acetic acid Chemical compound CC(O)=O QTBSBXVTEAMEQO-UHFFFAOYSA-N 0.000 description 3
- WEVYAHXRMPXWCK-UHFFFAOYSA-N Acetonitrile Chemical compound CC#N WEVYAHXRMPXWCK-UHFFFAOYSA-N 0.000 description 3
- 102100032187 Androgen receptor Human genes 0.000 description 3
- 206010006187 Breast cancer Diseases 0.000 description 3
- 208000026310 Breast neoplasm Diseases 0.000 description 3
- 108010091675 Cellular Apoptosis Susceptibility Protein Proteins 0.000 description 3
- 102100025064 Cellular tumor antigen p53 Human genes 0.000 description 3
- IAZDPXIOMUYVGZ-UHFFFAOYSA-N Dimethylsulphoxide Chemical compound CS(C)=O IAZDPXIOMUYVGZ-UHFFFAOYSA-N 0.000 description 3
- 102100029091 Exportin-2 Human genes 0.000 description 3
- PEDCQBHIVMGVHV-UHFFFAOYSA-N Glycerine Chemical compound OCC(O)CO PEDCQBHIVMGVHV-UHFFFAOYSA-N 0.000 description 3
- 102100033421 Keratin, type I cytoskeletal 18 Human genes 0.000 description 3
- 102100023972 Keratin, type II cytoskeletal 8 Human genes 0.000 description 3
- 108010066327 Keratin-18 Proteins 0.000 description 3
- 108010070511 Keratin-8 Proteins 0.000 description 3
- 108090001090 Lectins Proteins 0.000 description 3
- 102000004856 Lectins Human genes 0.000 description 3
- 102100034256 Mucin-1 Human genes 0.000 description 3
- 102100037422 Receptor-type tyrosine-protein phosphatase C Human genes 0.000 description 3
- FAPWRFPIFSIZLT-UHFFFAOYSA-M Sodium chloride Chemical compound [Na+].[Cl-] FAPWRFPIFSIZLT-UHFFFAOYSA-M 0.000 description 3
- PZBFGYYEXUXCOF-UHFFFAOYSA-N TCEP Chemical compound OC(=O)CCP(CCC(O)=O)CCC(O)=O PZBFGYYEXUXCOF-UHFFFAOYSA-N 0.000 description 3
- YXFVVABEGXRONW-UHFFFAOYSA-N Toluene Chemical compound CC1=CC=CC=C1 YXFVVABEGXRONW-UHFFFAOYSA-N 0.000 description 3
- 102100026144 Transferrin receptor protein 1 Human genes 0.000 description 3
- 229920004890 Triton X-100 Polymers 0.000 description 3
- 230000003321 amplification Effects 0.000 description 3
- 108010080146 androgen receptors Proteins 0.000 description 3
- 230000002494 anti-cea effect Effects 0.000 description 3
- 230000001028 anti-proliverative effect Effects 0.000 description 3
- 230000015572 biosynthetic process Effects 0.000 description 3
- 210000004369 blood Anatomy 0.000 description 3
- 239000008280 blood Substances 0.000 description 3
- 230000008859 change Effects 0.000 description 3
- 201000010897 colon adenocarcinoma Diseases 0.000 description 3
- 230000000295 complement effect Effects 0.000 description 3
- 230000021615 conjugation Effects 0.000 description 3
- GLNDAGDHSLMOKX-UHFFFAOYSA-N coumarin 120 Chemical compound C1=C(N)C=CC2=C1OC(=O)C=C2C GLNDAGDHSLMOKX-UHFFFAOYSA-N 0.000 description 3
- 230000008878 coupling Effects 0.000 description 3
- 238000010168 coupling process Methods 0.000 description 3
- 238000005859 coupling reaction Methods 0.000 description 3
- 108010038795 estrogen receptors Proteins 0.000 description 3
- 239000000835 fiber Substances 0.000 description 3
- 239000000834 fixative Substances 0.000 description 3
- MHMNJMPURVTYEJ-UHFFFAOYSA-N fluorescein-5-isothiocyanate Chemical compound O1C(=O)C2=CC(N=C=S)=CC=C2C21C1=CC=C(O)C=C1OC1=CC(O)=CC=C21 MHMNJMPURVTYEJ-UHFFFAOYSA-N 0.000 description 3
- 238000002866 fluorescence resonance energy transfer Methods 0.000 description 3
- 239000011521 glass Substances 0.000 description 3
- 150000004676 glycans Chemical class 0.000 description 3
- 230000002209 hydrophobic effect Effects 0.000 description 3
- 238000010166 immunofluorescence Methods 0.000 description 3
- 238000010249 in-situ analysis Methods 0.000 description 3
- 238000011065 in-situ storage Methods 0.000 description 3
- 239000003112 inhibitor Substances 0.000 description 3
- 239000002523 lectin Substances 0.000 description 3
- 201000001441 melanoma Diseases 0.000 description 3
- 210000004379 membrane Anatomy 0.000 description 3
- 239000012528 membrane Substances 0.000 description 3
- 210000003205 muscle Anatomy 0.000 description 3
- 230000009871 nonspecific binding Effects 0.000 description 3
- 238000003199 nucleic acid amplification method Methods 0.000 description 3
- 210000004940 nucleus Anatomy 0.000 description 3
- 239000008363 phosphate buffer Substances 0.000 description 3
- 229920001282 polysaccharide Polymers 0.000 description 3
- 239000005017 polysaccharide Substances 0.000 description 3
- 229920002981 polyvinylidene fluoride Polymers 0.000 description 3
- 102000003998 progesterone receptors Human genes 0.000 description 3
- 108090000468 progesterone receptors Proteins 0.000 description 3
- 230000009467 reduction Effects 0.000 description 3
- 201000009410 rhabdomyosarcoma Diseases 0.000 description 3
- 235000017557 sodium bicarbonate Nutrition 0.000 description 3
- 235000000346 sugar Nutrition 0.000 description 3
- 150000008163 sugars Chemical class 0.000 description 3
- ABZLKHKQJHEPAX-UHFFFAOYSA-N tetramethylrhodamine Chemical compound C=12C=CC(N(C)C)=CC2=[O+]C2=CC(N(C)C)=CC=C2C=1C1=CC=CC=C1C([O-])=O ABZLKHKQJHEPAX-UHFFFAOYSA-N 0.000 description 3
- MPLHNVLQVRSVEE-UHFFFAOYSA-N texas red Chemical compound [O-]S(=O)(=O)C1=CC(S(Cl)(=O)=O)=CC=C1C(C1=CC=2CCCN3CCCC(C=23)=C1O1)=C2C1=C(CCC1)C3=[N+]1CCCC3=C2 MPLHNVLQVRSVEE-UHFFFAOYSA-N 0.000 description 3
- 230000001225 therapeutic effect Effects 0.000 description 3
- YBJHBAHKTGYVGT-ZKWXMUAHSA-N (+)-Biotin Chemical compound N1C(=O)N[C@@H]2[C@H](CCCCC(=O)O)SC[C@@H]21 YBJHBAHKTGYVGT-ZKWXMUAHSA-N 0.000 description 2
- OZFAFGSSMRRTDW-UHFFFAOYSA-N (2,4-dichlorophenyl) benzenesulfonate Chemical compound ClC1=CC(Cl)=CC=C1OS(=O)(=O)C1=CC=CC=C1 OZFAFGSSMRRTDW-UHFFFAOYSA-N 0.000 description 2
- NHSJCIBSNKLAMA-UHFFFAOYSA-N (2Z)-1-ethyl-2-[(2E,4E)-5-[1-[6-[2-(4-hydroxyphenyl)ethylamino]-6-oxohexyl]-3,3-dimethyl-5-sulfoindol-1-ium-2-yl]penta-2,4-dienylidene]-3,3-dimethylindole-5-sulfonate Chemical compound CC[N+]1=C(\C=C\C=C\C=C2/N(CCCCCC(=O)NCCC3=CC=C(O)C=C3)C3=CC=C(C=C3C2(C)C)S(O)(=O)=O)C(C)(C)C2=C1C=CC(=C2)S([O-])(=O)=O NHSJCIBSNKLAMA-UHFFFAOYSA-N 0.000 description 2
- VGIRNWJSIRVFRT-UHFFFAOYSA-N 2',7'-difluorofluorescein Chemical compound OC(=O)C1=CC=CC=C1C1=C2C=C(F)C(=O)C=C2OC2=CC(O)=C(F)C=C21 VGIRNWJSIRVFRT-UHFFFAOYSA-N 0.000 description 2
- HBEDSQVIWPRPAY-UHFFFAOYSA-N 2,3-dihydrobenzofuran Chemical compound C1=CC=C2OCCC2=C1 HBEDSQVIWPRPAY-UHFFFAOYSA-N 0.000 description 2
- PXBFMLJZNCDSMP-UHFFFAOYSA-N 2-Aminobenzamide Chemical compound NC(=O)C1=CC=CC=C1N PXBFMLJZNCDSMP-UHFFFAOYSA-N 0.000 description 2
- OBYNJKLOYWCXEP-UHFFFAOYSA-N 2-[3-(dimethylamino)-6-dimethylazaniumylidenexanthen-9-yl]-4-isothiocyanatobenzoate Chemical compound C=12C=CC(=[N+](C)C)C=C2OC2=CC(N(C)C)=CC=C2C=1C1=CC(N=C=S)=CC=C1C([O-])=O OBYNJKLOYWCXEP-UHFFFAOYSA-N 0.000 description 2
- HSHNITRMYYLLCV-UHFFFAOYSA-N 4-methylumbelliferone Chemical compound C1=C(O)C=CC2=C1OC(=O)C=C2C HSHNITRMYYLLCV-UHFFFAOYSA-N 0.000 description 2
- AQSOTOUQTVJNMY-UHFFFAOYSA-N 7-(dimethylamino)-4-hydroxy-3-oxophenoxazin-10-ium-1-carboxylic acid;chloride Chemical compound [Cl-].OC(=O)C1=CC(=O)C(O)=C2OC3=CC(N(C)C)=CC=C3[NH+]=C21 AQSOTOUQTVJNMY-UHFFFAOYSA-N 0.000 description 2
- MPVDXIMFBOLMNW-ISLYRVAYSA-N 7-hydroxy-8-[(E)-phenyldiazenyl]naphthalene-1,3-disulfonic acid Chemical compound OC1=CC=C2C=C(S(O)(=O)=O)C=C(S(O)(=O)=O)C2=C1\N=N\C1=CC=CC=C1 MPVDXIMFBOLMNW-ISLYRVAYSA-N 0.000 description 2
- 108010051457 Acid Phosphatase Proteins 0.000 description 2
- 102000013563 Acid Phosphatase Human genes 0.000 description 2
- 208000024827 Alzheimer disease Diseases 0.000 description 2
- PAYRUJLWNCNPSJ-UHFFFAOYSA-N Aniline Chemical compound NC1=CC=CC=C1 PAYRUJLWNCNPSJ-UHFFFAOYSA-N 0.000 description 2
- 102100032912 CD44 antigen Human genes 0.000 description 2
- 102100037904 CD9 antigen Human genes 0.000 description 2
- 108090000397 Caspase 3 Proteins 0.000 description 2
- 102100023344 Centromere protein F Human genes 0.000 description 2
- 102000011022 Chorionic Gonadotropin Human genes 0.000 description 2
- 108010062540 Chorionic Gonadotropin Proteins 0.000 description 2
- 108090000197 Clusterin Proteins 0.000 description 2
- 102000003780 Clusterin Human genes 0.000 description 2
- 102000008186 Collagen Human genes 0.000 description 2
- 108010035532 Collagen Proteins 0.000 description 2
- 206010009944 Colon cancer Diseases 0.000 description 2
- 102000003915 DNA Topoisomerases Human genes 0.000 description 2
- 108090000323 DNA Topoisomerases Proteins 0.000 description 2
- 102100033215 DNA nucleotidylexotransferase Human genes 0.000 description 2
- XPDXVDYUQZHFPV-UHFFFAOYSA-N Dansyl Chloride Chemical compound C1=CC=C2C(N(C)C)=CC=CC2=C1S(Cl)(=O)=O XPDXVDYUQZHFPV-UHFFFAOYSA-N 0.000 description 2
- 239000012591 Dulbecco’s Phosphate Buffered Saline Substances 0.000 description 2
- 101150029707 ERBB2 gene Proteins 0.000 description 2
- WSFSSNUMVMOOMR-UHFFFAOYSA-N Formaldehyde Chemical compound O=C WSFSSNUMVMOOMR-UHFFFAOYSA-N 0.000 description 2
- 208000017604 Hodgkin disease Diseases 0.000 description 2
- 208000010747 Hodgkins lymphoma Diseases 0.000 description 2
- 101000868273 Homo sapiens CD44 antigen Proteins 0.000 description 2
- 101000793880 Homo sapiens Caspase-3 Proteins 0.000 description 2
- 101000721661 Homo sapiens Cellular tumor antigen p53 Proteins 0.000 description 2
- 101000620359 Homo sapiens Melanocyte protein PMEL Proteins 0.000 description 2
- 101001133056 Homo sapiens Mucin-1 Proteins 0.000 description 2
- 101000738771 Homo sapiens Receptor-type tyrosine-protein phosphatase C Proteins 0.000 description 2
- 101000650817 Homo sapiens Semaphorin-4D Proteins 0.000 description 2
- 101000611023 Homo sapiens Tumor necrosis factor receptor superfamily member 6 Proteins 0.000 description 2
- OAKJQQAXSVQMHS-UHFFFAOYSA-N Hydrazine Chemical compound NN OAKJQQAXSVQMHS-UHFFFAOYSA-N 0.000 description 2
- 102100022430 Melanocyte protein PMEL Human genes 0.000 description 2
- 108010063954 Mucins Proteins 0.000 description 2
- 102000015728 Mucins Human genes 0.000 description 2
- 102000016943 Muramidase Human genes 0.000 description 2
- 108010014251 Muramidase Proteins 0.000 description 2
- 101100346932 Mus musculus Muc1 gene Chemical group 0.000 description 2
- 102100038610 Myeloperoxidase Human genes 0.000 description 2
- 108090000235 Myeloperoxidases Proteins 0.000 description 2
- 108010062010 N-Acetylmuramoyl-L-alanine Amidase Proteins 0.000 description 2
- 102000003729 Neprilysin Human genes 0.000 description 2
- 108090000028 Neprilysin Proteins 0.000 description 2
- 108010032605 Nerve Growth Factor Receptors Proteins 0.000 description 2
- 102000007339 Nerve Growth Factor Receptors Human genes 0.000 description 2
- 102000008763 Neurofilament Proteins Human genes 0.000 description 2
- 108010088373 Neurofilament Proteins Proteins 0.000 description 2
- 108010051791 Nuclear Antigens Proteins 0.000 description 2
- 102000019040 Nuclear Antigens Human genes 0.000 description 2
- 241000237502 Ostreidae Species 0.000 description 2
- CBENFWSGALASAD-UHFFFAOYSA-N Ozone Chemical compound [O-][O+]=O CBENFWSGALASAD-UHFFFAOYSA-N 0.000 description 2
- 239000002033 PVDF binder Substances 0.000 description 2
- 102000012288 Phosphopyruvate Hydratase Human genes 0.000 description 2
- 108010022181 Phosphopyruvate Hydratase Proteins 0.000 description 2
- 102000007056 Recombinant Fusion Proteins Human genes 0.000 description 2
- 108010008281 Recombinant Fusion Proteins Proteins 0.000 description 2
- AUNGANRZJHBGPY-SCRDCRAPSA-N Riboflavin Chemical compound OC[C@@H](O)[C@@H](O)[C@@H](O)CN1C=2C=C(C)C(C)=CC=2N=C2C1=NC(=O)NC2=O AUNGANRZJHBGPY-SCRDCRAPSA-N 0.000 description 2
- 102100027744 Semaphorin-4D Human genes 0.000 description 2
- 102000016266 T-Cell Antigen Receptors Human genes 0.000 description 2
- 108010092262 T-Cell Antigen Receptors Proteins 0.000 description 2
- 108010033576 Transferrin Receptors Proteins 0.000 description 2
- 239000013504 Triton X-100 Substances 0.000 description 2
- 102100040403 Tumor necrosis factor receptor superfamily member 6 Human genes 0.000 description 2
- 102000007537 Type II DNA Topoisomerases Human genes 0.000 description 2
- 108010046308 Type II DNA Topoisomerases Proteins 0.000 description 2
- 102100023543 Vascular cell adhesion protein 1 Human genes 0.000 description 2
- 230000005856 abnormality Effects 0.000 description 2
- RZUBARUFLYGOGC-MTHOTQAESA-L acid fuchsin Chemical compound [Na+].[Na+].[O-]S(=O)(=O)C1=C(N)C(C)=CC(C(=C\2C=C(C(=[NH2+])C=C/2)S([O-])(=O)=O)\C=2C=C(C(N)=CC=2)S([O-])(=O)=O)=C1 RZUBARUFLYGOGC-MTHOTQAESA-L 0.000 description 2
- 230000002378 acidificating effect Effects 0.000 description 2
- DPKHZNPWBDQZCN-UHFFFAOYSA-N acridine orange free base Chemical compound C1=CC(N(C)C)=CC2=NC3=CC(N(C)C)=CC=C3C=C21 DPKHZNPWBDQZCN-UHFFFAOYSA-N 0.000 description 2
- 150000001266 acyl halides Chemical class 0.000 description 2
- 239000000853 adhesive Substances 0.000 description 2
- 230000001070 adhesive effect Effects 0.000 description 2
- 150000001350 alkyl halides Chemical class 0.000 description 2
- 229940037003 alum Drugs 0.000 description 2
- 239000012491 analyte Substances 0.000 description 2
- 230000006907 apoptotic process Effects 0.000 description 2
- 238000001574 biopsy Methods 0.000 description 2
- 238000006664 bond formation reaction Methods 0.000 description 2
- 150000001720 carbohydrates Chemical class 0.000 description 2
- 235000014633 carbohydrates Nutrition 0.000 description 2
- 150000001732 carboxylic acid derivatives Chemical class 0.000 description 2
- 238000004113 cell culture Methods 0.000 description 2
- 230000022131 cell cycle Effects 0.000 description 2
- 210000000170 cell membrane Anatomy 0.000 description 2
- 108010031377 centromere protein F Proteins 0.000 description 2
- 239000007979 citrate buffer Substances 0.000 description 2
- 238000003776 cleavage reaction Methods 0.000 description 2
- 229920001436 collagen Polymers 0.000 description 2
- 239000013068 control sample Substances 0.000 description 2
- 108010072268 cyclin-dependent kinase-activating kinase Proteins 0.000 description 2
- LSXWFXONGKSEMY-UHFFFAOYSA-N di-tert-butyl peroxide Chemical compound CC(C)(C)OOC(C)(C)C LSXWFXONGKSEMY-UHFFFAOYSA-N 0.000 description 2
- 230000004069 differentiation Effects 0.000 description 2
- 238000009826 distribution Methods 0.000 description 2
- 239000003814 drug Substances 0.000 description 2
- 210000002889 endothelial cell Anatomy 0.000 description 2
- 230000006862 enzymatic digestion Effects 0.000 description 2
- 210000003743 erythrocyte Anatomy 0.000 description 2
- IINNWAYUJNWZRM-UHFFFAOYSA-L erythrosin B Chemical compound [Na+].[Na+].[O-]C(=O)C1=CC=CC=C1C1=C2C=C(I)C(=O)C(I)=C2OC2=C(I)C([O-])=C(I)C=C21 IINNWAYUJNWZRM-UHFFFAOYSA-L 0.000 description 2
- VYXSBFYARXAAKO-UHFFFAOYSA-N ethyl 2-[3-(ethylamino)-6-ethylimino-2,7-dimethylxanthen-9-yl]benzoate;hydron;chloride Chemical compound [Cl-].C1=2C=C(C)C(NCC)=CC=2OC2=CC(=[NH+]CC)C(C)=CC2=C1C1=CC=CC=C1C(=O)OCC VYXSBFYARXAAKO-UHFFFAOYSA-N 0.000 description 2
- 230000001747 exhibiting effect Effects 0.000 description 2
- GVEPBJHOBDJJJI-UHFFFAOYSA-N fluoranthrene Natural products C1=CC(C2=CC=CC=C22)=C3C2=CC=CC3=C1 GVEPBJHOBDJJJI-UHFFFAOYSA-N 0.000 description 2
- 239000012634 fragment Substances 0.000 description 2
- 108020001507 fusion proteins Proteins 0.000 description 2
- 102000037865 fusion proteins Human genes 0.000 description 2
- PCHJSUWPFVWCPO-UHFFFAOYSA-N gold Chemical compound [Au] PCHJSUWPFVWCPO-UHFFFAOYSA-N 0.000 description 2
- 239000010931 gold Substances 0.000 description 2
- 229910052737 gold Inorganic materials 0.000 description 2
- 210000003714 granulocyte Anatomy 0.000 description 2
- 239000005090 green fluorescent protein Substances 0.000 description 2
- 238000003306 harvesting Methods 0.000 description 2
- 229940088597 hormone Drugs 0.000 description 2
- 239000005556 hormone Substances 0.000 description 2
- 108091008039 hormone receptors Proteins 0.000 description 2
- 229940084986 human chorionic gonadotropin Drugs 0.000 description 2
- 238000003018 immunoassay Methods 0.000 description 2
- 229940072221 immunoglobulins Drugs 0.000 description 2
- 238000007901 in situ hybridization Methods 0.000 description 2
- 238000002955 isolation Methods 0.000 description 2
- 150000002540 isothiocyanates Chemical class 0.000 description 2
- 150000002576 ketones Chemical class 0.000 description 2
- 235000010335 lysozyme Nutrition 0.000 description 2
- 239000003550 marker Substances 0.000 description 2
- 229960000901 mepacrine Drugs 0.000 description 2
- 108091005601 modified peptides Proteins 0.000 description 2
- 210000001616 monocyte Anatomy 0.000 description 2
- 210000000663 muscle cell Anatomy 0.000 description 2
- 210000000066 myeloid cell Anatomy 0.000 description 2
- 230000001537 neural effect Effects 0.000 description 2
- 210000005044 neurofilament Anatomy 0.000 description 2
- 210000002569 neuron Anatomy 0.000 description 2
- 235000020636 oyster Nutrition 0.000 description 2
- 230000008823 permeabilization Effects 0.000 description 2
- 210000004180 plasmocyte Anatomy 0.000 description 2
- 125000002924 primary amino group Chemical group [H]N([H])* 0.000 description 2
- GPKJTRJOBQGKQK-UHFFFAOYSA-N quinacrine Chemical compound C1=C(OC)C=C2C(NC(C)CCCN(CC)CC)=C(C=CC(Cl)=C3)C3=NC2=C1 GPKJTRJOBQGKQK-UHFFFAOYSA-N 0.000 description 2
- 238000011084 recovery Methods 0.000 description 2
- 230000007017 scission Effects 0.000 description 2
- QZAYGJVTTNCVMB-UHFFFAOYSA-N serotonin Chemical compound C1=C(O)C=C2C(CCN)=CNC2=C1 QZAYGJVTTNCVMB-UHFFFAOYSA-N 0.000 description 2
- 210000000813 small intestine Anatomy 0.000 description 2
- 210000002460 smooth muscle Anatomy 0.000 description 2
- 239000011780 sodium chloride Substances 0.000 description 2
- 238000004611 spectroscopical analysis Methods 0.000 description 2
- 238000006467 substitution reaction Methods 0.000 description 2
- 210000002700 urine Anatomy 0.000 description 2
- 238000001262 western blot Methods 0.000 description 2
- JWDFQMWEFLOOED-UHFFFAOYSA-N (2,5-dioxopyrrolidin-1-yl) 3-(pyridin-2-yldisulfanyl)propanoate Chemical compound O=C1CCC(=O)N1OC(=O)CCSSC1=CC=CC=N1 JWDFQMWEFLOOED-UHFFFAOYSA-N 0.000 description 1
- GKSPIZSKQWTXQG-UHFFFAOYSA-N (2,5-dioxopyrrolidin-1-yl) 4-[1-(pyridin-2-yldisulfanyl)ethyl]benzoate Chemical compound C=1C=C(C(=O)ON2C(CCC2=O)=O)C=CC=1C(C)SSC1=CC=CC=N1 GKSPIZSKQWTXQG-UHFFFAOYSA-N 0.000 description 1
- DIGQNXIGRZPYDK-WKSCXVIASA-N (2R)-6-amino-2-[[2-[[(2S)-2-[[2-[[(2R)-2-[[(2S)-2-[[(2R,3S)-2-[[2-[[(2S)-2-[[2-[[(2S)-2-[[(2S)-2-[[(2R)-2-[[(2S,3S)-2-[[(2R)-2-[[(2S)-2-[[(2S)-2-[[(2S)-2-[[2-[[(2S)-2-[[(2R)-2-[[2-[[2-[[2-[(2-amino-1-hydroxyethylidene)amino]-3-carboxy-1-hydroxypropylidene]amino]-1-hydroxy-3-sulfanylpropylidene]amino]-1-hydroxyethylidene]amino]-1-hydroxy-3-sulfanylpropylidene]amino]-1,3-dihydroxypropylidene]amino]-1-hydroxyethylidene]amino]-1-hydroxypropylidene]amino]-1,3-dihydroxypropylidene]amino]-1,3-dihydroxypropylidene]amino]-1-hydroxy-3-sulfanylpropylidene]amino]-1,3-dihydroxybutylidene]amino]-1-hydroxy-3-sulfanylpropylidene]amino]-1-hydroxypropylidene]amino]-1,3-dihydroxypropylidene]amino]-1-hydroxyethylidene]amino]-1,5-dihydroxy-5-iminopentylidene]amino]-1-hydroxy-3-sulfanylpropylidene]amino]-1,3-dihydroxybutylidene]amino]-1-hydroxy-3-sulfanylpropylidene]amino]-1,3-dihydroxypropylidene]amino]-1-hydroxyethylidene]amino]-1-hydroxy-3-sulfanylpropylidene]amino]-1-hydroxyethylidene]amino]hexanoic acid Chemical compound C[C@@H]([C@@H](C(=N[C@@H](CS)C(=N[C@@H](C)C(=N[C@@H](CO)C(=NCC(=N[C@@H](CCC(=N)O)C(=NC(CS)C(=N[C@H]([C@H](C)O)C(=N[C@H](CS)C(=N[C@H](CO)C(=NCC(=N[C@H](CS)C(=NCC(=N[C@H](CCCCN)C(=O)O)O)O)O)O)O)O)O)O)O)O)O)O)O)N=C([C@H](CS)N=C([C@H](CO)N=C([C@H](CO)N=C([C@H](C)N=C(CN=C([C@H](CO)N=C([C@H](CS)N=C(CN=C(C(CS)N=C(C(CC(=O)O)N=C(CN)O)O)O)O)O)O)O)O)O)O)O)O DIGQNXIGRZPYDK-WKSCXVIASA-N 0.000 description 1
- GIANIJCPTPUNBA-QMMMGPOBSA-N (2s)-3-(4-hydroxyphenyl)-2-nitramidopropanoic acid Chemical compound [O-][N+](=O)N[C@H](C(=O)O)CC1=CC=C(O)C=C1 GIANIJCPTPUNBA-QMMMGPOBSA-N 0.000 description 1
- DUFUXAHBRPMOFG-UHFFFAOYSA-N 1-(4-anilinonaphthalen-1-yl)pyrrole-2,5-dione Chemical compound O=C1C=CC(=O)N1C(C1=CC=CC=C11)=CC=C1NC1=CC=CC=C1 DUFUXAHBRPMOFG-UHFFFAOYSA-N 0.000 description 1
- QAPSNMNOIOSXSQ-YNEHKIRRSA-N 1-[(2r,4s,5r)-4-[tert-butyl(dimethyl)silyl]oxy-5-(hydroxymethyl)oxolan-2-yl]-5-methylpyrimidine-2,4-dione Chemical compound O=C1NC(=O)C(C)=CN1[C@@H]1O[C@H](CO)[C@@H](O[Si](C)(C)C(C)(C)C)C1 QAPSNMNOIOSXSQ-YNEHKIRRSA-N 0.000 description 1
- ZTTARJIAPRWUHH-UHFFFAOYSA-N 1-isothiocyanatoacridine Chemical compound C1=CC=C2C=C3C(N=C=S)=CC=CC3=NC2=C1 ZTTARJIAPRWUHH-UHFFFAOYSA-N 0.000 description 1
- GZCWLCBFPRFLKL-UHFFFAOYSA-N 1-prop-2-ynoxypropan-2-ol Chemical compound CC(O)COCC#C GZCWLCBFPRFLKL-UHFFFAOYSA-N 0.000 description 1
- 108010020567 12E7 Antigen Proteins 0.000 description 1
- PRDFBSVERLRRMY-UHFFFAOYSA-N 2'-(4-ethoxyphenyl)-5-(4-methylpiperazin-1-yl)-2,5'-bibenzimidazole Chemical compound C1=CC(OCC)=CC=C1C1=NC2=CC=C(C=3NC4=CC(=CC=C4N=3)N3CCN(C)CC3)C=C2N1 PRDFBSVERLRRMY-UHFFFAOYSA-N 0.000 description 1
- RUDINRUXCKIXAJ-UHFFFAOYSA-N 2,2,3,3,4,4,5,5,6,6,7,7,8,8,9,9,10,10,11,11,12,12,13,13,14,14,14-heptacosafluorotetradecanoic acid Chemical compound OC(=O)C(F)(F)C(F)(F)C(F)(F)C(F)(F)C(F)(F)C(F)(F)C(F)(F)C(F)(F)C(F)(F)C(F)(F)C(F)(F)C(F)(F)C(F)(F)F RUDINRUXCKIXAJ-UHFFFAOYSA-N 0.000 description 1
- FFRBMBIXVSCUFS-UHFFFAOYSA-N 2,4-dinitro-1-naphthol Chemical compound C1=CC=C2C(O)=C([N+]([O-])=O)C=C([N+]([O-])=O)C2=C1 FFRBMBIXVSCUFS-UHFFFAOYSA-N 0.000 description 1
- IOOMXAQUNPWDLL-UHFFFAOYSA-N 2-[6-(diethylamino)-3-(diethyliminiumyl)-3h-xanthen-9-yl]-5-sulfobenzene-1-sulfonate Chemical compound C=12C=CC(=[N+](CC)CC)C=C2OC2=CC(N(CC)CC)=CC=C2C=1C1=CC=C(S(O)(=O)=O)C=C1S([O-])(=O)=O IOOMXAQUNPWDLL-UHFFFAOYSA-N 0.000 description 1
- KISWVXRQTGLFGD-UHFFFAOYSA-N 2-[[2-[[6-amino-2-[[2-[[2-[[5-amino-2-[[2-[[1-[2-[[6-amino-2-[(2,5-diamino-5-oxopentanoyl)amino]hexanoyl]amino]-5-(diaminomethylideneamino)pentanoyl]pyrrolidine-2-carbonyl]amino]-3-hydroxypropanoyl]amino]-5-oxopentanoyl]amino]-5-(diaminomethylideneamino)p Chemical compound C1CCN(C(=O)C(CCCN=C(N)N)NC(=O)C(CCCCN)NC(=O)C(N)CCC(N)=O)C1C(=O)NC(CO)C(=O)NC(CCC(N)=O)C(=O)NC(CCCN=C(N)N)C(=O)NC(CO)C(=O)NC(CCCCN)C(=O)NC(C(=O)NC(CC(C)C)C(O)=O)CC1=CC=C(O)C=C1 KISWVXRQTGLFGD-UHFFFAOYSA-N 0.000 description 1
- LAXVMANLDGWYJP-UHFFFAOYSA-N 2-amino-5-(2-aminoethyl)naphthalene-1-sulfonic acid Chemical compound NC1=CC=C2C(CCN)=CC=CC2=C1S(O)(=O)=O LAXVMANLDGWYJP-UHFFFAOYSA-N 0.000 description 1
- DVUWFIWQOSNKQJ-UHFFFAOYSA-N 3',6'-dihydroxy-2',4',5',7'-tetraiodospiro[2-benzofuran-3,9'-xanthene]-1-one;sodium Chemical compound [Na].[Na].O1C(=O)C2=CC=CC=C2C21C1=CC(I)=C(O)C(I)=C1OC1=C(I)C(O)=C(I)C=C21 DVUWFIWQOSNKQJ-UHFFFAOYSA-N 0.000 description 1
- CPBJMKMKNCRKQB-UHFFFAOYSA-N 3,3-bis(4-hydroxy-3-methylphenyl)-2-benzofuran-1-one Chemical compound C1=C(O)C(C)=CC(C2(C3=CC=CC=C3C(=O)O2)C=2C=C(C)C(O)=CC=2)=C1 CPBJMKMKNCRKQB-UHFFFAOYSA-N 0.000 description 1
- GOLORTLGFDVFDW-UHFFFAOYSA-N 3-(1h-benzimidazol-2-yl)-7-(diethylamino)chromen-2-one Chemical compound C1=CC=C2NC(C3=CC4=CC=C(C=C4OC3=O)N(CC)CC)=NC2=C1 GOLORTLGFDVFDW-UHFFFAOYSA-N 0.000 description 1
- PBVAJRFEEOIAGW-UHFFFAOYSA-N 3-[bis(2-carboxyethyl)phosphanyl]propanoic acid;hydrochloride Chemical compound Cl.OC(=O)CCP(CCC(O)=O)CCC(O)=O PBVAJRFEEOIAGW-UHFFFAOYSA-N 0.000 description 1
- INZOTETZQBPBCE-NYLDSJSYSA-N 3-sialyl lewis Chemical compound O[C@H]1[C@H](O)[C@H](O)[C@H](C)O[C@H]1O[C@H]([C@H](O)CO)[C@@H]([C@@H](NC(C)=O)C=O)O[C@H]1[C@H](O)[C@@H](O[C@]2(O[C@H]([C@H](NC(C)=O)[C@@H](O)C2)[C@H](O)[C@H](O)CO)C(O)=O)[C@@H](O)[C@@H](CO)O1 INZOTETZQBPBCE-NYLDSJSYSA-N 0.000 description 1
- YSCNMFDFYJUPEF-OWOJBTEDSA-N 4,4'-diisothiocyano-trans-stilbene-2,2'-disulfonic acid Chemical compound OS(=O)(=O)C1=CC(N=C=S)=CC=C1\C=C\C1=CC=C(N=C=S)C=C1S(O)(=O)=O YSCNMFDFYJUPEF-OWOJBTEDSA-N 0.000 description 1
- YJCCSLGGODRWKK-NSCUHMNNSA-N 4-Acetamido-4'-isothiocyanostilbene-2,2'-disulphonic acid Chemical compound OS(=O)(=O)C1=CC(NC(=O)C)=CC=C1\C=C\C1=CC=C(N=C=S)C=C1S(O)(=O)=O YJCCSLGGODRWKK-NSCUHMNNSA-N 0.000 description 1
- AXDJCCTWPBKUKL-UHFFFAOYSA-N 4-[(4-aminophenyl)-(4-imino-3-methylcyclohexa-2,5-dien-1-ylidene)methyl]aniline;hydron;chloride Chemical compound Cl.C1=CC(=N)C(C)=CC1=C(C=1C=CC(N)=CC=1)C1=CC=C(N)C=C1 AXDJCCTWPBKUKL-UHFFFAOYSA-N 0.000 description 1
- 102100033400 4F2 cell-surface antigen heavy chain Human genes 0.000 description 1
- 102100022464 5'-nucleotidase Human genes 0.000 description 1
- 102100030310 5,6-dihydroxyindole-2-carboxylic acid oxidase Human genes 0.000 description 1
- SJQRQOKXQKVJGJ-UHFFFAOYSA-N 5-(2-aminoethylamino)naphthalene-1-sulfonic acid Chemical compound C1=CC=C2C(NCCN)=CC=CC2=C1S(O)(=O)=O SJQRQOKXQKVJGJ-UHFFFAOYSA-N 0.000 description 1
- ZWONWYNZSWOYQC-UHFFFAOYSA-N 5-benzamido-3-[[5-[[4-chloro-6-(4-sulfoanilino)-1,3,5-triazin-2-yl]amino]-2-sulfophenyl]diazenyl]-4-hydroxynaphthalene-2,7-disulfonic acid Chemical compound OC1=C(N=NC2=CC(NC3=NC(NC4=CC=C(C=C4)S(O)(=O)=O)=NC(Cl)=N3)=CC=C2S(O)(=O)=O)C(=CC2=C1C(NC(=O)C1=CC=CC=C1)=CC(=C2)S(O)(=O)=O)S(O)(=O)=O ZWONWYNZSWOYQC-UHFFFAOYSA-N 0.000 description 1
- WOVKYSAHUYNSMH-RRKCRQDMSA-N 5-bromodeoxyuridine Chemical compound C1[C@H](O)[C@@H](CO)O[C@H]1N1C(=O)NC(=O)C(Br)=C1 WOVKYSAHUYNSMH-RRKCRQDMSA-N 0.000 description 1
- NJYVEMPWNAYQQN-UHFFFAOYSA-N 5-carboxyfluorescein Chemical compound C12=CC=C(O)C=C2OC2=CC(O)=CC=C2C21OC(=O)C1=CC(C(=O)O)=CC=C21 NJYVEMPWNAYQQN-UHFFFAOYSA-N 0.000 description 1
- YERWMQJEYUIJBO-UHFFFAOYSA-N 5-chlorosulfonyl-2-[3-(diethylamino)-6-diethylazaniumylidenexanthen-9-yl]benzenesulfonate Chemical compound C=12C=CC(=[N+](CC)CC)C=C2OC2=CC(N(CC)CC)=CC=C2C=1C1=CC=C(S(Cl)(=O)=O)C=C1S([O-])(=O)=O YERWMQJEYUIJBO-UHFFFAOYSA-N 0.000 description 1
- AXGKYURDYTXCAG-UHFFFAOYSA-N 5-isothiocyanato-2-[2-(4-isothiocyanato-2-sulfophenyl)ethyl]benzenesulfonic acid Chemical compound OS(=O)(=O)C1=CC(N=C=S)=CC=C1CCC1=CC=C(N=C=S)C=C1S(O)(=O)=O AXGKYURDYTXCAG-UHFFFAOYSA-N 0.000 description 1
- HWQQCFPHXPNXHC-UHFFFAOYSA-N 6-[(4,6-dichloro-1,3,5-triazin-2-yl)amino]-3',6'-dihydroxyspiro[2-benzofuran-3,9'-xanthene]-1-one Chemical compound C=1C(O)=CC=C2C=1OC1=CC(O)=CC=C1C2(C1=CC=2)OC(=O)C1=CC=2NC1=NC(Cl)=NC(Cl)=N1 HWQQCFPHXPNXHC-UHFFFAOYSA-N 0.000 description 1
- TXSWURLNYUQATR-UHFFFAOYSA-N 6-amino-2-(3-ethenylsulfonylphenyl)-1,3-dioxobenzo[de]isoquinoline-5,8-disulfonic acid Chemical compound O=C1C(C2=3)=CC(S(O)(=O)=O)=CC=3C(N)=C(S(O)(=O)=O)C=C2C(=O)N1C1=CC=CC(S(=O)(=O)C=C)=C1 TXSWURLNYUQATR-UHFFFAOYSA-N 0.000 description 1
- WQZIDRAQTRIQDX-UHFFFAOYSA-N 6-carboxy-x-rhodamine Chemical compound OC(=O)C1=CC=C(C([O-])=O)C=C1C(C1=CC=2CCCN3CCCC(C=23)=C1O1)=C2C1=C(CCC1)C3=[N+]1CCCC3=C2 WQZIDRAQTRIQDX-UHFFFAOYSA-N 0.000 description 1
- IHHSSHCBRVYGJX-UHFFFAOYSA-N 6-chloro-2-methoxyacridin-9-amine Chemical compound C1=C(Cl)C=CC2=C(N)C3=CC(OC)=CC=C3N=C21 IHHSSHCBRVYGJX-UHFFFAOYSA-N 0.000 description 1
- YALJZNKPECPZAS-UHFFFAOYSA-N 7-(diethylamino)-3-(4-isothiocyanatophenyl)-4-methylchromen-2-one Chemical compound O=C1OC2=CC(N(CC)CC)=CC=C2C(C)=C1C1=CC=C(N=C=S)C=C1 YALJZNKPECPZAS-UHFFFAOYSA-N 0.000 description 1
- CJIJXIFQYOPWTF-UHFFFAOYSA-N 7-hydroxycoumarin Natural products O1C(=O)C=CC2=CC(O)=CC=C21 CJIJXIFQYOPWTF-UHFFFAOYSA-N 0.000 description 1
- SGAOZXGJGQEBHA-UHFFFAOYSA-N 82344-98-7 Chemical compound C1CCN2CCCC(C=C3C4(OC(C5=CC(=CC=C54)N=C=S)=O)C4=C5)=C2C1=C3OC4=C1CCCN2CCCC5=C12 SGAOZXGJGQEBHA-UHFFFAOYSA-N 0.000 description 1
- 102100026445 A-kinase anchor protein 17A Human genes 0.000 description 1
- 102100031585 ADP-ribosyl cyclase/cyclic ADP-ribose hydrolase 1 Human genes 0.000 description 1
- 102100033793 ALK tyrosine kinase receptor Human genes 0.000 description 1
- 101710168331 ALK tyrosine kinase receptor Proteins 0.000 description 1
- 108091006112 ATPases Proteins 0.000 description 1
- KIDFITUZQAFBTK-UHFFFAOYSA-N ATTO 635-2 Chemical compound [O-]Cl(=O)(=O)=O.C1=C2C(C)=CC(C)(C)[N+](CCCC(O)=O)=C2C=C2C1=CC1=CC=C(N(C)C)C=C1C2(C)C KIDFITUZQAFBTK-UHFFFAOYSA-N 0.000 description 1
- 102000012440 Acetylcholinesterase Human genes 0.000 description 1
- 108010022752 Acetylcholinesterase Proteins 0.000 description 1
- 241000251468 Actinopterygii Species 0.000 description 1
- 102000057290 Adenosine Triphosphatases Human genes 0.000 description 1
- 102100026423 Adhesion G protein-coupled receptor E5 Human genes 0.000 description 1
- 239000000275 Adrenocorticotropic Hormone Substances 0.000 description 1
- 108020004774 Alkaline Phosphatase Proteins 0.000 description 1
- 102000002260 Alkaline Phosphatase Human genes 0.000 description 1
- 102100024321 Alkaline phosphatase, placental type Human genes 0.000 description 1
- 102100035248 Alpha-(1,3)-fucosyltransferase 4 Human genes 0.000 description 1
- 102100022524 Alpha-1-antichymotrypsin Human genes 0.000 description 1
- 102100022712 Alpha-1-antitrypsin Human genes 0.000 description 1
- 102100024075 Alpha-internexin Human genes 0.000 description 1
- 102100026882 Alpha-synuclein Human genes 0.000 description 1
- 102100022749 Aminopeptidase N Human genes 0.000 description 1
- 102000013455 Amyloid beta-Peptides Human genes 0.000 description 1
- 108010090849 Amyloid beta-Peptides Proteins 0.000 description 1
- 101710137189 Amyloid-beta A4 protein Proteins 0.000 description 1
- 102100022704 Amyloid-beta precursor protein Human genes 0.000 description 1
- 101710151993 Amyloid-beta precursor protein Proteins 0.000 description 1
- 102100021253 Antileukoproteinase Human genes 0.000 description 1
- 102000009333 Apolipoprotein D Human genes 0.000 description 1
- 108010025614 Apolipoproteins D Proteins 0.000 description 1
- 102100021569 Apoptosis regulator Bcl-2 Human genes 0.000 description 1
- FYEHYMARPSSOBO-UHFFFAOYSA-N Aurin Chemical compound C1=CC(O)=CC=C1C(C=1C=CC(O)=CC=1)=C1C=CC(=O)C=C1 FYEHYMARPSSOBO-UHFFFAOYSA-N 0.000 description 1
- 241000271566 Aves Species 0.000 description 1
- NOWKCMXCCJGMRR-UHFFFAOYSA-N Aziridine Chemical compound C1CN1 NOWKCMXCCJGMRR-UHFFFAOYSA-N 0.000 description 1
- 102100025218 B-cell differentiation antigen CD72 Human genes 0.000 description 1
- 102100038080 B-cell receptor CD22 Human genes 0.000 description 1
- 102100024222 B-lymphocyte antigen CD19 Human genes 0.000 description 1
- 102100022005 B-lymphocyte antigen CD20 Human genes 0.000 description 1
- 102100037152 BAG family molecular chaperone regulator 1 Human genes 0.000 description 1
- 101710089792 BAG family molecular chaperone regulator 1 Proteins 0.000 description 1
- 108700034663 BCL2-associated athanogene 1 Proteins 0.000 description 1
- WOVKYSAHUYNSMH-UHFFFAOYSA-N BROMODEOXYURIDINE Natural products C1C(O)C(CO)OC1N1C(=O)NC(=O)C(Br)=C1 WOVKYSAHUYNSMH-UHFFFAOYSA-N 0.000 description 1
- 102100032412 Basigin Human genes 0.000 description 1
- 102100023994 Beta-1,3-galactosyltransferase 6 Human genes 0.000 description 1
- 102100029945 Beta-galactoside alpha-2,6-sialyltransferase 1 Human genes 0.000 description 1
- BVKZGUZCCUSVTD-UHFFFAOYSA-M Bicarbonate Chemical compound OC([O-])=O BVKZGUZCCUSVTD-UHFFFAOYSA-M 0.000 description 1
- ZOXJGFHDIHLPTG-UHFFFAOYSA-N Boron Chemical compound [B] ZOXJGFHDIHLPTG-UHFFFAOYSA-N 0.000 description 1
- 241000283690 Bos taurus Species 0.000 description 1
- 102100036166 C-X-C chemokine receptor type 1 Human genes 0.000 description 1
- 102100028989 C-X-C chemokine receptor type 2 Human genes 0.000 description 1
- 102100032957 C5a anaphylatoxin chemotactic receptor 1 Human genes 0.000 description 1
- 102100024217 CAMPATH-1 antigen Human genes 0.000 description 1
- 102100037917 CD109 antigen Human genes 0.000 description 1
- 102100035893 CD151 antigen Human genes 0.000 description 1
- 102100024210 CD166 antigen Human genes 0.000 description 1
- 102100027207 CD27 antigen Human genes 0.000 description 1
- 102000049320 CD36 Human genes 0.000 description 1
- 108010045374 CD36 Antigens Proteins 0.000 description 1
- 101150013553 CD40 gene Proteins 0.000 description 1
- 102100036008 CD48 antigen Human genes 0.000 description 1
- 108010065524 CD52 Antigen Proteins 0.000 description 1
- 102100022002 CD59 glycoprotein Human genes 0.000 description 1
- 102100025222 CD63 antigen Human genes 0.000 description 1
- 102100025221 CD70 antigen Human genes 0.000 description 1
- 102100027221 CD81 antigen Human genes 0.000 description 1
- 102100027217 CD82 antigen Human genes 0.000 description 1
- 102100035793 CD83 antigen Human genes 0.000 description 1
- 102000024905 CD99 Human genes 0.000 description 1
- 108060001253 CD99 Proteins 0.000 description 1
- 102000009728 CDC2 Protein Kinase Human genes 0.000 description 1
- 108010034798 CDC2 Protein Kinase Proteins 0.000 description 1
- 108091007914 CDKs Proteins 0.000 description 1
- OYPRJOBELJOOCE-UHFFFAOYSA-N Calcium Chemical compound [Ca] OYPRJOBELJOOCE-UHFFFAOYSA-N 0.000 description 1
- 241000189662 Calla Species 0.000 description 1
- 101710167800 Capsid assembly scaffolding protein Proteins 0.000 description 1
- 101710205625 Capsid protein p24 Proteins 0.000 description 1
- 102100024533 Carcinoembryonic antigen-related cell adhesion molecule 1 Human genes 0.000 description 1
- 102100025466 Carcinoembryonic antigen-related cell adhesion molecule 3 Human genes 0.000 description 1
- 102100025473 Carcinoembryonic antigen-related cell adhesion molecule 6 Human genes 0.000 description 1
- 102100025470 Carcinoembryonic antigen-related cell adhesion molecule 8 Human genes 0.000 description 1
- 102000014914 Carrier Proteins Human genes 0.000 description 1
- 102100032616 Caspase-2 Human genes 0.000 description 1
- 108090000552 Caspase-2 Proteins 0.000 description 1
- 102100026548 Caspase-8 Human genes 0.000 description 1
- 108090000538 Caspase-8 Proteins 0.000 description 1
- 102000003908 Cathepsin D Human genes 0.000 description 1
- 108090000258 Cathepsin D Proteins 0.000 description 1
- 241000700199 Cavia porcellus Species 0.000 description 1
- 102100023126 Cell surface glycoprotein MUC18 Human genes 0.000 description 1
- 108010058699 Choline O-acetyltransferase Proteins 0.000 description 1
- 102100023460 Choline O-acetyltransferase Human genes 0.000 description 1
- 102100031699 Choline transporter-like protein 1 Human genes 0.000 description 1
- 108010038447 Chromogranin A Proteins 0.000 description 1
- 102000010792 Chromogranin A Human genes 0.000 description 1
- RURLVUZRUFHCJO-UHFFFAOYSA-N Chromomycin A3 Natural products COC(C1Cc2cc3cc(OC4CC(OC(=O)C)C(OC5CC(O)C(OC)C(C)O5)C(C)O4)c(C)c(O)c3c(O)c2C(=O)C1OC6CC(OC7CC(C)(O)C(OC(=O)C)C(C)O7)C(O)C(C)O6)C(=O)C(O)C(C)O RURLVUZRUFHCJO-UHFFFAOYSA-N 0.000 description 1
- 241000675108 Citrus tangerina Species 0.000 description 1
- 102100025877 Complement component C1q receptor Human genes 0.000 description 1
- 102100025680 Complement decay-accelerating factor Human genes 0.000 description 1
- 102100030886 Complement receptor type 1 Human genes 0.000 description 1
- 102100032768 Complement receptor type 2 Human genes 0.000 description 1
- 102400000739 Corticotropin Human genes 0.000 description 1
- 101800000414 Corticotropin Proteins 0.000 description 1
- 241000938605 Crocodylia Species 0.000 description 1
- 108010068192 Cyclin A Proteins 0.000 description 1
- 108010060385 Cyclin B1 Proteins 0.000 description 1
- 108010058546 Cyclin D1 Proteins 0.000 description 1
- 108010058544 Cyclin D2 Proteins 0.000 description 1
- 108010058545 Cyclin D3 Proteins 0.000 description 1
- 108090000257 Cyclin E Proteins 0.000 description 1
- 102000003909 Cyclin E Human genes 0.000 description 1
- 102000002431 Cyclin G Human genes 0.000 description 1
- 108090000404 Cyclin G1 Proteins 0.000 description 1
- 102100025191 Cyclin-A2 Human genes 0.000 description 1
- 102100024458 Cyclin-dependent kinase inhibitor 2A Human genes 0.000 description 1
- 108090000266 Cyclin-dependent kinases Proteins 0.000 description 1
- 102000003903 Cyclin-dependent kinases Human genes 0.000 description 1
- 102000000634 Cytochrome c oxidase subunit IV Human genes 0.000 description 1
- 108090000365 Cytochrome-c oxidases Proteins 0.000 description 1
- 108060006006 Cytochrome-c peroxidase Proteins 0.000 description 1
- 102100039061 Cytokine receptor common subunit beta Human genes 0.000 description 1
- 102100026234 Cytokine receptor common subunit gamma Human genes 0.000 description 1
- AUNGANRZJHBGPY-UHFFFAOYSA-N D-Lyxoflavin Natural products OCC(O)C(O)C(O)CN1C=2C=C(C)C(C)=CC=2N=C2C1=NC(=O)NC2=O AUNGANRZJHBGPY-UHFFFAOYSA-N 0.000 description 1
- 108010008286 DNA nucleotidylexotransferase Proteins 0.000 description 1
- 102100022307 DNA polymerase alpha catalytic subunit Human genes 0.000 description 1
- 102000052510 DNA-Binding Proteins Human genes 0.000 description 1
- 101710096438 DNA-binding protein Proteins 0.000 description 1
- 102000000541 Defensins Human genes 0.000 description 1
- 108010002069 Defensins Proteins 0.000 description 1
- 108020005199 Dehydrogenases Proteins 0.000 description 1
- 102000028526 Dihydrolipoamide Dehydrogenase Human genes 0.000 description 1
- 108010028127 Dihydrolipoamide Dehydrogenase Proteins 0.000 description 1
- MYMOFIZGZYHOMD-UHFFFAOYSA-N Dioxygen Chemical compound O=O MYMOFIZGZYHOMD-UHFFFAOYSA-N 0.000 description 1
- 102100025012 Dipeptidyl peptidase 4 Human genes 0.000 description 1
- 101000782852 Drosophila melanogaster Acetylcholine receptor subunit beta-like 2 Proteins 0.000 description 1
- 102100023471 E-selectin Human genes 0.000 description 1
- 238000002965 ELISA Methods 0.000 description 1
- 239000006145 Eagle's minimal essential medium Substances 0.000 description 1
- 102100025137 Early activation antigen CD69 Human genes 0.000 description 1
- 102100029722 Ectonucleoside triphosphate diphosphohydrolase 1 Human genes 0.000 description 1
- 108010014258 Elastin Proteins 0.000 description 1
- 102000016942 Elastin Human genes 0.000 description 1
- 102100037241 Endoglin Human genes 0.000 description 1
- 101710128765 Enhancer of filamentation 1 Proteins 0.000 description 1
- 101800003838 Epidermal growth factor Proteins 0.000 description 1
- 108010066687 Epithelial Cell Adhesion Molecule Proteins 0.000 description 1
- 102000018651 Epithelial Cell Adhesion Molecule Human genes 0.000 description 1
- 108010007005 Estrogen Receptor alpha Proteins 0.000 description 1
- QTANTQQOYSUMLC-UHFFFAOYSA-O Ethidium cation Chemical compound C12=CC(N)=CC=C2C2=CC=C(N)C=C2[N+](CC)=C1C1=CC=CC=C1 QTANTQQOYSUMLC-UHFFFAOYSA-O 0.000 description 1
- 208000006168 Ewing Sarcoma Diseases 0.000 description 1
- 108010000722 Excitatory Amino Acid Transporter 1 Proteins 0.000 description 1
- 102100031563 Excitatory amino acid transporter 1 Human genes 0.000 description 1
- 102100026693 FAS-associated death domain protein Human genes 0.000 description 1
- 108010077716 Fas-Associated Death Domain Protein Proteins 0.000 description 1
- 102100024165 G1/S-specific cyclin-D1 Human genes 0.000 description 1
- 102100024185 G1/S-specific cyclin-D2 Human genes 0.000 description 1
- 102100037859 G1/S-specific cyclin-D3 Human genes 0.000 description 1
- 102100032340 G2/mitotic-specific cyclin-B1 Human genes 0.000 description 1
- 102100021260 Galactosylgalactosylxylosylprotein 3-beta-glucuronosyltransferase 1 Human genes 0.000 description 1
- 108010066371 Galactosylxylosylprotein 3-beta-galactosyltransferase Proteins 0.000 description 1
- 108010001517 Galectin 3 Proteins 0.000 description 1
- 102100039558 Galectin-3 Human genes 0.000 description 1
- 102000009338 Gastric Mucins Human genes 0.000 description 1
- 108010009066 Gastric Mucins Proteins 0.000 description 1
- 108010010803 Gelatin Proteins 0.000 description 1
- 102000053171 Glial Fibrillary Acidic Human genes 0.000 description 1
- 101710193519 Glial fibrillary acidic protein Proteins 0.000 description 1
- 239000004366 Glucose oxidase Substances 0.000 description 1
- 108010015776 Glucose oxidase Proteins 0.000 description 1
- 102100030651 Glutamate receptor 2 Human genes 0.000 description 1
- 101710087631 Glutamate receptor 2 Proteins 0.000 description 1
- 102000006587 Glutathione peroxidase Human genes 0.000 description 1
- 108700016172 Glutathione peroxidases Proteins 0.000 description 1
- 244000068988 Glycine max Species 0.000 description 1
- 235000010469 Glycine max Nutrition 0.000 description 1
- 108010031186 Glycoside Hydrolases Proteins 0.000 description 1
- 102000005744 Glycoside Hydrolases Human genes 0.000 description 1
- 102100041033 Golgin subfamily B member 1 Human genes 0.000 description 1
- 102100039622 Granulocyte colony-stimulating factor receptor Human genes 0.000 description 1
- 102100028113 Granulocyte-macrophage colony-stimulating factor receptor subunit alpha Human genes 0.000 description 1
- 102000001398 Granzyme Human genes 0.000 description 1
- 108060005986 Granzyme Proteins 0.000 description 1
- 108010043121 Green Fluorescent Proteins Proteins 0.000 description 1
- 102000004144 Green Fluorescent Proteins Human genes 0.000 description 1
- 102100030595 HLA class II histocompatibility antigen gamma chain Human genes 0.000 description 1
- 102100031573 Hematopoietic progenitor cell antigen CD34 Human genes 0.000 description 1
- 102000001554 Hemoglobins Human genes 0.000 description 1
- 108010054147 Hemoglobins Proteins 0.000 description 1
- 241000238631 Hexapoda Species 0.000 description 1
- 102100026122 High affinity immunoglobulin gamma Fc receptor I Human genes 0.000 description 1
- 108010088652 Histocompatibility Antigens Class I Proteins 0.000 description 1
- 102000008949 Histocompatibility Antigens Class I Human genes 0.000 description 1
- 102000006947 Histones Human genes 0.000 description 1
- 108010033040 Histones Proteins 0.000 description 1
- 102100027893 Homeobox protein Nkx-2.1 Human genes 0.000 description 1
- 241000282412 Homo Species 0.000 description 1
- 101000800023 Homo sapiens 4F2 cell-surface antigen heavy chain Proteins 0.000 description 1
- 101000678236 Homo sapiens 5'-nucleotidase Proteins 0.000 description 1
- 101000718019 Homo sapiens A-kinase anchor protein 17A Proteins 0.000 description 1
- 101000777636 Homo sapiens ADP-ribosyl cyclase/cyclic ADP-ribose hydrolase 1 Proteins 0.000 description 1
- 101000718243 Homo sapiens Adhesion G protein-coupled receptor E5 Proteins 0.000 description 1
- 101001022185 Homo sapiens Alpha-(1,3)-fucosyltransferase 4 Proteins 0.000 description 1
- 101000757160 Homo sapiens Aminopeptidase N Proteins 0.000 description 1
- 101000971171 Homo sapiens Apoptosis regulator Bcl-2 Proteins 0.000 description 1
- 101000934359 Homo sapiens B-cell differentiation antigen CD72 Proteins 0.000 description 1
- 101000884305 Homo sapiens B-cell receptor CD22 Proteins 0.000 description 1
- 101000980825 Homo sapiens B-lymphocyte antigen CD19 Proteins 0.000 description 1
- 101000897405 Homo sapiens B-lymphocyte antigen CD20 Proteins 0.000 description 1
- 101000863864 Homo sapiens Beta-galactoside alpha-2,6-sialyltransferase 1 Proteins 0.000 description 1
- 101000947174 Homo sapiens C-X-C chemokine receptor type 1 Proteins 0.000 description 1
- 101000916059 Homo sapiens C-X-C chemokine receptor type 2 Proteins 0.000 description 1
- 101000867983 Homo sapiens C5a anaphylatoxin chemotactic receptor 1 Proteins 0.000 description 1
- 101000738399 Homo sapiens CD109 antigen Proteins 0.000 description 1
- 101000914511 Homo sapiens CD27 antigen Proteins 0.000 description 1
- 101000716130 Homo sapiens CD48 antigen Proteins 0.000 description 1
- 101000897400 Homo sapiens CD59 glycoprotein Proteins 0.000 description 1
- 101000934368 Homo sapiens CD63 antigen Proteins 0.000 description 1
- 101000934356 Homo sapiens CD70 antigen Proteins 0.000 description 1
- 101000914479 Homo sapiens CD81 antigen Proteins 0.000 description 1
- 101000914469 Homo sapiens CD82 antigen Proteins 0.000 description 1
- 101000946856 Homo sapiens CD83 antigen Proteins 0.000 description 1
- 101000981093 Homo sapiens Carcinoembryonic antigen-related cell adhesion molecule 1 Proteins 0.000 description 1
- 101000914337 Homo sapiens Carcinoembryonic antigen-related cell adhesion molecule 3 Proteins 0.000 description 1
- 101000914324 Homo sapiens Carcinoembryonic antigen-related cell adhesion molecule 5 Proteins 0.000 description 1
- 101000914326 Homo sapiens Carcinoembryonic antigen-related cell adhesion molecule 6 Proteins 0.000 description 1
- 101000914320 Homo sapiens Carcinoembryonic antigen-related cell adhesion molecule 8 Proteins 0.000 description 1
- 101000940912 Homo sapiens Choline transporter-like protein 1 Proteins 0.000 description 1
- 101000933665 Homo sapiens Complement component C1q receptor Proteins 0.000 description 1
- 101000856022 Homo sapiens Complement decay-accelerating factor Proteins 0.000 description 1
- 101000727061 Homo sapiens Complement receptor type 1 Proteins 0.000 description 1
- 101000941929 Homo sapiens Complement receptor type 2 Proteins 0.000 description 1
- 101001033280 Homo sapiens Cytokine receptor common subunit beta Proteins 0.000 description 1
- 101000908391 Homo sapiens Dipeptidyl peptidase 4 Proteins 0.000 description 1
- 101000622123 Homo sapiens E-selectin Proteins 0.000 description 1
- 101000934374 Homo sapiens Early activation antigen CD69 Proteins 0.000 description 1
- 101001012447 Homo sapiens Ectonucleoside triphosphate diphosphohydrolase 1 Proteins 0.000 description 1
- 101000881679 Homo sapiens Endoglin Proteins 0.000 description 1
- 101000894906 Homo sapiens Galactosylgalactosylxylosylprotein 3-beta-glucuronosyltransferase 1 Proteins 0.000 description 1
- 101000746364 Homo sapiens Granulocyte colony-stimulating factor receptor Proteins 0.000 description 1
- 101000916625 Homo sapiens Granulocyte-macrophage colony-stimulating factor receptor subunit alpha Proteins 0.000 description 1
- 101001082627 Homo sapiens HLA class II histocompatibility antigen gamma chain Proteins 0.000 description 1
- 101000777663 Homo sapiens Hematopoietic progenitor cell antigen CD34 Proteins 0.000 description 1
- 101000913074 Homo sapiens High affinity immunoglobulin gamma Fc receptor I Proteins 0.000 description 1
- 101000878602 Homo sapiens Immunoglobulin alpha Fc receptor Proteins 0.000 description 1
- 101001056180 Homo sapiens Induced myeloid leukemia cell differentiation protein Mcl-1 Proteins 0.000 description 1
- 101001078158 Homo sapiens Integrin alpha-1 Proteins 0.000 description 1
- 101001078133 Homo sapiens Integrin alpha-2 Proteins 0.000 description 1
- 101000994378 Homo sapiens Integrin alpha-3 Proteins 0.000 description 1
- 101000994375 Homo sapiens Integrin alpha-4 Proteins 0.000 description 1
- 101000994369 Homo sapiens Integrin alpha-5 Proteins 0.000 description 1
- 101000994365 Homo sapiens Integrin alpha-6 Proteins 0.000 description 1
- 101001046687 Homo sapiens Integrin alpha-E Proteins 0.000 description 1
- 101001078143 Homo sapiens Integrin alpha-IIb Proteins 0.000 description 1
- 101001046686 Homo sapiens Integrin alpha-M Proteins 0.000 description 1
- 101001046677 Homo sapiens Integrin alpha-V Proteins 0.000 description 1
- 101000935043 Homo sapiens Integrin beta-1 Proteins 0.000 description 1
- 101000935040 Homo sapiens Integrin beta-2 Proteins 0.000 description 1
- 101001015004 Homo sapiens Integrin beta-3 Proteins 0.000 description 1
- 101001015006 Homo sapiens Integrin beta-4 Proteins 0.000 description 1
- 101000599852 Homo sapiens Intercellular adhesion molecule 1 Proteins 0.000 description 1
- 101000599858 Homo sapiens Intercellular adhesion molecule 2 Proteins 0.000 description 1
- 101000599862 Homo sapiens Intercellular adhesion molecule 3 Proteins 0.000 description 1
- 101001001420 Homo sapiens Interferon gamma receptor 1 Proteins 0.000 description 1
- 101001057504 Homo sapiens Interferon-stimulated gene 20 kDa protein Proteins 0.000 description 1
- 101001076422 Homo sapiens Interleukin-1 receptor type 2 Proteins 0.000 description 1
- 101001055144 Homo sapiens Interleukin-2 receptor subunit alpha Proteins 0.000 description 1
- 101000960936 Homo sapiens Interleukin-5 receptor subunit alpha Proteins 0.000 description 1
- 101001018097 Homo sapiens L-selectin Proteins 0.000 description 1
- 101000605020 Homo sapiens Large neutral amino acids transporter small subunit 1 Proteins 0.000 description 1
- 101000777628 Homo sapiens Leukocyte antigen CD37 Proteins 0.000 description 1
- 101000984196 Homo sapiens Leukocyte immunoglobulin-like receptor subfamily A member 5 Proteins 0.000 description 1
- 101000984190 Homo sapiens Leukocyte immunoglobulin-like receptor subfamily B member 1 Proteins 0.000 description 1
- 101000868279 Homo sapiens Leukocyte surface antigen CD47 Proteins 0.000 description 1
- 101000980823 Homo sapiens Leukocyte surface antigen CD53 Proteins 0.000 description 1
- 101000608935 Homo sapiens Leukosialin Proteins 0.000 description 1
- 101000878605 Homo sapiens Low affinity immunoglobulin epsilon Fc receptor Proteins 0.000 description 1
- 101000917826 Homo sapiens Low affinity immunoglobulin gamma Fc region receptor II-a Proteins 0.000 description 1
- 101000917824 Homo sapiens Low affinity immunoglobulin gamma Fc region receptor II-b Proteins 0.000 description 1
- 101000917858 Homo sapiens Low affinity immunoglobulin gamma Fc region receptor III-A Proteins 0.000 description 1
- 101000917839 Homo sapiens Low affinity immunoglobulin gamma Fc region receptor III-B Proteins 0.000 description 1
- 101001063392 Homo sapiens Lymphocyte function-associated antigen 3 Proteins 0.000 description 1
- 101001023379 Homo sapiens Lysosome-associated membrane glycoprotein 1 Proteins 0.000 description 1
- 101000604993 Homo sapiens Lysosome-associated membrane glycoprotein 2 Proteins 0.000 description 1
- 101000916644 Homo sapiens Macrophage colony-stimulating factor 1 receptor Proteins 0.000 description 1
- 101000934372 Homo sapiens Macrosialin Proteins 0.000 description 1
- 101001008874 Homo sapiens Mast/stem cell growth factor receptor Kit Proteins 0.000 description 1
- 101000961414 Homo sapiens Membrane cofactor protein Proteins 0.000 description 1
- 101000946889 Homo sapiens Monocyte differentiation antigen CD14 Proteins 0.000 description 1
- 101000934338 Homo sapiens Myeloid cell surface antigen CD33 Proteins 0.000 description 1
- 101001023043 Homo sapiens Myoblast determination protein 1 Proteins 0.000 description 1
- 101000589002 Homo sapiens Myogenin Proteins 0.000 description 1
- 101000971513 Homo sapiens Natural killer cells antigen CD94 Proteins 0.000 description 1
- 101000581981 Homo sapiens Neural cell adhesion molecule 1 Proteins 0.000 description 1
- 101000979249 Homo sapiens Neuromodulin Proteins 0.000 description 1
- 101000622137 Homo sapiens P-selectin Proteins 0.000 description 1
- 101001071312 Homo sapiens Platelet glycoprotein IX Proteins 0.000 description 1
- 101001070790 Homo sapiens Platelet glycoprotein Ib alpha chain Proteins 0.000 description 1
- 101001070786 Homo sapiens Platelet glycoprotein Ib beta chain Proteins 0.000 description 1
- 101001033026 Homo sapiens Platelet glycoprotein V Proteins 0.000 description 1
- 101001126417 Homo sapiens Platelet-derived growth factor receptor alpha Proteins 0.000 description 1
- 101000692455 Homo sapiens Platelet-derived growth factor receptor beta Proteins 0.000 description 1
- 101000617708 Homo sapiens Pregnancy-specific beta-1-glycoprotein 1 Proteins 0.000 description 1
- 101000583175 Homo sapiens Prolactin-inducible protein Proteins 0.000 description 1
- 101001043564 Homo sapiens Prolow-density lipoprotein receptor-related protein 1 Proteins 0.000 description 1
- 101000633778 Homo sapiens SLAM family member 5 Proteins 0.000 description 1
- 101000739767 Homo sapiens Semaphorin-7A Proteins 0.000 description 1
- 101000884271 Homo sapiens Signal transducer CD24 Proteins 0.000 description 1
- 101000946860 Homo sapiens T-cell surface glycoprotein CD3 epsilon chain Proteins 0.000 description 1
- 101000596234 Homo sapiens T-cell surface protein tactile Proteins 0.000 description 1
- 101000914514 Homo sapiens T-cell-specific surface glycoprotein CD28 Proteins 0.000 description 1
- 101000914484 Homo sapiens T-lymphocyte activation antigen CD80 Proteins 0.000 description 1
- 101000800116 Homo sapiens Thy-1 membrane glycoprotein Proteins 0.000 description 1
- 101000835093 Homo sapiens Transferrin receptor protein 1 Proteins 0.000 description 1
- 101000801228 Homo sapiens Tumor necrosis factor receptor superfamily member 1A Proteins 0.000 description 1
- 101000801232 Homo sapiens Tumor necrosis factor receptor superfamily member 1B Proteins 0.000 description 1
- 101000851376 Homo sapiens Tumor necrosis factor receptor superfamily member 8 Proteins 0.000 description 1
- 101000851370 Homo sapiens Tumor necrosis factor receptor superfamily member 9 Proteins 0.000 description 1
- 101000760337 Homo sapiens Urokinase plasminogen activator surface receptor Proteins 0.000 description 1
- 101000622304 Homo sapiens Vascular cell adhesion protein 1 Proteins 0.000 description 1
- 241000701806 Human papillomavirus Species 0.000 description 1
- AVXURJPOCDRRFD-UHFFFAOYSA-N Hydroxylamine Chemical compound ON AVXURJPOCDRRFD-UHFFFAOYSA-N 0.000 description 1
- DGAQECJNVWCQMB-PUAWFVPOSA-M Ilexoside XXIX Chemical compound C[C@@H]1CC[C@@]2(CC[C@@]3(C(=CC[C@H]4[C@]3(CC[C@@H]5[C@@]4(CC[C@@H](C5(C)C)OS(=O)(=O)[O-])C)C)[C@@H]2[C@]1(C)O)C)C(=O)O[C@H]6[C@@H]([C@H]([C@@H]([C@H](O6)CO)O)O)O.[Na+] DGAQECJNVWCQMB-PUAWFVPOSA-M 0.000 description 1
- 102100038005 Immunoglobulin alpha Fc receptor Human genes 0.000 description 1
- 102100022516 Immunoglobulin superfamily member 2 Human genes 0.000 description 1
- 102100026539 Induced myeloid leukemia cell differentiation protein Mcl-1 Human genes 0.000 description 1
- 108010001127 Insulin Receptor Proteins 0.000 description 1
- 102100036721 Insulin receptor Human genes 0.000 description 1
- 102100025323 Integrin alpha-1 Human genes 0.000 description 1
- 102100025305 Integrin alpha-2 Human genes 0.000 description 1
- 102100032819 Integrin alpha-3 Human genes 0.000 description 1
- 102100032818 Integrin alpha-4 Human genes 0.000 description 1
- 102100032817 Integrin alpha-5 Human genes 0.000 description 1
- 102100032816 Integrin alpha-6 Human genes 0.000 description 1
- 102100022341 Integrin alpha-E Human genes 0.000 description 1
- 102100025306 Integrin alpha-IIb Human genes 0.000 description 1
- 102100022338 Integrin alpha-M Human genes 0.000 description 1
- 102100022337 Integrin alpha-V Human genes 0.000 description 1
- 102100022297 Integrin alpha-X Human genes 0.000 description 1
- 102100025304 Integrin beta-1 Human genes 0.000 description 1
- 102100025390 Integrin beta-2 Human genes 0.000 description 1
- 102100032999 Integrin beta-3 Human genes 0.000 description 1
- 102100033000 Integrin beta-4 Human genes 0.000 description 1
- 102100037877 Intercellular adhesion molecule 1 Human genes 0.000 description 1
- 102100037872 Intercellular adhesion molecule 2 Human genes 0.000 description 1
- 102100037871 Intercellular adhesion molecule 3 Human genes 0.000 description 1
- 102100035678 Interferon gamma receptor 1 Human genes 0.000 description 1
- 102100027268 Interferon-stimulated gene 20 kDa protein Human genes 0.000 description 1
- 102100026017 Interleukin-1 receptor type 2 Human genes 0.000 description 1
- 108010038453 Interleukin-2 Receptors Proteins 0.000 description 1
- 102000010789 Interleukin-2 Receptors Human genes 0.000 description 1
- 102100026879 Interleukin-2 receptor subunit beta Human genes 0.000 description 1
- 102100033493 Interleukin-3 receptor subunit alpha Human genes 0.000 description 1
- 102100039078 Interleukin-4 receptor subunit alpha Human genes 0.000 description 1
- 102100039881 Interleukin-5 receptor subunit alpha Human genes 0.000 description 1
- 102100037792 Interleukin-6 receptor subunit alpha Human genes 0.000 description 1
- 102100037795 Interleukin-6 receptor subunit beta Human genes 0.000 description 1
- 102100021593 Interleukin-7 receptor subunit alpha Human genes 0.000 description 1
- 102100033467 L-selectin Human genes 0.000 description 1
- QIVBCDIJIAJPQS-VIFPVBQESA-N L-tryptophane Chemical compound C1=CC=C2C(C[C@H](N)C(O)=O)=CNC2=C1 QIVBCDIJIAJPQS-VIFPVBQESA-N 0.000 description 1
- OUYCCCASQSFEME-QMMMGPOBSA-N L-tyrosine Chemical compound OC(=O)[C@@H](N)CC1=CC=C(O)C=C1 OUYCCCASQSFEME-QMMMGPOBSA-N 0.000 description 1
- 108010023244 Lactoperoxidase Proteins 0.000 description 1
- 102100038609 Lactoperoxidase Human genes 0.000 description 1
- 102000008201 Lamin Type A Human genes 0.000 description 1
- 108010021099 Lamin Type A Proteins 0.000 description 1
- 102000002704 Leucyl aminopeptidase Human genes 0.000 description 1
- 108010004098 Leucyl aminopeptidase Proteins 0.000 description 1
- 108010013709 Leukocyte Common Antigens Proteins 0.000 description 1
- 102100031586 Leukocyte antigen CD37 Human genes 0.000 description 1
- 102100025574 Leukocyte immunoglobulin-like receptor subfamily A member 5 Human genes 0.000 description 1
- 102100032913 Leukocyte surface antigen CD47 Human genes 0.000 description 1
- 102100024221 Leukocyte surface antigen CD53 Human genes 0.000 description 1
- 102100039564 Leukosialin Human genes 0.000 description 1
- 102000004882 Lipase Human genes 0.000 description 1
- 108090001060 Lipase Proteins 0.000 description 1
- 239000004367 Lipase Substances 0.000 description 1
- 102100038007 Low affinity immunoglobulin epsilon Fc receptor Human genes 0.000 description 1
- 102100029204 Low affinity immunoglobulin gamma Fc region receptor II-a Human genes 0.000 description 1
- 102100029193 Low affinity immunoglobulin gamma Fc region receptor III-A Human genes 0.000 description 1
- 102100029185 Low affinity immunoglobulin gamma Fc region receptor III-B Human genes 0.000 description 1
- 102100030984 Lymphocyte function-associated antigen 3 Human genes 0.000 description 1
- 102100035133 Lysosome-associated membrane glycoprotein 1 Human genes 0.000 description 1
- 102100038225 Lysosome-associated membrane glycoprotein 2 Human genes 0.000 description 1
- 102000016200 MART-1 Antigen Human genes 0.000 description 1
- 108010010995 MART-1 Antigen Proteins 0.000 description 1
- 101800000695 MLL cleavage product C180 Proteins 0.000 description 1
- 102100028198 Macrophage colony-stimulating factor 1 receptor Human genes 0.000 description 1
- 102100025136 Macrosialin Human genes 0.000 description 1
- 241000124008 Mammalia Species 0.000 description 1
- 102100027754 Mast/stem cell growth factor receptor Kit Human genes 0.000 description 1
- 102000000380 Matrix Metalloproteinase 1 Human genes 0.000 description 1
- 108010016113 Matrix Metalloproteinase 1 Proteins 0.000 description 1
- 102000000424 Matrix Metalloproteinase 2 Human genes 0.000 description 1
- 108010016165 Matrix Metalloproteinase 2 Proteins 0.000 description 1
- 102000002274 Matrix Metalloproteinases Human genes 0.000 description 1
- 108010000684 Matrix Metalloproteinases Proteins 0.000 description 1
- 102100039373 Membrane cofactor protein Human genes 0.000 description 1
- 102000003735 Mesothelin Human genes 0.000 description 1
- 108090000015 Mesothelin Proteins 0.000 description 1
- 102000003792 Metallothionein Human genes 0.000 description 1
- 108090000157 Metallothionein Proteins 0.000 description 1
- PQMWYJDJHJQZDE-UHFFFAOYSA-M Methantheline bromide Chemical compound [Br-].C1=CC=C2C(C(=O)OCC[N+](C)(CC)CC)C3=CC=CC=C3OC2=C1 PQMWYJDJHJQZDE-UHFFFAOYSA-M 0.000 description 1
- 208000009795 Microphthalmos Diseases 0.000 description 1
- 102000003794 Mini-chromosome maintenance proteins Human genes 0.000 description 1
- 108090000159 Mini-chromosome maintenance proteins Proteins 0.000 description 1
- 102100035877 Monocyte differentiation antigen CD14 Human genes 0.000 description 1
- 108010008707 Mucin-1 Proteins 0.000 description 1
- 241000699666 Mus <mouse, genus> Species 0.000 description 1
- 101100381525 Mus musculus Bcl6 gene Proteins 0.000 description 1
- 101100390562 Mus musculus Fen1 gene Proteins 0.000 description 1
- 101001096236 Mus musculus Prolactin-inducible protein homolog Proteins 0.000 description 1
- 101100412856 Mus musculus Rhod gene Proteins 0.000 description 1
- 102100038895 Myc proto-oncogene protein Human genes 0.000 description 1
- 101710135898 Myc proto-oncogene protein Proteins 0.000 description 1
- 102000047918 Myelin Basic Human genes 0.000 description 1
- 101710107068 Myelin basic protein Proteins 0.000 description 1
- 102100025243 Myeloid cell surface antigen CD33 Human genes 0.000 description 1
- 102100035077 Myoblast determination protein 1 Human genes 0.000 description 1
- 102100032970 Myogenin Human genes 0.000 description 1
- 102100030856 Myoglobin Human genes 0.000 description 1
- 108010062374 Myoglobin Proteins 0.000 description 1
- KWYHDKDOAIKMQN-UHFFFAOYSA-N N,N,N',N'-tetramethylethylenediamine Chemical compound CN(C)CCN(C)C KWYHDKDOAIKMQN-UHFFFAOYSA-N 0.000 description 1
- 102100021462 Natural killer cells antigen CD94 Human genes 0.000 description 1
- 102100027347 Neural cell adhesion molecule 1 Human genes 0.000 description 1
- 108090000556 Neuregulin-1 Proteins 0.000 description 1
- 102400000058 Neuregulin-1 Human genes 0.000 description 1
- 206010029260 Neuroblastoma Diseases 0.000 description 1
- 102100023206 Neuromodulin Human genes 0.000 description 1
- 102000019315 Nicotinic acetylcholine receptors Human genes 0.000 description 1
- 108050006807 Nicotinic acetylcholine receptors Proteins 0.000 description 1
- 238000010826 Nissl staining Methods 0.000 description 1
- 239000000020 Nitrocellulose Substances 0.000 description 1
- 102100023050 Nuclear factor NF-kappa-B p105 subunit Human genes 0.000 description 1
- 108090000163 Nuclear pore complex proteins Proteins 0.000 description 1
- 102000003789 Nuclear pore complex proteins Human genes 0.000 description 1
- 108091028043 Nucleic acid sequence Proteins 0.000 description 1
- 239000004677 Nylon Substances 0.000 description 1
- 206010033128 Ovarian cancer Diseases 0.000 description 1
- 206010061535 Ovarian neoplasm Diseases 0.000 description 1
- 102000004316 Oxidoreductases Human genes 0.000 description 1
- 108090000854 Oxidoreductases Proteins 0.000 description 1
- 102100023472 P-selectin Human genes 0.000 description 1
- 102100034925 P-selectin glycoprotein ligand 1 Human genes 0.000 description 1
- 108010011536 PTEN Phosphohydrolase Proteins 0.000 description 1
- 241000282577 Pan troglodytes Species 0.000 description 1
- 206010061902 Pancreatic neoplasm Diseases 0.000 description 1
- 229930040373 Paraformaldehyde Natural products 0.000 description 1
- 108090000445 Parathyroid hormone Proteins 0.000 description 1
- 102000035195 Peptidases Human genes 0.000 description 1
- 108091005804 Peptidases Proteins 0.000 description 1
- 102100028465 Peripherin Human genes 0.000 description 1
- 108010003081 Peripherins Proteins 0.000 description 1
- 108700020962 Peroxidase Proteins 0.000 description 1
- 102000003992 Peroxidases Human genes 0.000 description 1
- 241000009328 Perro Species 0.000 description 1
- BELBBZDIHDAJOR-UHFFFAOYSA-N Phenolsulfonephthalein Chemical compound C1=CC(O)=CC=C1C1(C=2C=CC(O)=CC=2)C2=CC=CC=C2S(=O)(=O)O1 BELBBZDIHDAJOR-UHFFFAOYSA-N 0.000 description 1
- 102100032543 Phosphatidylinositol 3,4,5-trisphosphate 3-phosphatase and dual-specificity protein phosphatase PTEN Human genes 0.000 description 1
- 102000001105 Phosphofructokinases Human genes 0.000 description 1
- 108010069341 Phosphofructokinases Proteins 0.000 description 1
- 101710177166 Phosphoprotein Proteins 0.000 description 1
- 108700019535 Phosphoprotein Phosphatases Proteins 0.000 description 1
- 102000009097 Phosphorylases Human genes 0.000 description 1
- 108010073135 Phosphorylases Proteins 0.000 description 1
- 108010004729 Phycoerythrin Proteins 0.000 description 1
- 102100024616 Platelet endothelial cell adhesion molecule Human genes 0.000 description 1
- 102100036851 Platelet glycoprotein IX Human genes 0.000 description 1
- 102100034173 Platelet glycoprotein Ib alpha chain Human genes 0.000 description 1
- 102100034168 Platelet glycoprotein Ib beta chain Human genes 0.000 description 1
- 102100038411 Platelet glycoprotein V Human genes 0.000 description 1
- 102100030485 Platelet-derived growth factor receptor alpha Human genes 0.000 description 1
- 102100026547 Platelet-derived growth factor receptor beta Human genes 0.000 description 1
- 102100029740 Poliovirus receptor Human genes 0.000 description 1
- 102000012338 Poly(ADP-ribose) Polymerases Human genes 0.000 description 1
- 108010061844 Poly(ADP-ribose) Polymerases Proteins 0.000 description 1
- 229920000776 Poly(Adenosine diphosphate-ribose) polymerase Polymers 0.000 description 1
- 239000004743 Polypropylene Substances 0.000 description 1
- 229920001213 Polysorbate 20 Polymers 0.000 description 1
- 239000004793 Polystyrene Substances 0.000 description 1
- 108010071690 Prealbumin Proteins 0.000 description 1
- 102000007584 Prealbumin Human genes 0.000 description 1
- 102100022024 Pregnancy-specific beta-1-glycoprotein 1 Human genes 0.000 description 1
- 241000288906 Primates Species 0.000 description 1
- 102100033237 Pro-epidermal growth factor Human genes 0.000 description 1
- 101710127372 Probable head completion protein 2 Proteins 0.000 description 1
- 102100036829 Probable peptidyl-tRNA hydrolase Human genes 0.000 description 1
- 101710184309 Probable sucrose-6-phosphate hydrolase Proteins 0.000 description 1
- 102100030350 Prolactin-inducible protein Human genes 0.000 description 1
- 102100021923 Prolow-density lipoprotein receptor-related protein 1 Human genes 0.000 description 1
- 102100035703 Prostatic acid phosphatase Human genes 0.000 description 1
- 239000004365 Protease Substances 0.000 description 1
- 108010001267 Protein Subunits Proteins 0.000 description 1
- 102000002067 Protein Subunits Human genes 0.000 description 1
- 101100119953 Pyrococcus furiosus (strain ATCC 43587 / DSM 3638 / JCM 8422 / Vc1) fen gene Proteins 0.000 description 1
- 241000700159 Rattus Species 0.000 description 1
- 102100020718 Receptor-type tyrosine-protein kinase FLT3 Human genes 0.000 description 1
- 102100039808 Receptor-type tyrosine-protein phosphatase eta Human genes 0.000 description 1
- 208000006265 Renal cell carcinoma Diseases 0.000 description 1
- 201000000582 Retinoblastoma Diseases 0.000 description 1
- 108010093560 Rezafungin Proteins 0.000 description 1
- 102000013674 S-100 Human genes 0.000 description 1
- 108700021018 S100 Proteins 0.000 description 1
- 102100029216 SLAM family member 5 Human genes 0.000 description 1
- 108010082545 Secretory Leukocyte Peptidase Inhibitor Proteins 0.000 description 1
- 102100037545 Semaphorin-7A Human genes 0.000 description 1
- 102100038081 Signal transducer CD24 Human genes 0.000 description 1
- 108010074687 Signaling Lymphocytic Activation Molecule Family Member 1 Proteins 0.000 description 1
- 102100029215 Signaling lymphocytic activation molecule Human genes 0.000 description 1
- BLRPTPMANUNPDV-UHFFFAOYSA-N Silane Chemical compound [SiH4] BLRPTPMANUNPDV-UHFFFAOYSA-N 0.000 description 1
- 101710149279 Small delta antigen Proteins 0.000 description 1
- UIIMBOGNXHQVGW-DEQYMQKBSA-M Sodium bicarbonate-14C Chemical compound [Na+].O[14C]([O-])=O UIIMBOGNXHQVGW-DEQYMQKBSA-M 0.000 description 1
- 108010090804 Streptavidin Proteins 0.000 description 1
- 102000019259 Succinate Dehydrogenase Human genes 0.000 description 1
- 108010012901 Succinate Dehydrogenase Proteins 0.000 description 1
- 102400000472 Sucrase Human genes 0.000 description 1
- 101710112652 Sucrose-6-phosphate hydrolase Proteins 0.000 description 1
- 102000001435 Synapsin Human genes 0.000 description 1
- 108050009621 Synapsin Proteins 0.000 description 1
- 108090001076 Synaptophysin Proteins 0.000 description 1
- 102000004874 Synaptophysin Human genes 0.000 description 1
- 108010057722 Synaptosomal-Associated Protein 25 Proteins 0.000 description 1
- 102000004183 Synaptosomal-Associated Protein 25 Human genes 0.000 description 1
- 102100035794 T-cell surface glycoprotein CD3 epsilon chain Human genes 0.000 description 1
- 102100035268 T-cell surface protein tactile Human genes 0.000 description 1
- 102100027213 T-cell-specific surface glycoprotein CD28 Human genes 0.000 description 1
- 102100027222 T-lymphocyte activation antigen CD80 Human genes 0.000 description 1
- 101710164270 Tail knob protein gp9 Proteins 0.000 description 1
- 102100024554 Tetranectin Human genes 0.000 description 1
- 101100242191 Tetraodon nigroviridis rho gene Proteins 0.000 description 1
- 102100036407 Thioredoxin Human genes 0.000 description 1
- 102100033523 Thy-1 membrane glycoprotein Human genes 0.000 description 1
- 108010057966 Thyroid Nuclear Factor 1 Proteins 0.000 description 1
- MZZINWWGSYUHGU-UHFFFAOYSA-J ToTo-1 Chemical compound [I-].[I-].[I-].[I-].C12=CC=CC=C2C(C=C2N(C3=CC=CC=C3S2)C)=CC=[N+]1CCC[N+](C)(C)CCC[N+](C)(C)CCC[N+](C1=CC=CC=C11)=CC=C1C=C1N(C)C2=CC=CC=C2S1 MZZINWWGSYUHGU-UHFFFAOYSA-J 0.000 description 1
- 102000040945 Transcription factor Human genes 0.000 description 1
- 108091023040 Transcription factor Proteins 0.000 description 1
- 101710150448 Transcriptional regulator Myc Proteins 0.000 description 1
- QIVBCDIJIAJPQS-UHFFFAOYSA-N Tryptophan Natural products C1=CC=C2C(CC(N)C(O)=O)=CNC2=C1 QIVBCDIJIAJPQS-UHFFFAOYSA-N 0.000 description 1
- 102000005506 Tryptophan Hydroxylase Human genes 0.000 description 1
- 108010031944 Tryptophan Hydroxylase Proteins 0.000 description 1
- 102100031988 Tumor necrosis factor ligand superfamily member 6 Human genes 0.000 description 1
- 108050002568 Tumor necrosis factor ligand superfamily member 6 Proteins 0.000 description 1
- 102100033732 Tumor necrosis factor receptor superfamily member 1A Human genes 0.000 description 1
- 102100033733 Tumor necrosis factor receptor superfamily member 1B Human genes 0.000 description 1
- 102100022153 Tumor necrosis factor receptor superfamily member 4 Human genes 0.000 description 1
- 102100040245 Tumor necrosis factor receptor superfamily member 5 Human genes 0.000 description 1
- 102100036857 Tumor necrosis factor receptor superfamily member 8 Human genes 0.000 description 1
- 102100036856 Tumor necrosis factor receptor superfamily member 9 Human genes 0.000 description 1
- 102100039094 Tyrosinase Human genes 0.000 description 1
- 108060008724 Tyrosinase Proteins 0.000 description 1
- 108091000117 Tyrosine 3-Monooxygenase Proteins 0.000 description 1
- 102000048218 Tyrosine 3-monooxygenases Human genes 0.000 description 1
- 108090000848 Ubiquitin Proteins 0.000 description 1
- 102000044159 Ubiquitin Human genes 0.000 description 1
- 102100024689 Urokinase plasminogen activator surface receptor Human genes 0.000 description 1
- 108010000134 Vascular Cell Adhesion Molecule-1 Proteins 0.000 description 1
- 102000013127 Vimentin Human genes 0.000 description 1
- 108010065472 Vimentin Proteins 0.000 description 1
- GRRMZXFOOGQMFA-UHFFFAOYSA-J YoYo-1 Chemical compound [I-].[I-].[I-].[I-].C12=CC=CC=C2C(C=C2N(C3=CC=CC=C3O2)C)=CC=[N+]1CCC[N+](C)(C)CCC[N+](C)(C)CCC[N+](C1=CC=CC=C11)=CC=C1C=C1N(C)C2=CC=CC=C2O1 GRRMZXFOOGQMFA-UHFFFAOYSA-J 0.000 description 1
- WLKAMFOFXYCYDK-UHFFFAOYSA-N [5-amino-4-[[3-[(2-amino-4-azaniumyl-5-methylphenyl)diazenyl]-4-methylphenyl]diazenyl]-2-methylphenyl]azanium;dichloride Chemical compound [Cl-].[Cl-].CC1=CC=C(N=NC=2C(=CC([NH3+])=C(C)C=2)N)C=C1N=NC1=CC(C)=C([NH3+])C=C1N WLKAMFOFXYCYDK-UHFFFAOYSA-N 0.000 description 1
- 239000000370 acceptor Substances 0.000 description 1
- DGOBMKYRQHEFGQ-UHFFFAOYSA-L acid green 5 Chemical compound [Na+].[Na+].C=1C=C(C(=C2C=CC(C=C2)=[N+](CC)CC=2C=C(C=CC=2)S([O-])(=O)=O)C=2C=CC(=CC=2)S([O-])(=O)=O)C=CC=1N(CC)CC1=CC=CC(S([O-])(=O)=O)=C1 DGOBMKYRQHEFGQ-UHFFFAOYSA-L 0.000 description 1
- 150000001251 acridines Chemical class 0.000 description 1
- 230000003213 activating effect Effects 0.000 description 1
- 230000001154 acute effect Effects 0.000 description 1
- 150000008052 alkyl sulfonates Chemical class 0.000 description 1
- 108010091628 alpha 1-Antichymotrypsin Proteins 0.000 description 1
- 108010050122 alpha 1-Antitrypsin Proteins 0.000 description 1
- 229940024142 alpha 1-antitrypsin Drugs 0.000 description 1
- 102000013640 alpha-Crystallin B Chain Human genes 0.000 description 1
- 108010051585 alpha-Crystallin B Chain Proteins 0.000 description 1
- 108010026331 alpha-Fetoproteins Proteins 0.000 description 1
- 102000013529 alpha-Fetoproteins Human genes 0.000 description 1
- 108090000185 alpha-Synuclein Proteins 0.000 description 1
- 108010011385 alpha-internexin Proteins 0.000 description 1
- 150000001408 amides Chemical class 0.000 description 1
- DZHSAHHDTRWUTF-SIQRNXPUSA-N amyloid-beta polypeptide 42 Chemical compound C([C@@H](C(=O)N[C@@H](C)C(=O)N[C@@H](CCC(O)=O)C(=O)N[C@@H](CC(O)=O)C(=O)N[C@H](C(=O)NCC(=O)N[C@@H](CO)C(=O)N[C@@H](CC(N)=O)C(=O)N[C@@H](CCCCN)C(=O)NCC(=O)N[C@@H](C)C(=O)N[C@H](C(=O)N[C@@H]([C@@H](C)CC)C(=O)NCC(=O)N[C@@H](CC(C)C)C(=O)N[C@@H](CCSC)C(=O)N[C@@H](C(C)C)C(=O)NCC(=O)NCC(=O)N[C@@H](C(C)C)C(=O)N[C@@H](C(C)C)C(=O)N[C@@H]([C@@H](C)CC)C(=O)N[C@@H](C)C(O)=O)[C@@H](C)CC)C(C)C)NC(=O)[C@H](CC=1C=CC=CC=1)NC(=O)[C@@H](NC(=O)[C@H](CC(C)C)NC(=O)[C@H](CCCCN)NC(=O)[C@H](CCC(N)=O)NC(=O)[C@H](CC=1N=CNC=1)NC(=O)[C@H](CC=1N=CNC=1)NC(=O)[C@@H](NC(=O)[C@H](CCC(O)=O)NC(=O)[C@H](CC=1C=CC(O)=CC=1)NC(=O)CNC(=O)[C@H](CO)NC(=O)[C@H](CC(O)=O)NC(=O)[C@H](CC=1N=CNC=1)NC(=O)[C@H](CCCNC(N)=N)NC(=O)[C@H](CC=1C=CC=CC=1)NC(=O)[C@H](CCC(O)=O)NC(=O)[C@H](C)NC(=O)[C@@H](N)CC(O)=O)C(C)C)C(C)C)C1=CC=CC=C1 DZHSAHHDTRWUTF-SIQRNXPUSA-N 0.000 description 1
- 230000033115 angiogenesis Effects 0.000 description 1
- 150000008064 anhydrides Chemical class 0.000 description 1
- 239000003242 anti bacterial agent Substances 0.000 description 1
- 230000002280 anti-androgenic effect Effects 0.000 description 1
- 239000000051 antiandrogen Substances 0.000 description 1
- 229940088710 antibiotic agent Drugs 0.000 description 1
- 230000009830 antibody antigen interaction Effects 0.000 description 1
- 230000009833 antibody interaction Effects 0.000 description 1
- 239000003146 anticoagulant agent Substances 0.000 description 1
- 229940127219 anticoagulant drug Drugs 0.000 description 1
- 239000003418 antiprogestin Substances 0.000 description 1
- 230000001640 apoptogenic effect Effects 0.000 description 1
- 150000001502 aryl halides Chemical class 0.000 description 1
- 230000001174 ascending effect Effects 0.000 description 1
- QVGXLLKOCUKJST-UHFFFAOYSA-N atomic oxygen Chemical compound [O] QVGXLLKOCUKJST-UHFFFAOYSA-N 0.000 description 1
- FOYVTVSSAMSORJ-UHFFFAOYSA-N atto 655 Chemical compound OC(=O)CCCN1C(C)(C)CC(CS([O-])(=O)=O)C2=C1C=C1OC3=CC4=[N+](CC)CCCC4=CC3=NC1=C2 FOYVTVSSAMSORJ-UHFFFAOYSA-N 0.000 description 1
- JPIYZTWMUGTEHX-UHFFFAOYSA-N auramine O free base Chemical compound C1=CC(N(C)C)=CC=C1C(=N)C1=CC=C(N(C)C)C=C1 JPIYZTWMUGTEHX-UHFFFAOYSA-N 0.000 description 1
- GOOXRYWLNNXLFL-UHFFFAOYSA-H azane oxygen(2-) ruthenium(3+) ruthenium(4+) hexachloride Chemical compound N.N.N.N.N.N.N.N.N.N.N.N.N.N.[O--].[O--].[Cl-].[Cl-].[Cl-].[Cl-].[Cl-].[Cl-].[Ru+3].[Ru+3].[Ru+4] GOOXRYWLNNXLFL-UHFFFAOYSA-H 0.000 description 1
- 239000011324 bead Substances 0.000 description 1
- 102000005936 beta-Galactosidase Human genes 0.000 description 1
- 108010005774 beta-Galactosidase Proteins 0.000 description 1
- 102000009732 beta-microseminoprotein Human genes 0.000 description 1
- 108010020169 beta-microseminoprotein Proteins 0.000 description 1
- 108091008324 binding proteins Proteins 0.000 description 1
- 239000013060 biological fluid Substances 0.000 description 1
- 229960002685 biotin Drugs 0.000 description 1
- 235000020958 biotin Nutrition 0.000 description 1
- 239000011616 biotin Substances 0.000 description 1
- 210000000601 blood cell Anatomy 0.000 description 1
- 210000004204 blood vessel Anatomy 0.000 description 1
- 210000001124 body fluid Anatomy 0.000 description 1
- 239000010839 body fluid Substances 0.000 description 1
- 210000000988 bone and bone Anatomy 0.000 description 1
- 229910052796 boron Inorganic materials 0.000 description 1
- 229940045348 brown mixture Drugs 0.000 description 1
- 229950004398 broxuridine Drugs 0.000 description 1
- 108060001061 calbindin Proteins 0.000 description 1
- 102000014823 calbindin Human genes 0.000 description 1
- DEGAKNSWVGKMLS-UHFFFAOYSA-N calcein Chemical compound O1C(=O)C2=CC=CC=C2C21C1=CC(CN(CC(O)=O)CC(O)=O)=C(O)C=C1OC1=C2C=C(CN(CC(O)=O)CC(=O)O)C(O)=C1 DEGAKNSWVGKMLS-UHFFFAOYSA-N 0.000 description 1
- BQRGNLJZBFXNCZ-UHFFFAOYSA-N calcein am Chemical compound O1C(=O)C2=CC=CC=C2C21C1=CC(CN(CC(=O)OCOC(C)=O)CC(=O)OCOC(C)=O)=C(OC(C)=O)C=C1OC1=C2C=C(CN(CC(=O)OCOC(C)=O)CC(=O)OCOC(=O)C)C(OC(C)=O)=C1 BQRGNLJZBFXNCZ-UHFFFAOYSA-N 0.000 description 1
- 239000011575 calcium Substances 0.000 description 1
- 229910052791 calcium Inorganic materials 0.000 description 1
- 238000007707 calorimetry Methods 0.000 description 1
- 150000001735 carboxylic acids Chemical class 0.000 description 1
- 210000000845 cartilage Anatomy 0.000 description 1
- 230000004663 cell proliferation Effects 0.000 description 1
- 239000013522 chelant Substances 0.000 description 1
- 238000007385 chemical modification Methods 0.000 description 1
- ZYVSOIYQKUDENJ-WKSBCEQHSA-N chromomycin A3 Chemical compound O([C@@H]1C[C@@H](O[C@H](C)[C@@H]1OC(C)=O)OC=1C=C2C=C3C[C@H]([C@@H](C(=O)C3=C(O)C2=C(O)C=1C)O[C@@H]1O[C@H](C)[C@@H](O)[C@H](O[C@@H]2O[C@H](C)[C@@H](O)[C@H](O[C@@H]3O[C@@H](C)[C@H](OC(C)=O)[C@@](C)(O)C3)C2)C1)[C@H](OC)C(=O)[C@@H](O)[C@@H](C)O)[C@@H]1C[C@@H](O)[C@@H](OC)[C@@H](C)O1 ZYVSOIYQKUDENJ-WKSBCEQHSA-N 0.000 description 1
- 238000010367 cloning Methods 0.000 description 1
- 108010047295 complement receptors Proteins 0.000 description 1
- 102000006834 complement receptors Human genes 0.000 description 1
- 238000010668 complexation reaction Methods 0.000 description 1
- 230000001268 conjugating effect Effects 0.000 description 1
- 210000002808 connective tissue Anatomy 0.000 description 1
- 239000000470 constituent Substances 0.000 description 1
- 238000001816 cooling Methods 0.000 description 1
- IDLFZVILOHSSID-OVLDLUHVSA-N corticotropin Chemical compound C([C@@H](C(=O)N[C@@H](CO)C(=O)N[C@@H](CCSC)C(=O)N[C@@H](CCC(O)=O)C(=O)N[C@@H](CC=1NC=NC=1)C(=O)N[C@@H](CC=1C=CC=CC=1)C(=O)N[C@@H](CCCNC(N)=N)C(=O)N[C@@H](CC=1C2=CC=CC=C2NC=1)C(=O)NCC(=O)N[C@@H](CCCCN)C(=O)N1[C@@H](CCC1)C(=O)N[C@@H](C(C)C)C(=O)NCC(=O)N[C@@H](CCCCN)C(=O)N[C@@H](CCCCN)C(=O)N[C@@H](CCCNC(N)=N)C(=O)N[C@@H](CCCNC(N)=N)C(=O)N1[C@@H](CCC1)C(=O)N[C@@H](C(C)C)C(=O)N[C@@H](CCCCN)C(=O)N[C@@H](C(C)C)C(=O)N[C@@H](CC=1C=CC(O)=CC=1)C(=O)N1[C@@H](CCC1)C(=O)N[C@@H](CC(N)=O)C(=O)NCC(=O)N[C@@H](C)C(=O)N[C@@H](CCC(O)=O)C(=O)N[C@@H](CC(O)=O)C(=O)N[C@@H](CCC(O)=O)C(=O)N[C@@H](CO)C(=O)N[C@@H](C)C(=O)N[C@@H](CCC(O)=O)C(=O)N[C@@H](C)C(=O)N[C@@H](CC=1C=CC=CC=1)C(=O)N1[C@@H](CCC1)C(=O)N[C@@H](CC(C)C)C(=O)N[C@@H](CCC(O)=O)C(=O)N[C@@H](CC=1C=CC=CC=1)C(O)=O)NC(=O)[C@@H](N)CO)C1=CC=C(O)C=C1 IDLFZVILOHSSID-OVLDLUHVSA-N 0.000 description 1
- 229960000258 corticotropin Drugs 0.000 description 1
- 125000004122 cyclic group Chemical group 0.000 description 1
- 230000002380 cytological effect Effects 0.000 description 1
- 210000004443 dendritic cell Anatomy 0.000 description 1
- 230000001419 dependent effect Effects 0.000 description 1
- OVTCUIZCVUGJHS-UHFFFAOYSA-N dipyrrin Chemical compound C=1C=CNC=1C=C1C=CC=N1 OVTCUIZCVUGJHS-UHFFFAOYSA-N 0.000 description 1
- OOYIOIOOWUGAHD-UHFFFAOYSA-L disodium;2',4',5',7'-tetrabromo-4,5,6,7-tetrachloro-3-oxospiro[2-benzofuran-1,9'-xanthene]-3',6'-diolate Chemical compound [Na+].[Na+].O1C(=O)C(C(=C(Cl)C(Cl)=C2Cl)Cl)=C2C21C1=CC(Br)=C([O-])C(Br)=C1OC1=C(Br)C([O-])=C(Br)C=C21 OOYIOIOOWUGAHD-UHFFFAOYSA-L 0.000 description 1
- KPBGWWXVWRSIAY-UHFFFAOYSA-L disodium;2',4',5',7'-tetraiodo-6-isothiocyanato-3-oxospiro[2-benzofuran-1,9'-xanthene]-3',6'-diolate Chemical compound [Na+].[Na+].O1C(=O)C2=CC=C(N=C=S)C=C2C21C1=CC(I)=C([O-])C(I)=C1OC1=C(I)C([O-])=C(I)C=C21 KPBGWWXVWRSIAY-UHFFFAOYSA-L 0.000 description 1
- YJHDFAAFYNRKQE-YHPRVSEPSA-L disodium;5-[[4-anilino-6-[bis(2-hydroxyethyl)amino]-1,3,5-triazin-2-yl]amino]-2-[(e)-2-[4-[[4-anilino-6-[bis(2-hydroxyethyl)amino]-1,3,5-triazin-2-yl]amino]-2-sulfonatophenyl]ethenyl]benzenesulfonate Chemical compound [Na+].[Na+].N=1C(NC=2C=C(C(\C=C\C=3C(=CC(NC=4N=C(N=C(NC=5C=CC=CC=5)N=4)N(CCO)CCO)=CC=3)S([O-])(=O)=O)=CC=2)S([O-])(=O)=O)=NC(N(CCO)CCO)=NC=1NC1=CC=CC=C1 YJHDFAAFYNRKQE-YHPRVSEPSA-L 0.000 description 1
- 229920002549 elastin Polymers 0.000 description 1
- 238000001493 electron microscopy Methods 0.000 description 1
- 230000009881 electrostatic interaction Effects 0.000 description 1
- 230000003511 endothelial effect Effects 0.000 description 1
- 238000005516 engineering process Methods 0.000 description 1
- 230000002255 enzymatic effect Effects 0.000 description 1
- XHXYXYGSUXANME-UHFFFAOYSA-N eosin 5-isothiocyanate Chemical compound O1C(=O)C2=CC(N=C=S)=CC=C2C21C1=CC(Br)=C(O)C(Br)=C1OC1=C(Br)C(O)=C(Br)C=C21 XHXYXYGSUXANME-UHFFFAOYSA-N 0.000 description 1
- SEACYXSIPDVVMV-UHFFFAOYSA-L eosin Y Chemical compound [Na+].[Na+].[O-]C(=O)C1=CC=CC=C1C1=C2C=C(Br)C(=O)C(Br)=C2OC2=C(Br)C([O-])=C(Br)C=C21 SEACYXSIPDVVMV-UHFFFAOYSA-L 0.000 description 1
- 229940116977 epidermal growth factor Drugs 0.000 description 1
- 210000002919 epithelial cell Anatomy 0.000 description 1
- 210000000981 epithelium Anatomy 0.000 description 1
- 150000002118 epoxides Chemical class 0.000 description 1
- 229940011411 erythrosine Drugs 0.000 description 1
- 239000004174 erythrosine Substances 0.000 description 1
- 235000012732 erythrosine Nutrition 0.000 description 1
- 150000002148 esters Chemical class 0.000 description 1
- ZMMJGEGLRURXTF-UHFFFAOYSA-N ethidium bromide Chemical compound [Br-].C12=CC(N)=CC=C2C2=CC=C(N)C=C2[N+](CC)=C1C1=CC=CC=C1 ZMMJGEGLRURXTF-UHFFFAOYSA-N 0.000 description 1
- 229960005542 ethidium bromide Drugs 0.000 description 1
- IDAQSADEMXDTKN-UHFFFAOYSA-L ethyl green Chemical compound [Cl-].[Br-].C1=CC([N+](C)(C)CC)=CC=C1C(C=1C=CC(=CC=1)N(C)C)=C1C=CC(=[N+](C)C)C=C1 IDAQSADEMXDTKN-UHFFFAOYSA-L 0.000 description 1
- 239000000284 extract Substances 0.000 description 1
- 239000012530 fluid Substances 0.000 description 1
- ZFKJVJIDPQDDFY-UHFFFAOYSA-N fluorescamine Chemical class C12=CC=CC=C2C(=O)OC1(C1=O)OC=C1C1=CC=CC=C1 ZFKJVJIDPQDDFY-UHFFFAOYSA-N 0.000 description 1
- 238000001917 fluorescence detection Methods 0.000 description 1
- 238000002189 fluorescence spectrum Methods 0.000 description 1
- 239000011888 foil Substances 0.000 description 1
- 238000013467 fragmentation Methods 0.000 description 1
- 238000006062 fragmentation reaction Methods 0.000 description 1
- 229920000159 gelatin Polymers 0.000 description 1
- 239000008273 gelatin Substances 0.000 description 1
- 235000019322 gelatine Nutrition 0.000 description 1
- 235000011852 gelatine desserts Nutrition 0.000 description 1
- 210000005046 glial fibrillary acidic protein Anatomy 0.000 description 1
- 229940116332 glucose oxidase Drugs 0.000 description 1
- 235000019420 glucose oxidase Nutrition 0.000 description 1
- 238000010438 heat treatment Methods 0.000 description 1
- XLYOFNOQVPJJNP-ZSJDYOACSA-N heavy water Substances [2H]O[2H] XLYOFNOQVPJJNP-ZSJDYOACSA-N 0.000 description 1
- 210000002443 helper t lymphocyte Anatomy 0.000 description 1
- 210000003494 hepatocyte Anatomy 0.000 description 1
- 235000020256 human milk Nutrition 0.000 description 1
- 210000004251 human milk Anatomy 0.000 description 1
- 210000004754 hybrid cell Anatomy 0.000 description 1
- 238000009396 hybridization Methods 0.000 description 1
- 229910052739 hydrogen Inorganic materials 0.000 description 1
- 239000001257 hydrogen Substances 0.000 description 1
- 230000003301 hydrolyzing effect Effects 0.000 description 1
- 150000002463 imidates Chemical class 0.000 description 1
- 210000002861 immature t-cell Anatomy 0.000 description 1
- 230000003053 immunization Effects 0.000 description 1
- 238000002649 immunization Methods 0.000 description 1
- 229940099472 immunoglobulin a Drugs 0.000 description 1
- 229940027941 immunoglobulin g Drugs 0.000 description 1
- 238000013388 immunohistochemistry analysis Methods 0.000 description 1
- 238000000338 in vitro Methods 0.000 description 1
- 238000001727 in vivo Methods 0.000 description 1
- 230000002779 inactivation Effects 0.000 description 1
- 239000000411 inducer Substances 0.000 description 1
- 239000004615 ingredient Substances 0.000 description 1
- 230000002401 inhibitory effect Effects 0.000 description 1
- 210000005049 internexin Anatomy 0.000 description 1
- 230000000968 intestinal effect Effects 0.000 description 1
- 235000011073 invertase Nutrition 0.000 description 1
- 102000007236 involucrin Human genes 0.000 description 1
- 108010033564 involucrin Proteins 0.000 description 1
- 239000012948 isocyanate Substances 0.000 description 1
- 150000002513 isocyanates Chemical class 0.000 description 1
- 238000002372 labelling Methods 0.000 description 1
- 229940057428 lactoperoxidase Drugs 0.000 description 1
- 208000032839 leukemia Diseases 0.000 description 1
- 235000019421 lipase Nutrition 0.000 description 1
- 210000005229 liver cell Anatomy 0.000 description 1
- DLBFLQKQABVKGT-UHFFFAOYSA-L lucifer yellow dye Chemical compound [Li+].[Li+].[O-]S(=O)(=O)C1=CC(C(N(C(=O)NN)C2=O)=O)=C3C2=CC(S([O-])(=O)=O)=CC3=C1N DLBFLQKQABVKGT-UHFFFAOYSA-L 0.000 description 1
- 210000004698 lymphocyte Anatomy 0.000 description 1
- 210000003712 lysosome Anatomy 0.000 description 1
- 230000001868 lysosomic effect Effects 0.000 description 1
- 229960000274 lysozyme Drugs 0.000 description 1
- 239000004325 lysozyme Substances 0.000 description 1
- 108010053687 macrogolgin Proteins 0.000 description 1
- 229920002521 macromolecule Polymers 0.000 description 1
- 210000002540 macrophage Anatomy 0.000 description 1
- 229940107698 malachite green Drugs 0.000 description 1
- 208000015486 malignant pancreatic neoplasm Diseases 0.000 description 1
- 239000000463 material Substances 0.000 description 1
- 230000007246 mechanism Effects 0.000 description 1
- 210000003593 megakaryocyte Anatomy 0.000 description 1
- 239000007769 metal material Substances 0.000 description 1
- DWCZIOOZPIDHAB-UHFFFAOYSA-L methyl green Chemical compound [Cl-].[Cl-].C1=CC(N(C)C)=CC=C1C(C=1C=CC(=CC=1)[N+](C)(C)C)=C1C=CC(=[N+](C)C)C=C1 DWCZIOOZPIDHAB-UHFFFAOYSA-L 0.000 description 1
- 125000002496 methyl group Chemical group [H]C([H])([H])* 0.000 description 1
- CXKWCBBOMKCUKX-UHFFFAOYSA-M methylene blue Chemical compound [Cl-].C1=CC(N(C)C)=CC2=[S+]C3=CC(N(C)C)=CC=C3N=C21 CXKWCBBOMKCUKX-UHFFFAOYSA-M 0.000 description 1
- 229960000907 methylthioninium chloride Drugs 0.000 description 1
- 108010029942 microperoxidase Proteins 0.000 description 1
- 201000010478 microphthalmia Diseases 0.000 description 1
- 108010071421 milk fat globule Proteins 0.000 description 1
- 230000033607 mismatch repair Effects 0.000 description 1
- IKEOZQLIVHGQLJ-UHFFFAOYSA-M mitoTracker Red Chemical compound [Cl-].C1=CC(CCl)=CC=C1C(C1=CC=2CCCN3CCCC(C=23)=C1O1)=C2C1=C(CCC1)C3=[N+]1CCCC3=C2 IKEOZQLIVHGQLJ-UHFFFAOYSA-M 0.000 description 1
- 239000011259 mixed solution Substances 0.000 description 1
- 230000036457 multidrug resistance Effects 0.000 description 1
- 229940051921 muramidase Drugs 0.000 description 1
- 210000001087 myotubule Anatomy 0.000 description 1
- CTIQLGJVGNGFEW-UHFFFAOYSA-L naphthol yellow S Chemical compound [Na+].[Na+].C1=C(S([O-])(=O)=O)C=C2C([O-])=C([N+]([O-])=O)C=C([N+]([O-])=O)C2=C1 CTIQLGJVGNGFEW-UHFFFAOYSA-L 0.000 description 1
- 210000000944 nerve tissue Anatomy 0.000 description 1
- 108010091047 neurofilament protein H Proteins 0.000 description 1
- 210000004498 neuroglial cell Anatomy 0.000 description 1
- 230000007935 neutral effect Effects 0.000 description 1
- PGSADBUBUOPOJS-UHFFFAOYSA-N neutral red Chemical compound Cl.C1=C(C)C(N)=CC2=NC3=CC(N(C)C)=CC=C3N=C21 PGSADBUBUOPOJS-UHFFFAOYSA-N 0.000 description 1
- 210000000440 neutrophil Anatomy 0.000 description 1
- 229920001220 nitrocellulos Polymers 0.000 description 1
- 239000012038 nucleophile Substances 0.000 description 1
- 235000015097 nutrients Nutrition 0.000 description 1
- 229920001778 nylon Polymers 0.000 description 1
- 229960002378 oftasceine Drugs 0.000 description 1
- 108091008819 oncoproteins Proteins 0.000 description 1
- 102000027450 oncoproteins Human genes 0.000 description 1
- 230000008520 organization Effects 0.000 description 1
- 230000002611 ovarian Effects 0.000 description 1
- 229910052760 oxygen Inorganic materials 0.000 description 1
- 239000001301 oxygen Substances 0.000 description 1
- 210000000496 pancreas Anatomy 0.000 description 1
- 201000002528 pancreatic cancer Diseases 0.000 description 1
- 208000008443 pancreatic carcinoma Diseases 0.000 description 1
- 229920002866 paraformaldehyde Polymers 0.000 description 1
- AFAIELJLZYUNPW-UHFFFAOYSA-N pararosaniline free base Chemical compound C1=CC(N)=CC=C1C(C=1C=CC(N)=CC=1)=C1C=CC(=N)C=C1 AFAIELJLZYUNPW-UHFFFAOYSA-N 0.000 description 1
- 238000003359 percent control normalization Methods 0.000 description 1
- 210000005047 peripherin Anatomy 0.000 description 1
- ISWSIDIOOBJBQZ-UHFFFAOYSA-N phenol group Chemical group C1(=CC=CC=C1)O ISWSIDIOOBJBQZ-UHFFFAOYSA-N 0.000 description 1
- 229960003531 phenolsulfonphthalein Drugs 0.000 description 1
- 125000001997 phenyl group Chemical group [H]C1=C([H])C([H])=C(*)C([H])=C1[H] 0.000 description 1
- DHRLEVQXOMLTIM-UHFFFAOYSA-N phosphoric acid;trioxomolybdenum Chemical compound O=[Mo](=O)=O.O=[Mo](=O)=O.O=[Mo](=O)=O.O=[Mo](=O)=O.O=[Mo](=O)=O.O=[Mo](=O)=O.O=[Mo](=O)=O.O=[Mo](=O)=O.O=[Mo](=O)=O.O=[Mo](=O)=O.O=[Mo](=O)=O.O=[Mo](=O)=O.OP(O)(O)=O DHRLEVQXOMLTIM-UHFFFAOYSA-N 0.000 description 1
- ZWLUXSQADUDCSB-UHFFFAOYSA-N phthalaldehyde Chemical class O=CC1=CC=CC=C1C=O ZWLUXSQADUDCSB-UHFFFAOYSA-N 0.000 description 1
- 108060006184 phycobiliprotein Proteins 0.000 description 1
- INAAIJLSXJJHOZ-UHFFFAOYSA-N pibenzimol Chemical compound C1CN(C)CCN1C1=CC=C(N=C(N2)C=3C=C4NC(=NC4=CC=3)C=3C=CC(O)=CC=3)C2=C1 INAAIJLSXJJHOZ-UHFFFAOYSA-N 0.000 description 1
- OXNIZHLAWKMVMX-UHFFFAOYSA-N picric acid Chemical compound OC1=C([N+]([O-])=O)C=C([N+]([O-])=O)C=C1[N+]([O-])=O OXNIZHLAWKMVMX-UHFFFAOYSA-N 0.000 description 1
- 230000001817 pituitary effect Effects 0.000 description 1
- 108010031345 placental alkaline phosphatase Proteins 0.000 description 1
- 210000002381 plasma Anatomy 0.000 description 1
- 239000004033 plastic Substances 0.000 description 1
- 229920003023 plastic Polymers 0.000 description 1
- 229920000729 poly(L-lysine) polymer Polymers 0.000 description 1
- 229920000515 polycarbonate Polymers 0.000 description 1
- 239000004417 polycarbonate Substances 0.000 description 1
- 229920000642 polymer Polymers 0.000 description 1
- 239000000256 polyoxyethylene sorbitan monolaurate Substances 0.000 description 1
- 235000010486 polyoxyethylene sorbitan monolaurate Nutrition 0.000 description 1
- 229920001155 polypropylene Polymers 0.000 description 1
- 229920002223 polystyrene Polymers 0.000 description 1
- 239000003755 preservative agent Substances 0.000 description 1
- 102000004196 processed proteins & peptides Human genes 0.000 description 1
- 239000000047 product Substances 0.000 description 1
- 230000003623 progesteronic effect Effects 0.000 description 1
- XJMOSONTPMZWPB-UHFFFAOYSA-M propidium iodide Chemical compound [I-].[I-].C12=CC(N)=CC=C2C2=CC=C(N)C=C2[N+](CCC[N+](C)(CC)CC)=C1C1=CC=CC=C1 XJMOSONTPMZWPB-UHFFFAOYSA-M 0.000 description 1
- 108010043671 prostatic acid phosphatase Proteins 0.000 description 1
- 230000006916 protein interaction Effects 0.000 description 1
- AJMSJNPWXJCWOK-UHFFFAOYSA-N pyren-1-yl butanoate Chemical compound C1=C2C(OC(=O)CCC)=CC=C(C=C3)C2=C2C3=CC=CC2=C1 AJMSJNPWXJCWOK-UHFFFAOYSA-N 0.000 description 1
- INCIMLINXXICKS-UHFFFAOYSA-M pyronin Y Chemical compound [Cl-].C1=CC(=[N+](C)C)C=C2OC3=CC(N(C)C)=CC=C3C=C21 INCIMLINXXICKS-UHFFFAOYSA-M 0.000 description 1
- 238000011002 quantification Methods 0.000 description 1
- MYFATKRONKHHQL-UHFFFAOYSA-N rhodamine 123 Chemical compound [Cl-].COC(=O)C1=CC=CC=C1C1=C2C=CC(=[NH2+])C=C2OC2=CC(N)=CC=C21 MYFATKRONKHHQL-UHFFFAOYSA-N 0.000 description 1
- 229940043267 rhodamine b Drugs 0.000 description 1
- 235000019192 riboflavin Nutrition 0.000 description 1
- 239000002151 riboflavin Substances 0.000 description 1
- 229960002477 riboflavin Drugs 0.000 description 1
- 150000003839 salts Chemical class 0.000 description 1
- 239000012488 sample solution Substances 0.000 description 1
- 230000011218 segmentation Effects 0.000 description 1
- 229940076279 serotonin Drugs 0.000 description 1
- 125000005630 sialyl group Chemical group 0.000 description 1
- 229910000077 silane Inorganic materials 0.000 description 1
- 150000003384 small molecules Chemical class 0.000 description 1
- 229910052708 sodium Inorganic materials 0.000 description 1
- 239000011734 sodium Substances 0.000 description 1
- 238000001179 sorption measurement Methods 0.000 description 1
- 241000894007 species Species 0.000 description 1
- 230000003595 spectral effect Effects 0.000 description 1
- 238000009987 spinning Methods 0.000 description 1
- 210000000130 stem cell Anatomy 0.000 description 1
- COIVODZMVVUETJ-UHFFFAOYSA-N sulforhodamine 101 Chemical compound OS(=O)(=O)C1=CC(S([O-])(=O)=O)=CC=C1C1=C(C=C2C3=C4CCCN3CCC2)C4=[O+]C2=C1C=C1CCCN3CCCC2=C13 COIVODZMVVUETJ-UHFFFAOYSA-N 0.000 description 1
- YBBRCQOCSYXUOC-UHFFFAOYSA-N sulfuryl dichloride Chemical class ClS(Cl)(=O)=O YBBRCQOCSYXUOC-UHFFFAOYSA-N 0.000 description 1
- 238000003786 synthesis reaction Methods 0.000 description 1
- 102000013498 tau Proteins Human genes 0.000 description 1
- 108010026424 tau Proteins Proteins 0.000 description 1
- 108010013645 tetranectin Proteins 0.000 description 1
- 150000003568 thioethers Chemical class 0.000 description 1
- 125000003396 thiol group Chemical group [H]S* 0.000 description 1
- 108060008226 thioredoxin Proteins 0.000 description 1
- 229940094937 thioredoxin Drugs 0.000 description 1
- 102000004217 thyroid hormone receptors Human genes 0.000 description 1
- 108090000721 thyroid hormone receptors Proteins 0.000 description 1
- 229950003937 tolonium Drugs 0.000 description 1
- HNONEKILPDHFOL-UHFFFAOYSA-M tolonium chloride Chemical compound [Cl-].C1=C(C)C(N)=CC2=[S+]C3=CC(N(C)C)=CC=C3N=C21 HNONEKILPDHFOL-UHFFFAOYSA-M 0.000 description 1
- 239000003053 toxin Substances 0.000 description 1
- 231100000765 toxin Toxicity 0.000 description 1
- 229910052723 transition metal Inorganic materials 0.000 description 1
- 150000003624 transition metals Chemical class 0.000 description 1
- 239000003656 tris buffered saline Substances 0.000 description 1
- GPRLSGONYQIRFK-MNYXATJNSA-N triton Chemical compound [3H+] GPRLSGONYQIRFK-MNYXATJNSA-N 0.000 description 1
- 108010014402 tyrosinase-related protein-1 Proteins 0.000 description 1
- OUYCCCASQSFEME-UHFFFAOYSA-N tyrosine Natural products OC(=O)C(N)CC1=CC=C(O)C=C1 OUYCCCASQSFEME-UHFFFAOYSA-N 0.000 description 1
- 238000002371 ultraviolet--visible spectrum Methods 0.000 description 1
- ORHBXUUXSCNDEV-UHFFFAOYSA-N umbelliferone Chemical compound C1=CC(=O)OC2=CC(O)=CC=C21 ORHBXUUXSCNDEV-UHFFFAOYSA-N 0.000 description 1
- HFTAFOQKODTIJY-UHFFFAOYSA-N umbelliferone Natural products Cc1cc2C=CC(=O)Oc2cc1OCC=CC(C)(C)O HFTAFOQKODTIJY-UHFFFAOYSA-N 0.000 description 1
- VBEQCZHXXJYVRD-GACYYNSASA-N uroanthelone Chemical compound C([C@@H](C(=O)N[C@H](C(=O)N[C@@H](CS)C(=O)N[C@@H](CC(N)=O)C(=O)N[C@@H](CS)C(=O)N[C@H](C(=O)N[C@@H]([C@@H](C)CC)C(=O)NCC(=O)N[C@@H](CC=1C=CC(O)=CC=1)C(=O)N[C@@H](CO)C(=O)NCC(=O)N[C@@H](CC(O)=O)C(=O)N[C@@H](CCCNC(N)=N)C(=O)N[C@@H](CS)C(=O)N[C@@H](CCC(N)=O)C(=O)N[C@@H]([C@@H](C)O)C(=O)N[C@@H](CCCNC(N)=N)C(=O)N[C@@H](CC(O)=O)C(=O)N[C@@H](CC(C)C)C(=O)N[C@@H](CCCNC(N)=N)C(=O)N[C@@H](CC=1C2=CC=CC=C2NC=1)C(=O)N[C@@H](CC=1C2=CC=CC=C2NC=1)C(=O)N[C@@H](CCC(O)=O)C(=O)N[C@@H](CC(C)C)C(=O)N[C@@H](CCCNC(N)=N)C(O)=O)C(C)C)[C@@H](C)O)NC(=O)[C@H](CO)NC(=O)[C@H](CC(O)=O)NC(=O)[C@H](CC(C)C)NC(=O)[C@H](CO)NC(=O)[C@H](CCC(O)=O)NC(=O)[C@@H](NC(=O)[C@H](CC=1NC=NC=1)NC(=O)[C@H](CCSC)NC(=O)[C@H](CS)NC(=O)[C@@H](NC(=O)CNC(=O)CNC(=O)[C@H](CC(N)=O)NC(=O)[C@H](CC(C)C)NC(=O)[C@H](CS)NC(=O)[C@H](CC=1C=CC(O)=CC=1)NC(=O)CNC(=O)[C@H](CC(O)=O)NC(=O)[C@H](CC=1C=CC(O)=CC=1)NC(=O)[C@H](CO)NC(=O)[C@H](CO)NC(=O)[C@H]1N(CCC1)C(=O)[C@H](CS)NC(=O)CNC(=O)[C@H]1N(CCC1)C(=O)[C@H](CC=1C=CC(O)=CC=1)NC(=O)[C@H](CO)NC(=O)[C@@H](N)CC(N)=O)C(C)C)[C@@H](C)CC)C1=CC=C(O)C=C1 VBEQCZHXXJYVRD-GACYYNSASA-N 0.000 description 1
- 108090000195 villin Proteins 0.000 description 1
- 210000005048 vimentin Anatomy 0.000 description 1
- 238000011179 visual inspection Methods 0.000 description 1
- 239000008096 xylene Substances 0.000 description 1
- 150000003738 xylenes Chemical class 0.000 description 1
Images
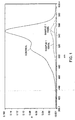
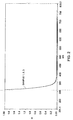
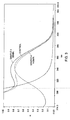
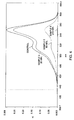
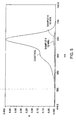

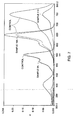
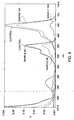
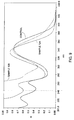
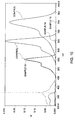
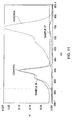

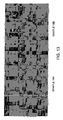


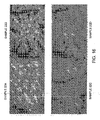
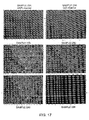

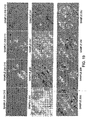
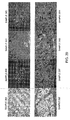
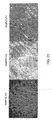
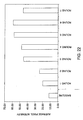

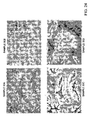

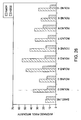

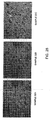
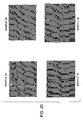
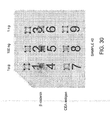

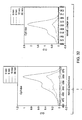

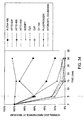
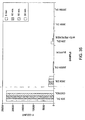

Classifications
-
- G—PHYSICS
- G01—MEASURING; TESTING
- G01N—INVESTIGATING OR ANALYSING MATERIALS BY DETERMINING THEIR CHEMICAL OR PHYSICAL PROPERTIES
- G01N33/00—Investigating or analysing materials by specific methods not covered by groups G01N1/00 - G01N31/00
- G01N33/48—Biological material, e.g. blood, urine; Haemocytometers
- G01N33/50—Chemical analysis of biological material, e.g. blood, urine; Testing involving biospecific ligand binding methods; Immunological testing
- G01N33/58—Chemical analysis of biological material, e.g. blood, urine; Testing involving biospecific ligand binding methods; Immunological testing involving labelled substances
- G01N33/582—Chemical analysis of biological material, e.g. blood, urine; Testing involving biospecific ligand binding methods; Immunological testing involving labelled substances with fluorescent label
-
- C—CHEMISTRY; METALLURGY
- C12—BIOCHEMISTRY; BEER; SPIRITS; WINE; VINEGAR; MICROBIOLOGY; ENZYMOLOGY; MUTATION OR GENETIC ENGINEERING
- C12Q—MEASURING OR TESTING PROCESSES INVOLVING ENZYMES, NUCLEIC ACIDS OR MICROORGANISMS; COMPOSITIONS OR TEST PAPERS THEREFOR; PROCESSES OF PREPARING SUCH COMPOSITIONS; CONDITION-RESPONSIVE CONTROL IN MICROBIOLOGICAL OR ENZYMOLOGICAL PROCESSES
- C12Q1/00—Measuring or testing processes involving enzymes, nucleic acids or microorganisms; Compositions therefor; Processes of preparing such compositions
- C12Q1/68—Measuring or testing processes involving enzymes, nucleic acids or microorganisms; Compositions therefor; Processes of preparing such compositions involving nucleic acids
- C12Q1/6813—Hybridisation assays
- C12Q1/6816—Hybridisation assays characterised by the detection means
-
- G—PHYSICS
- G01—MEASURING; TESTING
- G01N—INVESTIGATING OR ANALYSING MATERIALS BY DETERMINING THEIR CHEMICAL OR PHYSICAL PROPERTIES
- G01N33/00—Investigating or analysing materials by specific methods not covered by groups G01N1/00 - G01N31/00
- G01N33/48—Biological material, e.g. blood, urine; Haemocytometers
- G01N33/50—Chemical analysis of biological material, e.g. blood, urine; Testing involving biospecific ligand binding methods; Immunological testing
- G01N33/53—Immunoassay; Biospecific binding assay; Materials therefor
- G01N33/536—Immunoassay; Biospecific binding assay; Materials therefor with immune complex formed in liquid phase
- G01N33/542—Immunoassay; Biospecific binding assay; Materials therefor with immune complex formed in liquid phase with steric inhibition or signal modification, e.g. fluorescent quenching
Definitions
- Disclosed herein are methods for sequentially analyzing a biological sample to discern inter alia the presence, absence, concentration, and/or spatial distribution of multiple biological targets in a biological sample.
- analysis of proteins in histological sections and other cytological preparations may be performed using the techniques of histochemistry, immunohistochemistry (IHC), or immunofluorescence. Analysis of proteins in biological samples may also be performed using solid-state immunoassays, for example, using the techniques of western blots.
- targets may detect only a few targets at one time (such as, IHC or fluorescence-based western blots where number of targets detectable is limited by the fluorescence-based detection system) in a single sample. Further analysis of targets may require use of additional biological samples from the source limiting the ability to determine relative characteristics of the targets such as the presence, absence, concentration, and/or the spatial distribution of multiple biological targets in the biological sample. Moreover, in certain instances, a limited amount of sample may be available for analysis or the individual sample may require further analysis. Thus, methods, agents, and devices capable of iteratively analyzing an individual sample are needed.
- US 2003/073149 A1 discloses immunolabeling compositions and methods for use in the detection and measurement of one or more targets in a biological sample.
- WO 02/079771 A1 discloses a method for removing transition metal stains from biological samples including protein, DNA, and RNA.
- WO 00/20641 discloses a method comprising combining morphological staining and/or immunohistochemistry with fluorescence in situ hybridization (FISH) within the same section of a tissue sample.
- FISH fluorescence in situ hybridization
- the present invention provides a method of probing multiple targets in a biological sample comprising a tissue section, the method comprising:
- the term "antibody” refers to an immunoglobulin that specifically binds to and is thereby defined as complementary with a particular spatial and polar organization of another molecule.
- the antibody may be monoclonal or polyclonal and may be prepared by techniques that are well known in the art such as immunization of a host and collection of sera (polyclonal), or by preparing continuous hybrid cell lines and collecting the secreted protein (monoclonal), or by cloning and expressing nucleotide sequences or mutagenized versions thereof, coding at least for the amino acid sequences required for specific binding of natural antibodies.
- Antibodies may include a complete immunoglobulin or fragment thereof, which immunoglobulins include the various classes and isotypes, such as IgA, IgD, IgE, IgG1, IgG2a, IgG2b and IgG3, IgM.
- Functional antibody fragments may include portions of an antibody capable of retaining binding at similar affinity to full-length antibody (for example, Fab, Fv and F(ab') 2 , or Fab').
- aggregates, polymers, and conjugates of immunoglobulins or their fragments may be used where appropriate so long as binding affinity for a particular molecule is substantially maintained.
- binder refers to a molecule that may bind to one or more targets in the biological sample.
- a binder may specifically bind to a target.
- Suitable binders may include one or more of natural or modified peptides, proteins (e.g., antibodies, affibodies, or aptamers), nucleic acids (e.g., polynucleotides, DNA, RNA, or aptamers); polysaccharides (e.g., lectins, sugars), lipids, enzymes, enzyme substrates or inhibitors, ligands, receptors, antigens, or haptens.
- a suitable binder may be selected depending on the sample to be analyzed and the targets available for detection.
- a target in the sample may include a ligand and the binder may include a receptor or a target may include a receptor and the binder may include a ligand.
- a target may include an antigen and the binder may include an antibody or antibody fragment or vice versa.
- a target may include a nucleic acid and the binder may include a complementary nucleic acid.
- both the target and the binder may include proteins capable of binding to each other.
- biological sample refers to a sample obtained from a biological subject, including sample of biological tissue or fluid origin obtained in vivo or in vitro. Such samples can be, but are not limited to, body fluid (e.g., blood, blood plasma, serum, or urine), organs, tissues, fractions, and cells isolated from mammals including, humans. Biological samples also may include sections of the biological sample including tissues (e.g., sectional portions of an organ or tissue). Biological samples may also include extracts from a biological sample, for example, an antigen from a biological fluid (e.g., blood or urine).
- a biological sample may be of prokaryotic origin or eukaryotic origin (e.g., insects, protozoa, birds, fish, reptiles).
- the biological sample is mammalian (e.g., rat, mouse, cow, dog, donkey, guinea pig, or rabbit).
- the biological sample is of primate origin (e.g., example, chimpanzee, or human).
- control probe refers to an agent having a binder coupled to a signal generator or a signal generator capable of staining directly, such that the signal generator retains at least 80 percent signal after contact with a solution of an oxidizing agent employed to inactivate the fluorescent probe.
- a suitable signal generator in a control probe is not substantially oxidized or substantially inactivated when contacted with the oxidizing agent.
- Suitable examples of signal generators may include a radioactive label or a non-oxidizable fluorophore (e.g., DAPI)
- the term "enzyme” refers to a protein molecule that can catalyze a chemical reaction of a substrate.
- a suitable enzyme catalyzes a chemical reaction of the substrate to form a reaction product that can bind to a receptor (e.g., phenolic groups) present in the sample or a solid support to which the sample is bound.
- a receptor may be exogeneous (that is, a receptor extrinsically adhered to the sample or the solid-support) or endogeneous (receptors present intrinsically in the sample or the solid-support).
- suitable enzymes include peroxidases, oxidases, phosphatases, esterases, and glycosidases. Specific examples of suitable enzymes include horseradish peroxidase, alkaline phosphatase, -D-galactosidase, lipase, and glucose oxidase.
- enzyme substrate refers to a chemical compound that is chemically catalyzed by an enzyme to form a reaction product.
- the reaction product is capable of binding to a receptor present in the sample or a solid support to which the sample is bound.
- enzyme substrates employed in the methods herein may include non-chromogenic or non-chemiluminescent substrates.
- a signal generator may be attached to the enzyme substrate as a label.
- fluorophore or “fluorescent signal generator” refers to a chemical compound, which when excited by exposure to a particular wavelength of light, emits light at a different wavelength. Fluorophores may be described in terms of their emission profile, or "color.” Green fluorophores (for example Cy3, FITC, and Oregon Green) may be characterized by their emission at wavelengths generally in the range of 515-540 nanometers. Red fluorophores (for example Texas Red, Cy5, and tetramethylrhodamine) may be characterized by their emission at wavelengths generally in the range of 590-690 nanometers.
- fluorophores examples include, but are not limited to, 4-acetamido-4'-isothiocyanatostilbene-2,2'disulfonic acid, acridine, derivatives of acridine and acridine isothiocyanate, 5-(2'-aminoethyl)aminonaphthalene-1-sulfonic acid (EDANS), 4-amino-N-[3-vinylsulfonyl)phenyl]naphthalimide-3,5 disulfonate (Lucifer Yellow VS), N-(4-anilino-1-naphthyl)maleimide, anthranilamide, Brilliant Yellow, coumarin, coumarin derivatives, 7-amino-4-methylcoumarin (AMC, Coumarin 120), 7-amino-trifluoromethylcouluarin (Coumaran 151), cyanosine; 4',6-diaminidino-2-phenylindole (
- rhodamine and derivatives such as 6-carboxy-X-rhodamine (ROX), 6-carboxyrhodamine (R6G), lissamine rhodamine B sulfonyl chloride, rhodamine (Rhod), rhodamine B, rhodamine 123, rhodamine X isothiocyanate, sulforhodamine B, sulforhodamine 101 and sulfonyl chloride derivative of sulforhodamine 101 (Texas Red); N,N,N',N'-tetramethyl-6-carboxyrhodamine (TAMRA); tetramethyl Rhodamine, tetramethyl rhodamine isothiocyanate (TRITC); riboflavin; rosolic acid and lathanide chelate derivatives, quantum dots, cyanines, pyrelium dyes
- in situ generally refers to an event occurring in the original location, for example, in intact organ or tissue or in a representative segment of an organ or tissue.
- in situ analysis of targets may be performed on cells derived from a variety of sources, including an organism, an organ, tissue sample, or a cell culture. In situ analysis provides contextual information that may be lost when the target is removed from its site of origin. Accordingly, in situ analysis of targets describes analysis of target-bound probe located within a whole cell or a tissue sample, whether the cell membrane is fully intact or partially intact where target-bound probe remains within the cell. Furthermore, the methods disclosed herein may be employed to analyze targets in situ in cell or tissue samples that are fixed or unfixed.
- peroxidase refers to an enzyme class that catalyzes an oxidation reaction of an enzyme substrate along with an electron donor
- peroxidase enzymes include horseradish peroxidase, cytochrome C peroxidase, glutathione peroxidase, microperoxidase, myeloperoxidase, lactoperoxidase, or soybean peroxidase.
- peroxidase substrate refers to a chemical compound that is chemically catalyzed by peroxidase to form a reaction product.
- peroxidase substrates employed in the methods herein may include non-chromogenic or non-chemiluminescent substrates.
- a fluorescent signal generator may be attached to the peroxidase substrate as a label.
- the term "probe” refers to an agent having a binder and a label, such as a signal generator or an enzyme.
- the binder and the label are embodied in a single entity.
- the binder and the label may be attached directly (e.g., via a fluorescent molecule incorporated into the binder) or indirectly (e.g., through a linker, which may include a cleavage site) and applied to the biological sample in a single step.
- the binder and the label are embodied in discrete entities (e.g., a primary antibody capable of binding a target and an enzyme or a signal generator-labeled secondary antibody capable of binding the primary antibody).
- fluorescent probe refers to an agent having a binder coupled to a fluorescent signal generator.
- the term "signal generator” refers to a molecule capable of providing a detectable signal using one or more detection techniques (e.g., spectrometry, calorimetry, spectroscopy, or visual inspection). Suitable examples of a detectable signal may include an optical signal, and electrical signal, or a radioactive signal. Examples of signal generators include one or more of a chromophore, a fluorophore, a Raman-active tag, or a radioactive label. As stated above, with regard to the probe, the signal generator and the binder may be present in a single entity (e.g., a target binding protein with a fluorescent label) in some embodiments. Alternatively, the binder and the signal generator may be discrete entities (e.g., a receptor protein and a labeled-antibody against that particular receptor protein) that associate with each other before or upon introduction to the sample.
- detection techniques e.g., spectrometry, calorimetry, spectroscopy, or visual inspection.
- solid support refers to an article on which targets present in the biological sample may be immobilized and subsequently detected by the methods disclosed herein. Targets may be immobilized on the solid support by physical adsorption, by covalent bond formation, or by combinations thereof.
- a solid support may include a polymeric, a glass, or a metallic material. Examples of solid supports include a membrane, a microtiter plate, a bead, a filter, a test strip, a slide, a cover slip, and a test tube.
- a binder molecule may have an intrinsic equilibrium association constant (KA) for the target no lower than about 10 5 M -1 under ambient conditions such as a pH of about 6 to about 8 and temperature ranging from about 0°C to about 37°C.
- KA intrinsic equilibrium association constant
- the term "target,” refers to the component of a biological sample that may be detected when present in the biological sample.
- the target may be any substance for which there exists a naturally occurring specific binder (e.g., an antibody), or for which a specific binder may be prepared (e.g., a small molecule binder or an aptamer).
- a binder may bind to a target through one or more discrete chemical moieties of the target or a three-dimensional structural component of the target (e.g., 3D structures resulting from peptide folding).
- the target may include one or more of natural or modified peptides, proteins (e.g., antibodies, affibodies, or aptamers), nucleic acids (e.g., polynucleotides, DNA, RNA, or aptamers); polysaccharides (e.g., lectins or sugars), lipids, enzymes, enzyme substrates, ligands, receptors, antigens, or haptens.
- proteins e.g., antibodies, affibodies, or aptamers
- nucleic acids e.g., polynucleotides, DNA, RNA, or aptamers
- polysaccharides e.g., lectins or sugars
- targets may include proteins or nucleic acids.
- the invention includes embodiments that relate generally to methods applicable in analytical, diagnostic, or prognostic applications such as analyte detection, histochemistry, immunohistochemistry, or immunofluorescence.
- the methods disclosed herein may be particularly applicable in histochemistry, immunostaining, immunohistochemistry, immunoassays, or immunofluorescence.
- the disclosed methods relate generally to detection of multiple targets in a single biological sample.
- methods of detecting multiple targets in a single biological sample using the same detection channel are disclosed.
- the targets may be present on the surface of histological sections, or on the surface of solid supports (such as glass slides).
- the methods disclosed herein may allow detection of a plurality of targets in the same biological sample with little or no effect on the integrity of the biological sample. Detecting the targets in the same biological sample may further provide spatial information about the targets in the biological sample. Methods disclosed herein may also be applicable in analytical applications where a limited amount of biological sample may be available for analysis and the same sample may have to be processed for multiple analyses. Methods disclosed herein may also facilitate multiple analyses of solid-state samples (e.g., tissue sections) or samples adhered to a solid support (e.g., blots) without substantially stripping the probes and the targets. Furthermore, the same detection channel may be employed for detection of different targets in the sample, enabling fewer chemistry requirements for analyses of multiple targets.
- solid-state samples e.g., tissue sections
- a solid support e.g., blots
- the methods may further facilitate analyses based on detection methods that may be limited in the number of simultaneously detectable targets because of limitations of resolvable signals. For example, using fluorescent-based detection, the number of targets that may be simultaneously detected may be limited to about four as only about four fluorescent signals may be resolvable based on their excitation and emission wavelength properties. In some embodiments, the methods disclosed herein may allow detection of greater than four targets using fluorescent-based detection system.
- the method of detecting multiple targets in a biological sample includes sequential detection of targets in the biological sample.
- the method generally includes the steps of detecting a first target in the biological sample, modifying the signal from the first target using a chemical agent comprising an oxidizing agent, and detecting a second target in the biological sample.
- the method may further include repeating the step of modification of signal from the second target followed by detecting a third target in the biological sample, and so forth.
- the method includes the steps of contacting a biological sample with a first antibody probe and physically binding a first antibody probe to a first target.
- the method further includes observing a first signal from the first probe.
- An oxidizing agent is applied to the probe to modify the first signal.
- the method further includes contacting the biological sample with a second antibody probe and physically binding the second antibody probe to a second target in the biological sample followed by observing a second signal from the second probe.
- the method includes the steps of providing a biological sample containing multiple targets adhered to a solid support and binding at least one fluorescent probe to one or more target present in the sample.
- the method further includes observing a signal from the bound fluorescent probe.
- the bound fluorescent probe is oxidized with an oxidizing agent that substantially inactivates the fluorescent probe.
- the method further includes binding at least one subsequent fluorescent probe to one or more target present in the sample followed by observing a signal from the subsequent bound fluorescent probe.
- the method includes the steps of providing a biological sample containing multiple targets adhered to a solid support and binding at least one fluorescent antibody probe to one or more target present in the sample.
- the method further includes binding at least one control probe to one or more target in the sample.
- the method further includes observing a signal from the bound fluorescent antibody probe and a control signal from the control probe.
- the bound fluorescent probe is oxidized with an oxidizing agent that substantially inactivates the fluorescent probe and not the control probe.
- the method further includes binding at least one subsequent fluorescent probe to one or more target present in the sample followed by observing a signal from the subsequent bound fluorescent probe.
- a biological sample in accordance with one embodiment of the invention may be solid. Suitable examples of biological samples include solid tissue sections.
- the biological sample may be analyzed as is, that is, without harvest and/or isolation of the target of interest. In an alternate embodiment, harvest and isolation of targets may be performed prior to analysis.
- the methods disclosed herein may be particularly suitable for invitro analysis of biological samples.
- a biological sample may include any of the aforementioned samples regardless of their physical condition, such as, but not limited to, being frozen or stained or otherwise treated.
- a biological sample may include compounds which are not naturally intermixed with the sample in nature such as preservatives, anticoagulants, buffers, fixatives, nutrients, antibiotics, or the like.
- the biological sample includes a tissue sample.
- a biological sample essentially includes a tissue sample.
- a tissue sample may include a collection of similar cells obtained from a tissue of a biological subject that may have a similar function.
- a tissue sample may include a collection of similar cells obtained from a tissue of a human.
- Suitable examples of human tissues include, but are not limited to, (1) epithelium; (2) the connective tissues, including blood vessels, bone and cartilage; (3) muscle tissue; and (4) nerve tissue.
- the source of the tissue sample may be solid tissue obtained from a fresh, frozen and/or preserved organ or tissue sample or biopsy.
- a biological sample includes tissue sections from healthy or diseases tissue samples (e.g., tissue section from colon, breast tissue, prostate).
- a tissue section may include a single part or piece of a tissue sample, for example, a thin slice of tissue or cells cut from a tissue sample.
- multiple sections of tissue samples may be taken and subjected to analysis, provided the methods disclosed herein may be used for analysis of the same section of the tissue sample with respect to at least two different targets (at morphological or molecular level).
- the same section of tissue sample may be analyzed with respect to at least four different targets (at morphological or molecular level).
- the same section of tissue sample may be analyzed with respect to greater than four different targets (at morphological or molecular level).
- the same section of tissue sample may be analyzed at both morphological and molecular levels.
- a tissue section, if employed as a biological sample may have a thickness in a range that is less than about 100 micrometers, in a range that is less than about 50 micrometers, in a range that is less than about 25 micrometers, or in range that is less than about 10 micrometers.
- a biological sample or the targets in the biological sample may be adhered to a solid support.
- a solid support may include microarrays, glass slides or ELISA plates.
- a biological sample or the targets in the biological sample may be adhered to a membrane selected from nylon, nitrocellulose, and polyvinylidene difluoride.
- the solid support may include a plastic surface selected from polystyrene, polycarbonate, and polypropylene.
- a target may be present on the surface of a biological sample (for example, an antigen on a surface of a tissue section).
- a target may not be inherently present on the surface of a biological sample and the biological sample may have to be processed to make the target available on the surface (e.g., antigen recovery, enzymatic digestion, epitope retrieval, or blocking).
- the target may be fixed in a tissue, either on a cell surface, or within a cell.
- a target may provide information about the presence or absence of an analyte in the biological sample.
- a target may provide information on a state of a biological sample. For example, if the biological sample includes a tissue sample, the methods disclosed herein may be used to detect targets that may help in comparing different types of cells or tissues, comparing different developmental stages, detecting the presence of a disease or abnormality, or determining the type of disease or abnormality.
- Targets may include one or more of peptides, proteins (e.g., antibodies, affibodies, or aptamers), nucleic acids (e.g., polynucleotides, DNA, RNA, or aptamers); polysaccharides (e.g., lectins or sugars), lipids, enzymes, enzyme substrates, ligands, receptors, antigens, or haptens.
- targets may essentially include proteins or nucleic acids.
- One or more of the aforementioned targets may be characteristic of particular cells, while other targets may be associated with a particular disease or condition.
- targets that may be detected and analyzed using the methods disclosed herein may include, but are not limited to, prognostic targets, hormone or hormone receptor targets, lymphoid targets, tumor targets, cell cycle associated targets, neural tissue and tumor targets, or cluster differentiation targets
- prognostic targets may include enzymatic targets such as galactosyl transferase II, neuron specific enolase, proton ATPase-2, or acid phosphatase.
- hormone or hormone receptor targets may include human chorionic gonadotropin (HCG), adrenocorticotropic hormone, carcinoembryonic antigen (CEA), prostate-specific antigen (PSA), estrogen receptor, progesterone receptor, androgen receptor, gC1q-R/p33 complement receptor, IL-2 receptor, p75 neurotrophin receptor, PTH receptor, thyroid hormone receptor, or insulin receptor.
- HCG human chorionic gonadotropin
- CEA carcinoembryonic antigen
- PSA prostate-specific antigen
- estrogen receptor progesterone receptor
- androgen receptor gC1q-R/p33 complement receptor
- IL-2 receptor p75 neurotrophin receptor
- PTH receptor thyroid hormone receptor
- insulin receptor insulin receptor
- lymphoid targets may include alpha-1-antichymotrypsin, alpha-1-antitrypsin, B cell target, bcl-2, bcl-6, B lymphocyte antigen 36 kD, BM1 (myeloid target), BM2 (myeloid target), galectin-3, granzyme B, HLA class I Antigen, HLA class II (DP) antigen, HLA class II (DQ) antigen, HLA class II (DR) antigen, human neutrophil defensins, immunoglobulin A, immunoglobulin D, immunoglobulin G, immunoglobulin M, kappa light chain, kappa light chain, lambda light chain, lymphocyte/histocyte antigen, macrophage target, muramidase (lysozyme), p80 anaplastic lymphoma kinase, plasma cell target, secretory leukocyte protease inhibitor, T cell antigen receptor (JOVI 1), T cell antigen receptor (JOVI), T
- tumour targets may include alpha fetoprotein, apolipoprotein D, BAG-1 (RAP46 protein), CA19-9 (sialyl lewisa), CA50 (carcinoma associated mucin antigen), CA125 (ovarian cancer antigen), CA242 (tumour associated mucin antigen), chromogranin A, clusterin (apolipoprotein J), epithelial membrane antigen, epithelial-related antigen, epithelial specific antigen, gross cystic disease fluid protein-15, hepatocyte specific antigen, heregulin, human gastric mucin, human milk fat globule, MAGE-1, matrix metalloproteinases, melan A, melanoma target (HMB45), mesothelin, metallothionein, microphthalmia transcription factor (MITF), Muc-1 core glycoprotein.
- RAP46 protein RAP46 protein
- CA19-9 sialyl lewisa
- CA50 carcinoma associated mucin antigen
- cell cycle associated targets may include apoptosis protease activating factor-1, bcl-w , bcl-x, bromodeoxyuridine, CAK (cdk-activating kinase), cellular apoptosis susceptibility protein (CAS), caspase 2, caspase 8, CPP32 (caspase-3), CPP32 (caspase-3), cyclin dependent kinases, cyclin A, cyclin B1, cyclin D1, cyclin D2, cyclin D3, cyclin E, cyclin G, DNA fragmentation factor (N-terminus), Fas (CD95), Fas-associated death domain protein, Fas ligand, Fen-1, IPO-38, Mcl-1, minichromosome maintenance proteins, mismatch repair protein (MSH2), poly (ADP-Ribose) polymerase, proliferating cell nuclear antigen, p16 protein, p27 protein, p34cdc2, p57 protein (Kip
- Suitable examples of neural tissue and tumor targets may include alpha B crystallin, alpha-internexin, alpha synuclein, amyloid precursor protein, beta amyloid, calbindin, choline acetyltransferase, excitatory amino acid transporter 1, GAP43, glial fibrillary acidic protein, glutamate receptor 2, myelin basic protein, nerve growth factor receptor (gp75), neuroblastoma target, neurofilament 68 kD, neurofilament 160 kD, neurofilament 200 kD, neuron specific enolase, nicotinic acetylcholine receptor alpha4, nicotinic acetylcholine receptor beta2, peripherin, protein gene product 9, S-100 protein, serotonin, SNAP-25, synapsin I, synaptophysin, tau, tryptophan hydroxylase, tyrosine hydroxylase, or ubiquitin.
- Suitable examples of cluster differentiation targets may include CD1a, CD1b, CD1 c, CD1d, CD1e, CD2, CD3delta, CD3epsilon, CD3gamma, CD4, CD5, CD6, CD7, CD8alpha, CD8beta, CD9, CD10, CD11a, CD11b, CD11c, CDw12, CD13, CD14, Cod15, CD15s, CD16a, CD16b, CDw17, CD18, CD19, CD20, CD21, CD22, CD23, CD24, CD25, CD26, CD27, CD28, CD29, CD30, CD31, CD32, CD33, CD34, CD35, CD36, CD37, CD38, CD39, CD40, CD41, CD42a, CD42b, CD42c, CD42d, CD43, CD44, CD44R, CD45, CD46, CD47, CD48, CD49a, CD49b, CD49c, CD49d, CD49e, CD49f, CD50
- Suitable prognostic targets may include centromere protein-F (CENP-F), giantin, involucrin, lamin A&C (XB 10), LAP-70, mucin, nuclear pore complex proteins, p180 lamellar body protein, ran, r, cathepsin D, Ps2 protein, Her2-neu, P53, S100, epithelial target antigen (EMA), TdT, MB2, MB3, PCNA, or Ki67.
- CENP-F centromere protein-F
- giantin giantin
- involucrin lamin A&C (XB 10)
- LAP-70 LAP-70
- mucin mucin
- nuclear pore complex proteins p180 lamellar body protein, ran, r, cathepsin D
- Ps2 protein Her2-neu, P53, S100
- EMA epithelial target antigen
- TdT MB2, MB3, PCNA, or Ki67.
- a binder (antibody) and a label (signal generator which is a fluorescent probe) may be coupled to each other directly (that is without any linkers).
- a binder and a label may be coupled to each other via a linker.
- “coupled” generally refers to two entities (for example, binder and signal generator) stably bound to one another by any physicochemical means. The nature of the coupling may be such that it does not substantially impair the effectiveness of either entity.
- a binder and a label may be coupled to each other through covalent or non-covalent interactions.
- Non-covalent interactions may include, but are not limited to, hydrophobic interactions, ionic interactions, hydrogen-bond interactions, high affinity interactions (such as, biotin-avidin or biotin-streptavidin complexation), or other affinity interactions.
- a linker may include a form of linking structure or sequence formed due to the non-covalent or covalent bond formation.
- the linker may be chemically stable, that is, may maintain its integrity in the presence of a chemical agent.
- the linker may be susceptible to chemical agents that is may be capable of dissociating, cleaving, or hydrolyzing in the presence of a chemical agent.
- linkers may include disulfide bonds (e.g., SPDP or SMPT), pH sensitive structures/sequences, structures/sequences that may be reduced in the presence of an reducing agent, structures/sequences that may be oxidized in the presence of an oxidizing agent, or any other chemical or physical bond that may be easily manipulated (dissociated, cleaved, or hydrolyzed) in the presence of a chemical agent.
- disulfide bonds e.g., SPDP or SMPT
- pH sensitive structures/sequences e.g., pH sensitive structures/sequences
- structures/sequences that may be reduced in the presence of an reducing agent structures/sequences that may be oxidized in the presence of an oxidizing agent
- any other chemical or physical bond that may be easily manipulated (dissociated, cleaved, or hydrolyzed) in the presence of a chemical agent.
- a binder and a label may be chemically linked to each other through functional groups capable of reacting and forming a linkage under suitable conditions.
- Suitable examples of functional group combinations may include, but are not limited to, amine ester and amines or anilines; acyl azide and amines or anilines; acyl halides and amines, anilines, alcohols, or phenols; acyl nitrile and alcohols or phenols; aldehyde and amines or anilines; alkyl halide and amines, anilines, alcohols, phenols or thiols; alkyl sulfonate and thiols, alcohols or phenols; anhydride and alcohols, phenols, amines or anilines; aryl halide and thiols; aziridine and thiols or thioethers; carboxylic acid and amines, anilines, alcohols or alkyl halides; diazoalkane and
- a functional group in one of the aforementioned functional group pair may be present in a binder and a corresponding functional group may be present in the signal generator or the enzyme.
- a binder may include a carboxylic acid and the signal generator or the enzyme may include an amine, aniline, alcohol or acyl halide, or vice versa. Conjugation between the binder and the signal generator or the enzyme may be effected in this case by formation of an amide or an ester linkage.
- the binder and the label are embodied in a single entity.
- the binder and the label are embodied in discrete entities (e.g., a primary antibody capable of binding a target and a signal generator-labeled secondary antibody capable of binding the primary antibody or a hapten labeled primary antibody capable of binding a target and a signal generator-labeled anti-hapten antibody capable of binding the hapten labeled primary antibody).
- the binder and the signal generator are separate entities they may be applied to a biological sample in a single step or multiple steps.
- the binder and the label are separate entities that are pre-attached before application to the biological sample and applied to the biological sample in a single step.
- the binder and the label are separate entities that are applied to the biological sample independently and combine following application.
- binders that physically bind to the target in a specific manner.
- a binder may bind to a target with sufficient specificity, that is, a binder may bind to a target with greater affinity than it does to any other molecule.
- the binder may bind to other molecules, but the binding may be such that the non-specific binding may be at or near background levels.
- the affinity of the binder for the target of interest may be in a range that is at least 2-fold, at least 5-fold, at least 10-fold, or more than its affinity for other molecules.
- binders with the greatest differential affinity may be employed, although they may not be those with the greatest affinity for the target.
- binding between the target and the binder may be affected by physical binding.
- Physical binding may include binding effected using non-covalent interactions.
- Non-covalent interactions may include, but are not limited to, hydrophobic interactions, ionic interactions, hydrogen-bond interactions, or affinity interactions.
- the target and the binder may have areas on their surfaces or in cavities giving rise to specific recognition between the two resulting in physical binding.
- a binder may bind to a biological target based on the reciprocal fit of a portion of their molecular shapes.
- Binders and their corresponding targets may be considered as binding pairs, of which non-limiting examples include immune-type binding-pairs, such as, antigen/antibody or antigen/antibody fragment.
- the binder may be a sequence-or structure-specific binder, wherein the sequence or structure of a target recognized and bound by the binder may be sufficiently unique to that target.
- the binder may be structure-specific and may recognize a primary, secondary, or tertiary structure of a target.
- a primary structure of a target may include specification of its atomic composition and the chemical bonds connecting those atoms (including stereochemistry), for example, the type and nature of linear arrangement of amino acids in a protein.
- a secondary structure of a target may refer to the general three-dimensional form of segments of biomolecules, for example, for a protein a secondary structure may refer to the folding of the peptide "backbone" chain into various conformations that may result in distant amino acids being brought into proximity with each other. Suitable examples of secondary structures may include, but are not limited to, alpha helices, beta pleated sheets, or random coils.
- a tertiary structure of a target may be is its overall three dimensional structure.
- a quaternary structure of a target may be the structure formed by its noncovalent interaction with one or more other targets or macromolecules (such as protein interactions).
- An example of a quaternary structure may be the structure formed by the four-globin protein subunits to make hemoglobin.
- a binder in accordance with the embodiments of the invention may be specific for any of the afore-mentioned structures.
- An example of a structure-specific binder may include a protein-specific molecule that may bind to a protein target.
- suitable protein-specific molecules include antibodies and antibody fragments.
- the target includes an antigen and a binder includes an antibody.
- a suitable antibody may include monoclonal antibodies, polyclonal antibodies, multispecific antibodies (for example, bispecific antibodies), or antibody fragments so long as they bind specifically to a target antigen.
- the biological sample includes a tissue sample and the methods disclosed herein may be employed in immunohistochemistry (IHC).
- Immunochemistry may involve binding of a target antigen to an antibody-based binder to provide information about the tissues or cells (for example, diseased versus normal cells).
- antibodies (and the corresponding diseases/disease cells) suitable as binders for methods disclosed herein include, but are not limited to, anti-estrogen receptor antibody (breast cancer), anti-progesterone receptor antibody (breast cancer), anti-p53 antibody (multiple cancers), anti-Her-2/neu antibody (multiple cancers), anti-EGFR antibody (epidermal growth factor, multiple cancers), anti-cathepsin D antibody (breast and other cancers), anti-Bcl-2 antibody (apoptotic cells), anti-E-cadherin antibody, anti-CA125 antibody (ovarian and other cancers), anti-CA15-3 antibody (breast cancer), anti-CA19-antibody (colon cancer), anti-c-erbB-2 antibody, anti-P-glycoprotein antibody (MDR, multi-drug resistance), anti-CEA antibody (carcinoembryonic antigen), anti-retinoblastoma protein (Rb) antibody, anti-ras oneoprotein (p21
- Suitable antibodies may include, but are not limited to, anti proliferating cell nuclear antigen, clone pc10 (Sigma Aldrich, P8825); anti smooth muscle alpha actin (SmA), clone 1A4 (Sigma, A2547); rabbit anti beta catenin (Sigma, C 2206); mouse anti pan cytokeratin, clone PCK-26 (Sigma, C1801); mouse anti estrogen receptor alpha, clone 1D5 (DAKO, M 7047); beta catenin antibody, clone 15B8 (Sigma, C 7738); goat anti vimentin (Sigma, V4630); cycle androgen receptor clone AR441 (DAKO, M3562); Von Willebrand Factor 7, keratin 5, keratin 8/18, e-cadherin, Her2/neu, Estrogen receptor, p53, progesterone receptor, beta catenin; donkey anti-mouse (Jackson Immunoresearch, 7
- a tissue sample may be subjected to in situ hybridization in addition to immunohistochemistry (IHC) to obtain desired information from the sample.
- IHC immunohistochemistry
- the specificity of binding between the binder and the target may also be affected depending on the binding conditions (for example, hybridization conditions in case of complementary nucleic acids). Suitable binding conditions may be realized by modulation one or more of pH, temperature, or salt concentration.
- a binder may be intrinsically labeled (signal generator attached during synthesis of binder) or extrinsically labeled (signal generator attached during a later step).
- an intrinsically labeled binder may be prepared by employing labeled amino acids.
- a binder may be synthesized in a manner such that signal generators may be incorporated at a later stage. For example, this latter labeling may be accomplished by chemical means by the introduction of active amino or thiol groups into peptide chains.
- a binder such a protein for example, an antibody
- combinations of binders may be used that may provide greater specificity or in certain embodiments amplification of the signal.
- a sandwich of binders may be used, where the first binder may bind to the target and serve to provide for secondary binding, where the secondary binder may or may not include a label, which may further provide for tertiary binding (if required) where the tertiary binding member may include a label.
- Suitable examples of binder combinations may include a primary antibody-secondary antibody.
- Some specific examples of suitable binder pairs may include mouse anti-myc for recombinant expressed proteins with c-myc epitope; mouse anti-HisG for recombinant protein with His-Tag epitope, mouse anti-xpress for recombinant protein with epitope- tag, rabbit anti-goat for goat IgG primary molecules; mouse anti-thio for thioredoxin fusion proteins, or rabbit anti-GFP for fusion protein.
- a combination of a primary antibody and a secondary antibody may be used as a binder.
- a primary antibody may be capable of binding to a specific region of the target and the secondary antibody may be capable of binding to the primary antibody.
- a secondary antibody may be attached to a signal generator before binding to the primary antibody or may be capable of binding to a signal generator at a later step.
- a primary antibody and specific binding ligand-receptor pairs such as biotin-streptavidin
- the primary antibody may be attached to one member of the pair (for example biotin) and the other member (for example streptavidin) may be labeled with a signal generator.
- the secondary antibody may be each independently labeled with a signal generator or an enzyme.
- the methods disclosed herein may be employed in an immunostaining procedure, and a primary antibody may be used to specifically bind the target protein.
- a secondary antibody may be used to specifically bind to the primary antibody, thereby forming a bridge between the primary antibody and a subsequent reagent (for example a signal generator or enzyme), if any.
- a primary antibody may be mouse IgG (an antibody created in mouse) and the corresponding secondary antibody may be goat anti-mouse (antibody created in goat) having regions capable of binding to a region in mouse IgG.
- signal amplification may be obtained when several secondary antibodies may bind to epitopes on the primary antibody.
- a primary antibody may be the first antibody used in the procedure and the secondary antibody may be the second antibody used in the procedure.
- a primary antibody may be the only antibody used in an immunostaining procedure.
- the type of fluorescent probe suitable for the methods disclosed herein may depend on a variety of factors, including the nature of the analysis being conducted, the type of the energy source and detector used, the type of oxidizing agent employed, the type of binder, the type of target, or the mode of attachment between the binder and the signal generator (e.g., cleavable or non-cleavable).
- a suitable signal generator may be sterically and chemically compatible with the constituents to which it is bound, for example, a binder. Additionally, a suitable signal generator may not interfere with the binding of the binder to the target, nor may it affect the binding specificity of the binder.
- a suitable signal generator may be organic or inorganic in nature. In some embodiments, a signal generator may be of a chemical, peptide or nucleic acid nature.
- a suitable signal generator is a fluorescent label that emits light of a particular wavelength following excitation by light of another lower, characteristic wavelength and/or absorb light of a particular wavelength.
- a signal generator suitable in accordance with the methods disclosed herein may be amenable to manipulation on application of a chemical agent.
- a signal generator may be capable of being chemically destroyed on exposure to an oxidizing agent. Chemical destruction may include complete disintegration of the signal generator or modification of the signal-generating component of the signal generator. Modification of the signal-generating component may include any chemical modification (such as addition, substitution, or removal) that may result in the modification of the signal generating properties. For example, unconjugating a conjugated signal generator may result in destruction of chromogenic properties of the signal generator. Similarly, substitution of a fluorescence-inhibiting functional group on a fluorescent signal generator may result in modification of its fluorescent properties.
- one or more signal generators substantially resistant to inactivation by a specific chemical agent may be used as a control probe in the provided methods.
- a signal generator includes a light-emissive molecule capable of absorbing and emitting light through fluorescence, or polarized fluorescence.
- a signal generator may essentially include a fluorophore attached to an antibody, for example, in an immunohistochemistry analysis.
- Suitable fluorophores that may be conjugated to a primary antibody include, but are not limited to, Fluorescein, Rhodamine, Texas Red, VECTOR Red, ELF (Enzyme-Labeled Fluorescence), Cy2, Cy3, Cy3.5, Cy5, Cy7, FluorX, Calcein, Calcein-AM, CRYPTOFLUOR, Orange (42 kDa), Tangerine (35 kDa), Gold (31 kDa), Red (42 kDa), Crimson (40 kDa), BHMP, BHDMAP, Br-Oregon, Lucifer Yellow, Alexa dye family, N-[6-(7-nitrobenz-2-oxa-1, 3-diazol-4-yl)amino]caproyl] (NBD), BODIPY, boron dipyrromethene difluoride, Oregon Green, MITOTRACK
- the signal generator may be part of a FRET pair.
- FRET pair includes two fluorophores that are capable of undergoing FRET to produce or eliminate a detectable signal when positioned in proximity to one another.
- donors may include Alexa 488, Alexa 546, BODIPY 493, Oyster 556, Fluor (FAM), Cy3, or TTR (Tamra).
- acceptors may include Cy5, Alexa 594, Alexa 647, or Oyster 656.
- a signal generator may include a fluorophore capable of being destroyed chemically by an oxidizing agent.
- a signal generator may essentially include cyanine, coumarin, BODIPY, ATTO 658, or ATTO 634, capable of being destroyed chemically by an oxidizing agent.
- a signal generator may include one or more a Cy3 dye, a Cy5 dye, or a Cy7 dye capable of being destroyed or quenched.
- the present invention employs a chemical agent comprising a solution comprising an oxiditing agent capable of modifying the signal generator.
- the oxidizing agents may be, for example, active oxygen species, hydroxyl radicals, singlet oxygen, hydrogen peroxide, or ozone.
- the chemical agent may include hydrogen peroxide, potassium permanganate, sodium dichromate, aqueous bromine, iodine-potassium iodide, or t-butyl hydroperoxide.
- One or more of the aforementioned chemical agents may be used in the methods disclosed herein depending upon the susceptibility of the signal generator, of the binder, of the target, or of the biological sample to the chemical agent.
- a chemical agent that essentially does not affect the integrity of the binder, the target, and the biological sample may be employed.
- a chemical agent that does not affect the specificity of binding between the binder and the target may be employed.
- a chemical agent may be capable of selectively modifying one or more signal generators. Susceptibility of different signal generators to a chemical agent may depend, in part, to the concentration of the signal generator, temperature, or pH. For example, two different fluorophores may have different susceptibility to an oxidizing agent depending upon the concentration of the oxidizing agent.
- a chemical agent may essentially include an oxidizing agent.
- a chemical agent may essentially include a basic solution of an oxidizing agent.
- a basic solution may have a pH in a range of from about 8 to about 10.
- a basic solution e.g., sodium biocarbonate
- a suitable oxidizing agent may be selected from peroxide, sodium periodate, or ozone.
- a suitable oxidizing agent may include peroxide or a peroxide source and the basic solution may include hydrogen peroxide.
- the concentration of hydrogen peroxide in the basic solution may be selected to substantially oxidize the fluorescent signal generator in a predetermined period of time.
- the concentration of hydrogen peroxide in the basic solution may be selected to substantially inactivate both the fluorescent signal generator and the enzyme in a given period of time.
- the concentration of hydrogen peroxide in the basic solution may be selected such that the integrity of the sample, the targets, the binder, or the target-binder specificity may be maintained.
- a basic solution may include hydrogen peroxide in an amount that is in a range of from about 0.5 volume percent to about 5 volume percent, in a range of from about 1 volume percent to about 4 volume percent, or in a range of from about 1.5 volume percent to about 3.5 volume percent. In some specific embodiments, a basic solution may include hydrogen peroxide in an amount that is in a range of about 3 volume percent.
- the basic solution may not include reagents that strip the binders, the targets or both the binders and the targets from the sample such as reducing agents or surfactants.
- a biological sample may be contacted with a probe to bind the probe to a target in the biological sample.
- a target may not be easily accessible for binding with the probe and a biological sample may be further processed to facilitate the binding between the target and the binder in the probe, for example through antigen recovery, enzymatic digestion, epitope retrieval, or blocking.
- a probe may be contacted with the biological sample in the form of a solution.
- a probe may include a binder coupled to a label (fluorescent signal generator).
- the binder and the label (signal generator) may be embodied in a single molecule and the probe solution may be applied in a single step.
- the binder and the label (signal generator) may be distinct entities and the probe solution may be applied in a single step or multiple steps.
- a control probe may further be bonded to one or more targets in the sample.
- the sample may be contacted with a wash solution (for example an appropriate buffer solution) to wash away any unbound probes.
- a wash solution for example an appropriate buffer solution
- a biological sample may be subjected to a number of washing steps with the same or different washing solutions being employed in each step.
- the biological sample may be contacted with more than one probe in the first binding step.
- the plurality of probes may be capable of binding different targets in the biological sample.
- a biological sample may include two targets: target1 and target2 and two sets of probes may be used in this instance: probe1 (having binder1 capable of binding to target1) and probe2 (having binder2 capable of binding to target2).
- a plurality of probes may be contacted with the biological sample simultaneously (for example, as a single mixture) or sequentially (for example, a probe1 may be contacted with the biological sample, followed by washing step to remove any unbound probe1, followed by contacting a probe2 with the biological sample, and so forth).
- the number of probes that may be simultaneously bound to the target may depend on the type of detection employed, that is, the spectral resolution achievable. For example, for fluorescence-based signal generators, four different probes (providing four spectrally resolvable fluorescent signals) may be employed in accordance with the disclosed methods.
- Spectrally resolvable in reference to a plurality of fluorescent signal generators, indicates that the fluorescent emission bands of the signal generators are sufficiently distinct, that is, sufficiently non-overlapping, such that, binders to which the respective signal generators are attached may be distinguished on the basis of the fluorescent signal generated by the respective signal generators using standard photodetection systems.
- a biological sample may be essentially contacted with four or less than four probes in the first binding step.
- the number of probes that may be simultaneously bound to the target may also depend on the number of different enzymes and their corresponding substrates available.
- the biological sample includes a tissue sample.
- the tissue sample may be obtained by a variety of procedures including, but not limited to surgical excision or biopsy.
- the tissue may be fresh or frozen.
- the tissue sample may be fixed and embedded in paraffin.
- the tissue sample may be fixed or otherwise preserved by conventional methodology; the choice of a fixative may be determined by the purpose for which the tissue is to be histologically stained or otherwise analyzed.
- the length of fixation may depend upon the size of the tissue sample and the fixative used. For example, neutral buffered formalin, Bouin's or paraformaldehyde, may be used to fix or preserve a tissue sample.
- the tissue sample may be first fixed and then dehydrated through an ascending series of alcohols, infiltrated and embedded with paraffin or other sectioning media so that the tissue sample may be sectioned.
- a tissue sample may be sectioned and subsequently fixed.
- the tissue sample may be embedded and processed in paraffin. Examples of paraffin that may be used include, but are not limited to, Paraplast, Broloid, and Tissuemay.
- slide adhesives may include, but are not limited to, silane, gelatin, poly-L-lysine.
- the tissue sections may be deparaffinized and rehydrated in water.
- the tissue sections may be deparaffinized, for example, by using organic agents (such as, xylenes or gradually descending series of alcohols).
- the tissue section may be subjected to further treatment prior to, during, or following immunohistochemistry.
- the tissue section may be subjected to epitope retrieval methods, such as, heating of the tissue sample in citrate buffer.
- a tissue section may be optionally subjected to a blocking step to minimize any non-specific binding.
- a probe solution e.g., labeled-antibody solution
- the tissue section for a sufficient period of time and under conditions suitable for binding of binder to the target (e.g., antigen).
- two detection methods may be used: direct or indirect.
- a signal generator-labeled primary antibody fluorophore-labeled primary antibody
- an unconjugated primary antibody may be incubated with an antigen and then a labeled secondary antibody may bind to the primary antibody.
- Signal amplification may occur as several secondary antibodies may react with different epitopes on the primary antibody.
- two or more (at most four) primary antibodies may be contacted with the tissue sample. Unlabeled antibodies may be then contacted with the corresponding labeled secondary antibodies.
- a signal from the signal generator may be detected using a detection system.
- the nature of the detection system used may depend upon the nature of the signal generators used.
- the detection system may include a fluorescent detection system.
- signal intensity, signal wavelength, signal location, signal frequency, or signal shift may be determined using one or more of the aforementioned techniques. In some embodiments, one or more aforementioned characteristics of the signal may be observed, measured, and recorded.
- the signal generator (coupled with a binder) includes a fluorophore and fluorescence wavelength or fluorescent intensity may be determined using a fluorescence detection system.
- a signal may be observed in situ, that is, a signal may be observed directly from the signal generator associated through the binder to the target in the biological sample.
- a signal from the signal generator may be analyzed within the biological sample, obviating the need for separate array-based detection systems.
- observing a signal may include capturing an image of the biological sample.
- a microscope connected to an imaging device may be used as a detection system, in accordance with the methods disclosed herein.
- the signal generator fluorophore
- the signal fluorescence signal obtained may be observed and recorded in the form of a digital signal (for example, a digitalized image). The same procedure may be repeated for different signal generators (if present) that are bound in the sample using the appropriate fluorescence filters.
- a chemical agent may be applied to the sample to modify the signal.
- signal modification may include one or more of a change in signal characteristic, for example, a decrease in intensity of signal, a shift in the signal peak, a change in the resonant frequency, or cleavage (removal) of the signal generator resulting in signal removal.
- a chemical agent is applied to modify the signal by substantially inactivating the fluorescent signal generator.
- the chemical agent includes an oxidizing agent, which may substantially oxidize the fluorescent signal generator.
- a chemical agent may be applied to modify the signal by substantially oxidizing the cleavable linkage to cleave off the signal generator.
- a chemical agent may be in the form of a solution and the sample may be contacted with the chemical agent solution for a predetermined amount of time.
- a chemical agent may be a basic solution having an oxidizing agent. The concentration of the basic solution and the contact time may be dependent on the type of signal modification desired.
- a chemical agent solution may be contacted with the sample and the oxidation step may be performed for less than 30 minutes. In some embodiments, the oxidation step may be performed for less than 15 minutes. In some embodiments, the oxidation step may be performed for about 30 seconds to about 15 minutes. In some embodiments, the oxidation step may be performed for about 5 minutes. In some embodiments, the oxidation step may be performed at room temperature.
- the contacting conditions for the basic solution may be selected such that the binder, the target, the biological sample, and binding between the binder and the target may not be affected.
- an oxidizing agent may only affect the signal generator and the oxidizing agent may not affect the target/binder binding or the binder integrity.
- a binder may include a primary antibody or a primary antibody/secondary combination.
- An oxidizing agent according to the methods disclosed herein may only affect the signal generator, and the primary antibody or primary antibody/secondary antibody combination may essentially remain unaffected.
- a binder (such as, a primary antibody or primary antibody/secondary antibody combination) may remain bound to the target in the biological sample after contacting the sample with the oxidizing agent.
- a binder may remain bound to the target in the biological sample after contacting the sample with the oxidizing agent and the binder integrity may remain essentially unaffected (for example, an antibody may not substantially denature or elute in the presence of a chemical agent).
- the oxidizing agent after application of the oxidizing agent to the sample less than 25 percent of the binders may be stripped from the targets in the biological sample. In some embodiments, after application of the oxidizing agent to the sample less than 20, less than 15 percent, less than 10 percent, or less than 5 percent of the binders may be stripped from the targets in the biological sample.
- a characteristic of the signal may be observed after contacting the sample with the oxidizing agent to determine the effectiveness of the signal modification. For example, a color may be observed before application of the oxidizing agent and the color may be absent after application of the oxidizing agent. In another example, fluorescence intensity from a fluorescent signal generator may be observed before contacting with the oxidizing agent and after contacting with the oxidizing agent. In some embodiments, a decrease in signal intensity by a predetermined amount may be referred to as signal modification. In some embodiments, modification of the signal may refer to a decrease in the signal intensity by an amount in a range of greater than about 50 percent.
- modification of the signal may refer to a decrease in the signal intensity by an amount in a range of greater than about 60 percent. In some embodiments, modification of the signal may refer to a decrease in the signal intensity by an amount in a range of greater than about 80 percent.
- the biological sample or the sample bound to a solid support may be contacted with a subsequent probe using one or more procedures described herein above for the first probe.
- the subsequent probe may be capable of binding to target different from the target bound in the earlier steps.
- the subsequent probe may be capable of binding a target different from the targets bound by the earlier probe set.
- a biological sample may be contacted with a plurality of probes in the subsequent probe contact step.
- the signal generator used in the different binding steps may be the same, that is, detectable in the same detection channel. Methods employing the same signal generator in different binding steps may allow for detection of multiple targets when a limited number of detection channels is available.
- the subsequent probes may include the same signal generators as in the earlier binding steps.
- a first binding step may include Cy3, Cy5, and Cy7-conjugated different binders.
- the subsequent binding steps may also include the same dye set, that is, Cy3, Cry5, and Cy7.
- the signal generator used in the different binding steps may be different, that is, independently detectable in different detection channels.
- a first probe may include a Cy3 dye, which has a fluorescent emission wavelength in the green region and a subsequent probe may include a Cy7 dye, which has a fluorescent emission wavelength in the red region.
- One or more detection methods described hereinabove may be used to observe one or more characteristics of a subsequent (e.g., second, third, etc.) signal from a subsequent signal generator (present in the subsequent probe).
- signal intensity, signal wavelength, signal location, signal frequency, or signal shift may be determined using one or more of the aforementioned techniques.
- a subsequent signal for example, a fluorescence signal
- observing a subsequent signal may also include capturing an optical image of the biological sample.
- oxidation of the signal generator, and subsequent probe administration may be repeated multiple times.
- the biological sample may be contacted with an oxidizing agent to modify the signal from the second probe.
- a third probe may be contacted with the biological sample, wherein the third probe may be capable of binding a target different from the first and the second probes.
- a signal from the third probe may be observed followed by application of oxidizing agent to modify the signal.
- the binding, observing, and oxidation steps may be repeated iteratively multiple times using an n th probe capable of binding to additional targets to provide the user with information about a variety of targets using a variety of probes and/or signal generators.
- the oxidation, binding, reacting (if applicable), and observing steps may be repeated one or more time.
- the oxidation, binding, reacting (if applicable), and observing steps may be repeated at least 5, at least 10, or at least 20 times.
- a series of probes may be contacted with the biological sample in a sequential manner to obtain a multiplexed analysis of the biological sample.
- a series of probe sets (including at most 4 probes in one set) may be contacted with the biological sample in a sequential manner to obtain a multiplexed analysis of the biological sample.
- Multiplexed analysis generally refers to analysis of multiple targets in a biological sample using the same detection mechanism.
- the biological sample includes a tissue, and the sample may be contacted with a morphological stain before, during, or after the contacting step with the first probe or subsequent probe.
- a morphological stain may include a dye that may stain different cellular components, in order to facilitate identification of cell type or disease status.
- the morphological stain may be readily distinguishable from the signal generators in the probes, that is, the stain may not emit signal that may overlap with signal from the probe.
- the signal from the morphological stain may not autofluoresce in the same wavelength as the fluorophores used in the probes.
- a morphological stain may be contacted with the biological sample before, during, or after, any one of the aforementioned steps.
- a morphological stain may be contacted with biological sample along with the first probe contact step.
- a morphological stain may be contacted with the biological sample before contacting the sample with a chemical agent and after binding the first probe to the target.
- a morphological stain may be contacted with a biological sample after contacting the sample with a chemical agent and modifying the signal.
- a morphological stain may be contacted with a biological sample along with the second probe contact step.
- a biological sample may be contacted with the morphological stain after binding the second probe to the target.
- the morphological stains may result in background noise for the fluorescent signal from the signal generator
- the morphological stains may be contacted with the biological sample after the probing, oxidizing and reprobing steps.
- morphological stains like H&E may be sequentially imaged and registered after the methods disclosed herein.
- chromophores, fluorophores, or enzyme/enzyme substrates may be used as morphological stains.
- Suitable examples of chromophores that may be used as morphological stains (and their target cells, subcellular compartments, or cellular components) may include, but are not limited to, Eosin (alkaline cellular components, cytoplasm), Hematoxylin (nucleic acids), Orange G (red blood, pancreas, and pituitary cells), Light Green SF (collagen), Romanowsky-Giemsa (overall cell morphology), May-Grunwald (blood cells), Blue Counterstain (Trevigen), Ethyl Green (CAS) (amyloid), Feulgen-Naphthol Yellow S (DNA), Giemsa (differentially stains various cellular compartments), Methyl Green (amyloid), pyronin (nucleic acids), Naphthol-Yellow (red blood cells), Neutral Red (nu).
- Suitable fluorescent morphological stains may include, but are not limited to, ,: 4',6-diamidino-2-phenylindole (DAPI) (nucleic acids), Eosin (alkaline cellular components, cytoplasm), Hoechst 33258 and Hoechst 33342 (two bisbenzimides) (nucleic acids), Propidium Iodide (nucleic acids), Spectrum Orange (nucleic acids), Spectrum Green (nucleic acids), Quinacrine (nucleic acids), Fluorescein-phalloidin (actin fibers), Chromomycin A 3 (nucleic acids), Acriflavine-Feulgen reaction (nucleic acid), Auramine O-Feulgen reaction (nucleic acids), Ethidium Bromide (nucleic acids).
- DAPI 4',6-diamidino-2-phenylindole
- Eosin alkaline cellular components, cytoplasm
- Nissl stains neutralized DNA fluorophores
- high affinity DNA fluorophores such as POPO, BOBO, YOYO and TOTO and others
- Green Fluorescent Protein fused to DNA binding protein such as histones, ACMA, Quinacrine and Acridine Orange.
- Suitable enzymes may include, but are not limited to, ATPases (muscle fibers), succinate dehydrogenases (mitochondria), cytochrome c oxidases (mitochondria), phosphorylases (mitochondria), phosphofructokinases (mitochondria), acetyl cholinesterases (nerve cells), lactases (small intestine), acid phosphatases (lysosomes), leucine aminopeptidases (liver cells), dehydrogenases (mitochondria), myodenylate deaminases (muscle cells), NADH diaphorases (erythrocytes), and sucrases (small intestine).
- a morphological stain may be stable towards an oxidizing agent, that is, the signal generating properties of the morphological stain may no be substantially affected by the oxidizing agent.
- a biological sample may be stained with a probe and a morphological stain at the same time, application of oxidizing agent to modify the signal from the probe may not modify the signal from the morphological stain.
- a morphological stain may be used as a control to co-register the molecular information (obtained through the iterative probing steps) and the morphological information (obtained through the morphological stains).
- a control probe may be bonded to one or more targets in the biological sample.
- a control probe may be bonded to the targets along with the first probe contact step.
- a control probe may be applied to the biological sample simultaneously with the first probe.
- a control probe may be applied to the biological sample sequentially, that is before or after the application of the first probe, but before application of the oxidizing agent.
- a control probe may include a signal generator that is stable towards an oxidizing agent or the signal generating properties of the signal generator are not substantially affected when contacted with the oxidizing agent.
- a signal generator may include a radioisotope that is stable to the oxidizing agent or a fluorophore that is stable to the oxidizing agent.
- a suitable radioisotope may include P 32 or H 3 , 14 C, 125 I or 131 I.
- a suitable fluorophore may include DAPI.
- a suitable signal generator may be coupled to a binder to form a control probe.
- a radioactive label may be coupled to an antibody to form a control probe and the antibody may bind to one or more target antigens present in the biological sample.
- a suitable signal generator may be capable of binding to one more targets in the sample and also providing a detectable signal, which is stable in the presence of the oxidizing agent.
- a suitable control probe may be DAPI, which is capable of binding to nucleic acids in the sample and also capable of providing a fluorescent signal that is stable to the oxidizing agent.
- a control probe may be employed in the methods disclosed herein to provide an indication of the stability of the targets to the iterative staining steps.
- a control probe may be bonded to a known target in the sample and a signal from the control observed and quantified. The control signal may be then monitored during the iterative staining steps to provide an indication of the stability of the targets or binders to the oxidizing agents.
- a quantitative measure for example, signal intensity
- the control signal may be monitored to quantify the amount of targets present in the sample after the iterative probing steps.
- a control probe may be employed to obtain quantitative information of the sample of interest, for example concentration of targets in the sample or molecular weight of the targets in the sample.
- a control target having known concentration or known molecular weight
- a control probe may be bonded to the control target and a control signal observed. The control signal may be then correlated with the signals observed from the sample of interest using methods described herein below.
- a control probe may be employed in the methods disclosed herein to provide for co-registration of multiple molecular information (obtained through the iterative probing steps) and the morphological information (obtained, e.g., using DAPI).
- methods disclosed herein may include co-registration of multiple fluorescent images with the bright-field morphological images obtained e.g., using H&E.
- the probes employed in the iterative probing steps may not have any common compartmental information that may be used to register with the H&E images.
- a control probe like a DAPI nuclear stain may be employed to co-register the nucleus stained with hematoxylin in the bright-field images with the fluorescent images.
- the fluorescent images and the bright-field images may be co-registered using image registration algorithms that may be grouped in two categories: intensity-based and feature-based techniques.
- a first signal, a subsequent signal, or the first signal and the subsequent signals may be analyzed to obtain information regarding the biological sample.
- a presence or absence of a first signal may indicate the presence or absence of the first target (capable of binding to the first binder) in the biological sample.
- the presence or absence of a second signal may indicate the presence or absence of the second target (capable of binding to the second binder in the biological sample).
- the presence or absence of a particular signal may indicate the presence or absence of corresponding target in the biological sample.
- the observing steps may include a quantitative measurement of at least one target in the sample.
- an intensity value of a signal for example, fluorescence intensity
- a correlation between the amount of target and the signal intensity may be determined using calibration standards.
- intensity values of the first and second signals may be measured and correlated to the respective target amounts.
- the relative amounts of the first target and the second target may be ascertained.
- relative amounts of different targets in the biological sample may be determined by measuring different signal intensities.
- one or more control samples may be used as described hereinabove.
- information regarding the biological sample may be obtained. For example by comparing a diseased tissue sample versus a normal tissue sample, information regarding the targets present in the diseased tissue sample may be obtained. Similarly by comparing signal intensities between the samples (i.e., sample of interest and one or more control), information regarding the expression of targets in the sample may be obtained.
- the observing steps include co-localizing at least two targets in the sample.
- Methods for co-localizing targets in a sample are described in U.S. Patent Application Serial No. 11/686,649 , entitled “System and Methods for Analyzing Images of Tissue Samples", filed on March 15, 2007; U.S. Patent Application Serial No. 11/500028 , entitled “System and Method for Co-Registering Multi-Channel Images of a Tissue Micro Array", filed on August 7, 2006; U.S. Patent Application Serial No. 11/606582 , entitled “System and Methods for Scoring Images of a Tissue Micro Array, filed on November 30, 2006, and .S. Application Serial No. 11/680063 , entitled Automated Segmentation of Image Structures, filed on February 28, 2007, each of which is herein incorporated by reference.
- a location of the signal in the biological sample may be observed.
- a localization of the signal in the biological signal may be observed using morphological stains.
- relative locations of two or more signals may be observed.
- a location of the signal may be correlated to a location of the target in the biological sample, providing information regarding localization of different targets in the biological sample.
- an intensity value of the signal and a location of the signal may be correlated to obtain information regarding localization of different targets in the biological sample. For examples certain targets may be expressed more in the cytoplasm relative to the nucleus, or vice versa.
- information regarding relative localization of targets may be obtained by comparing location and intensity values of two or more signals.
- one or more of the observing or correlating step may be performed using computer-aided means.
- the signal(s) from the signal generator may be stored in the form of digital image(s)
- computer-aided analysis of the image(s) may be conducted.
- images e.g., signals from the probe(s) and morphological stains
- one or more of the aforementioned may be automated and may be performed using automated systems. In some embodiments, all the steps may be performed using automated systems.
- the methods disclosed herein may find applications in analytic, diagnostic, and therapeutic applications in biology and in medicine. In some embodiments, the methods disclosed herein may find applications in histochemistry, particularly, immunohistochemistry. Analysis of cell or tissue samples from a patient, according to the methods described herein, may be employed diagnostically (e.g., to identify patients who have a particular disease, have been exposed to a particular toxin or are responding well to a particular therapeutic or organ transplant) and prognostically (e.g., to identify patients who are likely to develop a particular disease, respond well to a particular therapeutic or be accepting of a particular organ transplant). The methods disclosed herein, may facilitate accurate and reliable analysis of a plurality (e.g., potentially infinite number) of targets (e.g., disease markers) from the same biological sample.
- targets e.g., disease markers
- a solution of hydrogen peroxide (H 2 O 2 ) was prepared in a sodium bicarbonate buffer by mixing 1 volume of 1M sodium bicarbonate, 3 volumes of water, and 1 volume of 30 percent (v/v) hydrogen peroxide. pH of sodium bicarbonate was adjusted to a pH 10 using sodium hydroxide, prior to mixing with hydrogen peroxide.
- cyanine dyes Three separate solutions of cyanine dyes: Cy3, Cy5, and Cy7 were prepared in water at a concentration of about 2 ⁇ M. An aliquot of a cyanine dye solution was mixed with an aliquot of the H 2 O 2 solution to prepare a sample solution with a final concentration of about 3 volume percent H 2 O 2 and 1 micromolar 1 ⁇ M cyanine dye (Samples 1 (Cy3), 2 (Cy5), and 3 (Cy7)). A 1 ⁇ M cyanine dye solution in water (without H 2 O 2 ) was used as a control.
- Oxidation reaction of the cyanine dye was monitored by measuring absorbance spectrum of the dye on an ultraviolet/visible (UV/Vis) spectrophotometer as a function of time.
- FIG. shows the absorbance spectra of Sample 1 as a function of wavelength, after duration of 10 minutes and 15 minutes. The absorbance value decreased considerably when compared with the control.
- FIG. 2 shows the absorbance values for Samples 1, 2, and 3 as a function of wavelength. The absorbance of the Samples 1, 2 and 3 reduced to zero after a duration of time exhibiting chemical destruction of the dye by H 2 O 2 .
- the time duration for the Samples 1, 2 and 3 was different for the different dye: 19 minutes for Sample 1, 15 minutes for Sample 2, and 3 minutes for Sample 3.
- a solution of 4',6-diamidino-2-phenylindole (DAPI) was prepared in water at a concentration of about 57 ⁇ M.
- An aliquot of DAPI solution was mixed with an aliquot of the H 2 O 2 solution to prepare a solution with a final concentration of about 3 volume percent H 2 O 2 and 10 ⁇ g/mL DAPI (Sample 4).
- a 10 ⁇ g/mL DAPI solution in water (without H 2 O 2 ) was used as a control.
- Oxidation reaction of DAPI was monitored by measuring absorbance spectrum of Sample 4 as a function of time.
- FIG. 3 shows the absorbance spectra of Sample 4 as a function of wavelength, after duration of 30 minutes and 140 minutes. The absorbance value of Sample 4 did not vary much even after a period of 140 minutes and was in the same range as the control, exhibiting no significant effect of H 2 O 2 on DAPI.
- a solution of sodium periodate (NaIO 4 ) was prepared by mixing a 0.2 M solution of NaIO 4 in 0.1X phosphate buffer saline (PBS). Three separate solutions of cyanine dyes (Cy3, Cy5, and Cy7) were prepared in water at a concentration of about 2 ⁇ M. An aliquot of a cyanine dye solution was mixed with an aliquot of the NaIO 4 solution to prepare a solution with a final concentration of about 1 ⁇ M NaIO 4 and 1 ⁇ M cyanine dye (Samples 5 (Cy3), 6 (Cy5), and 7 (Cy7)). A 1 ⁇ M cyanine dye solution in water (without NaIO 4 ) was used as a control.
- Oxidation reaction of the cyanine dye was monitored by measuring absorbance spectrum of the dye on an ultraviolet/visible (UV/Vis) spectrophotometer as a function of time.
- FIG. 4 shows the absorbance spectra of Sample 5 as a function of wavelength, after duration of 20 minutes, 60 minutes and 210 minutes. The absorbance value decreased as function of time when compared with the control. Complete absorbance loss was observed after 210 minutes for Sample 5.
- FIG.5 shows the absorbance spectra of Sample 6 as a function of wavelength, after duration of 12 minutes and 16 minutes. The absorbance value decreased as function of time when compared with the control. Complete absorbance loss was observed rapidly, after 16 minutes.
- a solution of 4',6-diamidino-2-phenylindole (DAPI) was prepared in water at a concentration of about 57 ⁇ M.
- An aliquot of DAPI solution was mixed with an aliquot of the NaIO 4 solution to prepare a solution with a final concentration of about 0.1 M NaIO 4 and 10 ⁇ g/mL DAPI (Sample 8).
- a 10 ⁇ g/mL DAPI solution in water (without NaIO 4 ) was used as a control.
- Oxidation reaction of DAPI was monitored by measuring absorbance spectrum of Sample 8 as a function of time.
- FIG. 6 shows the absorbance spectra of Sample 8 as a function of wavelength, after duration of 22 minutes, 70 minutes and 210 minutes. The absorbance value of Sample 8 did not vary much even after a period of 210 minutes and a significant amount of DAPI remained intact when compared to the control.
- a NaOH solution was prepared at a concentration of 0.1M and 1M.
- Three separate solutions of cyanine dyes, Cy3, Cy5, and Cy7 were prepared in water at a concentration of 2 ⁇ M.
- An aliquot of a cyanine dye solution was mixed with an aliquot of the NaOH solution of two different concentrations of NaOH: 0.1M NaOH (Samples 9a, 10a, and 11a) and 1M NaOH (Samples 9b, 10b, and 11b).
- a 1 ⁇ M cyanine dye solution in water (without NaOH) was used as a control.
- FIG. 7 shows the absorbance spectra of Samples 9a, 10a, and 11a as a function of wavelength, after duration of less than 5 minutes.
- the absorbance value of Sample 9A did not vary much and a significant amount of Cy3 remained intact when compared to the control.
- Sample 10a showed a 20 percent decomposition of the Cy5 dye, while Sample 11Ashowed a 70 percent decomposition of the Cy7 dye using 0.1 M NaOH.
- FIG. 8 shows the absorbance spectra of Samples 9B and 10B as a function of wavelength, after duration of less than 5 minutes. Sample 9B showed a 50 percent decomposition of the Cy3 dye, while Sample 10B showed an 80 percent decomposition of the Cy5 dye using 1 M NaOH.
- a solution of 4',6-diamidino-2-phenylindole (DAPI) was prepared in water at a concentration of about 57 ⁇ M.
- An aliquot of DAPI solution was mixed with an aliquot of the NaOH solution of two different concentrations 0.1M NaOH (Samples 12A) and 1M NaOH (Samples 12B).
- a 10 ⁇ g/mL DAPI dye solution in water (without NaOH) was used as a control.
- Base destruction of DAPI was monitored by measuring absorbance spectrum of Samples 12A and 12B as a function of time.
- FIG. 9 shows the absorbance spectra of Samples 12A and 12B as a function of wavelength. The absorbance value of the samples did not vary much and a significant amount of DAPI remained intact when compared to the control.
- a 5 percent (w/v) solution of a nucleophile was prepared by mixing tris[2-carboxyethyl]-phosphine hydrochloride (TCEP.HCl) in 1M-sodium bicarbonate buffer (final pH 7.7). Three separate solutions of cyanine dyes, Cy3, Cy5, and Cy7 were prepared in water at a concentration of about 2 ⁇ M. An aliquot of a cyanine dye solution was mixed with an aliquot of the TCEP.HCl solution to prepare Samples 13 (Cy3), 14 (Cy5), and 15 (Cy7). A 1 ⁇ M cyanine dye solution in water (without TCEP.HCl) was used as a control.
- FIG. 10 shows the absorbance spectra of Samples 13, 14, and 15 as a function of wavelength.
- the absorbance value of Sample 13 did not vary much and a significant amount of Cy3 remained intact when compared to the control after duration of 60 minutes.
- Samples 14 and 15 showed a significant decomposition of the Cy5 and Cy7 dyes after duration of 0.5 minutes.
- a solution of hydrogen peroxide (H 2 O 2 ) was prepared in a phosphate buffer saline solution (PBS) by mixing a 6 % (v/v) solution of H 2 O 2 in 0.8X PBS (final pH 6.6).
- PBS phosphate buffer saline solution
- Cy3 and Cy7 were prepared in water at a concentration of about 2 ⁇ M.
- An aliquot of a cyanine dye solution was mixed with an aliquot of the H 2 O 2 solution to prepare Samples 16 (Cy3) and 17 (Cy7)).
- a 1 ⁇ M cyanine dye solution in water (without H 2 O 2 ) was used as a control.
- FIG. 11 shows the absorbance spectra of Samples 16 and 17 as a function of wavelength.
- the absorbance value of Sample 16 did not vary much and a significant amount of Cy3 remained intact when compared to the control after duration of 60 minutes.
- Sample 17 showed a significant decomposition of the Cy7 dye after duration of 60 minutes.
- tissue samples were obtained as tissue slides embedded in paraffin.
- the tissue samples included slides of colon (Biochain, T2234090), normal breast tissue (Biochain, T2234086), prostate cancer (Biochain, T2235201-1), colon adenocarcinoma (Biochain, T2235090-1), breast tissue microarray (Imgenex, IMH 367, p61), breast TMA (Imgenex IMH 367,p32), and normal prostate (Biochain, T2234201).
- Paraffin embedded slides of adult human tissue were subjected to an immunohistochemistry protocol to prepare them for staining. The protocol included deparaffinization, rehydration, incubation, and wash.
- Deparaffinization was carried by washing the slides with Histochoice (or toluene) for a period of 10 minutes and with frequent agitation. After deparaffinization, the tissue sample was rehydrated by washing the slide with ethanol solution. Washing was carried out with three different solutions of ethanol with decreasing concentrations. The concentrations of ethanol used were 90 volume %, 70 volume %, and 50 volume %. The slide was then washed with a phosphate buffer saline (PBS, pH 7.4). Membrane permeabilization of the tissue was carried out by washing the slide with 0.1 1 weight percent solution of Triton TX-100. Citrate buffer pH 6.0 (Vector Unmasking Solution) was used for antigen retrieval.
- Citrate buffer pH 6.0 Vector Unmasking Solution
- the slides were exposed to the buffer in a pressure cooker for a period of 15 minutes followed by cooling at room temperature for 20 minutes. The slide was then blocked against nonspecific binding by washing with PBS and 900 ⁇ l of 3 volume percent bovine serum albumin (BSA) for 45 minutes at 37 C. For staining with secondary antibodies (optional), the slide was also blocked with 100 ⁇ L of serum from secondary antibody host species.
- BSA bovine serum albumin
- Dye-conjugated antibodies were prepared according to the following procedure.
- the antibodies used for conjugating and staining included anti-proliferating cell nuclear antigen, clone pc10 (Sigma Aldrich, P8825); anti-smooth muscle alpha actin (SmA), clone 1A4 (Sigma, A2547); rabbit anti-beta catenin (Sigma, C 2206); mouse anti-pan cytokeratin, clone PCK-26 (Sigma, C1801); mouse anti-estrogen receptor alpha, clone 1D5 (DAKO, M 7047); beta catenin antibody, clone 15B8 (Sigma, C 7738); goat anti-vimentin (Sigma, V4630); cycle androgen receptor clone AR441 (DAKO, M3562); Von Willebrand Factor VII, keratin 5, keratin 8/18, e-cadherin, Her2/neu, Estrogen receptor, p53,
- a micron YM-10 spin column was wetted with 250 mL of PBS and the column was spun for 15 minutes. 500 mL of the antibody (200 ⁇ g/mL) was pipetted into the wet column. The column was spun for 30 minutes at 11000 rpm at 4 C. The concentrated antibody/protein was then transferred into a new tube and spun for 30 seconds to remove the concentrated protein.
- a coupling buffer solution was then mixed with the concentrated antibody solution.
- the coupling buffer solution included 1M sodium carbonate (pH between 8-9) and 5 ⁇ L of the buffer was used per 100 ⁇ L of the antibody solution. The antibody and buffer solution was added to 0.01-0.1 milligrams of the cyanine dye.
- the dye was reconstituted in DMSO to a 10-20-mg/mL concentration prior to incubating with the antibody.
- the resulting solution was mixed thoroughly by pipetting and any bubbles formed were removed by spinning the tube.
- the solution was covered with a foil and incubated at room temperature for a period of about 30-45 minutes. Post incubation the solution was added to YM-10 spin column and spun for 30 minutes at 4 C at 11000 rpm. The solution was washed with PBS and spun to remove any unconjugated dye or antibody.
- the dye-conjugated antibody solution was then diluted with 50 percent glycerol and stored in a freezer at -20 C.
- Example 6 A slide prepared in Example 6 was incubated with a dye-conjugated antibody prepared in Example 7. Incubation was conducted in 3 percent BSA for 45 minutes at 37 C. After incubation, the slide was subjected to an extensive series of PBS washes. When secondary antibodies were used, the slide was incubated with a secondary antibody in BSA for 45 minutes at 37 C. After incubation, the slide was subjected to an extensive series of PBS washes. A primary antibody or secondary antibody-stained slide was counterstained with the morphological stain, DAPI, and cover slipped.
- a cover slipped slide was imaged using a camera.
- the camera used was a monochromatic Leica DFC 350FX monochromatic high-resolution camera mounted in a Leica DMRA2 fluorescent microscope. The magnification used was 20x unless otherwise stated. After image acquisition, the cover slip was removed and the slide was washed with PBS to prepare for signal destruction.
- NaOH solution and H 2 O 2 solution were used for signal destruction.
- a NaOH solution was prepared using 500 ⁇ L of 50 volume percent NaOH and 49.5 mL of PBS. The final pH of the NaOH solution was around 11.9-12.5.
- a H 2 O 2 solution was prepared by mixing 10 mL of 0.5M sodium carbonate (pH 10), 5 mL of 30 volume percent H 2 O 2 , and 35 mL of water.
- a slide was placed in the NaOH or H 2 O 2 solution for 15 minutes with gentle agitation. After 15 minutes, the slide was washed again with PBS, cover slipped and either imaged again (optional) to check the efficacy of the dye destruction or restained and imaged.
- Example 8 Restaining and reimaging steps were carried out using the process described in Example 8. Following imaging, a slide was subjected to signal destruction, staining, and imaging cycles, and the process was repeated a multiple number of times. The tissue samples were imaged using 1-9 different antibodies. After imaging with the cyanine series, the slide was optionally stained and imaged with morphological stains H&E.
- FIG. 12 shows micrographs (at 10x magnification) of Sample 18A (before dye destruction) and Sample 18B (after dye destruction). After treatment with NaOH little or no signal from Cy3 remained.
- PCNA primary antibody mouse anti-proliferating cell nuclear antigen
- FIG. 13 shows micrographs (at 10x magnification) of Sample 19A (before dye destruction) and Sample 19b (after dye destruction). After treatment with NaOH a little amount of signal from Cy3 remained.
- Sample 20A A normal breast tissue was stained with a primary antibody SmA, detected with a Cy3-conjugated donkey anti-mouse, and counter-stained with DAPI to form Sample 20A.
- Sample 20a was imaged and then treated with a NaOH solution to form Sample 20B, which was imaged again. Staining, imaging, and dye destruction steps were performed according to the procedures described herein in Examples 8 and 9.
- Sample 20B was restained with a primary antibody rabbit anti-beta catenin, and detected with a Cy3-conjugated anti-rabbit to form Sample 20C.
- Sample 20C was imaged and then counter-stained with H&E to form Sample 20D and imaged again.
- FIG. 14 shows micrographs of Sample 20A (before dye destruction) and Sample 20B (after dye destruction). After treatment with NaOH little or no signal from Cy3 remained and only DAPI was observed. Micrograph of Sample 20c showed imaging in the same Cy3 channel was possible by staining with a different antibody. Morphological information about the tissue was obtained by further staining with H&E (Sample 20D).
- Sample 21A A prostate cancer tissue was stained with a primary antibody mouse anti-pan cytokeratin clone PCK-26, and detected with a Cy3-conjugated donkey anti-mouse, to form Sample 21A.
- Sample 21A was imaged and then counterstained with DAPI to form Sample 21B.
- Sample 21B was imaged and then treated with a NaOH solution to form Sample 21C, which was imaged again. Staining, imaging, and dye destruction steps were performed according to the procedures described herein in Examples 8 and 9.
- Sample 21C was restained with a primary antibody SmA, and detected with a Cy3-conjugated anti-rabbit to form Sample 21D and imaged again.
- FIG. 15 shows micrographs of Sample 21A (Cye channel) and Sample 21B (DAPI channel) before dye destruction and Sample 21C (Cye channel) after dye destruction. After treatment with NaOH little or no signal from Cy3 remained (21C) and only DAPI was observed (not shown). Micrograph of Sample 21D showed imaging in the same Cy3 channel was possible by staining with a different antibody.
- Sample 22A A colon adenocarcinoma slide was stained with a primary antibody mouse anti-anti-pan cytokeratin clone PCK-26, and detected with a Cy3-conjugated donkey anti-mouse, to form Sample 22A.
- Sample 22A was imaged and then counterstained with DAPI to form Sample 22B.
- Sample 22B was imaged and then treated with a NaOH solution to form Sample 22C, which was imaged again. Staining, imaging, and dye destruction steps were performed according to the procedures described herein in Examples 8 and 9.
- Sample 22C was restained with a primary antibody SmA, and detected with a Cy3-conjugated anti-rabbit to form Sample 22d and imaged again.
- FIG. 16 shows micrographs of Samples 22A (Cye channel) and 22B (DAPI channel) before dye destruction) and Sample 22c after dye destruction. After treatment with NaOH little or no signal from Cy3 remained (22D) and only DAPI was observed (not shown). Micrograph of Sample 22D showed imaging in the same Cy3 channel was possible by staining with a different antibody. Nuclear information about the tissue was obtained by staining with DAPI (Sample 22B).
- sample 23A A breast tissue microarray (Sample 23A) was imaged in the DAPI and Cy3 channel to measure the autofluorescence from the tissue. Sample 23A was then stained with DAPI to form Sample 23B, imaged and then treated with NaOH to form Sample 23C, and imaged again. Sample 23A was also stained with a primary antibody mouse anti-estrogen receptor alpha clone 1D5, and detected with a Cy3-conjugated donkey anti-mouse, to form Sample 23D. Sample 23D was imaged then treated with a NaOH solution to form Sample 23E, which was imaged again. Staining, imaging, and dye destruction steps were performed according to the procedures described herein in Examples 8 and 9.
- FIG. 17 shows micrographs of Samples 23A-E. Micrographs of Samples 23C and 23Ewere compared to the autofluorescence (baseline) observed in Sample 23A. Both Samples showed signal reduction. DAPI-stained sample showed signal reduction possibly due to destruction of nucleic acids to which DAPI binds.
- Sample 24A was stained with a primary antibody mouse anti-pan cytokeratin clone PCK-26, detected visualized with a Cy3-conjugated donkey anti-mouse to form Sample 24A, and counterstained with DAPI (not shown) and imaged.
- Sample 24A was then treated with a NaOH solution to remove Cy3 signal (not shown), while retaining DAPI signal to form Sample 24B and imaged as shown in FIG. 18 at Sample 24B Staining, imaging, and dye destruction steps were performed according to the procedures described herein in Examples 8 and 9.
- Sample 24B was restained with a Cy3-directly conjugated beta catenin antibody to form Sample 24C and imaged again.
- Sample 24D was again treated with NaOH and labeled with Cy3-direct conjugated SmA antibody to form Sample 24D and imaged again.
- the images obtained were registered, pseudo colored and overlaid (Sample 24E) to give spatial information for expressing antigen.
- Sample 24D was further stained with H&E to form Sample 24F.
- FIG. 18 shows micrographs of Sample 24A (Cy3 channel before dye destruction) and Sample 24B (DAPI channel after dye destruction). After treatment with NaOH little or no signal from Cy3 remained and only DAPI was observed. Micrographs of Samples 24C and 24D showed imaging in the same Cy3 channel was possible by staining with different antibodies. Morphological information about the tissue was obtained by staining with H&E (Sample 24F).
- Samples 25B 25b-Cy3 and 25b-Cy5 respectively.
- Samples 25B 25b-Cy3 and 25b-Cy5 respectively.
- the sample was treated with a NaOH solution followed by staining-imaging-NaOH treatment-staining steps using seven Cy-directly conjugated antibodies (Samples 25C-25I).
- the antibodies used were: smooth muscle alpha actin, beta catenin, pan cadherin, Von Willebrand Factor VII, keratin 5, keratin 8/18, and e-cadherin.
- Each staining step included counterstaining with DAPI (Sample 25J).
- FIG. 19 shows micrographs of Sample 25A (Cy3 and Cy5 channels), Sample 25B (Cy3 and Cy5 channels), and Samples 25C-25J.
- FIG. 19 shows that multiple imaging in the same Cy3 channel was possible by staining with different antibodies. 12-channel multiple imaging was possible with 9 of the channels being Cy3 channels.
- EXAMPLE 18 Four channel staining and imaging of normal prostate using H 2 O 2
- Sample 26A Images were taken before staining to baseline the autofluorescence coming from each channel.
- a normal prostate slide was stained with a Cy3-directly conjugated anti-pan cadherin to form Sample 26A.
- the slide was imaged and treated with H 2 O 2 (Sample 26B), restained with Cy3-conjugated anti-vimentin (Sample 26c), treated with H 2 O 2 (Sample 26D), restained with Cy3-conjugated anti-pan cytokeratin (Sample 26E), treated with H 2 O 2 (Sample 26F), restained with Cy3-conjugated anti-SmA (Sample 26g), and treated with H 2 O 2 (Sample 26H).
- FIG. 20 shows micrographs of Samples 26A-G.
- FIG. 20 shows that multiple imaging in the same Cy3 channel was possible by staining with different antibodies and destroying the signal using H 2 O 2 .
- Sample 27A A normal prostate (Sample 27A) was imaged in the Cy3 channel to measure the autofluorescence from the tissue.
- Sample 27A was then stained with Cy3-conjugated anti-SmA to form Sample 27B, imaged and then treated with NaOH to form Sample 27C, and imaged again. Staining, imaging, and dye destruction steps were performed according to the procedures described herein in Examples 8 and 9.
- FIG. 21 shows the micrographs of Samples 27A-C. Residual stain was observed post NaOH treatment shown in sample 27C.
- FIG. 22 shows a plot of average pixel intensity of the background for each cycle in the imaging as well as a small image of what the background looked like prior to staining. A large spike in residual stain intensity was observed in cycle 4 as SmA, an abundantly expressed protein was stained in cycle 3.
- FIG. 23 shows head-to-head micrographs of SmA and pan cadherin staining and signal removal. H 2 O 2 showed more efficient dye removal for both SmA and pan cadherin when compared to NaOH.
- Example 30A and 30B Two prostate slides were stained with Cy3-directly conjugated pan cadherin (Samples 30A and 30B). Both slides were given identical pretreatment steps including antigen retrieval and the only difference was signal-destruction method; method one being with NaOH, the other with H 2 O 2 . The slides were subjected to 9 mock staining-and-signal-destruction cycles before staining with Cy3-conjugated pan-cytokeratin to produce Sample 30C and Sample 30D in FIG. 24 ..
- FIG. 24 compares staining from first cycle pan cadherin stain to the 9 th cycle of pan cytokeratin using NaOH or H 2 O 2 to destroy the signal after each staining.
- FIG. 25 compares background from after dye removal (Samples 30E and 30F) in the first cycle and after 9 cycles of NaOH or H 2 O 2 treatment (Samples 30C and 30D). H 2 O 2 (Sample 30D, FIG. 25 ) showed more efficient dye removal of pan keratin when compared to NaOH (Sample 30C, FIG 25 ) after the 9 th step
- FIG. 26 is a plot of average pixel intensities for the background of each cycle for the NaOH or H 2 O 2 slides. As the plot in Fig. 26 shows, the background for the H 2 O 2 slide was significantly less for each cycle after the initial baseline.
- Sample 31A A colon tissue slide was stained with a primary antibody rabbit anti-beta catenin and detected with a Cy3-conjugated donkey anti-rabbit secondary antibody to form Sample 31A.
- Sample 31A was imaged and then treated with a NaOH solution to form Sample 31B, which was imaged again. Staining, imaging, and dye destruction steps were performed according to the procedures described herein in Examples 8 and 9.
- Sample 31B was restained with a Cy3-conjugated anti-rabbit secondary antibody to form Sample 31C, and imaged again.
- FIG. 27 shows micrographs of Samples 31A-C.
- FIG. 27 shows that the primary antibody remains bound to the sample after NaOH treatment.
- Sample 32A A colon tissue slide was stained with a primary antibody mouse-anti-PCNA and detected with a Cy3-conjugated donkey anti-mouse secondary antibody to form Sample 32A.
- Sample 32A was imaged and then treated with a NaOH solution to form Sample 32C, which was imaged again. Staining, imaging, and dye destruction steps were performed according to the procedures described in Examples 8 and 9.
- Sample 32B was restained with a Cy3-conjugated anti-mouse secondary antibody to form Sample 32C, and imaged again.
- FIG. 28 shows that the primary antibody is still bound to the sample after treatment with NaOH.
- the antibodies used were rabbit anti- ⁇ -catenin directly conjugated to horse radish peroxidase (HRP) enzyme, mouse anti-keratin 5 and donkey anti-mouse conjugated to HRP antibody.
- HRP horse radish peroxidase
- the substrate for the HRP enzyme was Cy5-conjugated tyramide substrate.
- FIG. 29 shows a micrograph of Sample 33 after staining for ⁇ -catenin. After image acquisition, the slide was washed with PBS to prepare for signal destruction.
- EXAMPLE 25 Modification of signal, staining and imaging
- H 2 O 2 solution was used for signal destruction.
- a H 2 O 2 solution was prepared by mixing 10 mL of 0.5 M sodium carbonate (pH 10), 5 mL of 30 volume percent H 2 O 2 , and 35 mL of water.
- a slide was placed in the H 2 O 2 solution for 15 minutes with gentle agitation. After 15 minutes, the slide was washed again with PBS (Sample 34), coverslipped and imaged again to check the efficacy of the dye destruction.
- the reimaging step was carried out using the process described above in Example 24.
- FIG. 29 shows a micrograph of Sample 34 after signal modification showing substantial removal of signal after signal destruction. Sample 34 was then re-incubated with Cy5-tyramide to determine residual activity of the HRP enzyme and imaged as above.
- FIG. 29 shows a micrograph of Sample 35 and no further Cy5 and HRP enzyme is chemically inactivated by H 2 O 2 solution such that no further enzyme-substrate reaction occurs.
- Example 35 The slide (Sample 35) from Example 25 was incubated mouse anti-keratin 5 antibody. Incubation was conducted in 3 percent BSA for 45 minutes at 37 C. After incubation, the slide was subjected to an extensive series of PBS washes. The keratin 5 antibody was then detected with an HRP conjugated donkey anti-mouse antibody in BSA for 45 minutes at 37°C. The HRP-stained slide was incubated with Cy5-conjugated tyramide substrate as in Example 25. After incubation, the slide was subjected to an extensive series of PBS washes. The Cy5-restained slide (Sample 36) was counterstained with the morphological stain, DAPI, and coverslipped. The coverslipped slide was re-imaged using the process described above in Example 24.
- FIG. 29 shows a micrograph of Sample 36 after staining for k5 protein.
- Examples 27-31 illustrate embodiments of the invention according to which multiple imaging of dot blots is conducted. Multiple staining is obtained by staining, imaging, chemically destroying the fluorophore, restaining, imaging, and repeating the steps
- Target proteins ⁇ -catenin peptide (Sigma 26561-1 lot R1078-005) and CEA antigen were spotted on a polyvinylidene fluoride (PVDF) membrane at three different concentrations: 1 microgram, 100 nanograms, and 10 nanograms.
- PVDF polyvinylidene fluoride
- the blot was blocked using 5% milk, in 1xTBS-T (Tris-buffered saline Tween 20 buffer) for 1 hour at room temperature.
- a blot prepared in Example 27 was incubated with a primary antibody, rabbit anti- ⁇ -catenin antibody (Sigma, C7738). Incubation was conducted at 1:200 dilution of antibody using 1 percent milk in 1xTBS-T for 1 hour at room temperature (RT). After incubation, the blot was subjected to an extensive series of washes. The blot was then incubated with a dye-conjugated secondary antibody donkey anti-rabbit Cy5 (prepared as in Example 6) at 1:500 dilution using 1 percent milk in 1xTBS-T for 1 hour at room temperature (RT). After incubation, the blot (Sample 37) was washed with 1xTBS-T.
- a primary antibody rabbit anti- ⁇ -catenin antibody
- FIG. 30 shows an image of Sample 37. As shown in FIG. 30 , spots of variable signal intensities are observed for the three different concentrations of ⁇ -catenin target protein.
- H 2 O 2 solution was used for signal destruction.
- a H 2 O 2 solution was prepared by mixing 10 mL of 0.5M sodium carbonate (pH 10), 5 mL of 30 volume percent H 2 O 2 , and 35 mL of water.
- the blot prepared in Example 28 was placed in the H 2 O 2 solution for 15 minutes at room temperature with gentle agitation. After 15 minutes, the blot was washed three times using 1 x TBS-T for 5 minutes to form Sample 38.
- the blot (Sample 38) was reimaged and images of the blot were captured on Typhoon Imager (GE Healthcare) using Cy5 channel and a voltage setting of 450V.
- FIG. 30 shows an image of Sample 38. As shown in FIG. 30 , no spots were observed after the dye destruction step indicating substantially complete destruction of Cy5.
- the blot from Example 29 was incubated with a primary antibody mouse anti-CEA antibody. Incubation was conducted at 1:200 dilution using 1 percent milk in 1xTBS-T for 1 hour at room temperature (RT). After incubation, the blot was subjected to an extensive series of washes. The blot was then incubated with a dye-conjugated secondary antibody donkey anti-mouse Cy5 (prepared in Example 6) at 1:500 dilution using 1 percent milk in 1xTBS-T for 1 hour at room temperature (RT). After incubation, the blot (Sample 39) was subjected to an extensive series of washes.
- FIG. 30 shows an image of Sample 39. As shown in FIG. 30 , spots of variable signal intensities are observed for the three different concentrations of CEA antigen.
- the Example illustrates that two different targets may be detected using a single signal generator.
- FIG. 30 is a plot of relative signal intensities of the spots for Samples 37, 38, 39, and 40, showing that signal intensities reduce 10-fold after the dye-destruction step (Sample 38).
- Alexa 488, BODIPY FL C5 (D6184), hydroxycoumarin (H1193) were obtained from Invitrogen (Carlsbad, CA); ATTO 495, ATTO 635, and ATTO 655, were obtained from ATTO-TEC (Siegen, Germany); DY-734-NHS was obtained from Dyomics (Jena, Germany); Fluorescein cadaverine was obtained from Biotium Inc. (Hayward, CA). Goat anti-mouse IgG-Cy3 and goat anti-mouse IgG-Cy5 were obtained from Jackson ImmunoResearch Laboratories, Inc. (West Grove, PA).
- DPBS and PBS were obtained from Invitrogen; 16% PFA were obtained from Electron Microscopy Sciences (Hatfield, PA). Goat serum was obtained from Vector Laboratories (Burlingame, CA). All other reagents were obtained from Sigma (St. Louis, MO).
- LS174T cells (ATCC, CL-188) expressing carcino embryonic antigen (CEA) were cultured in EMEM (ATCC, cat# 30-2003) Supplemented with 10% FBS. Cells were incubated at 37°C and 5% CO 2 . Upon 90% confluence, they were subcultured or seeded into 96-well-plates and continued to grow for additional two days.
- Confluent cells on 96-well-plates were rinsed with DPBS (with calcium) twice, and then 2% PFA (final concentration) was added to fix cells for 10 minutes, followed by permeabilization using 0.1% Triton X-100 in PBS for 5 minutes. Next, cells were incubated in a blocking buffer (10% goat serum + 3% BSA) for 1 hour at room temperature. Mouse anti-CEA (final concentration 10 ⁇ g/ml in 3% BSA) was added immediately after the blocking step and incubated overnight.
- oxidizing agent solutions (as described in Table 1) were added to half the plate for 30 minutes, and then rinsed thoroughly with PBS.
- the oxidizing reagents employed were hydrogen peroxide, aqueous bromine, potassium permanganate, sodium dichromate, I 2 /KI solution, t-butyl peroxide, and t-butyl hydrogen peroxide.
- the other half of the plate was used as control with parallel PBS incubations and washes and no oxidizing agent solutions were applied.
- Table 1 shows the fluorescence values measured after application of the oxidizing agent to the primary antibody as shown in columns 2 (Cy3) and 4 (Cy5).
- the values in the Table are normalized fluorescence intensity, that is, a ratio of the fluorescence intensity measured for wells contacted with the oxidizing agent to the fluorescence intensity measured for the control wells (no oxidizing solution applied) multiplied by 100. Therefore, a value close to 100% means that the oxidizing solution has no effect on primary antibody when compared to its control (no oxidizing solution applied).
- Table 1 shows that some oxidizing agent (e.g. H 2 O 2 ) have almost no effect on primary antibody (P>0.1), whereas in other cases, the concentration of the oxidizing agent may be varied (e.g., for I 2 /KI) such that the primary antibody is not effected substantially.
- the bases employed NaOH and butyl amine
- PBS showed no effect on the primary antibody.
- Table 1 shows that some oxidizing agent (e.g. H 2 O 2 ) have almost no effect on primary antibody but result in substantial loss of fluorescence properties for the cyanine dye.
- the data reported in Table 1 further shows that fluorescent signal destruction worked better at high pH for H 2 O 2 solutions.
- the concentration of the oxidizing agent may be varied (e.g. for I 2 /KI) such that the primary antibody is not affected substantially but the cyanine dye is.
- the bases employed NaOH and butyl amine
- PBS showed no effect on the primary antibody and the cyanine dye.
- Optical density was used to monitor dye destruction. 10 ⁇ l of dye was mixed with equal volume of oxidizing solution and then 2 ⁇ l of the mixed solution was loaded to ND-1000 Spectrophotometer (NanoDrop Technologies, Inc. Wilmington, DE). Optical density (O.D.) was read at a full spectrum ranging from 200 nm to 750 nm. For kinetic study, measurements were taken at time 0, 5 min, 15 min, and 30 min.
- a panel of fluorescent dyes was tested for the effect of H 2 O 2 (3% H 2 O 2 at pH 10) on different fluorophores using the method described in Example 35. Absorbance spectrum was monitored over 30 minutes and the absorbance values are shown in FIG. 34 . Data shown here are O.D. values at dye's maximum absorbance wavelength normalized to O.D. at time 0. Fluorescein, which is very sensitive to photobleaching, was relatively stable to this oxidizing method. ATTO 496 and Alexa 488, were also less sensitive to the oxidizing agent when compared to other dyes. FIG. 34 shows that the dyes could be destroyed using H 2 O 2 .
- H 2 O 2 concentrations from 20x to 2000x dilution
- absorbance spectrum was monitored over 30 minutes using the method described in Example 36.
- the pH of H 2 O 2 solution was kept at 10.
- the absorbance values were compared to a control sample of a solution of QD 655 at different concentrations (from 20x to 2000x dilution).
- Qdot 655 goat F(ab')2 anti-mouse IgG conjugate (1 ⁇ M) solution was diluted 10x, 100x or 1000x with 0.775M sodium bicarbonate solution (adjusted to pH 10). To each solution an equal volume of 6% hydrogen peroxide was added. 100 ⁇ l aliquots of each in triplicates were placed in a 96 well microtitre plate. Samples without peroxide but diluted to the same final concentration with water were used as controls. A 2x diluted bicarbonate solution was used as background control. Fluorescence was measured over time on spectromax M2 plate reader using following parameters: Excitation 350 nm, Emission 655 nm and auto cut off 630 nm.
- FAM cadaverine Absorbance spectra of the fluorescein dye FAM cadaverine (“FAM-CAD") were measured using different oxidizing agent conditions for Samples 41 (FAM-CAD, H 2 O 2 and H 2 O (1:1:1), 42 (FAM-CAD, H 2 O 2 and FeCl 3 (1:1:1)), 43 (FAM-CAD, H 2 O and FeCl 3 (1:1:1)), 44 (FAM-CAD and H 2 O (1:2)).
- a solution of Fluorescein-cadaverine was mixed with 9% hydrogen peroxide and a 2% solution of FeCl 3 in water in the ratio of 1:1:1 1 by volume. Mixture was allowed to stand for 5 minutes.
- the invention may be embodied in other specific forms without departing from the spirit or essential characteristics thereof.
- the foregoing embodiments are therefore to be considered in all respects as illustrative rather than limiting on the invention described herein.
- the scope of the invention is thus indicated by the appended claims rather than by the foregoing description, and all changes that come within the meaning and range of equivalency of the claims are therefore intended to be embraced therein.
Abstract
Description
- Disclosed herein are methods for sequentially analyzing a biological sample to discern inter alia the presence, absence, concentration, and/or spatial distribution of multiple biological targets in a biological sample.
- Various methods may be used in biology and in medicine to observe different targets in a biological sample. For example, analysis of proteins in histological sections and other cytological preparations may be performed using the techniques of histochemistry, immunohistochemistry (IHC), or immunofluorescence. Analysis of proteins in biological samples may also be performed using solid-state immunoassays, for example, using the techniques of western blots.
- Many of the current techniques may detect only a few targets at one time (such as, IHC or fluorescence-based western blots where number of targets detectable is limited by the fluorescence-based detection system) in a single sample. Further analysis of targets may require use of additional biological samples from the source limiting the ability to determine relative characteristics of the targets such as the presence, absence, concentration, and/or the spatial distribution of multiple biological targets in the biological sample. Moreover, in certain instances, a limited amount of sample may be available for analysis or the individual sample may require further analysis. Thus, methods, agents, and devices capable of iteratively analyzing an individual sample are needed.
-
US 2003/073149 A1 discloses immunolabeling compositions and methods for use in the detection and measurement of one or more targets in a biological sample. -
WO 02/079771 A1 -
WO 00/20641 - The present invention provides a method of probing multiple targets in a biological sample comprising a tissue section, the method comprising:
- (a) providing a tissue section containing multiple targets
- (b) binding at least one fluorophore-labeled antibody probe to one or more targets present in the tissue section;
- (c) binding at least one control probe to one or more targets present in the tissue section;
- (d) detecting at least one signal from the at least one fluorophore-labeled antibody probe bound in step (b) and detecting at least one control signal from the at least one control probe bound in step (c);
- (e) applying to the sample in step (d) a solution comprising an oxidizing agent that selectively inactivates the fluorophore label(s) of the at least one fluorophore-labeled antibody probe and not the control probe(s);
- (f) binding at least one fluorophore-labeled antibody probe to one or more targets present in the sample after step (e); and
- (g) detecting at least one signal from the at least one fluorophore-labeled antibody probe bound in step (f).
-
-
FIG. 1 shows the absorbance spectra ofSample 1 as a function of wavelength, after 10 minutes and 15 minutes. -
FIG. 2 shows the absorbance spectra forSamples -
FIG. 3 shows the absorbance spectra ofSample 4 as a function of wavelength, after 30 minutes and 140 minutes. -
FIG. 4 shows the absorbance spectra ofSample 5 as a function of wavelength, after 20 minutes, 60 minutes, and 210 minutes. -
FIG. 5 shows the absorbance spectra ofSample 6 as a function of wavelength, after 12 minutes and 16 minutes. -
FIG. 6 shows the absorbance spectra ofSample 8 as a function of wavelength, after 22 minutes, 70 minutes, and 210 minutes. -
FIG. 7 shows the absorbance spectra of Samples 9a, 10a, and 11a as a function of wavelength. -
FIG. 8 shows the absorbance spectra of Samples 9b and 10b as a function of wavelength. -
FIG. 9 shows the absorbance spectra of Samples 12a and 12b as a function of wavelength. -
FIG. 10 shows the absorbance spectra ofSamples -
FIG. 11 shows the absorbance spectra ofSamples -
FIG. 12 shows the micrographs (at 10x magnification) ofSample 18A (before signal modification) andSample 18B (after signal modification). -
FIG. 13 shows the micrographs (at 10x magnification) ofSample 19A (before signal modification) andSample 19B (after signal modification). -
FIG. 14 shows the micrographs ofSample 20A (before signal modification) andSample 20B (after signal modification). -
FIG. 15 shows the micrographs ofSamples Sample 21C (after signal modification). -
FIG. 16 shows the micrographs ofSamples Sample 22C (after signal modification). -
FIG. 17 shows the micrographs ofSamples 23A-E. -
FIG. 18 shows the micrographs ofSample 24A (before signal modification) and Sample 24b (after signal modification). -
FIG. 19 shows the micrographs ofSample 25A (Cy3 and Cy5 channels),Sample 25B (Cy3 and Cy5 channels), andSamples 25C-25J. -
FIG. 20 shows the micrographs ofSamples 26A-H. -
FIG. 21 shows the micrographs ofSamples 27A-C. -
FIG. 22 shows the plot of average pixel intensity of the background for each cycle in the imaging in Example 20. -
FIG. 23 shows the comparison between micrographs ofSamples 28A-C and 29A-C. -
FIG. 24 shows the micrographs ofSamples 30A-D. -
FIG. 25 shows the micrographs ofSamples 30C-F. -
FIG. 26 shows the plot of average pixel intensities for the background of each cycle forSamples -
FIG. 27 shows the micrographs ofSamples -
FIG. 28 shows the micrographs ofSamples -
FIG. 29 shows the micrographs ofSamples -
FIG. 30 shows the dot blots forSamples -
FIG. 31 shows the bar chart of relative signal intensities of dots forSamples -
FIG. 32 shows the time profile of spectra of Cy3 and Cry5. -
FIG. 33 shows the Cy3 absorbance values as function of time for different H2O2 concentrations. -
FIG. 34 shows the absorbance values as function of time for different fluorophores. -
FIG. 35 shows the QD 655 absorbance values as function of time for H2O2. -
FIG. 36 shows the absorbance spectra for fluorescein using H2O2. - To more clearly and concisely describe and point out the subject matter of the claimed invention, the following definitions are provided for specific terms, which are used in the following description and the appended claims.
- The singular forms "a" "an" and "the" include plural referents unless the context clearly dictates otherwise. Approximating language, as used herein throughout the specification and claims, may be applied to modify any quantitative representation that could permissibly vary without resulting in a change in the basic function to which it is related. Accordingly, a value modified by a term such as "about" is not to be limited to the precise value specified. Unless otherwise indicated, all numbers expressing quantities of ingredients, properties such as molecular weight, reaction conditions, so forth used in the specification and claims are to be understood as being modified in all instances by the term "about." Accordingly, unless indicated to the contrary, the numerical parameters set forth in the following specification and attached claims are approximations that may vary depending upon the desired properties sought to be obtained by the present invention. At the very least each numerical parameter should at least be construed in light of the number of reported significant digits and by applying ordinary rounding techniques.
- To more clearly and concisely describe and point out the subject matter of the claimed invention, the following definitions are provided for specific terms that are used in the following description and the claims appended hereto.
- As used herein, the term "antibody" refers to an immunoglobulin that specifically binds to and is thereby defined as complementary with a particular spatial and polar organization of another molecule. The antibody may be monoclonal or polyclonal and may be prepared by techniques that are well known in the art such as immunization of a host and collection of sera (polyclonal), or by preparing continuous hybrid cell lines and collecting the secreted protein (monoclonal), or by cloning and expressing nucleotide sequences or mutagenized versions thereof, coding at least for the amino acid sequences required for specific binding of natural antibodies. Antibodies may include a complete immunoglobulin or fragment thereof, which immunoglobulins include the various classes and isotypes, such as IgA, IgD, IgE, IgG1, IgG2a, IgG2b and IgG3, IgM. Functional antibody fragments may include portions of an antibody capable of retaining binding at similar affinity to full-length antibody (for example, Fab, Fv and F(ab')2, or Fab'). In addition, aggregates, polymers, and conjugates of immunoglobulins or their fragments may be used where appropriate so long as binding affinity for a particular molecule is substantially maintained.
- As used herein, the term "binder" refers to a molecule that may bind to one or more targets in the biological sample. A binder may specifically bind to a target. Suitable binders may include one or more of natural or modified peptides, proteins (e.g., antibodies, affibodies, or aptamers), nucleic acids (e.g., polynucleotides, DNA, RNA, or aptamers); polysaccharides (e.g., lectins, sugars), lipids, enzymes, enzyme substrates or inhibitors, ligands, receptors, antigens, or haptens. A suitable binder may be selected depending on the sample to be analyzed and the targets available for detection. For example, a target in the sample may include a ligand and the binder may include a receptor or a target may include a receptor and the binder may include a ligand. Similarly, a target may include an antigen and the binder may include an antibody or antibody fragment or vice versa. In some embodiments, a target may include a nucleic acid and the binder may include a complementary nucleic acid. In some embodiments, both the target and the binder may include proteins capable of binding to each other.
- As used herein, the term "biological sample" refers to a sample obtained from a biological subject, including sample of biological tissue or fluid origin obtained in vivo or in vitro. Such samples can be, but are not limited to, body fluid (e.g., blood, blood plasma, serum, or urine), organs, tissues, fractions, and cells isolated from mammals including, humans. Biological samples also may include sections of the biological sample including tissues (e.g., sectional portions of an organ or tissue). Biological samples may also include extracts from a biological sample, for example, an antigen from a biological fluid (e.g., blood or urine).
- A biological sample may be of prokaryotic origin or eukaryotic origin (e.g., insects, protozoa, birds, fish, reptiles). In some embodiments, the biological sample is mammalian (e.g., rat, mouse, cow, dog, donkey, guinea pig, or rabbit). In certain embodiments, the biological sample is of primate origin (e.g., example, chimpanzee, or human).
- As used herein, the term "control probe" refers to an agent having a binder coupled to a signal generator or a signal generator capable of staining directly, such that the signal generator retains at least 80 percent signal after contact with a solution of an oxidizing agent employed to inactivate the fluorescent probe. A suitable signal generator in a control probe is not substantially oxidized or substantially inactivated when contacted with the oxidizing agent. Suitable examples of signal generators may include a radioactive label or a non-oxidizable fluorophore (e.g., DAPI)
- As used herein, the term "enzyme" refers to a protein molecule that can catalyze a chemical reaction of a substrate. In some embodiments, a suitable enzyme catalyzes a chemical reaction of the substrate to form a reaction product that can bind to a receptor (e.g., phenolic groups) present in the sample or a solid support to which the sample is bound. A receptor may be exogeneous (that is, a receptor extrinsically adhered to the sample or the solid-support) or endogeneous (receptors present intrinsically in the sample or the solid-support). Examples of suitable enzymes include peroxidases, oxidases, phosphatases, esterases, and glycosidases. Specific examples of suitable enzymes include horseradish peroxidase, alkaline phosphatase, -D-galactosidase, lipase, and glucose oxidase.
- As used herein, the term "enzyme substrate" refers to a chemical compound that is chemically catalyzed by an enzyme to form a reaction product. In some embodiments, the reaction product is capable of binding to a receptor present in the sample or a solid support to which the sample is bound. In some embodiments, enzyme substrates employed in the methods herein may include non-chromogenic or non-chemiluminescent substrates. A signal generator may be attached to the enzyme substrate as a label.
- As used herein, the term "fluorophore" or "fluorescent signal generator" refers to a chemical compound, which when excited by exposure to a particular wavelength of light, emits light at a different wavelength. Fluorophores may be described in terms of their emission profile, or "color." Green fluorophores (for example Cy3, FITC, and Oregon Green) may be characterized by their emission at wavelengths generally in the range of 515-540 nanometers. Red fluorophores (for example Texas Red, Cy5, and tetramethylrhodamine) may be characterized by their emission at wavelengths generally in the range of 590-690 nanometers. Examples of fluorophores include, but are not limited to, 4-acetamido-4'-isothiocyanatostilbene-2,2'disulfonic acid, acridine, derivatives of acridine and acridine isothiocyanate, 5-(2'-aminoethyl)aminonaphthalene-1-sulfonic acid (EDANS), 4-amino-N-[3-vinylsulfonyl)phenyl]naphthalimide-3,5 disulfonate (Lucifer Yellow VS), N-(4-anilino-1-naphthyl)maleimide, anthranilamide, Brilliant Yellow, coumarin, coumarin derivatives, 7-amino-4-methylcoumarin (AMC, Coumarin 120), 7-amino-trifluoromethylcouluarin (Coumaran 151), cyanosine; 4',6-diaminidino-2-phenylindole (DAPI), 5',5"-dibromopyrogallol-sulfonephthalein (Bromopyrogallol Red), 7-diethylamino-3-(4'-isothiocyanatophenyl)4-methylcoumarin, -, 4,4'-diisothiocyanatodihydro-stilbene-2,2'-disulfonic acid, 4, 4'-diisothiocyanatostilbene-2,2'-disulfonic acid, 5-[dimethylamino]naphthalene-1-sulfonyl chloride (DNS, dansyl chloride), eosin, derivatives of eosin such as eosin isothiocyanate, erythrosine, derivatives of erythrosine such as erythrosine B and erythrosin isothiocyanate; ethidium; fluorescein and derivatives such as 5-carboxyfluorescein (FAM), 5-(4,6-dichlorotriazin-2-yl) aminofluorescein (DTAF), 2'7'-dimethoxy-4'5'-dichloro-6-carboxyfluorescein (JOE), fluorescein, fluorescein isothiocyanate (FITC), QFITC (XRITC); fluorescamine derivative (fluorescent upon reaction with amines); IR144; IR1446; Malachite Green isothiocyanate; 4-methylumbelliferone; ortho cresolphthalein; nitrotyrosine; pararosaniline; Phenol Red, B-phycoerythrin; o-phthaldialdehyde derivative (fluorescent upon reaction with amines); pyrene and derivatives such as pyrene, pyrene butyrate and succinimidyl 1-pyrene butyrate; Reactive Red 4 (Cibacron .RTM. Brilliant Red 3B-A), rhodamine and derivatives such as 6-carboxy-X-rhodamine (ROX), 6-carboxyrhodamine (R6G), lissamine rhodamine B sulfonyl chloride, rhodamine (Rhod), rhodamine B, rhodamine 123, rhodamine X isothiocyanate, sulforhodamine B, sulforhodamine 101 and sulfonyl chloride derivative of sulforhodamine 101 (Texas Red); N,N,N',N'-tetramethyl-6-carboxyrhodamine (TAMRA); tetramethyl Rhodamine, tetramethyl rhodamine isothiocyanate (TRITC); riboflavin; rosolic acid and lathanide chelate derivatives, quantum dots, cyanines, pyrelium dyes, and squaraines.
- As used herein, the term "in situ" generally refers to an event occurring in the original location, for example, in intact organ or tissue or in a representative segment of an organ or tissue. In some embodiments, in situ analysis of targets may be performed on cells derived from a variety of sources, including an organism, an organ, tissue sample, or a cell culture. In situ analysis provides contextual information that may be lost when the target is removed from its site of origin. Accordingly, in situ analysis of targets describes analysis of target-bound probe located within a whole cell or a tissue sample, whether the cell membrane is fully intact or partially intact where target-bound probe remains within the cell. Furthermore, the methods disclosed herein may be employed to analyze targets in situ in cell or tissue samples that are fixed or unfixed.
- As used herein, the term "peroxidase" refers to an enzyme class that catalyzes an oxidation reaction of an enzyme substrate along with an electron donor Examples of peroxidase enzymes include horseradish peroxidase, cytochrome C peroxidase, glutathione peroxidase, microperoxidase, myeloperoxidase, lactoperoxidase, or soybean peroxidase.
- As used herein, the term "peroxidase substrate" refers to a chemical compound that is chemically catalyzed by peroxidase to form a reaction product. In some embodiments, peroxidase substrates employed in the methods herein may include non-chromogenic or non-chemiluminescent substrates. A fluorescent signal generator may be attached to the peroxidase substrate as a label.
- As used herein, the term "probe" refers to an agent having a binder and a label, such as a signal generator or an enzyme. In some embodiments, the binder and the label (signal generator or the enzyme) are embodied in a single entity. The binder and the label may be attached directly (e.g., via a fluorescent molecule incorporated into the binder) or indirectly (e.g., through a linker, which may include a cleavage site) and applied to the biological sample in a single step. In alternative embodiments, the binder and the label are embodied in discrete entities (e.g., a primary antibody capable of binding a target and an enzyme or a signal generator-labeled secondary antibody capable of binding the primary antibody). When the binder and the label (signal generator or the enzyme) are separate entities they may be applied to a biological sample in a single step or multiple steps. As used herein, the term "fluorescent probe" refers to an agent having a binder coupled to a fluorescent signal generator.
- As used herein, the term "signal generator" refers to a molecule capable of providing a detectable signal using one or more detection techniques (e.g., spectrometry, calorimetry, spectroscopy, or visual inspection). Suitable examples of a detectable signal may include an optical signal, and electrical signal, or a radioactive signal. Examples of signal generators include one or more of a chromophore, a fluorophore, a Raman-active tag, or a radioactive label. As stated above, with regard to the probe, the signal generator and the binder may be present in a single entity (e.g., a target binding protein with a fluorescent label) in some embodiments. Alternatively, the binder and the signal generator may be discrete entities (e.g., a receptor protein and a labeled-antibody against that particular receptor protein) that associate with each other before or upon introduction to the sample.
- As used herein, the term "solid support" refers to an article on which targets present in the biological sample may be immobilized and subsequently detected by the methods disclosed herein. Targets may be immobilized on the solid support by physical adsorption, by covalent bond formation, or by combinations thereof. A solid support may include a polymeric, a glass, or a metallic material. Examples of solid supports include a membrane, a microtiter plate, a bead, a filter, a test strip, a slide, a cover slip, and a test tube.
- As used herein, the term "specific binding" refers to the specific recognition of one of two different molecules for the other compared to substantially less recognition of other molecules. The molecules may have areas on their surfaces or in cavities giving rise to specific recognition between the two molecules arising from one or more of electrostatic interactions, hydrogen bonding, or hydrophobic interactions. Specific binding examples include, but are not limited to, antibody-antigen interactions, enzyme-substrate interactions, polynucleotide interactions, and the like. In some embodiments, a binder molecule may have an intrinsic equilibrium association constant (KA) for the target no lower than about 105 M-1 under ambient conditions such as a pH of about 6 to about 8 and temperature ranging from about 0°C to about 37°C.
- As used herein, the term "target," refers to the component of a biological sample that may be detected when present in the biological sample. The target may be any substance for which there exists a naturally occurring specific binder (e.g., an antibody), or for which a specific binder may be prepared (e.g., a small molecule binder or an aptamer). In general, a binder may bind to a target through one or more discrete chemical moieties of the target or a three-dimensional structural component of the target (e.g., 3D structures resulting from peptide folding). The target may include one or more of natural or modified peptides, proteins (e.g., antibodies, affibodies, or aptamers), nucleic acids (e.g., polynucleotides, DNA, RNA, or aptamers); polysaccharides (e.g., lectins or sugars), lipids, enzymes, enzyme substrates, ligands, receptors, antigens, or haptens. In some embodiments, targets may include proteins or nucleic acids.
- The invention includes embodiments that relate generally to methods applicable in analytical, diagnostic, or prognostic applications such as analyte detection, histochemistry, immunohistochemistry, or immunofluorescence. In some embodiments, the methods disclosed herein may be particularly applicable in histochemistry, immunostaining, immunohistochemistry, immunoassays, or immunofluorescence.
- The disclosed methods relate generally to detection of multiple targets in a single biological sample. In some embodiments, methods of detecting multiple targets in a single biological sample using the same detection channel are disclosed. The targets may be present on the surface of histological sections, or on the surface of solid supports (such as glass slides).
- The methods disclosed herein may allow detection of a plurality of targets in the same biological sample with little or no effect on the integrity of the biological sample. Detecting the targets in the same biological sample may further provide spatial information about the targets in the biological sample. Methods disclosed herein may also be applicable in analytical applications where a limited amount of biological sample may be available for analysis and the same sample may have to be processed for multiple analyses. Methods disclosed herein may also facilitate multiple analyses of solid-state samples (e.g., tissue sections) or samples adhered to a solid support (e.g., blots) without substantially stripping the probes and the targets. Furthermore, the same detection channel may be employed for detection of different targets in the sample, enabling fewer chemistry requirements for analyses of multiple targets. The methods may further facilitate analyses based on detection methods that may be limited in the number of simultaneously detectable targets because of limitations of resolvable signals. For example, using fluorescent-based detection, the number of targets that may be simultaneously detected may be limited to about four as only about four fluorescent signals may be resolvable based on their excitation and emission wavelength properties. In some embodiments, the methods disclosed herein may allow detection of greater than four targets using fluorescent-based detection system.
- In some embodiments, the method of detecting multiple targets in a biological sample includes sequential detection of targets in the biological sample. The method generally includes the steps of detecting a first target in the biological sample, modifying the signal from the first target using a chemical agent comprising an oxidizing agent, and detecting a second target in the biological sample. The method may further include repeating the step of modification of signal from the second target followed by detecting a third target in the biological sample, and so forth.
- In some embodiments, the method includes the steps of contacting a biological sample with a first antibody probe and physically binding a first antibody probe to a first target. The method further includes observing a first signal from the first probe. An oxidizing agent is applied to the probe to modify the first signal. The method further includes contacting the biological sample with a second antibody probe and physically binding the second antibody probe to a second target in the biological sample followed by observing a second signal from the second probe.
- In yet other embodiments, the method includes the steps of providing a biological sample containing multiple targets adhered to a solid support and binding at least one fluorescent probe to one or more target present in the sample. The method further includes observing a signal from the bound fluorescent probe. The bound fluorescent probe is oxidized with an oxidizing agent that substantially inactivates the fluorescent probe. The method further includes binding at least one subsequent fluorescent probe to one or more target present in the sample followed by observing a signal from the subsequent bound fluorescent probe.
- In yet other embodiments, the method includes the steps of providing a biological sample containing multiple targets adhered to a solid support and binding at least one fluorescent antibody probe to one or more target present in the sample. The method further includes binding at least one control probe to one or more target in the sample. The method further includes observing a signal from the bound fluorescent antibody probe and a control signal from the control probe. The bound fluorescent probe is oxidized with an oxidizing agent that substantially inactivates the fluorescent probe and not the control probe. The method further includes binding at least one subsequent fluorescent probe to one or more target present in the sample followed by observing a signal from the subsequent bound fluorescent probe.
- A biological sample in accordance with one embodiment of the invention may be solid. Suitable examples of biological samples include solid tissue sections. In some embodiments, the biological sample may be analyzed as is, that is, without harvest and/or isolation of the target of interest. In an alternate embodiment, harvest and isolation of targets may be performed prior to analysis. In some embodiments, the methods disclosed herein may be particularly suitable for invitro analysis of biological samples.
- A biological sample may include any of the aforementioned samples regardless of their physical condition, such as, but not limited to, being frozen or stained or otherwise treated. In some embodiments, a biological sample may include compounds which are not naturally intermixed with the sample in nature such as preservatives, anticoagulants, buffers, fixatives, nutrients, antibiotics, or the like.
- The biological sample includes a tissue sample. In some embodiments, a biological sample essentially includes a tissue sample. A tissue sample may include a collection of similar cells obtained from a tissue of a biological subject that may have a similar function. In some embodiments, a tissue sample may include a collection of similar cells obtained from a tissue of a human. Suitable examples of human tissues include, but are not limited to, (1) epithelium; (2) the connective tissues, including blood vessels, bone and cartilage; (3) muscle tissue; and (4) nerve tissue. The source of the tissue sample may be solid tissue obtained from a fresh, frozen and/or preserved organ or tissue sample or biopsy.
- In some embodiments, a biological sample includes tissue sections from healthy or diseases tissue samples (e.g., tissue section from colon, breast tissue, prostate). A tissue section may include a single part or piece of a tissue sample, for example, a thin slice of tissue or cells cut from a tissue sample. In some embodiments, multiple sections of tissue samples may be taken and subjected to analysis, provided the methods disclosed herein may be used for analysis of the same section of the tissue sample with respect to at least two different targets (at morphological or molecular level). In some embodiments, the same section of tissue sample may be analyzed with respect to at least four different targets (at morphological or molecular level). In some embodiments, the same section of tissue sample may be analyzed with respect to greater than four different targets (at morphological or molecular level). In some embodiments, the same section of tissue sample may be analyzed at both morphological and molecular levels.
- A tissue section, if employed as a biological sample may have a thickness in a range that is less than about 100 micrometers, in a range that is less than about 50 micrometers, in a range that is less than about 25 micrometers, or in range that is less than about 10 micrometers.
- In some embodiments, a biological sample or the targets in the biological sample may be adhered to a solid support. A solid support may include microarrays, glass slides or ELISA plates. In some embodiments, a biological sample or the targets in the biological sample may be adhered to a membrane selected from nylon, nitrocellulose, and polyvinylidene difluoride. In some embodiments, the solid support may include a plastic surface selected from polystyrene, polycarbonate, and polypropylene.
- A target may be present on the surface of a biological sample (for example, an antigen on a surface of a tissue section). In some embodiments, a target may not be inherently present on the surface of a biological sample and the biological sample may have to be processed to make the target available on the surface (e.g., antigen recovery, enzymatic digestion, epitope retrieval, or blocking).
- In some embodiments, the target may be fixed in a tissue, either on a cell surface, or within a cell.
- Suitability of targets to be analyzed may be determined by the type and nature of analysis required for the biological sample. In some embodiments, a target may provide information about the presence or absence of an analyte in the biological sample. In another embodiment, a target may provide information on a state of a biological sample. For example, if the biological sample includes a tissue sample, the methods disclosed herein may be used to detect targets that may help in comparing different types of cells or tissues, comparing different developmental stages, detecting the presence of a disease or abnormality, or determining the type of disease or abnormality.
- Targets may include one or more of peptides, proteins (e.g., antibodies, affibodies, or aptamers), nucleic acids (e.g., polynucleotides, DNA, RNA, or aptamers); polysaccharides (e.g., lectins or sugars), lipids, enzymes, enzyme substrates, ligands, receptors, antigens, or haptens. In some embodiments, targets may essentially include proteins or nucleic acids. One or more of the aforementioned targets may be characteristic of particular cells, while other targets may be associated with a particular disease or condition. In some embodiments, targets that may be detected and analyzed using the methods disclosed herein may include, but are not limited to, prognostic targets, hormone or hormone receptor targets, lymphoid targets, tumor targets, cell cycle associated targets, neural tissue and tumor targets, or cluster differentiation targets
- Suitable examples of prognostic targets may include enzymatic targets such as galactosyl transferase II, neuron specific enolase, proton ATPase-2, or acid phosphatase.
- Suitable examples of hormone or hormone receptor targets may include human chorionic gonadotropin (HCG), adrenocorticotropic hormone, carcinoembryonic antigen (CEA), prostate-specific antigen (PSA), estrogen receptor, progesterone receptor, androgen receptor, gC1q-R/p33 complement receptor, IL-2 receptor, p75 neurotrophin receptor, PTH receptor, thyroid hormone receptor, or insulin receptor.
- Suitable examples of lymphoid targets may include alpha-1-antichymotrypsin, alpha-1-antitrypsin, B cell target, bcl-2, bcl-6,
B lymphocyte antigen 36 kD, BM1 (myeloid target), BM2 (myeloid target), galectin-3, granzyme B, HLA class I Antigen, HLA class II (DP) antigen, HLA class II (DQ) antigen, HLA class II (DR) antigen, human neutrophil defensins, immunoglobulin A, immunoglobulin D, immunoglobulin G, immunoglobulin M, kappa light chain, kappa light chain, lambda light chain, lymphocyte/histocyte antigen, macrophage target, muramidase (lysozyme), p80 anaplastic lymphoma kinase, plasma cell target, secretory leukocyte protease inhibitor, T cell antigen receptor (JOVI 1), T cell antigen receptor (JOVI 3), terminal deoxynucleotidyl transferase, or unclustered B cell target. - Suitable examples of tumour targets may include alpha fetoprotein, apolipoprotein D, BAG-1 (RAP46 protein), CA19-9 (sialyl lewisa), CA50 (carcinoma associated mucin antigen), CA125 (ovarian cancer antigen), CA242 (tumour associated mucin antigen), chromogranin A, clusterin (apolipoprotein J), epithelial membrane antigen, epithelial-related antigen, epithelial specific antigen, gross cystic disease fluid protein-15, hepatocyte specific antigen, heregulin, human gastric mucin, human milk fat globule, MAGE-1, matrix metalloproteinases, melan A, melanoma target (HMB45), mesothelin, metallothionein, microphthalmia transcription factor (MITF), Muc-1 core glycoprotein. Muc-1 glycoprotein, Muc-2 glycoprotein, Muc-5AC glycoprotein, Muc-6 glycoprotein, myeloperoxidase, Myf-3 (Rhabdomyosarcoma target), Myf-4 (Rhabdomyosarcoma target), MyoD1 (Rhabdomyosarcoma target), myoglobin, nm23 protein, placental alkaline phosphatase, prealbumin, prostate specific antigen, prostatic acid phosphatase, prostatic inhibin peptide, PTEN, renal cell carcinoma target, small intestinal mucinous antigen, tetranectin, thyroid transcription factor-1, tissue inhibitor of
matrix metalloproteinase 1, tissue inhibitor ofmatrix metalloproteinase 2, tyrosinase, tyrosinase-related protein-1, villin, or von Willebrand factor. - Suitable Examples of cell cycle associated targets may include apoptosis protease activating factor-1, bcl-w , bcl-x, bromodeoxyuridine, CAK (cdk-activating kinase), cellular apoptosis susceptibility protein (CAS),
caspase 2,caspase 8, CPP32 (caspase-3), CPP32 (caspase-3), cyclin dependent kinases, cyclin A, cyclin B1, cyclin D1, cyclin D2, cyclin D3, cyclin E, cyclin G, DNA fragmentation factor (N-terminus), Fas (CD95), Fas-associated death domain protein, Fas ligand, Fen-1, IPO-38, Mcl-1, minichromosome maintenance proteins, mismatch repair protein (MSH2), poly (ADP-Ribose) polymerase, proliferating cell nuclear antigen, p16 protein, p27 protein, p34cdc2, p57 protein (Kip2), p105 protein,Stat 1 alpha, topoisomerase I, topoisomerase II alpha, topoisomerase III alpha, or topoisomerase II beta. - Suitable examples of neural tissue and tumor targets may include alpha B crystallin, alpha-internexin, alpha synuclein, amyloid precursor protein, beta amyloid, calbindin, choline acetyltransferase, excitatory
amino acid transporter 1, GAP43, glial fibrillary acidic protein,glutamate receptor 2, myelin basic protein, nerve growth factor receptor (gp75), neuroblastoma target, neurofilament 68 kD, neurofilament 160 kD, neurofilament 200 kD, neuron specific enolase, nicotinic acetylcholine receptor alpha4, nicotinic acetylcholine receptor beta2, peripherin,protein gene product 9, S-100 protein, serotonin, SNAP-25, synapsin I, synaptophysin, tau, tryptophan hydroxylase, tyrosine hydroxylase, or ubiquitin. - Suitable examples of cluster differentiation targets may include CD1a, CD1b, CD1 c, CD1d, CD1e, CD2, CD3delta, CD3epsilon, CD3gamma, CD4, CD5, CD6, CD7, CD8alpha, CD8beta, CD9, CD10, CD11a, CD11b, CD11c, CDw12, CD13, CD14, Cod15, CD15s, CD16a, CD16b, CDw17, CD18, CD19, CD20, CD21, CD22, CD23, CD24, CD25, CD26, CD27, CD28, CD29, CD30, CD31, CD32, CD33, CD34, CD35, CD36, CD37, CD38, CD39, CD40, CD41, CD42a, CD42b, CD42c, CD42d, CD43, CD44, CD44R, CD45, CD46, CD47, CD48, CD49a, CD49b, CD49c, CD49d, CD49e, CD49f, CD50, CD51, CD52, CD53, CD54, CD55, CD56, CD57, CD58, CD59, CDw60, CD61, CD62E, CD62L, CD62P, CD63, CD64, CD65, CD65s, CD66a, CD66b, CD66c, CD66d, CD66e, CD66f, CD68, CD69, CD70, CD71, CD72, CD73, CD74, CDw75, CDw76, CD77, CD79a, CD79b, CD80, CD81, CD82, CD83, CD84, CD85, CD86, CD87, CD88, CD89, CD90, CD91, CDw92, CDw93, CD94, CD95, CD96, CD97, CD98, CD99, CD100, CD101, CD102, CD103, CD104, CD105, CD106, CD107a, CD107b, CDw108, CD109, CD114, CD115, CD116, CD117, CDw119, CD120a, CD120b, CD121a, CDw121b, CD122, CD123, CD124, CDw125, CD126, CD127, CDw128a, CDw128b, CD130, CDw131, CD132, CD134, CD135, Cow136 CDw137, CD138, CD139, CD140a, CD140b, CD141, CD142, CD143, CD144, CDw145, CD146, CD147, CD148, CDw149, CDw150, CD151, CD152, CD153, CD154, CD155, CD156, CD157, CD158a, CD158b, CD161, CD162, CD163, CD164, CD165, CD166, and TCR-zeta.
- Other suitable prognostic targets may include centromere protein-F (CENP-F), giantin, involucrin, lamin A&C (XB 10), LAP-70, mucin, nuclear pore complex proteins, p180 lamellar body protein, ran, r, cathepsin D, Ps2 protein, Her2-neu, P53, S100, epithelial target antigen (EMA), TdT, MB2, MB3, PCNA, or Ki67.
- In some embodiments, a binder (antibody) and a label (signal generator which is a fluorescent probe) may be coupled to each other directly (that is without any linkers). In other embodiments, a binder and a label may be coupled to each other via a linker. As used herein, "coupled" generally refers to two entities (for example, binder and signal generator) stably bound to one another by any physicochemical means. The nature of the coupling may be such that it does not substantially impair the effectiveness of either entity. A binder and a label may be coupled to each other through covalent or non-covalent interactions. Non-covalent interactions may include, but are not limited to, hydrophobic interactions, ionic interactions, hydrogen-bond interactions, high affinity interactions (such as, biotin-avidin or biotin-streptavidin complexation), or other affinity interactions.
A linker may include a form of linking structure or sequence formed due to the non-covalent or covalent bond formation. In some embodiments, the linker may be chemically stable, that is, may maintain its integrity in the presence of a chemical agent. In some embodiments, the linker may be susceptible to chemical agents that is may be capable of dissociating, cleaving, or hydrolyzing in the presence of a chemical agent. Suitable examples of linkers may include disulfide bonds (e.g., SPDP or SMPT), pH sensitive structures/sequences, structures/sequences that may be reduced in the presence of an reducing agent, structures/sequences that may be oxidized in the presence of an oxidizing agent, or any other chemical or physical bond that may be easily manipulated (dissociated, cleaved, or hydrolyzed) in the presence of a chemical agent. - In some embodiments, a binder and a label may be chemically linked to each other through functional groups capable of reacting and forming a linkage under suitable conditions. Suitable examples of functional group combinations may include, but are not limited to, amine ester and amines or anilines; acyl azide and amines or anilines; acyl halides and amines, anilines, alcohols, or phenols; acyl nitrile and alcohols or phenols; aldehyde and amines or anilines; alkyl halide and amines, anilines, alcohols, phenols or thiols; alkyl sulfonate and thiols, alcohols or phenols; anhydride and alcohols, phenols, amines or anilines; aryl halide and thiols; aziridine and thiols or thioethers; carboxylic acid and amines, anilines, alcohols or alkyl halides; diazoalkane and carboxylic acids; epoxide and thiols; haloacetamide and thiols; halotriazin and amines, anilines or phenols; hydrazine and aldehydes or ketones; hydroxyamine and aldehydes or ketones; imido ester and amines or anilines; isocyanate and amines or anilines; and isothiocyanate and amines or anilines. A functional group in one of the aforementioned functional group pair may be present in a binder and a corresponding functional group may be present in the signal generator or the enzyme. For example, a binder may include a carboxylic acid and the signal generator or the enzyme may include an amine, aniline, alcohol or acyl halide, or vice versa. Conjugation between the binder and the signal generator or the enzyme may be effected in this case by formation of an amide or an ester linkage.
- In some embodiments, the binder and the label are embodied in a single entity. In alternative embodiments, the binder and the label are embodied in discrete entities (e.g., a primary antibody capable of binding a target and a signal generator-labeled secondary antibody capable of binding the primary antibody or a hapten labeled primary antibody capable of binding a target and a signal generator-labeled anti-hapten antibody capable of binding the hapten labeled primary antibody). When the binder and the signal generator are separate entities they may be applied to a biological sample in a single step or multiple steps. In some embodiments, the binder and the label are separate entities that are pre-attached before application to the biological sample and applied to the biological sample in a single step. In yet other embodiments, the binder and the label are separate entities that are applied to the biological sample independently and combine following application.
- The methods disclosed herein involve the use of binders (antibodies) that physically bind to the target in a specific manner. In some embodiments, a binder may bind to a target with sufficient specificity, that is, a binder may bind to a target with greater affinity than it does to any other molecule. In some embodiments, the binder may bind to other molecules, but the binding may be such that the non-specific binding may be at or near background levels. In some embodiments, the affinity of the binder for the target of interest may be in a range that is at least 2-fold, at least 5-fold, at least 10-fold, or more than its affinity for other molecules. In some embodiments, binders with the greatest differential affinity may be employed, although they may not be those with the greatest affinity for the target.
In some embodiments, binding between the target and the binder may be affected by physical binding. Physical binding may include binding effected using non-covalent interactions. Non-covalent interactions may include, but are not limited to, hydrophobic interactions, ionic interactions, hydrogen-bond interactions, or affinity interactions. In some embodiments, the target and the binder may have areas on their surfaces or in cavities giving rise to specific recognition between the two resulting in physical binding. In some embodiments, a binder may bind to a biological target based on the reciprocal fit of a portion of their molecular shapes. - Binders and their corresponding targets may be considered as binding pairs, of which non-limiting examples include immune-type binding-pairs, such as, antigen/antibody or antigen/antibody fragment.
- In some embodiments, the binder may be a sequence-or structure-specific binder, wherein the sequence or structure of a target recognized and bound by the binder may be sufficiently unique to that target.
- In some embodiments, the binder may be structure-specific and may recognize a primary, secondary, or tertiary structure of a target. A primary structure of a target may include specification of its atomic composition and the chemical bonds connecting those atoms (including stereochemistry), for example, the type and nature of linear arrangement of amino acids in a protein. A secondary structure of a target may refer to the general three-dimensional form of segments of biomolecules, for example, for a protein a secondary structure may refer to the folding of the peptide "backbone" chain into various conformations that may result in distant amino acids being brought into proximity with each other. Suitable examples of secondary structures may include, but are not limited to, alpha helices, beta pleated sheets, or random coils. A tertiary structure of a target may be is its overall three dimensional structure. A quaternary structure of a target may be the structure formed by its noncovalent interaction with one or more other targets or macromolecules (such as protein interactions). An example of a quaternary structure may be the structure formed by the four-globin protein subunits to make hemoglobin. A binder in accordance with the embodiments of the invention may be specific for any of the afore-mentioned structures.
- An example of a structure-specific binder may include a protein-specific molecule that may bind to a protein target. Examples of suitable protein-specific molecules include antibodies and antibody fragments.
- In the present invention, the target includes an antigen and a binder includes an antibody. A suitable antibody may include monoclonal antibodies, polyclonal antibodies, multispecific antibodies (for example, bispecific antibodies), or antibody fragments so long as they bind specifically to a target antigen.
- The biological sample includes a tissue sample and the methods disclosed herein may be employed in immunohistochemistry (IHC). Immunochemistry may involve binding of a target antigen to an antibody-based binder to provide information about the tissues or cells (for example, diseased versus normal cells). Examples of antibodies (and the corresponding diseases/disease cells) suitable as binders for methods disclosed herein include, but are not limited to, anti-estrogen receptor antibody (breast cancer), anti-progesterone receptor antibody (breast cancer), anti-p53 antibody (multiple cancers), anti-Her-2/neu antibody (multiple cancers), anti-EGFR antibody (epidermal growth factor, multiple cancers), anti-cathepsin D antibody (breast and other cancers), anti-Bcl-2 antibody (apoptotic cells), anti-E-cadherin antibody, anti-CA125 antibody (ovarian and other cancers), anti-CA15-3 antibody (breast cancer), anti-CA19-antibody (colon cancer), anti-c-erbB-2 antibody, anti-P-glycoprotein antibody (MDR, multi-drug resistance), anti-CEA antibody (carcinoembryonic antigen), anti-retinoblastoma protein (Rb) antibody, anti-ras oneoprotein (p21) antibody, anti-Lewis X (also called CD15) antibody, anti-Ki-67 antibody (cellular proliferation), anti-PCNA (multiple cancers) antibody, anti-CD3 antibody (T-cells), anti-CD4 antibody (helper T cells), anti-CD5 antibody (T cells), anti-CD7 antibody (thymocytes, immature T cells, NK killer cells), anti-CD8 antibody (suppressor T cells), anti-CD9/p24 antibody (ALL), anti-CD10 (also called CALLA) antibody (common acute lymphoblasic leukemia), anti-CD11c antibody (Monocytes, granulocytes, AML), anti-CD13 antibody (myelomonocytic cells, AML), anti-CD14 antibody (mature monocytes, granulocytes), anti-CD 15 antibody (Hodgkin's disease), anti-CD19 antibody (B cells), anti-CD20 antibody (B cells), anti-CD22 antibody (B cells), anti-CD23 antibody (activated B cells, CLL), anti-CD30 antibody (activated T and B cells, Hodgkin's disease), anti-CD31 antibody (angiogenesis marker), anti-CD33 antibody (myeloid cells, AML), anti-CD34 antibody (endothelial stem cells, stromal tumors), anti-CD35 antibody (dendritic cells), anti-CD38 antibody (plasma cells, activated T, B, and myeloid cells), anti-CD41 antibody (platelets, megakaryocytes), anti-LCA/CD45 antibody (leukocyte common antigen), anti-CD45RO antibody (helper, inducer T cells), anti-CD45RA antibody (B cells), anti-CD39, CD100 antibody, anti-CD95/Fas antibody (apoptosis), anti-CD99 antibody (Ewings Sarcoma marker, MIC2 gene product), anti-CD106 antibody (VCAM-1; activated endothelial cells), anti-ubiquitin antibody (Alzheimer's disease), anti-CD71 (transferrin receptor) antibody, anti-c-myc (oncoprotein and a hapten) antibody, anti-cytokeratins (transferrin receptor) antibody, anti-vimentins (endothelial cells) antibody (B and T cells), anti-HPV proteins (human papillomavirus) antibody, anti-kappa light chains antibody (B cell), anti-lambda light chains antibody (B cell), anti-melanosomes (HMB45) antibody (melanoma), antiprostate specific antigen (PSA) antibody (prostate cancer), anti-S-100 antibody (melanoma, salvary, glial cells), anti-tau antigen antibody (Alzheimer's disease), antifibrin antibody (epithelial cells), anti-keratins antibody, anti-cytokeratin antibody (tumor), anti-alpha-catenin (cell membrane), or anti-Tn-antigen antibody (colon carcinoma, adenocarcinomas, and pancreatic cancer).
- Other specific examples of suitable antibodies may include, but are not limited to, anti proliferating cell nuclear antigen, clone pc10 (Sigma Aldrich, P8825); anti smooth muscle alpha actin (SmA), clone 1A4 (Sigma, A2547); rabbit anti beta catenin (Sigma, C 2206); mouse anti pan cytokeratin, clone PCK-26 (Sigma, C1801); mouse anti estrogen receptor alpha, clone 1D5 (DAKO, M 7047); beta catenin antibody, clone 15B8 (Sigma, C 7738); goat anti vimentin (Sigma, V4630); cycle androgen receptor clone AR441 (DAKO, M3562);
Von Willebrand Factor 7,keratin 5,keratin 8/18, e-cadherin, Her2/neu, Estrogen receptor, p53, progesterone receptor, beta catenin; donkey anti-mouse (Jackson Immunoresearch, 715-166-150); or donkey anti rabbit (Jackson Immunoresearch, 711-166-152). - In some embodiments, a tissue sample may be subjected to in situ hybridization in addition to immunohistochemistry (IHC) to obtain desired information from the sample.
- Regardless of the type of binder and the target, the specificity of binding between the binder and the target may also be affected depending on the binding conditions (for example, hybridization conditions in case of complementary nucleic acids). Suitable binding conditions may be realized by modulation one or more of pH, temperature, or salt concentration.
- A binder may be intrinsically labeled (signal generator attached during synthesis of binder) or extrinsically labeled (signal generator attached during a later step). For example for a protein-based binder, an intrinsically labeled binder may be prepared by employing labeled amino acids. In some embodiments, a binder may be synthesized in a manner such that signal generators may be incorporated at a later stage. For example, this latter labeling may be accomplished by chemical means by the introduction of active amino or thiol groups into peptide chains. In some embodiments, a binder such a protein (for example, an antibody) may be directly chemically labeled using appropriate chemistries.
- In some embodiments, combinations of binders may be used that may provide greater specificity or in certain embodiments amplification of the signal. Thus, in some embodiments, a sandwich of binders may be used, where the first binder may bind to the target and serve to provide for secondary binding, where the secondary binder may or may not include a label, which may further provide for tertiary binding (if required) where the tertiary binding member may include a label.
- Suitable examples of binder combinations may include a primary antibody-secondary antibody. Some specific examples of suitable binder pairs may include mouse anti-myc for recombinant expressed proteins with c-myc epitope; mouse anti-HisG for recombinant protein with His-Tag epitope, mouse anti-xpress for recombinant protein with epitope- tag, rabbit anti-goat for goat IgG primary molecules; mouse anti-thio for thioredoxin fusion proteins, or rabbit anti-GFP for fusion protein.
- In some embodiments, a combination of a primary antibody and a secondary antibody may be used as a binder. A primary antibody may be capable of binding to a specific region of the target and the secondary antibody may be capable of binding to the primary antibody. A secondary antibody may be attached to a signal generator before binding to the primary antibody or may be capable of binding to a signal generator at a later step. In an alternate embodiment, a primary antibody and specific binding ligand-receptor pairs (such as biotin-streptavidin) may be used. The primary antibody may be attached to one member of the pair (for example biotin) and the other member (for example streptavidin) may be labeled with a signal generator. The secondary antibody may be each independently labeled with a signal generator or an enzyme.
- In some embodiments, the methods disclosed herein may be employed in an immunostaining procedure, and a primary antibody may be used to specifically bind the target protein. A secondary antibody may be used to specifically bind to the primary antibody, thereby forming a bridge between the primary antibody and a subsequent reagent (for example a signal generator or enzyme), if any. For example, a primary antibody may be mouse IgG (an antibody created in mouse) and the corresponding secondary antibody may be goat anti-mouse (antibody created in goat) having regions capable of binding to a region in mouse IgG.
- In some embodiments, signal amplification may be obtained when several secondary antibodies may bind to epitopes on the primary antibody. In an immunostaining procedure a primary antibody may be the first antibody used in the procedure and the secondary antibody may be the second antibody used in the procedure. In some embodiments, a primary antibody may be the only antibody used in an immunostaining procedure.
- The type of fluorescent probe suitable for the methods disclosed herein may depend on a variety of factors, including the nature of the analysis being conducted, the type of the energy source and detector used, the type of oxidizing agent employed, the type of binder, the type of target, or the mode of attachment between the binder and the signal generator (e.g., cleavable or non-cleavable).
- A suitable signal generator (probe) may be sterically and chemically compatible with the constituents to which it is bound, for example, a binder. Additionally, a suitable signal generator may not interfere with the binding of the binder to the target, nor may it affect the binding specificity of the binder. A suitable signal generator may be organic or inorganic in nature. In some embodiments, a signal generator may be of a chemical, peptide or nucleic acid nature.
- A suitable signal generator is a fluorescent label that emits light of a particular wavelength following excitation by light of another lower, characteristic wavelength and/or absorb light of a particular wavelength.
- A signal generator, suitable in accordance with the methods disclosed herein may be amenable to manipulation on application of a chemical agent. In some embodiments, a signal generator may be capable of being chemically destroyed on exposure to an oxidizing agent. Chemical destruction may include complete disintegration of the signal generator or modification of the signal-generating component of the signal generator. Modification of the signal-generating component may include any chemical modification (such as addition, substitution, or removal) that may result in the modification of the signal generating properties. For example, unconjugating a conjugated signal generator may result in destruction of chromogenic properties of the signal generator. Similarly, substitution of a fluorescence-inhibiting functional group on a fluorescent signal generator may result in modification of its fluorescent properties. In some embodiments, one or more signal generators substantially resistant to inactivation by a specific chemical agent may be used as a control probe in the provided methods.
- A signal generator includes a light-emissive molecule capable of absorbing and emitting light through fluorescence, or polarized fluorescence.
- A signal generator may essentially include a fluorophore attached to an antibody, for example, in an immunohistochemistry analysis. Suitable fluorophores that may be conjugated to a primary antibody include, but are not limited to, Fluorescein, Rhodamine, Texas Red, VECTOR Red, ELF (Enzyme-Labeled Fluorescence), Cy2, Cy3, Cy3.5, Cy5, Cy7, FluorX, Calcein, Calcein-AM, CRYPTOFLUOR, Orange (42 kDa), Tangerine (35 kDa), Gold (31 kDa), Red (42 kDa), Crimson (40 kDa), BHMP, BHDMAP, Br-Oregon, Lucifer Yellow, Alexa dye family, N-[6-(7-nitrobenz-2-oxa-1, 3-diazol-4-yl)amino]caproyl] (NBD), BODIPY, boron dipyrromethene difluoride, Oregon Green, MITOTRACKER Red, Phycoerythrin, Phycobiliproteins BPE (240 kDa) RPE (240 kDa) CPC (264 kDa) APC (104 kDa), Spectrum Blue, Spectrum Aqua, Spectrum Green, Spectrum Gold, Spectrum Orange, Spectrum Red, Infra-Red (IR) Dyes, Cyclic GDP-Ribose (cGDPR), Calcofluor White, Lissamine, Umbelliferone, Tyrosine or Tryptophan. In some embodiments, a signal generator may essentially include a cyanine dye. In some embodiments, a signal generator may essentially include one or more a Cy3 dye, a Cy5 dye, or a Cy7 dye.
- In some embodiments, the signal generator may be part of a FRET pair. FRET pair includes two fluorophores that are capable of undergoing FRET to produce or eliminate a detectable signal when positioned in proximity to one another. Some examples of donors may include
Alexa 488, Alexa 546, BODIPY 493, Oyster 556, Fluor (FAM), Cy3, or TTR (Tamra). Some examples of acceptors may include Cy5, Alexa 594, Alexa 647, or Oyster 656. - In some embodiments, a signal generator may include a fluorophore capable of being destroyed chemically by an oxidizing agent. In some embodiments, a signal generator may essentially include cyanine, coumarin, BODIPY,
ATTO 658, orATTO 634, capable of being destroyed chemically by an oxidizing agent. In some embodiments, a signal generator may include one or more a Cy3 dye, a Cy5 dye, or a Cy7 dye capable of being destroyed or quenched. - The present invention employs a chemical agent comprising a solution comprising an oxiditing agent capable of modifying the signal generator.
- In some embodiments the oxidizing agents may be, for example, active oxygen species, hydroxyl radicals, singlet oxygen, hydrogen peroxide, or ozone. In some embodiments, the chemical agent may include hydrogen peroxide, potassium permanganate, sodium dichromate, aqueous bromine, iodine-potassium iodide, or t-butyl hydroperoxide.
- One or more of the aforementioned chemical agents may be used in the methods disclosed herein depending upon the susceptibility of the signal generator, of the binder, of the target, or of the biological sample to the chemical agent. In some embodiments, a chemical agent that essentially does not affect the integrity of the binder, the target, and the biological sample may be employed. In some embodiments, a chemical agent that does not affect the specificity of binding between the binder and the target may be employed.
- In some embodiments, where two or more (up to four) signal generators may be employed simultaneously, a chemical agent may be capable of selectively modifying one or more signal generators. Susceptibility of different signal generators to a chemical agent may depend, in part, to the concentration of the signal generator, temperature, or pH. For example, two different fluorophores may have different susceptibility to an oxidizing agent depending upon the concentration of the oxidizing agent.
- In some embodiments, a chemical agent may essentially include an oxidizing agent. In other embodiments, a chemical agent may essentially include a basic solution of an oxidizing agent. In some specific embodiments, a basic solution may have a pH in a range of from about 8 to about 10. In some embodiments, a basic solution (e.g., sodium biocarbonate) may have pH of about 10..
- A suitable oxidizing agent may be selected from peroxide, sodium periodate, or ozone. In some embodiments, a suitable oxidizing agent may include peroxide or a peroxide source and the basic solution may include hydrogen peroxide. The concentration of hydrogen peroxide in the basic solution may be selected to substantially oxidize the fluorescent signal generator in a predetermined period of time. In some embodiments, the concentration of hydrogen peroxide in the basic solution may be selected to substantially inactivate both the fluorescent signal generator and the enzyme in a given period of time. The concentration of hydrogen peroxide in the basic solution may be selected such that the integrity of the sample, the targets, the binder, or the target-binder specificity may be maintained.
- In some embodiments, a basic solution may include hydrogen peroxide in an amount that is in a range of from about 0.5 volume percent to about 5 volume percent, in a range of from about 1 volume percent to about 4 volume percent, or in a range of from about 1.5 volume percent to about 3.5 volume percent. In some specific embodiments, a basic solution may include hydrogen peroxide in an amount that is in a range of about 3 volume percent.
- In some embodiments, the basic solution may not include reagents that strip the binders, the targets or both the binders and the targets from the sample such as reducing agents or surfactants.
- Sequentially Analyzing a Biological Sample, Contacting and Binding the Probe
- A biological sample may be contacted with a probe to bind the probe to a target in the biological sample. In some embodiments, a target may not be easily accessible for binding with the probe and a biological sample may be further processed to facilitate the binding between the target and the binder in the probe, for example through antigen recovery, enzymatic digestion, epitope retrieval, or blocking.
- In some embodiments, a probe may be contacted with the biological sample in the form of a solution. In some embodiments, a probe may include a binder coupled to a label (fluorescent signal generator). The binder and the label (signal generator) may be embodied in a single molecule and the probe solution may be applied in a single step. Alternatively, the binder and the label (signal generator) may be distinct entities and the probe solution may be applied in a single step or multiple steps. In all embodiments, a control probe may further be bonded to one or more targets in the sample.
- Depending on the nature of the binder, the target, and the binding between the two, sufficient contact time may be allowed. In some embodiments, an excess of probe molecules (and accordingly binder molecules) may be employed to ensure all the targets in the biological sample are bound. After a sufficient time has been providing for the binding action, the sample may be contacted with a wash solution (for example an appropriate buffer solution) to wash away any unbound probes. Depending on the concentration and type of probes used, a biological sample may be subjected to a number of washing steps with the same or different washing solutions being employed in each step.
- In some embodiments, the biological sample may be contacted with more than one probe in the first binding step. The plurality of probes may be capable of binding different targets in the biological sample. For example, a biological sample may include two targets: target1 and target2 and two sets of probes may be used in this instance: probe1 (having binder1 capable of binding to target1) and probe2 (having binder2 capable of binding to target2). A plurality of probes may be contacted with the biological sample simultaneously (for example, as a single mixture) or sequentially (for example, a probe1 may be contacted with the biological sample, followed by washing step to remove any unbound probe1, followed by contacting a probe2 with the biological sample, and so forth).
- The number of probes that may be simultaneously bound to the target may depend on the type of detection employed, that is, the spectral resolution achievable. For example, for fluorescence-based signal generators, four different probes (providing four spectrally resolvable fluorescent signals) may be employed in accordance with the disclosed methods. Spectrally resolvable, in reference to a plurality of fluorescent signal generators, indicates that the fluorescent emission bands of the signal generators are sufficiently distinct, that is, sufficiently non-overlapping, such that, binders to which the respective signal generators are attached may be distinguished on the basis of the fluorescent signal generated by the respective signal generators using standard photodetection systems.
- In some embodiments, a biological sample may be essentially contacted with four or less than four probes in the first binding step. In embodiments employing enzyme-based probes, the number of probes that may be simultaneously bound to the target may also depend on the number of different enzymes and their corresponding substrates available.
- The biological sample includes a tissue sample. The tissue sample may be obtained by a variety of procedures including, but not limited to surgical excision or biopsy. The tissue may be fresh or frozen.
- In some embodiments, the tissue sample may be fixed and embedded in paraffin. The tissue sample may be fixed or otherwise preserved by conventional methodology; the choice of a fixative may be determined by the purpose for which the tissue is to be histologically stained or otherwise analyzed. The length of fixation may depend upon the size of the tissue sample and the fixative used. For example, neutral buffered formalin, Bouin's or paraformaldehyde, may be used to fix or preserve a tissue sample.
- In some embodiments, the tissue sample may be first fixed and then dehydrated through an ascending series of alcohols, infiltrated and embedded with paraffin or other sectioning media so that the tissue sample may be sectioned. In an alternative embodiment, a tissue sample may be sectioned and subsequently fixed. In some embodiments, the tissue sample may be embedded and processed in paraffin. Examples of paraffin that may be used include, but are not limited to, Paraplast, Broloid, and Tissuemay. Once the tissue sample is embedded, the sample may be sectioned by a microtome into sections that may have a thickness in a range of from about three microns to about five microns. Once sectioned, the sections may be attached to slides using adhesives. Examples of slide adhesives may include, but are not limited to, silane, gelatin, poly-L-lysine. In embodiments, if paraffin is used as the embedding material, the tissue sections may be deparaffinized and rehydrated in water. The tissue sections may be deparaffinized, for example, by using organic agents (such as, xylenes or gradually descending series of alcohols).
- In some embodiments, aside from the sample preparation procedures discussed above, the tissue section may be subjected to further treatment prior to, during, or following immunohistochemistry. For example, in some embodiments, the tissue section may be subjected to epitope retrieval methods, such as, heating of the tissue sample in citrate buffer. In some embodiments, a tissue section may be optionally subjected to a blocking step to minimize any non-specific binding.
- Following the preparation of the tissue sample, a probe solution (e.g., labeled-antibody solution) may be contacted with the tissue section for a sufficient period of time and under conditions suitable for binding of binder to the target (e.g., antigen). As described earlier, two detection methods may be used: direct or indirect. In a direct detection, a signal generator-labeled primary antibody (fluorophore-labeled primary antibody) may be incubated with an antigen in the tissue sample, which may be visualized without further antibody interaction. In an indirect detection, an unconjugated primary antibody may be incubated with an antigen and then a labeled secondary antibody may bind to the primary antibody. Signal amplification may occur as several secondary antibodies may react with different epitopes on the primary antibody. In some embodiments two or more (at most four) primary antibodies (labeled or unlabeled) may be contacted with the tissue sample. Unlabeled antibodies may be then contacted with the corresponding labeled secondary antibodies.
- A signal from the signal generator (fluorescent label) may be detected using a detection system. The nature of the detection system used may depend upon the nature of the signal generators used. The detection system may include a fluorescent detection system.
- In some embodiments, signal intensity, signal wavelength, signal location, signal frequency, or signal shift may be determined using one or more of the aforementioned techniques. In some embodiments, one or more aforementioned characteristics of the signal may be observed, measured, and recorded.
- The signal generator (coupled with a binder) includes a fluorophore and fluorescence wavelength or fluorescent intensity may be determined using a fluorescence detection system. In some embodiments, a signal may be observed in situ, that is, a signal may be observed directly from the signal generator associated through the binder to the target in the biological sample. In some embodiments, a signal from the signal generator may be analyzed within the biological sample, obviating the need for separate array-based detection systems.
- In some embodiments, observing a signal may include capturing an image of the biological sample. In some embodiments, a microscope connected to an imaging device may be used as a detection system, in accordance with the methods disclosed herein. In some embodiments, the signal generator (fluorophore) may be excited and the signal (fluorescence signal) obtained may be observed and recorded in the form of a digital signal (for example, a digitalized image). The same procedure may be repeated for different signal generators (if present) that are bound in the sample using the appropriate fluorescence filters.
- A chemical agent may be applied to the sample to modify the signal. In some embodiments, signal modification may include one or more of a change in signal characteristic, for example, a decrease in intensity of signal, a shift in the signal peak, a change in the resonant frequency, or cleavage (removal) of the signal generator resulting in signal removal. In the present invention a chemical agent is applied to modify the signal by substantially inactivating the fluorescent signal generator. The chemical agent includes an oxidizing agent, which may substantially oxidize the fluorescent signal generator. In some embodiments, a chemical agent may be applied to modify the signal by substantially oxidizing the cleavable linkage to cleave off the signal generator.
- In some embodiments, a chemical agent may be in the form of a solution and the sample may be contacted with the chemical agent solution for a predetermined amount of time. In some embodiments, a chemical agent may be a basic solution having an oxidizing agent. The concentration of the basic solution and the contact time may be dependent on the type of signal modification desired. In some embodiments, a chemical agent solution may be contacted with the sample and the oxidation step may be performed for less than 30 minutes. In some embodiments, the oxidation step may be performed for less than 15 minutes. In some embodiments, the oxidation step may be performed for about 30 seconds to about 15 minutes. In some embodiments, the oxidation step may be performed for about 5 minutes. In some embodiments, the oxidation step may be performed at room temperature.
- In some embodiments, the contacting conditions for the basic solution may be selected such that the binder, the target, the biological sample, and binding between the binder and the target may not be affected. In some embodiments, an oxidizing agent may only affect the signal generator and the oxidizing agent may not affect the target/binder binding or the binder integrity. Thus by way of example, a binder may include a primary antibody or a primary antibody/secondary combination. An oxidizing agent according to the methods disclosed herein may only affect the signal generator, and the primary antibody or primary antibody/secondary antibody combination may essentially remain unaffected. In some embodiments, a binder (such as, a primary antibody or primary antibody/secondary antibody combination) may remain bound to the target in the biological sample after contacting the sample with the oxidizing agent.
- In some embodiments, a binder may remain bound to the target in the biological sample after contacting the sample with the oxidizing agent and the binder integrity may remain essentially unaffected (for example, an antibody may not substantially denature or elute in the presence of a chemical agent). In some embodiments, after application of the oxidizing agent to the sample less than 25 percent of the binders may be stripped from the targets in the biological sample. In some embodiments, after application of the oxidizing agent to the sample less than 20, less than 15 percent, less than 10 percent, or less than 5 percent of the binders may be stripped from the targets in the biological sample.
- In some embodiments, a characteristic of the signal may be observed after contacting the sample with the oxidizing agent to determine the effectiveness of the signal modification. For example, a color may be observed before application of the oxidizing agent and the color may be absent after application of the oxidizing agent. In another example, fluorescence intensity from a fluorescent signal generator may be observed before contacting with the oxidizing agent and after contacting with the oxidizing agent. In some embodiments, a decrease in signal intensity by a predetermined amount may be referred to as signal modification. In some embodiments, modification of the signal may refer to a decrease in the signal intensity by an amount in a range of greater than about 50 percent. In some embodiments, modification of the signal may refer to a decrease in the signal intensity by an amount in a range of greater than about 60 percent. In some embodiments, modification of the signal may refer to a decrease in the signal intensity by an amount in a range of greater than about 80 percent.
- The biological sample or the sample bound to a solid support may be contacted with a subsequent probe using one or more procedures described herein above for the first probe. The subsequent probe may be capable of binding to target different from the target bound in the earlier steps. In embodiments where a plurality of probes may be contacted with the biological sample in the earlier probe contact steps, the subsequent probe may be capable of binding a target different from the targets bound by the earlier probe set. In some embodiments, a biological sample may be contacted with a plurality of probes in the subsequent probe contact step.
- In some embodiments, the signal generator (e.g., a fluorescent signal generator) used in the different binding steps may be the same, that is, detectable in the same detection channel. Methods employing the same signal generator in different binding steps may allow for detection of multiple targets when a limited number of detection channels is available. In some embodiments, where a set of probes (2 to 4 probes) may be employed in the first binding step, the subsequent probes may include the same signal generators as in the earlier binding steps. For example, a first binding step may include Cy3, Cy5, and Cy7-conjugated different binders. In some embodiments, the subsequent binding steps may also include the same dye set, that is, Cy3, Cry5, and Cy7.
- In some embodiments, the signal generator (e.g., a fluorescent signal generator) used in the different binding steps may be different, that is, independently detectable in different detection channels. For example, in some embodiments, a first probe may include a Cy3 dye, which has a fluorescent emission wavelength in the green region and a subsequent probe may include a Cy7 dye, which has a fluorescent emission wavelength in the red region.
- One or more detection methods described hereinabove may be used to observe one or more characteristics of a subsequent (e.g., second, third, etc.) signal from a subsequent signal generator (present in the subsequent probe). In some embodiments, signal intensity, signal wavelength, signal location, signal frequency, or signal shift may be determined using one or more of the aforementioned techniques. Similar to the first signal, a subsequent signal (for example, a fluorescence signal) obtained may be recorded in the form of a digital signal (for example, a digitalized image). In some embodiments, observing a subsequent signal may also include capturing an optical image of the biological sample.
- In some embodiments, after contacting the sample with a subsequent (e.g., second, third, etc.) probe, oxidation of the signal generator, and subsequent probe administration may be repeated multiple times. In some embodiments, after observing a second signal from the second probe, the biological sample may be contacted with an oxidizing agent to modify the signal from the second probe. Furthermore, a third probe may be contacted with the biological sample, wherein the third probe may be capable of binding a target different from the first and the second probes. Likewise, a signal from the third probe may be observed followed by application of oxidizing agent to modify the signal. The binding, observing, and oxidation steps may be repeated iteratively multiple times using an nth probe capable of binding to additional targets to provide the user with information about a variety of targets using a variety of probes and/or signal generators. In some embodiments, the oxidation, binding, reacting (if applicable), and observing steps may be repeated one or more time. In some embodiments, the oxidation, binding, reacting (if applicable), and observing steps may be repeated at least 5, at least 10, or at least 20 times.
- In some embodiments, a series of probes may be contacted with the biological sample in a sequential manner to obtain a multiplexed analysis of the biological sample. In some embodiments, a series of probe sets (including at most 4 probes in one set) may be contacted with the biological sample in a sequential manner to obtain a multiplexed analysis of the biological sample. Multiplexed analysis generally refers to analysis of multiple targets in a biological sample using the same detection mechanism.
- The biological sample includes a tissue, and the sample may be contacted with a morphological stain before, during, or after the contacting step with the first probe or subsequent probe. A morphological stain may include a dye that may stain different cellular components, in order to facilitate identification of cell type or disease status. In some embodiments, the morphological stain may be readily distinguishable from the signal generators in the probes, that is, the stain may not emit signal that may overlap with signal from the probe. For example, for a fluorescent morphological stain, the signal from the morphological stain may not autofluoresce in the same wavelength as the fluorophores used in the probes.
- A morphological stain may be contacted with the biological sample before, during, or after, any one of the aforementioned steps. In some embodiments, a morphological stain may be contacted with biological sample along with the first probe contact step. In some embodiments, a morphological stain may be contacted with the biological sample before contacting the sample with a chemical agent and after binding the first probe to the target. In some embodiments, a morphological stain may be contacted with a biological sample after contacting the sample with a chemical agent and modifying the signal. In some embodiments, a morphological stain may be contacted with a biological sample along with the second probe contact step. In some embodiments, a biological sample may be contacted with the morphological stain after binding the second probe to the target. In some embodiments, where the morphological stains may result in background noise for the fluorescent signal from the signal generator, the morphological stains may be contacted with the biological sample after the probing, oxidizing and reprobing steps. For example, morphological stains like H&E may be sequentially imaged and registered after the methods disclosed herein.
- In some embodiments, chromophores, fluorophores, or enzyme/enzyme substrates may be used as morphological stains. Suitable examples of chromophores that may be used as morphological stains (and their target cells, subcellular compartments, or cellular components) may include, but are not limited to, Eosin (alkaline cellular components, cytoplasm), Hematoxylin (nucleic acids), Orange G (red blood, pancreas, and pituitary cells), Light Green SF (collagen), Romanowsky-Giemsa (overall cell morphology), May-Grunwald (blood cells), Blue Counterstain (Trevigen), Ethyl Green (CAS) (amyloid), Feulgen-Naphthol Yellow S (DNA), Giemsa (differentially stains various cellular compartments), Methyl Green (amyloid), pyronin (nucleic acids), Naphthol-Yellow (red blood cells), Neutral Red (nuclei), Papanicolaou stain (a mixture of Hematoxylin, Eosin Y, Orange G and Bismarck Brown mixture (overall cell morphology)), Red Counterstain B (Trevigen), Red Counterstain C (Trevigen), Sirius Red (amyloid), Feulgen reagent (pararosanilin) (DNA), Gallocyanin chrom-alum (DNA), Gallocyanin chrom-alum and Naphthol Yellow S (DNA), Methyl Green-Pyronin Y (DNA), Thionin-Feulgen reagent (DNA), Acridine Orange (DNA), Methylene Blue (RNA and DNA), Toluidine Blue (RNA and DNA), Alcian blue (carbohydrates), Ruthenium Red (carbohydrates), Sudan Black (lipids), Sudan IV (lipids), Oil Red-O (lipids), Van Gieson's trichrome stain (acid fuchsin and picric acid mixture) (muscle cells), Masson trichrome stain (hematoxylin, acid fuchsin, and Light Green mixture) (stains collagen, cytoplasm, nucleioli differently), Aldehyde Fuchsin (elastin fibers), or Weigert stain (differentiates reticular and collagenous fibers).
- Examples of suitable fluorescent morphological stains (and their target cells, subcellular compartments, or cellular components if applicable) may include, but are not limited to, ,: 4',6-diamidino-2-phenylindole (DAPI) (nucleic acids), Eosin (alkaline cellular components, cytoplasm), Hoechst 33258 and Hoechst 33342 (two bisbenzimides) (nucleic acids), Propidium Iodide (nucleic acids), Spectrum Orange (nucleic acids), Spectrum Green (nucleic acids), Quinacrine (nucleic acids), Fluorescein-phalloidin (actin fibers), Chromomycin A 3 (nucleic acids), Acriflavine-Feulgen reaction (nucleic acid), Auramine O-Feulgen reaction (nucleic acids), Ethidium Bromide (nucleic acids). Nissl stains (neurons), high affinity DNA fluorophores such as POPO, BOBO, YOYO and TOTO and others, and Green Fluorescent Protein fused to DNA binding protein, such as histones, ACMA, Quinacrine and Acridine Orange.
- Examples of suitable enzymes (and their primary cellular locations or activities) may include, but are not limited to, ATPases (muscle fibers), succinate dehydrogenases (mitochondria), cytochrome c oxidases (mitochondria), phosphorylases (mitochondria), phosphofructokinases (mitochondria), acetyl cholinesterases (nerve cells), lactases (small intestine), acid phosphatases (lysosomes), leucine aminopeptidases (liver cells), dehydrogenases (mitochondria), myodenylate deaminases (muscle cells), NADH diaphorases (erythrocytes), and sucrases (small intestine).
- In some embodiments, a morphological stain may be stable towards an oxidizing agent, that is, the signal generating properties of the morphological stain may no be substantially affected by the oxidizing agent. In some embodiments, where a biological sample may be stained with a probe and a morphological stain at the same time, application of oxidizing agent to modify the signal from the probe may not modify the signal from the morphological stain. In some embodiments, a morphological stain may be used as a control to co-register the molecular information (obtained through the iterative probing steps) and the morphological information (obtained through the morphological stains).
- In the present invention, a control probe may be bonded to one or more targets in the biological sample. In some embodiments, a control probe may be bonded to the targets along with the first probe contact step. In some embodiments, a control probe may be applied to the biological sample simultaneously with the first probe. In some embodiments, a control probe may be applied to the biological sample sequentially, that is before or after the application of the first probe, but before application of the oxidizing agent.
- A control probe may include a signal generator that is stable towards an oxidizing agent or the signal generating properties of the signal generator are not substantially affected when contacted with the oxidizing agent. A signal generator may include a radioisotope that is stable to the oxidizing agent or a fluorophore that is stable to the oxidizing agent. A suitable radioisotope may include P32 or H3, 14C, 125I or 131I. A suitable fluorophore may include DAPI.
- In some embodiments, a suitable signal generator may be coupled to a binder to form a control probe. For example, a radioactive label may be coupled to an antibody to form a control probe and the antibody may bind to one or more target antigens present in the biological sample. In other embodiments, a suitable signal generator may be capable of binding to one more targets in the sample and also providing a detectable signal, which is stable in the presence of the oxidizing agent. For example, a suitable control probe may be DAPI, which is capable of binding to nucleic acids in the sample and also capable of providing a fluorescent signal that is stable to the oxidizing agent.
- In some embodiments, a control probe may be employed in the methods disclosed herein to provide an indication of the stability of the targets to the iterative staining steps. For example, a control probe may be bonded to a known target in the sample and a signal from the control observed and quantified. The control signal may be then monitored during the iterative staining steps to provide an indication of the stability of the targets or binders to the oxidizing agents. In some embodiments, a quantitative measure (for example, signal intensity) of the control signal may be monitored to quantify the amount of targets present in the sample after the iterative probing steps.
- In some embodiments, a control probe may be employed to obtain quantitative information of the sample of interest, for example concentration of targets in the sample or molecular weight of the targets in the sample. For example, a control target (having known concentration or known molecular weight) may be loaded along with the sample of interest in a blotting technique. A control probe may be bonded to the control target and a control signal observed. The control signal may be then correlated with the signals observed from the sample of interest using methods described herein below.
- In some embodiments, a control probe may be employed in the methods disclosed herein to provide for co-registration of multiple molecular information (obtained through the iterative probing steps) and the morphological information (obtained, e.g., using DAPI). In some embodiments, methods disclosed herein may include co-registration of multiple fluorescent images with the bright-field morphological images obtained e.g., using H&E. In some embodiments, the probes employed in the iterative probing steps may not have any common compartmental information that may be used to register with the H&E images. A control probe like a DAPI nuclear stain may be employed to co-register the nucleus stained with hematoxylin in the bright-field images with the fluorescent images. The fluorescent images and the bright-field images may be co-registered using image registration algorithms that may be grouped in two categories: intensity-based and feature-based techniques.
- In some embodiments, a first signal, a subsequent signal, or the first signal and the subsequent signals may be analyzed to obtain information regarding the biological sample. For example, in some embodiments, a presence or absence of a first signal may indicate the presence or absence of the first target (capable of binding to the first binder) in the biological sample. Similarly, the presence or absence of a second signal may indicate the presence or absence of the second target (capable of binding to the second binder in the biological sample). In embodiments where multiple targets may be analyzed using a plurality of probes, the presence or absence of a particular signal may indicate the presence or absence of corresponding target in the biological sample.
- In some embodiments, the observing steps may include a quantitative measurement of at least one target in the sample. In some embodiments, an intensity value of a signal (for example, fluorescence intensity) may be measured and may be correlated to the amount of target in the biological sample. A correlation between the amount of target and the signal intensity may be determined using calibration standards. In some embodiment, intensity values of the first and second signals may be measured and correlated to the respective target amounts. In some embodiments, by comparing the two signal intensities, the relative amounts of the first target and the second target (with respect to each other or with respect to a control) may be ascertained. Similarly, where multiple targets may be analyzed using multiple probes, relative amounts of different targets in the biological sample may be determined by measuring different signal intensities. In some embodiments, one or more control samples may be used as described hereinabove. By observing a presence or absence of a signal in the samples (biological sample of interest versus a control), information regarding the biological sample may be obtained. For example by comparing a diseased tissue sample versus a normal tissue sample, information regarding the targets present in the diseased tissue sample may be obtained. Similarly by comparing signal intensities between the samples (i.e., sample of interest and one or more control), information regarding the expression of targets in the sample may be obtained.
- In some embodiments, the observing steps include co-localizing at least two targets in the sample. Methods for co-localizing targets in a sample are described in
U.S. Patent Application Serial No. 11/686,649 U.S. Patent Application Serial No. 11/500028 U.S. Patent Application Serial No. 11/606582 .S. Application Serial No. 11/680063 - In some embodiments, a location of the signal in the biological sample may be observed. In some embodiments, a localization of the signal in the biological signal may be observed using morphological stains. In some embodiments relative locations of two or more signals may be observed. A location of the signal may be correlated to a location of the target in the biological sample, providing information regarding localization of different targets in the biological sample. In some embodiments, an intensity value of the signal and a location of the signal may be correlated to obtain information regarding localization of different targets in the biological sample. For examples certain targets may be expressed more in the cytoplasm relative to the nucleus, or vice versa. In some embodiments, information regarding relative localization of targets may be obtained by comparing location and intensity values of two or more signals.
- In some embodiments, one or more of the observing or correlating step may be performed using computer-aided means. In embodiments where the signal(s) from the signal generator may be stored in the form of digital image(s), computer-aided analysis of the image(s) may be conducted. In some embodiments, images (e.g., signals from the probe(s) and morphological stains) may be overlaid using computer-aided superimposition to obtain complete information of the biological sample, for example topological and correlation information.
- In some embodiments, one or more of the aforementioned may be automated and may be performed using automated systems. In some embodiments, all the steps may be performed using automated systems.
- The methods disclosed herein may find applications in analytic, diagnostic, and therapeutic applications in biology and in medicine. In some embodiments, the methods disclosed herein may find applications in histochemistry, particularly, immunohistochemistry. Analysis of cell or tissue samples from a patient, according to the methods described herein, may be employed diagnostically (e.g., to identify patients who have a particular disease, have been exposed to a particular toxin or are responding well to a particular therapeutic or organ transplant) and prognostically (e.g., to identify patients who are likely to develop a particular disease, respond well to a particular therapeutic or be accepting of a particular organ transplant). The methods disclosed herein, may facilitate accurate and reliable analysis of a plurality (e.g., potentially infinite number) of targets (e.g., disease markers) from the same biological sample.
- A solution of hydrogen peroxide (H2O2) was prepared in a sodium bicarbonate buffer by mixing 1 volume of 1M sodium bicarbonate, 3 volumes of water, and 1 volume of 30 percent (v/v) hydrogen peroxide. pH of sodium bicarbonate was adjusted to a
pH 10 using sodium hydroxide, prior to mixing with hydrogen peroxide. - Three separate solutions of cyanine dyes: Cy3, Cy5, and Cy7 were prepared in water at a concentration of about 2µM. An aliquot of a cyanine dye solution was mixed with an aliquot of the H2O2 solution to prepare a sample solution with a final concentration of about 3 volume percent H2O2 and 1 micromolar 1µM cyanine dye (Samples 1 (Cy3), 2 (Cy5), and 3 (Cy7)). A 1µM cyanine dye solution in water (without H2O2) was used as a control.
- Oxidation reaction of the cyanine dye was monitored by measuring absorbance spectrum of the dye on an ultraviolet/visible (UV/Vis) spectrophotometer as a function of time. FIG. shows the absorbance spectra of
Sample 1 as a function of wavelength, after duration of 10 minutes and 15 minutes. The absorbance value decreased considerably when compared with the control.FIG. 2 shows the absorbance values forSamples Samples Samples Sample Sample Sample 3. - A solution of 4',6-diamidino-2-phenylindole (DAPI) was prepared in water at a concentration of about 57 µM. An aliquot of DAPI solution was mixed with an aliquot of the H2O2 solution to prepare a solution with a final concentration of about 3 volume percent H2O2 and 10 µg/mL DAPI (Sample 4). A 10 µg/mL DAPI solution in water (without H2O2) was used as a control.
- Oxidation reaction of DAPI was monitored by measuring absorbance spectrum of
Sample 4 as a function of time.FIG. 3 shows the absorbance spectra ofSample 4 as a function of wavelength, after duration of 30 minutes and 140 minutes. The absorbance value ofSample 4 did not vary much even after a period of 140 minutes and was in the same range as the control, exhibiting no significant effect of H2O2 on DAPI. - A solution of sodium periodate (NaIO4) was prepared by mixing a 0.2 M solution of NaIO4 in 0.1X phosphate buffer saline (PBS). Three separate solutions of cyanine dyes (Cy3, Cy5, and Cy7) were prepared in water at a concentration of about 2 µM. An aliquot of a cyanine dye solution was mixed with an aliquot of the NaIO4 solution to prepare a solution with a final concentration of about 1 µM NaIO4 and 1µ M cyanine dye (Samples 5 (Cy3), 6 (Cy5), and 7 (Cy7)). A 1 µM cyanine dye solution in water (without NaIO4) was used as a control.
- Oxidation reaction of the cyanine dye was monitored by measuring absorbance spectrum of the dye on an ultraviolet/visible (UV/Vis) spectrophotometer as a function of time.
FIG. 4 shows the absorbance spectra ofSample 5 as a function of wavelength, after duration of 20 minutes, 60 minutes and 210 minutes. The absorbance value decreased as function of time when compared with the control. Complete absorbance loss was observed after 210 minutes forSample 5.FIG.5 shows the absorbance spectra ofSample 6 as a function of wavelength, after duration of 12 minutes and 16 minutes. The absorbance value decreased as function of time when compared with the control. Complete absorbance loss was observed rapidly, after 16 minutes. - A solution of 4',6-diamidino-2-phenylindole (DAPI) was prepared in water at a concentration of about 57 µM. An aliquot of DAPI solution was mixed with an aliquot of the NaIO4 solution to prepare a solution with a final concentration of about 0.1 M NaIO4 and 10 µg/mL DAPI (Sample 8). A 10 µg/mL DAPI solution in water (without NaIO4) was used as a control.
- Oxidation reaction of DAPI was monitored by measuring absorbance spectrum of
Sample 8 as a function of time.FIG. 6 shows the absorbance spectra ofSample 8 as a function of wavelength, after duration of 22 minutes, 70 minutes and 210 minutes. The absorbance value ofSample 8 did not vary much even after a period of 210 minutes and a significant amount of DAPI remained intact when compared to the control. - A NaOH solution was prepared at a concentration of 0.1M and 1M. Three separate solutions of cyanine dyes, Cy3, Cy5, and Cy7 were prepared in water at a concentration of 2 µM. An aliquot of a cyanine dye solution was mixed with an aliquot of the NaOH solution of two different concentrations of NaOH: 0.1M NaOH (Samples 9a, 10a, and 11a) and 1M NaOH (Samples 9b, 10b, and 11b). A 1 µM cyanine dye solution in water (without NaOH) was used as a control.
- Base destruction of the dye was monitored by measuring absorbance spectrum of the samples as a function of time.
FIG. 7 shows the absorbance spectra of Samples 9a, 10a, and 11a as a function of wavelength, after duration of less than 5 minutes. The absorbance value ofSample 9A did not vary much and a significant amount of Cy3 remained intact when compared to the control. Sample 10a showed a 20 percent decomposition of the Cy5 dye, while Sample 11Ashowed a 70 percent decomposition of the Cy7 dye using 0.1 M NaOH.FIG. 8 shows the absorbance spectra ofSamples Sample 9B showed a 50 percent decomposition of the Cy3 dye, whileSample 10B showed an 80 percent decomposition of the Cy5 dye using 1 M NaOH. - A solution of 4',6-diamidino-2-phenylindole (DAPI) was prepared in water at a concentration of about 57 µM. An aliquot of DAPI solution was mixed with an aliquot of the NaOH solution of two different concentrations 0.1M NaOH (
Samples 12A) and 1M NaOH (Samples 12B). A 10 µg/mL DAPI dye solution in water (without NaOH) was used as a control. Base destruction of DAPI was monitored by measuring absorbance spectrum ofSamples FIG. 9 shows the absorbance spectra ofSamples - A 5 percent (w/v) solution of a nucleophile was prepared by mixing tris[2-carboxyethyl]-phosphine hydrochloride (TCEP.HCl) in 1M-sodium bicarbonate buffer (final pH 7.7). Three separate solutions of cyanine dyes, Cy3, Cy5, and Cy7 were prepared in water at a concentration of about 2 µM. An aliquot of a cyanine dye solution was mixed with an aliquot of the TCEP.HCl solution to prepare Samples 13 (Cy3), 14 (Cy5), and 15 (Cy7). A 1µM cyanine dye solution in water (without TCEP.HCl) was used as a control.
- Destruction of the dye was monitored by measuring absorbance spectrum of the samples as a function of time.
FIG. 10 shows the absorbance spectra ofSamples Sample 13 did not vary much and a significant amount of Cy3 remained intact when compared to the control after duration of 60 minutes.Samples - A solution of hydrogen peroxide (H2O2) was prepared in a phosphate buffer saline solution (PBS) by mixing a 6 % (v/v) solution of H2O2 in 0.8X PBS (final pH 6.6). Two separate solutions of cyanine dyes, Cy3 and Cy7 were prepared in water at a concentration of about 2 µM. An aliquot of a cyanine dye solution was mixed with an aliquot of the H2O2 solution to prepare Samples 16 (Cy3) and 17 (Cy7)). A 1 µM cyanine dye solution in water (without H2O2) was used as a control.
- Destruction of the dye was monitored by measuring absorbance spectrum of the samples as a function of time.
FIG. 11 shows the absorbance spectra ofSamples Sample 16 did not vary much and a significant amount of Cy3 remained intact when compared to the control after duration of 60 minutes.Sample 17 showed a significant decomposition of the Cy7 dye after duration of 60 minutes. - The following examples 6-21 illustrate embodiments of the invention according to which multiple imaging of tissue samples is conducted. Multiple staining is obtained by staining, imaging, chemically destroying the fluorophore, restaining, imaging, and repeating the steps
- Adult human tissue samples were obtained as tissue slides embedded in paraffin. The tissue samples included slides of colon (Biochain, T2234090), normal breast tissue (Biochain, T2234086), prostate cancer (Biochain, T2235201-1), colon adenocarcinoma (Biochain, T2235090-1), breast tissue microarray (Imgenex, IMH 367, p61), breast TMA (Imgenex IMH 367,p32), and normal prostate (Biochain, T2234201). Paraffin embedded slides of adult human tissue were subjected to an immunohistochemistry protocol to prepare them for staining. The protocol included deparaffinization, rehydration, incubation, and wash. Deparaffinization was carried by washing the slides with Histochoice (or toluene) for a period of 10 minutes and with frequent agitation. After deparaffinization, the tissue sample was rehydrated by washing the slide with ethanol solution. Washing was carried out with three different solutions of ethanol with decreasing concentrations. The concentrations of ethanol used were 90 volume %, 70 volume %, and 50 volume %. The slide was then washed with a phosphate buffer saline (PBS, pH 7.4). Membrane permeabilization of the tissue was carried out by washing the slide with 0.1 1 weight percent solution of Triton TX-100. Citrate buffer pH 6.0 (Vector Unmasking Solution) was used for antigen retrieval. The slides were exposed to the buffer in a pressure cooker for a period of 15 minutes followed by cooling at room temperature for 20 minutes. The slide was then blocked against nonspecific binding by washing with PBS and 900 µl of 3 volume percent bovine serum albumin (BSA) for 45 minutes at 37 C. For staining with secondary antibodies (optional), the slide was also blocked with 100 µL of serum from secondary antibody host species.
- Dye-conjugated antibodies were prepared according to the following procedure. The antibodies used for conjugating and staining included anti-proliferating cell nuclear antigen, clone pc10 (Sigma Aldrich, P8825); anti-smooth muscle alpha actin (SmA), clone 1A4 (Sigma, A2547); rabbit anti-beta catenin (Sigma, C 2206); mouse anti-pan cytokeratin, clone PCK-26 (Sigma, C1801); mouse anti-estrogen receptor alpha, clone 1D5 (DAKO, M 7047); beta catenin antibody, clone 15B8 (Sigma, C 7738); goat anti-vimentin (Sigma, V4630); cycle androgen receptor clone AR441 (DAKO, M3562); Von Willebrand Factor VII,
keratin 5,keratin 8/18, e-cadherin, Her2/neu, Estrogen receptor, p53, progesterone receptor, beta catenin; donkey anti-mouse (Jackson Immunoresearch, 715-166-150); and donkey anti-rabbit (Jackson Immunoresearch, 711-166-152). - A micron YM-10 spin column was wetted with 250 mL of PBS and the column was spun for 15 minutes. 500 mL of the antibody (200 µg/mL) was pipetted into the wet column. The column was spun for 30 minutes at 11000 rpm at 4 C. The concentrated antibody/protein was then transferred into a new tube and spun for 30 seconds to remove the concentrated protein. A coupling buffer solution was then mixed with the concentrated antibody solution. The coupling buffer solution included 1M sodium carbonate (pH between 8-9) and 5 µL of the buffer was used per 100 µL of the antibody solution. The antibody and buffer solution was added to 0.01-0.1 milligrams of the cyanine dye. The dye was reconstituted in DMSO to a 10-20-mg/mL concentration prior to incubating with the antibody. The resulting solution was mixed thoroughly by pipetting and any bubbles formed were removed by spinning the tube. The solution was covered with a foil and incubated at room temperature for a period of about 30-45 minutes. Post incubation the solution was added to YM-10 spin column and spun for 30 minutes at 4 C at 11000 rpm. The solution was washed with PBS and spun to remove any unconjugated dye or antibody. The dye-conjugated antibody solution was then diluted with 50 percent glycerol and stored in a freezer at -20 C.
- A slide prepared in Example 6 was incubated with a dye-conjugated antibody prepared in Example 7. Incubation was conducted in 3 percent BSA for 45 minutes at 37 C. After incubation, the slide was subjected to an extensive series of PBS washes. When secondary antibodies were used, the slide was incubated with a secondary antibody in BSA for 45 minutes at 37 C. After incubation, the slide was subjected to an extensive series of PBS washes. A primary antibody or secondary antibody-stained slide was counterstained with the morphological stain, DAPI, and cover slipped.
- A cover slipped slide was imaged using a camera. The camera used was a monochromatic Leica DFC 350FX monochromatic high-resolution camera mounted in a Leica DMRA2 fluorescent microscope. The magnification used was 20x unless otherwise stated. After image acquisition, the cover slip was removed and the slide was washed with PBS to prepare for signal destruction.
- NaOH solution and H2O2 solution were used for signal destruction. A NaOH solution was prepared using 500 µL of 50 volume percent NaOH and 49.5 mL of PBS. The final pH of the NaOH solution was around 11.9-12.5. A H2O2 solution was prepared by mixing 10 mL of 0.5M sodium carbonate (pH 10), 5 mL of 30 volume percent H2O2, and 35 mL of water. A slide was placed in the NaOH or H2O2 solution for 15 minutes with gentle agitation. After 15 minutes, the slide was washed again with PBS, cover slipped and either imaged again (optional) to check the efficacy of the dye destruction or restained and imaged. Restaining and reimaging steps were carried out using the process described in Example 8. Following imaging, a slide was subjected to signal destruction, staining, and imaging cycles, and the process was repeated a multiple number of times. The tissue samples were imaged using 1-9 different antibodies. After imaging with the cyanine series, the slide was optionally stained and imaged with morphological stains H&E.
- A normal colon slide was stained with a primary antibody mouse anti-proliferating cell nuclear antigen (PCNA)
clone pc 10, and detected with a Cy3-conjugated donkey anti-mouse to formSample 18A.Sample 18A was imaged and then treated with a NaOH solution to formSample 18B, which was imaged again. Staining, imaging, and dye destruction steps were performed according to the procedures described herein in Examples 8 and 9.FIG. 12 shows micrographs (at 10x magnification) ofSample 18A (before dye destruction) andSample 18B (after dye destruction). After treatment with NaOH little or no signal from Cy3 remained. - A normal colon slide was stained with a primary antibody mouse anti-smooth muscle alpha actin (SmA) clone 1A4, and detected with a Cy3-conjugated donkey anti-mouse to form
Sample 19A.Sample 19A was imaged and then treated with a NaOH solution to formSample 19B, which was imaged again. Staining, imaging, and dye destruction steps were performed according to the procedures described herein in Examples 8 and 9.FIG. 13 shows micrographs (at 10x magnification) ofSample 19A (before dye destruction) and Sample 19b (after dye destruction). After treatment with NaOH a little amount of signal from Cy3 remained. - A normal breast tissue was stained with a primary antibody SmA, detected with a Cy3-conjugated donkey anti-mouse, and counter-stained with DAPI to form
Sample 20A. Sample 20a was imaged and then treated with a NaOH solution to formSample 20B, which was imaged again. Staining, imaging, and dye destruction steps were performed according to the procedures described herein in Examples 8 and 9.Sample 20B was restained with a primary antibody rabbit anti-beta catenin, and detected with a Cy3-conjugated anti-rabbit to formSample 20C.Sample 20C was imaged and then counter-stained with H&E to formSample 20D and imaged again. -
FIG. 14 shows micrographs ofSample 20A (before dye destruction) andSample 20B (after dye destruction). After treatment with NaOH little or no signal from Cy3 remained and only DAPI was observed. Micrograph of Sample 20c showed imaging in the same Cy3 channel was possible by staining with a different antibody. Morphological information about the tissue was obtained by further staining with H&E (Sample 20D). - A prostate cancer tissue was stained with a primary antibody mouse anti-pan cytokeratin clone PCK-26, and detected with a Cy3-conjugated donkey anti-mouse, to form
Sample 21A.Sample 21A was imaged and then counterstained with DAPI to formSample 21B.Sample 21B was imaged and then treated with a NaOH solution to formSample 21C, which was imaged again. Staining, imaging, and dye destruction steps were performed according to the procedures described herein in Examples 8 and 9.Sample 21C was restained with a primary antibody SmA, and detected with a Cy3-conjugated anti-rabbit to formSample 21D and imaged again. -
FIG. 15 shows micrographs ofSample 21A (Cye channel) andSample 21B (DAPI channel) before dye destruction andSample 21C (Cye channel) after dye destruction. After treatment with NaOH little or no signal from Cy3 remained (21C) and only DAPI was observed (not shown). Micrograph ofSample 21D showed imaging in the same Cy3 channel was possible by staining with a different antibody. - A colon adenocarcinoma slide was stained with a primary antibody mouse anti-anti-pan cytokeratin clone PCK-26, and detected with a Cy3-conjugated donkey anti-mouse, to form
Sample 22A.Sample 22A was imaged and then counterstained with DAPI to formSample 22B.Sample 22B was imaged and then treated with a NaOH solution to formSample 22C, which was imaged again. Staining, imaging, and dye destruction steps were performed according to the procedures described herein in Examples 8 and 9.Sample 22C was restained with a primary antibody SmA, and detected with a Cy3-conjugated anti-rabbit to form Sample 22d and imaged again. -
FIG. 16 shows micrographs ofSamples 22A (Cye channel) and 22B (DAPI channel) before dye destruction) and Sample 22c after dye destruction. After treatment with NaOH little or no signal from Cy3 remained (22D) and only DAPI was observed (not shown). Micrograph ofSample 22D showed imaging in the same Cy3 channel was possible by staining with a different antibody. Nuclear information about the tissue was obtained by staining with DAPI (Sample 22B). - A breast tissue microarray (
Sample 23A) was imaged in the DAPI and Cy3 channel to measure the autofluorescence from the tissue.Sample 23A was then stained with DAPI to form Sample 23B, imaged and then treated with NaOH to formSample 23C, and imaged again.Sample 23A was also stained with a primary antibody mouse anti-estrogen receptor alpha clone 1D5, and detected with a Cy3-conjugated donkey anti-mouse, to formSample 23D.Sample 23D was imaged then treated with a NaOH solution to formSample 23E, which was imaged again. Staining, imaging, and dye destruction steps were performed according to the procedures described herein in Examples 8 and 9. -
FIG. 17 shows micrographs ofSamples 23A-E. Micrographs ofSamples 23C and 23Ewere compared to the autofluorescence (baseline) observed inSample 23A. Both Samples showed signal reduction. DAPI-stained sample showed signal reduction possibly due to destruction of nucleic acids to which DAPI binds. - A breast sample was stained with a primary antibody mouse anti-pan cytokeratin clone PCK-26, detected visualized with a Cy3-conjugated donkey anti-mouse to form
Sample 24A, and counterstained with DAPI (not shown) and imaged.Sample 24A was then treated with a NaOH solution to remove Cy3 signal (not shown), while retaining DAPI signal to form Sample 24B and imaged as shown inFIG. 18 at Sample 24B Staining, imaging, and dye destruction steps were performed according to the procedures described herein in Examples 8 and 9. Sample 24B was restained with a Cy3-directly conjugated beta catenin antibody to formSample 24C and imaged again. The sample was again treated with NaOH and labeled with Cy3-direct conjugated SmA antibody to formSample 24D and imaged again. The images obtained were registered, pseudo colored and overlaid (Sample 24E) to give spatial information for expressing antigen.Sample 24D was further stained with H&E to formSample 24F. -
FIG. 18 shows micrographs ofSample 24A (Cy3 channel before dye destruction) and Sample 24B (DAPI channel after dye destruction). After treatment with NaOH little or no signal from Cy3 remained and only DAPI was observed. Micrographs ofSamples Sample 24F). - Images were taken prior to staining to baseline the autofluorescence coming from each channel. A normal prostate slide was stained with a cocktail of two primary antibodies: goat anti-vimentin and mouse anti-pan cytokeratin. The two primary antibodies were detected with a second cocktail of secondary antibodies: Cy3-conjugated donkey anti-goat and Cy5-conjugated donkey anti-mouse to form
Sample 25A Cy3 and Cy5 respectively.Sample 25A was imaged and then treated with a NaOH solution. The tissue was then sequentially stained with a two primary antibodies: rabbit anti-alpha catenin, which was subsequently detected with Cy3 conjugated secondary antibody, and then Cy5 conjugated anti-androgen receptor, to formSamples 25B (25b-Cy3 and 25b-Cy5 respectively). Following imaging, the sample was treated with a NaOH solution followed by staining-imaging-NaOH treatment-staining steps using seven Cy-directly conjugated antibodies (Samples 25C-25I). The antibodies used were: smooth muscle alpha actin, beta catenin, pan cadherin, Von Willebrand Factor VII,keratin 5,keratin 8/18, and e-cadherin. Each staining step included counterstaining with DAPI (Sample 25J). -
FIG. 19 shows micrographs ofSample 25A (Cy3 and Cy5 channels),Sample 25B (Cy3 and Cy5 channels), andSamples 25C-25J.FIG. 19 shows that multiple imaging in the same Cy3 channel was possible by staining with different antibodies. 12-channel multiple imaging was possible with 9 of the channels being Cy3 channels. - Images were taken before staining to baseline the autofluorescence coming from each channel. A normal prostate slide was stained with a Cy3-directly conjugated anti-pan cadherin to form
Sample 26A. The slide was imaged and treated with H2O2 (Sample 26B), restained with Cy3-conjugated anti-vimentin (Sample 26c), treated with H2O2 (Sample 26D), restained with Cy3-conjugated anti-pan cytokeratin (Sample 26E), treated with H2O2 (Sample 26F), restained with Cy3-conjugated anti-SmA (Sample 26g), and treated with H2O2 (Sample 26H). -
FIG. 20 shows micrographs ofSamples 26A-G.FIG. 20 shows that multiple imaging in the same Cy3 channel was possible by staining with different antibodies and destroying the signal using H2O2. - A normal prostate (
Sample 27A) was imaged in the Cy3 channel to measure the autofluorescence from the tissue.Sample 27A was then stained with Cy3-conjugated anti-SmA to formSample 27B, imaged and then treated with NaOH to formSample 27C, and imaged again. Staining, imaging, and dye destruction steps were performed according to the procedures described herein in Examples 8 and 9.FIG. 21 shows the micrographs ofSamples 27A-C. Residual stain was observed post NaOH treatment shown insample 27C. - Residual stain values were also monitored during the twelve channels multiple imaging described in Example 17. Using Gimp 2.2, average pixel intensities were collected for each background and NaOH treated image and tabulated.
FIG. 22 shows a plot of average pixel intensity of the background for each cycle in the imaging as well as a small image of what the background looked like prior to staining. A large spike in residual stain intensity was observed incycle 4 as SmA, an abundantly expressed protein was stained incycle 3. - Two prostate slides were stained with Cy3-directly conjugated SmA (
Samples Sample 28C), the other with H2O2 (Sample 28D). Two other prostate slides were stained with Cy3-directly conjugated pan cadherin (Samples Sample 29C), the other with H2O2 (Sample 29D). -
FIG. 23 shows head-to-head micrographs of SmA and pan cadherin staining and signal removal. H2O2 showed more efficient dye removal for both SmA and pan cadherin when compared to NaOH. - Two prostate slides were stained with Cy3-directly conjugated pan cadherin (
Samples Sample 30C andSample 30D inFIG. 24 .. -
FIG. 24 compares staining from first cycle pan cadherin stain to the 9th cycle of pan cytokeratin using NaOH or H2O2 to destroy the signal after each staining.FIG. 25 compares background from after dye removal (Samples Samples Sample 30D,FIG. 25 ) showed more efficient dye removal of pan keratin when compared to NaOH (Sample 30C,FIG 25 ) after the 9th stepFIG. 26 is a plot of average pixel intensities for the background of each cycle for the NaOH or H2O2 slides. As the plot inFig. 26 shows, the background for the H2O2 slide was significantly less for each cycle after the initial baseline. - A colon tissue slide was stained with a primary antibody rabbit anti-beta catenin and detected with a Cy3-conjugated donkey anti-rabbit secondary antibody to form
Sample 31A.Sample 31A was imaged and then treated with a NaOH solution to formSample 31B, which was imaged again. Staining, imaging, and dye destruction steps were performed according to the procedures described herein in Examples 8 and 9.Sample 31B was restained with a Cy3-conjugated anti-rabbit secondary antibody to formSample 31C, and imaged again.FIG. 27 shows micrographs ofSamples 31A-C.FIG. 27 shows that the primary antibody remains bound to the sample after NaOH treatment. - A colon tissue slide was stained with a primary antibody mouse-anti-PCNA and detected with a Cy3-conjugated donkey anti-mouse secondary antibody to form
Sample 32A.Sample 32A was imaged and then treated with a NaOH solution to formSample 32C, which was imaged again. Staining, imaging, and dye destruction steps were performed according to the procedures described in Examples 8 and 9.Sample 32B was restained with a Cy3-conjugated anti-mouse secondary antibody to formSample 32C, and imaged again.FIG. 28 shows that the primary antibody is still bound to the sample after treatment with NaOH. - The following examples 23-26 illustrate embodiments of the invention according to which multiple imaging of tissue samples is conducted using enzyme-substrate-fluorophore conjugates. Multiple staining is obtained by staining, imaging, chemically destroying the fluorophore, restaining, imaging, and repeating the steps
- The antibodies used were rabbit anti-β-catenin directly conjugated to horse radish peroxidase (HRP) enzyme,
mouse anti-keratin 5 and donkey anti-mouse conjugated to HRP antibody. The substrate for the HRP enzyme was Cy5-conjugated tyramide substrate. - A slide prepared in as Example 6 was incubated with HRP-conjugated anti-β-catenin antibody prepared in Example 23. Primary antibody incubation was conducted in 3 percent BSA for 45 minutes at 37°C. After incubation, the slide was subjected to an extensive series of PBS washes. The HRP-stained slide was incubated with Cy5-conjugated tyramide substrate in PBS/0.1% Triton X-100 for 10 minutes. After incubation, the slide was subjected to an extensive series of PBS washes. The Cy5 tyramide substrate was then imaged with a Zeiss Axio Imager. The magnification used was 20x unless otherwise stated.
FIG. 29 shows a micrograph ofSample 33 after staining for β-catenin. After image acquisition, the slide was washed with PBS to prepare for signal destruction. - H2O2 solution was used for signal destruction. A H2O2 solution was prepared by mixing 10 mL of 0.5 M sodium carbonate (pH 10), 5 mL of 30 volume percent H2O2, and 35 mL of water. A slide was placed in the H2O2 solution for 15 minutes with gentle agitation. After 15 minutes, the slide was washed again with PBS (Sample 34), coverslipped and imaged again to check the efficacy of the dye destruction. The reimaging step was carried out using the process described above in Example 24.
FIG. 29 shows a micrograph ofSample 34 after signal modification showing substantial removal of signal after signal destruction.Sample 34 was then re-incubated with Cy5-tyramide to determine residual activity of the HRP enzyme and imaged as above.FIG. 29 shows a micrograph ofSample 35 and no further Cy5 and HRP enzyme is chemically inactivated by H2O2 solution such that no further enzyme-substrate reaction occurs. - The slide (Sample 35) from Example 25 was incubated
mouse anti-keratin 5 antibody. Incubation was conducted in 3 percent BSA for 45 minutes at 37 C. After incubation, the slide was subjected to an extensive series of PBS washes. Thekeratin 5 antibody was then detected with an HRP conjugated donkey anti-mouse antibody in BSA for 45 minutes at 37°C. The HRP-stained slide was incubated with Cy5-conjugated tyramide substrate as in Example 25. After incubation, the slide was subjected to an extensive series of PBS washes. The Cy5-restained slide (Sample 36) was counterstained with the morphological stain, DAPI, and coverslipped. The coverslipped slide was re-imaged using the process described above in Example 24.FIG. 29 shows a micrograph ofSample 36 after staining for k5 protein. - The following Examples 27-31 illustrate embodiments of the invention according to which multiple imaging of dot blots is conducted. Multiple staining is obtained by staining, imaging, chemically destroying the fluorophore, restaining, imaging, and repeating the steps
- Target proteins, β-catenin peptide (Sigma 26561-1 lot R1078-005) and CEA antigen were spotted on a polyvinylidene fluoride (PVDF) membrane at three different concentrations: 1 microgram, 100 nanograms, and 10 nanograms. The blot was blocked using 5% milk, in 1xTBS-T (Tris-buffered
saline Tween 20 buffer) for 1 hour at room temperature. - A blot prepared in Example 27 was incubated with a primary antibody, rabbit anti-β-catenin antibody (Sigma, C7738). Incubation was conducted at 1:200 dilution of antibody using 1 percent milk in 1xTBS-T for 1 hour at room temperature (RT). After incubation, the blot was subjected to an extensive series of washes. The blot was then incubated with a dye-conjugated secondary antibody donkey anti-rabbit Cy5 (prepared as in Example 6) at 1:500 dilution using 1 percent milk in 1xTBS-T for 1 hour at room temperature (RT). After incubation, the blot (Sample 37) was washed with 1xTBS-T. Images of the blot (Sample 37) were captured on Typhoon Imager (GE Healthcare) using Cy5 channel and a voltage setting of 450V.
FIG. 30 shows an image ofSample 37. As shown inFIG. 30 , spots of variable signal intensities are observed for the three different concentrations of β-catenin target protein. - H2O2 solution was used for signal destruction. A H2O2 solution was prepared by mixing 10 mL of 0.5M sodium carbonate (pH 10), 5 mL of 30 volume percent H2O2, and 35 mL of water. The blot prepared in Example 28 was placed in the H2O2 solution for 15 minutes at room temperature with gentle agitation. After 15 minutes, the blot was washed three times using 1 x TBS-T for 5 minutes to form
Sample 38. The blot (Sample 38) was reimaged and images of the blot were captured on Typhoon Imager (GE Healthcare) using Cy5 channel and a voltage setting of 450V.FIG. 30 shows an image ofSample 38. As shown inFIG. 30 , no spots were observed after the dye destruction step indicating substantially complete destruction of Cy5. - The blot from Example 29 was incubated with a primary antibody mouse anti-CEA antibody. Incubation was conducted at 1:200 dilution using 1 percent milk in 1xTBS-T for 1 hour at room temperature (RT). After incubation, the blot was subjected to an extensive series of washes. The blot was then incubated with a dye-conjugated secondary antibody donkey anti-mouse Cy5 (prepared in Example 6) at 1:500 dilution using 1 percent milk in 1xTBS-T for 1 hour at room temperature (RT). After incubation, the blot (Sample 39) was subjected to an extensive series of washes. Images of the blot (Sample 39) were captured on Typhoon using Cy5 channel and a voltage setting of 450V.
FIG. 30 shows an image ofSample 39. As shown inFIG. 30 , spots of variable signal intensities are observed for the three different concentrations of CEA antigen. The Example illustrates that two different targets may be detected using a single signal generator. -
Samples FIG. 30 with regions highlighted by a square numbered 4-9 inFIG 30 ). The signals from each sample each of the peptide spots were normalized to an average of threebackground spots FIG. 30 .FIG. 31 is a plot of relative signal intensities of the spots forSamples - The following examples 32-34 illustrate embodiments of the invention according to which the fluorophore is destroyed by an oxidizing agent without significantly stripping the probe (primary antibody) from the solid-support.
-
Alexa 488, BODIPY FL C5 (D6184), hydroxycoumarin (H1193) were obtained from Invitrogen (Carlsbad, CA); ATTO 495, ATTO 635, and ATTO 655, were obtained from ATTO-TEC (Siegen, Germany); DY-734-NHS was obtained from Dyomics (Jena, Germany); Fluorescein cadaverine was obtained from Biotium Inc. (Hayward, CA). Goat anti-mouse IgG-Cy3 and goat anti-mouse IgG-Cy5 were obtained from Jackson ImmunoResearch Laboratories, Inc. (West Grove, PA). DPBS and PBS were obtained from Invitrogen; 16% PFA were obtained from Electron Microscopy Sciences (Hatfield, PA). Goat serum was obtained from Vector Laboratories (Burlingame, CA). All other reagents were obtained from Sigma (St. Louis, MO). - LS174T cells (ATCC, CL-188) expressing carcino embryonic antigen (CEA) were cultured in EMEM (ATCC, cat# 30-2003) Supplemented with 10% FBS. Cells were incubated at 37°C and 5% CO2. Upon 90% confluence, they were subcultured or seeded into 96-well-plates and continued to grow for additional two days.
- Confluent cells on 96-well-plates were rinsed with DPBS (with calcium) twice, and then 2% PFA (final concentration) was added to fix cells for 10 minutes, followed by permeabilization using 0.1% Triton X-100 in PBS for 5 minutes. Next, cells were incubated in a blocking buffer (10% goat serum + 3% BSA) for 1 hour at room temperature. Mouse anti-CEA (
final concentration 10 µg/ml in 3% BSA) was added immediately after the blocking step and incubated overnight. - To investigate the effect of oxidizing agents on primary antibody, various oxidizing agent solutions (as described in Table 1) were added to half the plate for 30 minutes, and then rinsed thoroughly with PBS. The oxidizing reagents employed were hydrogen peroxide, aqueous bromine, potassium permanganate, sodium dichromate, I2/KI solution, t-butyl peroxide, and t-butyl hydrogen peroxide. The other half of the plate was used as control with parallel PBS incubations and washes and no oxidizing agent solutions were applied. To test the effect of a base on the probe different bases, such as NaOH, aqueous DBU (diazobicyclo-undecene), and aqueous butyl amine were also contacted with the plate. PBS was applied as a control agent.
- All wells were incubated with 50 µl/well goat anti-mouse IgG-Cy3 or goat anti-mouse IgG-Cy5 (1:200 dilution). The whole plate was scanned using Gemini M5 spectrophotometer (Molecular Devices, Sunnyvale, CA). A total of five spots were scanned in each well and then averaged to get one reading for each well. For Cy3 dye, fluorescence was read at excitation wavelength at 544 nm,
emission 580 nm, andcutoff 570 nm. For Cy5, Excitation 640 nm, Emission 675, and cutoff 665. - Table 1 shows the fluorescence values measured after application of the oxidizing agent to the primary antibody as shown in columns 2 (Cy3) and 4 (Cy5). The values in the Table are normalized fluorescence intensity, that is, a ratio of the fluorescence intensity measured for wells contacted with the oxidizing agent to the fluorescence intensity measured for the control wells (no oxidizing solution applied) multiplied by 100. Therefore, a value close to 100% means that the oxidizing solution has no effect on primary antibody when compared to its control (no oxidizing solution applied).
- Table 1 shows that some oxidizing agent (e.g. H2O2) have almost no effect on primary antibody (P>0.1), whereas in other cases, the concentration of the oxidizing agent may be varied (e.g., for I2/KI) such that the primary antibody is not effected substantially. The bases employed (NaOH and butyl amine) exhibited substantial destruction of the primary antibodies across a variety of concentrations employed. PBS showed no effect on the primary antibody.
- To test the effect of oxidizing agent on fluorophore-labeled cells, various oxidizing agent solutions (as described in Table 1) were added to different rows (control part of the plate) for 30 minutes. The plate was read again after thorough washing as described in Example 33.
- Table 1 shows that some oxidizing agent (e.g. H2O2) have almost no effect on primary antibody but result in substantial loss of fluorescence properties for the cyanine dye. The data reported in Table 1 further shows that fluorescent signal destruction worked better at high pH for H2O2 solutions. As described herein, in other cases, the concentration of the oxidizing agent may be varied (e.g. for I2/KI) such that the primary antibody is not affected substantially but the cyanine dye is. The bases employed (NaOH and butyl amine) exhibited substantial loss of signal from the cyanine dye but this may be due to destruction (or stripping) of the primary antibodies by the base. PBS showed no effect on the primary antibody and the cyanine dye. Table 1 Normalized fluorescence intensity measured after contacting the plate with different oxidizing agents.
Bleaching Solution On primary Cy3 (up to 6 sets) Bleaching Cy3 (up to 4 sets) On Primary Cy (2 sets) Bleaching Cy5 (1 set) Oxidizing reagents 3% H2O2, pH 10105% 11% 124% 0% 3% H2O2 pH5 99% 73 % Aqueous Bromine 100% 14% 4 % potassium permanganate 0% 0% 1% 0% 1 % potassium permanganate 80% 4% 4% sodium dichromate.2H2O 111% 69% 88% 25% 4% sodium dichromate.2 H2O in Acetic acid 213% 10% 5% I2, 10 % KI 9% 0% 7% 4% 0.5% I2, 1% KI 82% 10% 0.05% I2, 0.1% KI 101% 72% 3.5% t-butyl peroxide in Acetonitrile 45% 103% 49% 84% 3.5% t-butyl hydroperoxide 166% 65% 107% 44% Bases 0.35 N NaOH 17% 11% 14% 0.1 N NaOH 37% 13% 34% 5 % DBU 40% 12% 40% 1 % DBU 38% 41% 5 % Butylaminine 20% 13% 38% Control PBS 108% 79% 91% 96% - Optical density (O.D.) was used to monitor dye destruction. 10 µl of dye was mixed with equal volume of oxidizing solution and then 2 µl of the mixed solution was loaded to ND-1000 Spectrophotometer (NanoDrop Technologies, Inc. Wilmington, DE). Optical density (O.D.) was read at a full spectrum ranging from 200 nm to 750 nm. For kinetic study, measurements were taken at
time - To study the kinetics of dye destruction, hydrogen peroxide (1.5% H2O2 at pH 10) was used as an oxidizing agent and Cy3 and Cy5 as representative dyes using the method describe in Example 36. The fluorescence spectrum of the dye-oxidizing solution mixture was monitored for a period of 30 minutes.
FIG. 32 shows the time profile of spectrums of Cy3 and Cy5. A rapid decrease in O.D. was observed, indicating dye destruction. In both cases, 15 minute incubation in 1.5% H2O2 could practically destroy the dyes. O.D. values at peak excitation reduced to 2% for both Cy3 and Cy5 after 15 minutes. - A range of H2O2 concentrations from 0 to 1.5% were tested and absorbance spectrum was monitored over 30 minutes using the method described in Example 35. The pH of H2O2 solution was kept at 10. Cy3 was used as a dye, and absorbance was recorded at its peak wavelength at 550 nm. Except for 0.1% H2O2, all other concentrations of H2O2 showed very similar results, and almost reduced dye absorbance to 5% within 15 minutes as shown in
FIG. 33 . There is no statistical difference among treatments with concentrations of 0.5%, 1% and 1.5% (P>0.1). - A panel of fluorescent dyes was tested for the effect of H2O2 (3% H2O2 at pH 10) on different fluorophores using the method described in Example 35. Absorbance spectrum was monitored over 30 minutes and the absorbance values are shown in
FIG. 34 . Data shown here are O.D. values at dye's maximum absorbance wavelength normalized to O.D. attime 0. Fluorescein, which is very sensitive to photobleaching, was relatively stable to this oxidizing method.ATTO 496 andAlexa 488, were also less sensitive to the oxidizing agent when compared to other dyes.FIG. 34 shows that the dyes could be destroyed using H2O2. - A range of H2O2 concentrations (from 20x to 2000x dilution) were tested and absorbance spectrum was monitored over 30 minutes using the method described in Example 36. The pH of H2O2 solution was kept at 10. The absorbance values were compared to a control sample of a solution of QD 655 at different concentrations (from 20x to 2000x dilution).
- Qdot 655 goat F(ab')2 anti-mouse IgG conjugate (1 µM) solution was diluted 10x, 100x or 1000x with 0.775M sodium bicarbonate solution (adjusted to pH 10). To each solution an equal volume of 6% hydrogen peroxide was added. 100 µl aliquots of each in triplicates were placed in a 96 well microtitre plate. Samples without peroxide but diluted to the same final concentration with water were used as controls. A 2x diluted bicarbonate solution was used as background control. Fluorescence was measured over time on spectromax M2 plate reader using following parameters:
Excitation 350 nm, Emission 655 nm and auto cut off 630 nm. For the lowest concentration, 99% reduction in fluorescence was achieved after 5 min. With in 30 min, fluorescence of all peroxide samples was reduced by >99.5%. Fluorescence of control samples was mostly intact (>93% for the lowest conc. sample and ~99% for the highest conc. sample). - Three percent hydrogen peroxide in bicarbonate buffer (pH 10) was used to destroy signal. The absorbance values were compared to a control sample of a solution of QD 655 at different concentrations (from 20x to 2000x dilution). At all concentrations of Qdot the fluorescence reduced to less than 6% of the control value within 5 minutes as shown in
FIG. 35 . - Absorbance spectra of the fluorescein dye FAM cadaverine ("FAM-CAD") were measured using different oxidizing agent conditions for Samples 41 (FAM-CAD, H2O2 and H2O (1:1:1), 42 (FAM-CAD, H2O2 and FeCl3 (1:1:1)), 43 (FAM-CAD, H2O and FeCl3 (1:1:1)), 44 (FAM-CAD and H2O (1:2)). A solution of Fluorescein-cadaverine was mixed with 9% hydrogen peroxide and a 2% solution of FeCl3 in water in the ratio of 1:1:1 1 by volume. Mixture was allowed to stand for 5 minutes. Since the addition of FeCl3 changes pH to highly acidic and fluorescein spectrum is known to be different under acidic conditions, prior to UV/VIS spectrum measurement, solution was made basic by addition of 1N NaOH, filtered and its spectrum was recorded. Solutions similarly treated except where either the hydrogen peroxide was replaced with water or FeCl3 solution was replaced with water were used as controls. A solution where both FeCl3 and hydrogen peroxide were replaced with water was also used as another control. Although in the presence of peroxide, spectra are a bit noisy and baseline is raised due to bubble formation, spectra clearly showed that while control samples were unaffected, practically all of the fluorescein was destroyed in the test sample. The absorbance reduced considerably after 5 minutes for
Sample 42 as shown inFIG. 36 , indicating that fluorescein can be destroyed by employing an oxidizing agent to create hydroxyl radicals. - The invention may be embodied in other specific forms without departing from the spirit or essential characteristics thereof. The foregoing embodiments are therefore to be considered in all respects as illustrative rather than limiting on the invention described herein. The scope of the invention is thus indicated by the appended claims rather than by the foregoing description, and all changes that come within the meaning and range of equivalency of the claims are therefore intended to be embraced therein. The invention may be embodied in other specific forms without departing from the spirit or essential characteristics thereof. The foregoing embodiments are therefore to be considered in all respects as illustrative rather than limiting on the invention described herein. The scope of the invention is thus indicated by the appended claims rather than by the foregoing description, and all changes that come within the meaning and range of equivalency of the claims are therefore intended to be embraced therein.
Claims (13)
- A method of probing multiple targets in a biological sample comprising a tissue section, the method comprising:(a) providing a tissue section containing multiple targets(b) binding at least one fluorophore-labeled antibody probe to one or more targets present in the tissue section;(c) binding at least one control probe to one or more targets present in the tissue section;(d) detecting at least one signal from the at least one fluorophore-labeled antibody probe bound in step (b) and detecting at least one control signal from the at least one control probe bound in step (c);(e) applying to the sample in step (d) a solution comprising an oxidizing agent that selectively inactivates the fluorophore label(s) of the at least one fluorophore-labeled antibody probe and not the control probe(s);(f) binding at least one fluorophore-labeled antibody probe to one or more targets present in the sample after step (e); and(g) detecting at least one signal from the at least one fluorophore-labeled antibody probe bound in step (f).
- The method of claim 1, wherein the solution is a basic solution.
- The method of any preceding claim, wherein the solution in step (e) is a basic solution that does not contain a reducing agent or a surfactant.
- The method of any preceding claim, wherein the oxidizing agent is selected from hydrogen peroxide, potassium permanganate, sodium dichromate, aqueous bromine, iodine-potassium iodide, and t-butyl hydroperoxide.
- The method of any preceding claim, wherein the oxidizing agent is hydrogen peroxide.
- The method of any preceding claim, wherein one or both of steps (b) and (f) comprises binding the tissue section with a plurality of fluorophore-labeled antibody probes, each comprising a different antibody and a different fluorophore label.
- The method of any preceding claim, wherein the fluorophore labels comprise a cyanine dye.
- The method of any preceding claim, which uses 4',6-diaminidino-2-phenylindole as a control probe.
- The method of any preceding claim, wherein steps (e)-(g) are repeated one or more times, preferably at least 5, at least 10, or at least 20 times.
- The method of any preceding claim, wherein the oxidation step (e) is performed for less than about 30 minutes, preferably from about 30 seconds to about 15 minutes.
- The method of any preceding claim, wherein at least one fluorophore label in step (b) is the same as at least one fluorophore label in step (f).
- The method of any preceding claim, wherein an antibody in step (f) binds a different target to the at least one antibody in step (b).
- The method of any preceding claim, wherein the oxidation step is performed without inactivating more than 20% of the control probe.
Applications Claiming Priority (3)
| Application Number | Priority Date | Filing Date | Title |
|---|---|---|---|
| US11/560,599 US7629125B2 (en) | 2006-11-16 | 2006-11-16 | Sequential analysis of biological samples |
| US11/864,085 US7741045B2 (en) | 2006-11-16 | 2007-09-28 | Sequential analysis of biological samples |
| EP07871481A EP2082226B1 (en) | 2006-11-16 | 2007-11-15 | Sequential analysis of biological samples |
Related Parent Applications (2)
| Application Number | Title | Priority Date | Filing Date |
|---|---|---|---|
| EP07871481.3 Division | 2007-11-15 | ||
| EP07871481A Division EP2082226B1 (en) | 2006-11-16 | 2007-11-15 | Sequential analysis of biological samples |
Publications (2)
| Publication Number | Publication Date |
|---|---|
| EP2381257A1 EP2381257A1 (en) | 2011-10-26 |
| EP2381257B1 true EP2381257B1 (en) | 2014-03-26 |
Family
ID=39313177
Family Applications (2)
| Application Number | Title | Priority Date | Filing Date |
|---|---|---|---|
| EP07871481A Active EP2082226B1 (en) | 2006-11-16 | 2007-11-15 | Sequential analysis of biological samples |
| EP11175116.0A Active EP2381257B1 (en) | 2006-11-16 | 2007-11-15 | Sequential analysis of biological samples |
Family Applications Before (1)
| Application Number | Title | Priority Date | Filing Date |
|---|---|---|---|
| EP07871481A Active EP2082226B1 (en) | 2006-11-16 | 2007-11-15 | Sequential analysis of biological samples |
Country Status (11)
| Country | Link |
|---|---|
| US (1) | US7741045B2 (en) |
| EP (2) | EP2082226B1 (en) |
| JP (1) | JP5149303B2 (en) |
| AT (1) | ATE520026T1 (en) |
| AU (1) | AU2007323794B2 (en) |
| CA (1) | CA2669092C (en) |
| DK (1) | DK2082226T3 (en) |
| ES (1) | ES2459725T3 (en) |
| PL (1) | PL2082226T3 (en) |
| PT (1) | PT2082226E (en) |
| WO (1) | WO2008064067A2 (en) |
Families Citing this family (73)
| Publication number | Priority date | Publication date | Assignee | Title |
|---|---|---|---|---|
| US20080032321A1 (en) * | 2006-08-07 | 2008-02-07 | General Electric Company | System and methods for analyzing images of tissue samples |
| US8131476B2 (en) * | 2006-08-07 | 2012-03-06 | General Electric Company | System and method for co-registering multi-channel images of a tissue micro array |
| US8060348B2 (en) * | 2006-08-07 | 2011-11-15 | General Electric Company | Systems for analyzing tissue samples |
| US7629125B2 (en) * | 2006-11-16 | 2009-12-08 | General Electric Company | Sequential analysis of biological samples |
| US20100279272A1 (en) * | 2008-02-13 | 2010-11-04 | Michael Craig Burrell | Multiplexed analysis methods using sers-active nanoparticles |
| EP2110076A1 (en) * | 2008-02-19 | 2009-10-21 | Helmholtz Zentrum München Deutsches Forschungszentrum für Gesundheit und Umwelt (GmbH) | Method and device for near-field dual-wave modality imaging |
| CN102137618B (en) | 2008-07-25 | 2015-06-17 | 健康与环境慕尼黑德国研究中心赫姆霍茨中心(有限公司) | Quantitative multi-spectral opto-acoustic tomography (MSOT) of tissue biomarkers |
| JP5566456B2 (en) | 2009-06-29 | 2014-08-06 | ヘルムホルツ・ツェントルム・ミュンヒェン・ドイチェス・フォルシュンクスツェントルム・フューア・ゲズントハイト・ウント・ウムベルト(ゲーエムベーハー) | Imaging apparatus and imaging method, computer program, and computer readable storage medium for thermoacoustic imaging of a subject |
| WO2011012274A1 (en) | 2009-07-27 | 2011-02-03 | Helmholtz Zentrum München Deutsches Forschungszentrum Für Gesundheit Und Umwelt (Gmbh) | Imaging device and method for optoacoustic imaging of small animals |
| US8269827B2 (en) * | 2009-09-29 | 2012-09-18 | General Electric Company | System and methods for mapping fluorescent images into a bright field color space |
| US9677125B2 (en) * | 2009-10-21 | 2017-06-13 | General Electric Company | Detection of plurality of targets in biological samples |
| JP5978220B2 (en) | 2010-10-29 | 2016-08-24 | プレジデント アンド フェローズ オブ ハーバード カレッジ | Nucleic acid nanostructure barcode probe |
| US20120269418A1 (en) * | 2011-04-22 | 2012-10-25 | Ge Global Research | Analyzing the expression of biomarkers in cells with clusters |
| US8639013B2 (en) | 2011-08-17 | 2014-01-28 | General Electric Company | System and methods for generating a brightfield image using fluorescent images |
| US8568991B2 (en) | 2011-12-23 | 2013-10-29 | General Electric Company | Photoactivated chemical bleaching of dyes |
| US9176032B2 (en) | 2011-12-23 | 2015-11-03 | General Electric Company | Methods of analyzing an H and E stained biological sample |
| WO2013137715A1 (en) * | 2012-03-16 | 2013-09-19 | Umc Utrecht Holding B.V. | Biomarkers for adverse cardiac remodeling |
| WO2013148498A1 (en) | 2012-03-27 | 2013-10-03 | Ventana Medical Systems, Inc. | Signaling conjugates and methods of use |
| KR20140145141A (en) | 2012-03-30 | 2014-12-22 | 클래리언트 다이아그노스틱 서비시즈, 인크. | Methods for generating an image of a biological sample |
| US20140024024A1 (en) * | 2012-07-17 | 2014-01-23 | General Electric Company | Methods of detecting dna, rna and protein in biological samples |
| EP2742854B1 (en) | 2012-12-11 | 2021-03-10 | iThera Medical GmbH | Handheld device and method for tomographic optoacoustic imaging of an object |
| EP2754388B1 (en) | 2013-01-15 | 2020-09-09 | Helmholtz Zentrum München Deutsches Forschungszentrum für Gesundheit und Umwelt GmbH | System and method for quality-enhanced high-rate optoacoustic imaging of an object |
| JP2016513794A (en) | 2013-03-06 | 2016-05-16 | ゼネラル・エレクトリック・カンパニイ | Method for analyzing H & E stained biological sample |
| WO2014195363A1 (en) * | 2013-06-04 | 2014-12-11 | Roche Diagnostics Gmbh | Novel compounds useful for fret and methods related thereto |
| JP6475718B2 (en) | 2013-07-30 | 2019-02-27 | プレジデント アンド フェローズ オブ ハーバード カレッジ | Quantitative DNA-based imaging and super-resolution imaging |
| US9778263B2 (en) | 2013-11-13 | 2017-10-03 | General Electric Company | Quantitative in situ characterization of biological samples |
| ES2758173T3 (en) * | 2014-03-05 | 2020-05-04 | Ucl Business Ltd | Chimeric antigen receptor (CAR) with antigen-binding domains for the constant region of beta T lymphocyte receptors |
| US20230021548A1 (en) | 2014-03-05 | 2023-01-26 | Autolus Limited | Methods |
| US10294510B2 (en) * | 2014-03-11 | 2019-05-21 | President And Fellows Of Harvard College | High-throughput and highly multiplexed imaging with programmable nucleic acid probes |
| WO2016018963A1 (en) | 2014-07-30 | 2016-02-04 | President And Fellows Of Harvard College | Probe library construction |
| US9933431B2 (en) | 2014-08-22 | 2018-04-03 | Arizona Board Of Regents On Behalf Of Arizona State University | System and method for iterative detection of biological molecules |
| EP3037820A1 (en) | 2014-12-27 | 2016-06-29 | Miltenyi Biotec GmbH | Cell detection methods and reagents having a releasable labelling moiety |
| JP6841609B2 (en) | 2015-07-10 | 2021-03-10 | 3スキャン インコーポレイテッド | Spatial multiplexing of histological staining |
| US10640816B2 (en) | 2015-07-17 | 2020-05-05 | Nanostring Technologies, Inc. | Simultaneous quantification of gene expression in a user-defined region of a cross-sectioned tissue |
| US20170241911A1 (en) | 2016-02-22 | 2017-08-24 | Miltenyi Biotec Gmbh | Automated analysis tool for biological specimens |
| US10871490B2 (en) | 2016-02-29 | 2020-12-22 | Multenyi Biotec, gmbH | Assay for detection of chimeric antigen receptor T cells |
| WO2017202962A1 (en) | 2016-05-24 | 2017-11-30 | INSERM (Institut National de la Santé et de la Recherche Médicale) | Methods and pharmaceutical compositions for the treatment of non small cell lung cancer (nsclc) that coexists with chronic obstructive pulmonary disease (copd) |
| CN109475864B (en) | 2016-06-29 | 2022-03-04 | 美天施生物科技有限两合公司 | Multi-stage disposable cartridge for biological samples |
| CN106290878A (en) * | 2016-09-10 | 2017-01-04 | 天津大学 | The preparation method of pancreatic tumour mark CA242 immuno-chromatographic test paper strip based on quantum dot |
| AU2017370751B2 (en) | 2016-12-09 | 2023-11-09 | Ultivue, Inc. | Improved methods for multiplex imaging using labeled nucleic acid imaging agents |
| WO2018122249A1 (en) | 2016-12-28 | 2018-07-05 | INSERM (Institut National de la Santé et de la Recherche Médicale) | Methods for predicting the survival time of patients suffering from a microsatellite stable colorectal cancer |
| WO2018122245A1 (en) | 2016-12-28 | 2018-07-05 | INSERM (Institut National de la Santé et de la Recherche Médicale) | Methods of predicting the survival time of patients suffering from cms3 colorectal cancer |
| EP3619534A1 (en) | 2017-05-05 | 2020-03-11 | INSERM (Institut National de la Santé et de la Recherche Médicale) | Microtubule-targeting drugs as immune checkpoint inhibitors and methods of screening novel immune checkpoint inhibitors for the treatment of cancers and infectious diseases |
| WO2018218150A1 (en) | 2017-05-26 | 2018-11-29 | President And Fellows Of Harvard College | Systems and methods for high-throughput image-based screening |
| EP3489684A1 (en) * | 2017-11-27 | 2019-05-29 | Miltenyi Biotec GmbH | Method for photobleaching stained cells |
| JP7372927B6 (en) | 2018-02-12 | 2023-11-27 | ナノストリング テクノロジーズ,インコーポレイティド | Biomolecular probes and detection methods for detecting gene and protein expression |
| JP2020071152A (en) * | 2018-10-31 | 2020-05-07 | ソニー株式会社 | Method for immunostaining, system for immunostaining, and immunostaining kit |
| AU2020205150A1 (en) | 2019-01-03 | 2021-07-22 | Assistance Publique-Hôpitaux De Paris (Aphp) | Methods and pharmaceutical compositions for enhancing CD8+ T cell-dependent immune responses in subjects suffering from cancer |
| CN109770853B (en) * | 2019-01-30 | 2022-01-14 | 上海师范大学 | Zebra fish wound detection method |
| US11633741B2 (en) | 2019-03-19 | 2023-04-25 | Miltenyi Biotec B.V. & Co. KG | Slide chamber |
| EP3947737A2 (en) | 2019-04-02 | 2022-02-09 | INSERM (Institut National de la Santé et de la Recherche Médicale) | Methods of predicting and preventing cancer in patients having premalignant lesions |
| US20220160692A1 (en) | 2019-04-09 | 2022-05-26 | INSERM (Institut National de la Santé et de la Recherche Médicale) | Use of sk2 inhibitors in combination with immune checkpoint blockade therapy for the treatment of cancer |
| WO2020216439A1 (en) | 2019-04-23 | 2020-10-29 | Miltenyi Biotec B.V. & Co. KG | Reversible cell detection with conjugates having a linker for increased fluorescent brightness and an enzymatically releasable fluorescent moiety |
| JP2022536075A (en) | 2019-06-03 | 2022-08-12 | アンセルム(アンスティチュート・ナシオナル・ドゥ・ラ・サンテ・エ・ドゥ・ラ・ルシェルシュ・メディカル) | How to adjust the treatment regimen |
| JP2022552414A (en) * | 2019-10-17 | 2022-12-15 | シー2センス, インコーポレイテッド | Luminescence imaging for sensing and/or authentication |
| CN114746740A (en) | 2019-10-17 | 2022-07-12 | C2感官有限公司 | Luminescence imaging for sensing |
| EP4045686A1 (en) | 2019-10-17 | 2022-08-24 | Institut National de la Santé et de la Recherche Médicale (INSERM) | Methods for diagnosing nasal intestinal type adenocarcinomas |
| US20230113705A1 (en) | 2020-02-28 | 2023-04-13 | INSERM (Institut National de la Santé et de la Recherche Médicale) | Methods for diagnosing, prognosing and managing treatment of breast cancer |
| EP3916388A1 (en) | 2020-05-27 | 2021-12-01 | Miltenyi Biotec B.V. & Co. KG | Reagents for detection of chimeric antigen receptor cells |
| EP3916393B1 (en) | 2020-05-27 | 2023-01-25 | Miltenyi Biotec B.V. & Co. KG | Method for detection of cells by repetitive staining and destaining |
| JP2023531305A (en) | 2020-06-30 | 2023-07-21 | アンスティチュ ナショナル ドゥ ラ サンテ エ ドゥ ラ ルシェルシュ メディカル | A method for predicting the risk of recurrence and/or death in patients with solid tumors after neoadjuvant therapy. |
| CN115843335A (en) | 2020-06-30 | 2023-03-24 | 国家医疗保健研究所 | Method for predicting the risk of relapse and/or death of a patient with solid cancer after preoperative adjuvant and radical surgery |
| EP4313317A1 (en) | 2021-03-23 | 2024-02-07 | INSERM (Institut National de la Santé et de la Recherche Médicale) | Methods for the diagnosis and treatment of t cell-lymphomas |
| WO2022217084A1 (en) | 2021-04-09 | 2022-10-13 | Neogenomics Laboratories, Inc. | Perivascular accumulation of immune cells in the diagnosis and treatment of cancer |
| CN113684256A (en) * | 2021-08-30 | 2021-11-23 | 中国药科大学 | Method for detecting multiple targets through multiple positioning based on green solvent and programmable oligonucleotide probe |
| WO2023143179A1 (en) * | 2022-01-28 | 2023-08-03 | 南京大学 | Processing method for antigen sample, and use |
| WO2023144303A1 (en) | 2022-01-31 | 2023-08-03 | INSERM (Institut National de la Santé et de la Recherche Médicale) | Cd38 as a biomarker and biotarget in t-cell lymphomas |
| WO2023175366A1 (en) | 2022-03-17 | 2023-09-21 | Veracyte | Methods for predicting response to an immunotherapeutic treatment in a patient with a cancer |
| WO2023198648A1 (en) | 2022-04-11 | 2023-10-19 | Institut National de la Santé et de la Recherche Médicale | Methods for the diagnosis and treatment of t-cell malignancies |
| WO2023198874A1 (en) | 2022-04-15 | 2023-10-19 | Institut National de la Santé et de la Recherche Médicale | Methods for the diagnosis and treatment of t cell-lymphomas |
| WO2024003310A1 (en) | 2022-06-30 | 2024-01-04 | Institut National de la Santé et de la Recherche Médicale | Methods for the diagnosis and treatment of acute lymphoblastic leukemia |
| WO2024018046A1 (en) | 2022-07-22 | 2024-01-25 | Institut National de la Santé et de la Recherche Médicale | Garp as a biomarker and biotarget in t-cell malignancies |
| WO2024023283A1 (en) | 2022-07-29 | 2024-02-01 | Institut National de la Santé et de la Recherche Médicale | Lrrc33 as a biomarker and biotarget in cutaneous t-cell lymphomas |
Family Cites Families (27)
| Publication number | Priority date | Publication date | Assignee | Title |
|---|---|---|---|---|
| JP3130513B2 (en) * | 1989-04-19 | 2001-01-31 | イビデン株式会社 | Bioactive substance measurement device |
| US5807522A (en) * | 1994-06-17 | 1998-09-15 | The Board Of Trustees Of The Leland Stanford Junior University | Methods for fabricating microarrays of biological samples |
| DE4421891C2 (en) | 1994-06-23 | 1996-05-15 | Helmut Prof Dr Med Feucht | Method for detecting complement-activating IgG antibodies to HLA-DR antigens |
| US5830645A (en) * | 1994-12-09 | 1998-11-03 | The Regents Of The University Of California | Comparative fluorescence hybridization to nucleic acid arrays |
| DE19709348C2 (en) * | 1996-05-29 | 1999-07-01 | Schubert Walter Dr Md | Automatic multi-epitope ligand mapping process |
| DE19717904A1 (en) * | 1997-04-23 | 1998-10-29 | Diagnostikforschung Inst | Acid-labile and enzymatically cleavable dye constructs for diagnostics with near infrared light and for therapy |
| US6083486A (en) * | 1998-05-14 | 2000-07-04 | The General Hospital Corporation | Intramolecularly-quenched near infrared fluorescent probes |
| JP2002520448A (en) | 1998-07-10 | 2002-07-09 | クロマジェン インコーポレーティッド | New fluorogenic substrate for hydrolase |
| US6573043B1 (en) | 1998-10-07 | 2003-06-03 | Genentech, Inc. | Tissue analysis and kits therefor |
| AU3567900A (en) | 1999-03-30 | 2000-10-16 | Solexa Ltd. | Polynucleotide sequencing |
| WO2001023610A2 (en) * | 1999-09-29 | 2001-04-05 | Solexa Ltd. | Polynucleotide sequencing |
| GB0002389D0 (en) * | 2000-02-02 | 2000-03-22 | Solexa Ltd | Molecular arrays |
| DE10014685B4 (en) * | 2000-03-24 | 2004-07-01 | Schubert, Walter, Dr. | Procedure for the identification of cell-specific target structures |
| WO2001086296A2 (en) * | 2000-05-05 | 2001-11-15 | Agilix Corporation | Highly multiplexed reporter carrier systems |
| US20030044353A1 (en) * | 2001-01-05 | 2003-03-06 | Ralph Weissleder | Activatable imaging probes |
| US20050230255A1 (en) | 2001-03-30 | 2005-10-20 | Sumner Lloyd W | Silver destaining method |
| US7219016B2 (en) * | 2001-04-20 | 2007-05-15 | Yale University | Systems and methods for automated analysis of cells and tissues |
| US20020173053A1 (en) * | 2001-04-27 | 2002-11-21 | Bassam Damaj | Multiple simultaneous antigen detection by immunohistochemistry |
| AU2002319613A1 (en) * | 2001-07-19 | 2003-03-03 | Signet Laboratories, Inc. | Human tissue specific drug screening procedure |
| US8323903B2 (en) * | 2001-10-12 | 2012-12-04 | Life Technologies Corporation | Antibody complexes and methods for immunolabeling |
| WO2003061711A2 (en) * | 2002-01-16 | 2003-07-31 | Visen Medical, Inc. | Chromophore probes for optical imaging |
| EP1573061A4 (en) * | 2002-12-18 | 2006-03-08 | Aclara Biosciences Inc | Multiplexed immunohistochemical assays using molecular tags |
| WO2005017485A2 (en) | 2003-05-22 | 2005-02-24 | Agdia, Inc. | Multiplex enzyme-linked immunosorbent assay for detecting multiple analytes |
| US20050287578A1 (en) * | 2004-06-28 | 2005-12-29 | Exagen Diagnostics, Inc. | Methods for RNA fluorescence in situ hybridization |
| JP2007033159A (en) * | 2005-07-25 | 2007-02-08 | Assay Corp | Measuring object material labeled by fluorescent molecule |
| EP1950566A4 (en) * | 2005-11-10 | 2008-11-26 | Univ Toyama Nat Univ Corp | Method of evaluating binding properties of biosubstances and biosubstance-binding substances |
| US8305579B2 (en) * | 2006-11-16 | 2012-11-06 | Thomas Pirrie Treynor | Sequential analysis of biological samples |
-
2007
- 2007-09-28 US US11/864,085 patent/US7741045B2/en active Active
- 2007-11-15 PL PL07871481T patent/PL2082226T3/en unknown
- 2007-11-15 AU AU2007323794A patent/AU2007323794B2/en active Active
- 2007-11-15 EP EP07871481A patent/EP2082226B1/en active Active
- 2007-11-15 JP JP2009537360A patent/JP5149303B2/en active Active
- 2007-11-15 CA CA2669092A patent/CA2669092C/en active Active
- 2007-11-15 DK DK07871481.3T patent/DK2082226T3/en active
- 2007-11-15 WO PCT/US2007/084800 patent/WO2008064067A2/en active Application Filing
- 2007-11-15 ES ES11175116.0T patent/ES2459725T3/en active Active
- 2007-11-15 EP EP11175116.0A patent/EP2381257B1/en active Active
- 2007-11-15 AT AT07871481T patent/ATE520026T1/en active
- 2007-11-15 PT PT07871481T patent/PT2082226E/en unknown
Also Published As
| Publication number | Publication date |
|---|---|
| CA2669092A1 (en) | 2008-05-29 |
| ATE520026T1 (en) | 2011-08-15 |
| WO2008064067A2 (en) | 2008-05-29 |
| EP2082226B1 (en) | 2011-08-10 |
| JP2010510493A (en) | 2010-04-02 |
| PL2082226T3 (en) | 2012-01-31 |
| ES2459725T3 (en) | 2014-05-12 |
| US7741045B2 (en) | 2010-06-22 |
| AU2007323794A1 (en) | 2008-05-29 |
| EP2082226A2 (en) | 2009-07-29 |
| WO2008064067A3 (en) | 2008-07-10 |
| PT2082226E (en) | 2011-10-31 |
| US20080118934A1 (en) | 2008-05-22 |
| EP2381257A1 (en) | 2011-10-26 |
| JP5149303B2 (en) | 2013-02-20 |
| AU2007323794B2 (en) | 2013-08-22 |
| DK2082226T3 (en) | 2011-11-14 |
| CA2669092C (en) | 2016-07-26 |
Similar Documents
| Publication | Publication Date | Title |
|---|---|---|
| EP2381257B1 (en) | Sequential analysis of biological samples | |
| EP2082239B1 (en) | Sequential analysis of biological samples with intermediate bleaching of fluorescence detector | |
| EP2082238B1 (en) | Sequential analysis of biological samples with intermediate bleaching of fluorescence detector | |
| EP2875353B1 (en) | Methods of detecting dna, rna and protein in biological samples |
Legal Events
| Date | Code | Title | Description |
|---|---|---|---|
| AC | Divisional application: reference to earlier application |
Ref document number: 2082226 Country of ref document: EP Kind code of ref document: P |
|
| AK | Designated contracting states |
Kind code of ref document: A1 Designated state(s): AT BE BG CH CY CZ DE DK EE ES FI FR GB GR HU IE IS IT LI LT LU LV MC MT NL PL PT RO SE SI SK TR |
|
| PUAI | Public reference made under article 153(3) epc to a published international application that has entered the european phase |
Free format text: ORIGINAL CODE: 0009012 |
|
| RIN1 | Information on inventor provided before grant (corrected) |
Inventor name: BRESNAHAN, MAUREEN, ANN Inventor name: CAN, ALI Inventor name: FILKINS, ROBERT, JOHN Inventor name: MONTALTO, MICHAEL, CHRISTOPHER Inventor name: GINTY, FIONA Inventor name: PANG, ZHENGYU Inventor name: SOOD, ANUP Inventor name: GERDES, MICHAEL, J |
|
| 17P | Request for examination filed |
Effective date: 20120423 |
|
| 17Q | First examination report despatched |
Effective date: 20121114 |
|
| GRAP | Despatch of communication of intention to grant a patent |
Free format text: ORIGINAL CODE: EPIDOSNIGR1 |
|
| INTG | Intention to grant announced |
Effective date: 20131024 |
|
| GRAS | Grant fee paid |
Free format text: ORIGINAL CODE: EPIDOSNIGR3 |
|
| GRAA | (expected) grant |
Free format text: ORIGINAL CODE: 0009210 |
|
| AC | Divisional application: reference to earlier application |
Ref document number: 2082226 Country of ref document: EP Kind code of ref document: P |
|
| AK | Designated contracting states |
Kind code of ref document: B1 Designated state(s): AT BE BG CH CY CZ DE DK EE ES FI FR GB GR HU IE IS IT LI LT LU LV MC MT NL PL PT RO SE SI SK TR |
|
| REG | Reference to a national code |
Ref country code: GB Ref legal event code: FG4D |
|
| REG | Reference to a national code |
Ref country code: CH Ref legal event code: EP |
|
| REG | Reference to a national code |
Ref country code: AT Ref legal event code: REF Ref document number: 659244 Country of ref document: AT Kind code of ref document: T Effective date: 20140415 |
|
| REG | Reference to a national code |
Ref country code: NL Ref legal event code: T3 |
|
| REG | Reference to a national code |
Ref country code: SE Ref legal event code: TRGR |
|
| REG | Reference to a national code |
Ref country code: IE Ref legal event code: FG4D |
|
| REG | Reference to a national code |
Ref country code: DE Ref legal event code: R096 Ref document number: 602007035832 Country of ref document: DE Effective date: 20140508 |
|
| REG | Reference to a national code |
Ref country code: ES Ref legal event code: FG2A Ref document number: 2459725 Country of ref document: ES Kind code of ref document: T3 Effective date: 20140512 |
|
| PG25 | Lapsed in a contracting state [announced via postgrant information from national office to epo] |
Ref country code: LT Free format text: LAPSE BECAUSE OF FAILURE TO SUBMIT A TRANSLATION OF THE DESCRIPTION OR TO PAY THE FEE WITHIN THE PRESCRIBED TIME-LIMIT Effective date: 20140326 |
|
| REG | Reference to a national code |
Ref country code: AT Ref legal event code: MK05 Ref document number: 659244 Country of ref document: AT Kind code of ref document: T Effective date: 20140326 |
|
| REG | Reference to a national code |
Ref country code: LT Ref legal event code: MG4D |
|
| PG25 | Lapsed in a contracting state [announced via postgrant information from national office to epo] |
Ref country code: FI Free format text: LAPSE BECAUSE OF FAILURE TO SUBMIT A TRANSLATION OF THE DESCRIPTION OR TO PAY THE FEE WITHIN THE PRESCRIBED TIME-LIMIT Effective date: 20140326 |
|
| PG25 | Lapsed in a contracting state [announced via postgrant information from national office to epo] |
Ref country code: LV Free format text: LAPSE BECAUSE OF FAILURE TO SUBMIT A TRANSLATION OF THE DESCRIPTION OR TO PAY THE FEE WITHIN THE PRESCRIBED TIME-LIMIT Effective date: 20140326 |
|
| PG25 | Lapsed in a contracting state [announced via postgrant information from national office to epo] |
Ref country code: RO Free format text: LAPSE BECAUSE OF FAILURE TO SUBMIT A TRANSLATION OF THE DESCRIPTION OR TO PAY THE FEE WITHIN THE PRESCRIBED TIME-LIMIT Effective date: 20140326 Ref country code: EE Free format text: LAPSE BECAUSE OF FAILURE TO SUBMIT A TRANSLATION OF THE DESCRIPTION OR TO PAY THE FEE WITHIN THE PRESCRIBED TIME-LIMIT Effective date: 20140326 Ref country code: BG Free format text: LAPSE BECAUSE OF FAILURE TO SUBMIT A TRANSLATION OF THE DESCRIPTION OR TO PAY THE FEE WITHIN THE PRESCRIBED TIME-LIMIT Effective date: 20140626 Ref country code: CZ Free format text: LAPSE BECAUSE OF FAILURE TO SUBMIT A TRANSLATION OF THE DESCRIPTION OR TO PAY THE FEE WITHIN THE PRESCRIBED TIME-LIMIT Effective date: 20140326 Ref country code: IS Free format text: LAPSE BECAUSE OF FAILURE TO SUBMIT A TRANSLATION OF THE DESCRIPTION OR TO PAY THE FEE WITHIN THE PRESCRIBED TIME-LIMIT Effective date: 20140726 Ref country code: BE Free format text: LAPSE BECAUSE OF FAILURE TO SUBMIT A TRANSLATION OF THE DESCRIPTION OR TO PAY THE FEE WITHIN THE PRESCRIBED TIME-LIMIT Effective date: 20140326 Ref country code: CY Free format text: LAPSE BECAUSE OF FAILURE TO SUBMIT A TRANSLATION OF THE DESCRIPTION OR TO PAY THE FEE WITHIN THE PRESCRIBED TIME-LIMIT Effective date: 20140326 |
|
| PG25 | Lapsed in a contracting state [announced via postgrant information from national office to epo] |
Ref country code: PL Free format text: LAPSE BECAUSE OF FAILURE TO SUBMIT A TRANSLATION OF THE DESCRIPTION OR TO PAY THE FEE WITHIN THE PRESCRIBED TIME-LIMIT Effective date: 20140326 Ref country code: SK Free format text: LAPSE BECAUSE OF FAILURE TO SUBMIT A TRANSLATION OF THE DESCRIPTION OR TO PAY THE FEE WITHIN THE PRESCRIBED TIME-LIMIT Effective date: 20140326 Ref country code: AT Free format text: LAPSE BECAUSE OF FAILURE TO SUBMIT A TRANSLATION OF THE DESCRIPTION OR TO PAY THE FEE WITHIN THE PRESCRIBED TIME-LIMIT Effective date: 20140326 |
|
| PG25 | Lapsed in a contracting state [announced via postgrant information from national office to epo] |
Ref country code: PT Free format text: LAPSE BECAUSE OF FAILURE TO SUBMIT A TRANSLATION OF THE DESCRIPTION OR TO PAY THE FEE WITHIN THE PRESCRIBED TIME-LIMIT Effective date: 20140728 |
|
| REG | Reference to a national code |
Ref country code: DE Ref legal event code: R097 Ref document number: 602007035832 Country of ref document: DE |
|
| PG25 | Lapsed in a contracting state [announced via postgrant information from national office to epo] |
Ref country code: DK Free format text: LAPSE BECAUSE OF FAILURE TO SUBMIT A TRANSLATION OF THE DESCRIPTION OR TO PAY THE FEE WITHIN THE PRESCRIBED TIME-LIMIT Effective date: 20140326 |
|
| PGFP | Annual fee paid to national office [announced via postgrant information from national office to epo] |
Ref country code: ES Payment date: 20141126 Year of fee payment: 8 |
|
| PLBE | No opposition filed within time limit |
Free format text: ORIGINAL CODE: 0009261 |
|
| STAA | Information on the status of an ep patent application or granted ep patent |
Free format text: STATUS: NO OPPOSITION FILED WITHIN TIME LIMIT |
|
| 26N | No opposition filed |
Effective date: 20150106 |
|
| REG | Reference to a national code |
Ref country code: DE Ref legal event code: R097 Ref document number: 602007035832 Country of ref document: DE Effective date: 20150106 |
|
| PG25 | Lapsed in a contracting state [announced via postgrant information from national office to epo] |
Ref country code: LU Free format text: LAPSE BECAUSE OF FAILURE TO SUBMIT A TRANSLATION OF THE DESCRIPTION OR TO PAY THE FEE WITHIN THE PRESCRIBED TIME-LIMIT Effective date: 20141115 Ref country code: MC Free format text: LAPSE BECAUSE OF FAILURE TO SUBMIT A TRANSLATION OF THE DESCRIPTION OR TO PAY THE FEE WITHIN THE PRESCRIBED TIME-LIMIT Effective date: 20140326 |
|
| REG | Reference to a national code |
Ref country code: CH Ref legal event code: PL |
|
| PG25 | Lapsed in a contracting state [announced via postgrant information from national office to epo] |
Ref country code: CH Free format text: LAPSE BECAUSE OF NON-PAYMENT OF DUE FEES Effective date: 20141130 Ref country code: LI Free format text: LAPSE BECAUSE OF NON-PAYMENT OF DUE FEES Effective date: 20141130 Ref country code: SI Free format text: LAPSE BECAUSE OF FAILURE TO SUBMIT A TRANSLATION OF THE DESCRIPTION OR TO PAY THE FEE WITHIN THE PRESCRIBED TIME-LIMIT Effective date: 20140326 |
|
| REG | Reference to a national code |
Ref country code: IE Ref legal event code: MM4A |
|
| PG25 | Lapsed in a contracting state [announced via postgrant information from national office to epo] |
Ref country code: IE Free format text: LAPSE BECAUSE OF NON-PAYMENT OF DUE FEES Effective date: 20141115 |
|
| REG | Reference to a national code |
Ref country code: FR Ref legal event code: PLFP Year of fee payment: 9 |
|
| PG25 | Lapsed in a contracting state [announced via postgrant information from national office to epo] |
Ref country code: GR Free format text: LAPSE BECAUSE OF FAILURE TO SUBMIT A TRANSLATION OF THE DESCRIPTION OR TO PAY THE FEE WITHIN THE PRESCRIBED TIME-LIMIT Effective date: 20140627 |
|
| PG25 | Lapsed in a contracting state [announced via postgrant information from national office to epo] |
Ref country code: TR Free format text: LAPSE BECAUSE OF FAILURE TO SUBMIT A TRANSLATION OF THE DESCRIPTION OR TO PAY THE FEE WITHIN THE PRESCRIBED TIME-LIMIT Effective date: 20140326 Ref country code: HU Free format text: LAPSE BECAUSE OF FAILURE TO SUBMIT A TRANSLATION OF THE DESCRIPTION OR TO PAY THE FEE WITHIN THE PRESCRIBED TIME-LIMIT; INVALID AB INITIO Effective date: 20071115 Ref country code: MT Free format text: LAPSE BECAUSE OF FAILURE TO SUBMIT A TRANSLATION OF THE DESCRIPTION OR TO PAY THE FEE WITHIN THE PRESCRIBED TIME-LIMIT Effective date: 20140326 |
|
| REG | Reference to a national code |
Ref country code: FR Ref legal event code: PLFP Year of fee payment: 10 |
|
| PG25 | Lapsed in a contracting state [announced via postgrant information from national office to epo] |
Ref country code: ES Free format text: LAPSE BECAUSE OF NON-PAYMENT OF DUE FEES Effective date: 20151116 |
|
| REG | Reference to a national code |
Ref country code: FR Ref legal event code: PLFP Year of fee payment: 11 |
|
| REG | Reference to a national code |
Ref country code: ES Ref legal event code: FD2A Effective date: 20180710 |
|
| REG | Reference to a national code |
Ref country code: FR Ref legal event code: PLFP Year of fee payment: 12 |
|
| REG | Reference to a national code |
Ref country code: GB Ref legal event code: 732E Free format text: REGISTERED BETWEEN 20201029 AND 20201104 |
|
| REG | Reference to a national code |
Ref country code: NL Ref legal event code: PD Owner name: GLOBAL LIFE SCIENCES SOLUTIONS USA LLC.; US Free format text: DETAILS ASSIGNMENT: CHANGE OF OWNER(S), ASSIGNMENT; FORMER OWNER NAME: GENERAL ELECTRIC COMPANY Effective date: 20201217 |
|
| PGFP | Annual fee paid to national office [announced via postgrant information from national office to epo] |
Ref country code: NL Payment date: 20201029 Year of fee payment: 14 |
|
| REG | Reference to a national code |
Ref country code: DE Ref legal event code: R081 Ref document number: 602007035832 Country of ref document: DE Owner name: LEICA MICROSYSTEMS CMS GMBH, DE Free format text: FORMER OWNER: GENERAL ELECTRIC CO., SCHENECTADY, N.Y., US Ref country code: DE Ref legal event code: R081 Ref document number: 602007035832 Country of ref document: DE Owner name: GLOBAL LIFE SCIENCES SOLUTIONS USA LLC (N. D. , US Free format text: FORMER OWNER: GENERAL ELECTRIC CO., SCHENECTADY, N.Y., US |
|
| PGFP | Annual fee paid to national office [announced via postgrant information from national office to epo] |
Ref country code: SE Payment date: 20201026 Year of fee payment: 14 Ref country code: IT Payment date: 20201021 Year of fee payment: 14 |
|
| REG | Reference to a national code |
Ref country code: NL Ref legal event code: MM Effective date: 20211201 |
|
| PG25 | Lapsed in a contracting state [announced via postgrant information from national office to epo] |
Ref country code: SE Free format text: LAPSE BECAUSE OF NON-PAYMENT OF DUE FEES Effective date: 20211116 |
|
| REG | Reference to a national code |
Ref country code: GB Ref legal event code: 732E Free format text: REGISTERED BETWEEN 20220721 AND 20220727 |
|
| REG | Reference to a national code |
Ref country code: DE Ref legal event code: R081 Ref document number: 602007035832 Country of ref document: DE Owner name: LEICA MICROSYSTEMS CMS GMBH, DE Free format text: FORMER OWNER: GLOBAL LIFE SCIENCES SOLUTIONS USA LLC (N. D. GES. D. STAATES DELAWARE), MARLBOROUGH, MA, US |
|
| PG25 | Lapsed in a contracting state [announced via postgrant information from national office to epo] |
Ref country code: NL Free format text: LAPSE BECAUSE OF NON-PAYMENT OF DUE FEES Effective date: 20211201 |
|
| PG25 | Lapsed in a contracting state [announced via postgrant information from national office to epo] |
Ref country code: IT Free format text: LAPSE BECAUSE OF NON-PAYMENT OF DUE FEES Effective date: 20211115 |
|
| P01 | Opt-out of the competence of the unified patent court (upc) registered |
Effective date: 20230414 |
|
| PGFP | Annual fee paid to national office [announced via postgrant information from national office to epo] |
Ref country code: GB Payment date: 20231121 Year of fee payment: 17 |
|
| PGFP | Annual fee paid to national office [announced via postgrant information from national office to epo] |
Ref country code: FR Payment date: 20231123 Year of fee payment: 17 Ref country code: DE Payment date: 20231127 Year of fee payment: 17 |