EP2373957B1 - Methods for determining a liquid level in a container using imaging - Google Patents
Methods for determining a liquid level in a container using imaging Download PDFInfo
- Publication number
- EP2373957B1 EP2373957B1 EP09837845.8A EP09837845A EP2373957B1 EP 2373957 B1 EP2373957 B1 EP 2373957B1 EP 09837845 A EP09837845 A EP 09837845A EP 2373957 B1 EP2373957 B1 EP 2373957B1
- Authority
- EP
- European Patent Office
- Prior art keywords
- sample
- container
- image
- peaks
- dimensional array
- Prior art date
- Legal status (The legal status is an assumption and is not a legal conclusion. Google has not performed a legal analysis and makes no representation as to the accuracy of the status listed.)
- Active
Links
- 238000000034 method Methods 0.000 title claims description 53
- 239000007788 liquid Substances 0.000 title claims description 25
- 238000003384 imaging method Methods 0.000 title description 2
- 239000006260 foam Substances 0.000 claims description 32
- 238000003491 array Methods 0.000 claims description 25
- 239000012080 ambient air Substances 0.000 claims description 12
- 238000012545 processing Methods 0.000 claims description 6
- 239000000428 dust Substances 0.000 claims description 5
- 238000004458 analytical method Methods 0.000 claims description 2
- 238000001914 filtration Methods 0.000 claims description 2
- YTAHJIFKAKIKAV-XNMGPUDCSA-N [(1R)-3-morpholin-4-yl-1-phenylpropyl] N-[(3S)-2-oxo-5-phenyl-1,3-dihydro-1,4-benzodiazepin-3-yl]carbamate Chemical compound O=C1[C@H](N=C(C2=C(N1)C=CC=C2)C1=CC=CC=C1)NC(O[C@H](CCN1CCOCC1)C1=CC=CC=C1)=O YTAHJIFKAKIKAV-XNMGPUDCSA-N 0.000 claims 1
- 230000000873 masking effect Effects 0.000 claims 1
- 239000000523 sample Substances 0.000 description 106
- 239000003570 air Substances 0.000 description 18
- 238000004422 calculation algorithm Methods 0.000 description 8
- 238000012360 testing method Methods 0.000 description 4
- XLYOFNOQVPJJNP-UHFFFAOYSA-N water Substances O XLYOFNOQVPJJNP-UHFFFAOYSA-N 0.000 description 4
- 238000001514 detection method Methods 0.000 description 3
- 230000000717 retained effect Effects 0.000 description 3
- 239000008280 blood Substances 0.000 description 2
- 210000004369 blood Anatomy 0.000 description 2
- 239000003153 chemical reaction reagent Substances 0.000 description 2
- 238000007796 conventional method Methods 0.000 description 2
- 238000010586 diagram Methods 0.000 description 2
- 210000003608 fece Anatomy 0.000 description 2
- 238000000338 in vitro Methods 0.000 description 2
- 238000005259 measurement Methods 0.000 description 2
- 230000003287 optical effect Effects 0.000 description 2
- 239000002689 soil Substances 0.000 description 2
- 239000012780 transparent material Substances 0.000 description 2
- 238000002604 ultrasonography Methods 0.000 description 2
- 210000002700 urine Anatomy 0.000 description 2
- 238000013459 approach Methods 0.000 description 1
- 238000013473 artificial intelligence Methods 0.000 description 1
- 230000002238 attenuated effect Effects 0.000 description 1
- 230000015572 biosynthetic process Effects 0.000 description 1
- 238000004364 calculation method Methods 0.000 description 1
- 238000004891 communication Methods 0.000 description 1
- 238000012790 confirmation Methods 0.000 description 1
- 238000012937 correction Methods 0.000 description 1
- 238000012864 cross contamination Methods 0.000 description 1
- 230000006378 damage Effects 0.000 description 1
- 238000013461 design Methods 0.000 description 1
- 230000001066 destructive effect Effects 0.000 description 1
- 230000000694 effects Effects 0.000 description 1
- 238000005516 engineering process Methods 0.000 description 1
- 238000007620 mathematical function Methods 0.000 description 1
- 230000003071 parasitic effect Effects 0.000 description 1
- 230000005855 radiation Effects 0.000 description 1
- 230000001105 regulatory effect Effects 0.000 description 1
- 238000011160 research Methods 0.000 description 1
- 239000007787 solid Substances 0.000 description 1
- 230000000007 visual effect Effects 0.000 description 1
Images


Classifications
-
- G—PHYSICS
- G01—MEASURING; TESTING
- G01F—MEASURING VOLUME, VOLUME FLOW, MASS FLOW OR LIQUID LEVEL; METERING BY VOLUME
- G01F23/00—Indicating or measuring liquid level or level of fluent solid material, e.g. indicating in terms of volume or indicating by means of an alarm
- G01F23/22—Indicating or measuring liquid level or level of fluent solid material, e.g. indicating in terms of volume or indicating by means of an alarm by measuring physical variables, other than linear dimensions, pressure or weight, dependent on the level to be measured, e.g. by difference of heat transfer of steam or water
- G01F23/28—Indicating or measuring liquid level or level of fluent solid material, e.g. indicating in terms of volume or indicating by means of an alarm by measuring physical variables, other than linear dimensions, pressure or weight, dependent on the level to be measured, e.g. by difference of heat transfer of steam or water by measuring the variations of parameters of electromagnetic or acoustic waves applied directly to the liquid or fluent solid material
- G01F23/284—Electromagnetic waves
- G01F23/292—Light, e.g. infrared or ultraviolet
-
- G—PHYSICS
- G01—MEASURING; TESTING
- G01F—MEASURING VOLUME, VOLUME FLOW, MASS FLOW OR LIQUID LEVEL; METERING BY VOLUME
- G01F23/00—Indicating or measuring liquid level or level of fluent solid material, e.g. indicating in terms of volume or indicating by means of an alarm
- G01F23/80—Arrangements for signal processing
- G01F23/802—Particular electronic circuits for digital processing equipment
- G01F23/804—Particular electronic circuits for digital processing equipment containing circuits handling parameters other than liquid level
Description
- The present invention relates to liquid volume measurement, and more specifically to methods for detecting and measuring the level of a liquid in a container using imaging.
- Various tests may be performed on a sample for diagnostic purposes, routine care, research, etc. In the medical field, the sample may include, for example, blood, urine, DNA, feces, tissue, etc. In other fields, such as bio-terrorism, samples may include, for example, air, water, soil, etc. Frequently, as part of the test, the sample may be mixed with a reagent to produce an outcome. In an in vitro setting, the mixing may take place outside of a patient's body, for example. Additionally, the different tests may require different quantities of a sample, which may be collected in various containers. In some instances, the container may have a sample capacity greater than is necessary for a particular test. It may be desirable to know the quantity of sample in a container, for example, to determine an appropriate amount of reagent to add, to make appropriate calculations, to act as an automated confirmation of the liquid levels, or to meet regulatory requirements. A method for detecting the position of the interface between two media in a container is disclosed in
WO 03/060433 A2 - The inventors of the present invention have determined that an existing problem with conventional automated and non-automated liquid level sensing for in vitro diagnostics is that the conventional methods may be complex, and therefore expensive. Additionally, conventional liquid level sensing methods may be unreliable in detecting increasingly smaller volumes, particularly without destruction of, or physical contact with, the samples. For example, the conventional visual method whereby an observer views a sample and records the liquid level of the sample may be inaccurate and time consuming.
- The electro-capacitive method may be another conventional method for sensing a liquid level of a sample. With the electro-capacitive method a probe may be inserted into the sample, thereby contacting the sample, which may be destructive to the sample to some degree. Additionally, contact with the sample may increase the possibility of carryover between the different samples being tested. In other words, some of a first sample tested may remain on the probes used with the capacitive method, for example, and be carried-over to the second sample being tested by the same probes. The electro-capacitive method detects the level of the sample by measuring the position of the probe at the moment of contact with the sample that in turn produces a change in capacitance on the probe. However, the electro-capacitive method may be limited by the difficulty in detecting very small changes in capacitance, as well as unavoidable bulk parasitic changes and interferences in the environment when detecting the liquid level of the sample (ie. foam or dust on the surface of the sample; or turbulence in the sample).
- Pressure sensors may be another conventional way to sense the liquid level of a sample. Pressure sensors measure the pressure of the sample wherever the pressure gauge is located. Similar to the probes used in the electro-capacitive method, the components of the pressure sensors may contact the sample and thereby destroy the sample or result in cross-contamination. Additionally, pressure sensors may have difficulty in detecting the liquid level due to interference, such as foreign objects or solids, in the sample, which may interfere with the sensors.
- Another conventional way to sense the liquid level of a sample may be to use ultrasound, whereby a sound pulse is sent into the sample and a sensor examines time for an echo to return. Unlike electro-capacitive methods and pressure sensors, with ultrasound, no contact with the sample is necessary. However, ultrasonic level sensing may be difficult to implement, as it depends on air properties that may change with temperature and humidity. Additionally, the resolution associated with ultrasonic level sensing may be fairly low. Accordingly, a need exists for an improved method and apparatus for determining the amount of sample in a container.
- The method of the present invention may be performed by a system for determining a level of a sample. The system includes an image capture apparatus adapted to capture the image of a sample in a container, wherein the image is represented as a two dimensional array of intensities of light; and a controller coupled to the image capture apparatus, wherein the controller is adapted to extract an area of interest from the image, apply a filter to the area of interest, collapse the filtered area of interest into a one dimensional array, apply a mask to the one dimensional array, and determine the level of the sample in the container based on the masked one dimensional array.
- In the present invention, a method for determining a liquid level of a sample in a container is provided. The method comprises: capturing an image of a sample housed in a container, wherein the image is represented as a two dimensional array of intensities of light; extracting an area of interest from the image to obtain a two dimensional array of interest; processing the two dimensional array of interest with a differential filter to obtain a differentially filtered two dimensional array; splitting the differentially filtered two dimensional array into "n" narrower vertical arrays; collapsing the "n" two dimensional vertical arrays horizontally to form "n" one dimensional differential arrays; applying a mask to the "n" one dimensional differential arrays to account for noise; analyzing each of the resulting "n" masked vertical one dimensional differential arrays to determine the presence of peaks; counting and combining, per vertical unit, the peaks resulting from the analysis; forming a histogram from the combined and counted peaks to obtain a frequency of peak appearance per vertical unit; further processing the resulting histogram to determine the bottom of the container and interface/level of the liquid and ambient air, the presence of foam and/or other objects.
- The method of the present inventionmay be used for determining the presence and amount of foam on a surface of a sample wherein a range of continuous concentration of peaks is detected in at least one direction moving away from the interface, and wherein the continuous concentration is the foam.
- Other features and aspects of the present invention will become more fully apparent from the following detailed description, the appended claims, and the accompanying drawings.
-
-
FIG. 1A is a block diagram illustrating a system for determining the level of a sample that may be used in the method of the present invention. -
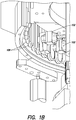
FIG. 1B is a schematic view of the system described inFIG. 1A . -
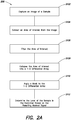
FIG. 2A is a flow chart depicting essential steps of method in accordance with the present invention. -
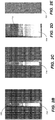
FIGs. 2B through 2F are perspective views of the method described inFIG. 2A in accordance with some embodiments of the present invention. -
FIG. 3 is a flow chart depicting an example method in accordance with some embodiments of the present invention. -
FIG. 4 is a flow chart depicting an example method in accordance with some embodiments of the present invention. - The present invention provides methods for sensing the liquid level of a sample in a container. In particular, the present invention provides a method whereby an image of the sample retained in a container is captured. The image may be captured by any conventional means (e.g. video camera, digital still camera, line scanner, etc.). The container may be made from a transparent material to allow the passage of light through the sample. By capturing an image of the sample, the sample may be observed/measured without physical contact with the sample. In some embodiments, the image may be converted to a two dimensional array of light intensities.
- An area of interest is then extracted or cropped from the two dimensional array, and if necessary, the geometry of the area of interest is adjusted. The area of interest may include the sample within the container, including both the bottom of the container and the interface between the sample and the ambient air. The geometry of the two dimensional array may need to be adjusted such that the horizontal array information may be disregarded and only the vertical array information may be analyzed, as the vertical axis contains the information about the level of liquid in the container. To emphasize or detect features (e.g., changes in intensities, such as an air-sample interface or the bottom of the container) in the vertical domain, the two dimensional array is then processed with a high-pass or a differential filter, for example, in the vertical domain. While the term "differential filter" will be used throughout the application, other methods for detecting the features may be used, for example, artificial intelligence algorithms. Note that the use of the term "differential filter," is merely exemplary and in no way limits the invention to only using or requiring use of a differential filter. In accordance with the invention, other known means of processing a two dimensional array may be used to emphasize or detect features in the vertical domain.
- The differentially filtered two dimensional array is then collapsed horizontally to form a vertical one dimensional array. Each element of the one dimensional array may be the normalized sum (or average) of all the line elements of the two dimensional array. Note that in alternate embodiments, for example, the two dimensional array may first be collapsed into a one dimensional array, and then the one dimensional array may be processed with the differential filter or the like. In other embodiments, for example, when the image is captured through a single line optical sensor (line scan array), the image may be interpolated horizontally through a cylindrical lens. In this case, data will be present only in one dimension, which is not possible in the case of conventional vision systems. A mask is applied to the one dimensional differential array or signal to account for any noise (e.g., dust, foreign matter, bubbles) that may be in the sample. The resulting signal is examined for peaks. Certain peaks may be selected for further processing based on the height of the peak, to determine the bottom of the container and the interface/level of the liquid and ambient air.
- In some instances, objects (e.g., dust, foam bubbles, etc.) may be large enough to cover the full width of the container, and/or the contrast of the objects to the ambient air is comparable to the contrast of the main liquid-ambient air interface. As will be described below, in some embodiments, when the object covers the full width of the container, the object may be labeled as foam. In some embodiments it may be desirable to determine the amount of foam as it contains enough sample to be significant in terms of calculating the amount of sample in a container. In instances where the air-liquid interface is less well defined, another embodiment of the present invention may be used to determine the liquid level of the sample. In this embodiment, instead of selecting peaks based on a particular peak height, the peaks may be selected based on the frequency of their appearance per vertical unit, as will be further explained below. In this embodiment, the steps are the same as described above with respect to the first embodiment, up to and including the step where the two dimensional array may be processed with a differential filter in the vertical dimension. The two dimensional array is then split into "n" narrower vertical arrays, such that each of the "n" vertical arrays may be separately analyzed for peaks. The differentially filtered "n" two dimensional arrays are then collapsed horizontally to form "n" vertical one dimensional differential arrays. As described above, the "n" two dimensional arrays are collapsed into "n" one dimensional arrays before being processed with the differential filter, resulting in "n" one dimensional differential arrays. As above, a mask is applied to the "n" one dimensional differential arrays to account for noise. The peaks in the resulting "n" signals are combined and counted (per vertical unit) in a histogram, for example. The resulting histogram is then further processed to determine the bottom of the container and interface/level of the liquid and ambient air, the presence of foam and/or other objects.
- Additionally, the peak frequency method described above is used to detect the presence of and size of objects on the surface of the sample (hereinafter referred to as "foam" for purposes of example only). The presence of and size of foam is determined by first examining the histogram to detect the liquid/ambient air interface, which may be recognized as the first major peak on the histogram when the bottom of the container is excluded. Then the histogram is examined from the liquid/ambient air interface in both directions (towards the top and bottom of the container) to detect a continuous concentration of peaks, whereby the continuous concentration is at least two peaks, and where the distance between peaks is not larger than a preset number, (e.g., at least two pixels), defined by the maximum size of bubbles. If such a range is found, then it may be reported as foam. The number of peaks in the range of the continuous concentration of peaks may be a function of the expected foam size, the number of vertical arrays and the application of a low pass filter to the histogram.
- Turning to
FIGs. 1A and1B , a block diagram and a schematic view, respectively, illustrating asystem 100 for determining the level of a sample according to the method of the present invention are provided. Thesystem 100 may include animage capture apparatus 102, to capture an image of asample 104 retained in acontainer 106 and optionally illuminated bylight source 108. To identify theinterface 110 between thesample 104 and the ambient air in thecontainer 106, theimage capture apparatus 102 may optionally be coupled to and operated by acontroller 112. - As described above, the
image capture apparatus 102 may include any conventional image capture means. For example, theimage capture apparatus 102 may be a video camera, a digital still camera, a line scanner, a CCD array, etc. As shown inFIG. 1B , thesystem 100 may include one or moreimage capture apparatuses 102. Conventional vision systems may capture the image as a two dimensional array. In other embodiments, for example when the image is captured through a single line optical sensor (e.g., line scan array), the image may be interpolated horizontally through a cylindrical lens. In this case, the data from the image will be present only in one dimension. - The captured image may depict the
sample 104 retained in thecontainer 106. As shown inFIG. 1B , thesystem 100 may include one ormore containers 106 retainingsamples 104 therein. As described above, the sample may include, for example, blood, urine, DNA, feces, tissue, air, water, soil, etc. Any other suitable sample may be used. Thecontainer 106 may be any container suitable to retain the sample therein, and allow the passage of light through the sample. In other words, for example, thecontainer 106 may be made from a transparent material to allow the passage of light therethrough, such that the amount ofsample 104 in thecontainer 106 may be determined, as will be described in more detail below. As depicted inFIG. 1B , thesamples 104 may be held incontainers 106 mounted on a carousel or a conveyor, with theimage capture apparatus 102 disposed to scan thecontainers 106 as they pass, to help automate the handling and measurement of the samples. - As indicated above, in some embodiments, the
system 100 may further include alight source 108. Thelight source 108 may illuminate thesample 104 to further highlight aninterface 110 between thesample 104 and the ambient air for theimage capture apparatus 102. While thelight source 108 is schematically depicted in the same horizontal plane as thecontainer 106, other orientations may be used. For example, thelight source 108 may be positioned below thecontainer 106, which may better highlight theinterface 110. As will be further described below, the air/sample interface 110 is used to determine the amount ofsample 104 in thecontainer 106. - As indicated above, in some embodiments, the
system 100 may also include acontroller 112. In some embodiments, thesystem 100 may be operated by thecontroller 112, which may be coupled to and/or otherwise communicate with and/or control any or all of the various components of thesystem 100. Thecontroller 112 may also be adapted to receive the image data from theimage capture apparatus 102 and analyze the data to determine the liquid/sample level in thecontainer 106 and translate the height of thesample 104 into the volume of thesample 104, as will be further described below. Thecontroller 112 may include a microcomputer, microprocessor, logic circuit, a computer, any combination of hardware and software, or the like. Thecontroller 112 may include various communications facilities including input/output ports, a keyboard, a mouse, a display, a network adapter, etc. In some embodiments, thecontroller 112 may be operative to execute program instructions to perform the methods of the present invention described herein. - Turning to
FIG. 2A , a flowchart is provided depicting anexample method 200 of the present invention. As described above, thesample 104 may be contained in thecontainer 106. In step S102, theimage capture apparatus 102 captures an image of the sample 104 (FIG. 2B ). The image captured by theimage capture apparatus 102 may be represented as a two dimensional array indicating different intensities of light (FIG. 2C ). In step S104, the image may be cropped and the geometry adjusted to extract an area of interest from the image (FIG. 2D ). As indicated above, the geometry adjustment may be optional, as the cropped image may be sufficient. In instances where the cropped image may not be sufficient, the geometry may be adjusted such that the horizontal information in the image may be disregarded, and the image analyzed in a single dimension. The single dimension of interest may be the vertical dimension or axis, which contains the information regarding the height or level of thesample 104 in thecontainer 106. The information from the image, in either the vertical or horizontal dimension, may be referred to as "signals." In some embodiments, the horizontal axis may be analyzed. If the image represented as the two dimensional array of intensities (FIG. 2C ) is skewed or deviates from the actual physical horizontal/vertical alignment in some other way, the signal of interest in the vertical dimension may be attenuated and/or mixed with signals from the horizontal axis. In this situation, it may be necessary to apply a skew and/or deviation correction to the array to compensate for any observable or known distortions. For example, two major visible features with a high contrast that may span for a large horizontal length, and may appear skewed in the image, may be the bottom of thecontainer 106 and the air/sample interface 110. - In step S106, the differential filter, for example, may be used to filter the area of interest, in the vertical dimension, to emphasize or detect the air-sample interface and bottom of the container (
FIG. 2E ). Any suitable differential or high pass filter or the like may be used. For example, a finite impulse response (FIR) filter, a Butterworth filter, a Chebyshev filter, a Bessel filter and/or an Elliptic filter may be used. As is well known in the art, digital filters (e.g., FIR, Butterworth, Chebyshev, Bessel, and Elliptic) may achieve many filtering effects that can be expressed as a mathematical function or algorithm. - In step S108, the filtered area of interest may be collapsed horizontally into a vertical one dimensional differential array, such as line 1 (L1), for example, in the graph shown in
FIG. 2F . It should be noted that the application of the differential filter results in an array having both positive and negative peaks. In the graph shown herein (FIG. 2F ), the absolute value of the differential one dimensional array is used such that all the peaks are positive. However, in other embodiments the differential one dimensional array may be analyzed with negative peaks. As indicated above, in some embodiments, the two dimensional array may be collapsed into a one dimensional array before application of the differential filter. Each element of the differential one dimensional array may be the normalized sum (or average) of all the line elements of the source (two dimensional) array. - The graph may indicate the vertically differential values of the various light intensities, wherein the "top" and "bottom" indicate the top and bottom of the
container 104. However, L1 (the source one dimensional differential array, also referred to as a signal) may include unavoidable noise/interference/minor features, which may be present in any system, and may make detection of the interface more difficult. Therefore, to correct for the noise, L1 may be masked, for example, by multiplying L1 by a result of a threshold (e.g., a comparing function) in step S110. The threshold may be the sum of the running average (L2) (a dashed line) of the source one dimensional differential array and a constant (L3) (a light dot/dashed line). When L1 is multiplied by the result of the threshold, the resulting signal is a masked or clean signal (L4) (a bold dot/dashed line). - In step S112, the level of the sample in the container is determined based on the resulting signal. For example, the resulting signal, or (L4), may be searched for local peaks, based on peak height. The
controller 112 may include an algorithm to process those peaks, for example. The algorithm may have simple rules or logic for determining the local peaks. For example, with respect to the graph shown inFIG. 2F , the peak closest to the bottom may be the bottom of the container, and the second peak from the bottom may be the first air/sample interface 110. The additional peaks may represent objects on the sample surface (e.g., bubbles or dust). For example, in the graph shown inFIG. 2F , the peak furthest from the bottom peak may be the top of foam or other foreign objects that may be present in the sample. The air/sample interface 110 is indicative of the height or level of thesample 104 in thecontainer 106. By determining the air/sample interface 110, the algorithm may calculate the volume ofsample 104 in thecontainer 106 from the height of thesample 104 in thecontainer 106, provided thecontainer 106 has known dimensions. Thismethod 200 may be preferable when the sample and ambient air are uniform and the air/sample interface is well defined. - Turning to
FIG. 3 , a flow chart depicting anexample method 300 for determining the sample level in a container using peak frequency is provided. Thismethod 300 may be preferable when the sample contains objects that may appear to be a false air/sample interface. This false air/sample interface may be the result of foam, foreign matter and/or bubbles (distorting features), for example, or any other matter. For example, if the size of the distorting features approaches the full width of thecontainer 104, and the contrast of the distorting features is comparable to the contrast of the main air/sample interface 110, then reliable detection of the sample level may be problematic. Therefore, to account for these distorting features, themethod 200 described above with respect toFIG. 2A may be extended inmethod 300, described herein with respect toFIG. 3 , to an additional statistical domain. - In the additional statistical domain, described in
method 300 ofFIG. 3 , peak selection is based on the frequency of peak appearance per vertical unit (as described below), as opposed to peak selection based on peak height, as described above inmethod 200 andFIG. 2A . Thus, steps S202 to S206 are the same as those described above with respect to steps S102 to S106 inFIG. 2A . In other words, in step S202, theimage capture apparatus 102 captures an image of thesample 104. Then in step S204, the image may be cropped and the geometry adjusted (if necessary) to extract an area of interest from the image. - In step S206, a differential filter may be applied to the area of interest. Then in step S208, the differential two dimensional array may be split or divided into "n" narrower vertical arrays. As in the
method 200 described above with respect toFIG. 2A , each of the "n" differential two dimensional arrays may be collapsed horizontally into "n" one dimensional differential array in step S210. As also described above, in some embodiments, the "n" two dimensional arrays may be collapsed into the "n" one dimensional array before application of the differential filter. Each element of the differential one dimensional array may be the normalized sum (or average) of all the line elements of the divided source (two dimensional) array. As above, the differential one dimensional arrays may include noise. As inmethod 200, the noise may be corrected via a mask, by multiplying the differential one dimensional arrays by the result of the threshold in step S212. Thecontroller 112 may employ an algorithm to separately analyze each of the resulting "n" masked differential one dimensional arrays to determine the presence of peaks in step S214. - In step S216, the resulting peaks are combined and counted (per vertical unit) to form a histogram. Then in step S218, a low pass filter and additional masks are applied to the histogram to correct for any noise. The resulting histogram is analyzed to determine the air/
sample interface 110 in step S220. For example, two or more peaks, depending in part on the number "n," in the same vertical location may be indicative of the major interface that may be the air/sample interface 110, the foam/sample interface or the foam/air interface, after the bottom of thecontainer 104 is excluded. The air/sample interface 110 is indicative of the height or level of thesample 104 in thecontainer 106. As described above with respect tomethod 200 andFIG. 2A , by determining the air/sample interface 110, the algorithm may calculate the volume ofsample 104 in thecontainer 106 from the height of thesample 104 in thecontainer 106, provided thecontainer 106 has known dimensions. - Turning to
FIG. 4 , a flow chart illustrating anexemplary method 400 for determining the presence and amount of foam on a surface of asample 104 is provided. Themethod 400 to detect the presence and amount of foam makes use of thepeak frequency method 300 described above with respect toFIG. 3 . In other words, steps S102 (capturing the image) to S106 and S208 to S218 (the formation of the histogram), are included herein as the first part of themethod 400. Then, in step S302, thecontroller 112 may employ an algorithm to examine the resulting histogram from the point of the air/sample interface 110 towards both top and bottom of the container to detect a range/span of a continuous concentration of spikes/peaks that is greater than a particular value. The particular value may be based on, for example, the expected foam size, the number "n," and the application of the low pass filter to the histogram. - If the range is found, it may be reported as foam in step S304. The range/span of the continuous concentration of peaks may indicate the width of the foam. In some instances, foam may span the horizontal width of the container. As the height of the foam may vary in such instances, so too may the volume of foam. In some embodiments, the volume of foam may be calculated as it may contain a significant amount of sample. In some instances, smaller objects, such as foreign objects and bubbles, for example, may span along a small portion of the horizontal width of the container, and may therefore not be categorized as foam.
Claims (12)
- A method for determining a liquid level of a sample in a container, comprising:a) capturing an image of a sample housed in the container, wherein the image is represented as a two dimensional array of intensities of light;b) extracting an area of interest from the image to obtain a two dimensional array of interest;c) processing the two dimensional array of interest with a differential filter in the vertical dimension to obtain a differentially filtered two dimensional array;d) splitting the differentially filtered two dimensional array into "n" narrower vertical arrays;e) collapsing the "n" two dimensional vertical arrays horizontally to form "n" one dimensional differential arrays;f) applying a mask to the "n" one dimensional differential arrays to account for noise;g) analyzing each of the resulting "n" masked vertical one dimensional differential arrays to determine the presence of peaks;h) combining and counting, per vertical unit, the peaks resulting from the analysis;i) forming a histogram from the combined and counted peaks to obtain a frequency of peak appearance per vertical unit; andj) further processing the resulting histogram to determine the bottom of the container and interface/level of the liquid and ambient air, the presence of foam and/or other objects.
- The method of claim 1, wherein filtering the area of interest emphasizes an air-sample interface in the sample.
- The method of claim 1 wherein noise includes at least one of foam or dust on the surface of the sample and turbulence in the sample.
- The method of claim 1 wherein extracting the area of interest from the image further comprises: cropping the image.
- The method of claim 1 wherein extracting the area of interest from the image further comprises: adjusting the geometry of the image.
- The method of claim 1 wherein masking the one dimensional array further comprises: applying a threshold as a mask, wherein the threshold is comprised of the one dimensional array plus a constant to the one dimensional array.
- The method of claim 6 wherein determining the level of the sample in the container further comprises:
searching the masked signal for local peaks. - Use of the method of claim 1 for determining the presence and amount of foam on a surface of a sample wherein in step j) a range of continuous concentration of peaks is detected in at least one direction moving away from the interface, and wherein the continuous concentration is the foam.
- The use of claim 8, wherein the continuous concentration of peaks is greater than or equal to a particular value.
- The use of claim 9, further comprising:
determining the amount of foam based on a width of the range of continuous concentration of peaks and a height of the foam. - The use of claim 10, wherein the continuous concentration of peaks are separated by a distance, and the distance is less than or equal to a preset number.
- The use of claim 11, wherein the preset number is defined by the maximum size of bubbles.
Applications Claiming Priority (2)
| Application Number | Priority Date | Filing Date | Title |
|---|---|---|---|
| US14269809P | 2009-01-06 | 2009-01-06 | |
| PCT/US2009/067645 WO2010080340A1 (en) | 2009-01-06 | 2009-12-11 | Methods and apparatus for determining a liquid level in a container using imaging |
Publications (3)
| Publication Number | Publication Date |
|---|---|
| EP2373957A1 EP2373957A1 (en) | 2011-10-12 |
| EP2373957A4 EP2373957A4 (en) | 2012-07-18 |
| EP2373957B1 true EP2373957B1 (en) | 2020-04-01 |
Family
ID=42316707
Family Applications (1)
| Application Number | Title | Priority Date | Filing Date |
|---|---|---|---|
| EP09837845.8A Active EP2373957B1 (en) | 2009-01-06 | 2009-12-11 | Methods for determining a liquid level in a container using imaging |
Country Status (5)
| Country | Link |
|---|---|
| US (1) | US9002096B2 (en) |
| EP (1) | EP2373957B1 (en) |
| JP (1) | JP5639078B2 (en) |
| CN (1) | CN102171541B (en) |
| WO (1) | WO2010080340A1 (en) |
Families Citing this family (39)
| Publication number | Priority date | Publication date | Assignee | Title |
|---|---|---|---|---|
| CN103540518B (en) | 2010-07-23 | 2015-07-08 | 贝克曼考尔特公司 | Test box |
| JP6014123B2 (en) | 2011-05-13 | 2016-10-25 | ベックマン コールター, インコーポレイテッド | Laboratory product transport elements and pathway arrays |
| ES2689169T3 (en) | 2011-05-13 | 2018-11-08 | Beckman Coulter, Inc. | System and method that includes laboratory product transport element |
| TWI708052B (en) | 2011-08-29 | 2020-10-21 | 美商安美基公司 | Methods and apparati for nondestructive detection of undissolved particles in a fluid |
| CN202236824U (en) * | 2011-08-29 | 2012-05-30 | 惠州市华阳医疗电子有限公司 | Negative-pressure wound treatment system with extravasate flow rate alarming function |
| BR112014011046A2 (en) | 2011-11-07 | 2017-06-13 | Beckman Coulter, Inc. | workflow and centrifuge system |
| KR20140091033A (en) | 2011-11-07 | 2014-07-18 | 베크만 컬터, 인코포레이티드 | Specimen container detection |
| WO2013070740A1 (en) | 2011-11-07 | 2013-05-16 | Beckman Coulter, Inc. | Aliquotter system and workflow |
| US8973736B2 (en) | 2011-11-07 | 2015-03-10 | Beckman Coulter, Inc. | Magnetic damping for specimen transport system |
| WO2013070754A1 (en) | 2011-11-07 | 2013-05-16 | Beckman Coulter, Inc. | Robotic arm |
| CN104053997B (en) | 2011-11-07 | 2016-12-21 | 贝克曼考尔特公司 | For processing the system and method for sample |
| CN102519540A (en) * | 2011-12-10 | 2012-06-27 | 山东明佳包装检测科技有限公司 | Detecting method of beer foam compensating liquid level |
| WO2014043474A1 (en) | 2012-09-14 | 2014-03-20 | Beckman Coulter, Inc. | Analytical system with capillary transport |
| WO2014138533A1 (en) | 2013-03-08 | 2014-09-12 | Siemens Healthcare Diagnostics Inc. | Tube characterization station |
| NO336180B1 (en) * | 2013-04-04 | 2015-06-08 | Univisual Instr | System and method for determining fluid levels |
| US9459130B2 (en) | 2013-11-13 | 2016-10-04 | Deere & Company | System for measuring a liquid level and orientation |
| US9528871B2 (en) | 2013-11-13 | 2016-12-27 | Deere & Company | System for determining a liquid quantity and orientation |
| US9576355B2 (en) * | 2014-01-31 | 2017-02-21 | Catamaran Corporation | System and method of monitoring and confirming medication dosage |
| CN104316709B (en) * | 2014-10-15 | 2016-03-30 | 中国航空工业集团公司北京航空材料研究院 | A kind of automatic liquid-feeding control method for realizing volumetric flask constant volume |
| WO2016187072A1 (en) | 2015-05-15 | 2016-11-24 | Gauss Surgical, Inc. | Methods and systems for characterizing fluids from a patient |
| CN105488788B (en) * | 2015-11-24 | 2019-04-05 | 大连楼兰科技股份有限公司 | Vehicle liquid excess detection method |
| AU2017269412B2 (en) * | 2016-05-27 | 2022-01-20 | Biomerieux, Inc. | Method and apparatus for detection of foam in specimen containers |
| DE102016209756A1 (en) | 2016-06-03 | 2017-12-07 | Voith Patent Gmbh | Determination of a level in a hydrodynamic coupling |
| GB201614717D0 (en) * | 2016-08-31 | 2016-10-12 | Ge Healthcare Bio Sciences Ab | Detection of foam levels |
| RU2762936C2 (en) | 2016-10-28 | 2021-12-24 | Бекман Каултер, Инк. | System for assessing substance preparation |
| US10088660B2 (en) | 2017-02-10 | 2018-10-02 | Amgen Inc. | Imaging system for counting and sizing particles in fluid-filled vessels |
| JP6729971B2 (en) * | 2017-08-30 | 2020-07-29 | 三菱電機株式会社 | Water level measuring device and waterfront line extraction method |
| CN109544500A (en) * | 2017-09-20 | 2019-03-29 | 诚锋兴业股份有限公司 | The device for identifying and discrimination method of vamp assembly operation |
| CN109029618B (en) * | 2018-07-11 | 2020-02-07 | 苏州科技大学 | Monocular vision packing box volume measuring method |
| WO2020041395A1 (en) | 2018-08-22 | 2020-02-27 | Biomerieux, Inc. | Detection instruments with automated cell location selection for newly intaken specimen containers and related methods |
| JP7185475B2 (en) * | 2018-10-11 | 2022-12-07 | 株式会社Subaru | Sealant discharge device |
| WO2020117780A1 (en) | 2018-12-03 | 2020-06-11 | Bio-Rad Laboratories, Inc. | Liquid level determination |
| EP3835737B1 (en) * | 2019-12-10 | 2024-03-20 | Roche Diagnostics GmbH | Method and apparatus for determining a vertical position of a horizontally extending interface between a first component and a second component |
| FR3111697A1 (en) * | 2020-06-18 | 2021-12-24 | Ceva Sante Animale | System for detecting a filling state of a bottle of a diffuser |
| US11681984B2 (en) | 2020-08-20 | 2023-06-20 | Scaled Solutions Technologies LLC | Inventory management systems and related methods |
| CN112324893B (en) * | 2020-10-30 | 2022-10-11 | 重庆长安汽车股份有限公司 | Automatic transmission oil level monitoring system and monitoring method |
| GB2612037A (en) * | 2021-10-19 | 2023-04-26 | Stanhope Seta Ltd | Analytical apparatus |
| US11674839B1 (en) * | 2022-02-03 | 2023-06-13 | Plainsight Corp. | System and method of detecting fluid levels in tanks |
| CN117268498B (en) * | 2023-11-20 | 2024-01-23 | 中国航空工业集团公司金城南京机电液压工程研究中心 | Oil mass measurement method and system |
Family Cites Families (47)
| Publication number | Priority date | Publication date | Assignee | Title |
|---|---|---|---|---|
| JPS59180313A (en) * | 1983-03-30 | 1984-10-13 | Toshiba Corp | Surface inspecting device |
| JPS60104205A (en) * | 1983-11-10 | 1985-06-08 | Nippon Denso Co Ltd | Method and device for measuring shape of jet body |
| US4998285A (en) * | 1988-03-11 | 1991-03-05 | Kabushiki Kaisha Toshiba | Character recognition apparatus |
| JP2647504B2 (en) | 1989-07-26 | 1997-08-27 | オリンパス光学工業株式会社 | Real image type zoom finder |
| JPH0359411A (en) | 1989-07-27 | 1991-03-14 | Nec Corp | Liquid amount measuring instrument |
| US5072108A (en) * | 1989-09-08 | 1991-12-10 | Kabushiki Kaisha Kirin Techno System | Foreign object detecting method and device |
| DE69130469T2 (en) * | 1990-08-03 | 1999-05-06 | Canon Kk | Image processing apparatus and method |
| US5204911A (en) * | 1991-05-29 | 1993-04-20 | Nira Schwartz | Inspection method using unique templates and histogram analysis |
| US5321770A (en) * | 1991-11-19 | 1994-06-14 | Xerox Corporation | Method for determining boundaries of words in text |
| US5542004A (en) * | 1991-11-25 | 1996-07-30 | Miller Brewing Company | Foam analyzing method and apparatus |
| DE4314249A1 (en) * | 1993-04-30 | 1994-11-03 | Maz Mikroelektronik Anwendungs | Device for detecting liquid level |
| US5414778A (en) * | 1993-11-24 | 1995-05-09 | Schwartz; Nira | Dynamic fluid level and bubble inspection for quality and process control |
| US6252980B1 (en) * | 1993-11-24 | 2001-06-26 | Nira Schwartz | Additional dynamic fluid level and bubble inspection for quality and process control |
| US6098029A (en) * | 1994-06-14 | 2000-08-01 | Hitachi, Ltd. | Liquid-level position measuring method and system |
| EP0699889A3 (en) * | 1994-08-24 | 1996-12-04 | Eastman Kodak Co | Gap distance measuring apparatus and method |
| US5845002A (en) * | 1994-11-03 | 1998-12-01 | Sunkist Growers, Inc. | Method and apparatus for detecting surface features of translucent objects |
| JP3805005B2 (en) * | 1994-11-09 | 2006-08-02 | キヤノン株式会社 | Image processing apparatus, optical character recognition apparatus, and methods thereof |
| JPH08278186A (en) | 1995-04-07 | 1996-10-22 | Central Japan Railway Co | Liquid level detecting method and liquid level detector |
| US5889884A (en) * | 1995-05-23 | 1999-03-30 | Minolta Co., Ltd. | Image forming apparatus capable of recognizing top and bottom of document image |
| US5781665A (en) * | 1995-08-28 | 1998-07-14 | Pitney Bowes Inc. | Apparatus and method for cropping an image |
| GB9521285D0 (en) * | 1995-10-18 | 1995-12-20 | Pa Consulting Services | Improvements in or relating to detection of foreign objects in fluid |
| NZ335864A (en) | 1996-11-06 | 2001-09-28 | Univ California | Isolated tumor necrosis factor receptor releasing enzyme (TRRE), compositions comprising the enzyme and methods of the use in modulation of TNF levels |
| US6683783B1 (en) | 1997-03-07 | 2004-01-27 | William Marsh Rice University | Carbon fibers formed from single-wall carbon nanotubes |
| US6226081B1 (en) * | 1997-03-24 | 2001-05-01 | Optikos Corporation | Optical height of fill detection system and associated methods |
| US6049379A (en) * | 1997-12-30 | 2000-04-11 | Coors Brewing Company | Method for inspecting translucent objects using imaging techniques |
| US6249602B1 (en) * | 1998-05-28 | 2001-06-19 | Cognex Corporation | Method and apparatus for determining a reference point of an object profile within an image |
| GB2341231A (en) * | 1998-09-05 | 2000-03-08 | Sharp Kk | Face detection in an image |
| US6490094B2 (en) * | 2000-03-17 | 2002-12-03 | Zograph, Llc | High acuity lens system |
| US6782122B1 (en) * | 2000-04-27 | 2004-08-24 | Simmonds Precision Products, Inc. | Apparatus for measuring height of a liquid in a container using area image pattern recognition techniques |
| US6909805B2 (en) * | 2001-01-31 | 2005-06-21 | Matsushita Electric Industrial Co., Ltd. | Detecting and utilizing add-on information from a scanned document image |
| JP3468755B2 (en) * | 2001-03-05 | 2003-11-17 | 石川島播磨重工業株式会社 | LCD drive board inspection equipment |
| WO2003060433A2 (en) * | 2002-01-16 | 2003-07-24 | Peter Holubar | Method for detecting the position of the interface between two media |
| AU2003236674A1 (en) * | 2002-06-07 | 2003-12-22 | Leica Geosystem Ag | Optical inclinometer |
| US7133572B2 (en) * | 2002-10-02 | 2006-11-07 | Siemens Corporate Research, Inc. | Fast two dimensional object localization based on oriented edges |
| CN2588336Y (en) * | 2002-12-17 | 2003-11-26 | 深圳市纽吉特电子技术有限公司 | Optical imaging type level measurer |
| US7522762B2 (en) * | 2003-04-16 | 2009-04-21 | Inverness Medical-Biostar, Inc. | Detection, resolution, and identification of arrayed elements |
| EP1644867B1 (en) | 2003-04-18 | 2010-08-11 | Medispectra, Inc. | A system and diagnostic method for optical detection of suspect portions of a tissue sample |
| WO2005041579A2 (en) * | 2003-10-24 | 2005-05-06 | Reactrix Systems, Inc. | Method and system for processing captured image information in an interactive video display system |
| US7049622B1 (en) * | 2004-04-09 | 2006-05-23 | Sandia Corporation | Optical position sensor for determining the interface between a clear and an opaque fluid |
| JP4517826B2 (en) * | 2004-11-15 | 2010-08-04 | パナソニック電工株式会社 | Liquid level detection method |
| US8036444B2 (en) * | 2005-10-15 | 2011-10-11 | Innoscan K/S | Method and system for irradiating and inspecting liquid-carrying containers |
| US7840360B1 (en) * | 2006-10-26 | 2010-11-23 | Micheels Ronald H | Optical system and method for inspection and characterization of liquids in vessels |
| CN100436658C (en) * | 2006-12-28 | 2008-11-26 | 西安理工大学 | Melt liquid level position detecting method for CZ method monocrystalline silicon growth |
| JP5246531B2 (en) | 2007-04-11 | 2013-07-24 | 澁谷工業株式会社 | Measuring method of liquid level |
| US8600135B2 (en) * | 2007-06-28 | 2013-12-03 | Mayo Foundation For Medical Education And Research | System and method for automatically generating sample points from a series of medical images and identifying a significant region |
| US10197505B2 (en) * | 2007-08-22 | 2019-02-05 | Camtek Ltd. | Method and system for low cost inspection |
| US8184848B2 (en) * | 2009-06-17 | 2012-05-22 | National Applied Research Laboratories | Liquid level detection method |
-
2009
- 2009-12-11 US US13/143,353 patent/US9002096B2/en active Active
- 2009-12-11 CN CN2009801388952A patent/CN102171541B/en active Active
- 2009-12-11 EP EP09837845.8A patent/EP2373957B1/en active Active
- 2009-12-11 WO PCT/US2009/067645 patent/WO2010080340A1/en active Application Filing
- 2009-12-11 JP JP2011545359A patent/JP5639078B2/en active Active
Non-Patent Citations (1)
| Title |
|---|
| None * |
Also Published As
| Publication number | Publication date |
|---|---|
| US20110268329A1 (en) | 2011-11-03 |
| US9002096B2 (en) | 2015-04-07 |
| EP2373957A4 (en) | 2012-07-18 |
| CN102171541A (en) | 2011-08-31 |
| CN102171541B (en) | 2013-03-27 |
| JP2012514751A (en) | 2012-06-28 |
| WO2010080340A1 (en) | 2010-07-15 |
| JP5639078B2 (en) | 2014-12-10 |
| EP2373957A1 (en) | 2011-10-12 |
Similar Documents
| Publication | Publication Date | Title |
|---|---|---|
| EP2373957B1 (en) | Methods for determining a liquid level in a container using imaging | |
| JP4765890B2 (en) | Foreign object detection device | |
| US8452046B2 (en) | Method and apparatus for automatic sediment or sludge detection, monitoring, and inspection in oil storage and other facilities | |
| AU725820B2 (en) | Method and apparatus for assessing slide and specimen preparation quality | |
| CN102481117B (en) | System and Method for Detecting Poor Quality in 3D Reconstructions | |
| EP2112514A1 (en) | Method and apparatus for checking the fluid in a pipet tip | |
| JPH0475463B2 (en) | ||
| EP2374090B1 (en) | Methods and apparatus for automated detection of the presence and types of caps on vials and containers | |
| JP2000036044A (en) | Defect integrating processor and defect integrating processing method | |
| WO2023035544A1 (en) | Laboratory spatial wave real-time measurement method based on visual edge detection | |
| AU2022283636B2 (en) | A microfluidic image analysis system | |
| WO2013026222A1 (en) | Liquid-property detection method and system | |
| JPH0921802A (en) | Specimen examining method and device thereof | |
| CN107300562A (en) | A kind of X-ray lossless detection method of measuring relay finished product contact spacing | |
| Samann | Real-time liquid level and color detection system using image processing | |
| EP3835737B1 (en) | Method and apparatus for determining a vertical position of a horizontally extending interface between a first component and a second component | |
| CN108362746A (en) | Defect estimation method based on single pair electrode capacitance imaging detection technology Lift-off effect | |
| Gao et al. | A vision-based instrument for measuring milk somatic cell count | |
| JP2019521353A (en) | Detection of under-aspiration in clinical analyzers | |
| CN113624710A (en) | Terahertz information identification method for liquid substance component change and application thereof | |
| Amalia et al. | Comparative analysis of edge detection methods on beaker glass | |
| CN108122226B (en) | Method and device for detecting glass defects | |
| CN114152557B (en) | Image analysis-based blood cell counting method and system | |
| JP3297945B2 (en) | Steel sheet surface defect detection method | |
| Chen et al. | Research on Verification Techniques of Common Glass Measuring Capacity Based on Image Processing |
Legal Events
| Date | Code | Title | Description |
|---|---|---|---|
| PUAI | Public reference made under article 153(3) epc to a published international application that has entered the european phase |
Free format text: ORIGINAL CODE: 0009012 |
|
| 17P | Request for examination filed |
Effective date: 20110519 |
|
| AK | Designated contracting states |
Kind code of ref document: A1 Designated state(s): AT BE BG CH CY CZ DE DK EE ES FI FR GB GR HR HU IE IS IT LI LT LU LV MC MK MT NL NO PL PT RO SE SI SK SM TR |
|
| DAX | Request for extension of the european patent (deleted) | ||
| A4 | Supplementary search report drawn up and despatched |
Effective date: 20120618 |
|
| RIC1 | Information provided on ipc code assigned before grant |
Ipc: G01F 23/292 20060101AFI20120612BHEP Ipc: G01F 23/00 20060101ALI20120612BHEP |
|
| STAA | Information on the status of an ep patent application or granted ep patent |
Free format text: STATUS: EXAMINATION IS IN PROGRESS |
|
| 17Q | First examination report despatched |
Effective date: 20171211 |
|
| RAP1 | Party data changed (applicant data changed or rights of an application transferred) |
Owner name: SIEMENS HEALTHCARE DIAGNOSTICS INC. |
|
| GRAP | Despatch of communication of intention to grant a patent |
Free format text: ORIGINAL CODE: EPIDOSNIGR1 |
|
| STAA | Information on the status of an ep patent application or granted ep patent |
Free format text: STATUS: GRANT OF PATENT IS INTENDED |
|
| INTG | Intention to grant announced |
Effective date: 20191025 |
|
| GRAS | Grant fee paid |
Free format text: ORIGINAL CODE: EPIDOSNIGR3 |
|
| GRAA | (expected) grant |
Free format text: ORIGINAL CODE: 0009210 |
|
| STAA | Information on the status of an ep patent application or granted ep patent |
Free format text: STATUS: THE PATENT HAS BEEN GRANTED |
|
| AK | Designated contracting states |
Kind code of ref document: B1 Designated state(s): AT BE BG CH CY CZ DE DK EE ES FI FR GB GR HR HU IE IS IT LI LT LU LV MC MK MT NL NO PL PT RO SE SI SK SM TR |
|
| REG | Reference to a national code |
Ref country code: GB Ref legal event code: FG4D |
|
| REG | Reference to a national code |
Ref country code: AT Ref legal event code: REF Ref document number: 1251961 Country of ref document: AT Kind code of ref document: T Effective date: 20200415 Ref country code: CH Ref legal event code: EP |
|
| REG | Reference to a national code |
Ref country code: DE Ref legal event code: R096 Ref document number: 602009061621 Country of ref document: DE |
|
| REG | Reference to a national code |
Ref country code: IE Ref legal event code: FG4D |
|
| PG25 | Lapsed in a contracting state [announced via postgrant information from national office to epo] |
Ref country code: BG Free format text: LAPSE BECAUSE OF FAILURE TO SUBMIT A TRANSLATION OF THE DESCRIPTION OR TO PAY THE FEE WITHIN THE PRESCRIBED TIME-LIMIT Effective date: 20200701 |
|
| REG | Reference to a national code |
Ref country code: NL Ref legal event code: MP Effective date: 20200401 |
|
| REG | Reference to a national code |
Ref country code: LT Ref legal event code: MG4D |
|
| PG25 | Lapsed in a contracting state [announced via postgrant information from national office to epo] |
Ref country code: CZ Free format text: LAPSE BECAUSE OF FAILURE TO SUBMIT A TRANSLATION OF THE DESCRIPTION OR TO PAY THE FEE WITHIN THE PRESCRIBED TIME-LIMIT Effective date: 20200401 Ref country code: NL Free format text: LAPSE BECAUSE OF FAILURE TO SUBMIT A TRANSLATION OF THE DESCRIPTION OR TO PAY THE FEE WITHIN THE PRESCRIBED TIME-LIMIT Effective date: 20200401 Ref country code: NO Free format text: LAPSE BECAUSE OF FAILURE TO SUBMIT A TRANSLATION OF THE DESCRIPTION OR TO PAY THE FEE WITHIN THE PRESCRIBED TIME-LIMIT Effective date: 20200701 Ref country code: IS Free format text: LAPSE BECAUSE OF FAILURE TO SUBMIT A TRANSLATION OF THE DESCRIPTION OR TO PAY THE FEE WITHIN THE PRESCRIBED TIME-LIMIT Effective date: 20200801 Ref country code: SE Free format text: LAPSE BECAUSE OF FAILURE TO SUBMIT A TRANSLATION OF THE DESCRIPTION OR TO PAY THE FEE WITHIN THE PRESCRIBED TIME-LIMIT Effective date: 20200401 Ref country code: FI Free format text: LAPSE BECAUSE OF FAILURE TO SUBMIT A TRANSLATION OF THE DESCRIPTION OR TO PAY THE FEE WITHIN THE PRESCRIBED TIME-LIMIT Effective date: 20200401 Ref country code: GR Free format text: LAPSE BECAUSE OF FAILURE TO SUBMIT A TRANSLATION OF THE DESCRIPTION OR TO PAY THE FEE WITHIN THE PRESCRIBED TIME-LIMIT Effective date: 20200702 Ref country code: LT Free format text: LAPSE BECAUSE OF FAILURE TO SUBMIT A TRANSLATION OF THE DESCRIPTION OR TO PAY THE FEE WITHIN THE PRESCRIBED TIME-LIMIT Effective date: 20200401 Ref country code: PT Free format text: LAPSE BECAUSE OF FAILURE TO SUBMIT A TRANSLATION OF THE DESCRIPTION OR TO PAY THE FEE WITHIN THE PRESCRIBED TIME-LIMIT Effective date: 20200817 |
|
| REG | Reference to a national code |
Ref country code: AT Ref legal event code: MK05 Ref document number: 1251961 Country of ref document: AT Kind code of ref document: T Effective date: 20200401 |
|
| PG25 | Lapsed in a contracting state [announced via postgrant information from national office to epo] |
Ref country code: LV Free format text: LAPSE BECAUSE OF FAILURE TO SUBMIT A TRANSLATION OF THE DESCRIPTION OR TO PAY THE FEE WITHIN THE PRESCRIBED TIME-LIMIT Effective date: 20200401 Ref country code: HR Free format text: LAPSE BECAUSE OF FAILURE TO SUBMIT A TRANSLATION OF THE DESCRIPTION OR TO PAY THE FEE WITHIN THE PRESCRIBED TIME-LIMIT Effective date: 20200401 |
|
| REG | Reference to a national code |
Ref country code: DE Ref legal event code: R097 Ref document number: 602009061621 Country of ref document: DE |
|
| PG25 | Lapsed in a contracting state [announced via postgrant information from national office to epo] |
Ref country code: ES Free format text: LAPSE BECAUSE OF FAILURE TO SUBMIT A TRANSLATION OF THE DESCRIPTION OR TO PAY THE FEE WITHIN THE PRESCRIBED TIME-LIMIT Effective date: 20200401 Ref country code: AT Free format text: LAPSE BECAUSE OF FAILURE TO SUBMIT A TRANSLATION OF THE DESCRIPTION OR TO PAY THE FEE WITHIN THE PRESCRIBED TIME-LIMIT Effective date: 20200401 Ref country code: RO Free format text: LAPSE BECAUSE OF FAILURE TO SUBMIT A TRANSLATION OF THE DESCRIPTION OR TO PAY THE FEE WITHIN THE PRESCRIBED TIME-LIMIT Effective date: 20200401 Ref country code: SM Free format text: LAPSE BECAUSE OF FAILURE TO SUBMIT A TRANSLATION OF THE DESCRIPTION OR TO PAY THE FEE WITHIN THE PRESCRIBED TIME-LIMIT Effective date: 20200401 Ref country code: EE Free format text: LAPSE BECAUSE OF FAILURE TO SUBMIT A TRANSLATION OF THE DESCRIPTION OR TO PAY THE FEE WITHIN THE PRESCRIBED TIME-LIMIT Effective date: 20200401 Ref country code: DK Free format text: LAPSE BECAUSE OF FAILURE TO SUBMIT A TRANSLATION OF THE DESCRIPTION OR TO PAY THE FEE WITHIN THE PRESCRIBED TIME-LIMIT Effective date: 20200401 Ref country code: IT Free format text: LAPSE BECAUSE OF FAILURE TO SUBMIT A TRANSLATION OF THE DESCRIPTION OR TO PAY THE FEE WITHIN THE PRESCRIBED TIME-LIMIT Effective date: 20200401 |
|
| PLBE | No opposition filed within time limit |
Free format text: ORIGINAL CODE: 0009261 |
|
| STAA | Information on the status of an ep patent application or granted ep patent |
Free format text: STATUS: NO OPPOSITION FILED WITHIN TIME LIMIT |
|
| PG25 | Lapsed in a contracting state [announced via postgrant information from national office to epo] |
Ref country code: SK Free format text: LAPSE BECAUSE OF FAILURE TO SUBMIT A TRANSLATION OF THE DESCRIPTION OR TO PAY THE FEE WITHIN THE PRESCRIBED TIME-LIMIT Effective date: 20200401 Ref country code: PL Free format text: LAPSE BECAUSE OF FAILURE TO SUBMIT A TRANSLATION OF THE DESCRIPTION OR TO PAY THE FEE WITHIN THE PRESCRIBED TIME-LIMIT Effective date: 20200401 |
|
| 26N | No opposition filed |
Effective date: 20210112 |
|
| PG25 | Lapsed in a contracting state [announced via postgrant information from national office to epo] |
Ref country code: SI Free format text: LAPSE BECAUSE OF FAILURE TO SUBMIT A TRANSLATION OF THE DESCRIPTION OR TO PAY THE FEE WITHIN THE PRESCRIBED TIME-LIMIT Effective date: 20200401 |
|
| REG | Reference to a national code |
Ref country code: CH Ref legal event code: PL |
|
| GBPC | Gb: european patent ceased through non-payment of renewal fee |
Effective date: 20201211 |
|
| PG25 | Lapsed in a contracting state [announced via postgrant information from national office to epo] |
Ref country code: MC Free format text: LAPSE BECAUSE OF FAILURE TO SUBMIT A TRANSLATION OF THE DESCRIPTION OR TO PAY THE FEE WITHIN THE PRESCRIBED TIME-LIMIT Effective date: 20200401 |
|
| REG | Reference to a national code |
Ref country code: BE Ref legal event code: MM Effective date: 20201231 |
|
| PG25 | Lapsed in a contracting state [announced via postgrant information from national office to epo] |
Ref country code: IE Free format text: LAPSE BECAUSE OF NON-PAYMENT OF DUE FEES Effective date: 20201211 Ref country code: LU Free format text: LAPSE BECAUSE OF NON-PAYMENT OF DUE FEES Effective date: 20201211 Ref country code: FR Free format text: LAPSE BECAUSE OF NON-PAYMENT OF DUE FEES Effective date: 20201231 |
|
| PG25 | Lapsed in a contracting state [announced via postgrant information from national office to epo] |
Ref country code: LI Free format text: LAPSE BECAUSE OF NON-PAYMENT OF DUE FEES Effective date: 20201231 Ref country code: GB Free format text: LAPSE BECAUSE OF NON-PAYMENT OF DUE FEES Effective date: 20201211 Ref country code: CH Free format text: LAPSE BECAUSE OF NON-PAYMENT OF DUE FEES Effective date: 20201231 |
|
| PG25 | Lapsed in a contracting state [announced via postgrant information from national office to epo] |
Ref country code: TR Free format text: LAPSE BECAUSE OF FAILURE TO SUBMIT A TRANSLATION OF THE DESCRIPTION OR TO PAY THE FEE WITHIN THE PRESCRIBED TIME-LIMIT Effective date: 20200401 Ref country code: MT Free format text: LAPSE BECAUSE OF FAILURE TO SUBMIT A TRANSLATION OF THE DESCRIPTION OR TO PAY THE FEE WITHIN THE PRESCRIBED TIME-LIMIT Effective date: 20200401 Ref country code: CY Free format text: LAPSE BECAUSE OF FAILURE TO SUBMIT A TRANSLATION OF THE DESCRIPTION OR TO PAY THE FEE WITHIN THE PRESCRIBED TIME-LIMIT Effective date: 20200401 |
|
| PG25 | Lapsed in a contracting state [announced via postgrant information from national office to epo] |
Ref country code: MK Free format text: LAPSE BECAUSE OF FAILURE TO SUBMIT A TRANSLATION OF THE DESCRIPTION OR TO PAY THE FEE WITHIN THE PRESCRIBED TIME-LIMIT Effective date: 20200401 |
|
| PG25 | Lapsed in a contracting state [announced via postgrant information from national office to epo] |
Ref country code: BE Free format text: LAPSE BECAUSE OF NON-PAYMENT OF DUE FEES Effective date: 20201231 |
|
| PGFP | Annual fee paid to national office [announced via postgrant information from national office to epo] |
Ref country code: DE Payment date: 20220620 Year of fee payment: 14 |