EP2367116A2 - Graph display apparatus, recording medium on which program is recorded and graph display method - Google Patents
Graph display apparatus, recording medium on which program is recorded and graph display method Download PDFInfo
- Publication number
- EP2367116A2 EP2367116A2 EP11157248A EP11157248A EP2367116A2 EP 2367116 A2 EP2367116 A2 EP 2367116A2 EP 11157248 A EP11157248 A EP 11157248A EP 11157248 A EP11157248 A EP 11157248A EP 2367116 A2 EP2367116 A2 EP 2367116A2
- Authority
- EP
- European Patent Office
- Prior art keywords
- display
- coordinate system
- scale
- unit
- coordinate
- Prior art date
- Legal status (The legal status is an assumption and is not a legal conclusion. Google has not performed a legal analysis and makes no representation as to the accuracy of the status listed.)
- Ceased
Links
Images


Classifications
-
- G—PHYSICS
- G06—COMPUTING; CALCULATING OR COUNTING
- G06F—ELECTRIC DIGITAL DATA PROCESSING
- G06F15/00—Digital computers in general; Data processing equipment in general
- G06F15/02—Digital computers in general; Data processing equipment in general manually operated with input through keyboard and computation using a built-in program, e.g. pocket calculators
Definitions
- the present invention relates to a graph display apparatus, a recording medium on which a program is recorded and a graph display method which can display a graph in which scale intervals are set for each coordinate axis.
- a graph display apparatus which displays a graph of a function formula is configured to display a numerical value (scale value) in each scale position when a user sets scale intervals on coordinate axes.
- Recent graph display apparatuses are configured to automatically reduce the number of scales and to display scale values in the positions of the remaining scales when display contents are zoomed out, for example.
- a graph display apparatus including: a display unit; a graph formula input unit for receiving input of a graph formula based on a user operation; a coordinate system setting unit for setting a display range of a coordinate system and a scale interval on a coordinate axis in the coordinate system based on the user operation; a coordinate system display controlling unit for making the display unit display the coordinate axis in the coordinate system in the display range set by the coordinate system setting unit and display scales and scale values at the scale interval set by the coordinate system setting unit on the coordinate axis, the coordinate system display controlling unit including a scale value display controlling unit for detecting overlapping of the scale values to be displayed on the coordinate axis, and, when the scale values overlap, making the display unit display only scale values of scales at both ends among the scales to be displayed on the coordinate axis; and a graph display controlling unit for making the display unit display a graph of the graph formula in the set display range of the coordinate system.
- a display range of a coordinate system and scale intervals on coordinate axes in the coordinate system are set based on a user operation, overlapping of scale values to be displayed on the coordinate axes is detected, and, when the scale values overlap, only the scale values of the scales at both ends among the scales to be displayed on the coordinate axes are displayed. Therefore, it is possible to display a range to be displayed of a graph while preventing the graph from looking cramped, and preventing scale intervals from being changed.
- FIG. 1 is a plan view illustrating a schematic configuration of a scientific electronic calculator 1 to which an electronic device according to the present invention is applied. As illustrated in FIG. 1 , the scientific electronic calculator 1 has an input key group 2 having various key groups and a display 3.
- the input key group 2 receives an operation of inputting a mathematical formula element such as a numerical value or an arithmetic operation symbol from a user and receives operations of commanding various pieces of processing, and has a plurality of keys to which unique functions are respectively assigned.
- the input key group 2 has, for example, a numerical keypad 20, arithmetic operation symbol keys 21, a cursor key 22, an EXE key 23, a delete key 24 and function keys 26.
- the numerical keypad 20 includes keys for receiving operations of inputting numerical values, and the arithmetic operation symbol keys 21 receive operations of inputting various arithmetic operation symbols such as a symbol or a bracket of four arithmetic operations, a vinculum of a fraction, a root sign ( ⁇ ), a logarithmic symbol, a constant (for example, the circumference ratio " ⁇ " or the light velocity "c") and a trigonometric function symbol.
- various arithmetic operation symbols such as a symbol or a bracket of four arithmetic operations, a vinculum of a fraction, a root sign ( ⁇ ), a logarithmic symbol, a constant (for example, the circumference ratio " ⁇ " or the light velocity "c”) and a trigonometric function symbol.
- the cursor key 22 is pushed down to move a cursor, which indicates a position to be edited or a position to be selected, in a predetermined direction in the display 3, for example.
- the cursor key 22 is configured to receive inputs in four directions of up, down, left and right in the present embodiment.
- the EXE key 23 receives an operation of inputting an execution command or a determination command of processing, and functions as a key for commanding an execution of arithmetic processing after a mathematical formula is input, for example.
- the delete key 24 receives an operation of deleting a numerical value or an arithmetic operation symbol displayed on the display 3.
- the function keys 26 include a plurality of keys for receiving an execution command of predetermined processing, and, in the present embodiment, include six keys 26a to 26f of "F1" to "F6". Among these keys, the "F2" key 26b is operated when a display range in the display 3 is to be changed. Further, the "F3" key 26c is operated to set or see view window information.
- the view window information shows a display mode of the X-Y coordinate system, and, in the present embodiment, shows a display range (maximum and minimum coordinate values of X and Y; that is, Xmin, Xmax, Ymin, and Ymax) of the X-Y coordinate system, scale intervals (Xscl and Yscl) on each coordinate axis, and a dot interval (X dot) in the X-axis direction when a graph is displayed.
- Y values of a graph equation are computed based on the X coordinate values which start from the X minimum coordinate value, the Y values being computed at the dot interval, and are plotted in the positions of the corresponding coordinates in the display range to display a graph.
- the display 3 is composed of, for example, an LCD (Liquid Crystal Display) or an ELD (Electronic Luminescent Display).
- the display 3 displays various pieces of data required for the use of the scientific electronic calculator 1 as well as texts, signs, mathematical formulae or arithmetic operation results, or the like, according to the operation of the input key group 2 or the like.
- a touch panel 30 is provided over the entire display screen, the touch panel 30 being integrated with the display 3.
- FIG. 2 is a block diagram illustrating a schematic function configuration of the scientific electronic calculator 1.
- the scientific electronic calculator 1 is composed of a key input unit 14, a display unit 15, an interface 16, a RAM (Random Access Memory) 12, a storing unit 13, and a CPU (Central Processing Unit) 11.
- the key input unit 14 includes the above input key group 2, and outputs to the CPU 11 an operation signal corresponding to a pushed key.
- the display unit 15 includes the above display 3, and displays various pieces of information on the display 3 according to a display signal from the CPU 11. Further, the display unit 15 includes the touch panel 30 provided integrally with the display 3, and outputs the information about a position at which an input pen touches on the display screen, to the CPU 11.
- the interface 16 is a connection terminal for connecting to an external device that is not illustrated, and can read data from the external device through a USB cable or the like in the present embodiment. In addition, this interface 16 may read data from a recording medium such as a card medium.
- the RAM 12 is a volatile memory for storing information temporarily, and includes a plurality of work areas to store, for example, various programs to be executed and data related to these various programs.
- the RAM 12 according to the present embodiment includes a mathematical formula storage area 120 as the work area.
- the mathematical formula storage area 120 stores a graph formula to be input in graph function processing (see FIG. 3 ) described below.
- the storing unit 13 is a nonvolatile memory which is composed of, for example, a ROM (Read Only Memory), and stores various programs and various pieces of data. More specifically, the storing unit 13 stores a graph function program 130 as the program according to the present invention and an image file group 131.
- the graph function program 130 is a program for causing the CPU 11 to execute the graph function processing (see FIG. 3 ) described below.
- the image file group 131 stores a plurality of image files 132 of images which can be displayed with the images overlaid on the coordinate system.
- Each of the image files 132 is formed by adding additional data to image data.
- the additional data shows a display range to be displayed (numerical value widths of X and Y axes) in the coordinate system to be displayed with the coordinate system being overlaid on the image, and scale intervals on each coordinate axis.
- the CPU 11 centrally controls each unit of the scientific electronic calculator 1. More specifically, the CPU 11 expands a program specified among system programs and various application programs stored in the storing unit 13, in the RAM 12, and executes various pieces of processing in collaboration with the program expanded in the RAM 12.
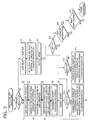
- FIG. 3 is a flowchart illustrating the operation of the graph function processing.
- the graph function program 130 is read from the storing unit 13 and adequately expanded in the RAM 12, and, as a result, the graph function processing is executed with the graph function program 130 and the CPU 11 collaborating with each other.
- the CPU 11 first determines whether a user operation of importing the image files 132 into the display screen of the display 3 is performed (Step S1) .
- Step S1 determines whether a user operation of importing the image files 132 into the display screen of the display 3 is performed.
- the CPU 11 allows the user to select one of the image files 132 in the image file group 131 (Step S2).
- the CPU 11 sets additional data (a display range (maximum and minimum coordinate values of X and Y; Xmin, Xmax, Ymin, and Ymax) of the X-Y coordinate system and scale intervals (Xscl and Yscl)) which is added to the selected image file 132, as view window information (Step S3) .
- the CPU 11 moves on to Step S5 described below.
- Step S5 when determining that the user operation of importing the image files 132 into the display screen is not performed in above Step S1 (Step S1; No), the CPU 11 allows the user to input a graph formula (Step S5).
- the graph formula may be input through the input key group 2, or may be input through the touch panel 30.
- the CPU 11 sets such contents as the view window information (Step S6) and allows the user to set up a display mode of the X-Y coordinate system (Step S7) .
- the CPU 11 makes the display 3 display the contents of the view window information and allows the user to see the contents in Step S6.
- Step S7 the user can configure the following setting; as a setting for "Axes" (X and Y axes), selecting either “on” (to display the coordinate axes), “off” (to hide the coordinate axes) or “scale” (to display the coordinate axes with scale values in scale positions); as a setting for "Label” (the names of the coordinate axes of X and Y and the origin position "0"), selecting either “on” (to display) or “off” (to hide) ; as a setting for "Grid”, selecting either “on” (to display grid points), “off” (to hide a grid) or “line” (to display grid lines), and the like.
- Step S8 the CPU 11 performs coordinate system displaying processing. More specifically, as illustrated in FIG. 4 , the CPU 11 first determines whether a setting for "Axes" (X and Y axes) is set to "off" (Step T1) in this coordinate system displaying processing. When determining that the setting for "Axes" is set to "off” (Step T1; Yes), the CPU 11 moves on to Step T21 described below.
- Step T1 when determining that the setting for "Axes" (X and Y axes) is not set to “off”, that is, when determining that the setting for "Axes" is set to either "on” or “scale", in Step T1 (Step T1; No), the CPU 11 commands the X and Y axes to be drawn in the display area of the display 3 at the set numerical value widths, and commands scale marks to be drawn on the coordinate axes at the set scale intervals (Step T2).
- Step T3 determines whether the setting for "Axes" (X and Y axes) is set to "scale” (Step T3).
- Step T3 determines that the setting for "Axes" is not set to "scale” (Step T3; No).
- Step T3 when determining that the setting for "Axes" (X and Y axes) is set to "scale” in Step T3 (Step T3; Yes), the CPU 11 determines whether the scale values mutually overlap when the scale values are displayed in each scale position on the X axis (Step T4). In addition, a font, a point or a display digit of scale values in addition to scale intervals are used for the determination in Step T4.
- Step T4 When determining that the scale values in each scale position on the X axis mutually overlap in Step T4 (Step T4; Yes), the CPU 11 makes the display 3 display only the scale values of the scales at both ends (maximum value and minimum value), among the scales to be displayed on the X axis (Step T5), and then, moves on to Step T9 described below.
- the CPU 11 makes the display 3 display only the scale values of the scales at both ends among the scale values to be displayed on the X axis which can be displayed in the display area of the display 3 in Step T5. More specifically, as illustrated in FIG.
- Step T4 when determining that the scale values in each of the scale positions on the X axis do not mutually overlap in Step T4 (Step T4; No), the CPU 11 makes the display 3 display the scale values in each of the scale positions on the X axis (Step T6) .
- the CPU 11 may always make the display 3 display the scale values of all the scales.
- Step T7 determines whether the interval between the scale values in each of the scale positions on the X axis is equal to or less than a predetermined value (for example, equal to or less than a dot pitch) (Step T7) .
- a predetermined value for example, equal to or less than a dot pitch
- Step T7 when determining that the interval between the scale values is equal to or less than the predetermined value in Step T7 (Step T7; Yes) , the CPU 11 makes the display 3 display the scale values in the scale positions with the scale values displayed in alternately different colors. (Step T8). Accordingly, even when the interval between the scale values is small and the scale values look too close to each other, each scale value can be made identifiable.
- the predetermined value is not limited to a dot pitch but may be a value computed based on scale intervals, or a font, a point or a display digit of scale values in the determination in Step T7 described above.
- the CPU 11 determines whether the scale values mutually overlap when the scale values are displayed in each of the scale positions of the Y axis (Step T9).
- Step T9 When determining that the scale values in each of the scale positions on the Y axis mutually overlap in Step T9 (Step T9; Yes), the CPU 11 makes the display 3 display only the scale values of the scales at both ends (maximum value and minimum value) among the scales to be displayed on the Y axis (Step T10), and then, moves on to Step T21 described below.
- the CPU 11 makes the display 3 display only the scale values of the scales at both ends among the scale values to be displayed on the Y axis which can be displayed in the display area of the display 3 in Step T10.
- the CPU 11 may always make the display 3 display the scale values of the scales at both ends in the display area.
- Step T9 when determining that the scale values in each of the scale positions on the Y axis do not mutually overlap in Step T9 (Step T9; No), the CPU 11 makes the display 3 display the scale values in each of the scale positions on the Y axis (Step T11).
- the CPU 11 makes the display 3 display only the scale values which can be displayed in the display area of the display 3 among the scale values to be displayed in each of the scale positions on the Y axis in Step T11 in the present embodiment, the CPU 11 may always make the display 3 display the scale values of all the scales.
- Step T21 determines whether a setting for "Label” is set to "on” (Step T21).
- Step T21 determines whether a setting for "Label” is set to "on” (Step T21).
- Step T21; No the CPU 11moves on to Step T23 described below.
- Step T21 when determining that the setting for "Label” is set to "on” in Step T21 (Step T21; Yes), the CPU 11 makes the display 3 display the names of the coordinate axes of X and Y and the origin position "0" in the coordinate system of the display 3 (Step T22).
- Step T23 determines whether a setting for "Grid” is set to “on” (Step T23).
- Step T23 determines whether a setting for "Grid” is set to "on” (Step T23).
- Step T23 when determining that the setting for "Grid” is set to "on” in Step T23 (Step T23; Yes), the CPU 11 determines whether the intervals of the grid to be displayed are equal to or less than a predetermined values (Step T31) . In the present embodiment, the CPU 11 determines whether the grid interval is equal to or less than 25 dots in the X-axis direction, and is equal to or less than 13 dots in the Y-axis direction in Step T31. When this condition is satisfied, the grid intervals are too small, and display contents are too cramped.
- Step T31 When determining that the grid intervals are equal to or less than the predetermine values in Step T31 (Step T31; Yes), the CPU 11 finishes the coordinate system displaying processing without commanding a grid to be displayed.
- Step T31 determines whether the setting for "Grid" is set to "line” (Step T32).
- Step T32 When determining that the setting for "Grid” is set to "line” in Step T32 (Step T32; Yes), the CPU 11 makes the display 3 display grid lines (Step T33), and then, finishes the coordinate system displaying processing.
- Step T32 when determining that the setting for "Grid” is not set to "line” in Step T32 (Step T32; No), the CPU 11 makes the display 3 display grid points (Step T34) , and then, finishes the coordinate system displaying processing.
- the CPU 11 makes the display 3 display the graph of the graph formula input in above Step S5 in the X-Y coordinate system (Step S9), and then, determines whether a zoom-in operation is performed (Step S11), as illustrated in FIG. 3 .
- Step S11 When determining that the zoom-in operation is performed in Step S11 (Step S11; Yes), the CPU 11 changes the display range (maximum and minimum coordinate values of X and Y; Xmin, Xmax, Ymin, and Ymax) of the X-Y coordinate system in the view window information to enlarge display contents at the magnification set according to the zoom-in operation (Step S12), and then, moves on to above Step S8.
- Step S11 when determining that the zoom-in operation is not performed in Step S11 (Step S11; No) , the CPU 11 determines whether a zoom-out operation is performed (Step S13).
- Step S13 When determining that the zoom-out operation is performed in Step S13 (Step S13; Yes) , the CPU 11 changes the display range (maximum and minimum coordinate values of X and Y; Xmin, Xmax, Ymin, and Ymax) of the X-Y coordinate system in the view window information to reduce display contents at the magnification set according to the zoom-out operation (Step S14) , and then, moves on to above Step S8.
- Step S13 when determining that the zoom-out operation is not performed in Step S13 (Step S13; No) , the CPU 11 determines whether a set-up operation is performed (Step S15).
- Step S15 When determining that the set-up operation is performed in Step S15 (Step S15; Yes), the CPU 11 moves on to above Step S7.
- Step S15 when determining that the set-up operation is not performed in Step S15 (Step S15 ; No), the CPU 11 determines whether an operation of setting the view window information is performed (Step S16).
- Step S16 When determining that the operation of setting the view window information is performed in Step S16 (Step S16; Yes), the CPU 11 moves on to above Step S6.
- Step S16 when determining that the operation of setting the view window information is not performed in Step S16 (Step S16; No), the CPU 11 determines whether an operation of inputting a graph formula is performed (Step S17). When determining that the operation of inputting a graph formula is not performed (Step S17; No), the CPU 11 moves on to another processing. On the other hand, when determining that the operation of inputting a graph formula is performed (Step S17; Yes), the CPU 11 moves on to above Step S5.
- Step T1 it is determined that the setting for "Axes" is not set to "off” (Step T1; No) , and the X and Y axes are drawn in the display area of the display 3 according to the set numerical value widths "X axis : -450 to 450" and "Y axis: -500 to 500" and the scale marks are drawn on the coordinate axes at the set scale interval "X and Y axes: 100" (Step T2), as illustrated in FIG. 5B .
- Step T3 it is determined that the setting for "Axes" is set to "scale” (Step T3; Yes) and it is determined that, when the scale values are displayed in each of the scale positions on the X axis, the scale values do not mutually overlap (Step T4; No), and the scale values are displayed in each of the scale positions on the X axis (Step T6) .
- Step T7; No it is determined that the interval between the scale values in the scale positions on the X axis is not equal to or less than a predetermined value (Step T7; No) and it is determined that, when the scale values are displayed in each of the scale positions on the Y axis, the scale values do not mutually overlap (Step T9; No), and the scale values are displayed in each of the scale positions on the Y axis (Step T11) .
- Step T21; Yes the setting for "Label” is set to "on”
- Step S16 After performing the operation of setting the view window information (Step S16; Yes) , the user sets again the view window information by setting the numerical value width to "-450 to 450" and the scale interval to "50" on the X coordinate and the numerical value width to "-500 to 500" and the scale interval to "50” on the Y coordinate (Step S6) , as illustrated in FIG. 5C , and sets up the X-Y coordinate system in a similar way to the above (Step S7). Then, as illustrated in FIG.
- Step T1 it is determined that the setting for "Axes" is not set to "off” (Step T1 ; No), and the X and Y axes are drawn in the display area of the display 3 according to the set numerical value widths "X axis: -450 to 450" and "Y axis: -500 to 500" and the scale marks are drawn on the coordinate axes at the set scale interval "X and Y axes: 50" (Step T2).
- Step T3 it is determined that the setting for "Axes" is set to "scale” (Step T3; Yes) and it is determined that, when the scale values are displayed in each of the scale positions on the X axis, the scale values mutually overlap (Step T4; Yes) , and only the scale values of the scale values at both ends (maximum value "400” and minimum value "-400") , among the scales to be displayed on the X axis which can be displayed in the display area, are displayed(Step T5) .
- Step T9 when the scale values are displayed in each of the scale positions on the Y axis, the scale values mutually overlap (Step T9; Yes), and only the scale values of the scale values at both ends (maximum value "450” and minimum value "-450") , among the scales to be displayed on the Y axis which can be displayed in the display area, are displayed (Step T10) .
- Step T21 the setting for "Label” is set to "on”
- Step T22 the names of the coordinate axes of X and Y and the origin position "0" are displayed in the coordinate system.
- Step S6 when the user sets again the view window information, from the state where the contents of above FIG. 5B are displayed, by setting the numerical value width to "-300 to 300" and the scale interval to "100" on the X coordinate and the numerical value width to "-300 to 300” and the scale interval to "100” on the Y coordinate (Step S6) as illustrated in FIG.
- Step S7 it is determined that the setting for "Axes" is not set to "off” (Step T1 ; No) , and the X and Y axes are drawn in the display area of the display 3 according to the set numerical value widths "X and Y axes: -300 to 300" and the scale marks are drawn on the coordinate axes at the set scale intervals "X and Y axes: 100" (Step T2), as illustrated in FIG. 6B .
- Step T3 it is determined that the setting for "Axes" is set to "scale” (Step T3; Yes) and it is determined that, when the scale values are displayed in each of the scale positions on the X axis, the scale values do not mutually overlap (Step T4; No), and the scale values are displayed in each of the scale positions on the X axis (Step T6).
- Step T7; No it is determined that the interval between scale values in scale positions on the X axis is not equal to or less than the predetermined value
- Step T9; No it is determined that, when the scale values are displayed in each of the scale positions on the Y axis, the scale values do not mutually overlap
- Step T11 it is determined that the setting for "Label” is set to "on” (Step T21; Yes), and the names of the coordinate axes of X and Y and the origin position "0" are displayed in the coordinate system (Step T22).
- the graph of the graph formula "Y - 1/2X" is displayed in the X-Y coordinate system (Step S9).
- Step S13 when the user performs the zoom-out operation (Step S13; Yes), the display range (maximum and minimum coordinate values of X and Y; Xmin, Xmax, Ymin, and Ymax) of the X-Y coordinate system in the view window information is changed to reduce display contents at the magnification (in this embodiment, 1/2-fold magnification) set according to the zoom-out operation (Step S14) , it is determined that the setting for "Axes" is not set to "off” (Step T1; No), and the X and Y axes are drawn in the display area of the display 3 according to the numerical value widths "X and Y axes: -600 to 600" set by the zoom-out operation and the scale marks are drawn on the coordinate axes at the set scale interval "X and Y axes: 100" (Step T2) , as illustrated in FIG.
- Step T3 it is determined that the setting for "Axes" is set to "scale” (Step T3; Yes) and it is determined that, when the scale values are displayed in each of the scale positions on the X axis, the scale values do not mutually overlap (Step T4; Yes) , and only the scale values of the scales at both ends (maximum value "500” and minimum value "-500"), among the scales to be displayed on the X axis which can be displayed in the display area, are displayed (Step T5) .
- Step S13 when the user performs the zoom-out operation (Step S13; Yes), the display range (maximum and minimum coordinate values of X and Y; Xmin, Xmax, Ymin, and Ymax) of the X-Y coordinate system in the view window information is changed to reduce display contents at the magnification (in this embodiment, 1/2-fold magnification) set according to the zoom-operation (Step S14).
- Step T1 it is determined that the setting for "Axes" is not set to "off” (Step T1; No) , and the X and Y axes are drawn in the display area of the display 3 according to the numerical value widths "X and Y axes: -1200 to 1200" set by the zoom-out operation and the scale marks are drawn on the coordinate axes at the set scale interval "X and Y axes: 100" (Step T2) , as illustrated in FIG. 6E .
- Step T3 it is determined that the setting for "Axes" is set to "scale” (Step T3; Yes) and it is determined that, when the scale values are displayed in each of the scale positions on the x axis, the scale values mutually overlap (Step T4; Yes) , and only the scale values of the scales at both ends(maximum value "1100” and minimum value "-1100") , among the scales to be displayed on the X axis which can be displayed in the display area, are displayed (Step T5) .
- Step T9 it is determined that, when the scale values are displayed in each of the scale positions on the Y axis, the scale values do not mutually overlap (Step T9; Yes), and only the scale values of the scales at both ends (maximum value "1200” and minimum value "-1200") , among the scales to be displayed on the Y axis which can be displayed in the display area, are displayed(Step T10) .
- Step T21 the setting for "Label” is set to "on”
- Step T22 the names of the coordinate axes of X and Y and the origin position "0" are displayed in the coordinate system.
- Step S2 the user performs the operation of importing the image files 132 into the display screen of the display 3 (Step S1; Yes), and selects one of the image files 132 named "FOUNTAIN.g3p" in the image file group 131 (Step S2).
- the additional data (numerical value widths and scale intervals of X and Y axes) added to the selected image file 132 is set as the view window information (Step S3) , and the image of the selected image file 132 (in this embodiment, the image of a fountain shot from the side) is displayed on the display 3 as a background of the coordinate system (Step S4).
- the numerical value width is "-18.9 to 18.9” and the scale interval is "1" on the X coordinate
- the numerical value width is "-9.3 to 9.3" and the scale interval is "1" on the Y coordinate, as illustrated in FIG. 7C .
- Step T1 it is determined that the setting for "Axes" is not set to "off” (Step T1; No) , and the X and Y axes are drawn in the display area of the display 3 according to the set numerical value widths "X axis: -18.9 to 18.9" and “Y axis: -9.3 to 9.3” and the scale marks are drawn on the coordinate axes at the set scale intervals "X and Y axes: 1" (Step T2), as illustrated in FIG. 8B .
- Step T3 it is determined that the setting for "Axes" is set to "scale” (Step T3; Yes) and it is determined that, when the scale values are displayed in each of the scale positions on the X axis, the scale values mutually overlap (Step T4; Yes) , and only the scale values of the scales at both ends (maximum value "18" and minimum value " -18") , among the scales to be displayed on the X axis which can be displayed in the display area, are displayed(Step T5).
- Step T9 when the scale values are displayed in each of the scale positions on the Y axis, the scale values mutually overlap (Step T9; Yes), and only the scale values of the scales at both ends (maximum value "9” and minimum value "-9") ,among the scales to be displayed on the Y axis which can be displayed in the display area, are displayed(Step T10).
- Step T21; Yes the setting for "Label” is set to "on”
- Step T22 the names of the coordinate axes of X and Y and the origin position "0" are displayed in the coordinate system.
- Step S11 when the user performs the zoom-in operation (Step S11; Yes), the display range (maximum and minimum coordinate values of X and Y; Xmin, Xmax, Ymin, and Ymax) of the X-Y coordinate system in view window information is changed to enlarge display contents at the magnification (in this embodiment 2-fold magnifications) set according to the zoom-in operation (Step S12).
- Step T1 it is determined that the setting for "Axes" is not set to "off” (Step T1; No), and the X and Y axes are drawn in the display area of the display 3 according to the numerical value widths "X axis: -9.45 to 9.45” and "Y axis: -4.65 to 4.65" set by the zoom-in operation and the scale marks are drawn on the coordinate axes at the set scale intervals "X and Y axes: 1" (Step T2), as illustrated in FIG. 8C .
- Step T3 it is determined that the setting for "Axes" is set to "scale” (Step T3; Yes) and it is determined that, when the scale values are displayed in each of the scale positions on the X axis, the scale values do not mutually overlap (Step T4; No) , and the scale values are displayed in each of the scale positions on the X axis (Step T6).
- Step T7; No it is determined that the interval between the scale values in the scale positions on the X axis is not equal to or less than the predetermined value (Step T7; No) and it is determined that, when the scale values are displayed in each of the scale positions on the Y axis, the scale values do not mutually overlap (Step T9; No), and the scale values are displayed in each of the scale positions on the Y axis (Step T11). Then, it is determined that the setting for "Label” is set to "on” (Step T21; Yes) and the names of the coordinate axes of X and Y and the origin position "0" are displayed in the coordinate system (Step T22).
- Step T1 it is determined that the setting for "Axes" is not set to "off” (Step T1; No), and the X and Y axes are drawn in the display area of the display 3 according to the set numerical value widths "X axis: -0.3 to 0.3" and "Y axis: -0.2 to 0.2" and the scale marks are drawn on the coordinate axes at the set scale intervals "X and Y axes: 0.1" (Step T2) ,as illustrated in FIG. 9A .
- Step T3 it is determined that the setting for "Axes" is set to "scale” (Step T3; Yes) and it is determined that, when the scale values are displayed in each of the scale positions on the X axis, the scale values do not mutually overlap (Step T4; No), and the scale values are displayed in each of the scale positions on the X axis (Step T6) .
- Step T7; No it is determined that the interval between the scale values in the scale positions on the X axis is not equal to or less than the predetermined value (Step T7; No) and it is determined that, when the scale values are displayed in each of the scale positions on the Y axis, the scale values do not mutually overlap (Step T9; No), and the scale values are displayed in each of the scale positions on the Y axis (Step T11) .
- Step S13 when the user performs the zoom-out operation (Step S13; Yes), the display range (maximum and minimum coordinate values of X and Y; Xmin, Xmax, Ymin, and Ymax) of the X-Y coordinate system in view window information is changed to reduce display contents at the magnification (in this embodiment, 1/2-fold magnification) set according to the zoom-out operation (Step S14) .
- Step T1 it is determined that the setting for "Axes" is not set to "off” (Step T1; No), and the X and Y axes are drawn in the display area of the display 3 according to the numerical value widths "X axis: -0.6 to 0.6" and "Y axis: -0.4 to 0.4" set by the zoom-out operation and the scale marks are drawn on the coordinate axes at the set scale interval "X and Y axes: 0.1" (Step T2), as illustrated in FIG. 9B .
- Step T3 it is determined that the setting for "Axes" is set to "scale” (Step T3; Yes) and it is determined that, when the scale values are displayed in each of the scale positions on the X axis, the scale values do not mutually overlap (Step T4; No) , and the scale values are displayed in each of the scale positions on the X axis (Step T6). Furthermore, it is determined that the interval between the scale values in the scale positions on the X axis is equal to or less than a predetermined value (in this embodiment, equal to or less than a dot pitch) (Step T7; Yes), and the scale values in the scale positions are displayed in alternately different display colors (Step T8). In addition, in FIG. 9B , the areas enclosed by broken lines in the display screen of the display 3 show that the texts in the areas are displayed in blue color.
- Step T9 it is determined that, when the scale values are displayed in each of the scale positions on the Y axis, the scale values do not mutually overlap (Step T9; No), and the scale values are displayed in each of the scale positions on the Y axis (Step T11) .
- a display range to be displayed of the coordinate system and scale intervals on the coordinate axes in the coordinate system are set based on the user operation, and overlapping of the scale values to be displayed on the coordinate axes is detected.
- the scale values overlap, only the scale values of scales at both ends among the scales to be displayed on the coordinate axes are displayed. Therefore, it is possible to display the range to be displayed of the graph while preventing the graph from looking cramped, and preventing the scale intervals from being changed.
- Steps S8 and S11 to S14 in FIG. 3 and FIGS. 6A to 6E when display contents are subjected to either zooming-in or zooming-out, overlapping of scale values to be displayed on the coordinate axes is detected. Therefore, even when the scale values overlap due to the zooming-in or zooming-out operation, it is possible to display a range to be displayed of the graph while preventing the graph from looking cramped, and preventing the scale intervals from being changed.
- the graph display apparatus has been described as the scientific electronic calculator 1, the apparatus to which the present invention is applicable is by no means limited to such a product but the present invention is generally applicable to the electronic devices such as mobile telephones, personal computers, PDAs (Personal Digital Assistant) , and game machines.
- the graph function program 130 according to the present invention may be stored in, for example, a memory card or a CD which is removable from the scientific electronic calculator 1.
- Step S1 has been described on the assumption that the image files 132 in the storing unit 13 are imported into the display screen, the image file 132 may be imported into the display screen from an external device through the interface 16.
- Step T8 has been described on the assumption that, when the interval between scale values in scale positions on the x axis is equal to or less than a predetermined value (equal to or less than a dot pitch), the scale values in the scale positions are displayed in alternately different display colors, the same processing may be applied to scale values in scale positions on the Y axis. Still further, as illustrated in FIG. 9C , the scale values can also be displayed so that the scale values are disposed at both sides of the coordinate axes alternately, in the processing of Step T8.
- a predetermined value equal to or less than a dot pitch
- the vertical axis and the horizontal axis of the coordinate system have been described as the Y axis and the X axis respectively, other names of the coordinate axes may be given.
- the coordinate system has been described as an orthogonal coordinate system, other types of coordinate systems such as an oblique coordinate system or polar coordinate system may be used.
- Step S5 has been described on the assumption that the user inputs a graph formula through the input key group 2, the user may input a graph formula through the touch panel 30.
Landscapes
- Engineering & Computer Science (AREA)
- Theoretical Computer Science (AREA)
- Computing Systems (AREA)
- Computer Hardware Design (AREA)
- Physics & Mathematics (AREA)
- General Engineering & Computer Science (AREA)
- General Physics & Mathematics (AREA)
- Controls And Circuits For Display Device (AREA)
- Digital Computer Display Output (AREA)
- Image Generation (AREA)
- User Interface Of Digital Computer (AREA)
Abstract
Description
- The present invention relates to a graph display apparatus, a recording medium on which a program is recorded and a graph display method which can display a graph in which scale intervals are set for each coordinate axis.
- Conventionally, a graph display apparatus which displays a graph of a function formula is configured to display a numerical value (scale value) in each scale position when a user sets scale intervals on coordinate axes.
- Therefore, when a user sets an X-axis scale interval to "100" in order to check Y values corresponding to X values "100", "200" ..., for example, in the graph, the scales and the scale values in the positions of each scale are displayed in the positions of X values "100", "200" ..., on the X axis.
- Incidentally, when display contents are zoomed out to see the overview of a graph (X-Y display range, i.e., Xmin, Xmax, Ymin, and Ymax are expanded to zoom out), a great number of scales are to be displayed in the display screen, and therefore the scales look too cramped even if the scale values of each scale are displayed with the size of the characters simply being reduced. Further, this problem occurs likewise when scale intervals are originally set small.
- Therefore, recent graph display apparatuses are configured to automatically reduce the number of scales and to display scale values in the positions of the remaining scales when display contents are zoomed out, for example.
- However, when the number of scales is automatically reduced, scale intervals set by a user change and thereby the displayed scales become confusing and cause misunderstanding. Further, it may be possible not to display scale values, from the viewpoint of preventing displayed scale values from being cramped. In this case, however, the range to be displayed of the graph becomes difficult to understand.
- It is therefore an object of the present invention to display a range to be displayed of a graph while preventing the graph from looking cramped, and preventing scale intervals from being changed.
- To achieve the abovementioned object, there is provided a graph display apparatus including: a display unit; a graph formula input unit for receiving input of a graph formula based on a user operation; a coordinate system setting unit for setting a display range of a coordinate system and a scale interval on a coordinate axis in the coordinate system based on the user operation; a coordinate system display controlling unit for making the display unit display the coordinate axis in the coordinate system in the display range set by the coordinate system setting unit and display scales and scale values at the scale interval set by the coordinate system setting unit on the coordinate axis, the coordinate system display controlling unit including a scale value display controlling unit for detecting overlapping of the scale values to be displayed on the coordinate axis, and, when the scale values overlap, making the display unit display only scale values of scales at both ends among the scales to be displayed on the coordinate axis; and a graph display controlling unit for making the display unit display a graph of the graph formula in the set display range of the coordinate system.
- According to the present invention, a display range of a coordinate system and scale intervals on coordinate axes in the coordinate system are set based on a user operation, overlapping of scale values to be displayed on the coordinate axes is detected, and, when the scale values overlap, only the scale values of the scales at both ends among the scales to be displayed on the coordinate axes are displayed. Therefore, it is possible to display a range to be displayed of a graph while preventing the graph from looking cramped, and preventing scale intervals from being changed.
- The above and other objects, advantages and features of the present invention will become more fully understood from the detailed description given hereinbelow and the appended drawings which are given by way of illustration only, and thus are not intended as a definition of the limits of the present invention, and wherein:
-
FIG. 1 is a plan view illustrating a schematic configuration of a scientific electronic calculator; -
FIG. 2 is a block diagram illustrating a function configuration of the scientific electronic calculator; -
FIG. 3 is a flowchart illustrating a flow of graph function processing; -
FIG. 4 is a flowchart illustrating a flow of coordinate system displaying processing; -
FIGS. 5A to 5D illustrate display contents on a display; -
FIGS. 6A to 6E illustrate display contents on the display; -
FIGS. 7A to 7D illustrate display contents on the display; -
FIGS. 8A to 8C illustrate display contents on the display; and -
FIGS. 9A to 9C illustrate display contents on the display. - One of embodiments according to the present invention will be described in detail below with reference to the accompanying drawings. However, the scope of the invention is not limited to the illustrated embodiment.
-
FIG. 1 is a plan view illustrating a schematic configuration of a scientificelectronic calculator 1 to which an electronic device according to the present invention is applied. As illustrated inFIG. 1 , the scientificelectronic calculator 1 has aninput key group 2 having various key groups and adisplay 3. - The
input key group 2 receives an operation of inputting a mathematical formula element such as a numerical value or an arithmetic operation symbol from a user and receives operations of commanding various pieces of processing, and has a plurality of keys to which unique functions are respectively assigned. In the present embodiment, theinput key group 2 has, for example, anumerical keypad 20, arithmeticoperation symbol keys 21, acursor key 22, anEXE key 23, adelete key 24 andfunction keys 26. - Among these keys, the
numerical keypad 20 includes keys for receiving operations of inputting numerical values, and the arithmeticoperation symbol keys 21 receive operations of inputting various arithmetic operation symbols such as a symbol or a bracket of four arithmetic operations, a vinculum of a fraction, a root sign (√), a logarithmic symbol, a constant (for example, the circumference ratio "π" or the light velocity "c") and a trigonometric function symbol. - The
cursor key 22 is pushed down to move a cursor, which indicates a position to be edited or a position to be selected, in a predetermined direction in thedisplay 3, for example. Thecursor key 22 is configured to receive inputs in four directions of up, down, left and right in the present embodiment. - The
EXE key 23 receives an operation of inputting an execution command or a determination command of processing, and functions as a key for commanding an execution of arithmetic processing after a mathematical formula is input, for example. Thedelete key 24 receives an operation of deleting a numerical value or an arithmetic operation symbol displayed on thedisplay 3. - The
function keys 26 include a plurality of keys for receiving an execution command of predetermined processing, and, in the present embodiment, include sixkeys 26a to 26f of "F1" to "F6". Among these keys, the "F2"key 26b is operated when a display range in thedisplay 3 is to be changed. Further, the "F3"key 26c is operated to set or see view window information. The view window information shows a display mode of the X-Y coordinate system, and, in the present embodiment, shows a display range (maximum and minimum coordinate values of X and Y; that is, Xmin, Xmax, Ymin, and Ymax) of the X-Y coordinate system, scale intervals (Xscl and Yscl) on each coordinate axis, and a dot interval (X dot) in the X-axis direction when a graph is displayed. When a graph is displayed, Y values of a graph equation are computed based on the X coordinate values which start from the X minimum coordinate value, the Y values being computed at the dot interval, and are plotted in the positions of the corresponding coordinates in the display range to display a graph. - The
display 3 is composed of, for example, an LCD (Liquid Crystal Display) or an ELD (Electronic Luminescent Display). Thedisplay 3 displays various pieces of data required for the use of the scientificelectronic calculator 1 as well as texts, signs, mathematical formulae or arithmetic operation results, or the like, according to the operation of theinput key group 2 or the like. In addition, on thedisplay 3 according to the present embodiment, atouch panel 30 is provided over the entire display screen, thetouch panel 30 being integrated with thedisplay 3. - Next, the function configuration of the scientific
electronic calculator 1 will be described. -
FIG. 2 is a block diagram illustrating a schematic function configuration of the scientificelectronic calculator 1. - As illustrated in
FIG. 2 , the scientificelectronic calculator 1 is composed of akey input unit 14, adisplay unit 15, aninterface 16, a RAM (Random Access Memory) 12, astoring unit 13, and a CPU (Central Processing Unit) 11. - The
key input unit 14 includes the aboveinput key group 2, and outputs to theCPU 11 an operation signal corresponding to a pushed key. - The
display unit 15 includes theabove display 3, and displays various pieces of information on thedisplay 3 according to a display signal from theCPU 11. Further, thedisplay unit 15 includes thetouch panel 30 provided integrally with thedisplay 3, and outputs the information about a position at which an input pen touches on the display screen, to theCPU 11. - The
interface 16 is a connection terminal for connecting to an external device that is not illustrated, and can read data from the external device through a USB cable or the like in the present embodiment. In addition, thisinterface 16 may read data from a recording medium such as a card medium. - The
RAM 12 is a volatile memory for storing information temporarily, and includes a plurality of work areas to store, for example, various programs to be executed and data related to these various programs. For example, theRAM 12 according to the present embodiment includes a mathematicalformula storage area 120 as the work area. - The mathematical
formula storage area 120 stores a graph formula to be input in graph function processing (seeFIG. 3 ) described below. - The storing
unit 13 is a nonvolatile memory which is composed of, for example, a ROM (Read Only Memory), and stores various programs and various pieces of data. More specifically, the storingunit 13 stores agraph function program 130 as the program according to the present invention and animage file group 131. - The
graph function program 130 is a program for causing theCPU 11 to execute the graph function processing (seeFIG. 3 ) described below. - The
image file group 131 stores a plurality of image files 132 of images which can be displayed with the images overlaid on the coordinate system. Each of the image files 132 is formed by adding additional data to image data. The additional data shows a display range to be displayed (numerical value widths of X and Y axes) in the coordinate system to be displayed with the coordinate system being overlaid on the image, and scale intervals on each coordinate axis. - The
CPU 11 centrally controls each unit of the scientificelectronic calculator 1. More specifically, theCPU 11 expands a program specified among system programs and various application programs stored in the storingunit 13, in theRAM 12, and executes various pieces of processing in collaboration with the program expanded in theRAM 12. - Next, the operation of the scientific
electronic calculator 1 will be described. -
FIG. 3 is a flowchart illustrating the operation of the graph function processing. In addition, when a user inputs an execution command to perform the graph function processing through thetouch panel 30 or thekey input unit 14, thegraph function program 130 is read from the storingunit 13 and adequately expanded in theRAM 12, and, as a result, the graph function processing is executed with thegraph function program 130 and theCPU 11 collaborating with each other. - As illustrated in
FIG. 3 , in the graph function processing, theCPU 11 first determines whether a user operation of importing the image files 132 into the display screen of thedisplay 3 is performed (Step S1) . When determining that the user operation is performed (Step S1; Yes), theCPU 11 allows the user to select one of the image files 132 in the image file group 131 (Step S2). - Next, the
CPU 11 sets additional data (a display range (maximum and minimum coordinate values of X and Y; Xmin, Xmax, Ymin, and Ymax) of the X-Y coordinate system and scale intervals (Xscl and Yscl)) which is added to the selectedimage file 132, as view window information (Step S3) . After making thedisplay 3 display the image of the selectedimage file 132 as a background of the coordinate system (Step S4), theCPU 11 moves on to Step S5 described below. - Further, when determining that the user operation of importing the image files 132 into the display screen is not performed in above Step S1 (Step S1; No), the
CPU 11 allows the user to input a graph formula (Step S5). In addition, the graph formula may be input through the inputkey group 2, or may be input through thetouch panel 30. - Next, when the user changes or sees the display range (maximum and minimum coordinate values of X and Y; Xmin, Xmax, Ymin, and Ymax) of the X-Y coordinate system and the scale intervals (Xscl and Yscl) in the view window information, the
CPU 11 sets such contents as the view window information (Step S6) and allows the user to set up a display mode of the X-Y coordinate system (Step S7) . When the additional data in the selectedimage file 132 is set as the view window information in above Step S3, theCPU 11 makes thedisplay 3 display the contents of the view window information and allows the user to see the contents in Step S6. Further, in Step S7, the user can configure the following setting; as a setting for "Axes" (X and Y axes), selecting either "on" (to display the coordinate axes), "off" (to hide the coordinate axes) or "scale" (to display the coordinate axes with scale values in scale positions); as a setting for "Label" (the names of the coordinate axes of X and Y and the origin position "0"), selecting either "on" (to display) or "off" (to hide) ; as a setting for "Grid", selecting either "on" (to display grid points), "off" (to hide a grid) or "line" (to display grid lines), and the like. - Next, the
CPU 11 performs coordinate system displaying processing (Step S8) . More specifically, as illustrated inFIG. 4 , theCPU 11 first determines whether a setting for "Axes" (X and Y axes) is set to "off" (Step T1) in this coordinate system displaying processing. When determining that the setting for "Axes" is set to "off" (Step T1; Yes), theCPU 11 moves on to Step T21 described below. - Further, when determining that the setting for "Axes" (X and Y axes) is not set to "off", that is, when determining that the setting for "Axes" is set to either "on" or "scale", in Step T1 (Step T1; No), the
CPU 11 commands the X and Y axes to be drawn in the display area of thedisplay 3 at the set numerical value widths, and commands scale marks to be drawn on the coordinate axes at the set scale intervals (Step T2). - Next, the
CPU 11 determines whether the setting for "Axes" (X and Y axes) is set to "scale" (Step T3). When determining that the setting for "Axes" is not set to "scale" (Step T3; No), theCPU 11 moves on to Step T21 described below. - Further, when determining that the setting for "Axes" (X and Y axes) is set to "scale" in Step T3 (Step T3; Yes), the
CPU 11 determines whether the scale values mutually overlap when the scale values are displayed in each scale position on the X axis (Step T4). In addition, a font, a point or a display digit of scale values in addition to scale intervals are used for the determination in Step T4. - When determining that the scale values in each scale position on the X axis mutually overlap in Step T4 (Step T4; Yes), the
CPU 11 makes thedisplay 3 display only the scale values of the scales at both ends (maximum value and minimum value), among the scales to be displayed on the X axis (Step T5), and then, moves on to Step T9 described below. In addition, in the present embodiment, theCPU 11 makes thedisplay 3 display only the scale values of the scales at both ends among the scale values to be displayed on the X axis which can be displayed in the display area of thedisplay 3 in Step T5. More specifically, as illustrated inFIG. 5D described below, when the X-axis scale interval is "50" and the range of "-450 to 450" is displayed in the display area of thedisplay 3, the scale values "-450" and "450" at both ends of the X axis cannot be displayed in the display area, and therefore the scale values "-400" and "400" at both ends which can be displayed are displayed. In addition, theCPU 11 may always make thedisplay 3 display the scale values of the scales at both ends in the display area in Step T5. - Further, when determining that the scale values in each of the scale positions on the X axis do not mutually overlap in Step T4 (Step T4; No), the
CPU 11 makes thedisplay 3 display the scale values in each of the scale positions on the X axis (Step T6) . In addition, although theCPU 11 makes thedisplay 3 display only the scale values which can be displayed in the display area of thedisplay 3 among the scale values to be displayed in each of the scale positions on the X axis in Step T6 in the present embodiment, theCPU 11 may always make thedisplay 3 display the scale values of all the scales. - Next, the
CPU 11 determines whether the interval between the scale values in each of the scale positions on the X axis is equal to or less than a predetermined value (for example, equal to or less than a dot pitch) (Step T7) . When determining that the interval is not equal to or less than the predetermined value (Step T7; No), theCPU 11 moves on to Step T9 described below. - Further, when determining that the interval between the scale values is equal to or less than the predetermined value in Step T7 (Step T7; Yes) , the
CPU 11 makes thedisplay 3 display the scale values in the scale positions with the scale values displayed in alternately different colors. (Step T8). Accordingly, even when the interval between the scale values is small and the scale values look too close to each other, each scale value can be made identifiable. In addition, the predetermined value is not limited to a dot pitch but may be a value computed based on scale intervals, or a font, a point or a display digit of scale values in the determination in Step T7 described above. - Next, the
CPU 11 determines whether the scale values mutually overlap when the scale values are displayed in each of the scale positions of the Y axis (Step T9). - When determining that the scale values in each of the scale positions on the Y axis mutually overlap in Step T9 (Step T9; Yes), the
CPU 11 makes thedisplay 3 display only the scale values of the scales at both ends (maximum value and minimum value) among the scales to be displayed on the Y axis (Step T10), and then, moves on to Step T21 described below. In addition, in the present embodiment, theCPU 11 makes thedisplay 3 display only the scale values of the scales at both ends among the scale values to be displayed on the Y axis which can be displayed in the display area of thedisplay 3 in Step T10. However, theCPU 11 may always make thedisplay 3 display the scale values of the scales at both ends in the display area. - Further, when determining that the scale values in each of the scale positions on the Y axis do not mutually overlap in Step T9 (Step T9; No), the
CPU 11 makes thedisplay 3 display the scale values in each of the scale positions on the Y axis (Step T11). In addition, although theCPU 11 makes thedisplay 3 display only the scale values which can be displayed in the display area of thedisplay 3 among the scale values to be displayed in each of the scale positions on the Y axis in Step T11 in the present embodiment, theCPU 11 may always make thedisplay 3 display the scale values of all the scales. - Next, the
CPU 11 determines whether a setting for "Label" is set to "on" (Step T21). When determining that the setting for "Label" is not set to "on" (Step T21; No), the CPU 11moves on to Step T23 described below. - Further, when determining that the setting for "Label" is set to "on" in Step T21 (Step T21; Yes), the
CPU 11 makes thedisplay 3 display the names of the coordinate axes of X and Y and the origin position "0" in the coordinate system of the display 3 (Step T22). - Next, the
CPU 11 determines whether a setting for "Grid" is set to "on" (Step T23). When determining that the setting for "Grid" is not set to "on" (Step T23; No), theCPU 11 finishes the coordinate system displaying processing. - Further, when determining that the setting for "Grid" is set to "on" in Step T23 (Step T23; Yes), the
CPU 11 determines whether the intervals of the grid to be displayed are equal to or less than a predetermined values (Step T31) . In the present embodiment, theCPU 11 determines whether the grid interval is equal to or less than 25 dots in the X-axis direction, and is equal to or less than 13 dots in the Y-axis direction in Step T31. When this condition is satisfied, the grid intervals are too small, and display contents are too cramped. - When determining that the grid intervals are equal to or less than the predetermine values in Step T31 (Step T31; Yes), the
CPU 11 finishes the coordinate system displaying processing without commanding a grid to be displayed. - Further, when determining that the grid intervals are not equal to less than the predetermined values in Step T31 (Step T31; No), the
CPU 11 determines whether the setting for "Grid" is set to "line" (Step T32). - When determining that the setting for "Grid" is set to "line" in Step T32 (Step T32; Yes), the
CPU 11 makes thedisplay 3 display grid lines (Step T33), and then, finishes the coordinate system displaying processing. - Further, when determining that the setting for "Grid" is not set to "line" in Step T32 (Step T32; No), the
CPU 11 makes thedisplay 3 display grid points (Step T34) , and then, finishes the coordinate system displaying processing. - When the above coordinate system displaying processing is finished, the
CPU 11 makes thedisplay 3 display the graph of the graph formula input in above Step S5 in the X-Y coordinate system (Step S9), and then, determines whether a zoom-in operation is performed (Step S11), as illustrated inFIG. 3 . - When determining that the zoom-in operation is performed in Step S11 (Step S11; Yes), the
CPU 11 changes the display range (maximum and minimum coordinate values of X and Y; Xmin, Xmax, Ymin, and Ymax) of the X-Y coordinate system in the view window information to enlarge display contents at the magnification set according to the zoom-in operation (Step S12), and then, moves on to above Step S8. - Further, when determining that the zoom-in operation is not performed in Step S11 (Step S11; No) , the
CPU 11 determines whether a zoom-out operation is performed (Step S13). - When determining that the zoom-out operation is performed in Step S13 (Step S13; Yes) , the
CPU 11 changes the display range (maximum and minimum coordinate values of X and Y; Xmin, Xmax, Ymin, and Ymax) of the X-Y coordinate system in the view window information to reduce display contents at the magnification set according to the zoom-out operation (Step S14) , and then, moves on to above Step S8. - Further, when determining that the zoom-out operation is not performed in Step S13 (Step S13; No) , the
CPU 11 determines whether a set-up operation is performed (Step S15). - When determining that the set-up operation is performed in Step S15 (Step S15; Yes), the
CPU 11 moves on to above Step S7. - Further, when determining that the set-up operation is not performed in Step S15 (Step S15 ; No), the
CPU 11 determines whether an operation of setting the view window information is performed (Step S16). - When determining that the operation of setting the view window information is performed in Step S16 (Step S16; Yes), the
CPU 11 moves on to above Step S6. - Further, when determining that the operation of setting the view window information is not performed in Step S16 (Step S16; No), the
CPU 11 determines whether an operation of inputting a graph formula is performed (Step S17). When determining that the operation of inputting a graph formula is not performed (Step S17; No), theCPU 11 moves on to another processing. On the other hand, when determining that the operation of inputting a graph formula is performed (Step S17; Yes), theCPU 11 moves on to above Step S5. - Next, the operation of the above scientific
electronic calculator 1 will be described in detail with reference to the accompanying drawing. - First, as illustrated in
FIG. 5A , a user inputs the graph formula "Y = 1/2X" (Step S5) without performing the operation of importing the image files 132 into the display screen (Step S1; No). Then, the user sets the view window information by setting the numerical value width to "-450 to 450" and the scale interval to "100" on the X axis and the numerical value width to "-500 to 500" and the scale interval to "100" on the Y axis (Step S6) . After that, the user sets up the X-Y coordinate system by setting "Axes" to "scale", "Label" to "on" and "Grid" to "off" (Step S7). - As a result, it is determined that the setting for "Axes" is not set to "off" (Step T1; No) , and the X and Y axes are drawn in the display area of the
display 3 according to the set numerical value widths "X axis : -450 to 450" and "Y axis: -500 to 500" and the scale marks are drawn on the coordinate axes at the set scale interval "X and Y axes: 100" (Step T2), as illustrated inFIG. 5B . Further, it is determined that the setting for "Axes" is set to "scale" (Step T3; Yes) and it is determined that, when the scale values are displayed in each of the scale positions on the X axis, the scale values do not mutually overlap (Step T4; No), and the scale values are displayed in each of the scale positions on the X axis (Step T6) . Further, it is determined that the interval between the scale values in the scale positions on the X axis is not equal to or less than a predetermined value (Step T7; No) and it is determined that, when the scale values are displayed in each of the scale positions on the Y axis, the scale values do not mutually overlap (Step T9; No), and the scale values are displayed in each of the scale positions on the Y axis (Step T11) . Then, it is determined that the setting for "Label" is set to "on" (Step T21; Yes), and the names of the coordinate axes of X and Y and the origin position "0" are displayed in the coordinate system (Step T22) . Then, the graph of the graph formula "Y = 1/2X" is displayed in the X-Y coordinate system (Step S9). - Next, after performing the operation of setting the view window information (Step S16; Yes) , the user sets again the view window information by setting the numerical value width to "-450 to 450" and the scale interval to "50" on the X coordinate and the numerical value width to "-500 to 500" and the scale interval to "50" on the Y coordinate (Step S6) , as illustrated in
FIG. 5C , and sets up the X-Y coordinate system in a similar way to the above (Step S7). Then, as illustrated inFIG. 5D , it is determined that the setting for "Axes" is not set to "off" (Step T1 ; No), and the X and Y axes are drawn in the display area of thedisplay 3 according to the set numerical value widths "X axis: -450 to 450" and "Y axis: -500 to 500" and the scale marks are drawn on the coordinate axes at the set scale interval "X and Y axes: 50" (Step T2). Further, it is determined that the setting for "Axes" is set to "scale" (Step T3; Yes) and it is determined that, when the scale values are displayed in each of the scale positions on the X axis, the scale values mutually overlap (Step T4; Yes) , and only the scale values of the scale values at both ends (maximum value "400" and minimum value "-400") , among the scales to be displayed on the X axis which can be displayed in the display area, are displayed(Step T5) . Further, it is determined that, when the scale values are displayed in each of the scale positions on the Y axis, the scale values mutually overlap (Step T9; Yes), and only the scale values of the scale values at both ends (maximum value "450" and minimum value "-450") , among the scales to be displayed on the Y axis which can be displayed in the display area, are displayed (Step T10) . Then, it is determined that the setting for "Label" is set to "on" (Step T21; Yes), and the names of the coordinate axes of X and Y and the origin position "0" are displayed in the coordinate system (Step T22) . Then, the graph of the graph formula "Y = 1/2X" is displayed on the X-Y coordinate system (Step S9). - Further, when the user sets again the view window information, from the state where the contents of above
FIG. 5B are displayed, by setting the numerical value width to "-300 to 300" and the scale interval to "100" on the X coordinate and the numerical value width to "-300 to 300" and the scale interval to "100" on the Y coordinate (Step S6) as illustrated inFIG. 6A , and sets up the X-Y coordinate system in a similar way to the above (Step S7) , it is determined that the setting for "Axes" is not set to "off" (Step T1 ; No) , and the X and Y axes are drawn in the display area of thedisplay 3 according to the set numerical value widths "X and Y axes: -300 to 300" and the scale marks are drawn on the coordinate axes at the set scale intervals "X and Y axes: 100" (Step T2), as illustrated inFIG. 6B . Further, it is determined that the setting for "Axes" is set to "scale" (Step T3; Yes) and it is determined that, when the scale values are displayed in each of the scale positions on the X axis, the scale values do not mutually overlap (Step T4; No), and the scale values are displayed in each of the scale positions on the X axis (Step T6). Further, it is determined that the interval between scale values in scale positions on the X axis is not equal to or less than the predetermined value (Step T7; No) and it is determined that, when the scale values are displayed in each of the scale positions on the Y axis, the scale values do not mutually overlap (Step T9; No) , and the scale values are displayed in each of the scale positions on the Y axis (Step T11). Then, it is determined that the setting for "Label" is set to "on" (Step T21; Yes), and the names of the coordinate axes of X and Y and the origin position "0" are displayed in the coordinate system (Step T22). Then, the graph of the graph formula "Y - 1/2X" is displayed in the X-Y coordinate system (Step S9). - Next, when the user performs the zoom-out operation (Step S13; Yes), the display range (maximum and minimum coordinate values of X and Y; Xmin, Xmax, Ymin, and Ymax) of the X-Y coordinate system in the view window information is changed to reduce display contents at the magnification (in this embodiment, 1/2-fold magnification) set according to the zoom-out operation (Step S14) , it is determined that the setting for "Axes" is not set to "off" (Step T1; No), and the X and Y axes are drawn in the display area of the
display 3 according to the numerical value widths "X and Y axes: -600 to 600" set by the zoom-out operation and the scale marks are drawn on the coordinate axes at the set scale interval "X and Y axes: 100" (Step T2) , as illustrated inFIG. 6C . Further, it is determined that the setting for "Axes" is set to "scale" (Step T3; Yes) and it is determined that, when the scale values are displayed in each of the scale positions on the X axis, the scale values do not mutually overlap (Step T4; Yes) , and only the scale values of the scales at both ends (maximum value "500" and minimum value "-500"), among the scales to be displayed on the X axis which can be displayed in the display area, are displayed (Step T5) . Further, it is determined that, when the scale values are displayed in each of the scale positions on the Y axis, the scale values do not mutually overlap (Step T9; No), and the scale values are displayed in each of the scale positions on the Y axis (Step T11). Then, it is determined that the setting for "Label" is set to "on" (Step T21; Yes), and the names of the coordinate axes of X and Y and the origin position "0" are displayed in the coordinate system (Step T22) . Then, the graph of the graph formula "Y = 1/2X" is displayed in the X-Y coordinate system (Step S9) . In addition, the view window information at this time is as illustrated inFIG. 6D . - Next, in a similar way to the above, when the user performs the zoom-out operation (Step S13; Yes), the display range (maximum and minimum coordinate values of X and Y; Xmin, Xmax, Ymin, and Ymax) of the X-Y coordinate system in the view window information is changed to reduce display contents at the magnification (in this embodiment, 1/2-fold magnification) set according to the zoom-operation (Step S14). Then, it is determined that the setting for "Axes" is not set to "off" (Step T1; No) , and the X and Y axes are drawn in the display area of the
display 3 according to the numerical value widths "X and Y axes: -1200 to 1200" set by the zoom-out operation and the scale marks are drawn on the coordinate axes at the set scale interval "X and Y axes: 100" (Step T2) , as illustrated inFIG. 6E . Further, it is determined that the setting for "Axes" is set to "scale" (Step T3; Yes) and it is determined that, when the scale values are displayed in each of the scale positions on the x axis, the scale values mutually overlap (Step T4; Yes) , and only the scale values of the scales at both ends(maximum value "1100" and minimum value "-1100") , among the scales to be displayed on the X axis which can be displayed in the display area, are displayed (Step T5) . Further, it is determined that, when the scale values are displayed in each of the scale positions on the Y axis, the scale values do not mutually overlap (Step T9; Yes), and only the scale values of the scales at both ends (maximum value "1200" and minimum value "-1200") , among the scales to be displayed on the Y axis which can be displayed in the display area, are displayed(Step T10) . Then, it is determined that the setting for "Label" is set to "on" (Step T21; Yes) , and the names of the coordinate axes of X and Y and the origin position "0" are displayed in the coordinate system (Step T22) . Then, the graph of the graph formula "Y = 1/2X" is displayed in the X-Y coordinate system (Step S9). - First, as illustrated in
FIG. 7A , the user performs the operation of importing the image files 132 into the display screen of the display 3 (Step S1; Yes), and selects one of the image files 132 named "FOUNTAIN.g3p" in the image file group 131 (Step S2). - Next, as illustrated in
FIG. 7B , the additional data (numerical value widths and scale intervals of X and Y axes) added to the selectedimage file 132 is set as the view window information (Step S3) , and the image of the selected image file 132 (in this embodiment, the image of a fountain shot from the side) is displayed on thedisplay 3 as a background of the coordinate system (Step S4). In addition, in the additional data in thisimage file 132, the numerical value width is "-18.9 to 18.9" and the scale interval is "1" on the X coordinate, and the numerical value width is "-9.3 to 9.3" and the scale interval is "1" on the Y coordinate, as illustrated inFIG. 7C . - Next, as illustrated in
FIG. 7D andFIG. 8A , a user inputs the graph formula "Y = -0.4(X - 6)2 + 6" (Step S5), and sets up the X-Y coordinate system by setting "Axes" to "scale", "Label" to "on" and "Grid" to "line" (Step S7). - As a result, it is determined that the setting for "Axes" is not set to "off" (Step T1; No) , and the X and Y axes are drawn in the display area of the
display 3 according to the set numerical value widths "X axis: -18.9 to 18.9" and "Y axis: -9.3 to 9.3" and the scale marks are drawn on the coordinate axes at the set scale intervals "X and Y axes: 1" (Step T2), as illustrated inFIG. 8B . Further, it is determined that the setting for "Axes" is set to "scale" (Step T3; Yes) and it is determined that, when the scale values are displayed in each of the scale positions on the X axis, the scale values mutually overlap (Step T4; Yes) , and only the scale values of the scales at both ends (maximum value "18" and minimum value " -18") , among the scales to be displayed on the X axis which can be displayed in the display area, are displayed(Step T5). Further, it is determined that, when the scale values are displayed in each of the scale positions on the Y axis, the scale values mutually overlap (Step T9; Yes), and only the scale values of the scales at both ends (maximum value "9" and minimum value "-9") ,among the scales to be displayed on the Y axis which can be displayed in the display area, are displayed(Step T10). Then, it is determined that the setting for "Label" is set to "on" (Step T21; Yes) and the names of the coordinate axes of X and Y and the origin position "0" are displayed in the coordinate system (Step T22) . Then, it is determined that the setting for "Grid" is set to "on" (Step T23; Yes) and it is determined that the interval of the grid to be displayed is equal to or less than a predetermined value (the grid interval is equal to or less than 25 dots in the X-axis direction and is equal to or less than 13 dots in the Y-axis direction) (Step T31; Yes). Then, the graph of the graph formula "Y = -0.4 (X - 6) 2 + 6" is displayed in the X-Y coordinate system without the grid being displayed (Step S9). - Next, when the user performs the zoom-in operation (Step S11; Yes), the display range (maximum and minimum coordinate values of X and Y; Xmin, Xmax, Ymin, and Ymax) of the X-Y coordinate system in view window information is changed to enlarge display contents at the magnification (in this embodiment 2-fold magnifications) set according to the zoom-in operation (Step S12). Then, it is determined that the setting for "Axes" is not set to "off" (Step T1; No), and the X and Y axes are drawn in the display area of the
display 3 according to the numerical value widths "X axis: -9.45 to 9.45" and "Y axis: -4.65 to 4.65" set by the zoom-in operation and the scale marks are drawn on the coordinate axes at the set scale intervals "X and Y axes: 1" (Step T2), as illustrated inFIG. 8C . Further, it is determined that the setting for "Axes" is set to "scale" (Step T3; Yes) and it is determined that, when the scale values are displayed in each of the scale positions on the X axis, the scale values do not mutually overlap (Step T4; No) , and the scale values are displayed in each of the scale positions on the X axis (Step T6). Further, it is determined that the interval between the scale values in the scale positions on the X axis is not equal to or less than the predetermined value (Step T7; No) and it is determined that, when the scale values are displayed in each of the scale positions on the Y axis, the scale values do not mutually overlap (Step T9; No), and the scale values are displayed in each of the scale positions on the Y axis (Step T11). Then, it is determined that the setting for "Label" is set to "on" (Step T21; Yes) and the names of the coordinate axes of X and Y and the origin position "0" are displayed in the coordinate system (Step T22). Then, it is determined that the setting for "Grid" is set to "on" (Step T23; Yes), the grid interval is not equal to or less than a predetermined value (Step T31; No) and that the setting for "Grid" is set to "line" (Step T32; Yes) , and the grid lines are displayed (Step T33). Then, the graph of the graph formula "Y = -0.4(X - 6)2 + 6" is displayed in the X-Y coordinate system (Step S9). - First, the user inputs the graph formula "Y = 1/2X" (Step S5), without performing the operation of importing the
image file 132 into the display screen (step S1; No) , sets view window information by setting the numerical the value width to "-0/3 to 0.3" and the scale value to "0.1" on the X coordinate and the numerical value to "-0.2 to 0.2" and the scale interval to "0.1" on the Y coordinate (Step S6), and then, sets up the X-Y coordinate system by setting "Axes" to "scale", "Label" to "off" and "Grid" to "off" (Step S7) . Then, it is determined that the setting for "Axes" is not set to "off" (Step T1; No), and the X and Y axes are drawn in the display area of thedisplay 3 according to the set numerical value widths "X axis: -0.3 to 0.3" and "Y axis: -0.2 to 0.2" and the scale marks are drawn on the coordinate axes at the set scale intervals "X and Y axes: 0.1" (Step T2) ,as illustrated inFIG. 9A . Further, it is determined that the setting for "Axes" is set to "scale" (Step T3; Yes) and it is determined that, when the scale values are displayed in each of the scale positions on the X axis, the scale values do not mutually overlap (Step T4; No), and the scale values are displayed in each of the scale positions on the X axis (Step T6) . Furthermore, it is determined that the interval between the scale values in the scale positions on the X axis is not equal to or less than the predetermined value (Step T7; No) and it is determined that, when the scale values are displayed in each of the scale positions on the Y axis, the scale values do not mutually overlap (Step T9; No), and the scale values are displayed in each of the scale positions on the Y axis (Step T11) . Then, the graph of the graph formula "Y = 1/2X" is displayed in the X-Y coordinate system (Step S9). - Next, when the user performs the zoom-out operation (Step S13; Yes), the display range (maximum and minimum coordinate values of X and Y; Xmin, Xmax, Ymin, and Ymax) of the X-Y coordinate system in view window information is changed to reduce display contents at the magnification (in this embodiment, 1/2-fold magnification) set according to the zoom-out operation (Step S14) . Then, it is determined that the setting for "Axes" is not set to "off" (Step T1; No), and the X and Y axes are drawn in the display area of the
display 3 according to the numerical value widths "X axis: -0.6 to 0.6" and "Y axis: -0.4 to 0.4" set by the zoom-out operation and the scale marks are drawn on the coordinate axes at the set scale interval "X and Y axes: 0.1" (Step T2), as illustrated inFIG. 9B . Further, it is determined that the setting for "Axes" is set to "scale" (Step T3; Yes) and it is determined that, when the scale values are displayed in each of the scale positions on the X axis, the scale values do not mutually overlap (Step T4; No) , and the scale values are displayed in each of the scale positions on the X axis (Step T6). Furthermore, it is determined that the interval between the scale values in the scale positions on the X axis is equal to or less than a predetermined value (in this embodiment, equal to or less than a dot pitch) (Step T7; Yes), and the scale values in the scale positions are displayed in alternately different display colors (Step T8). In addition, inFIG. 9B , the areas enclosed by broken lines in the display screen of thedisplay 3 show that the texts in the areas are displayed in blue color. - Then, it is determined that, when the scale values are displayed in each of the scale positions on the Y axis, the scale values do not mutually overlap (Step T9; No), and the scale values are displayed in each of the scale positions on the Y axis (Step T11) . Then, the graph of the graph formula "Y = 1/2X" is displayed in the X-Y coordinate system (Step S9).
- As described above, according to the present embodiment, as illustrated in, for example, Step S6 of
FIG. 3 , Steps T4 to T11 ofFIG. 4 , andFIGS. 5A to 9C , a display range to be displayed of the coordinate system and scale intervals on the coordinate axes in the coordinate system are set based on the user operation, and overlapping of the scale values to be displayed on the coordinate axes is detected. When the scale values overlap, only the scale values of scales at both ends among the scales to be displayed on the coordinate axes are displayed. Therefore, it is possible to display the range to be displayed of the graph while preventing the graph from looking cramped, and preventing the scale intervals from being changed. - Further, as illustrated in, for example, Steps S8 and S11 to S14 in
FIG. 3 andFIGS. 6A to 6E , when display contents are subjected to either zooming-in or zooming-out, overlapping of scale values to be displayed on the coordinate axes is detected. Therefore, even when the scale values overlap due to the zooming-in or zooming-out operation, it is possible to display a range to be displayed of the graph while preventing the graph from looking cramped, and preventing the scale intervals from being changed. - In addition, the detailed configuration and detailed operation of each component of the scientific
electronic calculator 1 according to the above embodiment can be naturally changed adequately within the range which does not deviate from the gist of the present invention. - For example, although the graph display apparatus according to the present invention has been described as the scientific
electronic calculator 1, the apparatus to which the present invention is applicable is by no means limited to such a product but the present invention is generally applicable to the electronic devices such as mobile telephones, personal computers, PDAs (Personal Digital Assistant) , and game machines. Further, thegraph function program 130 according to the present invention may be stored in, for example, a memory card or a CD which is removable from the scientificelectronic calculator 1. - Further, although the processing of Step S1 has been described on the assumption that the image files 132 in the storing
unit 13 are imported into the display screen, theimage file 132 may be imported into the display screen from an external device through theinterface 16. - Furthermore, although the processing of Step T8 has been described on the assumption that, when the interval between scale values in scale positions on the x axis is equal to or less than a predetermined value (equal to or less than a dot pitch), the scale values in the scale positions are displayed in alternately different display colors, the same processing may be applied to scale values in scale positions on the Y axis. Still further, as illustrated in
FIG. 9C , the scale values can also be displayed so that the scale values are disposed at both sides of the coordinate axes alternately, in the processing of Step T8. - Moreover, although the vertical axis and the horizontal axis of the coordinate system have been described as the Y axis and the X axis respectively, other names of the coordinate axes may be given. Further, although the coordinate system has been described as an orthogonal coordinate system, other types of coordinate systems such as an oblique coordinate system or polar coordinate system may be used.
- Further, although the processing of Step S5 has been described on the assumption that the user inputs a graph formula through the input
key group 2, the user may input a graph formula through thetouch panel 30.
Claims (8)
- A graph display apparatus comprising:a display unit;a graph formula input unit for receiving input of a graph formula based on a user operation;a coordinate system setting unit for setting a display range of a coordinate system and a scale interval on a coordinate axis in the coordinate system based on the user operation;a coordinate system display controlling unit for making the display unit display the coordinate axis in the coordinate system in the display range set by the coordinate system setting unit and display scales and scale values at the scale interval set by the coordinate system setting unit on the coordinate axis, the coordinate system display controlling unit including a scale value display controlling unit for detecting overlapping of the scale values to be displayed on the coordinate axis, and, when the scale values overlap, making the display unit display only scale values of scales at both ends among the scales to be displayed on the coordinate axis; anda graph display controlling unit for making the display unit display a graph of the graph formula in the set display range of the coordinate system.
- The graph display apparatus according to claim 1, wherein
the coordinate system setting unit sets the scale interval for each of the coordinate axes in the coordinate system based on the user operation,
the coordinate system display controlling unit makes the display unit display the scales and the scale values at the scale interval set by the coordinate system setting unit for each of the coordinate axes in the coordinate system, and
the scale value display controlling unit detects the overlapping of the scale values to be displayed for each of the coordinate axes, and, when the scale values on any one of the coordinate axes overlap, makes the display unit display only the scale values of the scales at both ends among the scales to be displayed on the coordinate axis. - The graph display apparatus according to either claim 1 or 2, further comprising a display range zooming in/out unit for changing the display range of the coordinate system set by the coordinate system setting unit according to one of a zooming-in operation and a zooming-out operation by the user, wherein
the scale value display controlling unit detects the overlapping of the scale values to be displayed on the coordinate axis when the display range zooming in/out unit changes the display range of the coordinate system ,
the scale value display controlling unit makes the display unit display only the scale values of the scales at both ends among the scales to be displayed on the coordinate axis when the scale values overlap, and
the scale value display controlling unit makes the display unit display the scale values of each of the scales to be displayed on the coordinate axis when the scale values do not overlap. - The graph display apparatus according to any one of claims 1 to 3, wherein
the coordinate system setting unit includes an axis name display setting unit for setting whether to display a coordinate axis name of the coordinate axis and an origin symbol indicating an origin position, based on the user operation,
the coordinate system display controlling unit makes the display unit hide the coordinate axis name and the origin symbol when the axis name display setting unit performs a setting so that the coordinate axis name and the origin symbol are to be hidden, and
the coordinate system display controlling unit makes the display unit display the coordinate axis name and the origin symbol when the axis name display setting unit performs a setting so that the coordinate axis name and the origin symbol are to be displayed. - The graph display apparatus according to any one of claims 1 to 4, wherein
the coordinate system setting unit includes a grid display setting unit for setting whether to display a grid in the coordinate system, based on the user operation,
the coordinate system display controlling unit makes the display unit hide the grid when the grid display setting unit performs a setting so that the grid is to be hidden, and
the coordinate system display controlling unit makes the display unit display the grid when the grid display setting unit performs a setting so that the grid is to be displayed. - The graph display apparatus according to any one of claims 1 to 5, further comprising:an image data storing unit for storing at least one piece of image data;an image data selecting unit for selecting any one piece of image data in the image data storing unit, as selected image data, based on the user operation; andan image data display controlling unit for making the display unit display an image of the selected image data as a background of the coordinate system, whereinadditional data is added to the image data, the additional data showing the display range of the coordinate system to be displayed with the coordinate system overlaid on the image of the image data, and the scale interval on the coordinate axis, andthe coordinate system setting unit sets the display range and the scale interval according to the additional data, based on the user operation.
- A recording medium having recorded therein a program to cause a computer having a display unit to realize:a graph formula input function for receiving input of a graph formula based on a user operation;a coordinate system setting function for setting a display range of a coordinate system and a scale interval on a coordinate axis in the coordinate system based on the user operation;a coordinate system display controlling function for making the display unit display the coordinate axis in the coordinate system in the display range set by the coordinate system setting function and display scales and scale values at the scale interval set by the coordinate system setting function on the coordinate axis, the coordinate system display controlling function including a scale value display controlling function for detecting overlapping of the scale values to be displayed on the coordinate axis, and, when the scale values overlap, making the display unit display only scale values of scales at both ends among the scales to be displayed on the coordinate axis; anda graph display controlling function for making the display unit display a graph of the graph formula in the set display range of the coordinate system.
- A graph display method in a display apparatus including a display unit and an input unit, the graph display method comprising the steps of:(a) setting a display range of a coordinate system and a scale interval on a coordinate axis in the coordinate system based on a user operation on the input unit;(b) making the display unit display the coordinate axis in the coordinate system in the display range set by step (a) and display scales and scale values at the scale interval set by step (a) on the coordinate axis, step (b) including (b1) detecting overlapping of the scale values to be displayed on the coordinate axis, and, when the scale values overlap, making the display unit display only scale values of scales at both ends among the scales to be displayed on the coordinate axis; and(c) making the display unit display a graph of a graph formula in the set display range of the coordinate system.
Applications Claiming Priority (1)
| Application Number | Priority Date | Filing Date | Title |
|---|---|---|---|
| JP2010063527A JP4849179B2 (en) | 2010-03-19 | 2010-03-19 | Graph display device and program |
Publications (2)
| Publication Number | Publication Date |
|---|---|
| EP2367116A2 true EP2367116A2 (en) | 2011-09-21 |
| EP2367116A3 EP2367116A3 (en) | 2018-01-24 |
Family
ID=44170411
Family Applications (1)
| Application Number | Title | Priority Date | Filing Date |
|---|---|---|---|
| EP11157248.3A Ceased EP2367116A3 (en) | 2010-03-19 | 2011-03-08 | Graph display apparatus, recording medium on which program is recorded and graph display method |
Country Status (5)
| Country | Link |
|---|---|
| US (1) | US8817027B2 (en) |
| EP (1) | EP2367116A3 (en) |
| JP (1) | JP4849179B2 (en) |
| CN (1) | CN102193895B (en) |
| AU (1) | AU2011200911B2 (en) |
Cited By (1)
| Publication number | Priority date | Publication date | Assignee | Title |
|---|---|---|---|---|
| CN115543518A (en) * | 2022-10-21 | 2022-12-30 | 北京世冠金洋科技发展有限公司 | Image coordinate display method, device and equipment and readable storage medium |
Families Citing this family (14)
| Publication number | Priority date | Publication date | Assignee | Title |
|---|---|---|---|---|
| US9035972B2 (en) * | 2012-04-13 | 2015-05-19 | Sap Se | Intelligent axis labels |
| EP2951665B1 (en) * | 2013-01-31 | 2018-11-21 | Hewlett-Packard Development Company, L.P. | Electronic device with touch gesture adjustment of a graphical representation |
| JP6221323B2 (en) * | 2013-04-22 | 2017-11-01 | カシオ計算機株式会社 | Graph display device and control program thereof |
| JP6221372B2 (en) * | 2013-06-11 | 2017-11-01 | カシオ計算機株式会社 | Graph display device, program, and server device |
| JP6244901B2 (en) | 2013-12-27 | 2017-12-13 | カシオ計算機株式会社 | Graph display control device, electronic device, and program |
| JP6318615B2 (en) | 2013-12-27 | 2018-05-09 | カシオ計算機株式会社 | Graph display control device, electronic device, and program |
| JP6287412B2 (en) | 2014-03-19 | 2018-03-07 | カシオ計算機株式会社 | Graphic drawing apparatus, graphic drawing method and program |
| JP6394163B2 (en) | 2014-08-07 | 2018-09-26 | カシオ計算機株式会社 | Graph display device, graph display method and program |
| JP6428053B2 (en) * | 2014-08-26 | 2018-11-28 | カシオ計算機株式会社 | Graph display device, program, and server device |
| CN105574202A (en) * | 2016-01-06 | 2016-05-11 | 北京金控数据技术股份有限公司 | Real-time data multi-curve display method for operation facility |
| JP6992491B2 (en) * | 2017-12-22 | 2022-01-13 | カシオ計算機株式会社 | Display device, display method, and program |
| CN108198273A (en) * | 2017-12-29 | 2018-06-22 | 深圳市元征科技股份有限公司 | Data display method, terminal and computer-readable medium |
| JP7014024B2 (en) * | 2018-04-17 | 2022-02-01 | カシオ計算機株式会社 | Graph drawing method, graph drawing system, server device, graph drawing device and computer program |
| CN115954079A (en) * | 2022-12-21 | 2023-04-11 | 北京和兴创联健康科技有限公司 | ICU patient diagnosis and treatment data visualization display method based on data aggregation |
Family Cites Families (11)
| Publication number | Priority date | Publication date | Assignee | Title |
|---|---|---|---|---|
| JPS6265080A (en) | 1985-09-17 | 1987-03-24 | カシオ計算機株式会社 | Graph display system |
| JPH09282476A (en) * | 1996-04-17 | 1997-10-31 | Casio Comput Co Ltd | Device and method for graph display |
| JP3113225B2 (en) * | 1998-01-05 | 2000-11-27 | 株式会社ピーエフユー | Graph creation apparatus and graph creation method |
| JPH11272760A (en) * | 1998-03-26 | 1999-10-08 | Sharp Corp | Information processor |
| JPH11282931A (en) * | 1998-03-31 | 1999-10-15 | Ricoh Co Ltd | Graphing device |
| US7170519B2 (en) * | 2002-03-29 | 2007-01-30 | Sas Institute Inc. | Computer-implemented system and method for generating data graphical displays |
| US8224636B2 (en) * | 2002-12-17 | 2012-07-17 | Cadence Design Systems, Inc. | Method and system for implementing parallel execution in a computing system and in a circuit simulator |
| US8832562B2 (en) * | 2003-08-08 | 2014-09-09 | Hewlett-Packard Development Company, L.P. | Graphical calculator user interface for function drawing |
| US7292245B2 (en) * | 2004-01-20 | 2007-11-06 | Sensitron, Inc. | Method and apparatus for time series graph display |
| US7233333B2 (en) * | 2004-11-23 | 2007-06-19 | Buxco Electric, Inc. | Collapsible (folding) graph |
| JP2009294926A (en) * | 2008-06-05 | 2009-12-17 | Casio Comput Co Ltd | Electronic calculator |
-
2010
- 2010-03-19 JP JP2010063527A patent/JP4849179B2/en active Active
-
2011
- 2011-03-02 AU AU2011200911A patent/AU2011200911B2/en active Active
- 2011-03-02 US US13/038,552 patent/US8817027B2/en active Active
- 2011-03-08 EP EP11157248.3A patent/EP2367116A3/en not_active Ceased
- 2011-03-18 CN CN201110069185.8A patent/CN102193895B/en active Active
Non-Patent Citations (1)
| Title |
|---|
| None |
Cited By (2)
| Publication number | Priority date | Publication date | Assignee | Title |
|---|---|---|---|---|
| CN115543518A (en) * | 2022-10-21 | 2022-12-30 | 北京世冠金洋科技发展有限公司 | Image coordinate display method, device and equipment and readable storage medium |
| CN115543518B (en) * | 2022-10-21 | 2023-05-12 | 北京世冠金洋科技发展有限公司 | Image coordinate display method, device, equipment and readable storage medium |
Also Published As
| Publication number | Publication date |
|---|---|
| JP2011197984A (en) | 2011-10-06 |
| AU2011200911B2 (en) | 2012-11-29 |
| CN102193895B (en) | 2014-07-09 |
| AU2011200911A1 (en) | 2011-10-06 |
| CN102193895A (en) | 2011-09-21 |
| US8817027B2 (en) | 2014-08-26 |
| US20110227946A1 (en) | 2011-09-22 |
| JP4849179B2 (en) | 2012-01-11 |
| EP2367116A3 (en) | 2018-01-24 |
Similar Documents
| Publication | Publication Date | Title |
|---|---|---|
| EP2367116A2 (en) | Graph display apparatus, recording medium on which program is recorded and graph display method | |
| US8576230B2 (en) | Graph display apparatus, recording medium on which program is recorded, and graph display method | |
| EP1543405B1 (en) | Graphic display control device for displaying graphs | |
| EP2237230B1 (en) | Graph display control apparatus and graph display control method | |
| US9195430B2 (en) | Image display terminal, image display control method and recording medium recording image display control program | |
| US9870144B2 (en) | Graph display apparatus, graph display method and storage medium | |
| JP2959960B2 (en) | Information processing device with multiple graph display function | |
| JP5488058B2 (en) | Graph display device and program | |
| US8843537B2 (en) | Electronic calculator, display method, and recording medium for displaying mathematical expression in full color | |
| WO2014148358A1 (en) | Information terminal, operating region control method, and operating region control program | |
| JP2011210209A (en) | Information display device and program | |
| JP4876699B2 (en) | Display control apparatus and display control program | |
| JP5521668B2 (en) | Inequality display device and inequality display program | |
| JP5287588B2 (en) | Graphic display device and program | |
| JP6504128B2 (en) | Electronic device, data processing method and program | |
| JP5459015B2 (en) | Graph display device and program | |
| US9921999B2 (en) | Electronic device, display method at time of execution of verification with electronic device, and storage medium | |
| JP5692317B2 (en) | Calculation apparatus and calculation program | |
| JP3969301B2 (en) | Graph display control device and graph display control program | |
| JP5392343B2 (en) | Electronic device and program | |
| KR20080047018A (en) | Electronic device with variable displaying window for charactor inputting | |
| KR20150039511A (en) | Method and apparatus for providing a menu interface | |
| CN113311970A (en) | Content display method, device, equipment and readable storage medium | |
| JP2000035779A (en) | Graphic display controller and storage medium |
Legal Events
| Date | Code | Title | Description |
|---|---|---|---|
| PUAI | Public reference made under article 153(3) epc to a published international application that has entered the european phase |
Free format text: ORIGINAL CODE: 0009012 |
|
| 17P | Request for examination filed |
Effective date: 20110308 |
|
| AK | Designated contracting states |
Kind code of ref document: A2 Designated state(s): AL AT BE BG CH CY CZ DE DK EE ES FI FR GB GR HR HU IE IS IT LI LT LU LV MC MK MT NL NO PL PT RO RS SE SI SK SM TR |
|
| AX | Request for extension of the european patent |
Extension state: BA ME |
|
| PUAL | Search report despatched |
Free format text: ORIGINAL CODE: 0009013 |
|
| AK | Designated contracting states |
Kind code of ref document: A3 Designated state(s): AL AT BE BG CH CY CZ DE DK EE ES FI FR GB GR HR HU IE IS IT LI LT LU LV MC MK MT NL NO PL PT RO RS SE SI SK SM TR |
|
| AX | Request for extension of the european patent |
Extension state: BA ME |
|
| RIC1 | Information provided on ipc code assigned before grant |
Ipc: G06F 15/02 20060101AFI20171215BHEP |
|
| STAA | Information on the status of an ep patent application or granted ep patent |
Free format text: STATUS: EXAMINATION IS IN PROGRESS |
|
| 17Q | First examination report despatched |
Effective date: 20190821 |
|
| STAA | Information on the status of an ep patent application or granted ep patent |
Free format text: STATUS: EXAMINATION IS IN PROGRESS |
|
| STAA | Information on the status of an ep patent application or granted ep patent |
Free format text: STATUS: THE APPLICATION HAS BEEN REFUSED |
|
| 18R | Application refused |
Effective date: 20211015 |