EP2314211A1 - Biological parameter displaying apparatus - Google Patents
Biological parameter displaying apparatus Download PDFInfo
- Publication number
- EP2314211A1 EP2314211A1 EP10188548A EP10188548A EP2314211A1 EP 2314211 A1 EP2314211 A1 EP 2314211A1 EP 10188548 A EP10188548 A EP 10188548A EP 10188548 A EP10188548 A EP 10188548A EP 2314211 A1 EP2314211 A1 EP 2314211A1
- Authority
- EP
- European Patent Office
- Prior art keywords
- data
- plot
- biological parameter
- biological
- displaying apparatus
- Prior art date
- Legal status (The legal status is an assumption and is not a legal conclusion. Google has not performed a legal analysis and makes no representation as to the accuracy of the status listed.)
- Granted
Links
Images




Classifications
-
- A—HUMAN NECESSITIES
- A61—MEDICAL OR VETERINARY SCIENCE; HYGIENE
- A61B—DIAGNOSIS; SURGERY; IDENTIFICATION
- A61B5/00—Measuring for diagnostic purposes; Identification of persons
- A61B5/02—Detecting, measuring or recording for evaluating the cardiovascular system, e.g. pulse, heart rate, blood pressure or blood flow
- A61B5/0205—Simultaneously evaluating both cardiovascular conditions and different types of body conditions, e.g. heart and respiratory condition
-
- A—HUMAN NECESSITIES
- A61—MEDICAL OR VETERINARY SCIENCE; HYGIENE
- A61B—DIAGNOSIS; SURGERY; IDENTIFICATION
- A61B5/00—Measuring for diagnostic purposes; Identification of persons
- A61B5/41—Detecting, measuring or recording for evaluating the immune or lymphatic systems
- A61B5/412—Detecting or monitoring sepsis
-
- A—HUMAN NECESSITIES
- A61—MEDICAL OR VETERINARY SCIENCE; HYGIENE
- A61B—DIAGNOSIS; SURGERY; IDENTIFICATION
- A61B5/00—Measuring for diagnostic purposes; Identification of persons
- A61B5/74—Details of notification to user or communication with user or patient; User input means
- A61B5/742—Details of notification to user or communication with user or patient; User input means using visual displays
-
- A—HUMAN NECESSITIES
- A61—MEDICAL OR VETERINARY SCIENCE; HYGIENE
- A61B—DIAGNOSIS; SURGERY; IDENTIFICATION
- A61B5/00—Measuring for diagnostic purposes; Identification of persons
- A61B5/74—Details of notification to user or communication with user or patient; User input means
- A61B5/742—Details of notification to user or communication with user or patient; User input means using visual displays
- A61B5/7445—Display arrangements, e.g. multiple display units
-
- G—PHYSICS
- G16—INFORMATION AND COMMUNICATION TECHNOLOGY [ICT] SPECIALLY ADAPTED FOR SPECIFIC APPLICATION FIELDS
- G16H—HEALTHCARE INFORMATICS, i.e. INFORMATION AND COMMUNICATION TECHNOLOGY [ICT] SPECIALLY ADAPTED FOR THE HANDLING OR PROCESSING OF MEDICAL OR HEALTHCARE DATA
- G16H40/00—ICT specially adapted for the management or administration of healthcare resources or facilities; ICT specially adapted for the management or operation of medical equipment or devices
- G16H40/60—ICT specially adapted for the management or administration of healthcare resources or facilities; ICT specially adapted for the management or operation of medical equipment or devices for the operation of medical equipment or devices
- G16H40/63—ICT specially adapted for the management or administration of healthcare resources or facilities; ICT specially adapted for the management or operation of medical equipment or devices for the operation of medical equipment or devices for local operation
-
- A—HUMAN NECESSITIES
- A61—MEDICAL OR VETERINARY SCIENCE; HYGIENE
- A61B—DIAGNOSIS; SURGERY; IDENTIFICATION
- A61B5/00—Measuring for diagnostic purposes; Identification of persons
- A61B5/02—Detecting, measuring or recording for evaluating the cardiovascular system, e.g. pulse, heart rate, blood pressure or blood flow
- A61B5/021—Measuring pressure in heart or blood vessels
-
- A—HUMAN NECESSITIES
- A61—MEDICAL OR VETERINARY SCIENCE; HYGIENE
- A61B—DIAGNOSIS; SURGERY; IDENTIFICATION
- A61B5/00—Measuring for diagnostic purposes; Identification of persons
- A61B5/02—Detecting, measuring or recording for evaluating the cardiovascular system, e.g. pulse, heart rate, blood pressure or blood flow
- A61B5/026—Measuring blood flow
- A61B5/029—Measuring blood output from the heart, e.g. minute volume
Definitions
- the present invention relates to a biological parameter displaying apparatus which automatically plots data related to two biological parameters (particularly cardiovascular parameters such as the blood pressure and the cardiac output) of different kinds that are acquired from a living body at the same time or in the same time zone, in XY coordinates, and which can display the data in the form of a trend display so as to clarify the plotted time sequence.
- two biological parameters particularly cardiovascular parameters such as the blood pressure and the cardiac output
- cardiovascular parameters such as the blood pressure and the cardiac output
- a trend display is a display in which the ordinate shows the values of biological parameters, and the abscissa shows the time.
- temporal changes of biological parameters in the medium and long term can be easily known, thereby providing beneficial information to the a medical person.
- the cardiac index CI is set as the Y-axis (ordinate)
- the pulmonary artery wedge pressure PCWP is set as the X-axis (abscissa)
- data are plotted in XY coordinates as shown in Fig. 7 . From the drawn curve, a medical person can easily know the circulatory dynamics such as whether the cardiac function is normal, decreased, or enhanced.
- XY coordinates in which a cardiac function curve is displayed is divided into four events, and the events are classified as "I Normal”, “II Mild”, “III Low cardiac output”, and “IV Low cardiac output + pulmonary congestion", respectively.
- a medical person can easily know the circulatory dynamics such as a pathological condition due to cardiogenic shock.
- the abscissa is the time axis, and hence only temporal changes of parameters are known, so that the circulatory dynamics based on the linking of two different biological parameters cannot be known.
- a graph such as shown in Fig. 7 is usually produced by first independently measuring two different biological parameters, and then plotting the data to form the graph. It cannot be always said that such a graph is produced by plotting data of two different biological parameters having appropriate temporal relationships.
- the cardiac index CI and pulmonary artery wedge pressure PCWP shown in Fig. 7 are measured, an invasive technique in which a pulmonary artery catheter having a balloon at the tip end is inserted into the heart of the patient is employed.
- the cardiac index CI is a value which is acquired by performing division on the cardiac output CO.
- the thermodilution method or dye dillution method in which a medical person injects a predetermined solution into the patient in each measurement.
- the pulmonary artery wedge pressure PCWP is a blood pressure in the case where the balloon at the tip end of the pulmonary artery catheter is inflated. In order to acquire the pulmonary artery wedge pressure PCWP, therefore, a medical person must inflate the balloon in each measurement. Therefore, data of the ordinate and the abscissa which are acquired by operations conducted by a medical person cannot be continuously measured.
- a graph such as shown in Fig. 7 is applied as a trend display of, for example, the circulatory dynamics of a living body, particularly, plotting must be performed while further considering the temporal simultaneousness of two different biological parameters. Even if simultaneous measurements are performed and data can be plotted in coordinates, the display is shown in the form indicating the time sequence. Although a technique in which the time is directly written as in Fig. 7 may be considered, there is a problem in display such as that, when the number of data to be plotted is increased, the data are hardly readable.
- a biological parameter displaying apparatus comprising: a coordinate displaying unit which displays first coordinates in which a first biological parameter of a patient, which is measured by a first measuring unit, is set as an X-axis, and a second biological parameter of the patient, which is different in kind from the first biological parameter and which is measured by a second measuring unit, is set as a Y-axis; a plot data producing unit which produces first plot data, each of the first plot data being produced based on first measurement values of the first and second biological parameters which are measured at a same time or in a same time zone; and a plot displaying unit which plots the first plot data in the first coordinates.
- the first plot data may include at least two data including first data and second data, the first data may be subsequent to the second data, and the first data and the second data may be displayed at a time interval.
- the first data may be a latest data.
- the first measurement values of the first and second biological parameters may be representative values of the first and second biological parameters, which are acquired from groups of values of the first and second biological parameters measured at the same time or in the same time zone.
- the representative values may be one of median, mean, and mode values of the groups of the values of the first and second biological parameters measured at the same time or in the same time zone.
- the first plot data may be plotted in a manner showing a time sequence.
- the first plot data may include first, second and third data, and the second data is subsequent to the third data, and the first data is subsequent to the second data and is a latest data.
- a brightness of the first data may be highest, and a brightness of the second data may be identical to a brightness of the third data or a brightness of the second data may be higher than a brightness of the third data.
- the first plot data may include first, second and third data, and the second data is subsequent to the third data, and the first data is subsequent to the second data and is a latest data.
- a size of the first data may be largest, and a size of the second data may be identical to a size of the third data or a size of the second data may be larger than a size of the third data.
- the first plot data may include first and second data, and the first data is subsequent to the second data.
- a color of the first data may be different from a color of the second data.
- the first plot data may include first and second data, and the first data is subsequent to the second data.
- the first data and the second data may be connected to each other by an arrow or a line.
- the first data and the second data may not be connected to each other by the arrow or the line.
- the first plot data may include first and second data, and the first data is subsequent to the second data and is a latest data.
- a shape of the first data may be different from a shape of the second data.
- the first plot data may include first and second data, and the first data is subsequent to the second data and is a latest data. In the manner showing the time sequence, the first data may blink and the second data may not blink.
- the first plot data may include first and second data, and the first data is subsequent to the second data.
- the first data may be displayed on the second data.
- the biological parameter displaying apparatus may further include a determination criterion displaying unit which displays information indicating whether the first plot data are normal or abnormal as a state of the patient.
- the biological parameter displaying apparatus may further include a region displaying unit which displays a region showing whether the first plot data are adequate or critical as a state of the patient.
- the first biological parameter may be a cardiovascular parameter which is one of a first parameter indicating a cardiac output/cardiac function which can be continuously measured and a second parameter indicating a preload/afterload of a heart which can be continuously measured
- the second biological parameter may be a cardiovascular parameter which is the other of the first and second parameters.
- the patient may include a plurality of patients.
- the biological parameter displaying apparatus may further include a time selecting unit which selects a time.
- the first plot data corresponding to the selected time may be plotted.
- the coordinate displaying unit may display second coordinates in which a third biological parameter, which is measured by a third measuring unit, is set as an X-axis, and the second biological parameter is set as a Y-axis, the plot data producing unit may produce second plot data, each of the second plot data being produced based on second measurement values of the second and third biological parameters which are measured at a same time or in a same time zone, and the plot displaying unit may plot the second plot data in the second coordinates.
- the coordinate displaying unit may display second coordinates in which a third biological parameter, which is measured by a third measuring unit, is set as an X-axis, and a fourth biological parameter, which is measured by a fourth measuring unit, is set as a Y-axis, the plot data producing unit may produce second plot data, each of the second plot data being produced based on second measurement values of the third and fourth biological parameters which are measured at a same time or in a same time zone, and the plot displaying unit may plot the second plot data in the second coordinates.
- the biological parameter displaying apparatus includes a first measuring unit 11 and a second measuring unit 12.
- a blood pressure measuring unit which measures an invasive blood pressure such as the central venous pressure (CVP), the pulmonary arterial pressure (PAP), the pulmonary arterial wedge pressure (PCWP), the arterial pressure (ART), and the intracardiac pressure (RAP, RVP, LAP, LVP), a cardiac output measuring unit which measures the cardiac output CO indicating the amount of blood pumped out from the heart for one minute, or a measuring unit which can measure the preload and afterload of the heart, such as the CVP-ET or the PPV is preferable.
- the measuring units are not limited to these units, and may be any measuring unit as far as it can acquire a measurement value which is equivalent to or reflects a biological parameter.
- measuring units which can continuously measure the biological parameters are preferred.
- these biological parameters are often measured by an invasive technique.
- the biological parameters may be measured by a noninvasive technique.
- the first measuring unit 11 and the second measuring unit 12 are requested to be different measuring units.
- the preload means the amount of blood which maintains the ventricle and the lumen of a large blood vessel before the cardiac contraction (the end-diastole time).
- CVP-ET is a value which is acquired by measuring the central venous pressure (CVP) at the timing of the end-tidal, and used as an index of the preload of the right ventricle.
- CVP central venous pressure
- the details are disclosed in JP-A-2010-200901 .
- the term of PPV means the respiratory variation of the pulse pressure, and is the variation of the pulse pressure (the difference between the systolic blood pressure and the diastolic blood pressure) which is acquired by performing calculation on the pulse pressure, and used as an index of the preload of the right ventricle.
- the signals acquired in the above-described various sensors are processed, and then sent to a CPU 30.
- the CPU 30 includes a coordinate displaying unit 31, a plot data producing unit 32, a plot displaying unit 33, a determination criterion displaying unit 34, and a region displaying unit 35.
- An inputting unit 50 configured by a touch panel, a keyboard, and the like is connected to the CPU 30. Through the inputting unit 50, two kinds of biological parameters which are to be plotted and displayed in XY coordinates are selected from biological parameters which are measured by the measuring units. In the embodiment, the interval (time zone) between data can be selected from 1 m, 10 m, 30 m, 1 h, and 4 h. Through the inputting unit 50, it is possible also to select whether a trend display or a plot display in the XY coordinates is to be performed. It is a matter of course that the numbers are not limited to the above.
- the coordinate displaying unit 31 of the CPU 30 draws a graph using XY coordinates in which data which are measured by the first measuring unit 11, and which are related to a first biological parameter are set as the X-axis, and data which are measured by the second measuring unit 12, and which are related to a second biological parameter are set as the Y-axis, on a displaying unit 40.
- the plot data producing unit 32 produces plot data based on measurement values of the first biological parameter and the second biological parameter which are measured at the same time or in the same time zone by the first measuring unit 11 and the second measuring unit 12.
- the produced plot data are plotted in the XY coordinates by the plot displaying unit 33.
- the fact that the measurement values are measured at the same time or in the same time zone is detected based on the input times of the data in the case of real-time measurement.
- the CPU 30 acquires the measurement start times and the sampling intervals of the data, and the detection is performed based on these data.
- the plotting interval is an interval which is set through the inputting unit 50.
- the value of the plotting interval is displayed in a region W of a screen shown in Figs. 2 to 6 .
- the plotting may be performed in a manner showing the time sequence which will be described later.
- the term "at the same time” means the time relationship in the case where the plot data producing unit 32 produces plot data based on measurement values which are measured at the same time by the first measuring unit 11 and the second measuring unit 12, and includes the time relationship in the case where plot data are produced based on two measurement values which are not measured at the same time, but in which the measurement time by the first measuring unit 11 and that by the second measuring unit 12 are closest to each other, or latest measurement values which are measured by the respective measuring units.
- the plot displaying unit 33 performs plotting while biological parameters are measured in real time, it is preferable to perform the plotting base on two data which are measured by the first measuring unit 11 and the second measuring unit 12 at times that are closest to each other.
- the term "in the same time zone” means the time relationship in the case where representative values are acquired from groups of measurement values of the measured biological parameters in a predetermined time period immediately before the plotting, and the plot data producing unit 32 produces plot data based on the representative values.
- Examples of the representative value are the mode, mean, and median values of a measurement value group of each biological parameter.
- the plot data producing unit 32 produces plot data based on the representative values acquired from measurement values which are measured at the same time by the first measuring unit 11 and the second measuring unit 12.
- the term "the representative values acquired from measurement values which are measured at the same time by the first measuring unit 11 and the second measuring unit 12" means that, in the case where each of the measuring units samples measurement values at intervals of 1 second, for example, the mode, mean, or median value which is acquired from a group of 60 measurement values that are measured from 11 o'clock to 11 o'clock 1 minute is set as plot data of 11 o'clock.
- the term "in the same time zone” may mean the time relationship in the case where the plot data producing unit 32 produces plot data by using a mathematical technique such as the mode, mean, and median values of a measurement value group of biological parameters measured between the plotted intervals (above-described data intervals).
- a configuration where the brightness is changed by a predetermined gradation in the unit of the elapsed time of data, that where arrows or lines are used, that where the color is gradually changed, and that where the shape or size of a plot point is changed may be used singly or combinedly.
- an image may be produced so that several sequential plot points have an adequate size and overlapped with one another, or are not overlapped with one another but made close to one another, or plot points are connected to one another by arrows or lines.
- Figs. 9A to 9D Examples of the display manner are shown in Figs. 9A to 9D.
- Fig. 9A shows a display manner in which both ends of a line connecting plot points are contacted with the plot points, respectively.
- Fig. 9B shows a display manner in which both ends of a line connecting plot points are not contacted with the plot points.
- Figs. 9C and 9D show display manners in which one end of a line connecting plot points is contacted with one of the plot points.
- the plotted shape is made different from that of other plot points (for example, the latest plot point is triangular, and other plot points are circular).
- the latest plot point may blink.
- a newer plot point may be displayed in a more front face.
- the CPU 30 further includes the determination criterion displaying unit 34.
- the determination criterion displaying unit 34 displays information (for example, previously stored in accordance with two kinds of biological parameters which are to be plotted and displayed in the XY coordinates) indicating whether a plot point is normal or abnormal as the state of a living body, in the coordinates.
- Specific examples of the information are curves L1, L2 shown in Figs. 2 and 3 .
- the cardiac function traces the locus such as the curve L1
- the cardiac function traces the locus such as the curve L2.
- the determination criterion displaying unit 34 displays a plot point correspondingly with the change in a display manner in which, as shown in Fig. 4 , the time sequence is clearly shown in the XY coordinates in accordance with data of two kinds of biological parameters. Also in this case, the determination criterion displaying unit 34 may display information (for example, a line which is different from Fig. 3 ) indicating whether a plot point in the biological parameter of Fig. 4 is normal or abnormal as the state of a living body.
- the CPU 30 further includes the region displaying unit 35.
- the region displaying unit 35 displays a region (for example, previously stored in accordance with two kinds of biological parameters which are to be plotted and displayed in the XY coordinates) where a plot point in the coordinates is normal as the state of a living body, as shown in Fig. 5 so as to be clearly distinguished from another region.
- a region for example, previously stored in accordance with two kinds of biological parameters which are to be plotted and displayed in the XY coordinates
- a plot point in the coordinates is normal as the state of a living body, as shown in Fig. 5 so as to be clearly distinguished from another region.
- any display manner such as that in which the region is boxed, or that in which the color of a normal region is different from that of another region may be employed as far as a normal region is clearly known.
- the settings related to the determination criterion displaying unit 34 and the region displaying unit 35 may be freely set in consideration of the individual differences, the operation of the facility, and the like.
- a plot point of biological parameter data enters the range enclosed by a rectangular frame S in which the MAP is 65 mmHg or higher and the CVP-ET is from 8 mmHg to 12 mmHg
- various medical procedures or the like to be performed may be displayed.
- the EGDT Error Goal Direct Therapy
- the range is not limited to this.
- the region displaying unit 35 may divide the coordinate into a plurality of regions such as "Target zone", "Reduction of circulatory blood volume”, “Lowering of myocardial contractile function”, “Critical zone of pulmonary edema”, and “Cardiac tamponade”.
- “Target zone” which is normal as the state of a living body, and other particularly critical regions such as “Cardiac tamponade” and "Critical zone of pulmonary edema” may be displayed in different display manners.
- the critical regions are made distinguishable by right and left slanting hatchings, the regions may be displayed so as to be clearly distinguishable from other regions.
- An adequate manner such as that in which the region is boxed, or that in which the color of the region is different from that of other regions may be employed.
- the displaying unit 40 is configured by, for example, an LCD which displays information supplied from the coordinate displaying unit 31, plot displaying unit 33, determination criterion displaying unit 34, and region displaying unit 35 of the CPU 30.
- the biological parameter displaying apparatus of the invention may be used not only in a so-called bedside biological information monitoring apparatus but also in a station type biological information monitoring apparatus (central monitor) which receives and displays biological information of patients transmitted from a plurality of bedside biological information monitoring apparatuses.
- the biological information displaying apparatus plots information transmitted from the bedside biological information monitoring apparatuses, in coordinates, whereby the living body states of a plurality of patients can be simultaneously displayed.
- Fig. 10 shows an example of the display by the biological parameter displaying apparatus.
- a trend display is displayed, and, in the lower side, a plurality of coordinates are displayed by the plot displaying unit 33.
- a cursor C1 which is at the right end of the trend display of Fig. 10 is used for displaying values of biological parameters such as the ART and the PPV at the present time.
- the biological parameter displaying apparatus includes a time selecting unit through which the user can perform operations such as that a dedicated cursor C2 (in the vicinity of the middle of the trend display of Fig. 10 ) is set to data of the time of concern in the trend display of Fig. 10 , that (although not illustrated) trend data of the time of concern is clicked, and that the time of concern is directly input.
- the plot displaying unit 33 displays plot data corresponding to the time which is selected by the time selecting unit, in at least one of the first and second coordinates.
- the displayed plot data corresponding to the selected time may be one data or plural number of data.
- the coordinates in the lower side of Fig. 10 are examples of the first and second coordinates, and show that the plot data corresponding to the time which is selected by the time selecting unit can be replayed and displayed.
- the term "corresponding to the time which is selected” means that times in the neighborhood of the selected time.
- the user can freely perform the setting related to the range (time duration) of the neighborhood times.
- plot data based on biological data are plotted and displayed while the ordinate indicates the CCI and the abscissa indicates the PPV
- plot data based on biological data are plotted and displayed while the ordinate indicates the CCI and the abscissa indicates the CVP.
- the abscissas may indicate the same biological parameter
- the abscissas may indicate different biological parameters, respectively.
- the abscissa in the left coordinates of the lower side of Fig. 10 indicates the PPV.
- the PPV suitably reflects the response to infusion fluid administered to the patient, and hence can be used as an index for administration of infusion fluid.
- the abscissa in the right coordinates of the lower side of Fig. 10 indicates the CVP.
- the CVP can be used as an index for determining whether the amount of administered infusion fluid is adequate or not. Therefore, it is seen that, when a plurality of coordinates are displayed for one patient as shown in the lower side of Fig. 10 , the circulatory dynamics can be known more accurately, and infusion fluid management can be effectively known.
- the biological parameter displaying apparatus of the embodiment includes the configuration for performing such a display.
- data related to two different biological parameters that are measured at the same time or in the same time zone are automatically plotted in XY coordinates. Therefore, the apparatus is preferred in the case where the process (particularly, the circulatory dynamics) of the state of a living body is to be known easily and adequately.
- plot data are produced based on one of the median, mean, and mode values of the group of measurement values which are measured in the same time zone. Even when a sudden noise enters the measurement value, therefore, an influence on data to be plotted can be reduced or eliminated, and stable and accurate data are plotted.
- plotting is performed in a manner showing the time sequence, such as that in which the brightness, size, color, or shape of the most recent plot data is different from that of other data, or that in which the most recent plot data blink. Therefore, plotted data can be traced time-sequentially, and hence the latest state of a living body can be easily known.
- the displayed data in the case where data are separated from one another, the displayed data can be traced time-sequentially, and hence the latest state of a living body can be easily known.
- the arrows or the lines are not displayed, and the display is prevented from being hardly viewed.
- the plot point which is latest in the time sequence is displayed on the front. Therefore, the latest state of a living body can be easily known.
- information indicating normality or abnormality, and an adequate or critical region are displayed in the coordinates. Therefore, it is possible to easily know whether the state of a living body is normal or abnormal.
- data of a plurality of persons can be simultaneously plotted in the coordinates. Therefore, living body states of a plurality of persons can be simultaneously known, and the working efficiency of a medical person related to a monitoring operation is improved.
- the first coordinates and the second coordinates can be simultaneously displayed. Therefore, the circulatory dynamics can be known more accurately, and adequate infusion fluid management can be realized.
- plot data at the time which is desired by the user can be replayed in the coordinates. Therefore, oversight or the like can be prevented from occurring.
Landscapes
- Health & Medical Sciences (AREA)
- Life Sciences & Earth Sciences (AREA)
- Engineering & Computer Science (AREA)
- Biomedical Technology (AREA)
- Medical Informatics (AREA)
- Public Health (AREA)
- General Health & Medical Sciences (AREA)
- Biophysics (AREA)
- Molecular Biology (AREA)
- Veterinary Medicine (AREA)
- Physics & Mathematics (AREA)
- Animal Behavior & Ethology (AREA)
- Surgery (AREA)
- Pathology (AREA)
- Heart & Thoracic Surgery (AREA)
- Physiology (AREA)
- Cardiology (AREA)
- Pulmonology (AREA)
- Immunology (AREA)
- Vascular Medicine (AREA)
- Business, Economics & Management (AREA)
- General Business, Economics & Management (AREA)
- Epidemiology (AREA)
- Primary Health Care (AREA)
- Measuring And Recording Apparatus For Diagnosis (AREA)
- Measuring Pulse, Heart Rate, Blood Pressure Or Blood Flow (AREA)
Abstract
Description
- The present invention relates to a biological parameter displaying apparatus which automatically plots data related to two biological parameters (particularly cardiovascular parameters such as the blood pressure and the cardiac output) of different kinds that are acquired from a living body at the same time or in the same time zone, in XY coordinates, and which can display the data in the form of a trend display so as to clarify the plotted time sequence.
- In order to know the trend of the circulatory dynamics, there is an apparatus which performs a trend display such as shown in
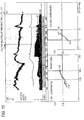
Fig. 8 . A trend display is a display in which the ordinate shows the values of biological parameters, and the abscissa shows the time. In the trend display ofFig. 8 , temporal changes of biological parameters in the medium and long term can be easily known, thereby providing beneficial information to the a medical person. - As a graph showing a relationship between two different biological parameters, there are a cardiac function curve and the Forrester classification in which data related to two biological parameters acquired from a living body are displayed in XY coordinates.
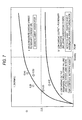
- In a cardiac function curve, the cardiac index CI is set as the Y-axis (ordinate), the pulmonary artery wedge pressure PCWP is set as the X-axis (abscissa), and data are plotted in XY coordinates as shown in
Fig. 7 . From the drawn curve, a medical person can easily know the circulatory dynamics such as whether the cardiac function is normal, decreased, or enhanced. - In the Forrester classification, similarly as shown in
Fig. 7 , for example, XY coordinates in which a cardiac function curve is displayed is divided into four events, and the events are classified as "I Normal", "II Mild", "III Low cardiac output", and "IV Low cardiac output + pulmonary congestion", respectively. Depending on the position where the data (indicated by the circles) of the patient are plotted, a medical person can easily know the circulatory dynamics such as a pathological condition due to cardiogenic shock. - In the trend display which is shown in
Fig. 8 , the abscissa is the time axis, and hence only temporal changes of parameters are known, so that the circulatory dynamics based on the linking of two different biological parameters cannot be known. - A graph such as shown in
Fig. 7 is usually produced by first independently measuring two different biological parameters, and then plotting the data to form the graph. It cannot be always said that such a graph is produced by plotting data of two different biological parameters having appropriate temporal relationships. - The reason of this is as follows. In the case where the cardiac index CI and pulmonary artery wedge pressure PCWP shown in
Fig. 7 are measured, an invasive technique in which a pulmonary artery catheter having a balloon at the tip end is inserted into the heart of the patient is employed. Moreover, the cardiac index CI is a value which is acquired by performing division on the cardiac output CO. In order to acquire the cardiac output CO, it is necessary to perform the thermodilution method or dye dillution method in which a medical person injects a predetermined solution into the patient in each measurement. Moreover, the pulmonary artery wedge pressure PCWP is a blood pressure in the case where the balloon at the tip end of the pulmonary artery catheter is inflated. In order to acquire the pulmonary artery wedge pressure PCWP, therefore, a medical person must inflate the balloon in each measurement. Therefore, data of the ordinate and the abscissa which are acquired by operations conducted by a medical person cannot be continuously measured. - Recently, an apparatus which can continuously calculate the cardiac output CO has been developed. In order to plot data in coordinates with temporal simultaneousness, however, a plurality of medical persons must respectively perform measurements, or a single medical person must simultaneously perform the measurements. Therefore, it cannot be said that the workability is high.
- In the case where a graph such as shown in
Fig. 7 is applied as a trend display of, for example, the circulatory dynamics of a living body, particularly, plotting must be performed while further considering the temporal simultaneousness of two different biological parameters. Even if simultaneous measurements are performed and data can be plotted in coordinates, the display is shown in the form indicating the time sequence. Although a technique in which the time is directly written as inFig. 7 may be considered, there is a problem in display such as that, when the number of data to be plotted is increased, the data are hardly readable. -
U.S. Patent No. 7,542,795 and Japanese Patent No.3,656,642 - In
U.S. Patent No. 7, 542, 795 , results of measurements by one electrocardiogram sensor are plotted in the ordinate and the abscissa. In Japanese Patent No.3,656,642 - It is therefore an object of the invention to provide a biological parameter displaying apparatus which automatically plots data related to two biological parameters that are acquired by different sensors from a living body at the same time or in the same time zone, in XY coordinates, and which can display the data in the form of a trend display so as to clarify the plotted time sequence.
- In order to achieve the object, according to the invention, there is provided a biological parameter displaying apparatus comprising: a coordinate displaying unit which displays first coordinates in which a first biological parameter of a patient, which is measured by a first measuring unit, is set as an X-axis, and a second biological parameter of the patient, which is different in kind from the first biological parameter and which is measured by a second measuring unit, is set as a Y-axis; a plot data producing unit which produces first plot data, each of the first plot data being produced based on first measurement values of the first and second biological parameters which are measured at a same time or in a same time zone; and a plot displaying unit which plots the first plot data in the first coordinates.
- The first plot data may include at least two data including first data and second data, the first data may be subsequent to the second data, and the first data and the second data may be displayed at a time interval.
- The first data may be a latest data.
- The first measurement values of the first and second biological parameters may be representative values of the first and second biological parameters, which are acquired from groups of values of the first and second biological parameters measured at the same time or in the same time zone.
- The representative values may be one of median, mean, and mode values of the groups of the values of the first and second biological parameters measured at the same time or in the same time zone.
- The first plot data may be plotted in a manner showing a time sequence.
- The first plot data may include first, second and third data, and the second data is subsequent to the third data, and the first data is subsequent to the second data and is a latest data. In the manner showing the time sequence, a brightness of the first data may be highest, and a brightness of the second data may be identical to a brightness of the third data or a brightness of the second data may be higher than a brightness of the third data.
- The first plot data may include first, second and third data, and the second data is subsequent to the third data, and the first data is subsequent to the second data and is a latest data. In the manner showing the time sequence, a size of the first data may be largest, and a size of the second data may be identical to a size of the third data or a size of the second data may be larger than a size of the third data.
- The first plot data may include first and second data, and the first data is subsequent to the second data. In the manner showing the time sequence, a color of the first data may be different from a color of the second data.
- The first plot data may include first and second data, and the first data is subsequent to the second data. In the manner showing the time sequence, the first data and the second data may be connected to each other by an arrow or a line.
- When a distance between the first data and the second data is shorter than a length, the first data and the second data may not be connected to each other by the arrow or the line.
- The first plot data may include first and second data, and the first data is subsequent to the second data and is a latest data. In the manner showing the time sequence, a shape of the first data may be different from a shape of the second data.
- The first plot data may include first and second data, and the first data is subsequent to the second data and is a latest data. In the manner showing the time sequence, the first data may blink and the second data may not blink.
- The first plot data may include first and second data, and the first data is subsequent to the second data. In the manner showing the time sequence, when the first data and the second data are overlapped with each other at least in part, the first data may be displayed on the second data.
- The biological parameter displaying apparatus may further include a determination criterion displaying unit which displays information indicating whether the first plot data are normal or abnormal as a state of the patient.
- The biological parameter displaying apparatus may further include a region displaying unit which displays a region showing whether the first plot data are adequate or critical as a state of the patient.
- The first biological parameter may be a cardiovascular parameter which is one of a first parameter indicating a cardiac output/cardiac function which can be continuously measured and a second parameter indicating a preload/afterload of a heart which can be continuously measured, and the second biological parameter may be a cardiovascular parameter which is the other of the first and second parameters.
- The patient may include a plurality of patients.
- The biological parameter displaying apparatus may further include a time selecting unit which selects a time. The first plot data corresponding to the selected time may be plotted.
- The coordinate displaying unit may display second coordinates in which a third biological parameter, which is measured by a third measuring unit, is set as an X-axis, and the second biological parameter is set as a Y-axis, the plot data producing unit may produce second plot data, each of the second plot data being produced based on second measurement values of the second and third biological parameters which are measured at a same time or in a same time zone, and the plot displaying unit may plot the second plot data in the second coordinates.
- The coordinate displaying unit may display second coordinates in which a third biological parameter, which is measured by a third measuring unit, is set as an X-axis, and a fourth biological parameter, which is measured by a fourth measuring unit, is set as a Y-axis, the plot data producing unit may produce second plot data, each of the second plot data being produced based on second measurement values of the third and fourth biological parameters which are measured at a same time or in a same time zone, and the plot displaying unit may plot the second plot data in the second coordinates.
-
-
Fig. 1 is a block diagram showing the configuration of an embodiment of the biological parameter displaying apparatus of the invention. -
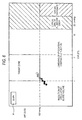
Fig. 2 is a view showing an example of an image which is displayed in the embodiment of the biological parameter displaying apparatus of the invention. -
Fig. 3 is a view showing another example of an image which is displayed in the embodiment of the biological parameter displaying apparatus of the invention. -
Fig. 4 is a view showing a further example of an image which is displayed in the embodiment of the biological parameter displaying apparatus of the invention. -
Fig. 5 is a view showing a still further example of an image which is displayed in the embodiment of the biological parameter displaying apparatus of the invention. -
Fig. 6 is a view showing a still further example of an image which is displayed in the embodiment of the biological parameter displaying apparatus of the invention. -
Fig. 7 is a view showing an example of the Forrester classification. -
Fig. 8 is a view showing an example of a trend display displayed in a related-art biological parameter displaying apparatus. -
Figs. 9A to 9D are views showing still further examples of an image which is displayed in the embodiment of the biological parameter displaying apparatus of the invention, and in which plots are connected to one another by lines. -
Fig. 10 is a view showing a still further example of an image which is displayed in the embodiment of the biological parameter displaying apparatus of the invention, and in which a plurality of coordinates are displayed on a screen and the time which is selected. - Hereinafter, an embodiment of the biological parameter displaying apparatus of the invention will be described with reference to the accompanying drawings. In the figures, the identical components are denoted by the same reference numerals, and duplicated description will be omitted. As shown in
Fig. 1 , the biological parameter displaying apparatus includes afirst measuring unit 11 and asecond measuring unit 12. - As the
first measuring unit 11 and thesecond measuring unit 12, a blood pressure measuring unit which measures an invasive blood pressure such as the central venous pressure (CVP), the pulmonary arterial pressure (PAP), the pulmonary arterial wedge pressure (PCWP), the arterial pressure (ART), and the intracardiac pressure (RAP, RVP, LAP, LVP), a cardiac output measuring unit which measures the cardiac output CO indicating the amount of blood pumped out from the heart for one minute, or a measuring unit which can measure the preload and afterload of the heart, such as the CVP-ET or the PPV is preferable. The measuring units are not limited to these units, and may be any measuring unit as far as it can acquire a measurement value which is equivalent to or reflects a biological parameter. Particularly, measuring units which can continuously measure the biological parameters are preferred. Usually, these biological parameters are often measured by an invasive technique. Alternatively, the biological parameters may be measured by a noninvasive technique. Anyway, thefirst measuring unit 11 and thesecond measuring unit 12 are requested to be different measuring units. - Here, the preload means the amount of blood which maintains the ventricle and the lumen of a large blood vessel before the cardiac contraction (the end-diastole time). The term of CVP-ET is a value which is acquired by measuring the central venous pressure (CVP) at the timing of the end-tidal, and used as an index of the preload of the right ventricle. The details are disclosed in
JP-A-2010-200901 - The signals acquired in the above-described various sensors are processed, and then sent to a
CPU 30. - The
CPU 30 includes a coordinate displayingunit 31, a plotdata producing unit 32, aplot displaying unit 33, a determinationcriterion displaying unit 34, and aregion displaying unit 35. - An inputting
unit 50 configured by a touch panel, a keyboard, and the like is connected to theCPU 30. Through the inputtingunit 50, two kinds of biological parameters which are to be plotted and displayed in XY coordinates are selected from biological parameters which are measured by the measuring units. In the embodiment, the interval (time zone) between data can be selected from 1 m, 10 m, 30 m, 1 h, and 4 h. Through the inputtingunit 50, it is possible also to select whether a trend display or a plot display in the XY coordinates is to be performed. It is a matter of course that the numbers are not limited to the above. - The coordinate displaying
unit 31 of theCPU 30 draws a graph using XY coordinates in which data which are measured by thefirst measuring unit 11, and which are related to a first biological parameter are set as the X-axis, and data which are measured by thesecond measuring unit 12, and which are related to a second biological parameter are set as the Y-axis, on a displayingunit 40. - The plot
data producing unit 32 produces plot data based on measurement values of the first biological parameter and the second biological parameter which are measured at the same time or in the same time zone by thefirst measuring unit 11 and thesecond measuring unit 12. The produced plot data are plotted in the XY coordinates by theplot displaying unit 33. The fact that the measurement values are measured at the same time or in the same time zone is detected based on the input times of the data in the case of real-time measurement. In the case of not real-time measurement, theCPU 30 acquires the measurement start times and the sampling intervals of the data, and the detection is performed based on these data. The plotting interval is an interval which is set through the inputtingunit 50. The value of the plotting interval is displayed in a region W of a screen shown inFigs. 2 to 6 . Alternatively, the plotting may be performed in a manner showing the time sequence which will be described later. - The term "at the same time" means the time relationship in the case where the plot
data producing unit 32 produces plot data based on measurement values which are measured at the same time by thefirst measuring unit 11 and thesecond measuring unit 12, and includes the time relationship in the case where plot data are produced based on two measurement values which are not measured at the same time, but in which the measurement time by thefirst measuring unit 11 and that by thesecond measuring unit 12 are closest to each other, or latest measurement values which are measured by the respective measuring units. - In the case where the
plot displaying unit 33 performs plotting while biological parameters are measured in real time, it is preferable to perform the plotting base on two data which are measured by thefirst measuring unit 11 and thesecond measuring unit 12 at times that are closest to each other. - The term "in the same time zone" means the time relationship in the case where representative values are acquired from groups of measurement values of the measured biological parameters in a predetermined time period immediately before the plotting, and the plot
data producing unit 32 produces plot data based on the representative values. Examples of the representative value are the mode, mean, and median values of a measurement value group of each biological parameter. - As described above, the plot
data producing unit 32 produces plot data based on the representative values acquired from measurement values which are measured at the same time by thefirst measuring unit 11 and thesecond measuring unit 12. The term "the representative values acquired from measurement values which are measured at the same time by thefirst measuring unit 11 and thesecond measuring unit 12" means that, in the case where each of the measuring units samples measurement values at intervals of 1 second, for example, the mode, mean, or median value which is acquired from a group of 60 measurement values that are measured from 11 o'clock to 11o'clock 1 minute is set as plot data of 11 o'clock. - Alternatively, the term "in the same time zone" may mean the time relationship in the case where the plot
data producing unit 32 produces plot data by using a mathematical technique such as the mode, mean, and median values of a measurement value group of biological parameters measured between the plotted intervals (above-described data intervals). - As the manner showing the time sequence, a configuration where the brightness is changed by a predetermined gradation in the unit of the elapsed time of data, that where arrows or lines are used, that where the color is gradually changed, and that where the shape or size of a plot point is changed may be used singly or combinedly. In order that data can be traced time-sequentially, in addition to or separately from the above-described manner, an image may be produced so that several sequential plot points have an adequate size and overlapped with one another, or are not overlapped with one another but made close to one another, or plot points are connected to one another by arrows or lines. These display manners are shown in
Figs. 2 to 6 , and9A to 9D . - Examples of the display manner are shown in
Figs. 9A to 9D. Fig. 9A shows a display manner in which both ends of a line connecting plot points are contacted with the plot points, respectively.Fig. 9B shows a display manner in which both ends of a line connecting plot points are not contacted with the plot points.Figs. 9C and 9D show display manners in which one end of a line connecting plot points is contacted with one of the plot points. - In order that the latest plot is clearly shown, in addition to or separately from the above-described manner, the plotted shape is made different from that of other plot points (for example, the latest plot point is triangular, and other plot points are circular). Alternatively, the latest plot point may blink. In the case where a plurality of data are close to and are overlapped with one another, a newer plot point may be displayed in a more front face.
- The
CPU 30 further includes the determinationcriterion displaying unit 34. The determinationcriterion displaying unit 34 displays information (for example, previously stored in accordance with two kinds of biological parameters which are to be plotted and displayed in the XY coordinates) indicating whether a plot point is normal or abnormal as the state of a living body, in the coordinates. Specific examples of the information are curves L1, L2 shown inFigs. 2 and3 . In the case where the cardiac function is normal, the cardiac function traces the locus such as the curve L1, and, in the case where the cardiac function is abnormal, the cardiac function traces the locus such as the curve L2. When plot points and the curves L1, L2 are displayed together, therefore, it is possible to easily know the state of the cardiac function of a living body. - In the case where the biological parameters of the ordinate and the abscissa are changed, the determination
criterion displaying unit 34 displays a plot point correspondingly with the change in a display manner in which, as shown inFig. 4 , the time sequence is clearly shown in the XY coordinates in accordance with data of two kinds of biological parameters. Also in this case, the determinationcriterion displaying unit 34 may display information (for example, a line which is different fromFig. 3 ) indicating whether a plot point in the biological parameter ofFig. 4 is normal or abnormal as the state of a living body. - The
CPU 30 further includes theregion displaying unit 35. Theregion displaying unit 35 displays a region (for example, previously stored in accordance with two kinds of biological parameters which are to be plotted and displayed in the XY coordinates) where a plot point in the coordinates is normal as the state of a living body, as shown inFig. 5 so as to be clearly distinguished from another region. In order to clearly distinguish the region, any display manner such as that in which the region is boxed, or that in which the color of a normal region is different from that of another region may be employed as far as a normal region is clearly known. - Preferably, the settings related to the determination
criterion displaying unit 34 and theregion displaying unit 35 may be freely set in consideration of the individual differences, the operation of the facility, and the like. - Referring to
Fig. 5 , in order to enable a medical person to a perform a procedure so that a plot point of biological parameter data enters the range enclosed by a rectangular frame S in which the MAP is 65 mmHg or higher and the CVP-ET is from 8 mmHg to 12 mmHg, various medical procedures or the like to be performed may be displayed. - As the range, the EGDT (Early Goal Direct Therapy) which is a guideline that is to be achieved in a patient with severe septicemia or septic shock within six hours after initial treatment in order to normalize the circulatory dynamics and improve tissular hypoxia is exemplified. However, the range is not limited to this.
- In the range, as shown in
Fig. 6 , theregion displaying unit 35 may divide the coordinate into a plurality of regions such as "Target zone", "Reduction of circulatory blood volume", "Lowering of myocardial contractile function", "Critical zone of pulmonary edema", and "Cardiac tamponade". In this case, more preferably, "Target zone" which is normal as the state of a living body, and other particularly critical regions such as "Cardiac tamponade" and "Critical zone of pulmonary edema" may be displayed in different display manners. Although, inFig. 6 , the critical regions are made distinguishable by right and left slanting hatchings, the regions may be displayed so as to be clearly distinguishable from other regions. An adequate manner such as that in which the region is boxed, or that in which the color of the region is different from that of other regions may be employed. - The displaying
unit 40 is configured by, for example, an LCD which displays information supplied from the coordinate displayingunit 31,plot displaying unit 33, determinationcriterion displaying unit 34, andregion displaying unit 35 of theCPU 30. - The biological parameter displaying apparatus of the invention may be used not only in a so-called bedside biological information monitoring apparatus but also in a station type biological information monitoring apparatus (central monitor) which receives and displays biological information of patients transmitted from a plurality of bedside biological information monitoring apparatuses. In this case, the biological information displaying apparatus plots information transmitted from the bedside biological information monitoring apparatuses, in coordinates, whereby the living body states of a plurality of patients can be simultaneously displayed. In the case where a plurality of patients are simultaneously displayed, it is preferred to perform the display while the color, shape, and the like of a plot are changed for each patient.
-
Fig. 10 shows an example of the display by the biological parameter displaying apparatus. In the upper side ofFig. 10 , a trend display is displayed, and, in the lower side, a plurality of coordinates are displayed by theplot displaying unit 33. - A cursor C1 which is at the right end of the trend display of
Fig. 10 is used for displaying values of biological parameters such as the ART and the PPV at the present time. The biological parameter displaying apparatus includes a time selecting unit through which the user can perform operations such as that a dedicated cursor C2 (in the vicinity of the middle of the trend display ofFig. 10 ) is set to data of the time of concern in the trend display ofFig. 10 , that (although not illustrated) trend data of the time of concern is clicked, and that the time of concern is directly input. Theplot displaying unit 33 displays plot data corresponding to the time which is selected by the time selecting unit, in at least one of the first and second coordinates. The displayed plot data corresponding to the selected time may be one data or plural number of data. - The coordinates in the lower side of
Fig. 10 are examples of the first and second coordinates, and show that the plot data corresponding to the time which is selected by the time selecting unit can be replayed and displayed. The term "corresponding to the time which is selected" means that times in the neighborhood of the selected time. Preferably, the user can freely perform the setting related to the range (time duration) of the neighborhood times. - In the left coordinates of the lower side of
Fig. 10 , plot data based on biological data are plotted and displayed while the ordinate indicates the CCI and the abscissa indicates the PPV, and, in the right coordinates of the lower side ofFig. 10 , plot data based on biological data are plotted and displayed while the ordinate indicates the CCI and the abscissa indicates the CVP. InFig. 10 , the example in which the ordinates indicate the same biological parameter or the CCI is shown. Alternatively, the abscissas may indicate the same biological parameter, or the ordinates and the abscissas may indicate different biological parameters, respectively. - For example, the abscissa in the left coordinates of the lower side of
Fig. 10 indicates the PPV. The PPV suitably reflects the response to infusion fluid administered to the patient, and hence can be used as an index for administration of infusion fluid. Moreover, the abscissa in the right coordinates of the lower side ofFig. 10 indicates the CVP. The CVP can be used as an index for determining whether the amount of administered infusion fluid is adequate or not. Therefore, it is seen that, when a plurality of coordinates are displayed for one patient as shown in the lower side ofFig. 10 , the circulatory dynamics can be known more accurately, and infusion fluid management can be effectively known. The biological parameter displaying apparatus of the embodiment includes the configuration for performing such a display. - According to an aspect of the invention, data related to two different biological parameters that are measured at the same time or in the same time zone are automatically plotted in XY coordinates. Therefore, the apparatus is preferred in the case where the process (particularly, the circulatory dynamics) of the state of a living body is to be known easily and adequately.
- According to an aspect of the invention, plot data are produced based on one of the median, mean, and mode values of the group of measurement values which are measured in the same time zone. Even when a sudden noise enters the measurement value, therefore, an influence on data to be plotted can be reduced or eliminated, and stable and accurate data are plotted.
- According to an aspect of the invention, plotting is performed in a manner showing the time sequence, such as that in which the brightness, size, color, or shape of the most recent plot data is different from that of other data, or that in which the most recent plot data blink. Therefore, plotted data can be traced time-sequentially, and hence the latest state of a living body can be easily known.
- According to an aspect of the invention, in the case where data are separated from one another, the displayed data can be traced time-sequentially, and hence the latest state of a living body can be easily known. In the case where data are close to one another, moreover, the arrows or the lines are not displayed, and the display is prevented from being hardly viewed.
- According to an aspect of the invention, in the case where a plurality of data overlap one another in the coordinates, the plot point which is latest in the time sequence is displayed on the front. Therefore, the latest state of a living body can be easily known.
- According to an aspect of the invention, information indicating normality or abnormality, and an adequate or critical region are displayed in the coordinates. Therefore, it is possible to easily know whether the state of a living body is normal or abnormal.
- According to an aspect of the invention, data of a plurality of persons can be simultaneously plotted in the coordinates. Therefore, living body states of a plurality of persons can be simultaneously known, and the working efficiency of a medical person related to a monitoring operation is improved.
- According to an aspect of the invention, the first coordinates and the second coordinates can be simultaneously displayed. Therefore, the circulatory dynamics can be known more accurately, and adequate infusion fluid management can be realized.
- According to an aspect of the invention, plot data at the time which is desired by the user, can be replayed in the coordinates. Therefore, oversight or the like can be prevented from occurring.
Claims (21)
- A biological parameter displaying apparatus comprising:a coordinate displaying unit which displays first coordinates in which a first biological parameter of a patient, which is measured by a first measuring unit, is set as an X-axis, and a second biological parameter of the patient, which is different in kind from the first biological parameter and which is measured by a second measuring unit, is set as a Y-axis;a plot data producing unit which produces first plot data, each of the first plot data being produced based on first measurement values of the first and second biological parameters which are measured at a same time or in a same time zone; anda plot displaying unit which plots the first plot data in the first coordinates.
- The biological parameter displaying apparatus according to claim 1, wherein
the first plot data includes at least two data including first data and second data,
the first data is subsequent to the second data, and the first data and the second data are displayed at a time interval. - The biological parameter displaying apparatus according to claim 2, wherein
the first data is a latest data. - The biological parameter displaying apparatus according to claim 1, wherein
the first measurement values of the first and second biological parameters are representative values of the first and second biological parameters, which are acquired from groups of values of the first and second biological parameters measured at the same time or in the same time zone. - The biological parameter displaying apparatus according to claim 4, wherein
the representative values are one of median, mean, and mode values of the groups of the values of the first and second biological parameters measured at the same time or in the same time zone. - The biological parameter displaying apparatus according to claim 1, wherein
the first plot data are plotted in a manner showing a time sequence. - The biological parameter displaying apparatus according to claim 6, wherein
the first plot data include first, second and third data, the second data is subsequent to the third data, and the first data is subsequent to the second data and is a latest data, and
in the manner showing the time sequence, a brightness of the first data is highest, and a brightness of the second data is identical to a brightness of the third data or a brightness of the second data is higher than a brightness of the third data. - The biological parameter displaying apparatus according to claim 6, wherein
the first plot data include first, second and third data, the second data is subsequent to the third data, and the first data is subsequent to the second data and is a latest data, and
in the manner showing the time sequence, a size of the first data is largest, and a size of the second data is identical to a size of the third data or a size of the second data is larger than a size of the third data. - The biological parameter displaying apparatus according to claim 6, wherein
the first plot data include first and second data, the first data is subsequent to the second data, and
in the manner showing the time sequence, a color of the first data is different from a color of the second data. - The biological parameter displaying apparatus according to claim 6, wherein
the first plot data include first and second data, the first data is subsequent to the second data, and in the manner showing the time sequence, the first data and the second data are connected to each other by an arrow or a line. - The biological parameter displaying apparatus according to claim 10, wherein
when a distance between the first data and the second data is shorter than a length, the first data and the second data are not connected to each other by the arrow or the line. - The biological parameter displaying apparatus according to claim 6, wherein
the first plot data include first and second data, the first data is subsequent to the second data and is a latest data, and
in the manner showing the time sequence, a shape of the first data is different from a shape of the second data. - The biological parameter displaying apparatus according to claim 6, wherein
the first plot data include first and second data, the first data is subsequent to the second data and is a latest data, and
in the manner showing the time sequence, the first data blinks and the second data does not blink. - The biological parameter displaying apparatus according to claim 6, wherein
the first plot data include first and second data, the first data is subsequent to the second data, and in the manner showing the time sequence, when the first data and the second data are overlapped with each other at least in part, the first data is displayed on the second data. - The biological parameter displaying apparatus according to claim 1, further comprising
a determination criterion displaying unit which displays information indicating whether the first plot data are normal or abnormal as a state of the patient. - The biological parameter displaying apparatus according to claim 1, further comprising
a region displaying unit which displays a region showing whether the first plot data are adequate or critical as a state of the patient. - The biological parameter displaying apparatus according to claim 1, wherein
the first biological parameter is a cardiovascular parameter which is one of a first parameter indicating a cardiac output/cardiac function which can be continuously measured and a second parameter indicating a preload/afterload of a heart which can be continuously measured, and
the second biological parameter is a cardiovascular parameter which is the other of the first and second parameters. - The biological parameter displaying apparatus according to claim 1, wherein
the patient includes a plurality of patients. - The biological parameter displaying apparatus according to claim 1, further comprising
a time selecting unit which selects a time, wherein the first plot data corresponding to the selected time are plotted. - The biological parameter displaying apparatus according to claim 1, wherein
the coordinate displaying unit displays second coordinates in which a third biological parameter, which is measured by a third measuring unit, is set as an X-axis, and the second biological parameter is set as a Y-axis,
the plot data producing unit produces second plot data, each of the second plot data being produced based on second measurement values of the second and third biological parameters which are measured at a same time or in a same time zone, and
the plot displaying unit plots the second plot data in the second coordinates. - The biological parameter displaying apparatus according to claim 1, wherein
the coordinate displaying unit displays second coordinates in which a third biological parameter, which is measured by a third measuring unit, is set as an X-axis, and a fourth biological parameter, which is measured by a fourth measuring unit, is set as a Y-axis,
the plot data producing unit produces second plot data, each of the second plot data being produced based on second measurement values of the third and fourth biological parameters which are measured at a same time or in a same time zone, and
the plot displaying unit plots the second plot data in the second coordinates.
Applications Claiming Priority (2)
| Application Number | Priority Date | Filing Date | Title |
|---|---|---|---|
| JP2009243125 | 2009-10-22 | ||
| JP2010169504A JP5536582B2 (en) | 2009-10-22 | 2010-07-28 | Biological parameter display device |
Publications (2)
| Publication Number | Publication Date |
|---|---|
| EP2314211A1 true EP2314211A1 (en) | 2011-04-27 |
| EP2314211B1 EP2314211B1 (en) | 2018-08-15 |
Family
ID=43402049
Family Applications (1)
| Application Number | Title | Priority Date | Filing Date |
|---|---|---|---|
| EP10188548.1A Active EP2314211B1 (en) | 2009-10-22 | 2010-10-22 | Biological parameter displaying apparatus |
Country Status (4)
| Country | Link |
|---|---|
| US (1) | US9743842B2 (en) |
| EP (1) | EP2314211B1 (en) |
| JP (1) | JP5536582B2 (en) |
| CN (1) | CN102038495B (en) |
Cited By (3)
| Publication number | Priority date | Publication date | Assignee | Title |
|---|---|---|---|---|
| EP2685398A3 (en) * | 2012-07-09 | 2017-04-12 | Nihon Kohden Corporation | Monitor |
| WO2017077702A1 (en) * | 2015-11-02 | 2017-05-11 | Nihon Kohden Corporation | Vital information displaying apparatus |
| EP3925526A1 (en) * | 2020-06-15 | 2021-12-22 | Nihon Kohden Corporation | Hemodynamic parameter analysis apparatus and hemodynamic parameter analysis program |
Families Citing this family (10)
| Publication number | Priority date | Publication date | Assignee | Title |
|---|---|---|---|---|
| US9489279B2 (en) * | 2011-01-18 | 2016-11-08 | Cisco Technology, Inc. | Visualization of performance data over a network path |
| US8850324B2 (en) * | 2011-02-02 | 2014-09-30 | Cisco Technology, Inc. | Visualization of changes and trends over time in performance data over a network path |
| JP6017807B2 (en) * | 2012-03-16 | 2016-11-02 | オムロン株式会社 | Blood pressure related information display device |
| JP6242106B2 (en) * | 2013-07-31 | 2017-12-06 | フクダ電子株式会社 | Biological information monitor and display method in biological information monitor |
| JP2015216970A (en) * | 2014-05-14 | 2015-12-07 | オムロンヘルスケア株式会社 | Blood pressure related information display and program |
| CN108882869B (en) * | 2016-04-15 | 2021-03-23 | 欧姆龙株式会社 | Biological information analysis device, system, and program |
| WO2018096631A1 (en) | 2016-11-24 | 2018-05-31 | オリンパス株式会社 | Data processing device, computer readable medium, data processing method, and program |
| CN111970977B (en) * | 2018-03-26 | 2024-04-16 | 泰尔茂株式会社 | Diagnosis support system, diagnosis support method, and recording medium |
| JP7302962B2 (en) * | 2018-11-07 | 2023-07-04 | フクダ電子株式会社 | Medical image display method and program |
| WO2020132797A1 (en) * | 2018-12-24 | 2020-07-02 | 深圳迈瑞生物医疗电子股份有限公司 | Physiological sign monitoring method for fluid infusion and monitoring device |
Citations (5)
| Publication number | Priority date | Publication date | Assignee | Title |
|---|---|---|---|---|
| JP3656642B2 (en) | 1993-11-20 | 2005-06-08 | 伸夫 鈴木 | Computer 2D display and analysis system for blood pressure |
| US20070027398A1 (en) * | 2005-08-01 | 2007-02-01 | Brodnick Donald E | Vector superimposition & graphical display of physiological data without or before analysis |
| US20080139958A1 (en) * | 2006-12-11 | 2008-06-12 | Japan As Represented By President Of National Cardiovascular Center | Solid tissue impedance estimating method, cardiac output calculating method, pulmonary artery wedge pressure calculating method, cardiac output monitoring device, cardiac output monitoring system, pulmonary artery wedge pressure monitoring device, and pulmonary artery wedge pressure monitoring system |
| US20090216138A1 (en) * | 2005-05-26 | 2009-08-27 | Inovise Medical, Inc. | Cardio-Function cafeteria methodology |
| JP2010200901A (en) | 2009-03-02 | 2010-09-16 | Nippon Koden Corp | Biological signal measuring apparatus |
Family Cites Families (25)
| Publication number | Priority date | Publication date | Assignee | Title |
|---|---|---|---|---|
| US5103828A (en) * | 1988-07-14 | 1992-04-14 | Bomed Medical Manufacturing, Ltd. | System for therapeutic management of hemodynamic state of patient |
| US5655530A (en) * | 1995-08-09 | 1997-08-12 | Rio Grande Medical Technologies, Inc. | Method for non-invasive blood analyte measurement with improved optical interface |
| US5697959A (en) * | 1996-01-11 | 1997-12-16 | Pacesetter, Inc. | Method and system for analyzing and displaying complex pacing event records |
| JP3628812B2 (en) * | 1996-07-15 | 2005-03-16 | 松下電器産業株式会社 | Abnormal fluctuation prediction method and abnormal fluctuation prediction apparatus |
| JP3708699B2 (en) * | 1998-01-22 | 2005-10-19 | 株式会社東芝 | Plant data analyzer |
| US7806831B2 (en) * | 2000-03-02 | 2010-10-05 | Itamar Medical Ltd. | Method and apparatus for the non-invasive detection of particular sleep-state conditions by monitoring the peripheral vascular system |
| BR0109026A (en) * | 2000-03-02 | 2003-06-03 | Itamar Medical Ltd | Method of monitoring an individual for the occurrence of a particular condition of the individual's sleeping state and apparatus for monitoring an individual to detect the occurrence of a particular condition during the individual's sleeping state |
| JP2002301034A (en) * | 2001-04-09 | 2002-10-15 | Nippon Colin Co Ltd | Pulse propagation velocity measuring apparatus |
| US7139598B2 (en) * | 2002-04-04 | 2006-11-21 | Veralight, Inc. | Determination of a measure of a glycation end-product or disease state using tissue fluorescence |
| US7054679B2 (en) * | 2001-10-31 | 2006-05-30 | Robert Hirsh | Non-invasive method and device to monitor cardiac parameters |
| JP2004021712A (en) * | 2002-06-18 | 2004-01-22 | Yokogawa Electric Corp | Equipment diagnosis support system |
| JP4517619B2 (en) * | 2002-12-05 | 2010-08-04 | オムロンヘルスケア株式会社 | Pulse wave measuring device |
| JP4200441B2 (en) * | 2003-08-13 | 2008-12-24 | 財団法人柏戸記念財団 | Visualization expression sheet creation device for clinical laboratory data |
| JP3931895B2 (en) * | 2004-07-29 | 2007-06-20 | 株式会社デンソー | Biological information display device |
| US7174203B2 (en) * | 2004-11-18 | 2007-02-06 | Inovise Medical, Inc. | Method and system relating to monitoring and characterizing heart condition |
| US20070142923A1 (en) * | 2005-11-04 | 2007-06-21 | Ayre Peter J | Control systems for rotary blood pumps |
| JP3948677B1 (en) * | 2006-07-07 | 2007-07-25 | 株式会社クロスウェル | Biological monitoring system and control method and program thereof |
| EP1884189A1 (en) * | 2006-08-03 | 2008-02-06 | Pulsion Medical Systems AG | Apparatus and method for determining a physiologic parameter of a patient applying fourier transformation |
| WO2009063446A2 (en) * | 2007-11-13 | 2009-05-22 | Oridion Medical (1987) Ltd. | Medical system, apparatus and method |
| CN101385641B (en) * | 2007-09-11 | 2015-03-25 | 深圳迈瑞生物医疗电子股份有限公司 | Wave analysis method and device of physiological parameter |
| EP2047794B1 (en) * | 2007-10-11 | 2012-02-29 | LiDCO Group PLC | Hemodynamic monitor |
| US20090124867A1 (en) * | 2007-11-13 | 2009-05-14 | Hirsh Robert A | Method and device to administer anesthetic and or vosactive agents according to non-invasively monitored cardiac and or neurological parameters |
| WO2009094700A1 (en) | 2008-01-31 | 2009-08-06 | Applied Physiology Pty. Ltd. | Systems, methods and devices for maintenance, guidance and/or control |
| JP4327243B1 (en) * | 2009-01-27 | 2009-09-09 | 株式会社クロスウェル | Autonomic nerve function diagnosis apparatus and program |
| US20110021936A1 (en) * | 2009-07-24 | 2011-01-27 | Shen Luo | Medical data display with 3-D and 2-D color mapping |
-
2010
- 2010-07-28 JP JP2010169504A patent/JP5536582B2/en active Active
- 2010-10-22 EP EP10188548.1A patent/EP2314211B1/en active Active
- 2010-10-22 CN CN201010527804.9A patent/CN102038495B/en active Active
- 2010-10-22 US US12/910,088 patent/US9743842B2/en active Active
Patent Citations (6)
| Publication number | Priority date | Publication date | Assignee | Title |
|---|---|---|---|---|
| JP3656642B2 (en) | 1993-11-20 | 2005-06-08 | 伸夫 鈴木 | Computer 2D display and analysis system for blood pressure |
| US20090216138A1 (en) * | 2005-05-26 | 2009-08-27 | Inovise Medical, Inc. | Cardio-Function cafeteria methodology |
| US20070027398A1 (en) * | 2005-08-01 | 2007-02-01 | Brodnick Donald E | Vector superimposition & graphical display of physiological data without or before analysis |
| US7542795B2 (en) | 2005-08-01 | 2009-06-02 | The General Electric Company | Vector superimposition and graphical display of physiological data without or before analysis |
| US20080139958A1 (en) * | 2006-12-11 | 2008-06-12 | Japan As Represented By President Of National Cardiovascular Center | Solid tissue impedance estimating method, cardiac output calculating method, pulmonary artery wedge pressure calculating method, cardiac output monitoring device, cardiac output monitoring system, pulmonary artery wedge pressure monitoring device, and pulmonary artery wedge pressure monitoring system |
| JP2010200901A (en) | 2009-03-02 | 2010-09-16 | Nippon Koden Corp | Biological signal measuring apparatus |
Non-Patent Citations (1)
| Title |
|---|
| FORRESTER J S ET AL: "Correlative classification of clinical and hemodynamic function after acute myocardial infarction.", THE AMERICAN JOURNAL OF CARDIOLOGY FEB 1977 LNKD- PUBMED:835473, vol. 39, no. 2, February 1977 (1977-02-01), pages 137 - 145, XP002616569, ISSN: 0002-9149 * |
Cited By (4)
| Publication number | Priority date | Publication date | Assignee | Title |
|---|---|---|---|---|
| EP2685398A3 (en) * | 2012-07-09 | 2017-04-12 | Nihon Kohden Corporation | Monitor |
| US10905384B2 (en) | 2012-07-09 | 2021-02-02 | Nihon Kohden Corporation | Monitor |
| WO2017077702A1 (en) * | 2015-11-02 | 2017-05-11 | Nihon Kohden Corporation | Vital information displaying apparatus |
| EP3925526A1 (en) * | 2020-06-15 | 2021-12-22 | Nihon Kohden Corporation | Hemodynamic parameter analysis apparatus and hemodynamic parameter analysis program |
Also Published As
| Publication number | Publication date |
|---|---|
| JP2011104341A (en) | 2011-06-02 |
| JP5536582B2 (en) | 2014-07-02 |
| CN102038495A (en) | 2011-05-04 |
| CN102038495B (en) | 2015-04-15 |
| US20110098540A1 (en) | 2011-04-28 |
| EP2314211B1 (en) | 2018-08-15 |
| US9743842B2 (en) | 2017-08-29 |
Similar Documents
| Publication | Publication Date | Title |
|---|---|---|
| US9743842B2 (en) | Biological parameter displaying apparatus | |
| EP2047794B1 (en) | Hemodynamic monitor | |
| US8388542B2 (en) | System for cardiac pathology detection and characterization | |
| EP3324836B1 (en) | Devices, systems, and methods for assessing a vessel | |
| US8668649B2 (en) | System for cardiac status determination | |
| EP2727524B1 (en) | Method and apparatus for measuring cardiac output | |
| US20110021936A1 (en) | Medical data display with 3-D and 2-D color mapping | |
| CN108937881B (en) | Method and apparatus for determining object volume responsiveness | |
| EP2226005A2 (en) | Biological signal measuring apparatus | |
| JP3887798B2 (en) | Biological information display method and biological information display device | |
| JP2008295517A (en) | Analysis system and method of pulse diagnosis in Kampo medicine | |
| US8282568B2 (en) | Method for estimating cardiac pumping capacity | |
| US6217522B1 (en) | Method and system for determination of the pressure-volume relationship of the heart | |
| JP2013173043A (en) | Biological information processing device, exercise electrocardiographic testing system and biological information processing program | |
| JP3779900B2 (en) | Blood vessel tension measuring device | |
| JP7461805B2 (en) | Circulatory dynamics analysis device and circulatory dynamics analysis program | |
| EP1420687B1 (en) | A method for the measurement of post arteriolar pressure | |
| JP5230305B2 (en) | Electrocardiogram analyzer, exercise electrocardiogram inspection system, and electrocardiogram analysis program | |
| JP4406122B2 (en) | Ultrasound diagnostic imaging equipment | |
| CN117617986A (en) | Methods, devices and electronic equipment for determining microcirculatory resistance index | |
| CN116636823A (en) | Atrial fibrillation detection system, atrial fibrillation detection method and atrial fibrillation detection device | |
| JP4091972B1 (en) | Vascular function diagnosis system and program | |
| CN114190906A (en) | Physiological parameter monitoring equipment and monitoring method thereof | |
| Bieber et al. | Visual detection of short-wave blood pressure fluctuations | |
| JP2004141600A (en) | Electrocardiogram synchronized pressure measuring device |
Legal Events
| Date | Code | Title | Description |
|---|---|---|---|
| PUAI | Public reference made under article 153(3) epc to a published international application that has entered the european phase |
Free format text: ORIGINAL CODE: 0009012 |
|
| AK | Designated contracting states |
Kind code of ref document: A1 Designated state(s): AL AT BE BG CH CY CZ DE DK EE ES FI FR GB GR HR HU IE IS IT LI LT LU LV MC MK MT NL NO PL PT RO RS SE SI SK SM TR |
|
| AX | Request for extension of the european patent |
Extension state: BA ME |
|
| 17P | Request for examination filed |
Effective date: 20111024 |
|
| 17Q | First examination report despatched |
Effective date: 20161111 |
|
| GRAP | Despatch of communication of intention to grant a patent |
Free format text: ORIGINAL CODE: EPIDOSNIGR1 |
|
| INTG | Intention to grant announced |
Effective date: 20180314 |
|
| GRAS | Grant fee paid |
Free format text: ORIGINAL CODE: EPIDOSNIGR3 |
|
| GRAA | (expected) grant |
Free format text: ORIGINAL CODE: 0009210 |
|
| AK | Designated contracting states |
Kind code of ref document: B1 Designated state(s): AL AT BE BG CH CY CZ DE DK EE ES FI FR GB GR HR HU IE IS IT LI LT LU LV MC MK MT NL NO PL PT RO RS SE SI SK SM TR |
|
| REG | Reference to a national code |
Ref country code: CH Ref legal event code: EP Ref country code: GB Ref legal event code: FG4D Ref country code: AT Ref legal event code: REF Ref document number: 1028795 Country of ref document: AT Kind code of ref document: T Effective date: 20180815 |
|
| REG | Reference to a national code |
Ref country code: IE Ref legal event code: FG4D |
|
| REG | Reference to a national code |
Ref country code: DE Ref legal event code: R096 Ref document number: 602010052701 Country of ref document: DE Ref country code: FR Ref legal event code: PLFP Year of fee payment: 9 |
|
| REG | Reference to a national code |
Ref country code: NL Ref legal event code: MP Effective date: 20180815 |
|
| REG | Reference to a national code |
Ref country code: LT Ref legal event code: MG4D |
|
| REG | Reference to a national code |
Ref country code: AT Ref legal event code: MK05 Ref document number: 1028795 Country of ref document: AT Kind code of ref document: T Effective date: 20180815 |
|
| PG25 | Lapsed in a contracting state [announced via postgrant information from national office to epo] |
Ref country code: IS Free format text: LAPSE BECAUSE OF FAILURE TO SUBMIT A TRANSLATION OF THE DESCRIPTION OR TO PAY THE FEE WITHIN THE PRESCRIBED TIME-LIMIT Effective date: 20181215 Ref country code: RS Free format text: LAPSE BECAUSE OF FAILURE TO SUBMIT A TRANSLATION OF THE DESCRIPTION OR TO PAY THE FEE WITHIN THE PRESCRIBED TIME-LIMIT Effective date: 20180815 Ref country code: AT Free format text: LAPSE BECAUSE OF FAILURE TO SUBMIT A TRANSLATION OF THE DESCRIPTION OR TO PAY THE FEE WITHIN THE PRESCRIBED TIME-LIMIT Effective date: 20180815 Ref country code: NL Free format text: LAPSE BECAUSE OF FAILURE TO SUBMIT A TRANSLATION OF THE DESCRIPTION OR TO PAY THE FEE WITHIN THE PRESCRIBED TIME-LIMIT Effective date: 20180815 Ref country code: NO Free format text: LAPSE BECAUSE OF FAILURE TO SUBMIT A TRANSLATION OF THE DESCRIPTION OR TO PAY THE FEE WITHIN THE PRESCRIBED TIME-LIMIT Effective date: 20181115 Ref country code: LT Free format text: LAPSE BECAUSE OF FAILURE TO SUBMIT A TRANSLATION OF THE DESCRIPTION OR TO PAY THE FEE WITHIN THE PRESCRIBED TIME-LIMIT Effective date: 20180815 Ref country code: GR Free format text: LAPSE BECAUSE OF FAILURE TO SUBMIT A TRANSLATION OF THE DESCRIPTION OR TO PAY THE FEE WITHIN THE PRESCRIBED TIME-LIMIT Effective date: 20181116 Ref country code: BG Free format text: LAPSE BECAUSE OF FAILURE TO SUBMIT A TRANSLATION OF THE DESCRIPTION OR TO PAY THE FEE WITHIN THE PRESCRIBED TIME-LIMIT Effective date: 20181115 Ref country code: FI Free format text: LAPSE BECAUSE OF FAILURE TO SUBMIT A TRANSLATION OF THE DESCRIPTION OR TO PAY THE FEE WITHIN THE PRESCRIBED TIME-LIMIT Effective date: 20180815 Ref country code: SE Free format text: LAPSE BECAUSE OF FAILURE TO SUBMIT A TRANSLATION OF THE DESCRIPTION OR TO PAY THE FEE WITHIN THE PRESCRIBED TIME-LIMIT Effective date: 20180815 |
|
| PG25 | Lapsed in a contracting state [announced via postgrant information from national office to epo] |
Ref country code: LV Free format text: LAPSE BECAUSE OF FAILURE TO SUBMIT A TRANSLATION OF THE DESCRIPTION OR TO PAY THE FEE WITHIN THE PRESCRIBED TIME-LIMIT Effective date: 20180815 Ref country code: AL Free format text: LAPSE BECAUSE OF FAILURE TO SUBMIT A TRANSLATION OF THE DESCRIPTION OR TO PAY THE FEE WITHIN THE PRESCRIBED TIME-LIMIT Effective date: 20180815 Ref country code: ES Free format text: LAPSE BECAUSE OF FAILURE TO SUBMIT A TRANSLATION OF THE DESCRIPTION OR TO PAY THE FEE WITHIN THE PRESCRIBED TIME-LIMIT Effective date: 20180815 Ref country code: HR Free format text: LAPSE BECAUSE OF FAILURE TO SUBMIT A TRANSLATION OF THE DESCRIPTION OR TO PAY THE FEE WITHIN THE PRESCRIBED TIME-LIMIT Effective date: 20180815 |
|
| PG25 | Lapsed in a contracting state [announced via postgrant information from national office to epo] |
Ref country code: IT Free format text: LAPSE BECAUSE OF FAILURE TO SUBMIT A TRANSLATION OF THE DESCRIPTION OR TO PAY THE FEE WITHIN THE PRESCRIBED TIME-LIMIT Effective date: 20180815 Ref country code: PL Free format text: LAPSE BECAUSE OF FAILURE TO SUBMIT A TRANSLATION OF THE DESCRIPTION OR TO PAY THE FEE WITHIN THE PRESCRIBED TIME-LIMIT Effective date: 20180815 Ref country code: EE Free format text: LAPSE BECAUSE OF FAILURE TO SUBMIT A TRANSLATION OF THE DESCRIPTION OR TO PAY THE FEE WITHIN THE PRESCRIBED TIME-LIMIT Effective date: 20180815 Ref country code: CZ Free format text: LAPSE BECAUSE OF FAILURE TO SUBMIT A TRANSLATION OF THE DESCRIPTION OR TO PAY THE FEE WITHIN THE PRESCRIBED TIME-LIMIT Effective date: 20180815 Ref country code: RO Free format text: LAPSE BECAUSE OF FAILURE TO SUBMIT A TRANSLATION OF THE DESCRIPTION OR TO PAY THE FEE WITHIN THE PRESCRIBED TIME-LIMIT Effective date: 20180815 |
|
| REG | Reference to a national code |
Ref country code: DE Ref legal event code: R097 Ref document number: 602010052701 Country of ref document: DE |
|
| PG25 | Lapsed in a contracting state [announced via postgrant information from national office to epo] |
Ref country code: SM Free format text: LAPSE BECAUSE OF FAILURE TO SUBMIT A TRANSLATION OF THE DESCRIPTION OR TO PAY THE FEE WITHIN THE PRESCRIBED TIME-LIMIT Effective date: 20180815 Ref country code: DK Free format text: LAPSE BECAUSE OF FAILURE TO SUBMIT A TRANSLATION OF THE DESCRIPTION OR TO PAY THE FEE WITHIN THE PRESCRIBED TIME-LIMIT Effective date: 20180815 Ref country code: SK Free format text: LAPSE BECAUSE OF FAILURE TO SUBMIT A TRANSLATION OF THE DESCRIPTION OR TO PAY THE FEE WITHIN THE PRESCRIBED TIME-LIMIT Effective date: 20180815 |
|
| REG | Reference to a national code |
Ref country code: CH Ref legal event code: PL |
|
| PLBE | No opposition filed within time limit |
Free format text: ORIGINAL CODE: 0009261 |
|
| STAA | Information on the status of an ep patent application or granted ep patent |
Free format text: STATUS: NO OPPOSITION FILED WITHIN TIME LIMIT |
|
| REG | Reference to a national code |
Ref country code: BE Ref legal event code: MM Effective date: 20181031 |
|
| PG25 | Lapsed in a contracting state [announced via postgrant information from national office to epo] |
Ref country code: MC Free format text: LAPSE BECAUSE OF FAILURE TO SUBMIT A TRANSLATION OF THE DESCRIPTION OR TO PAY THE FEE WITHIN THE PRESCRIBED TIME-LIMIT Effective date: 20180815 Ref country code: LU Free format text: LAPSE BECAUSE OF NON-PAYMENT OF DUE FEES Effective date: 20181022 |
|
| 26N | No opposition filed |
Effective date: 20190516 |
|
| GBPC | Gb: european patent ceased through non-payment of renewal fee |
Effective date: 20181115 |
|
| REG | Reference to a national code |
Ref country code: IE Ref legal event code: MM4A |
|
| PG25 | Lapsed in a contracting state [announced via postgrant information from national office to epo] |
Ref country code: CH Free format text: LAPSE BECAUSE OF NON-PAYMENT OF DUE FEES Effective date: 20181031 Ref country code: SI Free format text: LAPSE BECAUSE OF FAILURE TO SUBMIT A TRANSLATION OF THE DESCRIPTION OR TO PAY THE FEE WITHIN THE PRESCRIBED TIME-LIMIT Effective date: 20180815 Ref country code: LI Free format text: LAPSE BECAUSE OF NON-PAYMENT OF DUE FEES Effective date: 20181031 Ref country code: BE Free format text: LAPSE BECAUSE OF NON-PAYMENT OF DUE FEES Effective date: 20181031 |
|
| PG25 | Lapsed in a contracting state [announced via postgrant information from national office to epo] |
Ref country code: IE Free format text: LAPSE BECAUSE OF NON-PAYMENT OF DUE FEES Effective date: 20181022 |
|
| PG25 | Lapsed in a contracting state [announced via postgrant information from national office to epo] |
Ref country code: GB Free format text: LAPSE BECAUSE OF NON-PAYMENT OF DUE FEES Effective date: 20181115 |
|
| PG25 | Lapsed in a contracting state [announced via postgrant information from national office to epo] |
Ref country code: MT Free format text: LAPSE BECAUSE OF NON-PAYMENT OF DUE FEES Effective date: 20181022 |
|
| PG25 | Lapsed in a contracting state [announced via postgrant information from national office to epo] |
Ref country code: TR Free format text: LAPSE BECAUSE OF FAILURE TO SUBMIT A TRANSLATION OF THE DESCRIPTION OR TO PAY THE FEE WITHIN THE PRESCRIBED TIME-LIMIT Effective date: 20180815 |
|
| PG25 | Lapsed in a contracting state [announced via postgrant information from national office to epo] |
Ref country code: PT Free format text: LAPSE BECAUSE OF FAILURE TO SUBMIT A TRANSLATION OF THE DESCRIPTION OR TO PAY THE FEE WITHIN THE PRESCRIBED TIME-LIMIT Effective date: 20180815 |
|
| PG25 | Lapsed in a contracting state [announced via postgrant information from national office to epo] |
Ref country code: HU Free format text: LAPSE BECAUSE OF FAILURE TO SUBMIT A TRANSLATION OF THE DESCRIPTION OR TO PAY THE FEE WITHIN THE PRESCRIBED TIME-LIMIT; INVALID AB INITIO Effective date: 20101022 Ref country code: CY Free format text: LAPSE BECAUSE OF FAILURE TO SUBMIT A TRANSLATION OF THE DESCRIPTION OR TO PAY THE FEE WITHIN THE PRESCRIBED TIME-LIMIT Effective date: 20180815 Ref country code: MK Free format text: LAPSE BECAUSE OF NON-PAYMENT OF DUE FEES Effective date: 20180815 |
|
| PGFP | Annual fee paid to national office [announced via postgrant information from national office to epo] |
Ref country code: FR Payment date: 20250908 Year of fee payment: 16 |
|
| PGFP | Annual fee paid to national office [announced via postgrant information from national office to epo] |
Ref country code: DE Payment date: 20250902 Year of fee payment: 16 |