EP2227689B1 - Biomarkers for fatty liver disease and methods using the same - Google Patents
Biomarkers for fatty liver disease and methods using the same Download PDFInfo
- Publication number
- EP2227689B1 EP2227689B1 EP08845659A EP08845659A EP2227689B1 EP 2227689 B1 EP2227689 B1 EP 2227689B1 EP 08845659 A EP08845659 A EP 08845659A EP 08845659 A EP08845659 A EP 08845659A EP 2227689 B1 EP2227689 B1 EP 2227689B1
- Authority
- EP
- European Patent Office
- Prior art keywords
- metabolite
- steatohepatitis
- biomarkers
- subject
- sample
- Prior art date
- Legal status (The legal status is an assumption and is not a legal conclusion. Google has not performed a legal analysis and makes no representation as to the accuracy of the status listed.)
- Active
Links
- 239000000090 biomarker Substances 0.000 title claims description 455
- 238000000034 method Methods 0.000 title claims description 173
- 208000010706 fatty liver disease Diseases 0.000 title description 21
- 208000004930 Fatty Liver Diseases 0.000 claims description 288
- 206010053219 non-alcoholic steatohepatitis Diseases 0.000 claims description 160
- 239000000523 sample Substances 0.000 claims description 113
- 208000008338 non-alcoholic fatty liver disease Diseases 0.000 claims description 98
- 239000012472 biological sample Substances 0.000 claims description 85
- 239000000203 mixture Substances 0.000 claims description 80
- 108010007979 Glycocholic Acid Proteins 0.000 claims description 64
- RFDAIACWWDREDC-FRVQLJSFSA-N glycocholic acid Chemical compound C([C@H]1C[C@H]2O)[C@H](O)CC[C@]1(C)[C@@H]1[C@@H]2[C@@H]2CC[C@H]([C@@H](CCC(=O)NCC(O)=O)C)[C@@]2(C)[C@@H](O)C1 RFDAIACWWDREDC-FRVQLJSFSA-N 0.000 claims description 64
- 238000003745 diagnosis Methods 0.000 claims description 35
- YGPSJZOEDVAXAB-UHFFFAOYSA-N kynurenine Chemical compound OC(=O)C(N)CC(=O)C1=CC=CC=C1N YGPSJZOEDVAXAB-UHFFFAOYSA-N 0.000 claims description 24
- 208000019423 liver disease Diseases 0.000 claims description 24
- WHUUTDBJXJRKMK-VKHMYHEASA-N L-glutamic acid Chemical compound OC(=O)[C@@H](N)CCC(O)=O WHUUTDBJXJRKMK-VKHMYHEASA-N 0.000 claims description 18
- 229930195712 glutamate Natural products 0.000 claims description 18
- WBWWGRHZICKQGZ-HZAMXZRMSA-N taurocholic acid Chemical compound C([C@H]1C[C@H]2O)[C@H](O)CC[C@]1(C)[C@@H]1[C@@H]2[C@@H]2CC[C@H]([C@@H](CCC(=O)NCCS(O)(=O)=O)C)[C@@]2(C)[C@@H](O)C1 WBWWGRHZICKQGZ-HZAMXZRMSA-N 0.000 claims description 16
- SITLTJHOQZFJGG-XPUUQOCRSA-N Glu-Val Chemical compound CC(C)[C@@H](C(O)=O)NC(=O)[C@@H](N)CCC(O)=O SITLTJHOQZFJGG-XPUUQOCRSA-N 0.000 claims description 14
- VVLXCWVSSLFQDS-QWRGUYRKSA-N gamma-Glu-Tyr Chemical compound OC(=O)[C@@H](N)CCC(=O)N[C@H](C(O)=O)CC1=CC=C(O)C=C1 VVLXCWVSSLFQDS-QWRGUYRKSA-N 0.000 claims description 14
- 108010089460 gamma-glutamyltyrosine Proteins 0.000 claims description 14
- QWYFHHGCZUCMBN-SECBINFHSA-N O-butanoyl-L-carnitine Chemical compound CCCC(=O)O[C@H](CC([O-])=O)C[N+](C)(C)C QWYFHHGCZUCMBN-SECBINFHSA-N 0.000 claims description 13
- 238000012544 monitoring process Methods 0.000 claims description 12
- 238000002965 ELISA Methods 0.000 claims description 9
- 108010015031 Glycochenodeoxycholic Acid Proteins 0.000 claims description 8
- 230000000694 effects Effects 0.000 claims description 8
- GHCZAUBVMUEKKP-GYPHWSFCSA-N glycochenodeoxycholic acid Chemical compound C([C@H]1C[C@H]2O)[C@H](O)CC[C@]1(C)[C@@H]1[C@@H]2[C@@H]2CC[C@H]([C@@H](CCC(=O)NCC(O)=O)C)[C@@]2(C)CC1 GHCZAUBVMUEKKP-GYPHWSFCSA-N 0.000 claims description 8
- 238000004949 mass spectrometry Methods 0.000 claims description 8
- 238000012216 screening Methods 0.000 claims description 8
- 238000005842 biochemical reaction Methods 0.000 claims description 7
- 230000002255 enzymatic effect Effects 0.000 claims description 7
- 238000006911 enzymatic reaction Methods 0.000 claims description 7
- XHHOHZPNYFQJKL-QWRGUYRKSA-N gamma-Glu-Phe Chemical compound OC(=O)[C@@H](N)CCC(=O)N[C@H](C(O)=O)CC1=CC=CC=C1 XHHOHZPNYFQJKL-QWRGUYRKSA-N 0.000 claims description 5
- 108010030535 gamma-glutamylphenylalanine Proteins 0.000 claims description 5
- 210000002700 urine Anatomy 0.000 claims description 5
- PHIQHXFUZVPYII-ZCFIWIBFSA-O (R)-carnitinium Chemical compound C[N+](C)(C)C[C@H](O)CC(O)=O PHIQHXFUZVPYII-ZCFIWIBFSA-O 0.000 claims description 4
- 229960004203 carnitine Drugs 0.000 claims description 4
- MYFMARDICOWMQP-YUMQZZPRSA-N gamma-Glu-Leu Chemical compound CC(C)C[C@@H](C(O)=O)NC(=O)CC[C@H](N)C(O)=O MYFMARDICOWMQP-YUMQZZPRSA-N 0.000 claims description 4
- 108010064169 gamma-glutamyl-leucine Proteins 0.000 claims description 4
- 238000000338 in vitro Methods 0.000 claims description 3
- 239000002207 metabolite Substances 0.000 description 330
- 231100000240 steatosis hepatitis Toxicity 0.000 description 195
- 230000007863 steatosis Effects 0.000 description 186
- 150000001875 compounds Chemical class 0.000 description 56
- 206010016654 Fibrosis Diseases 0.000 description 20
- 210000002381 plasma Anatomy 0.000 description 20
- 201000010099 disease Diseases 0.000 description 19
- 208000037265 diseases, disorders, signs and symptoms Diseases 0.000 description 19
- 210000004027 cell Anatomy 0.000 description 17
- 208000019425 cirrhosis of liver Diseases 0.000 description 17
- 230000003247 decreasing effect Effects 0.000 description 17
- 229940049906 glutamate Drugs 0.000 description 17
- DRTQHJPVMGBUCF-XVFCMESISA-N Uridine Chemical compound O[C@@H]1[C@H](O)[C@@H](CO)O[C@H]1N1C(=O)NC(=O)C=C1 DRTQHJPVMGBUCF-XVFCMESISA-N 0.000 description 16
- CVSVTCORWBXHQV-UHFFFAOYSA-N creatine Chemical compound NC(=[NH2+])N(C)CC([O-])=O CVSVTCORWBXHQV-UHFFFAOYSA-N 0.000 description 16
- 238000007637 random forest analysis Methods 0.000 description 16
- LFQSCWFLJHTTHZ-UHFFFAOYSA-N Ethanol Chemical compound CCO LFQSCWFLJHTTHZ-UHFFFAOYSA-N 0.000 description 15
- OUYCCCASQSFEME-QMMMGPOBSA-N L-tyrosine Chemical compound OC(=O)[C@@H](N)CC1=CC=C(O)C=C1 OUYCCCASQSFEME-QMMMGPOBSA-N 0.000 description 15
- 238000004458 analytical method Methods 0.000 description 15
- 230000007882 cirrhosis Effects 0.000 description 15
- 229960004441 tyrosine Drugs 0.000 description 15
- OUYCCCASQSFEME-UHFFFAOYSA-N tyrosine Natural products OC(=O)C(N)CC1=CC=C(O)C=C1 OUYCCCASQSFEME-UHFFFAOYSA-N 0.000 description 15
- LRFVTYWOQMYALW-UHFFFAOYSA-N 9H-xanthine Chemical compound O=C1NC(=O)NC2=C1NC=N2 LRFVTYWOQMYALW-UHFFFAOYSA-N 0.000 description 14
- 210000004185 liver Anatomy 0.000 description 14
- 238000000638 solvent extraction Methods 0.000 description 14
- 238000012360 testing method Methods 0.000 description 14
- WQZGKKKJIJFFOK-QTVWNMPRSA-N D-mannopyranose Chemical compound OC[C@H]1OC(O)[C@@H](O)[C@@H](O)[C@@H]1O WQZGKKKJIJFFOK-QTVWNMPRSA-N 0.000 description 13
- 239000008777 Glycerylphosphorylcholine Substances 0.000 description 12
- SUHOQUVVVLNYQR-MRVPVSSYSA-N choline alfoscerate Chemical compound C[N+](C)(C)CCOP([O-])(=O)OC[C@H](O)CO SUHOQUVVVLNYQR-MRVPVSSYSA-N 0.000 description 12
- 229960004956 glycerylphosphorylcholine Drugs 0.000 description 12
- 238000011282 treatment Methods 0.000 description 12
- QNAYBMKLOCPYGJ-REOHCLBHSA-N L-alanine Chemical compound C[C@H](N)C(O)=O QNAYBMKLOCPYGJ-REOHCLBHSA-N 0.000 description 11
- 235000004279 alanine Nutrition 0.000 description 11
- 235000018102 proteins Nutrition 0.000 description 11
- 108090000623 proteins and genes Proteins 0.000 description 11
- 102000004169 proteins and genes Human genes 0.000 description 11
- 150000003384 small molecules Chemical class 0.000 description 11
- 206010019708 Hepatic steatosis Diseases 0.000 description 10
- AGPKZVBTJJNPAG-WHFBIAKZSA-N L-isoleucine Chemical compound CC[C@H](C)[C@H](N)C(O)=O AGPKZVBTJJNPAG-WHFBIAKZSA-N 0.000 description 10
- LEHOTFFKMJEONL-UHFFFAOYSA-N Uric Acid Chemical compound N1C(=O)NC(=O)C2=C1NC(=O)N2 LEHOTFFKMJEONL-UHFFFAOYSA-N 0.000 description 10
- ODBLHEXUDAPZAU-UHFFFAOYSA-N isocitric acid Chemical compound OC(=O)C(O)C(C(O)=O)CC(O)=O ODBLHEXUDAPZAU-UHFFFAOYSA-N 0.000 description 10
- 229960000310 isoleucine Drugs 0.000 description 10
- AGPKZVBTJJNPAG-UHFFFAOYSA-N isoleucine Natural products CCC(C)C(N)C(O)=O AGPKZVBTJJNPAG-UHFFFAOYSA-N 0.000 description 10
- ROHFNLRQFUQHCH-YFKPBYRVSA-N L-leucine Chemical compound CC(C)C[C@H](N)C(O)=O ROHFNLRQFUQHCH-YFKPBYRVSA-N 0.000 description 9
- KZSNJWFQEVHDMF-BYPYZUCNSA-N L-valine Chemical compound CC(C)[C@H](N)C(O)=O KZSNJWFQEVHDMF-BYPYZUCNSA-N 0.000 description 9
- ROHFNLRQFUQHCH-UHFFFAOYSA-N Leucine Natural products CC(C)CC(N)C(O)=O ROHFNLRQFUQHCH-UHFFFAOYSA-N 0.000 description 9
- QIAFMBKCNZACKA-UHFFFAOYSA-N N-benzoylglycine Chemical compound OC(=O)CNC(=O)C1=CC=CC=C1 QIAFMBKCNZACKA-UHFFFAOYSA-N 0.000 description 9
- KZSNJWFQEVHDMF-UHFFFAOYSA-N Valine Natural products CC(C)C(N)C(O)=O KZSNJWFQEVHDMF-UHFFFAOYSA-N 0.000 description 9
- 208000024891 symptom Diseases 0.000 description 9
- 239000004474 valine Substances 0.000 description 9
- UNXHWFMMPAWVPI-UHFFFAOYSA-N Erythritol Natural products OCC(O)C(O)CO UNXHWFMMPAWVPI-UHFFFAOYSA-N 0.000 description 8
- JVTAAEKCZFNVCJ-UHFFFAOYSA-M Lactate Chemical compound CC(O)C([O-])=O JVTAAEKCZFNVCJ-UHFFFAOYSA-M 0.000 description 8
- FNYLWPVRPXGIIP-UHFFFAOYSA-N Triamterene Chemical compound NC1=NC2=NC(N)=NC(N)=C2N=C1C1=CC=CC=C1 FNYLWPVRPXGIIP-UHFFFAOYSA-N 0.000 description 8
- 238000000540 analysis of variance Methods 0.000 description 8
- DRTQHJPVMGBUCF-PSQAKQOGSA-N beta-L-uridine Natural products O[C@H]1[C@@H](O)[C@H](CO)O[C@@H]1N1C(=O)NC(=O)C=C1 DRTQHJPVMGBUCF-PSQAKQOGSA-N 0.000 description 8
- 229960003624 creatine Drugs 0.000 description 8
- 239000006046 creatine Substances 0.000 description 8
- 239000003596 drug target Substances 0.000 description 8
- UNXHWFMMPAWVPI-ZXZARUISSA-N erythritol Chemical compound OC[C@H](O)[C@H](O)CO UNXHWFMMPAWVPI-ZXZARUISSA-N 0.000 description 8
- 239000011159 matrix material Substances 0.000 description 8
- 230000002503 metabolic effect Effects 0.000 description 8
- 230000037361 pathway Effects 0.000 description 8
- 238000007619 statistical method Methods 0.000 description 8
- YAPQBXQYLJRXSA-UHFFFAOYSA-N theobromine Chemical compound CN1C(=O)NC(=O)C2=C1N=CN2C YAPQBXQYLJRXSA-UHFFFAOYSA-N 0.000 description 8
- DRTQHJPVMGBUCF-UHFFFAOYSA-N uracil arabinoside Natural products OC1C(O)C(CO)OC1N1C(=O)NC(=O)C=C1 DRTQHJPVMGBUCF-UHFFFAOYSA-N 0.000 description 8
- 229940045145 uridine Drugs 0.000 description 8
- 230000008238 biochemical pathway Effects 0.000 description 7
- 230000008859 change Effects 0.000 description 7
- HNDVDQJCIGZPNO-UHFFFAOYSA-N histidine Natural products OC(=O)C(N)CC1=CN=CN1 HNDVDQJCIGZPNO-UHFFFAOYSA-N 0.000 description 7
- 239000000543 intermediate Substances 0.000 description 7
- 210000001519 tissue Anatomy 0.000 description 7
- 229940075420 xanthine Drugs 0.000 description 7
- PEDCQBHIVMGVHV-UHFFFAOYSA-N Glycerine Chemical compound OCC(O)CO PEDCQBHIVMGVHV-UHFFFAOYSA-N 0.000 description 6
- OKJIRPAQVSHGFK-UHFFFAOYSA-N N-acetylglycine Chemical compound CC(=O)NCC(O)=O OKJIRPAQVSHGFK-UHFFFAOYSA-N 0.000 description 6
- HVYWMOMLDIMFJA-DPAQBDIFSA-N cholesterol Chemical compound C1C=C2C[C@@H](O)CC[C@]2(C)[C@@H]2[C@@H]1[C@@H]1CC[C@H]([C@H](C)CCCC(C)C)[C@@]1(C)CC2 HVYWMOMLDIMFJA-DPAQBDIFSA-N 0.000 description 6
- 239000003925 fat Substances 0.000 description 6
- 230000004761 fibrosis Effects 0.000 description 6
- ZDXPYRJPNDTMRX-UHFFFAOYSA-N glutamine Natural products OC(=O)C(N)CCC(N)=O ZDXPYRJPNDTMRX-UHFFFAOYSA-N 0.000 description 6
- QHKABHOOEWYVLI-UHFFFAOYSA-N 3-methyl-2-oxobutanoic acid Chemical compound CC(C)C(=O)C(O)=O QHKABHOOEWYVLI-UHFFFAOYSA-N 0.000 description 5
- XUIIKFGFIJCVMT-GFCCVEGCSA-N D-thyroxine Chemical compound IC1=CC(C[C@@H](N)C(O)=O)=CC(I)=C1OC1=CC(I)=C(O)C(I)=C1 XUIIKFGFIJCVMT-GFCCVEGCSA-N 0.000 description 5
- 239000004386 Erythritol Substances 0.000 description 5
- WQZGKKKJIJFFOK-GASJEMHNSA-N Glucose Natural products OC[C@H]1OC(O)[C@H](O)[C@@H](O)[C@@H]1O WQZGKKKJIJFFOK-GASJEMHNSA-N 0.000 description 5
- 206010061218 Inflammation Diseases 0.000 description 5
- 208000008589 Obesity Diseases 0.000 description 5
- 238000003556 assay Methods 0.000 description 5
- 229940009714 erythritol Drugs 0.000 description 5
- 235000019414 erythritol Nutrition 0.000 description 5
- 238000002290 gas chromatography-mass spectrometry Methods 0.000 description 5
- 239000008103 glucose Substances 0.000 description 5
- 230000004054 inflammatory process Effects 0.000 description 5
- 238000004895 liquid chromatography mass spectrometry Methods 0.000 description 5
- 235000020824 obesity Nutrition 0.000 description 5
- 229940034208 thyroxine Drugs 0.000 description 5
- XUIIKFGFIJCVMT-UHFFFAOYSA-N thyroxine-binding globulin Natural products IC1=CC(CC([NH3+])C([O-])=O)=CC(I)=C1OC1=CC(I)=C(O)C(I)=C1 XUIIKFGFIJCVMT-UHFFFAOYSA-N 0.000 description 5
- ZDPHROOEEOARMN-UHFFFAOYSA-N undecanoic acid Chemical compound CCCCCCCCCCC(O)=O ZDPHROOEEOARMN-UHFFFAOYSA-N 0.000 description 5
- QUNWUDVFRNGTCO-UHFFFAOYSA-N 1,7-dimethylxanthine Chemical compound N1C(=O)N(C)C(=O)C2=C1N=CN2C QUNWUDVFRNGTCO-UHFFFAOYSA-N 0.000 description 4
- WMCQWXZMVIETAO-UHFFFAOYSA-N 2-(2-carboxyethyl)-4-methyl-5-propylfuran-3-carboxylic acid Chemical compound CCCC=1OC(CCC(O)=O)=C(C(O)=O)C=1C WMCQWXZMVIETAO-UHFFFAOYSA-N 0.000 description 4
- KPGXRSRHYNQIFN-UHFFFAOYSA-L 2-oxoglutarate(2-) Chemical compound [O-]C(=O)CCC(=O)C([O-])=O KPGXRSRHYNQIFN-UHFFFAOYSA-L 0.000 description 4
- 108010053070 Glutathione Disulfide Proteins 0.000 description 4
- COLNVLDHVKWLRT-QMMMGPOBSA-N L-phenylalanine Chemical compound OC(=O)[C@@H](N)CC1=CC=CC=C1 COLNVLDHVKWLRT-QMMMGPOBSA-N 0.000 description 4
- DFPAKSUCGFBDDF-UHFFFAOYSA-N Nicotinamide Chemical compound NC(=O)C1=CC=CN=C1 DFPAKSUCGFBDDF-UHFFFAOYSA-N 0.000 description 4
- 230000006378 damage Effects 0.000 description 4
- 206010012601 diabetes mellitus Diseases 0.000 description 4
- 230000004069 differentiation Effects 0.000 description 4
- WIGCFUFOHFEKBI-UHFFFAOYSA-N gamma-tocopherol Natural products CC(C)CCCC(C)CCCC(C)CCCC1CCC2C(C)C(O)C(C)C(C)C2O1 WIGCFUFOHFEKBI-UHFFFAOYSA-N 0.000 description 4
- 235000010382 gamma-tocopherol Nutrition 0.000 description 4
- IPCSVZSSVZVIGE-UHFFFAOYSA-M hexadecanoate Chemical compound CCCCCCCCCCCCCCCC([O-])=O IPCSVZSSVZVIGE-UHFFFAOYSA-M 0.000 description 4
- 238000012317 liver biopsy Methods 0.000 description 4
- COLNVLDHVKWLRT-UHFFFAOYSA-N phenylalanine Natural products OC(=O)C(N)CC1=CC=CC=C1 COLNVLDHVKWLRT-UHFFFAOYSA-N 0.000 description 4
- YGSDEFSMJLZEOE-UHFFFAOYSA-N salicylic acid Chemical compound OC(=O)C1=CC=CC=C1O YGSDEFSMJLZEOE-UHFFFAOYSA-N 0.000 description 4
- 230000035945 sensitivity Effects 0.000 description 4
- 239000000126 substance Substances 0.000 description 4
- 238000004885 tandem mass spectrometry Methods 0.000 description 4
- 229960004559 theobromine Drugs 0.000 description 4
- QUEDXNHFTDJVIY-DQCZWYHMSA-N γ-tocopherol Chemical compound OC1=C(C)C(C)=C2O[C@@](CCC[C@H](C)CCC[C@H](C)CCCC(C)C)(C)CCC2=C1 QUEDXNHFTDJVIY-DQCZWYHMSA-N 0.000 description 4
- 239000002478 γ-tocopherol Substances 0.000 description 4
- ODHCTXKNWHHXJC-VKHMYHEASA-N 5-oxo-L-proline Chemical compound OC(=O)[C@@H]1CCC(=O)N1 ODHCTXKNWHHXJC-VKHMYHEASA-N 0.000 description 3
- UNXHWFMMPAWVPI-QWWZWVQMSA-N D-Threitol Natural products OC[C@@H](O)[C@H](O)CO UNXHWFMMPAWVPI-QWWZWVQMSA-N 0.000 description 3
- KDXKERNSBIXSRK-UHFFFAOYSA-N Lysine Natural products NCCCCC(N)C(O)=O KDXKERNSBIXSRK-UHFFFAOYSA-N 0.000 description 3
- 239000004472 Lysine Substances 0.000 description 3
- UFAHZIUFPNSHSL-UHFFFAOYSA-N O-propanoylcarnitine Chemical compound CCC(=O)OC(CC([O-])=O)C[N+](C)(C)C UFAHZIUFPNSHSL-UHFFFAOYSA-N 0.000 description 3
- LCTONWCANYUPML-UHFFFAOYSA-M Pyruvate Chemical compound CC(=O)C([O-])=O LCTONWCANYUPML-UHFFFAOYSA-M 0.000 description 3
- 238000000692 Student's t-test Methods 0.000 description 3
- BHTRKEVKTKCXOH-UHFFFAOYSA-N Taurochenodesoxycholsaeure Natural products OC1CC2CC(O)CCC2(C)C2C1C1CCC(C(CCC(=O)NCCS(O)(=O)=O)C)C1(C)CC2 BHTRKEVKTKCXOH-UHFFFAOYSA-N 0.000 description 3
- AYFVYJQAPQTCCC-UHFFFAOYSA-N Threonine Natural products CC(O)C(N)C(O)=O AYFVYJQAPQTCCC-UHFFFAOYSA-N 0.000 description 3
- 239000004473 Threonine Substances 0.000 description 3
- 238000001790 Welch's t-test Methods 0.000 description 3
- 238000009825 accumulation Methods 0.000 description 3
- 239000002253 acid Substances 0.000 description 3
- ODHCTXKNWHHXJC-UHFFFAOYSA-N acide pyroglutamique Natural products OC(=O)C1CCC(=O)N1 ODHCTXKNWHHXJC-UHFFFAOYSA-N 0.000 description 3
- 210000004369 blood Anatomy 0.000 description 3
- 239000008280 blood Substances 0.000 description 3
- 230000001413 cellular effect Effects 0.000 description 3
- 229960001231 choline Drugs 0.000 description 3
- OEYIOHPDSNJKLS-UHFFFAOYSA-N choline Chemical compound C[N+](C)(C)CCO OEYIOHPDSNJKLS-UHFFFAOYSA-N 0.000 description 3
- 238000004587 chromatography analysis Methods 0.000 description 3
- 206010073071 hepatocellular carcinoma Diseases 0.000 description 3
- 231100000844 hepatocellular carcinoma Toxicity 0.000 description 3
- 238000004128 high performance liquid chromatography Methods 0.000 description 3
- 230000000984 immunochemical effect Effects 0.000 description 3
- 238000004811 liquid chromatography Methods 0.000 description 3
- 229920002521 macromolecule Polymers 0.000 description 3
- QIQXTHQIDYTFRH-UHFFFAOYSA-N octadecanoic acid Chemical compound CCCCCCCCCCCCCCCCCC(O)=O QIQXTHQIDYTFRH-UHFFFAOYSA-N 0.000 description 3
- 238000012353 t test Methods 0.000 description 3
- BHTRKEVKTKCXOH-AYSJQVDDSA-N taurochenodeoxycholic acid Chemical compound C([C@H]1C[C@@H]2O)[C@H](O)CC[C@]1(C)C1C2C2CC[C@H]([C@@H](CCC(=O)NCCS(O)(=O)=O)C)[C@@]2(C)CC1 BHTRKEVKTKCXOH-AYSJQVDDSA-N 0.000 description 3
- AWDRATDZQPNJFN-VAYUFCLWSA-N taurodeoxycholic acid Chemical compound C([C@H]1CC2)[C@H](O)CC[C@]1(C)[C@@H]1[C@@H]2[C@@H]2CC[C@H]([C@@H](CCC(=O)NCCS(O)(=O)=O)C)[C@@]2(C)[C@@H](O)C1 AWDRATDZQPNJFN-VAYUFCLWSA-N 0.000 description 3
- -1 thryoxine Chemical compound 0.000 description 3
- VVPRQWTYSNDTEA-UHFFFAOYSA-O (3-carboxy-2-hexanoyloxypropyl)-trimethylazanium Chemical compound CCCCCC(=O)OC(CC(O)=O)C[N+](C)(C)C VVPRQWTYSNDTEA-UHFFFAOYSA-O 0.000 description 2
- FUFLCEKSBBHCMO-UHFFFAOYSA-N 11-dehydrocorticosterone Natural products O=C1CCC2(C)C3C(=O)CC(C)(C(CC4)C(=O)CO)C4C3CCC2=C1 FUFLCEKSBBHCMO-UHFFFAOYSA-N 0.000 description 2
- OYHQOLUKZRVURQ-HZJYTTRNSA-M 9-cis,12-cis-Octadecadienoate Chemical compound CCCCC\C=C/C\C=C/CCCCCCCC([O-])=O OYHQOLUKZRVURQ-HZJYTTRNSA-M 0.000 description 2
- 102100036475 Alanine aminotransferase 1 Human genes 0.000 description 2
- 108010082126 Alanine transaminase Proteins 0.000 description 2
- 108010003415 Aspartate Aminotransferases Proteins 0.000 description 2
- 102000004625 Aspartate Aminotransferases Human genes 0.000 description 2
- KWIUHFFTVRNATP-UHFFFAOYSA-N Betaine Natural products C[N+](C)(C)CC([O-])=O KWIUHFFTVRNATP-UHFFFAOYSA-N 0.000 description 2
- 101800004538 Bradykinin Proteins 0.000 description 2
- MFYSYFVPBJMHGN-ZPOLXVRWSA-N Cortisone Chemical compound O=C1CC[C@]2(C)[C@H]3C(=O)C[C@](C)([C@@](CC4)(O)C(=O)CO)[C@@H]4[C@@H]3CCC2=C1 MFYSYFVPBJMHGN-ZPOLXVRWSA-N 0.000 description 2
- MFYSYFVPBJMHGN-UHFFFAOYSA-N Cortisone Natural products O=C1CCC2(C)C3C(=O)CC(C)(C(CC4)(O)C(=O)CO)C4C3CCC2=C1 MFYSYFVPBJMHGN-UHFFFAOYSA-N 0.000 description 2
- RGHNJXZEOKUKBD-SQOUGZDYSA-M D-gluconate Chemical compound OC[C@@H](O)[C@@H](O)[C@H](O)[C@@H](O)C([O-])=O RGHNJXZEOKUKBD-SQOUGZDYSA-M 0.000 description 2
- 108090000790 Enzymes Proteins 0.000 description 2
- 102000004190 Enzymes Human genes 0.000 description 2
- 229930091371 Fructose Natural products 0.000 description 2
- RFSUNEUAIZKAJO-ARQDHWQXSA-N Fructose Chemical compound OC[C@H]1O[C@](O)(CO)[C@@H](O)[C@@H]1O RFSUNEUAIZKAJO-ARQDHWQXSA-N 0.000 description 2
- 239000005715 Fructose Substances 0.000 description 2
- DHMQDGOQFOQNFH-UHFFFAOYSA-N Glycine Chemical compound NCC(O)=O DHMQDGOQFOQNFH-UHFFFAOYSA-N 0.000 description 2
- QXZGBUJJYSLZLT-UHFFFAOYSA-N H-Arg-Pro-Pro-Gly-Phe-Ser-Pro-Phe-Arg-OH Natural products NC(N)=NCCCC(N)C(=O)N1CCCC1C(=O)N1C(C(=O)NCC(=O)NC(CC=2C=CC=CC=2)C(=O)NC(CO)C(=O)N2C(CCC2)C(=O)NC(CC=2C=CC=CC=2)C(=O)NC(CCCN=C(N)N)C(O)=O)CCC1 QXZGBUJJYSLZLT-UHFFFAOYSA-N 0.000 description 2
- 206010019663 Hepatic failure Diseases 0.000 description 2
- 208000005176 Hepatitis C Diseases 0.000 description 2
- PMMYEEVYMWASQN-DMTCNVIQSA-N Hydroxyproline Chemical compound O[C@H]1CN[C@H](C(O)=O)C1 PMMYEEVYMWASQN-DMTCNVIQSA-N 0.000 description 2
- 102100035792 Kininogen-1 Human genes 0.000 description 2
- CKLJMWTZIZZHCS-REOHCLBHSA-N L-aspartic acid Chemical compound OC(=O)[C@@H](N)CC(O)=O CKLJMWTZIZZHCS-REOHCLBHSA-N 0.000 description 2
- YGPSJZOEDVAXAB-QMMMGPOBSA-N L-kynurenine Chemical compound OC(=O)[C@@H](N)CC(=O)C1=CC=CC=C1N YGPSJZOEDVAXAB-QMMMGPOBSA-N 0.000 description 2
- JPIJQSOTBSSVTP-STHAYSLISA-N L-threonic acid Chemical compound OC[C@H](O)[C@@H](O)C(O)=O JPIJQSOTBSSVTP-STHAYSLISA-N 0.000 description 2
- KWIUHFFTVRNATP-UHFFFAOYSA-O N,N,N-trimethylglycinium Chemical compound C[N+](C)(C)CC(O)=O KWIUHFFTVRNATP-UHFFFAOYSA-O 0.000 description 2
- MTCFGRXMJLQNBG-UHFFFAOYSA-N Serine Natural products OCC(N)C(O)=O MTCFGRXMJLQNBG-UHFFFAOYSA-N 0.000 description 2
- QWCKQJZIFLGMSD-UHFFFAOYSA-N alpha-aminobutyric acid Chemical compound CCC(N)C(O)=O QWCKQJZIFLGMSD-UHFFFAOYSA-N 0.000 description 2
- 229940009098 aspartate Drugs 0.000 description 2
- 229960003237 betaine Drugs 0.000 description 2
- 239000012620 biological material Substances 0.000 description 2
- 238000001574 biopsy Methods 0.000 description 2
- 238000009534 blood test Methods 0.000 description 2
- QXZGBUJJYSLZLT-FDISYFBBSA-N bradykinin Chemical compound NC(=N)NCCC[C@H](N)C(=O)N1CCC[C@H]1C(=O)N1[C@H](C(=O)NCC(=O)N[C@@H](CC=2C=CC=CC=2)C(=O)N[C@@H](CO)C(=O)N2[C@@H](CCC2)C(=O)N[C@@H](CC=2C=CC=CC=2)C(=O)N[C@@H](CCCNC(N)=N)C(O)=O)CCC1 QXZGBUJJYSLZLT-FDISYFBBSA-N 0.000 description 2
- RYYVLZVUVIJVGH-UHFFFAOYSA-N caffeine Chemical compound CN1C(=O)N(C)C(=O)C2=C1N=CN2C RYYVLZVUVIJVGH-UHFFFAOYSA-N 0.000 description 2
- 210000001175 cerebrospinal fluid Anatomy 0.000 description 2
- 238000012512 characterization method Methods 0.000 description 2
- 229960004544 cortisone Drugs 0.000 description 2
- 238000002405 diagnostic procedure Methods 0.000 description 2
- PMMYEEVYMWASQN-UHFFFAOYSA-N dl-hydroxyproline Natural products OC1C[NH2+]C(C([O-])=O)C1 PMMYEEVYMWASQN-UHFFFAOYSA-N 0.000 description 2
- 229940079593 drug Drugs 0.000 description 2
- 239000003814 drug Substances 0.000 description 2
- 238000004817 gas chromatography Methods 0.000 description 2
- 229940050410 gluconate Drugs 0.000 description 2
- YPZRWBKMTBYPTK-BJDJZHNGSA-N glutathione disulfide Chemical compound OC(=O)[C@@H](N)CCC(=O)N[C@H](C(=O)NCC(O)=O)CSSC[C@@H](C(=O)NCC(O)=O)NC(=O)CC[C@H](N)C(O)=O YPZRWBKMTBYPTK-BJDJZHNGSA-N 0.000 description 2
- 150000004676 glycans Chemical class 0.000 description 2
- JYGXADMDTFJGBT-VWUMJDOOSA-N hydrocortisone Chemical compound O=C1CC[C@]2(C)[C@H]3[C@@H](O)C[C@](C)([C@@](CC4)(O)C(=O)CO)[C@@H]4[C@@H]3CCC2=C1 JYGXADMDTFJGBT-VWUMJDOOSA-N 0.000 description 2
- 238000001727 in vivo Methods 0.000 description 2
- 150000002500 ions Chemical class 0.000 description 2
- 229940049918 linoleate Drugs 0.000 description 2
- 201000007270 liver cancer Diseases 0.000 description 2
- 210000005229 liver cell Anatomy 0.000 description 2
- 231100000835 liver failure Toxicity 0.000 description 2
- 208000007903 liver failure Diseases 0.000 description 2
- 208000014018 liver neoplasm Diseases 0.000 description 2
- 210000005228 liver tissue Anatomy 0.000 description 2
- 230000014759 maintenance of location Effects 0.000 description 2
- 238000002483 medication Methods 0.000 description 2
- 238000002705 metabolomic analysis Methods 0.000 description 2
- 230000001431 metabolomic effect Effects 0.000 description 2
- 229960003966 nicotinamide Drugs 0.000 description 2
- 235000005152 nicotinamide Nutrition 0.000 description 2
- 239000011570 nicotinamide Substances 0.000 description 2
- 102000039446 nucleic acids Human genes 0.000 description 2
- 108020004707 nucleic acids Proteins 0.000 description 2
- 150000007523 nucleic acids Chemical class 0.000 description 2
- 210000000056 organ Anatomy 0.000 description 2
- SECPZKHBENQXJG-FPLPWBNLSA-N palmitoleic acid Chemical compound CCCCCC\C=C/CCCCCCCC(O)=O SECPZKHBENQXJG-FPLPWBNLSA-N 0.000 description 2
- FJKROLUGYXJWQN-UHFFFAOYSA-N papa-hydroxy-benzoic acid Natural products OC(=O)C1=CC=C(O)C=C1 FJKROLUGYXJWQN-UHFFFAOYSA-N 0.000 description 2
- 229920001282 polysaccharide Polymers 0.000 description 2
- 239000005017 polysaccharide Substances 0.000 description 2
- 230000008569 process Effects 0.000 description 2
- 238000003908 quality control method Methods 0.000 description 2
- 238000011002 quantification Methods 0.000 description 2
- ZHNFLHYOFXQIOW-LPYZJUEESA-N quinine sulfate dihydrate Chemical compound [H+].[H+].O.O.[O-]S([O-])(=O)=O.C([C@H]([C@H](C1)C=C)C2)C[N@@]1[C@@H]2[C@H](O)C1=CC=NC2=CC=C(OC)C=C21.C([C@H]([C@H](C1)C=C)C2)C[N@@]1[C@@H]2[C@H](O)C1=CC=NC2=CC=C(OC)C=C21 ZHNFLHYOFXQIOW-LPYZJUEESA-N 0.000 description 2
- 229960004889 salicylic acid Drugs 0.000 description 2
- 231100000241 scar Toxicity 0.000 description 2
- 230000037390 scarring Effects 0.000 description 2
- ZFXYFBGIUFBOJW-UHFFFAOYSA-N theophylline Chemical compound O=C1N(C)C(=O)N(C)C2=C1NC=N2 ZFXYFBGIUFBOJW-UHFFFAOYSA-N 0.000 description 2
- 229940022036 threonate Drugs 0.000 description 2
- LOIYMIARKYCTBW-OWOJBTEDSA-N trans-urocanic acid Chemical compound OC(=O)\C=C\C1=CNC=N1 LOIYMIARKYCTBW-OWOJBTEDSA-N 0.000 description 2
- 238000002054 transplantation Methods 0.000 description 2
- GHCZAUBVMUEKKP-UHFFFAOYSA-N ursodeoxycholic acid glycine-conjugate Natural products OC1CC2CC(O)CCC2(C)C2C1C1CCC(C(CCC(=O)NCC(O)=O)C)C1(C)CC2 GHCZAUBVMUEKKP-UHFFFAOYSA-N 0.000 description 2
- AFENDNXGAFYKQO-VKHMYHEASA-N (S)-2-hydroxybutyric acid Chemical compound CC[C@H](O)C(O)=O AFENDNXGAFYKQO-VKHMYHEASA-N 0.000 description 1
- NILQLFBWTXNUOE-UHFFFAOYSA-N 1-aminocyclopentanecarboxylic acid Chemical compound OC(=O)C1(N)CCCC1 NILQLFBWTXNUOE-UHFFFAOYSA-N 0.000 description 1
- GOLXRNDWAUTYKT-UHFFFAOYSA-N 3-(1H-indol-3-yl)propanoic acid Chemical compound C1=CC=C2C(CCC(=O)O)=CNC2=C1 GOLXRNDWAUTYKT-UHFFFAOYSA-N 0.000 description 1
- JVGVDSSUAVXRDY-UHFFFAOYSA-M 3-(4-hydroxyphenyl)lactate Chemical compound [O-]C(=O)C(O)CC1=CC=C(O)C=C1 JVGVDSSUAVXRDY-UHFFFAOYSA-M 0.000 description 1
- QHKABHOOEWYVLI-UHFFFAOYSA-M 3-methyl-2-oxobutanoate Chemical compound CC(C)C(=O)C([O-])=O QHKABHOOEWYVLI-UHFFFAOYSA-M 0.000 description 1
- JVQYSWDUAOAHFM-UHFFFAOYSA-M 3-methyl-2-oxovalerate Chemical compound CCC(C)C(=O)C([O-])=O JVQYSWDUAOAHFM-UHFFFAOYSA-M 0.000 description 1
- 208000022309 Alcoholic Liver disease Diseases 0.000 description 1
- YZXBAPSDXZZRGB-DOFZRALJSA-M Arachidonate Chemical compound CCCCC\C=C/C\C=C/C\C=C/C\C=C/CCCC([O-])=O YZXBAPSDXZZRGB-DOFZRALJSA-M 0.000 description 1
- 241000282693 Cercopithecidae Species 0.000 description 1
- WQZGKKKJIJFFOK-IVMDWMLBSA-N D-allopyranose Chemical compound OC[C@H]1OC(O)[C@H](O)[C@H](O)[C@@H]1O WQZGKKKJIJFFOK-IVMDWMLBSA-N 0.000 description 1
- RBNPOMFGQQGHHO-UWTATZPHSA-N D-glyceric acid Chemical compound OC[C@@H](O)C(O)=O RBNPOMFGQQGHHO-UWTATZPHSA-N 0.000 description 1
- KCXVZYZYPLLWCC-UHFFFAOYSA-N EDTA Chemical compound OC(=O)CN(CC(O)=O)CCN(CC(O)=O)CC(O)=O KCXVZYZYPLLWCC-UHFFFAOYSA-N 0.000 description 1
- 241000052079 Erioneuron Species 0.000 description 1
- 241000295146 Gallionellaceae Species 0.000 description 1
- 239000004471 Glycine Substances 0.000 description 1
- 108010035713 Glycodeoxycholic Acid Proteins 0.000 description 1
- 206010019799 Hepatitis viral Diseases 0.000 description 1
- SQUHHTBVTRBESD-UHFFFAOYSA-N Hexa-Ac-myo-Inositol Natural products CC(=O)OC1C(OC(C)=O)C(OC(C)=O)C(OC(C)=O)C(OC(C)=O)C1OC(C)=O SQUHHTBVTRBESD-UHFFFAOYSA-N 0.000 description 1
- LPHGQDQBBGAPDZ-UHFFFAOYSA-N Isocaffeine Natural products CN1C(=O)N(C)C(=O)C2=C1N(C)C=N2 LPHGQDQBBGAPDZ-UHFFFAOYSA-N 0.000 description 1
- ZDXPYRJPNDTMRX-VKHMYHEASA-N L-glutamine Chemical compound OC(=O)[C@@H](N)CCC(N)=O ZDXPYRJPNDTMRX-VKHMYHEASA-N 0.000 description 1
- WQZGKKKJIJFFOK-QRXFDPRISA-N L-gulose Chemical compound OC[C@@H]1OC(O)[C@@H](O)[C@@H](O)[C@@H]1O WQZGKKKJIJFFOK-QRXFDPRISA-N 0.000 description 1
- 206010067125 Liver injury Diseases 0.000 description 1
- 208000002720 Malnutrition Diseases 0.000 description 1
- 241000124008 Mammalia Species 0.000 description 1
- 241001465754 Metazoa Species 0.000 description 1
- 241000699666 Mus <mouse, genus> Species 0.000 description 1
- 206010028289 Muscle atrophy Diseases 0.000 description 1
- VVPRQWTYSNDTEA-LLVKDONJSA-N O-hexanoyl-L-carnitine Chemical compound CCCCCC(=O)O[C@H](CC([O-])=O)C[N+](C)(C)C VVPRQWTYSNDTEA-LLVKDONJSA-N 0.000 description 1
- 241000283973 Oryctolagus cuniculus Species 0.000 description 1
- 108090000340 Transaminases Proteins 0.000 description 1
- 102000003929 Transaminases Human genes 0.000 description 1
- 238000001793 Wilcoxon signed-rank test Methods 0.000 description 1
- 230000001594 aberrant effect Effects 0.000 description 1
- IPBVNPXQWQGGJP-UHFFFAOYSA-N acetic acid phenyl ester Natural products CC(=O)OC1=CC=CC=C1 IPBVNPXQWQGGJP-UHFFFAOYSA-N 0.000 description 1
- WQZGKKKJIJFFOK-PHYPRBDBSA-N alpha-D-galactose Chemical compound OC[C@H]1O[C@H](O)[C@H](O)[C@@H](O)[C@H]1O WQZGKKKJIJFFOK-PHYPRBDBSA-N 0.000 description 1
- LKDRXBCSQODPBY-BGPJRJDNSA-N alpha-L-sorbopyranose Chemical compound OC[C@@]1(O)OC[C@H](O)[C@@H](O)[C@@H]1O LKDRXBCSQODPBY-BGPJRJDNSA-N 0.000 description 1
- 230000004075 alteration Effects 0.000 description 1
- 229940024606 amino acid Drugs 0.000 description 1
- 235000001014 amino acid Nutrition 0.000 description 1
- 150000001413 amino acids Chemical class 0.000 description 1
- 238000010171 animal model Methods 0.000 description 1
- 229940114078 arachidonate Drugs 0.000 description 1
- 238000007681 bariatric surgery Methods 0.000 description 1
- WQZGKKKJIJFFOK-VFUOTHLCSA-N beta-D-glucose Chemical compound OC[C@H]1O[C@@H](O)[C@H](O)[C@@H](O)[C@@H]1O WQZGKKKJIJFFOK-VFUOTHLCSA-N 0.000 description 1
- 239000000091 biomarker candidate Substances 0.000 description 1
- 230000001851 biosynthetic effect Effects 0.000 description 1
- 230000006696 biosynthetic metabolic pathway Effects 0.000 description 1
- 230000000740 bleeding effect Effects 0.000 description 1
- 229960001948 caffeine Drugs 0.000 description 1
- VJEONQKOZGKCAK-UHFFFAOYSA-N caffeine Natural products CN1C(=O)N(C)C(=O)C2=C1C=CN2C VJEONQKOZGKCAK-UHFFFAOYSA-N 0.000 description 1
- 230000001925 catabolic effect Effects 0.000 description 1
- 238000004113 cell culture Methods 0.000 description 1
- 230000033077 cellular process Effects 0.000 description 1
- 238000006243 chemical reaction Methods 0.000 description 1
- 239000013626 chemical specie Substances 0.000 description 1
- 229940099352 cholate Drugs 0.000 description 1
- 235000012000 cholesterol Nutrition 0.000 description 1
- BHQCQFFYRZLCQQ-OELDTZBJSA-N cholic acid Chemical compound C([C@H]1C[C@H]2O)[C@H](O)CC[C@]1(C)[C@@H]1[C@@H]2[C@@H]2CC[C@H]([C@@H](CCC(O)=O)C)[C@@]2(C)[C@@H](O)C1 BHQCQFFYRZLCQQ-OELDTZBJSA-N 0.000 description 1
- 208000029078 coronary artery disease Diseases 0.000 description 1
- 239000003246 corticosteroid Substances 0.000 description 1
- 238000007821 culture assay Methods 0.000 description 1
- 210000000805 cytoplasm Anatomy 0.000 description 1
- GZCGUPFRVQAUEE-ARQDHWQXSA-N d-altrose Chemical compound OC[C@@H](O)[C@@H](O)[C@@H](O)[C@H](O)C=O GZCGUPFRVQAUEE-ARQDHWQXSA-N 0.000 description 1
- 238000003066 decision tree Methods 0.000 description 1
- 230000001419 dependent effect Effects 0.000 description 1
- 235000014113 dietary fatty acids Nutrition 0.000 description 1
- DVSZKTAMJJTWFG-UHFFFAOYSA-N docosa-2,4,6,8,10,12-hexaenoic acid Chemical compound CCCCCCCCCC=CC=CC=CC=CC=CC=CC(O)=O DVSZKTAMJJTWFG-UHFFFAOYSA-N 0.000 description 1
- 230000008482 dysregulation Effects 0.000 description 1
- 238000011156 evaluation Methods 0.000 description 1
- 229930195729 fatty acid Natural products 0.000 description 1
- 239000000194 fatty acid Substances 0.000 description 1
- 150000004665 fatty acids Chemical class 0.000 description 1
- 239000012530 fluid Substances 0.000 description 1
- 230000004907 flux Effects 0.000 description 1
- 235000013305 food Nutrition 0.000 description 1
- 230000006870 function Effects 0.000 description 1
- 229930182830 galactose Natural products 0.000 description 1
- 238000001415 gene therapy Methods 0.000 description 1
- 238000007429 general method Methods 0.000 description 1
- WVULKSPCQVQLCU-BUXLTGKBSA-N glycodeoxycholic acid Chemical compound C([C@H]1CC2)[C@H](O)CC[C@]1(C)[C@@H]1[C@@H]2[C@@H]2CC[C@H]([C@@H](CCC(=O)NCC(O)=O)C)[C@@]2(C)[C@@H](O)C1 WVULKSPCQVQLCU-BUXLTGKBSA-N 0.000 description 1
- 230000036541 health Effects 0.000 description 1
- 231100000234 hepatic damage Toxicity 0.000 description 1
- 230000002440 hepatic effect Effects 0.000 description 1
- 208000006454 hepatitis Diseases 0.000 description 1
- 231100000283 hepatitis Toxicity 0.000 description 1
- 210000003494 hepatocyte Anatomy 0.000 description 1
- 229960000890 hydrocortisone Drugs 0.000 description 1
- 229960002591 hydroxyproline Drugs 0.000 description 1
- 238000003384 imaging method Methods 0.000 description 1
- 238000005462 in vivo assay Methods 0.000 description 1
- CDAISMWEOUEBRE-GPIVLXJGSA-N inositol Chemical compound O[C@H]1[C@H](O)[C@@H](O)[C@H](O)[C@H](O)[C@@H]1O CDAISMWEOUEBRE-GPIVLXJGSA-N 0.000 description 1
- 229960000367 inositol Drugs 0.000 description 1
- 210000000936 intestine Anatomy 0.000 description 1
- 150000002605 large molecules Chemical class 0.000 description 1
- DTOSIQBPPRVQHS-PDBXOOCHSA-M linolenate Chemical compound CC\C=C/C\C=C/C\C=C/CCCCCCCC([O-])=O DTOSIQBPPRVQHS-PDBXOOCHSA-M 0.000 description 1
- 150000002632 lipids Chemical class 0.000 description 1
- 230000008818 liver damage Effects 0.000 description 1
- 230000005976 liver dysfunction Effects 0.000 description 1
- 238000007449 liver function test Methods 0.000 description 1
- 230000001071 malnutrition Effects 0.000 description 1
- 235000000824 malnutrition Nutrition 0.000 description 1
- 238000004519 manufacturing process Methods 0.000 description 1
- 239000000463 material Substances 0.000 description 1
- 210000003470 mitochondria Anatomy 0.000 description 1
- 238000012986 modification Methods 0.000 description 1
- 230000004048 modification Effects 0.000 description 1
- 201000000585 muscular atrophy Diseases 0.000 description 1
- 230000035772 mutation Effects 0.000 description 1
- 239000002773 nucleotide Substances 0.000 description 1
- 125000003729 nucleotide group Chemical group 0.000 description 1
- 208000015380 nutritional deficiency disease Diseases 0.000 description 1
- 210000003463 organelle Anatomy 0.000 description 1
- 238000012261 overproduction Methods 0.000 description 1
- 229940049953 phenylacetate Drugs 0.000 description 1
- WLJVXDMOQOGPHL-UHFFFAOYSA-N phenylacetic acid Chemical compound OC(=O)CC1=CC=CC=C1 WLJVXDMOQOGPHL-UHFFFAOYSA-N 0.000 description 1
- ZHFMVVUVCALAMY-UHFFFAOYSA-N pipecolate Natural products OC1CNC(C(O)=O)C(O)C1O ZHFMVVUVCALAMY-UHFFFAOYSA-N 0.000 description 1
- 230000002441 reversible effect Effects 0.000 description 1
- 238000005070 sampling Methods 0.000 description 1
- 238000007423 screening assay Methods 0.000 description 1
- CDAISMWEOUEBRE-UHFFFAOYSA-N scyllo-inosotol Natural products OC1C(O)C(O)C(O)C(O)C1O CDAISMWEOUEBRE-UHFFFAOYSA-N 0.000 description 1
- 230000011664 signaling Effects 0.000 description 1
- 238000000528 statistical test Methods 0.000 description 1
- 239000000758 substrate Substances 0.000 description 1
- 235000000346 sugar Nutrition 0.000 description 1
- 150000008163 sugars Chemical class 0.000 description 1
- 229960000278 theophylline Drugs 0.000 description 1
- 238000002560 therapeutic procedure Methods 0.000 description 1
- 231100000331 toxic Toxicity 0.000 description 1
- 230000002588 toxic effect Effects 0.000 description 1
- PMMYEEVYMWASQN-IMJSIDKUSA-N trans-4-Hydroxy-L-proline Natural products O[C@@H]1CN[C@H](C(O)=O)C1 PMMYEEVYMWASQN-IMJSIDKUSA-N 0.000 description 1
- FGMPLJWBKKVCDB-UHFFFAOYSA-N trans-L-hydroxy-proline Chemical group ON1CCCC1C(O)=O FGMPLJWBKKVCDB-UHFFFAOYSA-N 0.000 description 1
- 150000003626 triacylglycerols Chemical class 0.000 description 1
- UFTFJSFQGQCHQW-UHFFFAOYSA-N triformin Chemical compound O=COCC(OC=O)COC=O UFTFJSFQGQCHQW-UHFFFAOYSA-N 0.000 description 1
- 238000011144 upstream manufacturing Methods 0.000 description 1
- 201000001862 viral hepatitis Diseases 0.000 description 1
- 230000004580 weight loss Effects 0.000 description 1
- 125000003810 γ-tocopherol group Chemical group 0.000 description 1
Images


Classifications
-
- G—PHYSICS
- G01—MEASURING; TESTING
- G01N—INVESTIGATING OR ANALYSING MATERIALS BY DETERMINING THEIR CHEMICAL OR PHYSICAL PROPERTIES
- G01N33/00—Investigating or analysing materials by specific methods not covered by groups G01N1/00 - G01N31/00
- G01N33/48—Biological material, e.g. blood, urine; Haemocytometers
- G01N33/50—Chemical analysis of biological material, e.g. blood, urine; Testing involving biospecific ligand binding methods; Immunological testing
- G01N33/68—Chemical analysis of biological material, e.g. blood, urine; Testing involving biospecific ligand binding methods; Immunological testing involving proteins, peptides or amino acids
- G01N33/6893—Chemical analysis of biological material, e.g. blood, urine; Testing involving biospecific ligand binding methods; Immunological testing involving proteins, peptides or amino acids related to diseases not provided for elsewhere
-
- H—ELECTRICITY
- H01—ELECTRIC ELEMENTS
- H01J—ELECTRIC DISCHARGE TUBES OR DISCHARGE LAMPS
- H01J49/00—Particle spectrometers or separator tubes
- H01J49/0027—Methods for using particle spectrometers
-
- G—PHYSICS
- G01—MEASURING; TESTING
- G01N—INVESTIGATING OR ANALYSING MATERIALS BY DETERMINING THEIR CHEMICAL OR PHYSICAL PROPERTIES
- G01N2500/00—Screening for compounds of potential therapeutic value
-
- G—PHYSICS
- G01—MEASURING; TESTING
- G01N—INVESTIGATING OR ANALYSING MATERIALS BY DETERMINING THEIR CHEMICAL OR PHYSICAL PROPERTIES
- G01N2570/00—Omics, e.g. proteomics, glycomics or lipidomics; Methods of analysis focusing on the entire complement of classes of biological molecules or subsets thereof, i.e. focusing on proteomes, glycomes or lipidomes
-
- G—PHYSICS
- G01—MEASURING; TESTING
- G01N—INVESTIGATING OR ANALYSING MATERIALS BY DETERMINING THEIR CHEMICAL OR PHYSICAL PROPERTIES
- G01N2800/00—Detection or diagnosis of diseases
- G01N2800/08—Hepato-biliairy disorders other than hepatitis
- G01N2800/085—Liver diseases, e.g. portal hypertension, fibrosis, cirrhosis, bilirubin
-
- G—PHYSICS
- G01—MEASURING; TESTING
- G01N—INVESTIGATING OR ANALYSING MATERIALS BY DETERMINING THEIR CHEMICAL OR PHYSICAL PROPERTIES
- G01N2800/00—Detection or diagnosis of diseases
- G01N2800/52—Predicting or monitoring the response to treatment, e.g. for selection of therapy based on assay results in personalised medicine; Prognosis
-
- G—PHYSICS
- G01—MEASURING; TESTING
- G01N—INVESTIGATING OR ANALYSING MATERIALS BY DETERMINING THEIR CHEMICAL OR PHYSICAL PROPERTIES
- G01N2800/00—Detection or diagnosis of diseases
- G01N2800/56—Staging of a disease; Further complications associated with the disease
-
- G—PHYSICS
- G01—MEASURING; TESTING
- G01N—INVESTIGATING OR ANALYSING MATERIALS BY DETERMINING THEIR CHEMICAL OR PHYSICAL PROPERTIES
- G01N2800/00—Detection or diagnosis of diseases
- G01N2800/60—Complex ways of combining multiple protein biomarkers for diagnosis
-
- Y—GENERAL TAGGING OF NEW TECHNOLOGICAL DEVELOPMENTS; GENERAL TAGGING OF CROSS-SECTIONAL TECHNOLOGIES SPANNING OVER SEVERAL SECTIONS OF THE IPC; TECHNICAL SUBJECTS COVERED BY FORMER USPC CROSS-REFERENCE ART COLLECTIONS [XRACs] AND DIGESTS
- Y10—TECHNICAL SUBJECTS COVERED BY FORMER USPC
- Y10T—TECHNICAL SUBJECTS COVERED BY FORMER US CLASSIFICATION
- Y10T436/00—Chemistry: analytical and immunological testing
- Y10T436/14—Heterocyclic carbon compound [i.e., O, S, N, Se, Te, as only ring hetero atom]
- Y10T436/142222—Hetero-O [e.g., ascorbic acid, etc.]
- Y10T436/143333—Saccharide [e.g., DNA, etc.]
-
- Y—GENERAL TAGGING OF NEW TECHNOLOGICAL DEVELOPMENTS; GENERAL TAGGING OF CROSS-SECTIONAL TECHNOLOGIES SPANNING OVER SEVERAL SECTIONS OF THE IPC; TECHNICAL SUBJECTS COVERED BY FORMER USPC CROSS-REFERENCE ART COLLECTIONS [XRACs] AND DIGESTS
- Y10—TECHNICAL SUBJECTS COVERED BY FORMER USPC
- Y10T—TECHNICAL SUBJECTS COVERED BY FORMER US CLASSIFICATION
- Y10T436/00—Chemistry: analytical and immunological testing
- Y10T436/16—Phosphorus containing
- Y10T436/163333—Organic [e.g., chemical warfare agents, insecticides, etc.]
-
- Y—GENERAL TAGGING OF NEW TECHNOLOGICAL DEVELOPMENTS; GENERAL TAGGING OF CROSS-SECTIONAL TECHNOLOGIES SPANNING OVER SEVERAL SECTIONS OF THE IPC; TECHNICAL SUBJECTS COVERED BY FORMER USPC CROSS-REFERENCE ART COLLECTIONS [XRACs] AND DIGESTS
- Y10—TECHNICAL SUBJECTS COVERED BY FORMER USPC
- Y10T—TECHNICAL SUBJECTS COVERED BY FORMER US CLASSIFICATION
- Y10T436/00—Chemistry: analytical and immunological testing
- Y10T436/20—Oxygen containing
- Y10T436/200833—Carbonyl, ether, aldehyde or ketone containing
Definitions
- the invention generally relates to biomarkers for fatty liver disease and methods based on the same biomarkers.
- Fatty change in the liver results from excessive accumulation of lipids within hepatocytes.
- Fatty liver is the accumulation of triglycerides and other fats in the liver cells.
- Fatty liver disease can range from fatty liver alone (simple fatty liver, steatosis) to fatty liver associated with hepatic inflammation (steatohepatitis). Although having fat in the liver is not normal, by itself it probably causes little harm or permanent damage. Steatosis is generally believed to be a benign condition, with rare progression to chronic liver disease. In contrast, steatohepatitis may progress to liver fibrosis and cirrhosis, can be associated with hepatocellular carcinoma and may result in liver-related morbidity and mortality.
- Steatosis can occur with the use of alcohol (alcohol-related fatty liver) or in the absence of alcohol (nonalcoholic fatty liver disease, NAFLD).
- Steatohepatitis may be related to alcohol-induced hepatic damage or may be unrelated to alcohol. If steatohepatitis is present but a history of alcohol use is not, the condition is termed nonalcoholic steatohepatitis (NASH).
- NASH nonalcoholic steatohepatitis
- NASH simple fatty liver
- fibrosis develop cirrhosis after 10 years.
- NASH is the most common liver disease among adolescents and is the third most common cause of chronic liver disease in adults (after hepatitis C and alcohol).
- NASH is usually a silent disease with few or no symptoms. Patients generally feel well in the early stages and only begin to have symptoms-such as fatigue, weight loss, and weakness-once the disease is more advanced or cirrhosis develops.
- the progression of NASH can take years, even decades. The process can stop and, in some cases, reverse on its own without specific therapy. Or NASH can slowly worsen, causing scarring or "fibrosis" to appear and accumulate in the liver. As fibrosis worsens, cirrhosis develops; the liver becomes seriously scarred, hardened, and unable to function normally. Not every person with NASH develops cirrhosis, but once serious scarring or cirrhosis is present, few treatments can halt the progression.
- NASH ranks as one of the major causes of cirrhosis in America, behind hepatitis C and alcoholic liver disease.
- NASH is usually first suspected in a person who is found to have elevations in liver tests that are included in routine blood test panels, such as alanine aminotransferase (ALT) or aspartate aminotransferase (AST). When further evaluation shows no apparent reason for liver disease (such as medications, viral hepatitis, or excessive use of alcohol) and when x-rays or imaging studies of the liver show fat, NASH is suspected.
- the only means of proving a diagnosis of NASH and separating it from simple fatty liver is a liver biopsy. A liver biopsy requires a needle to be inserted through the skin and the removal of a small piece of the liver. If the tissue shows fat without inflammation and damage, simple fatty liver or NAFLD is diagnosed.
- NASH is diagnosed when microscopic examination of the tissue shows fat along with inflammation and damage to liver cells. A biopsy is required to determine whether scar tissue has developed in the liver. Currently, no blood tests or scans can reliably provide this information. Therefore there exists a need for a less invasive diagnostic method (i.e. a method that would not require a biopsy).
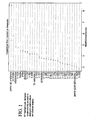
- Figure 1 provides one embodiment of biomarker compounds that are important in distinguishing steatosis subjects and Control subjects.
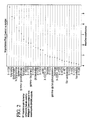
- Figure 2 provides one embodiment of biomarker compounds that are important in distinguishing steatohepatitis subjects from control subjects.
- Figure 3 provides an embodiment of biomarker compounds that are important in distinguishing steatosis, steatohepatitis and control subjects.
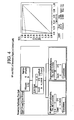
- Figure 4 provides one example of recursive partitioning results showing the classification of Control and steatosis subjects using the biomarkers identified in Table 8.
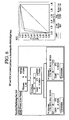
- Figure 5 provides an example of recursive partitioning results showing the classification of steatosis and steatohepatitis (NASH, SH) using the biomarkers listed in Table 9.
- Figure 6 provides an example of recursive partitioning results showing the classification of control and steatohepatitis using the biomarkers listed in Table 10.
- Figure 7 provides an example of recursive partitioning results showing the use of the biomarkers to classify steatosis, steatohepatitis and control subjects using the biomarkers listed in Table 11.
- the present disclosure relates to biomarkers of steatosis and steatohepatitis, methods for diagnosis (or assisting in the diagnosis) of steatosis and/or steatohepatitis, methods of distinguishing between hepatic steatosis and steatohepatitis, methods of distinguishing between NAFLD and NASH, methods of determining predisposition to steatohepatitis, fibrosis and cirrhosis, methods of monitoring progression/regression of steatohepatitis, methods of assessing efficacy of compositions for treating steatohepatitis, methods of screening compositions for activity in modulating biomarkers of steatohepatitis, methods of treating steatohepatitis, as well as other methods based on biomarkers of steatosis and steatohepatitis.
- Biomarker means a compound, preferably a metabolite, that is differentially present (i.e., increased or decreased) in a biological sample from a subject or a group of subjects having a first phenotype (e.g., having a disease) as compared to a biological sample from a subject or group of subjects having a second phenotype (e.g., not having the disease).
- a biomarker may be differentially present at any level, but is generally present at a level that is increased by at least 5%, by at least 10%, by at least 15%, by at least 20%, by at least 25%, by at least 30%, by at least 35%, by at least 40%, by at least 45%, by at least 50%, by at least 55%, by at least 60%, by at least 65%, by at least 70%, by at least 75%, by at least 80%, by at least 85%, by at least 90%, by at least 95%, by at least 100%, by at least 110%, by at least 120%, by at least 130%, by at least 140%, by at least 150%, or more; or is generally present at a level that is decreased by at least 5%, by at least 10%, by at least 15%, by at least 20%, by at least 25%, by at least 30%, by at least 35%, by at least 40%, by at least 45%, by at least 50%, by at least 55%, by at least 60%, by at least 65%, by at least 70%, by at
- a biomarker is preferably differentially present at a level that is statistically significant (i.e., a p-value less than 0.05 and/or a q-value of less than 0.10 as determined using either Welch's T-test or Wilcoxon's rank-sum Test).
- the "level" of one or more biomarkers means the absolute or relative amount or concentration of the biomarker in the sample.
- sample or “biological sample” means biological material isolated from a subject.
- the biological sample may contain any biological material suitable for detecting the desired biomarkers, and may comprise cellular and/or non-cellular material from the subject.
- the sample can be isolated from any suitable biological tissue or fluid such as, for example, tissue, blood, blood plasma, urine, or cerebral spinal fluid (CSF).
- CSF cerebral spinal fluid
- Subject means any animal, but is preferably a mammal, such as, for example, a human, monkey, non-human primate, mouse, or rabbit.
- a “reference level" of a biomarker means a level of the biomarker that is indicative of a particular disease state, phenotype, or predisposition to developing a particular disease state or phenotype, or lack thereof, as well as combinations of disease states, phenotypes, or predisposition to developing a particular disease state or phenotype, or lack thereof.
- a “positive" reference level of a biomarker means a level that is indicative of a particular disease state or phenotype.
- a “negative” reference level of a biomarker means a level that is indicative of a lack of a particular disease state or phenotype.
- a "NASH-positive reference level" of a biomarker means a level of a biomarker that is indicative of a positive diagnosis of NASH in a subject
- a "NASH-negative reference level” of a biomarker means a level of a biomarker that is indicative of a negative diagnosis of NASH in a subject.
- a “reference level" of a biomarker may be an absolute or relative amount or concentration of the biomarker, a presence or absence of the biomarker, a range of amount or concentration of the biomarker, a minimum and/or maximum amount or concentration of the biomarker, a mean amount or concentration of the biomarker, and/or a median amount or concentration of the biomarker; and, in addition, “reference levels” of combinations of biomarkers may also be ratios of absolute or relative amounts or concentrations of two or more biomarkers with respect to each other.
- Appropriate positive and negative reference levels of biomarkers for a particular disease state, phenotype, or lack thereof may be determined by measuring levels of desired biomarkers in one or more appropriate subjects, and such reference levels may be tailored to specific populations of subjects (e.g., a reference level may be age-matched or gender-matched so that comparisons may be made between biomarker levels in samples from subjects of a certain age or gender and reference levels for a particular disease state, phenotype, or lack thereof in a certain age or gender group). Such reference levels may also be tailored to specific techniques that are used to measure levels of biomarkers in biological samples (e.g., LC-MS, GC-MS, etc.), where the levels of biomarkers may differ based on the specific technique that is used.
- Non-biomarker compound means a compound that is not differentially present in a biological sample from a subject or a group of subjects having a first phenotype (e.g., having a first disease) as compared to a biological sample from a subject or group of subjects having a second phenotype (e.g., not having the first disease).
- Such non-biomarker compounds may, however, be biomarkers in a biological sample from a subject or a group of subjects having a third phenotype (e.g., having a second disease) as compared to the first phenotype (e.g., having the first disease) or the second phenotype (e.g., not having the first disease).
- Metal means organic and inorganic molecules which are present in a cell.
- the term does not include large macromolecules, such as large proteins (e.g., proteins with molecular weights over 2,000, 3,000, 4,000, 5,000, 6,000, 7,000, 8,000, 9,000, or 10,000), large nucleic acids (e.g., nucleic acids with molecular weights of over 2,000, 3,000, 4,000, 5,000, 6,000, 7,000, 8,000, 9,000, or 10,000), or large polysaccharides (e.g., polysaccharides with a molecular weights of over 2,000, 3,000, 4,000, 5,000, 6,000, 7,000, 8,000, 9,000, or 10,000).
- large proteins e.g., proteins with molecular weights over 2,000, 3,000, 4,000, 5,000, 6,000, 7,000, 8,000, 9,000, or 10,000
- nucleic acids e.g., nucleic acids with molecular weights of over 2,000, 3,000, 4,000
- small molecules of the cell are generally found free in solution in the cytoplasm or in other organelles, such as the mitochondria, where they form a pool of intermediates which can be metabolized further or used to generate large molecules, called macromolecules.
- the term "small molecules” includes signaling molecules and intermediates in the chemical reactions that transform energy derived from food into usable forms. Examples of small molecules include sugars, fatty acids, amino acids, nucleotides, intermediates formed during cellular processes, and other small molecules found within the cell.
- Metal profile or “small molecule profile” means a complete or partial inventory of small molecules within a targeted cell, tissue, organ, organism, or fraction thereof(e.g., cellular compartment).
- the inventory may include the quantity and/or type of small molecules present.
- the "small molecule profile” may be determined using a single technique or multiple different techniques.
- Methods means all of the small molecules present in a given organism.
- Stepsis refers to fatty liver disease without the presence of inflammation. The condition can occur with the use of alcohol or in the absence of alcohol use.
- Non-alcoholic fatty liver disease refers to fatty liver disease (steatosis) that occurs in subjects even in the absence of consumption of alcohol in amounts considered harmful to the liver.
- Steatohepatitis refers to fatty liver disease that is associated with inflammation. Steatohepatitis can progress to cirrhosis and can be associated with hepatocellular carcinoma. The condition can occur with the use of alcohol or in the absence of alcohol use.
- Non-alcoholic steatohepatitis refers to steatohepatitis that occurs in subjects even in the absence of consumption of alcohol in amounts considered harmful to the liver. NASH can progress to cirrhosis and can be associated with hepatocellular carcinoma.
- metabolic profiles were determined for biological samples from human subjects diagnosed with steatosis as well as from one or more other groups of human subjects (e.g., healthy control subjects not diagnosed with steatosis), as well as from human subjects diagnosed with NASH.
- the metabolic profile for biological samples from a subject having steatosis was compared to the metabolic profile for biological samples from the one or more other groups of subjects.
- Those molecules differentially present, including those molecules differentially present at a level that is statistically significant, in the metabolic profile of samples from subjects with steatosis as compared to another group (e.g., healthy control subjects not diagnosed with steatosis) were identified as biomarkers to distinguish those groups.
- those molecules differentially present, including those molecules differentially present at a level that is statistically significant, in the metabolic profile of samples from subjects with steatosis as compared to NASH were also identified as biomarkers to distinguish those groups.
- biomarkers are discussed in more detail herein.
- the biomarkers that were discovered correspond with the following group(s):
- biomarkers compounds Although the identities of some of the biomarkers compounds are not known at this time, such identities are not necessary for the identification of the biomarkers in biological samples from subjects, as the "unnamed” compounds have been sufficiently characterized by analytical techniques to allow such identification. The analytical characterization of all such “unnamed” compounds is listed in the Examples. Such "unnamed” biomarkers are designated herein using the nomenclature “Metabolite” followed by a specific metabolite number.
- biomarkers may be used in the methods disclosed herein. That is, the disclosed methods may include the determination of the level(s) of one biomarker, two or more biomarkers, three or more biomarkers, four or more biomarkers, five or more biomarkers, six or more biomarkers, seven or more biomarkers, eight or more biomarkers, nine or more biomarkers, ten or more biomarkers, fifteen or more biomarkers, etc., including a combination of all of the biomarkers in each or all of Tables 1, 2, 3, 4B, 5B, 6B, 8, 9, 11, 12, 13, Figure 1 , Figure 3 or any fraction or combination thereof.
- the number of biomarkers for use in the disclosed methods include the levels of about thirty or less biomarkers, twenty-five or less, twenty or less, fifteen or less, ten or less, nine or less, eight or less, seven or less, six or less, five or less biomarkers. In another aspect, the number of biomarkers for use in the disclosed methods include the levels of one, two, three, four, five, six, seven, eight, nine, ten, eleven, twelve, thirteen, fourteen, fifteen, twenty, twenty-five, or thirty biomarkers.
- the methods disclosed herein using the biomarkers listed in the tables may be used in combination with clinical diagnostic measures of fatty liver diseases. Combinations with clinical diagnostics may facilitate the disclosed methods, or confirm results of the disclosed methods (for example, facilitating or confirming diagnosis, monitoring progression or regression, and/or determining predisposition to fatty liver diseases).
- a method of diagnosing (or aiding in diagnosing) whether a subject has steatosis comprises (1) analyzing a biological sample from a subject to determine the level(s) of one or more biomarkers of steatosis in the sample and (2) comparing the level(s) of the one or more biomarkers in the sample to steatosis-positive and/or steatosis-negative reference levels of the one or more biomarkers in order to diagnose (or aid in the diagnosis of) whether the subject has steatosis.
- the one or more biomarkers that are used are selected from Tables 2, 3, 4B, 5B, 8, 9, 11, 12, 13, Figure 1 , Figure 3 and combinations thereof.
- the results of the method may be used along with other methods (or the results thereof) useful in the clinical determination of whether a subject has steatosis.
- the method comprises (1) analyzing a biological sample from a subject to determine the level(s) of one or more biomarkers of steatosis in the sample and (2) comparing the level(s) of the one or more biomarkers in the sample to steatosis-positive and/or steatosis-negative reference levels of the one or more biomarkers in order to diagnose (or aid in the diagnosis of) whether the subject has steatosis, and the one or more biomarkers that are used are selected from Tables 2, 3, 4B, 5B, 8, 9, 11, 12, 13, Figure 1 , Figure 3 and combinations thereof.
- the method comprises (1) analyzing a biological sample from a subject to determine the level(s) of one or more biomarkers of steatohepatitis in the sample and (2) comparing the level(s) of the one or more biomarkers in the sample to steatohepatitis-positive and/or steatohepatitis-negative reference levels of the one or more biomarkers in order to diagnose (or aid in the diagnosis of) whether the subject has steatohepatitis, and the one or more biomarkers that are used are selected from Tables 1, 3, 4B, 6B, 9, 10, 11, 12, 13, Figure 2 , Figure 3 and combinations thereof.
- the method comprises (1) analyzing a biological sample from a subject to determine the level(s) of one or more biomarkers of NASH in the sample and (2) comparing the level(s) of the one or more biomarkers in the sample to NASH-positive and/or NASH-negative reference levels of the one or more biomarkers in order to diagnose (or aid in the diagnosis of) whether the subject has NASH, and the one or more biomarkers that are used are selected from Tables 1, 3, 4B, 6B, 9, 10, 11, 12, 13, Figure 2 , Figure 3 and combinations thereof.
- any suitable method may be used to analyze the biological sample in order to determine the level(s) of the one or more biomarkers in the sample. Suitable methods include chromatography (e.g., HPLC, gas chromatography, liquid chromatography), mass spectrometry (e.g., MS, MS-MS), enzymatic or biochemical reactions, clinical chemistry, enzyme-linked immunosorbent assay (ELISA), antibody linkage, other immunochemical techniques, and combinations thereof. Further, the level(s) of the one or more biomarkers may be measured indirectly, for example, by using an assay that measures the level of a compound (or compounds) that correlates with the level of the biomarker(s) that are desired to be measured.
- chromatography e.g., HPLC, gas chromatography, liquid chromatography
- mass spectrometry e.g., MS, MS-MS
- enzymatic or biochemical reactions e.g., clinical chemistry
- enzyme-linked immunosorbent assay e.g., enzyme-linked immuno
- the levels of one or more of the biomarkers of Tables 1, 2, 3, 4B, 5B, 6B, 8, 9, 10, 11, 12, 13, Figure 1 , Figure 2 , Figure 3 may be determined in the methods of diagnosing and methods of aiding in diagnosing whether a subject has steatosis or steatohepatitis.
- Determining levels of combinations of the biomarkers may allow greater sensitivity and specificity in diagnosing steatosis and aiding in the diagnosis of steatosis, and may allow better differentiation of steatosis from other liver disorders (e.g. fibrosis, cirrhosis, liver cancer, etc.) that may have similar or overlapping biomarkers to steatosis (as compared to a subject not having steatosis).
- liver disorders e.g. fibrosis, cirrhosis, liver cancer, etc.
- ratios of the levels of certain biomarkers (and non-biomarker compounds) in biological samples may allow greater sensitivity and specificity in diagnosing steatosis and aiding in the diagnosis of steatosis and may allow better differentiation of steatosis from other liver disorders that may have similar or overlapping biomarkers to steatosis (as compared to a subject not having steatosis).
- biomarkers that are specific for diagnosing steatosis or steatohepatitis (or aiding in diagnosing steatosis or steatohepatitis) in a certain type of sample (e.g., liver tissue sample, liver biopsy, urine sample, or blood plasma sample) may also be used.
- a certain type of sample e.g., liver tissue sample, liver biopsy, urine sample, or blood plasma sample
- the biological sample is plasma
- one or more biomarkers listed in Tables 2, 4B, 5B, 8, 11, 12, 13, Figure 1 , Figure 3 may be used to diagnose (or aid in diagnosing) whether a subject has steatosis.
- the level(s) of the one or more biomarkers in the sample are determined, the level(s) are compared to steatosis-positive and/or steatosis-negative reference levels (or steatohepatitis-positive and/or steatohepatitis-negative reference levels) to aid in diagnosing or to diagnose whether the subject has steatosis (or steatohepatitis).
- Levels of the one or more biomarkers in a sample matching the steatosis-positive reference levels are indicative of a diagnosis of steatosis in the subject.
- Levels of the one or more biomarkers in a sample matching the steatosis-negative reference levels are indicative of a diagnosis of no steatosis in the subject.
- levels of the one or more biomarkers that are differentially present (especially at a level that is statistically significant) in the sample as compared to steatosis-negative reference levels are indicative of a diagnosis of steatosis in the subject.
- levels of the one or more biomarkers that are differentially present (especially at a level that is statistically significant) in the sample as compared to steatosis-positive reference levels are indicative of a diagnosis of no steatosis in the subject.
- the level(s) of the one or more biomarkers may be compared to steatosis-positive and/or steatosis-negative and/or steatohepatitis-positive and/or steatohepatitis-negative reference levels using various techniques, including a simple comparison (e.g., a manual comparison) of the level(s) of the one or more biomarkers in the biological sample to steatosis-positive and/or steatosis-negative and/or steatohepatitis-positive and/or steatohepatitis-negative reference levels.
- a simple comparison e.g., a manual comparison
- the level(s) of the one or more biomarkers in the biological sample may also be compared to steatosis-positive and/or steatosis-negative and/or steatohepatitis-positive and/or steatohepatitis-negative reference levels using one or more statistical analyses (e.g., t-test, Welch's T-test, Wilcoxon's rank sum test, ANOVA, recursive partitioning, random forest).
- statistical analyses e.g., t-test, Welch's T-test, Wilcoxon's rank sum test, ANOVA, recursive partitioning, random forest.
- the biological samples may be analyzed to determine the level(s) of one or more non-biomarker compounds.
- the level(s) of such non-biomarker compounds may also allow differentiation of steatosis from other liver disorders that may have similar or overlapping biomarkers to steatosis and/or steatohepatitis (as compared to a subject not having a liver disorder).
- a known non-biomarker compound present in biological samples of subjects having steatosis and subjects not having steatosis could be monitored to verify a diagnosis of steatosis as compared to a diagnosis of another liver disorder when biological samples from subjects having the liver disorder do not have the non-biomarker compound.
- the methods of diagnosing (or aiding in diagnosing) whether a subject has steatosis may also be conducted specifically to diagnose (or aid in diagnosing) whether a subject has NAFLD and/or steatohepatitis (e.g. NASH).
- Such methods comprise (1) analyzing a biological sample from a subject to determine the level(s) of one or more biomarkers of NAFLD (and/or NASH) in the sample and (2) comparing the level(s) of the one or more biomarkers in the sample to NAFLD-positive and/or NAFLD-negative reference levels (or NASH-positive and/or NASH-negative reference levels) in order to diagnose (or aid in the diagnosis of) whether the subject has NAFLD (or NASH).
- Biomarker specific for NAFLD are listed in Tables 2, 4B, 5B, 8, 11, 12, 13, Figure 1 , Figure 3 and biomarkers specific for NASH are listed in Tables 1, 4B, 6B, 10, 11, 12, 13, Figure 2 , Figure 3 .
- a method of distinguishing NAFLD from NASH in a subject having steatosis comprises (1) analyzing a biological sample from a subject to determine the level(s) in the sample of one or more biomarkers of NAFLD that distinguish over NASH and/or one or more biomarkers of NASH that distinguish over NAFLD, and (2) comparing the level(s) of the one or more biomarkers in the sample to NAFLD-positive reference levels that distinguish over NASH and/or NASH-positive reference levels that distinguish over NAFLD of the one or more biomarkers in order to determine whether the subject has NAFLD or NASH.
- the one or more biomarkers that may be used include those biomarkers selected from Tables 1, 2, 3, 4B, 5B, 6B, 8, 9, 10, 11, 12, 13, Figure 1 , Figure 2 , Figure 3 and combinations thereof.
- any suitable method may be used to analyze the biological sample in order to determine the level(s) of the one or more biomarkers in the sample. Suitable methods include chromatography (e.g., HPLC, gas chromatography, liquid chromatography), mass spectrometry (e.g., MS, MS-MS), enzymatic or biochemical reactions, clinical chemistry, enzyme-linked immunosorbent assay (ELISA), antibody linkage, other immunochemical techniques, and combinations thereof. Further, the level(s) of the one or more biomarkers may be measured indirectly, for example, by using an assay that measures the level of a compound (or compounds) that correlates with the level of the biomarker(s) that are desired to be measured.
- chromatography e.g., HPLC, gas chromatography, liquid chromatography
- mass spectrometry e.g., MS, MS-MS
- enzymatic or biochemical reactions e.g., clinical chemistry
- enzyme-linked immunosorbent assay e.g., enzyme-linked immuno
- the levels of one or more of the biomarkers of Tables 1, 2, 3, 4B, 5B, 6B, 8, 9, 10, 11, 12, 13, Figure 1 , Figure 2 , Figure 3 may be determined in the methods of diagnosing and methods of aiding in diagnosing whether a subject has steatohepatitis.
- biomarkers that are specific for distinguishing between NAFLD and NASH in a certain type of sample may also be used.
- a certain type of sample e.g., liver tissue sample, urine sample, or blood plasma sample
- biomarkers listed in Tables 1, 2, 3, 4B, 5B, 6B, 8, 9, 10, 11, 12, 13, Figure 1 , Figure 2 , Figure 3 may be used.
- the level(s) of the one or more biomarkers in the sample are determined, the level(s) are compared to NAFLD-positive reference levels that distinguish over NASH-negative and/or NASH-positive reference levels that distinguish over NAFLD of the one or more biomarkers in order to determine whether the subject has NAFLD or NASH.
- Levels of the one or more biomarkers in a sample matching the NAFLD-positive reference levels that distinguish over NASH are indicative of NAFLD in the subject.
- Levels of the one or more biomarkers in a sample matching the NASH-positive reference levels that distinguish over NAFLD are indicative of NASH in the subject. If the level(s) of the one or more biomarkers are more similar to the NAFLD-positive reference levels that distinguish over NASH (or less similar to the NASH-positive reference levels), then the results are indicative of NAFLD in the subject. If the level(s) of the one or more biomarkers are more similar to the NASH-positive reference levels that distinguish over NAFLD (or less similar to the NAFLD-positive reference levels), then the results are indicative of NASH in the subject.
- the level(s) of the one or more biomarkers may be compared to NAFLD-positive reference levels that distinguish over NASH and/or NASH-positive reference levels that distinguish over NAFLD using various techniques, including a simple comparison (e.g., a manual comparison) of the level(s) of the one or more biomarkers in the biological sample to NAFLD-positive and/or NASH-positive reference levels.
- the level(s) of the one or more biomarkers in the biological sample may also be compared to NAFLD-positive reference levels that distinguish over NASH and/or NASH-positive reference levels that distinguish over NAFLD using one or more statistical analyses (e.g., t-test, Welch's T-test, Wilcoxon's rank sum test, ANOVA, recursive partitioning, random forest).
- one or more statistical analyses e.g., t-test, Welch's T-test, Wilcoxon's rank sum test, ANOVA, recursive partitioning, random forest.
- the biological samples may be analyzed to determine the level(s) of one or more non-biomarker compounds.
- the level(s) of such non-biomarker compounds may also allow differentiation of NAFLD from NASH.
- biomarkers for steatosis and steatohepatitis also allows for the determination of whether a subject having no symptoms of steatohepatitis or steatosis is predisposed to developing steatohepatitis or steatosis.
- a method of determining whether a subject having no symptoms of steatohepatitis is predisposed to developing steatohepatitis comprises (1) analyzing a biological sample from a subject to determine the level(s) of one or more biomarkers listed in Tables 1, 3, 4B, 6B, 9, 10, 11, 12, 13, Figure 2 , Figure 3 in the sample and (2) comparing the level(s) of the one or more biomarkers in the sample to steatohepatitis-positive and/or steatohepatitis-negative reference levels of the one or more biomarkers in order to determine whether the subject is predisposed to developing steatohepatitis.
- the results of the method may be used along with other methods (or the results thereof) useful in the clinical determination of whether a subject is predisposed to developing steatohepatitis.
- any suitable method may be used to analyze the biological sample in order to determine the level(s) of the one or more biomarkers in the sample.
- the level(s) of the one or more biomarkers in the sample are determined, the level(s) are compared to, for example, steatohepatitis-positive and/or steatohepatitis-negative reference levels in order to predict whether the subject is predisposed to developing steatohepatitis.
- Levels of the one or more biomarkers in a sample matching the steatohepatitis-positive reference levels are indicative of the subject being predisposed to developing steatohepatitis.
- Levels of the one or more biomarkers in a sample matching the steatohepatitis-negative reference levels are indicative of the subject not being predisposed to developing steatohepatitis.
- levels of the one or more biomarkers that are differentially present (especially at a level that is statistically significant) in the sample as compared to steatohepatitis-negative reference levels are indicative of the subject being predisposed to developing steatohepatitis.
- Levels of the one or more biomarkers that are differentially present (especially at a level that is statistically significant) in the sample as compared to steatohepatitis-positive reference levels are indicative of the subject not being predisposed to developing steatohepatitis.
- reference levels specific to assessing whether or not a subject that does not have steatohepatitis is predisposed to developing steatohepatitis may also be possible to determine reference levels specific to assessing whether or not a subject that does not have steatohepatitis is predisposed to developing steatohepatitis. For example, it may be possible to determine reference levels of the biomarkers for assessing different degrees of risk (e.g., low, medium, high) in a subject for developing steatohepatitis. Such reference levels could be used for comparison to the levels of the one or more biomarkers in a biological sample from a subject.
- the level(s) of the one or more biomarkers may be compared to steatohepatitis-positive and/or steatohepatitis-negative reference levels using various techniques, including a simple comparison, one or more statistical analyses, and combinations thereof.
- the methods of determining whether a subject having no symptoms of steatohepatitis or steatosis is predisposed to developing steatosis or steatohepatitis may further comprise analyzing the biological sample to determine the level(s) of one or more non-biomarker compounds.
- the methods of determining whether a subject having no symptoms of steatohepatitis is predisposed to developing steatohepatitis may also be conducted specifically to determine whether a subject having no symptoms of steatohepatitis is predisposed to developing NAFLD and/or NASH.
- Biomarker specific for NAFLD are listed in Tables 2, 4B, 5B, 8, 11, 12, 13, Figure 1 , Figure 3 and biomarkers specific for NASH are listed in Tables 1, 4B, 6B, 10, 11, 12, 13, Figure 2 , Figure 3 .
- methods of determining whether a subject having NAFLD is predisposed to developing NASH may be conducted using one or more biomarkers selected from Tables 1, 4B, 6B, 10, 11, 12, 13, Figure 2 , Figure 3 .
- a method of monitoring the progression/regression of steatosis in a subject comprises (1) analyzing a first biological sample from a subject to determine the level(s) of one or more biomarkers for steatosis selected from Tables 2, 3, 4B, 6B, 8, 9, 11, 12, 13, Figure 1 , Figure 3 , the first sample obtained from the subject at a first time point, (2) analyzing a second biological sample from a subject to determine the level(s) of the one or more biomarkers, the second sample obtained from the subject at a second time point, and (3) comparing the level(s) of one or more biomarkers in the first sample to the level(s) of the one or more biomarkers in the second sample in order to monitor the progression/regression of steatosis in the subject.
- the results of the method comprises (1) analyzing a first biological sample from a subject to determine the level(s) of one or more biomarkers for steatosis selected from Tables 2, 3, 4B, 6B, 8, 9, 11, 12, 13, Figure 1
- the change (if any) in the level(s) of the one or more biomarkers over time may be indicative of progression or regression of steatosis in the subject.
- the level(s) of the one or more biomarkers in the first sample, the level(s) of the one or more biomarkers in the second sample, and/or the results of the comparison of the levels of the biomarkers in the first and second samples may be compared to steatosis-positive, steatosis-negative, NAFLD-positive, NAFLD-negative, high-grade steatosis-positive, and/or NASH-negative reference levels as well as NAFLD-positive reference levels that distinguish over NASH and/or NASH-positive reference levels that distinguish over NAFLD.
- the comparisons indicate that the level(s) of the one or more biomarkers are increasing or decreasing over time (e.g., in the second sample as compared to the first sample) to become more similar to the steatosis-positive reference levels (or less similar to the steatosis-negative reference levels), to the NASH reference levels, or, when the subject initially has NAFLD, to the NASH-positive reference levels that distinguish over NAFLD, then the results are indicative of steatosis progression.
- the results are indicative of steatosis regression.
- the comparisons made in the methods of monitoring progression/regression of steatosis in a subject may be carried out using various techniques, including simple comparisons, one or more statistical analyses, and combinations thereof.
- the results of the method may be used along with other methods (or the results thereof) useful in the clinical monitoring of progression/regression of steatosis in a subject.
- any suitable method may be used to analyze the biological samples in order to determine the level(s) of the one or more biomarkers in the samples.
- the level(s) of one or more biomarkers including a combination of all of the biomarkers in Tables 2, 4B, 5B, 8, 11, 12, 13, Figure 1 , Figure 3 or any fraction thereof, may be determined and used in methods of monitoring progression/regression of steatosis in a subject.
- Such methods could be conducted to monitor the course of steatosis in subjects having steatosis or could be used in subjects not having steatosis (e.g., subjects suspected of being predisposed to developing steatosis) in order to monitor levels of predisposition to steatosis.
- Such methods could be conducted to monitor the course of steatohepatitis in subjects having steatohepatitis or could be used in subjects not having steatohepatitis (e.g., subjects suspected of being predisposed to developing steatohepatitis) in order to monitor levels of predisposition to steatohepatitis.
- the levels(s) of one or more biomarkers including a combination of all of the biomarkers in Tables 1, 3, 4B, 6B, 9, 10, 11, 12, 13, Figure 2 and/or Figure 3 , or any fraction thereof, may be determined and used in methods of monitoring progression/regression of steatohepatitis in a subject.
- biomarkers for steatohepatitis and steatosis also allows for assessment of the efficacy of a composition for treating steatohepatitis and/or steatosis as well as the assessment of the relative efficacy of two or more compositions for treating steatohepatitis and/or steatosis. Such assessments may be used, for example, in efficacy studies as well as in lead selection of compositions for treating steatohepatitis or steatosis.
- a method of assessing the efficacy of a composition for treating steatohepatitis comprises (1) analyzing, from a subject having steatohepatitis and currently or previously being treated with a composition, a biological sample to determine the level(s) of one or more biomarkers selected from Tables 1, 3, 4B, 6B, 9, 10, 11, 12, 13, Figure 2 and/or Figure 3 , and ( 2 ) comparing the level(s) of the one or more biomarkers in the sample to (a) level(s) of the one or more biomarkers in a previously-taken biological sample from the subject, wherein the previously-taken biological sample was obtained from the subject before being treated with the composition, (b) steatohepatitis-positive reference levels (including NASH-positive and/or NAFLD-positive reference levels) of the one or more biomarkers, (c) steatohepatitis-negative reference levels (including NASH-negative and/or NAFLD-negative reference levels) of the one or more biomarkers,
- the level(s) of the one or more biomarkers in the biological sample are compared to (1) steatohepatitis-positive reference levels, (2) steatohepatitis-negative reference levels, (3) previous levels of the one or more biomarkers in the subject before treatment with the composition, (4) NASH-positive reference levels that distinguish over NAFLD, and/or (5) NAFLD-positive reference levels that distinguish over NASH.
- level(s) in the sample matching the steatohepatitis-negative reference levels are indicative of the composition having efficacy for treating steatohepatitis.
- Levels of the one or more biomarkers in the sample matching the steatohepatitis-positive reference levels are indicative of the composition not having efficacy for treating steatohepatitis.
- the comparisons may also indicate degrees of efficacy for treating steatohepatitis based on the level(s) of the one or more biomarkers.
- level(s) in the sample matching the NASH-positive reference levels that distinguish over NAFLD are indicative of the composition having efficacy for treating steatohepatitis.
- Levels of the one or more biomarkers in the sample matching the NASH-positive reference levels that distinguish over NAFLD are indicative of the composition not having efficacy for treating steatohepatitis.
- any changes in the level(s) of the one or more biomarkers are indicative of the efficacy of the composition for treating steatohepatitis.
- the comparisons indicate that the level(s) of the one or more biomarkers have increased or decreased after treatment with the composition to become more similar to the steatohepatitis-negative reference levels (or less similar to the steatohepatitis-positive reference levels) or, when the subject initially has NAFLD, the level(s) have increased or decreased to become more similar to NASH-positive reference levels that distinguish over NAFLD (or less similar to the NAFLD-positive reference levels that distinguish over NASH), then the results are indicative of the composition having efficacy for treating steatohepatitis.
- the comparisons indicate that the level(s) of the one or more biomarkers have not increased or decreased after treatment with the composition to become more similar to the steatohepatitis-negative reference levels (or less similar to the steatohepatitis-positive reference levels) or, when the subject initially has NASH, the level(s) have not increased or decreased to become more similar to NAFLD-positive reference levels that distinguish over NASH (or less similar to the NASH-positive reference levels that distinguish over NAFLD), then the results are indicative of the composition not having efficacy for treating steatohepatitis.
- the comparisons may also indicate degrees of efficacy for treating steatohepatitis based on the amount of changes observed in the level(s) of the one or more biomarkers after treatment.
- the changes in the level(s) of the one or more biomarkers, the level(s) of the one or more biomarkers before treatment, and/or the level(s) of the one or more biomarkers in the subject currently or previously being treated with the composition may be compared to steatohepatitis-positive reference levels (including low grade and NASH-positive reference levels), steatohepatitis-negative reference levels (including low grade and NASH-negative reference levels), NAFLD-positive reference levels that distinguish over NASH, and/or NASH-positive reference levels that distinguish over NAFLD.
- Another method for assessing the efficacy of a composition in treating steatohepatitis comprises (1) analyzing a first biological sample from a subject to determine the level(s) of one or more biomarkers selected from Tables 1, 3, 4B, 6B, 9, 10, 11, 12, 13, Figure 2 and/or Figure 3 , the first sample obtained from the subject at a first time point, (2) administering the composition to the subject, (3) analyzing a second biological sample from a subject to determine the level(s) of the one or more biomarkers, the second sample obtained from the subject at a second time point after administration of the composition, and (4) comparing the level(s) of one or more biomarkers in the first sample to the level(s) of the one or more biomarkers in the second sample in order to assess the efficacy of the composition for treating steatohepatitis.
- the comparison of the samples indicates that the level(s) of the one or more biomarkers have increased or decreased after administration of the composition to become more similar to the steatohepatitis-negative reference levels (or less similar to the steatohepatitis-positive reference levels) or, when the subject initially has NASH, if the level(s) have increased or decreased to become more similar to NAFLD-positive reference levels that distinguish over NASH (or less similar to the NASH-positive reference levels that distinguish over NAFLD), then the results are indicative of the composition having efficacy for treating steatohepatitis.
- the comparisons indicate that the level(s) of the one or more biomarkers have not increased or decreased after treatment with the composition to become more similar to the steatohepatitis-negative reference levels (or less similar to the steatohepatitis-positive reference levels) or, when the subject initially has NASH, the level(s) have not increased or decreased to become more similar to NAFLD-positive reference levels that distinguish over NASH (or less similar to the NASH-positive reference levels that distinguish over NAFLD), then the results are indicative of the composition not having efficacy for treating steatohepatitis.
- the comparison may also indicate a degree of efficacy for treating steatohepatitis based on the amount of changes observed in the level(s) of the one or more biomarkers after administration of the composition as discussed above.
- a method of assessing the relative efficacy of two or more compositions for treating steatohepatitis comprises (1) analyzing, from a first subject having steatohepatitis and currently or previously being treated with a first composition, a first biological sample to determine the level(s) of one or more biomarkers selected from Tables 1, 3, 4B, 6B, 9, 10, 11, 12, 13, Figure 2 and/or Figure 3 (2) analyzing, from a second subject having steatohepatitis and currently or previously being treated with a second composition, a second biological sample to determine the level(s) of the one or more biomarkers, and (3) comparing the level(s) of one or more biomarkers in the first sample to the level(s) of the one or more biomarkers in the second sample in order to assess the relative efficacy of the first and second compositions for treating steatohepatitis.
- the results are indicative of the relative efficacy of the two compositions, and the results (or the levels of the one or more biomarkers in the first sample and/or the level(s) of the one or more biomarkers in the second sample) may be compared to steatohepatitis-positive reference levels (including low grade and NASH-positive reference levels), steatohepatitis-negative reference levels (including low grade and NASH-negative reference levels), NAFLD-positive reference levels that distinguish over NASH, and/or NASH-positive reference levels that distinguish over NAFLD to aid in characterizing the relative efficacy.
- steatohepatitis-positive reference levels including low grade and NASH-positive reference levels
- steatohepatitis-negative reference levels including low grade and NASH-negative reference levels
- NAFLD-positive reference levels that distinguish over NASH
- NASH-positive reference levels that distinguish over NAFLD
- Each of the methods of assessing efficacy may be conducted on one or more subjects or one or more groups of subjects (e.g., a first group being treated with a first composition and a second group being treated with a second composition).
- the comparisons made in the methods of assessing efficacy (or relative efficacy) of compositions for treating steatohepatitis and/or steatosis may be carried out using various techniques, including simple comparisons, one or more statistical analyses, and combinations thereof. Any suitable method may be used to analyze the biological samples in order to determine the level(s) of the one or more biomarkers in the samples.
- the level(s) of one or more biomarkers may be determined and used in methods of assessing efficacy (or relative efficacy) of compositions for treating steatohepatitis.
- the methods of assessing efficacy (or relative efficacy) of one or more compositions for treating steatohepatitis may further comprise analyzing the biological sample to determine the level(s) of one or more non-biomarker compounds.
- the non-biomarker compounds may then be compared to reference levels of non-biomarker compounds for subjects having (or not having) steatohepatitis.
- biomarkers for steatohepatitis and steatosis also allows for the screening of compositions for activity in modulating biomarkers associated with steatohepatitis and/or steatosis, which may be useful in treating steatohepatitis and/or steatosis.
- methods of screening compositions useful for treatment of steatohepatitis comprise assaying test compositions for activity in modulating the levels of one or more biomarkers in Tables 1, 3, 4B, 6B, 9, 10, 11, 12, 13, Figure 2 and/or Figure 3 .
- screening assays may be conducted in vitro and/or in vivo, and may be in any form known in the art useful for assaying modulation of such biomarkers in the presence of a test composition such as, for example, cell culture assays, organ culture assays, and in vivo assays (e.g., assays involving animal models).
- a test composition such as, for example, cell culture assays, organ culture assays, and in vivo assays (e.g., assays involving animal models).
- a method for screening a composition for activity in modulating one or more biomarkers of steatohepatitis comprises (1) contacting one or more cells with a composition, (2) analyzing at least a portion of the one or more cells or a biological sample associated with the cells to determine the level(s) of one or more biomarkers of steatohepatitis selected from Tables 1, 3, 4B, 6B, 9, 10, 11, 12, 13, Figure 2 and/or Figure 3; and (3 ) comparing the level(s) of the one or more biomarkers with predetermined standard levels for the one or more biomarkers to determine whether the composition modulated the level(s) of the one or more biomarkers.
- the cells may be contacted with the composition in vitro and/or in vivo.
- the predetermined standard levels for the one or more biomarkers may be the levels of the one or more biomarkers in the one or more cells in the absence of the composition.
- the predetermined standard levels for the one or more biomarkers may also be the level(s) of the one or more biomarkers in control cells not contacted with the composition.
- the methods may further comprise analyzing at least a portion of the one or more cells or a biological sample associated with the cells to determine the level(s) of one or more non-biomarker compounds of steatohepatitis and/or steatosis. The levels of the non-biomarker compounds may then be compared to predetermined standard levels of the one or more non-biomarker compounds.
- Any suitable method may be used to analyze at least a portion of the one or more cells or a biological sample associated with the cells in order to determine the level(s) of the one or more biomarkers (or levels of non-biomarker compounds).
- Suitable methods include chromatography (e.g., HPLC, gas chromatograph, liquid chromatography), mass spectrometry (e.g., MS, MS-MS), enzymatic or biochemical reactions, clinical chemistry, ELISA, antibody linkage, other immunochemical techniques, and combinations thereof.
- the level(s) of the one or more biomarkers may be measured indirectly, for example, by using an assay that measures the level of a compound (or compounds) that correlates with the level of the biomarker(s) (or non-biomarker compounds) that are desired to be measured.
- a method for identifying a potential drug target for steatohepatitis comprises (1) identifying one or more biochemical pathways associated with one or more biomarkers for steatohepatitis selected from Tables 1, 3, 4B, 6B, 9, 10, 11, 12, 13, Figure 2 and/or Figure 3 , and ( 2 ) identifying a protein (e.g., an enzyme) affecting at least one of the one or more identified biochemical pathways, the protein being a potential drug target for steatohepatitis.
- a protein e.g., an enzyme
- Another method for identifying a potential drug target for steatohepatitis comprises (1) identifying one or more biochemical pathways associated with one or more biomarkers for steatohepatitis selected from Tables 1, 3, 4B, 6B, 9, 10, 11, 12, 13, Figure 2 and/or Figure 3 , and one or more non-biomarker compounds of steatohepatitis and (2) identifying a protein affecting at least one of the one or more identified biochemical pathways, the protein being a potential drug target for steatohepatitis.
- biochemical pathways e.g., biosynthetic and/or metabolic (catabolic) pathway
- biomarkers or non-biomarker compounds
- proteins affecting at least one of the pathways are identified.
- those proteins affecting more than one of the pathways are identified.
- a build-up of one metabolite may indicate the presence of a 'block' downstream of the metabolite and the block may result in a low/absent level of a downstream metabolite (e.g. product of a biosynthetic pathway).
- a downstream metabolite e.g. product of a biosynthetic pathway.
- the absence of a metabolite could indicate the presence of a 'block' in the pathway upstream of the metabolite resulting from inactive or non-functional enzyme(s) or from unavailability of biochemical intermediates that are required substrates to produce the product.
- an increase in the level of a metabolite could indicate a genetic mutation that produces an aberrant protein which results in the over-production and/or accumulation of a metabolite which then leads to an alteration of other related biochemical pathways and result in dysregulation of the normal flux through the pathway; further, the build-up of the biochemical intermediate metabolite may be toxic or may compromise the production of a necessary intermediate for a related pathway. It is possible that the relationship between pathways is currently unknown and this data could reveal such a relationship.
- compositions that may be potential candidates for treating steatohepatitis including compositions for gene therapy.
- biomarkers for steatohepatitis and steatosis also allows for the treatment of steatohepatitis and/or steatosis.
- an effective amount of one or more steatohepatitis biomarkers that are lowered in steatohepatitis as compared to a healthy subject not having steatohepatitis may be administered to the subject.
- the biomarkers that may be administered may comprise one or more of the biomarkers in Tables 1, 3, 4B, 6B, 9, 10, 11, 12, 13, Figure 2 , Figure 3 that are decreased in steatohepatitis.
- the biomarkers that are administered are one or more biomarkers listed in Tables 1, 3, 4B, 6B, 9, 10, 11, 12, 13, Figure 2 , Figure 3 that are decreased in steatohepatitis and that have a p-value less than 0.10.
- the biomarkers that are administered are one or biomarkers listed in Tables 1, 3, 4B, 6B, 9, 10, 11, 12, 13, Figure 2 , Figure 3 that are decreased in steatohepatitis by at least 5%, by at least 10%, by at least 15%, by at least 20%, by at least 25%, by at least 30%, by at least 35%, by at least 40%, by at least 45%, by at least 50%, by at least 55%, by at least 60%, by at least 65%, by at least 70%, by at least 75%, by at least 80%, by at least 85%, by at least 90%, by at least 95%, or by 100% (i.e., absent).
- biomarkers for steatosis and steatohepatitis described herein may also be biomarkers for liver disorders (e.g. liver fibrosis, cirrhosis, liver cancer, etc.) in general. Therefore, it is believed that at least some of the steatosis biomarkers or steatohepatitis biomarkers may be used in the methods described herein for liver disorders in general.
- liver disorders e.g. liver fibrosis, cirrhosis, liver cancer, etc.
- the methods described herein with respect to steatosis and/or steatohepatitis may also be used for diagnosing (or aiding in the diagnosis of) a liver disorder, methods of monitoring progression/regression of a liver disorder, methods of assessing efficacy of compositions for treating a liver disorder, methods of screening a composition for activity in modulating biomarkers associated with a liver disorder, methods of identifying potential drug targets for liver disorder, and methods of treating a liver disorder. Such methods could be conducted as described herein with respect to steatosis.
- the biomarkers that are used may be selected from those biomarkers in Tables 1, 2, 3, 4B, 5B, 6B, 8, 9, 10, 11, 12, 13, Figures 1 , 2 , and 3 , having p-values of less than 0.05 and/or those biomarkers in Tables 1, 2, 3, 4B, 5B, 6B, 8, 9, 10, 11, 12, 13, Figures 1 , 2 , and 3 having q-values of less than 0.10.
- biomarkers that are used in any of the methods described herein may also be selected from those biomarkers in Tables 1, 2, 3, 4B, 5B, 6B, 8, 9, 10, 11, 12, 13, Figures 1 , 2 , and 3 that are decreased in steatosis and/or steatohepatitis (as compared to the control) or that are decreased in remission (as compared to control or steatosis and/or steatohepatitis) by at least 5%, by at least 10%, by at least 15%, by at least 20%, by at least 25%, by at least 30%, by at least 35%, by at least 40%, by at least 45%, by at least 50%, by at least 55%, by at least 60%, by at least 65%, by at least 70%, by at least 75%, by at least 80%, by at least 85%, by at least 90%, by at least 95%, or by 100% (i.e., absent); and/or those biomarkers in Tables 1, 2, 3, 4B, 5B, 6B
- GC-MS gas chromatography-mass spectrometry
- LC-MS liquid chromatography-mass spectrometry
- the data was analyzed using statistical tests of significance to identify molecules (either known, named metabolites or unnamed metabolites) present at differential levels in a definable population or subpopulation (e.g., biomarkers for steatosis biological samples compared to control biological samples or compared to patients in remission from steatosis) useful for distinguishing between the definable populations (e.g., steatosis (NAFLD) and control, steatohepatitis (NASH) and control, NAFLD and NASH). Other molecules (either known, named metabolites or unnamed metabolites) in the definable population or subpopulation were also identified.
- significance tests Analysis of variance (ANOVA), analysis of covariance (ANCOVA) and Wilcoxon signed rank test were used to statistically analyze the data.
- Random Forest and Recursive Partitioning were used to analyze the data.
- Biomarkers were discovered by (1) analyzing blood plasma samples from different groups of human subjects to determine the levels of metabolites in the samples and then (2) statistically analyzing the results to determine those metabolites that were differentially present in the two groups.
- the plasma samples used for the analysis were 25 control samples that were from healthy subjects, 11 samples from patients with steatosis and 24 samples from patients with NASH. Subjects for all groups included males and females. After the levels of metabolites were determined, the data was analyzed using significance tests (ANOVA, ANCOVA, Wilcoxon).
- ANOVA was used to identify significant differences in the mean levels of metabolites between two populations (i.e., Steatosis vs. Control, NASH vs. Control, Steatosis vs. NASH).
- biomarkers were discovered that were differentially present between plasma samples from steatosis patients and Control subjects, biomarkers that were discovered that were differentially present between plasma samples from patients with NASH and from Control subjects and biomarkers that were discovered that were differentially present between plasma samples from steatohepatitis (NASH) and plasma samples from subjects with steatosis.
- NASH steatohepatitis
- Tables 1, 2 and 3 include, for each listed biomarkers, the p-value and q-value determined in the statistical analysis of the data concerning the biomarkers in the steatosis mean level as compared to the control mean level, the NASH mean level as compared to the control mean level, and the steatohepatitis (NASH) mean level as compared to the steatosis mean level.
- Library indicates the chemical library that was used to identify the compounds.
- the number 50 refer to the GC library and the numbers 61, 200 and 201 refer to the LC library.
- Comp ID refers to the identification number for the compound in our internal chemical compound database.
- the data is presented as a percent change based upon the ratio of means and indicates biomarkers that increase or decrease in NASH relative to control (Table 1), in steatosis relative to control (Table 2) and/or in NASH relative to steatosis (Table 3). Table 1.
- Biomarkers from subjects with steatohepatitis (NASH) compared to Control subjects ID Biomarker Library p-value q-value % Change 32868 glycocholate* 201 8.56E-06 0.0005 331% 12751 Metabolite-3073 50 1.36E-07 1.08E-05 129% 32322 glutamate 50 1.52E-07 3.11E-05 137% 1113 isocitrate 61 3.94E-07 0.000021 85% 1125 isoleucine 50 6.7E-07 2.27E-05 52% 18706 Metabolite-5769 61 7.12E-07 2.27E-05 64% 33073 Metabolite-11728 200 1.36E-06 0.0001 -57% 60 leucine 50 3.12E-06 0.0001 11% 16511 Metabolite-4274 50 3.22E-06 0.0001 61% 32393 glutamylvaline 200 8.94E-06 0.0005 33% 1126 alanine 50 0.000011 0.0002 40% 1299
- Biomarkers from subjects with Steatosis compared to Control subjects.
- Biomarkers from subjects with Steatosis compared to Steatohepatitis subjects ID Biomarker Library p-value q-value % Change 21762 Metabolite-8506 61 0.0006 0.1449 -44% 528 alpha-keto-glutarate 61 0.0017 0.1921 75% 6847 Metabolite-1496 61 0.0025 0.1921 49% 16650 Metabolite-4360 50 0.0033 0.1921 -144% 18591 Metabolite-5646 61 0.0041 0.1921 -53% 27718 creatine 200 0.0071 1 -50% 599 pyruvate 61 0.0087 0.253 -42% 32621 Metabolite-11304 200 0.0124 1 31% 1113 isocitrate 61 0.0151 0.3249 38% 15506 choline 61 0.0163 0.3249 -28% 32729 Metabolite-11412 200 0.0166 1 -14% 10501 Metabolite-2321 61 0.0183 0.3249 -40% 12644 Met
- Random forest analyses were used for classification of samples into groups (e.g. disease or healthy, steatosis or healthy, steatohepatitis or healthy, steatosis or NASH). Random forests give an estimate of how well we can classify individuals in a new data set into each group, in contrast to a t-test, which tests whether the unknown means for two populations are different or not. Random forests create a set of classification trees based on continual sampling of the experimental units and compounds. Then each observation is classified based on the majority votes from all the classification trees.
- groups e.g. disease or healthy, steatosis or healthy, steatohepatitis or healthy, steatosis or NASH. Random forests give an estimate of how well we can classify individuals in a new data set into each group, in contrast to a t-test, which tests whether the unknown means for two populations are different or not. Random forests create a set of classification trees based on continual sampling of the experimental units and compounds. Then each observation is classified
- Random forest results show that the samples can be classified correctly with varying degrees of accuracy using the biomarkers listed in Tables 1, 2, and/or 3.
- the confusion matrices demonstrate that using plasma samples steatosis subjects, steatohepatitis subjects and control subjects can be distinguished (Table4), steatosis, subjects can be distinguished from control subjects (Table 5), steatohepatitis subjects can be distinguished from control subjects (Table 6) and steatosis subjects can be distinguished from steatohepatitis subjects (Table 7).
- OOB Out-of Bag
- Confusion Matrix showing Control subjects, Steatosis subjects and NASH subjects can be distinguished from each other.
- Confusion Matrix Control vs. Steatosis vs. NASH Control_ Predicted Steatosis_ Predicted NASH_ Predicted Error Control 23 0 2 8% Steatosis 3 9 12 63% NASH 2 4 5 55% Out_of_bag_error 38%
- the Random Forest model that was created could be used to predict whether a subject has steatosis, steatohepatitis, or no fatty liver disease with about 62% accuracy from analysis of the levels of the biomarkers in samples from the subject.
- the biomarkers that are the most important biomarkers for distinguishing the groups are listed in Table 4B and displayed in Figure 3 .
- Table 4B Most important biomarkers to distinguish control, steatosis and steatohepatitis subjects from Random Forest Importance Plot shown in Figure 3.
- Biomarker 2734 gamma-glutamyltyrosine 32322 glutamate 33073 Metabolite - 11728 32412 butyrytcarnitine 18497 taurocholate 32393 glutamylvaline 1299 tyrosine 32739 Metabolite - 11422 15140 kynurenine 32868 glycocholate* 33420 gamma-tocopherol- 32748 Metabolite - 11431 27718 creatine 31489 Metabolite - 10914 32552 Metabolite - 11235 15753 hippurate 32846 Metabolite - 11529 17028 Metabolite - 4611 32735 Metabolite - 01911_200 32808 Metabolite - 11491 15990 glycerophosphorylcholine (GPC) 32701 urate- 33362 gamma-glutamylphenylalanine- 32547 Metabolite -11230 32497 10c-undeceno
- Confusion Matrix showing Control subjects can be distinguished from Steatosis subjects.
- Confusion Matrix Control vs. Steatosis Control_ Predicted Steatosis Predicted Error Control 22 3 12% Steatosis 1 10 9% Out_of_bag_error 11%
- the Random Forest model that was created could be used to predict whether a subject has steatosis or no fatty liver disease with about 89% accuracy from analysis of the levels of the biomarkers in samples from the subject.
- the biomarkers that are the most important biomarkers for distinguishing the groups are listed in Table 5B and displayed in Figure 1 .
- Table 5 B Most important biomarkers from Random Forest Importance Plot shown in Figure 1.
- the Random Forest model that was created could be used to predict whether a subject has steatohepatitis or no fatty liver disease with about 92% accuracy from analysis of the levels of the biomarkers in samples from the subject.
- the biomarkers that are the most important biomarkers for distinguishing the groups are listed in Table 6B and displayed in the importance plot in Figure 2 .
- Table 6B Most important biomarkers from Random Forest Importance Plot shown in Figure 2.
- Confusion Matrix showing Steatosis subjects can be distinguished from steatohepatitis (NASH) subjects.
- Confusion Matrix Steatosis vs. NASH Steatosis_ Predicted NASH_ Predicted Error Steatosis 10 14 58% NASH 5 6 45% Out_of_bag_error 54%
- the Random Forest model that was created could be used to predict whether a subject has steatosis or steatohepatitis with about 46% accuracy from analysis of the levels of the biomarkers in samples from the subject.
- Figure 1 lists the biomarker compounds that are most important in distinguishing steatosis subjects and Control subjects.
- Figure 2 are the biomarker compounds that are most important in distinguishing steatohepatitis subjects from control subjects.
- Figure 3 are the biomarker compounds that are most important in distinguishing steatosis, steatohepatitis and control subjects.
- SAS JMP program
- the recursive partitioning results showing the classification of Control and steatosis subjects is shown in Figure 4 .
- the biomarkers that contribute to the classification are listed in Table 8.
- the recursive partitioning results showing the classification of steatosis and steatohepatitis (NASH, SH) are shown in Figure 5 and the biomarkers used in the classification are listed in Table 9.
- the recursive partitioning results showing the classification of control and steatohepatitis are shown in Figure 6 and the biomarkers are listed in Table 10.
- the recursive partitioning results showing the use of the biomarkers to classify steatosis, steatohepatitis and control subjects are shown in Figure 7 and the biomarkers are listed in Table 11.
- the sensitivity and specificity of a given biomarker was determined by the Receiver Operating Characteristic curve (or ROC curve), which plots the true positive rate against the false positive rate for the different possible cutpoints of the specific biomarker.
- the area under the curve is a measure of test accuracy. An area of 1 represents a perfect test while an area of 0.5 represents a worthless test.
- a rough guide for classifying the accuracy of a diagnostic test is the traditional academic point system:
- ROC curves are shown in Figures 4 , 5 , 6 and 7 .
- the control subjects are separated from steatosis subjects with an accuracy of >90 ( Figure 4 ).
- the steatosis and steatohepatitis subjects can be distinguished with >82% accuracy ( Figure 5 ).
- the Control and steatohepatitis subjects are classified >87% accuracy ( Figure 6 ).
- the three groups can be classified using the biomarkers with >70% (NASH), >77% (Steatosis), >86% accuracy (control) ( Figure 7 ).
- Table 8 Recursive Partitioning Biomarkers, Steatosis vs control.
- Biomarkers were discovered by (1) analyzing blood plasma samples from different groups of female human subjects and from different groups of male human subjects to determine the levels of metabolites in the samples and then (2) statistically analyzing the results to determine those metabolites that were differentially present in the two groups.
- the plasma samples used for the analysis were 7 control samples that were from healthy subjects, 6 samples from patients with steatosis and 8 samples from patients with steatohepatitis.
- the plasma samples used for the analysis were 18 control samples that were from healthy subjects, 5 samples from patients with steatosis and 16 samples from patients with steatohepatitis.
- significance tests ANOVA, ANCOVA, Wilcoxon.
- ANOVA was used to identify significant differences in the mean levels of metabolites between two populations (i.e., Steatosis vs. Control, Steatohepatitis vs. Control, Steatosis vs. Steatohepatitis).
- biomarkers were discovered that were differentially present between plasma samples from steatosis patients and Control subjects, biomarkers that were discovered that were differentially present between plasma samples from patients with steatohepatitis and from Control subjects and biomarkers that were discovered that were differentially present between plasma samples from steatosis and plasma samples from subjects with steatohepatitis (i.e. NASH).
- Tables 12 and 13 include, for each listed biomarker, the p-value and the q-value determined in the statistical analysis of the data concerning the biomarkers in the steatosis mean level as compared to the control mean level, the NASH mean level as compared to the control mean level, and the steatosis mean level as compared to the NASH mean level.
- Library indicates the chemical library that was used to identify the compounds.
- the number 50 refer to the GC library and the number 61 refers to the LC library.
- Comp ID refers to the identification number for the compound in our internal chemical compound database.
- Table 12 lists biomarkers for males, including, for each biomarker, the p-value and q-value for the specified comparisons of groups as described above. Table 12. Biomarkers from male subjects with Steatosis compared to Control subjects, steatohepatitis (NASH) compared to Control subjects and Steatosis compared to steatohepatitis (NASH) subjects. COMPOUND COMP_ID LIBRARY Control vs. NASH Control vs. STEATOSIS NASH vs.
- Table 13 lists biomarkers for females, including, for each biomarker, the p-value and the q-value for the specified comparisons of groups as described above. Table 13. Biomarkers from female subjects with Steatosis compared to Control subjects, steatohepatitis (NASH) compared to Control subjects and Steatosis compared to steatohepatitis (NASH) subjects. COMPOUND COMP _ID LIB _ID Control vs. NASH Control vs. STEATOSIS NASH vs.
- Table 14 below includes analytical characteristics of each of the isobars and the unnamed metabolites listed in Tables 1-3 and 8-13 above.
- the table includes, for each listed Metabolite, the Metabolite ID (ID), the retention time (RT), retention index (RI), mass, library, and polarity obtained using the analytical methods described above.
- Metabolite ID refers to the unique identifier for that compound in our internal chemical library database.
- Mass refers to the mass of the C 12 isotope of the parent ion used in quantification of the compound.
- the values for "Library” give an indication of the analytical method used for quantification: “50” indicates GC-MS and "61", "200” and "201” indicate LC-MS.
- Isobar 47 includes taurochenodeoxycholic acid and taurodeoxycholic acid 61 15.51 15700.0 498.4 - 5628 Metabolite - 1086 61 4.56 4811.0 294.1 + 6398 Metabolite - 1335 61 8.74 9162.2 367.2 + 6847 Metabolite - 1496 61 1.53 1562.0 133.0 - 7933 Metabolite - 1911 61 11.42 11799.6 464.1 + 10501 Metabolite - 2321 61 13.44 12940.0 314.3 + 10629 Metabolite - 2386 61 11.94 12150.0 539.2 - 10737
Description
- The invention generally relates to biomarkers for fatty liver disease and methods based on the same biomarkers.
- Fatty change in the liver results from excessive accumulation of lipids within hepatocytes. Fatty liver is the accumulation of triglycerides and other fats in the liver cells. Fatty liver disease can range from fatty liver alone (simple fatty liver, steatosis) to fatty liver associated with hepatic inflammation (steatohepatitis). Although having fat in the liver is not normal, by itself it probably causes little harm or permanent damage. Steatosis is generally believed to be a benign condition, with rare progression to chronic liver disease. In contrast, steatohepatitis may progress to liver fibrosis and cirrhosis, can be associated with hepatocellular carcinoma and may result in liver-related morbidity and mortality.
- Steatosis can occur with the use of alcohol (alcohol-related fatty liver) or in the absence of alcohol (nonalcoholic fatty liver disease, NAFLD). Steatohepatitis may be related to alcohol-induced hepatic damage or may be unrelated to alcohol. If steatohepatitis is present but a history of alcohol use is not, the condition is termed nonalcoholic steatohepatitis (NASH).
- In the absence of alcohol the main risk factors for simple fatty liver (NAFLD) and NASH are obesity, diabetes, and high triglyceride levels. In NASH, fat builds up in the liver and eventually causes scar tissue. This type of hepatitis appears to be associated with diabetes, protein malnutrition, obesity, coronary artery disease, and treatment with corticosteroid medications. Fibrosis or cirrhosis in the liver is present in 15-50% of patients with NASH. Approximately 30% of patients with fibrosis develop cirrhosis after 10 years.
- Fatty liver disease is now the most common cause for elevated liver function tests in the United States. It is now probably the leading reason for mild elevations of transaminases. Steatosis affects approximately 25-35% of the general population. NAFLD is found in over 80% of patients who are obese. NASH affects 2 to 5 percent of Americans and has been detected in 1.2-9% of patients undergoing routine liver biopsy. Over 50% of patients undergoing bariatric surgery have NASH. The disease strikes males and females; early studies report >70% of cases were in females but recent studies report 50% of patients are females. Fatty liver occurs in all age groups. In the United States NASH is the most common liver disease among adolescents and is the third most common cause of chronic liver disease in adults (after hepatitis C and alcohol).
- Both NASH and NAFLD are becoming more common, possibly because of the greater number of Americans with obesity. In the past 10 years, the rate of obesity has doubled in adults and tripled in children. Obesity also contributes to diabetes and high blood cholesterol, which can further complicate the health of someone with NASH. Diabetes and high blood cholesterol are also becoming more common among Americans.
- NASH is usually a silent disease with few or no symptoms. Patients generally feel well in the early stages and only begin to have symptoms-such as fatigue, weight loss, and weakness-once the disease is more advanced or cirrhosis develops. The progression of NASH can take years, even decades. The process can stop and, in some cases, reverse on its own without specific therapy. Or NASH can slowly worsen, causing scarring or "fibrosis" to appear and accumulate in the liver. As fibrosis worsens, cirrhosis develops; the liver becomes seriously scarred, hardened, and unable to function normally. Not every person with NASH develops cirrhosis, but once serious scarring or cirrhosis is present, few treatments can halt the progression. A person with cirrhosis experiences fluid retention, muscle wasting, bleeding from the intestines, and liver failure. Liver transplantation is the only treatment for advanced cirrhosis with liver failure, and transplantation is increasingly performed in people with NASH. NASH ranks as one of the major causes of cirrhosis in America, behind hepatitis C and alcoholic liver disease.
- NASH is usually first suspected in a person who is found to have elevations in liver tests that are included in routine blood test panels, such as alanine aminotransferase (ALT) or aspartate aminotransferase (AST). When further evaluation shows no apparent reason for liver disease (such as medications, viral hepatitis, or excessive use of alcohol) and when x-rays or imaging studies of the liver show fat, NASH is suspected. The only means of proving a diagnosis of NASH and separating it from simple fatty liver is a liver biopsy. A liver biopsy requires a needle to be inserted through the skin and the removal of a small piece of the liver. If the tissue shows fat without inflammation and damage, simple fatty liver or NAFLD is diagnosed. NASH is diagnosed when microscopic examination of the tissue shows fat along with inflammation and damage to liver cells. A biopsy is required to determine whether scar tissue has developed in the liver. Currently, no blood tests or scans can reliably provide this information. Therefore there exists a need for a less invasive diagnostic method (i.e. a method that would not require a biopsy).
- In the broadest sense the present application is defined as follows:
- 1. A method of diagnosing whether a subject has, or is predisposed to, steatohepatitis, comprising:
- analyzing a biological sample from a subject to determine the level of glycocholate in the sample, and
- comparing the level of glycocholate in the sample to steatohepatitis-positive and/or steatohepatitis-negative reference levels of glycocholate in order to diagnose whether the subject has, or is predisposed to, steatohepatitis.
- 2. The method of 1, further comprising analyzing the biological sample to determine the level(s) of one or more additional biomarkers for steatohepatitis in the sample, wherein the one or more additional biomarkers are selected from Tables 1, 3, 4B, 6B, 9, 10, 11, 12, 13, and/or
Figure 2 and/or 3, and
comparing the level(s) of the one or more additional biomarkers in the sample to steatohepatitis-positive and/or steatohepatitis-negative reference levels of the one or more additional biomarkers in order to diagnose whether the subject has, or is predisposed to, steatohepatitis. - 3. The method of 2, wherein the method is a method of diagnosing whether a subject has steatohepatitis and wherein the one or more additional biomarkers are selected from those biomarkers in Tables 1, 3, 4B, 6B, 9, 10, 11, 12, 13, and/or
Figure 2 and/or 3 having p values of less than 0.05 and/or those biomarkers in Tables 1, 3, 4B, 6B, 9, 10, 11, 12, 13, and/orFigure 2 and/or 3 having q values of less than 0.10. - 4. The method of 2, wherein the method is a method of diagnosing whether a subject has steatohepatitis and wherein the sample analyzed is from a male subject and the biomarkers are selected from Table 12.
- 5. The method of 2, wherein the method is a method of diagnosing whether a subject has steatohepatitis and wherein the sample analyzed is from a female subject and the biomarkers are selected from Table 13.
- 6. The method of any one of the preceding, wherein the method is a method of diagnosing whether a subject has steatohepatitis and wherein the sample is analyzed using one or more techniques selected from the group consisting of mass spectrometry, enzymatic or biochemical reactions, clinical chemistry, ELISA, and antibody linkage.
- 7. A method according to 2, wherein the method is a method of determining whether a subject is predisposed to developing steatohepatitis and
the level(s) of glycocholate and the one or more additional biomarkers in the sample are compared to steatohepatitis-positive and/or steatohepatitis-negative reference levels of glycocholate and the one or more additional biomarkers in order to determine whether the subject is predisposed to developing steatohepatitis. - 8. A method of monitoring progression/regression of steatohepatitis in a subject comprising:
- analyzing a first biological sample from a subject to determine the level(s) of glycocholate and optionally one or more additional biomarkers for steatohepatitis in the sample, wherein the one or more biomarkers are selected from Tables 1, 3, 4B, 6B, 9, 10, 11, 12, 13, and/or
Figure 2 and/or 3 and the first sample is obtained from the subject at a first time point; - analyzing a second biological sample from a subject to determine the level(s) of glycocholate and optionally the one or more additional biomarkers, wherein the second sample is obtained from the subject at a second time point; and
- comparing the level(s) of glycocholate and optionally the one or more additional biomarkers in the first sample to the level(s) of glycocholate and optionally the one or more additional biomarkers in the second sample in order to monitor the progression/regression of steatohepatitis in the subject.
- analyzing a first biological sample from a subject to determine the level(s) of glycocholate and optionally one or more additional biomarkers for steatohepatitis in the sample, wherein the one or more biomarkers are selected from Tables 1, 3, 4B, 6B, 9, 10, 11, 12, 13, and/or
- 9. A method of assessing the efficacy of a composition for treating steatohepatitis comprising:
- analyzing, from a subject having steatohepatitis and currently or previously being treated with a composition, a biological sample to determine the level(s) of glycocholate and optionally one or more additional biomarkers for steatohepatitis selected from Tables 1, 3, 4B, 6B, 9, 10, 11, 12, 13, and/or
Figure 2 and/or 3; and - comparing the level(s) of glycocholate and optionally the one or more additional biomarkers in the sample to (a) levels of glycocholate and optionally the one or more additional biomarkers in a previously-taken biological sample from the subject, wherein the previously-taken biological sample was obtained from the subject before being treated with the composition, (b) steatohepatitis-positive reference levels of glycocholate and optionally the one or more additional biomarkers, and/or (c) steatohepatitis-negative reference levels of glycocholate and optionally the one or more additional biomarkers.
- analyzing, from a subject having steatohepatitis and currently or previously being treated with a composition, a biological sample to determine the level(s) of glycocholate and optionally one or more additional biomarkers for steatohepatitis selected from Tables 1, 3, 4B, 6B, 9, 10, 11, 12, 13, and/or
- 10. A method for assessing the efficacy of a composition in treating steatohepatitis, comprising:
- analyzing a first biological sample from a subject to determine the level(s) of glycocholate and optionally one or more additional biomarkers for steatohepatitis selected from Tables 1, 3, 4B, 6B, 9, 10, 11, 12, 13, and/or
Figure 2 and/or 3, the first sample obtained from the subject at a first time point; - analyzing a second biological sample from the subject administered with the composition to determine the level(s) of glycocholate and optionally the one or more additional biomarkers, the second sample obtained from the subject at a second time point after administration of the composition;
- comparing the level(s) of glycocholate and optionally the one or more additional biomarkers in the first sample to the level(s) of glycocholate and optionally the one or more additional biomarkers in the second sample in order to assess the efficacy of the composition for treating steatohepatitis.
- analyzing a first biological sample from a subject to determine the level(s) of glycocholate and optionally one or more additional biomarkers for steatohepatitis selected from Tables 1, 3, 4B, 6B, 9, 10, 11, 12, 13, and/or
- 11. A method for screening a composition for activity in modulating glycocholate and optionally one or more additional biomarkers of steatohepatitis, comprising:
- contacting one or more cells with a composition;
- analyzing at least a portion of the one or more cells or a biological sample associated with the cells to determine the level(s) of glycocholate and optionally one or more additional biomarkers of steatohepatitis selected from Tables 1, 3, 4B, 6B, 9, 10, 11, 12, 13, and/or
Figure 2 and/or 3; and - comparing the level(s) of glycocholate and optionally the one or more additional biomarkers with predetermined standard levels for glycocholate and optionally the one or more additional biomarkers to determine whether the composition modulated the level(s) of glycocholate and optionally the one or more additional biomarkers.
- 12. Use of a biomarker, or plurality of biomarkers, in the diagnosis of steatohepatitis, wherein said biomarker or plurality of biomarkers comprises glycocholate and optionally one or more additional biomarkers selected from Tables 1, 3, 4B, 6B, 9, 10, 11, 12, 13, and/or
Figure 2 and/or 3. - 13. A method of distinguishing NAFLD from NASH in a subject having liver disease or disorder, comprising:
- analyzing a biological sample from a subject to determine the level(s) of glycocholate and optionally one or more additional biomarkers for NAFLD and/or NASH in the sample, wherein the one or more biomarkers are selected from Tables 1, 2, 3, 4B, 5B, 6B, 8, 9, 10, 11, 12, 13, and
Figures 1 ,2 ,3 - comparing the level(s) of glycocholate and optionally the one or more additional biomarkers in the sample to NAFLD-positive reference levels that distinguish over NASH and/or to NASH-positive reference levels that distinguish over NAFLD in order to determine whether the subject has NASH.
- analyzing a biological sample from a subject to determine the level(s) of glycocholate and optionally one or more additional biomarkers for NAFLD and/or NASH in the sample, wherein the one or more biomarkers are selected from Tables 1, 2, 3, 4B, 5B, 6B, 8, 9, 10, 11, 12, 13, and
- 14. The method of 1, further comprising analyzing the biological sample from the subject to determine level(s) of one or more additional biomarkers for steatohepatitis in the sample, wherein the one or more additional biomarkers are selected from the group consisting of glycochenodeoxycholate, taurocholate, butyryl carnitine, gamma glutamyltyrosine, kynurenine, glutamyl valine, gamma glutamylphenylalanine, gamma glutamylleucine, glutamate, carnitine, propionylcarnitine, and combinations thereof, and
comparing the level(s) of the one or more additional biomarkers in the sample to steatohepatitis-positive and/or steatohepatitis-negative reference levels of the one or more additional biomarkers in order to diagnose whether the subject has, or is predisposed to, steatohepatitis. - 15. The method of 14, wherein the biological sample is analyzed using one or more techniques selected from the group consisting of mass spectrometry, enzymatic or biochemical reactions, clinical chemistry, ELISA, and antibody linkage.
- 16. The method of 15, wherein the biological sample is a plasma sample or a urine sample.
- 17. The method of 14, wherein the one or more additional biomarkers are selected from the group consisting of glycochenodeoxycholate, taurocholate, and combinations thereof.
-
Figure 1 provides one embodiment of biomarker compounds that are important in distinguishing steatosis subjects and Control subjects. -
Figure 2 provides one embodiment of biomarker compounds that are important in distinguishing steatohepatitis subjects from control subjects. -
Figure 3 provides an embodiment of biomarker compounds that are important in distinguishing steatosis, steatohepatitis and control subjects. -
Figure 4 provides one example of recursive partitioning results showing the classification of Control and steatosis subjects using the biomarkers identified in Table 8. -
Figure 5 provides an example of recursive partitioning results showing the classification of steatosis and steatohepatitis (NASH, SH) using the biomarkers listed in Table 9. -
Figure 6 provides an example of recursive partitioning results showing the classification of control and steatohepatitis using the biomarkers listed in Table 10. -
Figure 7 provides an example of recursive partitioning results showing the use of the biomarkers to classify steatosis, steatohepatitis and control subjects using the biomarkers listed in Table 11. - The present disclosure relates to biomarkers of steatosis and steatohepatitis, methods for diagnosis (or assisting in the diagnosis) of steatosis and/or steatohepatitis, methods of distinguishing between hepatic steatosis and steatohepatitis, methods of distinguishing between NAFLD and NASH, methods of determining predisposition to steatohepatitis, fibrosis and cirrhosis, methods of monitoring progression/regression of steatohepatitis, methods of assessing efficacy of compositions for treating steatohepatitis, methods of screening compositions for activity in modulating biomarkers of steatohepatitis, methods of treating steatohepatitis, as well as other methods based on biomarkers of steatosis and steatohepatitis. Prior to describing this invention in further detail, however, the following terms will first be defined. Definitions:
- "Biomarker" means a compound, preferably a metabolite, that is differentially present (i.e., increased or decreased) in a biological sample from a subject or a group of subjects having a first phenotype (e.g., having a disease) as compared to a biological sample from a subject or group of subjects having a second phenotype (e.g., not having the disease). A biomarker may be differentially present at any level, but is generally present at a level that is increased by at least 5%, by at least 10%, by at least 15%, by at least 20%, by at least 25%, by at least 30%, by at least 35%, by at least 40%, by at least 45%, by at least 50%, by at least 55%, by at least 60%, by at least 65%, by at least 70%, by at least 75%, by at least 80%, by at least 85%, by at least 90%, by at least 95%, by at least 100%, by at least 110%, by at least 120%, by at least 130%, by at least 140%, by at least 150%, or more; or is generally present at a level that is decreased by at least 5%, by at least 10%, by at least 15%, by at least 20%, by at least 25%, by at least 30%, by at least 35%, by at least 40%, by at least 45%, by at least 50%, by at least 55%, by at least 60%, by at least 65%, by at least 70%, by at least 75%, by at least 80%, by at least 85%, by at least 90%, by at least 95%, or by 100% (i.e., absent). A biomarker is preferably differentially present at a level that is statistically significant (i.e., a p-value less than 0.05 and/or a q-value of less than 0.10 as determined using either Welch's T-test or Wilcoxon's rank-sum Test).
- The "level" of one or more biomarkers means the absolute or relative amount or concentration of the biomarker in the sample.
- "Sample" or "biological sample" means biological material isolated from a subject. The biological sample may contain any biological material suitable for detecting the desired biomarkers, and may comprise cellular and/or non-cellular material from the subject. The sample can be isolated from any suitable biological tissue or fluid such as, for example, tissue, blood, blood plasma, urine, or cerebral spinal fluid (CSF).
- "Subject" means any animal, but is preferably a mammal, such as, for example, a human, monkey, non-human primate, mouse, or rabbit.
- A "reference level" of a biomarker means a level of the biomarker that is indicative of a particular disease state, phenotype, or predisposition to developing a particular disease state or phenotype, or lack thereof, as well as combinations of disease states, phenotypes, or predisposition to developing a particular disease state or phenotype, or lack thereof. A "positive" reference level of a biomarker means a level that is indicative of a particular disease state or phenotype. A "negative" reference level of a biomarker means a level that is indicative of a lack of a particular disease state or phenotype. For example, a "NASH-positive reference level" of a biomarker means a level of a biomarker that is indicative of a positive diagnosis of NASH in a subject, and a "NASH-negative reference level" of a biomarker means a level of a biomarker that is indicative of a negative diagnosis of NASH in a subject. A "reference level" of a biomarker may be an absolute or relative amount or concentration of the biomarker, a presence or absence of the biomarker, a range of amount or concentration of the biomarker, a minimum and/or maximum amount or concentration of the biomarker, a mean amount or concentration of the biomarker, and/or a median amount or concentration of the biomarker; and, in addition, "reference levels" of combinations of biomarkers may also be ratios of absolute or relative amounts or concentrations of two or more biomarkers with respect to each other. Appropriate positive and negative reference levels of biomarkers for a particular disease state, phenotype, or lack thereof may be determined by measuring levels of desired biomarkers in one or more appropriate subjects, and such reference levels may be tailored to specific populations of subjects (e.g., a reference level may be age-matched or gender-matched so that comparisons may be made between biomarker levels in samples from subjects of a certain age or gender and reference levels for a particular disease state, phenotype, or lack thereof in a certain age or gender group). Such reference levels may also be tailored to specific techniques that are used to measure levels of biomarkers in biological samples (e.g., LC-MS, GC-MS, etc.), where the levels of biomarkers may differ based on the specific technique that is used.
- "Non-biomarker compound" means a compound that is not differentially present in a biological sample from a subject or a group of subjects having a first phenotype (e.g., having a first disease) as compared to a biological sample from a subject or group of subjects having a second phenotype (e.g., not having the first disease). Such non-biomarker compounds may, however, be biomarkers in a biological sample from a subject or a group of subjects having a third phenotype (e.g., having a second disease) as compared to the first phenotype (e.g., having the first disease) or the second phenotype (e.g., not having the first disease).
- "Metabolite", or "small molecule", means organic and inorganic molecules which are present in a cell. The term does not include large macromolecules, such as large proteins (e.g., proteins with molecular weights over 2,000, 3,000, 4,000, 5,000, 6,000, 7,000, 8,000, 9,000, or 10,000), large nucleic acids (e.g., nucleic acids with molecular weights of over 2,000, 3,000, 4,000, 5,000, 6,000, 7,000, 8,000, 9,000, or 10,000), or large polysaccharides (e.g., polysaccharides with a molecular weights of over 2,000, 3,000, 4,000, 5,000, 6,000, 7,000, 8,000, 9,000, or 10,000). The small molecules of the cell are generally found free in solution in the cytoplasm or in other organelles, such as the mitochondria, where they form a pool of intermediates which can be metabolized further or used to generate large molecules, called macromolecules. The term "small molecules" includes signaling molecules and intermediates in the chemical reactions that transform energy derived from food into usable forms. Examples of small molecules include sugars, fatty acids, amino acids, nucleotides, intermediates formed during cellular processes, and other small molecules found within the cell.
- "Metabolic profile", or "small molecule profile", means a complete or partial inventory of small molecules within a targeted cell, tissue, organ, organism, or fraction thereof(e.g., cellular compartment). The inventory may include the quantity and/or type of small molecules present. The "small molecule profile" may be determined using a single technique or multiple different techniques.
- "Metabolome" means all of the small molecules present in a given organism.
- "Steatosis" refers to fatty liver disease without the presence of inflammation. The condition can occur with the use of alcohol or in the absence of alcohol use.
- "Non-alcoholic fatty liver disease" (NAFLD) refers to fatty liver disease (steatosis) that occurs in subjects even in the absence of consumption of alcohol in amounts considered harmful to the liver.
- "Steatohepatitis" refers to fatty liver disease that is associated with inflammation. Steatohepatitis can progress to cirrhosis and can be associated with hepatocellular carcinoma. The condition can occur with the use of alcohol or in the absence of alcohol use.
- "Non-alcoholic steatohepatitis" (NASH) refers to steatohepatitis that occurs in subjects even in the absence of consumption of alcohol in amounts considered harmful to the liver. NASH can progress to cirrhosis and can be associated with hepatocellular carcinoma.
- The NAFLD and NASH biomarkers described herein were discovered using metabolomic profiling techniques. Such metabolomic profiling techniques are described in more detail in the Examples set forth below as well as in
U.S. Patent No. 7,005,255 andU.S. Patent Application Nos. 11/357,732 ,10/695,265 2005/0014132 ),11/301,077 2006/0134676 ),11/301,078 2006/0134677 ),11/301,079 2006/0134678 ), and11/405,033 - Generally, metabolic profiles were determined for biological samples from human subjects diagnosed with steatosis as well as from one or more other groups of human subjects (e.g., healthy control subjects not diagnosed with steatosis), as well as from human subjects diagnosed with NASH. The metabolic profile for biological samples from a subject having steatosis was compared to the metabolic profile for biological samples from the one or more other groups of subjects. Those molecules differentially present, including those molecules differentially present at a level that is statistically significant, in the metabolic profile of samples from subjects with steatosis as compared to another group (e.g., healthy control subjects not diagnosed with steatosis) were identified as biomarkers to distinguish those groups. In addition, those molecules differentially present, including those molecules differentially present at a level that is statistically significant, in the metabolic profile of samples from subjects with steatosis as compared to NASH were also identified as biomarkers to distinguish those groups.
- The biomarkers are discussed in more detail herein. The biomarkers that were discovered correspond with the following group(s):
- Biomarkers for distinguishing subjects having steatosis vs. control subjects not diagnosed with liver disease (see Tables 2, 4B, 5B, 8, 11, 12, 13,
Figure 1 (gamma-glutamyltyrosine, taurocholate, butyrylcarnitine, Metabolite - 11235, Tyrosine, uridine, glutamate, Metabolite - 11304, Metabolite - 4611, Metabolite - 6488, 10c-undecenoate, Metabolite - 11431, Metabolite - 3107, Glutamylvaline, Metabolite - 11230, Metabolite - 3083, Metabolite - 11491, Metabolite - 10432, Metabolite - 11422, Metabolite - 11728, Metabolite - 10914, Metabolite - 11432, Metabolite - 11314, Metabolite - 12035, Metabolite - 11242, Metabolite - 11529, Metabolite - 11897, gamma-glutamylphenylalanine-, Metabolite - 11628, Metabolite - 3108, Alanine, glycocholate, Isobar 47 (taurochenodeoxycholic acid, taurodeoxycholic acid), Isobar 66 (glycochenodeoxycholic acid, glychodeoxycholic acid), Lactate, mannose, Metabolite-10026, Metabolite-10951, Metabolite-2347, Metabolite-2821, Metabolite-3016, Metabolite-3019, Metabolite-3025, Metabolite-3026, Metabolite-3073, Metabolite-3077, Metabolite-3098, Metabolite-3165, Metabolite-3330, Metabolite-4167, Metabolite-4361, Metabolite-4759, Metabolite-4806, Metabolite-5346, Metabolite-5769, Metabolite-8506, Thyroxine, urate), andFigure 3 (gamma-glutamyltyrosine, glutamate, Metabolite - 11728, butyrylcarnitine, taurocholate, glutamylvaline tyrosine, Metabolite - 11422, kynurenine, glycocholate, gamma-tocopherol, Metabolite - 11431, creatine, Metabolite - 10914, Metabolite - 11235, hippurate, Metabolite - 11529, Metabolite - 4611, Metabolite - 01911, Metabolite - 11491, glycerophosphorylcholine (GPC), urate-, gamma-glutamylphenylalanine-, Metabolite -11230, 10c-undecenoate, Metabolite - 11315, histidine, Metabolite - 11304, Metabolite - 11432, Metabolite - 11242, alanine, isocitrate, isoleucine, lactate, leucine, mannose, Metabolite - 10026, Metabolite - 10812, Metabolite - 1496, Metabolite - 1911, Metabolite - 2395, Metabolite - 3016, Metabolite - 3026, Metabolite - 3073, Metabolite - 3098, Metabolite - 3330, Metabolite - 4274, Metabolite - 5769, Metabolite - 7187, Metabolite - 8506, Metabolite - 9855, theobromine, thryoxine, urate, valine, xanthine)); - Biomarkers for distinguishing subjects having NASH vs. control subjects not diagnosed with liver disease (see Tables 1, 6B, 10, 11, 12, 13,
Figure 2 (Metabolite - 11728, Kynurenine, glycocholate, butyrylcarnitine, glutamate, gamma-glutamyltyrosine, hippurate, Metabolite - 10914, Metabolite - 11422, gamma-tocopherol-, Metabolite - 11564, Glutamylvaline, Metabolite - 11205, Metabolite - 11431, urate, Metabolite - 02272, Tyrosine, Metabolite - 11231, gamma-glutamylphenylalanine, mannose, Metabolite - 03951, Metabolite - 11315, Metabolite - 11529, Metabolite - 4611, 10c-undecenoate, Metabolite - 11432, Metabolite - 4147, Metabolite - 11227, Taurocholate, Metabolite - 11380, 3-methyl-2-oxobutyric acid, Alanine, glutamine, isocitrate, isoleucine, leucine, meso-erythritol, Metabolite-10026, Metabolite-10812, Metabolite-1086, Metabolite-1110, Metabolite-1335, Metabolite-1496, Metabolite-2041, Metabolite-2272, Metabolite-2395, Metabolite-3073, Metabolite-3087, Metabolite-3098, Metabolite-4274, Metabolite-5769, Metabolite-7187, Valine, xanthine)); - Biomarkers for distinguishing subjects having steatohepatitis (NASH) vs. subjects having steatosis (see Tables 3, 4B, 9, 11, 12, 13, and
Figure 3 (gamma-glutamyltyrosine, glutamate, Metabolite - 11728, butyrylcarnitine, taurocholate, glutamylvaline tyrosine, Metabolite - 11422, kynurenine, glycocholate, gamma-tocopherol, Metabolite - 11431, creatine, Metabolite - 10914, Metabolite - 11235, hippurate, Metabolite - 11529, Metabolite - 4611, Metabolite - 01911, Metabolite - 11491, glycerophosphorylcholine (GPC), urate-, gamma-glutamylphenylalanine-, Metabolite - 11230, 10c-undecenoate, Metabolite - 11315, histidine, Metabolite - 11304, Metabolite - 11432, Metabolite - 11242, alanine, isocitrate, isoleucine, lactate, leucine, mannose, Metabolite - 10026, Metabolite - 10812, Metabolite - 1496, Metabolite - 1911, Metabolite - 2395, Metabolite - 3016, Metabolite - 3026, Metabolite - 3073, Metabolite - 3098, Metabolite - 3330, Metabolite - 4274, Metabolite - 5769, Metabolite - 7187, Metabolite - 8506, Metabolite - 9855, theobromine, thryoxine, urate, valine, xanthine)); - Although the identities of some of the biomarkers compounds are not known at this time, such identities are not necessary for the identification of the biomarkers in biological samples from subjects, as the "unnamed" compounds have been sufficiently characterized by analytical techniques to allow such identification. The analytical characterization of all such "unnamed" compounds is listed in the Examples. Such "unnamed" biomarkers are designated herein using the nomenclature "Metabolite" followed by a specific metabolite number.
- Any number of biomarkers may be used in the methods disclosed herein. That is, the disclosed methods may include the determination of the level(s) of one biomarker, two or more biomarkers, three or more biomarkers, four or more biomarkers, five or more biomarkers, six or more biomarkers, seven or more biomarkers, eight or more biomarkers, nine or more biomarkers, ten or more biomarkers, fifteen or more biomarkers, etc., including a combination of all of the biomarkers in each or all of Tables 1, 2, 3, 4B, 5B, 6B, 8, 9, 11, 12, 13,
Figure 1 ,Figure 3 or any fraction or combination thereof. In another aspect, the number of biomarkers for use in the disclosed methods include the levels of about thirty or less biomarkers, twenty-five or less, twenty or less, fifteen or less, ten or less, nine or less, eight or less, seven or less, six or less, five or less biomarkers. In another aspect, the number of biomarkers for use in the disclosed methods include the levels of one, two, three, four, five, six, seven, eight, nine, ten, eleven, twelve, thirteen, fourteen, fifteen, twenty, twenty-five, or thirty biomarkers. - In addition, the methods disclosed herein using the biomarkers listed in the tables may be used in combination with clinical diagnostic measures of fatty liver diseases. Combinations with clinical diagnostics may facilitate the disclosed methods, or confirm results of the disclosed methods (for example, facilitating or confirming diagnosis, monitoring progression or regression, and/or determining predisposition to fatty liver diseases).
- The identification of biomarkers for steatosis allows for the diagnosis of (or for aiding in the diagnosis of) steatosis in subjects presenting one or more symptoms of liver dysfunction. A method of diagnosing (or aiding in diagnosing) whether a subject has steatosis comprises (1) analyzing a biological sample from a subject to determine the level(s) of one or more biomarkers of steatosis in the sample and (2) comparing the level(s) of the one or more biomarkers in the sample to steatosis-positive and/or steatosis-negative reference levels of the one or more biomarkers in order to diagnose (or aid in the diagnosis of) whether the subject has steatosis. The one or more biomarkers that are used are selected from Tables 2, 3, 4B, 5B, 8, 9, 11, 12, 13,
Figure 1 ,Figure 3 and combinations thereof. When such a method is used to aid in the diagnosis of steatosis, the results of the method may be used along with other methods (or the results thereof) useful in the clinical determination of whether a subject has steatosis. - In one embodiment for the diagnosis of (or for aiding in the diagnosis of) steatosis, the method comprises (1) analyzing a biological sample from a subject to determine the level(s) of one or more biomarkers of steatosis in the sample and (2) comparing the level(s) of the one or more biomarkers in the sample to steatosis-positive and/or steatosis-negative reference levels of the one or more biomarkers in order to diagnose (or aid in the diagnosis of) whether the subject has steatosis, and the one or more biomarkers that are used are selected from Tables 2, 3, 4B, 5B, 8, 9, 11, 12, 13,
Figure 1 ,Figure 3 and combinations thereof. - In an embodiment for the diagnosis of (or for aiding in the diagnosis of) steatohepatitis, the method comprises (1) analyzing a biological sample from a subject to determine the level(s) of one or more biomarkers of steatohepatitis in the sample and (2) comparing the level(s) of the one or more biomarkers in the sample to steatohepatitis-positive and/or steatohepatitis-negative reference levels of the one or more biomarkers in order to diagnose (or aid in the diagnosis of) whether the subject has steatohepatitis, and the one or more biomarkers that are used are selected from Tables 1, 3, 4B, 6B, 9, 10, 11, 12, 13,
Figure 2 ,Figure 3 and combinations thereof. - In an embodiment for the diagnosis of (or for aiding in the diagnosis of) NASH, the method comprises (1) analyzing a biological sample from a subject to determine the level(s) of one or more biomarkers of NASH in the sample and (2) comparing the level(s) of the one or more biomarkers in the sample to NASH-positive and/or NASH-negative reference levels of the one or more biomarkers in order to diagnose (or aid in the diagnosis of) whether the subject has NASH, and the one or more biomarkers that are used are selected from Tables 1, 3, 4B, 6B, 9, 10, 11, 12, 13,
Figure 2 ,Figure 3 and combinations thereof. - Any suitable method may be used to analyze the biological sample in order to determine the level(s) of the one or more biomarkers in the sample. Suitable methods include chromatography (e.g., HPLC, gas chromatography, liquid chromatography), mass spectrometry (e.g., MS, MS-MS), enzymatic or biochemical reactions, clinical chemistry, enzyme-linked immunosorbent assay (ELISA), antibody linkage, other immunochemical techniques, and combinations thereof. Further, the level(s) of the one or more biomarkers may be measured indirectly, for example, by using an assay that measures the level of a compound (or compounds) that correlates with the level of the biomarker(s) that are desired to be measured.
- The levels of one or more of the biomarkers of Tables 1, 2, 3, 4B, 5B, 6B, 8, 9, 10, 11, 12, 13,
Figure 1 ,Figure 2 ,Figure 3 may be determined in the methods of diagnosing and methods of aiding in diagnosing whether a subject has steatosis or steatohepatitis. For example, the level(s) of one biomarker, two or more biomarkers, three or more biomarkers, four or more biomarkers, five or more biomarkers, six or more biomarkers, seven or more biomarkers, eight or more biomarkers, nine or more biomarkers, ten or more biomarkers, etc., including a combination of all of the biomarkers in Tables 1, 2, 3, 4B, 5B, 6B, 8, 9, 10, 11, 12, 13,Figure 1 ,Figure 2 ,Figure 3 or any fraction thereof, may be determined and used in such methods. Determining levels of combinations of the biomarkers may allow greater sensitivity and specificity in diagnosing steatosis and aiding in the diagnosis of steatosis, and may allow better differentiation of steatosis from other liver disorders (e.g. fibrosis, cirrhosis, liver cancer, etc.) that may have similar or overlapping biomarkers to steatosis (as compared to a subject not having steatosis). For example, ratios of the levels of certain biomarkers (and non-biomarker compounds) in biological samples may allow greater sensitivity and specificity in diagnosing steatosis and aiding in the diagnosis of steatosis and may allow better differentiation of steatosis from other liver disorders that may have similar or overlapping biomarkers to steatosis (as compared to a subject not having steatosis). - One or more biomarkers that are specific for diagnosing steatosis or steatohepatitis (or aiding in diagnosing steatosis or steatohepatitis) in a certain type of sample (e.g., liver tissue sample, liver biopsy, urine sample, or blood plasma sample) may also be used. For example, when the biological sample is plasma, one or more biomarkers listed in Tables 2, 4B, 5B, 8, 11, 12, 13,
Figure 1 ,Figure 3 may be used to diagnose (or aid in diagnosing) whether a subject has steatosis. - After the level(s) of the one or more biomarkers in the sample are determined, the level(s) are compared to steatosis-positive and/or steatosis-negative reference levels (or steatohepatitis-positive and/or steatohepatitis-negative reference levels) to aid in diagnosing or to diagnose whether the subject has steatosis (or steatohepatitis). Levels of the one or more biomarkers in a sample matching the steatosis-positive reference levels (e.g., levels that are the same as the reference levels, substantially the same as the reference levels, above and/or below the minimum and/or maximum of the reference levels, and/or within the range of the reference levels) are indicative of a diagnosis of steatosis in the subject. Levels of the one or more biomarkers in a sample matching the steatosis-negative reference levels (e.g., levels that are the same as the reference levels, substantially the same as the reference levels, above and/or below the minimum and/or maximum of the reference levels, and/or within the range of the reference levels) are indicative of a diagnosis of no steatosis in the subject. In addition, levels of the one or more biomarkers that are differentially present (especially at a level that is statistically significant) in the sample as compared to steatosis-negative reference levels are indicative of a diagnosis of steatosis in the subject. Levels of the one or more biomarkers that are differentially present (especially at a level that is statistically significant) in the sample as compared to steatosis-positive reference levels are indicative of a diagnosis of no steatosis in the subject.
- The level(s) of the one or more biomarkers may be compared to steatosis-positive and/or steatosis-negative and/or steatohepatitis-positive and/or steatohepatitis-negative reference levels using various techniques, including a simple comparison (e.g., a manual comparison) of the level(s) of the one or more biomarkers in the biological sample to steatosis-positive and/or steatosis-negative and/or steatohepatitis-positive and/or steatohepatitis-negative reference levels. The level(s) of the one or more biomarkers in the biological sample may also be compared to steatosis-positive and/or steatosis-negative and/or steatohepatitis-positive and/or steatohepatitis-negative reference levels using one or more statistical analyses (e.g., t-test, Welch's T-test, Wilcoxon's rank sum test, ANOVA, recursive partitioning, random forest).
- In addition, the biological samples may be analyzed to determine the level(s) of one or more non-biomarker compounds. The level(s) of such non-biomarker compounds may also allow differentiation of steatosis from other liver disorders that may have similar or overlapping biomarkers to steatosis and/or steatohepatitis (as compared to a subject not having a liver disorder). For example, a known non-biomarker compound present in biological samples of subjects having steatosis and subjects not having steatosis could be monitored to verify a diagnosis of steatosis as compared to a diagnosis of another liver disorder when biological samples from subjects having the liver disorder do not have the non-biomarker compound.
- The methods of diagnosing (or aiding in diagnosing) whether a subject has steatosis may also be conducted specifically to diagnose (or aid in diagnosing) whether a subject has NAFLD and/or steatohepatitis (e.g. NASH). Such methods comprise (1) analyzing a biological sample from a subject to determine the level(s) of one or more biomarkers of NAFLD (and/or NASH) in the sample and (2) comparing the level(s) of the one or more biomarkers in the sample to NAFLD-positive and/or NAFLD-negative reference levels (or NASH-positive and/or NASH-negative reference levels) in order to diagnose (or aid in the diagnosis of) whether the subject has NAFLD (or NASH). Biomarker specific for NAFLD are listed in Tables 2, 4B, 5B, 8, 11, 12, 13,
Figure 1 ,Figure 3 and biomarkers specific for NASH are listed in Tables 1, 4B, 6B, 10, 11, 12, 13,Figure 2 ,Figure 3 . - The identification of biomarkers for distinguishing NAFLD versus NASH allows NAFLD and NASH to be distinguished in patients. A method of distinguishing NAFLD from NASH in a subject having steatosis comprises (1) analyzing a biological sample from a subject to determine the level(s) in the sample of one or more biomarkers of NAFLD that distinguish over NASH and/or one or more biomarkers of NASH that distinguish over NAFLD, and (2) comparing the level(s) of the one or more biomarkers in the sample to NAFLD-positive reference levels that distinguish over NASH and/or NASH-positive reference levels that distinguish over NAFLD of the one or more biomarkers in order to determine whether the subject has NAFLD or NASH. The one or more biomarkers that may be used include those biomarkers selected from Tables 1, 2, 3, 4B, 5B, 6B, 8, 9, 10, 11, 12, 13,
Figure 1 ,Figure 2 ,Figure 3 and combinations thereof. - Any suitable method may be used to analyze the biological sample in order to determine the level(s) of the one or more biomarkers in the sample. Suitable methods include chromatography (e.g., HPLC, gas chromatography, liquid chromatography), mass spectrometry (e.g., MS, MS-MS), enzymatic or biochemical reactions, clinical chemistry, enzyme-linked immunosorbent assay (ELISA), antibody linkage, other immunochemical techniques, and combinations thereof. Further, the level(s) of the one or more biomarkers may be measured indirectly, for example, by using an assay that measures the level of a compound (or compounds) that correlates with the level of the biomarker(s) that are desired to be measured.
- The levels of one or more of the biomarkers of Tables 1, 2, 3, 4B, 5B, 6B, 8, 9, 10, 11, 12, 13,
Figure 1 ,Figure 2 ,Figure 3 may be determined in the methods of diagnosing and methods of aiding in diagnosing whether a subject has steatohepatitis. For example, the level(s) of one biomarker, two or more biomarkers, three or more biomarkers, four or more biomarkers, five or more biomarkers, six or more biomarkers, seven or more biomarkers, eight or more biomarkers, nine or more biomarkers, ten or more biomarkers, etc., including a combination of all of the biomarkers in Tables 1, 2, 3, 4B, 5B, 6B, 8, 9, 10, 11, 12, 13,Figure 1 ,Figure 2 ,Figure 3 or any fraction thereof, may be determined and used in such methods. Determining levels of combinations of the biomarkers may allow greater sensitivity and specificity in distinguishing between NAFLD and NASH. - One or more biomarkers that are specific for distinguishing between NAFLD and NASH in a certain type of sample (e.g., liver tissue sample, urine sample, or blood plasma sample) may also be used. For example, when the biological sample is blood plasma, one or more biomarkers listed in Tables 1, 2, 3, 4B, 5B, 6B, 8, 9, 10, 11, 12, 13,
Figure 1 ,Figure 2 ,Figure 3 may be used. - After the level(s) of the one or more biomarkers in the sample are determined, the level(s) are compared to NAFLD-positive reference levels that distinguish over NASH-negative and/or NASH-positive reference levels that distinguish over NAFLD of the one or more biomarkers in order to determine whether the subject has NAFLD or NASH. Levels of the one or more biomarkers in a sample matching the NAFLD-positive reference levels that distinguish over NASH (e.g., levels that are the same as the reference levels, substantially the same as the reference levels, above and/or below the minimum and/or maximum of the reference levels, and/or within the range of the reference levels) are indicative of NAFLD in the subject. Levels of the one or more biomarkers in a sample matching the NASH-positive reference levels that distinguish over NAFLD (e.g., levels that are the same as the reference levels, substantially the same as the reference levels, above and/or below the minimum and/or maximum of the reference levels, and/or within the range of the reference levels) are indicative of NASH in the subject. If the level(s) of the one or more biomarkers are more similar to the NAFLD-positive reference levels that distinguish over NASH (or less similar to the NASH-positive reference levels), then the results are indicative of NAFLD in the subject. If the level(s) of the one or more biomarkers are more similar to the NASH-positive reference levels that distinguish over NAFLD (or less similar to the NAFLD-positive reference levels), then the results are indicative of NASH in the subject.
- The level(s) of the one or more biomarkers may be compared to NAFLD-positive reference levels that distinguish over NASH and/or NASH-positive reference levels that distinguish over NAFLD using various techniques, including a simple comparison (e.g., a manual comparison) of the level(s) of the one or more biomarkers in the biological sample to NAFLD-positive and/or NASH-positive reference levels. The level(s) of the one or more biomarkers in the biological sample may also be compared to NAFLD-positive reference levels that distinguish over NASH and/or NASH-positive reference levels that distinguish over NAFLD using one or more statistical analyses (e.g., t-test, Welch's T-test, Wilcoxon's rank sum test, ANOVA, recursive partitioning, random forest).
- In addition, the biological samples may be analyzed to determine the level(s) of one or more non-biomarker compounds. The level(s) of such non-biomarker compounds may also allow differentiation of NAFLD from NASH.
- The identification of biomarkers for steatosis and steatohepatitis also allows for the determination of whether a subject having no symptoms of steatohepatitis or steatosis is predisposed to developing steatohepatitis or steatosis. For example, a method of determining whether a subject having no symptoms of steatohepatitis is predisposed to developing steatohepatitis comprises (1) analyzing a biological sample from a subject to determine the level(s) of one or more biomarkers listed in Tables 1, 3, 4B, 6B, 9, 10, 11, 12, 13,
Figure 2 ,Figure 3 in the sample and (2) comparing the level(s) of the one or more biomarkers in the sample to steatohepatitis-positive and/or steatohepatitis-negative reference levels of the one or more biomarkers in order to determine whether the subject is predisposed to developing steatohepatitis. The results of the method may be used along with other methods (or the results thereof) useful in the clinical determination of whether a subject is predisposed to developing steatohepatitis. - As described above in connection with methods of diagnosing (or aiding in the diagnosis of) steatohepatitis, any suitable method may be used to analyze the biological sample in order to determine the level(s) of the one or more biomarkers in the sample.
- As with the methods of diagnosing (or aiding in the diagnosis of) steatohepatitis or steatosis described above, the level(s) of one biomarker, two or more biomarkers, three or more biomarkers, four or more biomarkers, five or more biomarkers, six or more biomarkers, seven or more biomarkers, eight or more biomarkers, nine or more biomarkers, ten or more biomarkers, etc., including a combination of all of the biomarkers, for example, in Tables 1, 3, 4B, 6B, 9, 10, 11, 12, 13,
Figure 2 ,Figure 3 or any fraction thereof, may be determined and used in methods of determining whether a subject having no symptoms of steatohepatitis is predisposed to developing steatohepatitis. - After the level(s) of the one or more biomarkers in the sample are determined, the level(s) are compared to, for example, steatohepatitis-positive and/or steatohepatitis-negative reference levels in order to predict whether the subject is predisposed to developing steatohepatitis. Levels of the one or more biomarkers in a sample matching the steatohepatitis-positive reference levels (e.g., levels that are the same as the reference levels, substantially the same as the reference levels, above and/or below the minimum and/or maximum of the reference levels, and/or within the range of the reference levels) are indicative of the subject being predisposed to developing steatohepatitis. Levels of the one or more biomarkers in a sample matching the steatohepatitis-negative reference levels (e.g., levels that are the same as the reference levels, substantially the same as the reference levels, above and/or below the minimum and/or maximum of the reference levels, and/or within the range of the reference levels) are indicative of the subject not being predisposed to developing steatohepatitis. In addition, levels of the one or more biomarkers that are differentially present (especially at a level that is statistically significant) in the sample as compared to steatohepatitis-negative reference levels are indicative of the subject being predisposed to developing steatohepatitis. Levels of the one or more biomarkers that are differentially present (especially at a level that is statistically significant) in the sample as compared to steatohepatitis-positive reference levels are indicative of the subject not being predisposed to developing steatohepatitis.
- Furthermore, it may also be possible to determine reference levels specific to assessing whether or not a subject that does not have steatohepatitis is predisposed to developing steatohepatitis. For example, it may be possible to determine reference levels of the biomarkers for assessing different degrees of risk (e.g., low, medium, high) in a subject for developing steatohepatitis. Such reference levels could be used for comparison to the levels of the one or more biomarkers in a biological sample from a subject.
- As with the methods described above, the level(s) of the one or more biomarkers may be compared to steatohepatitis-positive and/or steatohepatitis-negative reference levels using various techniques, including a simple comparison, one or more statistical analyses, and combinations thereof.
- As with the methods of diagnosing (or aiding in diagnosing) whether a subject has steatohepatitis and/or steatosis, the methods of determining whether a subject having no symptoms of steatohepatitis or steatosis is predisposed to developing steatosis or steatohepatitis may further comprise analyzing the biological sample to determine the level(s) of one or more non-biomarker compounds.
- The methods of determining whether a subject having no symptoms of steatohepatitis is predisposed to developing steatohepatitis may also be conducted specifically to determine whether a subject having no symptoms of steatohepatitis is predisposed to developing NAFLD and/or NASH. Biomarker specific for NAFLD are listed in Tables 2, 4B, 5B, 8, 11, 12, 13,
Figure 1 ,Figure 3 and biomarkers specific for NASH are listed in Tables 1, 4B, 6B, 10, 11, 12, 13,Figure 2 ,Figure 3 . - In addition, methods of determining whether a subject having NAFLD is predisposed to developing NASH may be conducted using one or more biomarkers selected from Tables 1, 4B, 6B, 10, 11, 12, 13,
Figure 2 ,Figure 3 . - The identification of biomarkers for steatosis and steatohepatitis also allows for monitoring progression/regression of steatosis and/or steatohepatitis in a subject. For example, a method of monitoring the progression/regression of steatosis in a subject comprises (1) analyzing a first biological sample from a subject to determine the level(s) of one or more biomarkers for steatosis selected from Tables 2, 3, 4B, 6B, 8, 9, 11, 12, 13,
Figure 1 ,Figure 3 , the first sample obtained from the subject at a first time point, (2) analyzing a second biological sample from a subject to determine the level(s) of the one or more biomarkers, the second sample obtained from the subject at a second time point, and (3) comparing the level(s) of one or more biomarkers in the first sample to the level(s) of the one or more biomarkers in the second sample in order to monitor the progression/regression of steatosis in the subject. The results of the method are indicative of the course of steatosis (i.e., progression or regression, if any change) in the subject. - The change (if any) in the level(s) of the one or more biomarkers over time may be indicative of progression or regression of steatosis in the subject. In order to characterize the course of steatosis in the subject, the level(s) of the one or more biomarkers in the first sample, the level(s) of the one or more biomarkers in the second sample, and/or the results of the comparison of the levels of the biomarkers in the first and second samples may be compared to steatosis-positive, steatosis-negative, NAFLD-positive, NAFLD-negative, high-grade steatosis-positive, and/or NASH-negative reference levels as well as NAFLD-positive reference levels that distinguish over NASH and/or NASH-positive reference levels that distinguish over NAFLD. If the comparisons indicate that the level(s) of the one or more biomarkers are increasing or decreasing over time (e.g., in the second sample as compared to the first sample) to become more similar to the steatosis-positive reference levels (or less similar to the steatosis-negative reference levels), to the NASH reference levels, or, when the subject initially has NAFLD, to the NASH-positive reference levels that distinguish over NAFLD, then the results are indicative of steatosis progression. If the comparisons indicate that the level(s) of the one or more biomarkers are increasing or decreasing over time to become more similar to the steatosis-negative reference levels (or less similar to the steatosis-positive reference levels), or, when the subject initially has NASH, to NAFLD reference levels and/or to NAFLD-positive reference levels that distinguish over NASH, then the results are indicative of steatosis regression.
- As with the other methods described herein, the comparisons made in the methods of monitoring progression/regression of steatosis in a subject may be carried out using various techniques, including simple comparisons, one or more statistical analyses, and combinations thereof.
- The results of the method may be used along with other methods (or the results thereof) useful in the clinical monitoring of progression/regression of steatosis in a subject.
- As described above in connection with methods of diagnosing (or aiding in the diagnosis of) steatosis, any suitable method may be used to analyze the biological samples in order to determine the level(s) of the one or more biomarkers in the samples. In addition, the level(s) of one or more biomarkers, including a combination of all of the biomarkers in Tables 2, 4B, 5B, 8, 11, 12, 13,
Figure 1 ,Figure 3 or any fraction thereof, may be determined and used in methods of monitoring progression/regression of steatosis in a subject. - Such methods could be conducted to monitor the course of steatosis in subjects having steatosis or could be used in subjects not having steatosis (e.g., subjects suspected of being predisposed to developing steatosis) in order to monitor levels of predisposition to steatosis.
- Such methods could be conducted to monitor the course of steatohepatitis in subjects having steatohepatitis or could be used in subjects not having steatohepatitis (e.g., subjects suspected of being predisposed to developing steatohepatitis) in order to monitor levels of predisposition to steatohepatitis. The levels(s) of one or more biomarkers, including a combination of all of the biomarkers in Tables 1, 3, 4B, 6B, 9, 10, 11, 12, 13,
Figure 2 and/orFigure 3 , or any fraction thereof, may be determined and used in methods of monitoring progression/regression of steatohepatitis in a subject. - The identification of biomarkers for steatohepatitis and steatosis also allows for assessment of the efficacy of a composition for treating steatohepatitis and/or steatosis as well as the assessment of the relative efficacy of two or more compositions for treating steatohepatitis and/or steatosis. Such assessments may be used, for example, in efficacy studies as well as in lead selection of compositions for treating steatohepatitis or steatosis.
- For example, a method of assessing the efficacy of a composition for treating steatohepatitis comprises (1) analyzing, from a subject having steatohepatitis and currently or previously being treated with a composition, a biological sample to determine the level(s) of one or more biomarkers selected from Tables 1, 3, 4B, 6B, 9, 10, 11, 12, 13,
Figure 2 and/orFigure 3 , and (2 ) comparing the level(s) of the one or more biomarkers in the sample to (a) level(s) of the one or more biomarkers in a previously-taken biological sample from the subject, wherein the previously-taken biological sample was obtained from the subject before being treated with the composition, (b) steatohepatitis-positive reference levels (including NASH-positive and/or NAFLD-positive reference levels) of the one or more biomarkers, (c) steatohepatitis-negative reference levels (including NASH-negative and/or NAFLD-negative reference levels) of the one or more biomarkers, (d) NASH-positive reference levels that distinguish over NAFLD, and/or (e) NASH-positive reference levels that distinguish over NAFLD. The results of the comparison are indicative of the efficacy of the composition for treating steatohepatitis. - Thus, in order to characterize the efficacy of the composition for treating steatohepatitis, the level(s) of the one or more biomarkers in the biological sample are compared to (1) steatohepatitis-positive reference levels, (2) steatohepatitis-negative reference levels, (3) previous levels of the one or more biomarkers in the subject before treatment with the composition, (4) NASH-positive reference levels that distinguish over NAFLD, and/or (5) NAFLD-positive reference levels that distinguish over NASH.
- When comparing the level(s) of the one or more biomarkers in the biological sample (from a subject having steatohepatitis and currently or previously being treated with a composition) to steatohepatitis-positive reference levels and/or steatohepatitis-negative reference levels, level(s) in the sample matching the steatohepatitis-negative reference levels (e.g., levels that are the same as the reference levels, substantially the same as the reference levels, above and/or below the minimum and/or maximum of the reference levels, and/or within the range of the reference levels) are indicative of the composition having efficacy for treating steatohepatitis. Levels of the one or more biomarkers in the sample matching the steatohepatitis-positive reference levels (e.g., levels that are the same as the reference levels, substantially the same as the reference levels, above and/or below the minimum and/or maximum of the reference levels, and/or within the range of the reference levels) are indicative of the composition not having efficacy for treating steatohepatitis. The comparisons may also indicate degrees of efficacy for treating steatohepatitis based on the level(s) of the one or more biomarkers.
- When comparing the level(s) of the one or more biomarkers in the biological sample (from a subject having NASH and currently or previously being treated with a composition) NASH-positive reference levels that distinguish over NAFLD and/or NAFLD-positive reference levels that distinguish over NASH, level(s) in the sample matching the NASH-positive reference levels that distinguish over NAFLD (e.g., levels that are the same as the reference levels, substantially the same as the reference levels, above and/or below the minimum and/or maximum of the reference levels, and/or within the range of the reference levels) are indicative of the composition having efficacy for treating steatohepatitis. Levels of the one or more biomarkers in the sample matching the NASH-positive reference levels that distinguish over NAFLD (e.g., levels that are the same as the reference levels, substantially the same as the reference levels, above and/or below the minimum and/or maximum of the reference levels, and/or within the range of the reference levels) are indicative of the composition not having efficacy for treating steatohepatitis.
- When the level(s) of the one or more biomarkers in the biological sample (from a subject having steatohepatitis and currently or previously being treated with a composition) are compared to level(s) of the one or more biomarkers in a previously-taken biological sample from the subject before treatment with the composition, any changes in the level(s) of the one or more biomarkers are indicative of the efficacy of the composition for treating steatohepatitis. That is, if the comparisons indicate that the level(s) of the one or more biomarkers have increased or decreased after treatment with the composition to become more similar to the steatohepatitis-negative reference levels (or less similar to the steatohepatitis-positive reference levels) or, when the subject initially has NAFLD, the level(s) have increased or decreased to become more similar to NASH-positive reference levels that distinguish over NAFLD (or less similar to the NAFLD-positive reference levels that distinguish over NASH), then the results are indicative of the composition having efficacy for treating steatohepatitis. If the comparisons indicate that the level(s) of the one or more biomarkers have not increased or decreased after treatment with the composition to become more similar to the steatohepatitis-negative reference levels (or less similar to the steatohepatitis-positive reference levels) or, when the subject initially has NASH, the level(s) have not increased or decreased to become more similar to NAFLD-positive reference levels that distinguish over NASH (or less similar to the NASH-positive reference levels that distinguish over NAFLD), then the results are indicative of the composition not having efficacy for treating steatohepatitis. The comparisons may also indicate degrees of efficacy for treating steatohepatitis based on the amount of changes observed in the level(s) of the one or more biomarkers after treatment. In order to help characterize such a comparison, the changes in the level(s) of the one or more biomarkers, the level(s) of the one or more biomarkers before treatment, and/or the level(s) of the one or more biomarkers in the subject currently or previously being treated with the composition may be compared to steatohepatitis-positive reference levels (including low grade and NASH-positive reference levels), steatohepatitis-negative reference levels (including low grade and NASH-negative reference levels), NAFLD-positive reference levels that distinguish over NASH, and/or NASH-positive reference levels that distinguish over NAFLD.
- Another method for assessing the efficacy of a composition in treating steatohepatitis comprises (1) analyzing a first biological sample from a subject to determine the level(s) of one or more biomarkers selected from Tables 1, 3, 4B, 6B, 9, 10, 11, 12, 13,
Figure 2 and/orFigure 3 , the first sample obtained from the subject at a first time point, (2) administering the composition to the subject, (3) analyzing a second biological sample from a subject to determine the level(s) of the one or more biomarkers, the second sample obtained from the subject at a second time point after administration of the composition, and (4) comparing the level(s) of one or more biomarkers in the first sample to the level(s) of the one or more biomarkers in the second sample in order to assess the efficacy of the composition for treating steatohepatitis. As indicated above, if the comparison of the samples indicates that the level(s) of the one or more biomarkers have increased or decreased after administration of the composition to become more similar to the steatohepatitis-negative reference levels (or less similar to the steatohepatitis-positive reference levels) or, when the subject initially has NASH, if the level(s) have increased or decreased to become more similar to NAFLD-positive reference levels that distinguish over NASH (or less similar to the NASH-positive reference levels that distinguish over NAFLD), then the results are indicative of the composition having efficacy for treating steatohepatitis. If the comparisons indicate that the level(s) of the one or more biomarkers have not increased or decreased after treatment with the composition to become more similar to the steatohepatitis-negative reference levels (or less similar to the steatohepatitis-positive reference levels) or, when the subject initially has NASH, the level(s) have not increased or decreased to become more similar to NAFLD-positive reference levels that distinguish over NASH (or less similar to the NASH-positive reference levels that distinguish over NAFLD), then the results are indicative of the composition not having efficacy for treating steatohepatitis. - The comparison may also indicate a degree of efficacy for treating steatohepatitis based on the amount of changes observed in the level(s) of the one or more biomarkers after administration of the composition as discussed above.
- A method of assessing the relative efficacy of two or more compositions for treating steatohepatitis comprises (1) analyzing, from a first subject having steatohepatitis and currently or previously being treated with a first composition, a first biological sample to determine the level(s) of one or more biomarkers selected from Tables 1, 3, 4B, 6B, 9, 10, 11, 12, 13,
Figure 2 and/orFigure 3 (2) analyzing, from a second subject having steatohepatitis and currently or previously being treated with a second composition, a second biological sample to determine the level(s) of the one or more biomarkers, and (3) comparing the level(s) of one or more biomarkers in the first sample to the level(s) of the one or more biomarkers in the second sample in order to assess the relative efficacy of the first and second compositions for treating steatohepatitis. The results are indicative of the relative efficacy of the two compositions, and the results (or the levels of the one or more biomarkers in the first sample and/or the level(s) of the one or more biomarkers in the second sample) may be compared to steatohepatitis-positive reference levels (including low grade and NASH-positive reference levels), steatohepatitis-negative reference levels (including low grade and NASH-negative reference levels), NAFLD-positive reference levels that distinguish over NASH, and/or NASH-positive reference levels that distinguish over NAFLD to aid in characterizing the relative efficacy. - Each of the methods of assessing efficacy may be conducted on one or more subjects or one or more groups of subjects (e.g., a first group being treated with a first composition and a second group being treated with a second composition).
- As with the other methods described herein, the comparisons made in the methods of assessing efficacy (or relative efficacy) of compositions for treating steatohepatitis and/or steatosis may be carried out using various techniques, including simple comparisons, one or more statistical analyses, and combinations thereof. Any suitable method may be used to analyze the biological samples in order to determine the level(s) of the one or more biomarkers in the samples. In addition, the level(s) of one or more biomarkers, including a combination of all of the biomarkers in Tables 1, 3, 4B, 6B, 9, 10, 11, 12, 13,
Figure 2 and/orFigure 3 or any fraction thereof, may be determined and used in methods of assessing efficacy (or relative efficacy) of compositions for treating steatohepatitis. - Finally, the methods of assessing efficacy (or relative efficacy) of one or more compositions for treating steatohepatitis may further comprise analyzing the biological sample to determine the level(s) of one or more non-biomarker compounds. The non-biomarker compounds may then be compared to reference levels of non-biomarker compounds for subjects having (or not having) steatohepatitis.
- The identification of biomarkers for steatohepatitis and steatosis also allows for the screening of compositions for activity in modulating biomarkers associated with steatohepatitis and/or steatosis, which may be useful in treating steatohepatitis and/or steatosis. For example, methods of screening compositions useful for treatment of steatohepatitis comprise assaying test compositions for activity in modulating the levels of one or more biomarkers in Tables 1, 3, 4B, 6B, 9, 10, 11, 12, 13,
Figure 2 and/orFigure 3 . Such screening assays may be conducted in vitro and/or in vivo, and may be in any form known in the art useful for assaying modulation of such biomarkers in the presence of a test composition such as, for example, cell culture assays, organ culture assays, and in vivo assays (e.g., assays involving animal models). - In one embodiment, a method for screening a composition for activity in modulating one or more biomarkers of steatohepatitis comprises (1) contacting one or more cells with a composition, (2) analyzing at least a portion of the one or more cells or a biological sample associated with the cells to determine the level(s) of one or more biomarkers of steatohepatitis selected from Tables 1, 3, 4B, 6B, 9, 10, 11, 12, 13,
Figure 2 and/orFigure 3; and (3 ) comparing the level(s) of the one or more biomarkers with predetermined standard levels for the one or more biomarkers to determine whether the composition modulated the level(s) of the one or more biomarkers. As discussed above, the cells may be contacted with the composition in vitro and/or in vivo. The predetermined standard levels for the one or more biomarkers may be the levels of the one or more biomarkers in the one or more cells in the absence of the composition. The predetermined standard levels for the one or more biomarkers may also be the level(s) of the one or more biomarkers in control cells not contacted with the composition. - In addition, the methods may further comprise analyzing at least a portion of the one or more cells or a biological sample associated with the cells to determine the level(s) of one or more non-biomarker compounds of steatohepatitis and/or steatosis. The levels of the non-biomarker compounds may then be compared to predetermined standard levels of the one or more non-biomarker compounds.
- Any suitable method may be used to analyze at least a portion of the one or more cells or a biological sample associated with the cells in order to determine the level(s) of the one or more biomarkers (or levels of non-biomarker compounds). Suitable methods include chromatography (e.g., HPLC, gas chromatograph, liquid chromatography), mass spectrometry (e.g., MS, MS-MS), enzymatic or biochemical reactions, clinical chemistry, ELISA, antibody linkage, other immunochemical techniques, and combinations thereof. Further, the level(s) of the one or more biomarkers (or levels of non-biomarker compounds) may be measured indirectly, for example, by using an assay that measures the level of a compound (or compounds) that correlates with the level of the biomarker(s) (or non-biomarker compounds) that are desired to be measured.
- The identification of biomarkers for steatohepatitis and steatosis also allows for the identification of potential drug targets for steatohepatitis and/or steatosis. For example, a method for identifying a potential drug target for steatohepatitis comprises (1) identifying one or more biochemical pathways associated with one or more biomarkers for steatohepatitis selected from Tables 1, 3, 4B, 6B, 9, 10, 11, 12, 13,
Figure 2 and/orFigure 3 , and (2 ) identifying a protein (e.g., an enzyme) affecting at least one of the one or more identified biochemical pathways, the protein being a potential drug target for steatohepatitis. - Another method for identifying a potential drug target for steatohepatitis comprises (1) identifying one or more biochemical pathways associated with one or more biomarkers for steatohepatitis selected from Tables 1, 3, 4B, 6B, 9, 10, 11, 12, 13,
Figure 2 and/orFigure 3 , and one or more non-biomarker compounds of steatohepatitis and (2) identifying a protein affecting at least one of the one or more identified biochemical pathways, the protein being a potential drug target for steatohepatitis. - One or more biochemical pathways (e.g., biosynthetic and/or metabolic (catabolic) pathway) are identified that are associated with one or more biomarkers (or non-biomarker compounds). After the biochemical pathways are identified, one or more proteins affecting at least one of the pathways are identified. Preferably, those proteins affecting more than one of the pathways are identified.
- A build-up of one metabolite (e.g., a pathway intermediate) may indicate the presence of a 'block' downstream of the metabolite and the block may result in a low/absent level of a downstream metabolite (e.g. product of a biosynthetic pathway). In a similar manner, the absence of a metabolite could indicate the presence of a 'block' in the pathway upstream of the metabolite resulting from inactive or non-functional enzyme(s) or from unavailability of biochemical intermediates that are required substrates to produce the product. Alternatively, an increase in the level of a metabolite could indicate a genetic mutation that produces an aberrant protein which results in the over-production and/or accumulation of a metabolite which then leads to an alteration of other related biochemical pathways and result in dysregulation of the normal flux through the pathway; further, the build-up of the biochemical intermediate metabolite may be toxic or may compromise the production of a necessary intermediate for a related pathway. It is possible that the relationship between pathways is currently unknown and this data could reveal such a relationship.
- The proteins identified as potential drug targets may then be used to identify compositions that may be potential candidates for treating steatohepatitis, including compositions for gene therapy.
- The identification of biomarkers for steatohepatitis and steatosis also allows for the treatment of steatohepatitis and/or steatosis. For example, in order to treat a subject having steatohepatitis, an effective amount of one or more steatohepatitis biomarkers that are lowered in steatohepatitis as compared to a healthy subject not having steatohepatitis may be administered to the subject. The biomarkers that may be administered may comprise one or more of the biomarkers in Tables 1, 3, 4B, 6B, 9, 10, 11, 12, 13,
Figure 2 ,Figure 3 that are decreased in steatohepatitis. In some embodiments, the biomarkers that are administered are one or more biomarkers listed in Tables 1, 3, 4B, 6B, 9, 10, 11, 12, 13,Figure 2 ,Figure 3 that are decreased in steatohepatitis and that have a p-value less than 0.10. In other embodiments, the biomarkers that are administered are one or biomarkers listed in Tables 1, 3, 4B, 6B, 9, 10, 11, 12, 13,Figure 2 ,Figure 3 that are decreased in steatohepatitis by at least 5%, by at least 10%, by at least 15%, by at least 20%, by at least 25%, by at least 30%, by at least 35%, by at least 40%, by at least 45%, by at least 50%, by at least 55%, by at least 60%, by at least 65%, by at least 70%, by at least 75%, by at least 80%, by at least 85%, by at least 90%, by at least 95%, or by 100% (i.e., absent). - It is believed that some of the biomarkers for steatosis and steatohepatitis described herein may also be biomarkers for liver disorders (e.g. liver fibrosis, cirrhosis, liver cancer, etc.) in general. Therefore, it is believed that at least some of the steatosis biomarkers or steatohepatitis biomarkers may be used in the methods described herein for liver disorders in general. That is, the methods described herein with respect to steatosis and/or steatohepatitis may also be used for diagnosing (or aiding in the diagnosis of) a liver disorder, methods of monitoring progression/regression of a liver disorder, methods of assessing efficacy of compositions for treating a liver disorder, methods of screening a composition for activity in modulating biomarkers associated with a liver disorder, methods of identifying potential drug targets for liver disorder, and methods of treating a liver disorder. Such methods could be conducted as described herein with respect to steatosis.
- Other methods of using the biomarkers discussed herein are also contemplated. For example, the methods described in
U.S. Patent No. 7,005,255 andU.S. Patent Application No. 10/695,265 may be conducted using a small molecule profile comprising one or more of the biomarkers disclosed herein. - In any of the methods listed herein, the biomarkers that are used may be selected from those biomarkers in Tables 1, 2, 3, 4B, 5B, 6B, 8, 9, 10, 11, 12, 13,
Figures 1 ,2 , and3 , having p-values of less than 0.05 and/or those biomarkers in Tables 1, 2, 3, 4B, 5B, 6B, 8, 9, 10, 11, 12, 13,Figures 1 ,2 , and3 having q-values of less than 0.10. The biomarkers that are used in any of the methods described herein may also be selected from those biomarkers in Tables 1, 2, 3, 4B, 5B, 6B, 8, 9, 10, 11, 12, 13,Figures 1 ,2 , and3 that are decreased in steatosis and/or steatohepatitis (as compared to the control) or that are decreased in remission (as compared to control or steatosis and/or steatohepatitis) by at least 5%, by at least 10%, by at least 15%, by at least 20%, by at least 25%, by at least 30%, by at least 35%, by at least 40%, by at least 45%, by at least 50%, by at least 55%, by at least 60%, by at least 65%, by at least 70%, by at least 75%, by at least 80%, by at least 85%, by at least 90%, by at least 95%, or by 100% (i.e., absent); and/or those biomarkers in Tables 1, 2, 3, 4B, 5B, 6B, 8, 9, 10, 11, 12, 13,Figure 1 ,Figure 2 ,Figure 3 that are increased in steatosis and/or steatohepatitis (as compared to the control or remission) or that are increased in remission (as compared to the control or steatosis or steatohepatitis) by at least 5%, by at least 10%, by at least 15%, by at least 20%, by at least 25%, by at least 30%, by at least 35%, by at least 40%, by at least 45%, by at least 50%, by at least 55%, by at least 60%, by at least 65%, by at least 70%, by at least 75%, by at least 80%, by at least 85%, by at least 90%, by at least 95%, by at least 100%, by at least 110%, by at least 120%, by at least 130%, by at least 140%, by at least 150%, or more. - The invention will be further explained by the following illustrative examples that are intended to be non-limiting.
- Each sample was analyzed to determine the concentration of several hundred metabolites. Analytical techniques such as GC-MS (gas chromatography-mass spectrometry) and LC-MS (liquid chromatography-mass spectrometry) were used to analyze the metabolites. Multiple aliquots were simultaneously, and in parallel, analyzed, and, after appropriate quality control (QC), the information derived from each analysis was recombined. Every sample was characterized according to several thousand characteristics, which ultimately amount to several hundred chemical species. The techniques used were able to identify novel and chemically unnamed compounds.
- The data was analyzed using statistical tests of significance to identify molecules (either known, named metabolites or unnamed metabolites) present at differential levels in a definable population or subpopulation (e.g., biomarkers for steatosis biological samples compared to control biological samples or compared to patients in remission from steatosis) useful for distinguishing between the definable populations (e.g., steatosis (NAFLD) and control, steatohepatitis (NASH) and control, NAFLD and NASH). Other molecules (either known, named metabolites or unnamed metabolites) in the definable population or subpopulation were also identified. For significance tests, Analysis of variance (ANOVA), analysis of covariance (ANCOVA) and Wilcoxon signed rank test were used to statistically analyze the data. For classification tests, Random Forest and Recursive Partitioning were used to analyze the data.
- Various peaks identified in the analyses (e.g. GC-MS, LC-MS, MS-MS), including those identified as statistically significant, were subjected to a mass spectrometry based chemical identification process.
- Biomarkers were discovered by (1) analyzing blood plasma samples from different groups of human subjects to determine the levels of metabolites in the samples and then (2) statistically analyzing the results to determine those metabolites that were differentially present in the two groups.
- The plasma samples used for the analysis were 25 control samples that were from healthy subjects, 11 samples from patients with steatosis and 24 samples from patients with NASH. Subjects for all groups included males and females. After the levels of metabolites were determined, the data was analyzed using significance tests (ANOVA, ANCOVA, Wilcoxon).
- ANOVA was used to identify significant differences in the mean levels of metabolites between two populations (i.e., Steatosis vs. Control, NASH vs. Control, Steatosis vs. NASH).
- As listed below in Tables 1, 2 and 3, biomarkers were discovered that were differentially present between plasma samples from steatosis patients and Control subjects, biomarkers that were discovered that were differentially present between plasma samples from patients with NASH and from Control subjects and biomarkers that were discovered that were differentially present between plasma samples from steatohepatitis (NASH) and plasma samples from subjects with steatosis.
- Tables 1, 2 and 3 include, for each listed biomarkers, the p-value and q-value determined in the statistical analysis of the data concerning the biomarkers in the steatosis mean level as compared to the control mean level, the NASH mean level as compared to the control mean level, and the steatohepatitis (NASH) mean level as compared to the steatosis mean level. Library indicates the chemical library that was used to identify the compounds. The number 50 refer to the GC library and the numbers 61, 200 and 201 refer to the LC library. Comp ID refers to the identification number for the compound in our internal chemical compound database. The data is presented as a percent change based upon the ratio of means and indicates biomarkers that increase or decrease in NASH relative to control (Table 1), in steatosis relative to control (Table 2) and/or in NASH relative to steatosis (Table 3).
Table 1. Biomarkers from subjects with steatohepatitis (NASH) compared to Control subjects ID Biomarker Library p-value q-value % Change 32868 glycocholate* 201 8.56E-06 0.0005 331% 12751 Metabolite-3073 50 1.36E-07 1.08E-05 129% 32322 glutamate 50 1.52E-07 3.11E-05 137% 1113 isocitrate 61 3.94E-07 0.000021 85% 1125 isoleucine 50 6.7E-07 2.27E-05 52% 18706 Metabolite-5769 61 7.12E-07 2.27E-05 64% 33073 Metabolite-11728 200 1.36E-06 0.0001 -57% 60 leucine 50 3.12E-06 0.0001 11% 16511 Metabolite-4274 50 3.22E-06 0.0001 61% 32393 glutamylvaline 200 8.94E-06 0.0005 33% 1126 alanine 50 0.000011 0.0002 40% 1299 tyrosine 61 1.77E-05 0.0003 30% 24285 Metabolite-10026 61 2.22E-05 0.0003 52% 2734 gamma-glutamyltyrosine 200 2.23E-05 0.0009 29% 15140 kynurenine 61 2.96E-05 0.0004 33% 31489 Metabolite-10914 50 4.45E-05 0.0014 -45% 1647 glutamine 50 0.0001 0.0007 37% 8509 Metabolite-2041 61 0.0001 0.0008 34% 12780 Metabolite-3098 50 0.0001 0.0007 40% 17068 Metabolite-4627 61 0.0001 0.0009 250% 20267 Metabolite-7187 61 0.0001 0.001 85% 32701 urate- 200 0.0001 0.0023 22% 33362 gamma-glutamylphenylalanine- 200 0.0001 0.0023 29% 33420 gamma-tocopherol- 50 0.0001 0.0023 87% 12774 Metabolite-3094 50 0.0001 0.0023 52% 16865 Metabolite-4522 50 0.0001 0.0011 30% 20699 erythritol 50 0.0001 0.0007 36% 30821 Metabolite-10812 50 0.0001 0.0007 21% 2761 thyroxine 61 0.0002 0.0013 46% 6847 Metabolite-1496 61 0.0002 0.0014 50% 13600 Metabolite-3330 61 0.0002 0.0014 362% 18882 Isobar-47-includes-taurochenodeoxycholic acid-and-taurodeoxycholic acid 61 0.0002 0.0014 268% 32497 10c-undecenoate 201 0.0002 0.003 -9% 32675 Metabolite-03951 200 0.0002 0.003 25% 32881 Metabolite-11564 201 0.0002 0.003 33% 584 mannose 50 0.0002 0.0012 29% 1336 palmitate (16:0) 50 0.0002 0.0012 10% 16650 Metabolite-4360 50 0.0002 0.0012 213% 5628 Metabolite-1086 61 0.0003 0.0016 105% 24233 Metabolite-9855 61 0.0003 0.0017 146% 18497 taurocholate 201 0.0003 0.0042 303% 22570 Metabolite-9033 50 0.0003 0.0017 1% 5687 Metabolite-1110 61 0.0004 0.0021 -71% 59 histidine 201 0.0004 0.0042 -14% 32863 Metabolite-11546 201 0.0004 0.0042 223% 33133 Metabolite-11788 200 0.0004 0.0042 20% 64 phenylalanine 61 0.0004 0.002 13% 31595 Metabolite-10951 61 0.0005 0.0022 60% 12783 Metabolite-3101 50 0.0005 0.0042 61% 15990 glycerophosphorylcholine (GPC) 200 0.0005 0.0042 -28% 17028 Metabolite-4611 50 0.0005 0.0046 35% 32632 Metabolite-11315 200 0.0005 0.0042 -32% 12767 Metabolite-3087 50 0.0006 0.0025 46% 12791 Metabolite-3109 50 0.0006 0.0025 -28% 32564 Metabolite-11247 201 0.0006 0.0048 -67% 32808 Metabolite-11491 201 0.0006 0.0048 130% 527 lactate 50 0.0006 0.0025 26% 21047 3-methyl-2-oxobutyrate 61 0.0006 0.0025 10% 7933 Metabolite-1911 61 0.0007 0.0027 112% 31510 Metabolite-10932 61 0.0007 0.0028 34% 32735 Metabolite-01911 200 0.0007 0.0052 99% 1358 stearate (18:0) 50 0.0008 0.0029 -1% 3147 xanthine 61 0.0009 0.0031 91% 27801 Metabolite-10589 61 0.0009 0.0031 64% 1494 5-oxoproline 50 0.0009 0.0031 0% 32552 Metabolite-11235 201 0.001 0.0065 90% 32739 Metabolite-11422 201 0.001 0.0066 31% 599 pyruvate 50 0.001 0.0065 44% 25602 Metabolite-10432 50 0.001 0.0065 73% 10551 Metabolite-2347 61 0.0011 0.0036 214% 16016 Metabolite-3994 61 0.0011 0.0037 -45% 32846 Metabolite-11529 201 0.0011 0.0071 151% 13296 Metabolite-3230 61 0.0013 0.004 25% 32519 Metabolite-11205 200 0.0013 0.0077 -28% 32549 Metabolite-02269 201 0.0014 0.0077 -67% 32550 Metabolite-02272 201 0.0014 0.0077 -28% 8210 Metabolite-1981 61 0.0015 0.0048 -41% 15753 hippurate 201 0.0016 0.0085 -32% 32656 Metabolite-11339 201 0.0017 0.0087 -10% 13214 Metabolite-3183 61 0.0018 0.0055 30% 32544 Metabolite-11227 201 0.0019 0.0096 13% 10286 Metabolite-2272 61 0.002 0.006 -26% 22803 Isobar-66-includes-glycochenodeoxycholic acid-glycodeoxycholic acid 61 0.002 0.006 195% 10245 Metabolite-2269- 61 0.0021 0.006 -62% 32548 Metabolite-11231 201 0.0022 0.0108 82% 32559 Metabolite-11242 201 0.0022 0.0108 60% 1110 arachidonate-20-4-n-6- 50 0.0023 0.0064 11% 32637 Metabotite-11320 201 0.0024 0.0115 -27% 10715 Metabolite-2395 61 0.0025 0.0068 107% 32813 Metabolite-11496 201 0.0027 0.0122 -18% 32412 butyrylcarnitine 200 0.0029 0.0129 27% 10672 Metabolite-2390 61 0.0031 0.0084 35% 15529 Metabolite-3951 61 0.0034 0.009 27% 16308 Metabolite-4147 50 0.0034 0.015 43% 32641 Metabolite-11324 201 0.0037 0.0159 -25% 32786 Metabolite-11469 200 0.0039 0.0163 -68% 32346 glycochenodeoxycholate 201 0.004 0.0165 102% 20488 glucose 50 0.004 0.0105 18% 607 urocanate 200 0.0041 0.0165 -20% 7941 Metabolite-1914 61 0.0043 0.0112 -69% 32748 Metabolite-11431 201 0.0045 0.0179 73% 21421 Metabolite-8214 50 0.0051 0.013 30% 15122 glycerol 50 0.0053 0.0131 18% 15996 aspartate 50 0.0055 0.021 40% 18657 Metabolite-5726 61 0.0057 0.0137 65% 32910 Metabolite-11593 201 0.0057 0.021 23% 33131 Metabolite-11786 200 0.0057 0.021 -34% 17627 Metabolite-4986 50 0.0057 0.0137 -26% 22600 Metabolite-9043 50 0.0057 0.0137 28% 30728 Metabolite-10797 61 0.0064 0.015 72% 32547 Metabolite-11230 201 0.0065 0.0232 70% 32854 Metabolite-11537 200 0.0066 0.0232 -47% 32752 Metabolite-11435 201 0.0067 0.0233 68% 12644 Metabolite-3016 50 0.0072 0.0164 14% 18118 Metabolite-5346 50 0.0072 0.0164 31% 27710 N-acetylglycine 50 0.0076 0.017 -32% 32749 Metabolite-11432 201 0.0079 0.027 71% 18291 3-4-5-trimethoxycinnamic acid 61 0.008 0.0178 -64% 19462 Metabolite-6446 50 0.0083 0.0181 24% 3141 Betaine 200 0.0084 0.0283 -16% 10414 Metabolite-2291 61 0.0086 0.0186 -79% 33386 Metabolite-12035 50 0.0086 0.0284 42% 16496 Metabolite-4251 50 0.0087 0.0186 36% 1769 Cortisone 201 0.0089 0.0287 -22% 15500 carnitine 200 0.009 0.0287 10% 18369 gamma-glutamylleucine 200 0.0093 0.0294 19% 32848 Metabolite-11531 201 0.0095 0.0296 78% 16518 Metabolite-4276 50 0.0098 0.0205 79% 32545 Metabolite-11228 201 0.0099 0.0303 79% 19323 docosahexaenoate-DHA- 50 0.0101 0.0209 -27% 19490 Metabolite-6488 50 0.0102 0.0308 54% 32684 Metabolite-11367 201 0.0105 0.0313 -37% 27738 threonate 50 0.0106 0.0216 -25% 1301 lysine 50 0.0107 0.0216 12% 33242 Metabolite-11897 201 0.011 0.0318 61% 9905 Metabolite-2231 61 0.0112 0.0223 17% 27288 Metabolite-10517 50 0.0114 0.0325 39% 1431 p-hydroxyphenyllactate-HPLA- 50 0.0115 0.0226 34% 25522 Metabolite-10407 50 0.0116 0.0226 25% 32515 valine* 200 0.0117 0.0327 10% 22154 bradykinin 200 0.0118 0.0327 1226% 32751 Metabolite-11434 201 0.0125 0.0341 33% 10247 Metabolite-2270 61 0.0127 0.0244 -68% 19397 Metabolite-6326 50 0.0132 0.0251 24% 15958 phenylacetate 201 0.0134 0.0362 -23% 15506 choline 61 0.0138 0.026 -3% 10737 Isobar-1-includes-mannose-fructose-glucose-galactose-alpha-L-sorbopyranose-Inositol-D-allose-D--altrose-D-psicone-L--gulose-allo-inositol 61 0.014 0.026 9% 587 gluconate 50 0.0142 0.0261 22% 33154 Metabolite-11809 200 0.0145 0.0387 -18% 12782 Metabolite-3100 50 0.0152 0.0276 64% 33227 Metabolite-11882 201 0.0154 0.0406 -41% 31787 3-carboxyl-4-methyl-5-propyl-2-furanpropanoic acid 201 0.017 0.0436 -43% 32197 3-(4-hydroxyphenyl)lactate 201 0.0178 0.0449 25% 9130 Metabolite-2139 61 0.0198 0.0355 26% 33087 peptide-RPPGFSPF 200 0.0212 0.0516 818% 32682 Metabolite-11365 201 0.0216 0.0521 -17% 32746 Metabolite-11429 201 0.0221 0.0526 18% 16337 Metabolite-4167 61 0.0222 0.0394 32% 5689 Metabolite-1111 61 0.0225 0.0395 66% 27727 glutathione, oxidized (GSSG) 200 0.0228 0.0536 -69% 11923 Metabolite-2821 61 0.025 0.0432 21% 14837 Metabolite-3707 61 0.0251 0.0432 -39% 13142 Metabolite-3165 61 0.0263 0.0446 14% 32769 Metabolite-11452 201 0.0267 0.0622 51 % 606 uridine 61 0.0274 0.0461 -8% 18591 Metabolite-5646 61 0.0278 0.0463 -34% 10087 Metabolite-2249 61 0.029 0.0477 34% 32551 Metabolite-11234 201 0.0302 0.069 26% 33228 Metabolite-11883 200 0.0303 0.069 -24% 12656 Metabolite-3025 50 0.0308 0.0502 13% 22261 Isobar-60-includes-s-2-hydroxybutyric acid-2-hydroxyisobutyric acid 61 0.0312 0.0502 55% 32405 3-indolepropionate 200 0.0313 0.0704 -36% 10156 Metabolite-2259 61 0.0314 0.0502 73% 7650 Metabolite-1834 61 0.0328 0.0518 47% 32741 Metabolite-11424 200 0.0329 0.0732 15% 32757 Metabolite-11440 201 0.0339 0.074 39% 33012 Metabolite-11674 200 0.0339 0.074 13% 12658 Metabolite-3026 50 0.0343 0.0537 15% 32110 Metabolite-11086 50 0.0344 0.0742 -14% 1284 threonine 50 0.0352 0.0546 -7% 32648 Metabolite-11331 201 0.0356 0.0758 -4% 32517 Metabolite-11203 200 0.0359 0.0758 -17% 10092 Metabolite-2250 61 0.0363 0.0557 55% 63 cholesterol 50 0.0373 0.0561 12% 1507 palmitoleate 50 0.0376 0.0561 28% 12768 Metabolite-3088 50 0.0376 0.0561 -18% 32578 Metabolite-11261 200 0.0389 0.0806 26% 8796 Metabolite-2074 61 0.0391 0.0578 90% 33140 Metabolite-11795 200 0.04 0.082 24% 21127 1-palmitoylglycerol-1-monopalmitin- 50 0.0424 0.0621 13% 27256 Metabolite-10500 50 0.0432 0.0871 15% 13024 Metabolite-3139 61 0.0433 0.0628 33% 32599 Metabolite-11282 201 0.0434 0.0871 39% 30633 Metabolite-10785 61 0.044 0.0633 -22% 9491 Metabolite-2185 61 0.0445 0.0634 25% 32880 Metabolite-11583 201 0.0449 0.0893 -16% 594 nicotinamide 61 0.045 0.0636 -13% 12663 Metabolite-3030 50 0.0457 0.0638 -11% 30281 Metabolite-10743 50 0.047 0.0644 -17% 17390 Metabolite-4806 50 0.0478 0.0644 21% 12790 Metabolite-3108 50 0.048 0.0946 24% 19370 Metabolite-6268 50 0.048 0.0644 4% 6413 Metabolite-1342 61 0.0481 0.0644 -13% 18015 Metabolite-3113 61 0.0487 0.0644 -15% 17033 Metabolite-4613 61 0.049 0.0644 53% 12645 Metabolite-3017 50 0.0499 0.0644 -13% 17304 Metabolite-4759 61 0.0502 0.0644 26% 22895 Metabolite-9299 50 0.0503 0.0644 -9% 12647 Metabolite-3019 50 0.0513 0.0646 12% 16045 Metabolite-4006 50 0.0513 0.0646 26% 24077 Metabolite-9727 50 0.0519 0.0647 19% 27275 Metabolite-10507 50 0.0527 0.0653 -11% 32315 serine 50 0.0532 0.1028 -15% 31401 Metabolite-10892 50 0.0543 0.1029 36% 32452 propionylcarnitine 200 0.055 0.1029 18% 21631 Metabolite-8403 50 0.0552 0.1029 19% 32348 2-aminobutyrate 200 0.0561 0.1036 -13% 16019 Metabolite-3995 61 0.0584 0.0716 -24% 32776 Metabolite-11459 200 0.0584 0.1065 19% 10629 Metabolite-2386 61 0.0587 0.0716 26% 1572 Glycerate 50 0.0588 0.1065 -16% 12035 pelargonate-9-0- 50 0.0592 0.0716 -1% 31529 Metabolite-10941 61 0.0597 0.0717 18% 32762 Metabolite-11445 201 0.06 0.1078 -55% 32691 Metabolite-11374 200 0.0607 0.108 19% 528 alpha-keto-glutarate 61 0.0625 0.0744 28% 32792 Metabolite-11475 201 0.0631 0.1115 54% 32572 Metabolite-11255 200 0.0644 0.112 -51% 6398 Metabolite-1335 61 0.0645 0.0763 41% 27718 creatine 200 0.0652 0.112 17% 16666 Metabolite-4365 50 0.0656 0.112 -22% 18335 quinate 50 0.0656 0.112 -52% 12666 Metabolite-3033 50 0.0683 0.08 -11% 1366 trans-4-hydroxyproline 50 0.0699 0.0809 35% 32385 Metabolite-11180 50 0.0702 0.1172 -10% 18477 glycodeoxycholate 201 0.0704 0.1172 247% 10501 Metabolite-2321 61 0.0709 0.0815 -25% 32328 hexanoylcarnitine 200 0.0713 0.1177 17% 22133 DL-hexanoyl-carnitine 61 0.0719 0.082 28% 32596 Metabolite-02250 200 0.0722 0.1178 36% 32740 Metabolite-11423 201 0.0725 0.1178 13% 12785 Metabolite-3103 50 0.0743 0.1195 42% 32697 Metabolite-11380 200 0.0747 0.1195 13% 13557 Metabolite-3323 61 0.0779 0.0883 71% 32761 Metabolite-11444 201 0.0805 0.1278 31% 32952 Metabolite-02277 201 0.0819 0.1286 -75% 32945 Metabolite-11628 201 0.0822 0.1286 38% 32338 glycine 50 0.084 0.1292 -15% 1712 hydrocortisone 201 0.0854 0.1292 -19% 21418 Isobar-56-includes-DL-pipecolic acid-1-amino-1-cyclopentanecarboxylic acid 61 0.0856 0.0958 -24% 1105 linoleate 50 0.0858 0.0958 11% 32638 Metabolite-11321 201 0.0867 0.1296 -12% 12919 Metabolite-3130 61 0.0889 0.0978 67% 33203 Metabolite-11858 201 0.0893 0.1321 63% 33366 Metabolite-12020 200 0.0896 0.1321 -27% 22842 cholate 201 0.0996 0.144 125% 32814 Metabolite-11497 201 0.1001 0.144 -7% 32743 bradykinin, hydroxyproline form- 200 0.1007 0.144 158% 32671 Metabolite-11354 200 0.1009 0.144 -13% 25459 Metabolite-10395 50 0.1012 0.144 -14% 12067 undecanoate 201 0.1035 0.1452 -5% 18868 Metabolite-5847 50 0.1035 0.1452 70% 21762 Metabolite-8506 61 0.1759 0.1569 -16% Table 2. Biomarkers from subjects with Steatosis (NAFLD) compared to Control subjects. ID Biomarker Library p-value q-value % Change 18706 Metabolite-5769 61 2.09E-06 0.0004 80% 12644 Metabolite-3016 50 2.08E-05 0.0021 30% 12751 Metabolite-3073 50 0.0001 0.0043 102% 24285 Metabolite-10026 61 0.0001 0.0031 64% 1125 isoleucine 50 0.0002 0.0076 48% 18882 Isobar-47-includes-taurochenodeoxycholic acid-and-taurodeoxycholic acid 61 0.0003 0.0076 309% 18476 glycocholate 61 0.0004 0.0092 248% 32322 glutamate 50 0.0005 0.0384 -91% 32497 10c-undecenoate 201 0.0005 0.0384 11% 31489 Metabolite-10914 50 0.0006 0.0384 47% 33073 Metabolite-11728 200 0.0006 0.0384 53% 12658 Metabolite-3026 50 0.0007 0.0136 30% 33386 Metabolite-12035 50 0.0007 0.0384 -80% 584 mannose 50 0.001 0.0177 -25% 1299 tyrosine 200 0.0011 0.0499 -27% 17068 Metabolite-4627 61 0.0012 0.0203 263% 12780 Metabolite-3098 50 0.0015 0.0208 34% 60 leucine 50 0.0015 0.0208 -13% 18118 Metabolite-5346 50 0.0016 0.0208 42% 32393 glutamylvaline 200 0.0016 0.0577 -28% 2734 gamma-glutamyltyrosine 200 0.0018 0.0577 -24% 11923 Metabolite-2821 61 0.0019 0.0227 38% 27801 Metabolite-10589 61 0.002 0.0231 80% 32846 Metabolite-11529 201 0.002 0.0577 -172% 32701 urate- 200 0.0021 0.0577 -23% 10672 Metabolite-2390 61 0.0023 0.0245 57% 1649 valine 50 0.0024 0.0247 37% 32749 Metabolite-11432 201 0.003 0.0722 -106% 13142 Metabolite-3165 61 0.0031 0.029 25% 7650 Metabolite-1834 61 0.0035 0.029 144% 10715 Metabolite-2395 61 0.0035 0.029 661% 10551 Metabolite-2347 61 0.0036 0.029 154% 22133 DL-hexanoyl-carnitine 61 0.0036 0.029 317% 59 histidine 201 0.0036 0.0804 14% 16337 Metabolite-4167 61 0.0038 0.029 66% 22803 Isobar-66-includes-glycochenodeoxycholic acid-glycodeoxycholic acid 61 0.0039 0.029 194% 10737 Isobar-1-includes-mannose-fructose-glucose-galactose-alpha-L-sorbopyranose-Inositol- 61 0.004 0.029 13% D-allose-0--altrose-D-psicone-L--gulose-allo-inositol 25602 Metabolite-10432 50 0.0044 0.0867 -62% 12770 Metabolite-3090 50 0.0045 0.0867 -67% 9491 Metabolite-2185 61 0.0048 0.0338 50% 606 uridine 201 0.0049 0.0882 22% 12656 Metabolite-3025 50 0.0052 0.0354 22% 32776 Metabolite-11459 200 0.006 0.0975 -40% 21047 3-methyl-2-oxobutyric acid 61 0.0062 0.0409 20% 32748 Metabolite-11431 201 0.0062 0.0975 -82% 32641 Metabolite-11324 201 0.0065 0.0975 29% 18369 gamma-glutamylleucine 61 0.0065 0.0414 -18% 22600 Metabolite-9043 50 0.0068 0.0414 -51% 1126 alanine 50 0.0071 0.0414 26% 32412 butyrylcarnitine 200 0.0073 0.1038 -38% 16511 Metabolite-4274 50 0.0089 0.0489 39% 17304 Metabolite-4759 61 0.0094 0.0503 48% 17028 Metabolite-4611 50 0.0095 0.1279 -31% 32548 Metabolite-11231 201 0.0102 0.1281 -75% 13214 Metabolite-3183 61 0.0109 0.0524 28% 30821 Metabolite-10812 50 0.0112 0.0524 -20% 16016 Metabolite-3994 61 0.0113 0.0524 -45% 21762 Metabolite-8506 61 0.0118 0.0536 50% 33362 gamma-glutamylphenylalanine- 200 0.0122 0.1281 -23% 9130 Metabolite-2139 61 0.0126 0.0557 40% 13600 Metabolite-3330 61 0.013 0.0557 139% 31401 Metabolite-10892 50 0.0132 0.1281 -64% 32552 Metabolite-11235 201 0.0134 0.1281 -53% 64 phenylalanine 61 0.0134 0.0557 -9% 32564 Metabolite-11247 201 0.0135 0.1281 62% 19490 Metabolite-6488 50 0.0139 0.1281 -47% 32578 Metabolite-11261 200 0.0144 0.1281 -54% 16308 Metabolite-4147 50 0.0145 0.1281 -48% 32754 Metabolite-11437 201 0.0148 0.1281 50% 32547 Metabolite-11230 201 0.0151 0.1281 -83% 32808 Metabolite-11491 201 0.0154 0.1281 -86% 12783 Metabolite-3101 50 0.0158 0.1281 -39% 1769 cortisone 201 0.0162 0.1281 28% 32945 Metabolite-11628 201 0.0179 0.1339 -68% 2761 thyroxine 61 0.018 0.0734 31% 12647 Metabolite-3019 50 0.0184 0.0734 17% 12763 Metabolite-3083 50 0.0186 0.1339 -36% 32881 Metabolite-11564 201 0.0186 0.1339 -26% 15500 carnitine 200 0.0189 0.1339 -11% 16865 Metabolite-4522 50 0.0192 0.075 22% 1494 5-oxoproline 50 0.0197 0.075 20% 30805 Metabotite-10810 50 0.0198 0.1349 -75% 32753 Metabolite-09789 201 0.0201 0.1349 51% 1642 caprate-10-0- 201 0.0219 0.1425 7% 32854 Metabolite-11537 200 0.0223 0.1425 46% 32863 Metabolite-11546 201 0.0257 0.1608 -116% 9905 Metabolite-2231 61 0.0262 0.0921 18% 12790 Metabolite-3108 50 0.0276 0.1669 -26% 527 lactate 50 0.0276 0.0952 -20% 32926 Metabolite-11609 201 0.028 0.1669 -44% 8509 Metabolite-2041 61 0.0298 0.0996 22% 8210 Metabolite-1981 61 0.0309 0.1016 -35% 32519 Metabolite-11205 200 0.0312 0.1764 22% 32813 Metabolite-11496 201 0.0347 0.1875 16% 32698 Metabolite-11381_200 200 0.036 0.1875 -22% 32631 Metabolite-11314 200 0.0365 0.1875 -11% 32517 Metabolite-11203 200 0.037 0.1875 26% 32807 Metabolite-11490 201 0.04 0.1972 -125% 18497 taurocholate 201 0.0404 0.1972 -115% 15140 L-kynurenine 61 0.0407 0.1275 24% 12782 Metabolite-3100 50 0.0422 0.1978 -49% 27727 glutathione, oxidized (GSSG) 200 0.0426 0.1978 72% 32621 Metabolite-11304 200 0.0427 0.1978 -43% 13557 Metabolite-3323 61 0.0447 0.135 68% 31595 Metabolite-10951 61 0.0451 0.135 27% 20699 erythritol 50 0.0452 0.2057 -23% 32878 Metabolite-11561 201 0.0477 0.2137 -32% 1113 isocitrate 61 0.0497 0.144 34% 32910 Metabolite-11593 201 0.0507 0.2233 -20% 17390 Metabolite-4806 50 0.0519 0.1462 27% 32752 Metabolite-11435 201 0.0533 0.2263 -41% 1647 glutamine 50 0.0534 0.147 21% 33242 Metabolite-11897 201 0.0544 0.2263 -38% 32452 propionylcarnitine 200 0.0545 0.2263 -27% 32978 Metabolite-11656 200 0.0547 0.2263 6% 27710 N-acetylglycine 50 0.0581 0.155 -29% 12785 Metabolite-3103 50 0.0581 0.2331 -48% 33228 Metabolite-11883 200 0.0581 0.2331 18% 1336 palmitate 50 0.0586 0.155 14% 594 nicotinamide 200 0.0598 0.2337 16% 15996 aspartate 50 0.0606 0.2337 -29% 10245 Metabolite-2269- 61 0.0622 0.1602 -42% 33131 Metabolite-11786 200 0.0626 0.2367 33% 32559 Metabolite-11242 201 0.0641 0.2372 -27% 15529 Metabolite-3951 61 0.0658 0.1647 22% 5687 Metabolite-1110 61 0.0702 0.1672 -43% 19370 Metabolite-6268 50 0.0707 0.1672 25% 32549 Metabolite-02269 201 0.0733 0.2653 44% 12789 Metabolite-3107 50 0.0741 0.2653 -59% 528 alpha-keto-glutarate 61 0.0742 0.1717 -27% 31510 Metabolite-10932 61 0.0764 0.1746 21% 19985 Metabolite-6957 50 0.0799 0.2678 -20% 10247 Metabolite-2270 61 0.0802 0.1773 -64% 18868 Metabolite-5847 50 0.0804 0.2678 -67% 32675 Metabolite-03951_200 200 0.0812 0.2678 -15% 20488 glucose 50 0.0819 0.1773 11% 18335 quinate 50 0.0822 0.2678 20% 15676 3-methyl-2-oxovalerate 201 0.0827 0.2678 -17% 25601 Metabolite-10431 50 0.0828 0.2678 -41% 12593 Metabolite-2973 50 0.0852 0.2678 -22% 32838 Metabolite-11521 200 0.0856 0.2678 -35% 19397 Metabolite-6326 50 0.086 0.1815 19% 31787 3-carboxyl-4-methyl-5-propyl-2-furanpropanoic acid 201 0.0861 0.2678 53% 12604 Metabolite-2981 50 0.0864 0.2678 -15% 21631 Metabolite-8403 50 0.0885 0.2678 -26% 1515 salicylic acid 50 0.0887 0.2678 -140% 1301 lysine 200 0.09 0.2687 -14% 32511 EDTA* 201 0.0942 0.2759 -7% 32971 Metabolite-11654 200 0.0945 0.2759 -36% 12767 Metabolite-3087 50 0.096 0.1954 35% 32795 Metabolite-11478 201 0.0982 0.2796 -35% 32793 Metabolite-11476 200 0.0988 0.2796 6% Table 3. Biomarkers from subjects with Steatosis compared to Steatohepatitis subjects. ID Biomarker Library p-value q-value % Change 21762 Metabolite-8506 61 0.0006 0.1449 -44% 528 alpha-keto-glutarate 61 0.0017 0.1921 75% 6847 Metabolite-1496 61 0.0025 0.1921 49% 16650 Metabolite-4360 50 0.0033 0.1921 -144% 18591 Metabolite-5646 61 0.0041 0.1921 -53% 27718 creatine 200 0.0071 1 -50% 599 pyruvate 61 0.0087 0.253 -42% 32621 Metabolite-11304 200 0.0124 1 31% 1113 isocitrate 61 0.0151 0.3249 38% 15506 choline 61 0.0163 0.3249 -28% 32729 Metabolite-11412 200 0.0166 1 -14% 10501 Metabolite-2321 61 0.0183 0.3249 -40% 12644 Metabolite-3016 50 0.0186 0.3249 -13% 32735 Metabolite-01911 200 0.0199 1 -99% 15753 hippurate 201 0.0255 1 44% 30805 Metabolite-10810 50 0.0302 1 37% 12768 Metabolite-3088 50 0.0305 0.4178 -25% 10629 Metabolite-2386 61 0.0335 0.4178 25% 33209 Metabolite-11864 201 0.0376 1 45% 32855 Metabolite-11538 201 0.0429 1 34% 32416 alpha linolenate (18:3(n-3)) 201 0.0486 1 32% 16518 Metabolite-4276 50 0.0499 0.481 63% 20267 Metabolite-7187 61 0.0521 0.481 37% 19462 Metabolite-6446 50 0.0552 0.481 22% 33420 gamma-tocopherol- 50 0.0556 1 -54% 1515 salicylic acid 50 0.0569 1 60% 32567 Metabolite-11250 200 0.0573 1 40% 32769 Metabolite-11452 201 0.0608 1 -79% 12774 Metabolite-3094 50 0.0625 1 -24% 32632 Metabolite-11315 200 0.0651 1 21% 32741 Metabolite-11424 200 0.0655 1 -13% 12658 Metabolite-3026 50 0.0658 0.525 -12% 32110 Metabolite-11086 50 0.0659 1 17% 30728 Metabolite-10797 61 0.0693 0.525 65% 32625 Metabolite-11308 201 0.0697 1 27% 15140 kynurenine 200 0.0702 1 -14% 12645 Metabolite-3017 50 0.0709 0.525 -22% 33154 Metabolite-11809 200 0.0711 1 19% 12067 undecanoate 201 0.072 1 6% 5628 Metabolite-1086 61 0.0723 0.525 45% 19402 Metabolite-6346 50 0.077 1 -20% 32631 Metabolite-11314 200 0.0779 1 8% 7933 Metabolite-1911 61 0.0792 0.5308 75% 32797 Metabolite-11480 201 0.0818 1 -213% 18254 paraxanthine 200 0.0824 1 -69% 32912 Metabolite-11595 201 -0.0834 1 25% 32717 Metabolite-11400 200 0.0855 1 39% 33133 Metabolite-11788 200 0.0862 1 -11% 22261 Isobar-60-includes-s-2-hydroxybutyric acid-2-hydroxyisobutyric acid 61 0.0869 0.5308 42% 19374 Metabolite-6270 50 0.09 1 27% 6398 Metabolite-1335 61 0.0908 0.5308 28% 12770 Metabolite-3090 50 0.0919 1 28% 18392 theobromine 200 0.0956 1 -118% 32978 Metabolite-11656 200 0.0961 1 -6% 32761 Metabolite-11444 201 0.0962 1 -11% 31548 peptide-DSGEGDFXAEGGGVR 200 0.0981 1 -323% 3141 betaine 200 0.0986 1 14% 606 uridine 201 0.0987 1 -17% 24233 Metabolite-9855 61 0.0996 0.5308 99% - Random forest analyses were used for classification of samples into groups (e.g. disease or healthy, steatosis or healthy, steatohepatitis or healthy, steatosis or NASH). Random forests give an estimate of how well we can classify individuals in a new data set into each group, in contrast to a t-test, which tests whether the unknown means for two populations are different or not. Random forests create a set of classification trees based on continual sampling of the experimental units and compounds. Then each observation is classified based on the majority votes from all the classification trees.
- Random forest results show that the samples can be classified correctly with varying degrees of accuracy using the biomarkers listed in Tables 1, 2, and/or 3. The confusion matrices demonstrate that using plasma samples steatosis subjects, steatohepatitis subjects and control subjects can be distinguished (Table4), steatosis, subjects can be distinguished from control subjects (Table 5), steatohepatitis subjects can be distinguished from control subjects (Table 6) and steatosis subjects can be distinguished from steatohepatitis subjects (Table 7). The "Out-of Bag" (OOB) Error rate gives an estimate of how accurately new observations can be predicted using the random forest model (e.g., whether a sample is from a subject having steatosis or a control subject).
Table 4. Confusion Matrix showing Control subjects, Steatosis subjects and NASH subjects can be distinguished from each other. Confusion Matrix: Control vs. Steatosis vs. NASH Control_ Predicted Steatosis_ Predicted NASH_ Predicted Error Control 23 0 2 8 % Steatosis 3 9 12 63 % NASH 2 4 5 55% Out_of_bag_error 38% - Based on the OOB Error rate of 38%, the Random Forest model that was created could be used to predict whether a subject has steatosis, steatohepatitis, or no fatty liver disease with about 62% accuracy from analysis of the levels of the biomarkers in samples from the subject. The biomarkers that are the most important biomarkers for distinguishing the groups are listed in Table 4B and displayed in
Figure 3 .Table 4B. Most important biomarkers to distinguish control, steatosis and steatohepatitis subjects from Random Forest Importance Plot shown in Figure 3. ID Biomarker 2734 gamma-glutamyltyrosine 32322 glutamate 33073 Metabolite - 11728 32412 butyrytcarnitine 18497 taurocholate 32393 glutamylvaline 1299 tyrosine 32739 Metabolite - 11422 15140 kynurenine 32868 glycocholate* 33420 gamma-tocopherol- 32748 Metabolite - 11431 27718 creatine 31489 Metabolite - 10914 32552 Metabolite - 11235 15753 hippurate 32846 Metabolite - 11529 17028 Metabolite - 4611 32735 Metabolite - 01911_200 32808 Metabolite - 11491 15990 glycerophosphorylcholine (GPC) 32701 urate- 33362 gamma-glutamylphenylalanine- 32547 Metabolite -11230 32497 10c-undecenoate 32632 Metabolite -11315 59 histidine 32621 Metabolite - 11304 32749 Metabolite -11432 32559 Metabolite - 11242 1126 alanine 1113 isocitrate 1125 isoleucine 527 lactate 60 leucine 584 mannose 24285 Metabolite - 10026 30821 Metabolite - 10812 6847 Metabolite - 1496 7933 Metabolite -1911 10715 Metabolite - 2395 12644 Metabolite - 3016 12658 Metabolite - 3026 12751 Metabolite - 3073 12780 Metabolite - 3098 13600 Metabolite - 3330 16511 MetaboJite - 4274 18706 Metabolite - 5769 20267 Metabolite - 7187 21762 Metabolite - 8506 24233 Metabolite - 9855 18392 theobromine 2761 thryoxine 1604 urate 1649 valine 3147 xanthine Table 5. Confusion Matrix showing Control subjects can be distinguished from Steatosis subjects. Confusion Matrix: Control vs. Steatosis Control_ Predicted Steatosis Predicted Error Control 22 3 12 % Steatosis 1 10 9 % Out_of_bag_error 11% - Based on the OOB Error rate of 11%, the Random Forest model that was created could be used to predict whether a subject has steatosis or no fatty liver disease with about 89% accuracy from analysis of the levels of the biomarkers in samples from the subject. The biomarkers that are the most important biomarkers for distinguishing the groups are listed in Table 5B and displayed in
Figure 1 .Table 5 B. Most important biomarkers from Random Forest Importance Plot shown in Figure 1. ID Biomarker 2734 gamma-glutamyltyrosine 18497 taurocholate 32412 butyrylcarnitine 32552 Metabolite - 11235 1299 tyrosine 606 uridine 32322 glutamate 32621 Metabolite - 11304 17028 Metabolite - 4611 19490 Metabolite - 6488 32497 10c-undecenoate 32748 Metabolite - 11431 12789 Metabolite - 3107 32393 glutamylvaline 32547 Metabolite - 11230 12763 Metabolite - 3083 32808 Metabolite - 11491 25602 Metabolite - 10432 32739 Metabolite - 11422 33073 Metabolite - 11728 31489 Metabolite - 10914 32749 Metabolite - 11432 32631 Metabolite - 11314 33386 Metabolite - 12035 32559 Metabolite - 11242 32846 Metabolite -11529 33242 Metabolite - 11897 33362 gamma-glutamylphenylalanine- 32945 Metabolite -11628 12790 Metabolite - 3108 1126 alanine 18476 glycocholate Isobar 47 (taurochenodeoxycholic acid, taurodeoxycholic acid) Isobar 66 (glycochenodeoxycholic acid, glychodeoxycholic acid) 57 lactate 584 mannose 24285 Metabolite-10026 31595 Metabolite-10951 10551 Metabolite-2347 11923 Metabolite-2821 12644 Metabolite-3016 12647 Metabolite-3019 12656 Metabolite-3025 12658 Metabolite-3026 12751 Metabolite-3073 Metabolite-3077 12780 Metabolite-3098 13142 Metaboiite-3165 13600 Metabolite-3330 16337 Metabolite-4187 Metabolite-4361 17304 Metabolite-4759 17390 Metabolite-4806 18118 Metabolite-5346 18706 Metabolite-5769 21762 Metabolite-8506 2761 thyroxine 1604 urate Table 6. Confusion Matrix showing Control subjects can be distinguished from NASH subjects. Confusion Matrix: Control vs. NASH Control_ Predicted NASH_ Predicted Error Control 23 2 8 % NASH 2 22 8 % Out_of_bag_error 8% - Based on the OOB Error rate of 8%, the Random Forest model that was created could be used to predict whether a subject has steatohepatitis or no fatty liver disease with about 92% accuracy from analysis of the levels of the biomarkers in samples from the subject. The biomarkers that are the most important biomarkers for distinguishing the groups are listed in Table 6B and displayed in the importance plot in
Figure 2 .Table 6B. Most important biomarkers from Random Forest Importance Plot shown in Figure 2. ID Biomarker 33073 Metabolite - 11728 15140 kynurenine 32868 glycocholate* 32412 butyrylcarnitine 32322 glutamate 2734 gamma-glutamyltyrosine 15753 hippurate 31489 Metabolite - 10914 32739 Metabolite - 11422 33420 gamma-tocopherol- 32881 Metabolite - 11564 32393 glutamylvaline 32519 Metabolite - 11205 32748 Metabolite - 11431 32701 urate- 32550 Metabolite - 02272_201 1299 tyrosine 32548 Metabolite - 11231 33362 gamma-glutamylphenylalanine- 584 mannose 32675 Metabolite - 03951_200 32632 Metabolite - 11315 32846 Metabolite - 11529 17028 Metabolite - 4611 32497 10c-undecenoate 32749 Metabolite - 11432 16308 Metabolite - 4147 32544 Metabolite - 11227 18497 taurocholate 32697 Metabolite - 11380 21047 3-methyl-2-oxobutyric acid 1126 alanine 1647 glutamine 1113 isocitrate 1125 isoleucine 60 leucine 20699 meso-erythritol 24285 Metabolite-10026 30821 Metabolite-10812 5628 Metabolite-1086 5687 Metabolite-1110 6398 Metabolite-1335 6847 Metabolite-1496 8509 Metabolite-2041 10286 Metabolite-2272 10715 Metabolite-2395 12751 Metabolite-3073 12767 Metabolite-3087 12780 Metabolite-3098 16511 Metabolite-4274 18706 Metabolite-5769 20267 Metabolite-7187 1649 valine 3147 xanthine Table 7. Confusion Matrix showing Steatosis subjects can be distinguished from steatohepatitis (NASH) subjects. Confusion Matrix: Steatosis vs. NASH Steatosis_ Predicted NASH_ Predicted Error Steatosis 10 14 58 % NASH 5 6 45% Out_of_bag_error 54% - Based on the OOB Error rate of 54%, the Random Forest model that was created could be used to predict whether a subject has steatosis or steatohepatitis with about 46% accuracy from analysis of the levels of the biomarkers in samples from the subject.
- The compounds that are the most important biomarkers for distinguishing the groups are shown in the importance plots in
Figures 1 ,2 ,3 .Figure 1 lists the biomarker compounds that are most important in distinguishing steatosis subjects and Control subjects. Listed inFigure 2 are the biomarker compounds that are most important in distinguishing steatohepatitis subjects from control subjects. Listed inFigure 3 are the biomarker compounds that are most important in distinguishing steatosis, steatohepatitis and control subjects. - Recursive partitioning was performed to uncover the biomarkers that can best differentiate the 2 groups of subjects. It relates a 'dependent' variable (e.g. Group or Y) to a collection of independent ('predictor') variables (e.g. metabolites or X) in order to uncover -- or simply understand -- the elusive relationship, Y=f(X). It was performed with the JMP program (SAS) to generate a decision tree. The significance level of each "split" of data into the nodes or branches of the tree was computed as p-values, which discern the quality of the split relative to a random event. It was given as LogWorth, which is the negative log10 of a raw p-value.
- The recursive partitioning results showing the classification of Control and steatosis subjects is shown in
Figure 4 . The biomarkers that contribute to the classification are listed in Table 8. The recursive partitioning results showing the classification of steatosis and steatohepatitis (NASH, SH) are shown inFigure 5 and the biomarkers used in the classification are listed in Table 9. The recursive partitioning results showing the classification of control and steatohepatitis are shown inFigure 6 and the biomarkers are listed in Table 10. The recursive partitioning results showing the use of the biomarkers to classify steatosis, steatohepatitis and control subjects are shown inFigure 7 and the biomarkers are listed in Table 11. - The sensitivity and specificity of a given biomarker was determined by the Receiver Operating Characteristic curve (or ROC curve), which plots the true positive rate against the false positive rate for the different possible cutpoints of the specific biomarker. The area under the curve is a measure of test accuracy. An area of 1 represents a perfect test while an area of 0.5 represents a worthless test. A rough guide for classifying the accuracy of a diagnostic test is the traditional academic point system:
- 90-1 = excellent
- 80-.90 = good
- 70-.80 = fair
- 60-.70 = poor
- 50-.60 = fail
- ROC curves are shown in
Figures 4 ,5 ,6 and7 . The control subjects are separated from steatosis subjects with an accuracy of >90 (Figure 4 ). The steatosis and steatohepatitis subjects can be distinguished with >82% accuracy (Figure 5 ). The Control and steatohepatitis subjects are classified >87% accuracy (Figure 6 ). The three groups can be classified using the biomarkers with >70% (NASH), >77% (Steatosis), >86% accuracy (control) (Figure 7 ).Table 8. Recursive Partitioning Biomarkers, Steatosis vs control. ID COMPOUND Library LogWorth Candidate G^2 2734 gamma glutamyltyrosine 200 7.2110 29.7676 18497 taurocholate 201 4.5487 20.2589 32599 Metabolite - 11282 201 3.4916 17.2822 20699 erythritol 50 3.4916 17.2822 32552 Metabolite - 11235 201 3.3649 16.7903 32322 glutamate 50 3.3649 16.7903 32393 glutamylvaline 200 3.0618 15.2513 12763 Metabolite - 3083 50 3.0147 15.2513 32497 10c undecenoate 201 2.9895 15.3210 19490 Metabolite - 6488 50 2.9743 15.2513 1299 tyrosine 200 2.9718 15.2513 33242 Metabolite - 11897 201 2.9718 15.2513 32748 Metabolite - 11431 201 2.9601 15.2052 32621 Metabolite - 11304 200 2.8266 14.6774 606 uridine 201 2.8266 14.6774 17028 Metabolite - 4611 50 2.8266 14.6774 12789 Metabolite - 3107 50 2.4680 12.6627 32808 Metabolite - 11491 201 2.3944 12.6627 32412 butyrylcarnitine 200 2.3372 12.8627 32547 Metabolite - 11230 201 2.3242 12.6627 12790 Metabolite - 3108 50 2.2779 12.4746 33073 Metabolite - 11728 200 2.2201 12.1291 32739 Metabolite - 11422 201 2.1932 12.1291 30805 Metabolite - 10810 50 2.1932 12.1291 32776 Metabolite - 11459 200 2.1488 11.9121 32697 Metabolite - 11380 200 2.1443 11.9121 32701 urate 200 2.1403 11.9121 32559 Metabolite - 11242 201 2.1279 11.8611 32631 Metabolite - 11314 200 2.1279 11.8611 32945 Metabolite - 11628 201 2.1279 11.8611 33386 Metabolite - 12035 50 2.0266 11.2117 Table 9. RP Biomarker Candidates, steatosis vs. steatohepatitis. ID COMPOUND Library LogWorth Candidate G^2 27718 creatine 200 2.8020 14.5688 12067 undecanoate 201 2.7871 14.5095 32729 Metabolite - 11412 200 2.5472 13.5499 32855 Metabolite - 11538 201 2.5472 13.5499 32735 Metabolite - 01911_200 200 2.4708 13.0756 32621 Metabolite - 11304 200 2.1940 12.1162 27275 Metabolite - 10507 50 2.0579 11.5561 Table 10. RP Biomarkers of steatohepatitis (NASH) vs Control. ID COMPOUND Library LogWorth Candidate G^2 33073 Metabolite - 11728 200 7.3726 31.8519 32868 glycocholate 201 6.5169 28.4230 15140 kynurenine 200 6.4082 27.7714 2734 gamma glutamyltyrosine 200 5.5940 24.5076 32412 butyrylcarnitine 200 5.4888 24.6395 15753 hippurate 201 5.2301 23.5921 32322 glutamate 50 4.5652 21.1976 33420 gamma tocopherol 50 4.5330 21.1976 32748 Metabolite - 11431 201 4.3254 20.3263 32739 Metabolite - 11422 201 4.2214 19.9467 32393 glutamylvaline 200 3.9888 19.1924 32550 Metabolite - 02272 201 3.9860 19.0839 31489 Metabolite - 10914 50 3.8423 18.5637 32519 Metabolite - 11205 200 3.8117 18.4417 33133 Metabolite - 11788 200 3.6919 17.9988 32632 Metabolite - 11315 200 3.6913 17.9988 32548 Metabolite - 11231 201 3.6260 17.7540 16308 Metabolite - 4147 50 3.6255 17.7540 32881 Metabolite - 11564 201 3.5761 17.5685 32675 Metabolite - 03951 200 3.5752 17.5685 32697 Metabolite - 11380 200 3.4581 17.1290 32863 Metabolite - 11546 201 3.4182 16.9876 17028 Metabolite - 4611 50 3.3802 16.8375 584 mannose 50 3.3005 16.5389 33362 gamma glutamylphenylalanine 200 3.1967 16.1427 32749 Metabolite - 11432 201 3.1952 16.1427 32701 urate 200 3.1486 15.9669 32846 Metabolite - 11529 201 3.1224 15.8433 1299 tyrosine 200 3.1159 15.8433 32544 Metabolite - 11227 201 3.1019 15.7905 32564 Metabolite - 11247 201 2.9040 15.0281 32517 Metabolite - 11203 200 2.9012 15.0281 32808 Metabolite - 11491 201 2.8993 14.9830 33012 Metabolite - 11674 200 2.8909 14.9830 31787 3-carboxyl-4-methyl-5-propyl-2-furanpropanoic acid 201 2.8894 14.9830 20699 erythritol 50 2.8894 14.9830 32110 Metabolite - 11086 50 2.8894 14.9830 12783 Metabolite - 3101 50 2.8894 14.9830 19402 Metabolite - 6346 50 2.8894 14.9830 18497 taurocholate 201 2.6891 13.9546 59 histidine 201 2.6508 14.0671 12774 Metabolite - 3094 50 2.6508 14.0671 32682 Metabolite - 11365 201 2.6217 13.9546 33227 Metabolite - 11882 201 2.5727 13.7651 15990 glycerophosphorylcholine (GPC) 200 2.5636 13.7298 32547 Metabolite - 11230 201 2.5131 13.5334 32497 X10c undecanoate 201 2.4846 13.4226 32549 Metabolite - 02269 201 2.4738 13.3217 32552 Metabolite - 11235 201 2.4690 13.3619 32385 Metabolite - 11180 50 2.4078 13.0513 32621 Metabolite - 11304 200 2.3922 13.0617 20488 glucose 50 2.3922 13.0617 16865 Metabolite - 4522 50 2.3036 12.7022 64 phenylalanine 200 2.2026 12.3145 32637 Metabolite - 11320 201 2.1916 12.2709 32813 Metabolite - 11496 201 2.1916 12.2709 32854 Metabolite - 11537 200 2.1916 12.2709 27256 Metabolite - 10500 50 2.1916 12.2709 32346 glycochenodeoxycholate 201 2.1443 11.9681 32656 Metabolite - 11339 201 2.0482 11.6993 16650 Metabolite - 4360 50 2.0204 11.5103 607 urocanate 200 2.0135 10.2237 32559 Metabolite - 11242 201 2.0012 11.5103 Table 11. RP Biomarkers of Steatosis vs Steatohepatitis (NASH) Vs Control. ID COMPOUND Library LogWorth Candidate G^2 2734 gamma glutamyltyrosine 200 8.7610 39.6669 33073 Metabolite - 11728 200 6.9137 33.1250 32868 glycocholate 201 5.6594 28.4476 32412 butyrylcarnitine 200 5.5221 27.9670 15140 kynurenine 200 5.4648 27.7794 32322 glutamate 50 5.4202 27.6254 18497 taurocholate 201 4.8465 25.6695 32748 Metabolite - 11431 201 4.5458 24.5681 32393 glutamylvaline 200 4.4325 24.1102 1299 tyrosine 200 4.4170 24.1102 15753 hippurate 201 4.2727 23.5947 32739 Metabolite - 11422 201 3.9941 22.5914 17028 Metabolite - 4611 50 3.7736 21.7885 33420 gamma tocopherol 50 3.6961 21.4058 20699 erythritol 50 3.4424 20.5670 31489 Metabolite - 10914 50 3.4147 20.4362 32552 Metabolite - 11235 201 3.4135 20.4592 32697 Metabolite - 11380 200 3.2207 19.7221 32519 Metabolite - 11205 200 3.2148 19.7148 32749 Metabolite - 11432 201 3.1735 19.5592 33362 gamma glutamylphenylalanine 200 3.1317 19.2619 32846 Metabolite - 11529 201 3.1175 19.1830 32550 Metabolite - 02272_201 201 3.0781 19.1976 32808 Metabolite - 11491 201 2.9873 18.6852 32547 Metabolite - 11230 201 2.9438 18.6852 16308 Metabolite - 4147 50 2.8966 18.4875 32548 Metabolite - 11231 201 2.8923 18.4875 33133 Metabolite - 11788 200 2.8602 18.3636 32735 Metabolite - 01911_200 200 2.8564 18.1394 32863 Metabolite - 11546 201 2.8379 18.1709 32881 Metabolite - 11564 201 2.8103 18.1709 33242 Metabolite - 11897 201 2.8094 18.1676 32675 Metabolite - 03951_200 200 2.7808 18.0072 59 histidine 201 2.7802 18.0542 32632 Metabolite - 11315 200 2.7704 17.9993 27718 creatine 200 2.6480 17.5391 32701 urate 200 2.6462 17.5321 584 mannose 50 2.6462 17.5321 32599 Metabolite - 11282 201 2.5826 17.2822 32559 Metabolite - 11242 201 2.5799 17.2717 32497 10c undecenoate 201 2.5001 16.9560 606 uridine 201 2.4079 16.5890 32621 Metabolite - 11304 200 2.4027 16.5683 12783 Metabolite - 3101 50 2.4027 16.5683 32564 Metabolite - 11247 201 2.3935 16.4772 32517 Metabolite - 11203 200 2.3800 16.4772 12763 Metabolite - 3083 50 2.3715 16.2338 32544 Metabolite - 11227 201 2.3539 16.3727 19490 Metabolite - 6488 50 2.3240 16.2338 12067 undecanoate 201 2.3176 16.2264 32854 Metabolite - 11537 200 2.2206 15.7775 32813 Metabolite - 11496 201 2.2068 15.7775 32945 Metabolite - 11628 201 2.1937 15.7238 32110 Metabolite - 11086 50 2.1659 15.6103 19402 Metabolite - 6346 50 2.1659 15.6103 31787 3-carboxyl-4-methyl-5-propyl-2-furanpropanoic acid 201 2.1292 15.4023 32729 Metabolite - 11412 200 2.1279 15.4545 32549 Metabolite - 02269 201 2.0837 15.0750 15990 glycerophosphorylcholine GPC 200 2.0516 15.1396 33012 Metabolite - 11674 200 2.0280 14.9832 32385 Metabolite - 11180 50 2.0268 14.8693 - Biomarkers were discovered by (1) analyzing blood plasma samples from different groups of female human subjects and from different groups of male human subjects to determine the levels of metabolites in the samples and then (2) statistically analyzing the results to determine those metabolites that were differentially present in the two groups.
- For males, the plasma samples used for the analysis were 7 control samples that were from healthy subjects, 6 samples from patients with steatosis and 8 samples from patients with steatohepatitis. For females, the plasma samples used for the analysis were 18 control samples that were from healthy subjects, 5 samples from patients with steatosis and 16 samples from patients with steatohepatitis. In both the male and the female studies, after the levels of metabolites were determined, the data was analyzed using significance tests (ANOVA, ANCOVA, Wilcoxon).
- ANOVA was used to identify significant differences in the mean levels of metabolites between two populations (i.e., Steatosis vs. Control, Steatohepatitis vs. Control, Steatosis vs. Steatohepatitis).
- As listed below in Tables 12 (male subjects) and 13 (female subjects), biomarkers were discovered that were differentially present between plasma samples from steatosis patients and Control subjects, biomarkers that were discovered that were differentially present between plasma samples from patients with steatohepatitis and from Control subjects and biomarkers that were discovered that were differentially present between plasma samples from steatosis and plasma samples from subjects with steatohepatitis (i.e. NASH).
- Tables 12 and 13 include, for each listed biomarker, the p-value and the q-value determined in the statistical analysis of the data concerning the biomarkers in the steatosis mean level as compared to the control mean level, the NASH mean level as compared to the control mean level, and the steatosis mean level as compared to the NASH mean level. Library indicates the chemical library that was used to identify the compounds. The number 50 refer to the GC library and the number 61 refers to the LC library. Comp ID refers to the identification number for the compound in our internal chemical compound database.
- Table 12 lists biomarkers for males, including, for each biomarker, the p-value and q-value for the specified comparisons of groups as described above.
Table 12. Biomarkers from male subjects with Steatosis compared to Control subjects, steatohepatitis (NASH) compared to Control subjects and Steatosis compared to steatohepatitis (NASH) subjects. COMPOUND COMP_ID LIBRARY Control vs. NASH Control vs. STEATOSIS NASH vs. STEATOSIS p-value q-value p-value q-value p-value q-value stearate 1358 50 4.00E-04 0.0633 0.0128 0.2286 0.3457 0.7893 palmitate 1336 50 9.00E-04 0.0633 0.0091 0.1836 0.5612 0.8289 isoleucine 1125 50 0.0011 0.0633 0.0025 0.1264 0.9729 0.8893 glutamate 57 50 0.0011 0.0633 0.0305 0.2368 0.3124 0.7803 Metabolite-9033 22570 50 0.0021 0.0872 0.2901 0.66 0.0507 0.6206 Metabolite-3087 12767 50 0.0031 0.0872 0.1491 0.4771 0.1507 0.7628 valine 1649 50 0.0034 0.0872 0.0243 0.2368 0.5868 0.832 isoleucine 18118 50 0.0036 0.0872 0.0019 0.1264 0.6472 0.8475 glutamate 12751 50 0.0036 0.0872 0.0472 0.2804 0.4112 0.8022 Metabolite-4274 16511 50 0.0038 0.0872 0.106 0.3961 0.2349 0.7803 linoleate 1105 50 0.0049 0.0872 0.051 0.2862 0.4508 0.8145 leucine 60 50 0.0054 0.0872 0.0175 0.2368 0.8025 0.8527 Metabolite-5769 18706 61 0.0054 0.0872 0.0025 0.1264 0.626 0.8421 isocitrate 1113 61 0.0055 0.0872 0.094 0.3845 0.3151 0.7803 Metabolite-2041 8509 61 0.0059 0.0872 0.0536 0.2922 0.4791 0.8182 Metabolite-2270 10247 61 0.0061 0.0872 0.0206 0.2368 0.7827 0.8519 Metabolite-10932 31510 61 0.007 0.0872 0.0338 0.2455 0.6578 0.8475 alanine 1126 50 0.0072 0.0872 0.0298 0.2368 1 0.7063 0.8475 tyrosine 12780 50 0.0073 0.0872 0.0272 0.2368 0.7393 0.8519 Metabolite-8214 21421 50 0.0085 0.0948 0.0925 0.3845 0.398 0.8022 glucose 20488 50 0.0095 0.0948 0.0911 0.3845 0.4236 0.8022 Metabolite-10439 25609 50 0.0098 0.0948 0.0341 0.2455 0.7445 0.8519 Metabolite-1496 6847 61 0.0098 0.0948 0.9827 0.8655 0.0124 0.348 choline 15506 61 0.01 0.0948 0.6398 0.7767 0.0429 0.6206 glutamine 1647 50 0.0116 0.1058 0.1325 0.4409 0.3566 0.7893 Metabolite-9855 24233 61 0.0121 0.1061 0.8754 0.8551 0.0105 0.3457 Metabolite-7187 20267 61 0.0145 0.1218 0.4129 0.698 0.1218 0.7385 Metabolite-5646 18591 61 0.0157 0.1272 0.4187 0.698 0.0021 0.2874 3-methyl-2-oxobutyric acid 21047 61 0.0164 0.1281 0.1039 0.3961 0.5063 0.8289 Metabolite-4096 16186 61 0.0169 0.1281 0.1525 0.4771 0.3895 0.8005 Metabolite-9727 24077 50 0.0185 0.1342 0.0298 0.2368 0.9767 0.8893 Metabolite-1911 7933 61 0.0189 0.1342 0.6182 0.7691 0.0064 0.2874 - Table 13 lists biomarkers for females, including, for each biomarker, the p-value and the q-value for the specified comparisons of groups as described above.
Table 13. Biomarkers from female subjects with Steatosis compared to Control subjects, steatohepatitis (NASH) compared to Control subjects and Steatosis compared to steatohepatitis (NASH) subjects. COMPOUND COMP _ID LIB _ID Control vs. NASH Control vs. STEATOSIS NASH vs. STEATOSIS p-value q-value p-value q-value p-value q-value glutamate 57 50 1.73E-08 3.22E-06 0.0023 0.0904 0.2067 0.6864 urate 1604 50 3.32E-07 3.08E-05 0.0278 0.2958 0.1005 0.6474 glutamate 12751 50 8.91E-07 1.00E-04 0.0036 0.0977 0.4745 0.6864 Metabolite-5769 18706 61 4.24E-06 2.00E-04 8.00E-04 0.0661 0.9332 0.7199 isocitrate 1113 61 8.14E-06 3.00E-04 0.255 0.4932 0.0342 0.4905 Metabolite-10026 24285 61 1.94E-05 6.00E-04 0.0231 0.2804 0.4083 0.6864 glycocholate 18476 61 2.91E-05 8.00E-04 0.0172 0.2557 0.5271 0.6864 L-kynurenine, 15140 61 1.00E-04 0.0013 0.9893 0.73 0.0051 0.432 Metabolite-3330 13600 61 1.00E-04 0.0016 0.1335 0.3923 0.1878 0.6864 leucine 60 50 1.00E-04 0.0016 0.104 0.3726 0.241 0.6864 valine 1649 50 1.00E.04 0.0019 0.0938 0.3726 0.288 0.6864 isoleucine 1125 50 1.00E-04 0.0013 0.0574 0.3465 0.3262 0.6864 Metabolite-1110 5687 61 1.00E-04 0.0016 0.0032 0.0977 0.8124 0.6937 Metabolite- 31595 61 2.00E-04 0.0026 0.2368 0.4917 0.1503 0.6474 10951 Metabolite-4522 16865 50 2.00E-04 0.0021 0.0689 0.359 0.3877 0.6864 Metabolite-4274 16511 50 2.00E-04 0.0021 0.0431 0.3397 0.516 0.6864 Isobar-47-includes-taurochenodeoxy cholic acid-and-taurodeoxycholic acid 18882 61 2.00E-04 0.0021 0.032 0.3148 0.5941 0.6868 tyrosine 1299 61 3.00E-04 0.0026 0.0548 0.3465 0.492 0.6864 alanine 1126 50 4.00E-04 0.0036 0.1507 0.414 0.2717 0.6864 thyroxine 2761 61 5.00E.04 0.0043 0.2645 0.5014 0.1712 0.6644 Metabolite-2347 10551 61 5.00E-04 0.0048 0.0022 0.0904 0.4853 0.6864 Metabolite-10812 30821 50 7.00E-04 0.0058 0.1583 0.421 0.3247 0.6864 Metabolite-2269- 10245 61 7.00E-04 0.0056 0.0025 0.0904 0.4809 0.6864 glutamine 10245 1647 50 9.00E-04 0.0067 0.1091 0.3726 0.458 0.6864 meso-erythritol 20699 50 0.001 0.0067 0.1995 0.463 0.2975 0.6864 Metabolite-3183 13214 61 0.001 0.0067 0.106 0.3726 0.4805 0.6864 docosahexaenoat e-DHA- 19323 50 0.001 0.0067 0.0405 0.3397 0.7884 0.6896 Metabolite-4627 17068 61 0.001 0.0067 0.0268 0.2958 0.9307 0.7199 Isobar-66-includes-glycochenodeoxy cholic acid-glycodeoxycholi c acid 22803 61 0.0011 0.0067 0.0519 0.3465 0.7198 0.6896 5-oxoproline 1494 50 0.0012 0.0076 0.1022 0.3726 0.5195 0.6864 Metabolite-10589 27801 61 0.0013 0.0078 0.2598 0.4988 0.2575 0.6864 584 50 0.0013 0.0078 0.0435 0.3397 0.8177 0.6937 mannose metabolite-4360 16650 50 0.0015 0.0083 0.6433 0.6655 0.0796 0.5826 gamma-L-glutamyl-L-tyrosine 2734 61 0.0016 0.009 0.3615 0.5823 0.1942 0.6864 Metabolite-1086 5628 61 0.0017 0.0092 0.6934 0.6655 0.0743 0.5826 phenylalanine 64 61 0.0019 0.0095 0.1746 0.4408 0.4085 0.6864 lactate 527 50 0.0019 0.0095 0.1018 0.3726 0.586 0.6868 arachidonate 1110 50 0.002 0.0098 0.8148 0.6934 0.0194 0.4834 Metabolite-7187 20267 61 0.0021 0.0098 0.747 0.6811 0.0705 0.5824 Metabolite-1914 7941 61 0.0021 0.0098 0.0075 0.1505 0.5693 0.6868 Metabolite-3109 12791 50 0.0024 0.0109 0.783 0.6934 0.0195 0.4834 tyrosine 12780 50 0.0031 0.0138 0.0321 0.3148 0.9228 0.7184 xanthine 3147 61 0.0032 0.0138 0.2695 0.5014 0.3371 0.6864 Metabolite-1496 6847 61 0.0035 0.0149 0.3752 0.5823 0.005 0.432 Metabolite-2041 8509 61 0.0037 0.0154 0.3041 0.5383 0.3177 0.6864 3-4-5-trimethoxycinna mic acid 18291 61 0.0045 0.0183 0.0182 0.2557 0.6793 0.6896 Metabolite-3951 15529 61 0.0049 0.0192 0.0586 0.3465 0.9515 0.7253 Metabolite-3994 16016 61 0.005 0.0192 0.0249 0.2887 0.7558 0.6896 Metabolite-3094 12774 50 0.0055 0.0209 0.6697 0.6655 0.0218 0.4834 Metabolite-9855 24233 61 0.0058 0.0216 0.124 0.3816 0.7024 0.6896 Metabolite-5726 18657 61 0.006 0.022 0.7399 0.6781 0.1182 0.6474 glycerol 15122 50 0.0065 0.0229 0.0928 0.3726 0.8347 0.6975 Metabolite-2395 10715 61 0.0066 0.0229 0.0016 0.0904 0.1741 0.6654 Metabolite-4986 17627 50 0.0067 0.0229 0.1963 0.4608 0.5502 0.6868 3-methyl-2-oxobutyric acid 21047 61 0.0069 0.0234 0.0928 0.3726 0.8462 0.6991 Metabolite-2259 10156 61 0.0071 0.0235 0.6427 0.6655 0.1628 0.6474 Metabolite-3230 13296 61 0.0072 0.0235 0.6656 0.6655 0.1545 0.6474 palmitate 1336 50 0.0075 0.0237 0.3757 0.5823 0.3312 0.6864 Metabolite-1911 7933 61 0.0075 0.0237 0.1736 0.4408 0.6183 0.6868 Metabolite-2291 10414 61 0.0079 0.0245 0.0098 0.1787 0.4316 0.6864 pyruvate 599 61 0.0118 0.0359 0.9667 0.7259 0.0792 0.5826 Isobar-1-includes-mannose-fructose-glucose-galactose-alpha-L-sorbopyranose-Inositol-D-allose-D--altrose-D-psicone-L-gulose-allo-inositol 10737 61 0.0126 0.0375 0.055 0.3465 0.8389 0.6975 Metabolite-2272 10286 61 0.0128 0.0375 0.0731 0.359 0.94 0.7208 lysine 1301 50 0.0132 0.0384 0.271 0.5014 0.5375 0.6864 uridine 606 61 0.0139 0.0397 0.1016 0.3726 0.9509 0.7253 Metabolite-2390 10672 61 0.0143 0.0402 0.0557 0.3465 0.8179 0.6937 Metabolite-9043 22600 50 0.0154 0.0427 0.0118 0.2006 0.375 0.6864 Metabolite-2329 10544 61 0.0157 0.0429 0.3917 0.5823 0.4157 0.6864 Metabolite-9033 22570 50 0.0163 0.0437 0.0719 0.359 0.883 0.7052 Metabolite-4251 16496 50 0.018 0.0478 0.7335 0.6781 0.1998 0.6864 Metabolite-4276 16518 50 0.0183 0.0479 0.3795 0.5823 0.4523 0.6864 Metabolite-10932 31510 61 0.02 0.0515 0.6694 0.6655 0.2414 0.6864 Metabolite-3323 13557 61 0.0221 0.0561 0.4812 0.657 0.3823 0.6864 Metabolite-3016 12644 50 0.0229 0.0575 0.0038 0.0977 0.1636 0.6474 Metabolite-1981 8210 61 0.0248 0.0613 0.2371 0.4917 0.7138 0.6896 Metabolite-3088 12768 50 0.0272 0.0663 0.8115 0.6934 0.0842 0.5956 Metabolite-3087 12767 50 0.0295 0.0712 0.2356 0.4917 0.7535 0.6896 Metabolite-10797 30728 61 0.0309 0.0735 0.7815 0.6934 0.2311 0.6864 Metabolite-3100 50 0.0316 0.0742 0.0624 0.3465 0.6928 0.6896 2-amino butyrate 12645 50 0.033 0.0756 0.3666 0.5823 0.5717 0.6868 threonine 1284 50 0.033 0.0756 0.1048 0.3726 0.8734 0.7052 Metabolite-3707 14837 61 0.0338 0.0761 0.019 0.2557 0.3591 0.6864 Metabolite-1834 7650 61 0.0343 0.0761 4.00E-04 0.0646 0.0289 0.4905 Metabolite-10785 30633 61 0.0344 0.0761 0.0612 0.3465 0.6678 0.6896 Metabolite-2139 9130 61 0.0349 0.0762 0.4999 0.6647 0.4382 0.6864 Metabolite-4613 17033 61 0.0375 0.0808 0.4934 0.663 0.4563 0.6864 gluconate 587 50 0.039 0.083 0.9105 0.7087 0.1966 0.6864 N-acetylglycine 27710 50 0.0396 0.083 0.1303 0.3923 0.9192 0.7177 Metabolite-10507 27275 50 0.0398 0.083 0.8432 0.6996 0.1135 0.6474 threonate 27738 50 0.0404 0.0834 0.5847 0.6655 0.3906 0.6864 p-hydroxyphenylla ctate-HPLA- 1431 50 0.0411 0.0837 0.7669 0.6934 0.0954 0.6428 palmitoleate 1507 50 0.0427 0.0854 0.6825 0.6655 0.3285 0.6864 Metabolite-3995 16019 61 0.0428 0.0854 0.6036 0.6655 0.3849 0.6864 Metabolite-2231 9905 61 0.0463 0.0913 0.3818 0.5823 0.6207 0.6868 Metabolite-3165 13142 61 0.0481 0.0939 0.0439 0.3397 0.4996 0.6864 stearate 1358 50 0.0486 0.0939 0.7225 0.6781 0.3214 0.6864 Metabolite-9726 24076 50 0.0504 0.0954 0.6042 0.6655 0.0688 0.5824 serine 12663 50 0.0504 0.0954 0.578 0.6655 0.4331 0.6864 Metabolite-5774 18723 61 0.0514 0.0964 0.8537 0.6996 0.254 0.6864 Metabolite-10933 31518 50 0.0578 0.1062 0.2685 0.5014 0.0197 0.4834 Metabolite-2321 10501 61 0.0918 0.1468 0.3393 0.5814 0.0402 0.4905 Isobar-60-includes-s-2-hydroxybutyric acid-2-hydroxyisobutyric acid 22261 61 0.1198 0.1696 0.2887 0.5228 0.0389 0.4905 threonine 12666 50 0.131 0.18 0.3057 0.5383 0.0454 0.5204 Metabolite-2821 11923 61 0.1533 0.1987 5.00E-04 0.0646 0.0098 0.4834 creatine 27718 61 0.1942 0.2211 0.1218 0.3816 0.0183 0.4834 paraxanthine 18254 61 0.2253 0.247 0.0823 0.3726 0.013 0.4834 Metabolite-3443 14125 61 0.2434 0.258 0.4408 0.0371 0.4905 fructose 577 50 0.2708 0.2732 0.1778 0.4674 0.0487 0.5204 theophylline 18394 61 0.3262 0.301 0.15 0.414 0.0399 0.4905 alpha-keto-glutarate 528 61 0.364 0.3232 0.0187 0.2557 0.004 0.432 Metabolite-6346 19402 50 0.4153 0.3451 0.0919 0.3726 0.029 0.4905 Metabolite-8506 21762 61 0.4328 0.3491 0.0711 0.359 0.0227 0.4834 Metabolite-1667 7132 61 0.4557 0.3628 0.1102 0.3726 0.0398 0.4905 caffeine 569 61 0.462 0.3658 0.036 0.3397 0.0114 0.4834 Metabolite-4238 16471 61 0.9278 0.51 0.0226 0.2804 0.0282 0.4905 - Table 14 below includes analytical characteristics of each of the isobars and the unnamed metabolites listed in Tables 1-3 and 8-13 above. The table includes, for each listed Metabolite, the Metabolite ID (ID), the retention time (RT), retention index (RI), mass, library, and polarity obtained using the analytical methods described above. "Metabolite ID" refers to the unique identifier for that compound in our internal chemical library database. "Mass" refers to the mass of the C 12 isotope of the parent ion used in quantification of the compound. The values for "Library" give an indication of the analytical method used for quantification: "50" indicates GC-MS and "61", "200" and "201" indicate LC-MS. "Polarity" indicates the polarity of the quantitative ion as being either positive (+) or negative (-).
Table 14. Analytical Characteristics of Unnamed Metabolites. ID Biomarker Library RT RI MASS Polarity 1882 Isobar 47 includes taurochenodeoxycholic acid and taurodeoxycholic acid 61 15.51 15700.0 498.4 - 5628 Metabolite - 1086 61 4.56 4811.0 294.1 + 6398 Metabolite - 1335 61 8.74 9162.2 367.2 + 6847 Metabolite - 1496 61 1.53 1562.0 133.0 - 7933 Metabolite - 1911 61 11.42 11799.6 464.1 + 10501 Metabolite - 2321 61 13.44 12940.0 314.3 + 10629 Metabolite - 2386 61 11.94 12150.0 539.2 - 10737 Isobar 1 includes mannose, fructose, glucose, galactose, alpha-L-sorbopyranose, Inositol, D-allose, D-(+)-altrose, D-psicone,L-(+)-gulose, allo-nositol 61 1.45 1481.0 215.0 - 11923 Metabolite - 2821 61 6.80 7980.0 119.1 + 12593 Metabolite-2973 50 4.74 1213.4 281 + 12604 Metabolite-2981 50 5.21 1265.2 210.9 + 12626 Metabolite-3003 50 6.79 1446.6 218.1 + 12754 Metabolite-3075 50 10.36 1857.9 204 + 12757 Metabolite-3078 50 10.65 1887 203.1 + 12761 Metabolite-3081 50 10.89 1911.5 204 + 12763 Metabolite-3083 50 10.94 1916.1 204 + 12769 Metabolite-3089 50 11.28 1951.5 116.9 + 12770 Metabolite-3090 50 11.31 1955 243.1 + 12771 Metabolite-3091 50 11.41 1966.2 232.1 + 12774 Metabolite-3094 50 11.55 1980.6 299 + 12781 Metabolite-3099 50 11.77 2005.2 204 + 12782 Metabolite-3100 50 11.85 2013.2 204 + 12783 Metabolite-3101 50 11.93 2022.2 290 + 12785 Metabolite-3103 50 12.09 2039.8 290.1 + 12789 Metabolite-3107 50 12.21 2053.2 204.1 + 12790 Metabolite-3108 50 12.24 2056.5 246 + 13142 Metabolite - 3165 61 8.38 8472.2 265.0 + 13214 Metabolite - 3183 61 9.37 9441.0 295.2 + 13296 Metabolite - 3230 61 3.10 3043.2 245.0 + 13557 Metabolite - 3323 61 14.47 14696.5 624.4 - 13600 Metabolite - 3330 61 14.06 14292.2 514.3 - 15529 Metabolite - 3951 61 8.41 8705.4 367.1 + 16016 Metabolite - 3994 61 1.63 1640.4 427.0 + 16019 Metabolite - 3995 61 2.19 2230.0 207.7 - 16138 Metabolite-4080 50 14.02 2270.2 299 + 16308 Metabolite-4147 50 10.07 1767.1 290.2 + 16337 Metabolite - 4167 61 11.03 10920.4 286.2 + 16650 Metabolite-4360 50 9.15 1678.2 347.2 + 16665 Metabolite-4364 50 10.66 1852.4 232 + 16666 Metabolite-4365 50 11.05 1892.9 204 + 16819 Metabolite-4496 50 6.76 1398.2 204 + 16829 Metabolite-4503 50 8.39 1589 227.2 + 16865 Metabolite-4522 50 12.26 2025.4 217.1 + 16959 Metabolite-4595 50 5.65 1274.4 130 + 17028 Metabolite-4611 50 8.07 1546.6 292.1 + 17033 Metabolite - 4613 61 12.73 12778.0 541.4 - 17068 Metabolite - 4627 61 10.84 11034.9 591.3 + 17304 Metabolite - 4759 61 11.80 11906.0 310.2 + 17627 Metabolite-4986 50 11.56 1956.4 204.1 + 18232 Metabolite-5403 50 5.92 1300.2 319 + 18591 Metabolite - 5646 61 8.96 8750.0 228.0 - 18657 Metabolite - 5726 61 14.05 13757.0 417.3 - 18706 Metabolite - 5769 61 11.12 10753.2 485.2 - 18868 Metabolite-5847 50 12.35 2040 288.2 + 18929 Metabolite-5907 50 8.69 1643.2 229.1 + 19363 Metabolite-6227 50 5 1210.5 196.1 + 19368 Metabolite-6267 50 9.32 17704.5 257.1 + 19370 Metabolite-6268 50 9.91 1773.8 271.1 + 19374 Metabolite-6270 50 11.35 1929.6 320.2 + 19402 Metabolite-6346 50 8 1550.8 263.2 + 19490 Metabolite-6488 50 12.25 2021.7 204.1 + 19985 Metabolite-6957 50 11.71 1966 290.1 + 20267 Metabolite - 7187 61 8.38 8500.0 328.0 + 20950 Metabolite-7846 50 5.1 1208.1 145.1 + 21418 Isobar 56 - pipecolate; aminocyclopentane carboxylic acid 61 2.45 2850.0 130.1 + 21762 Metabolite - 8506 61 8.92 8811.0 475.1 + 22261 Isobar 60 includes- (s)-2-hydroxybutyric acid,2- 61 4.26 4725.0 148.9 - hydroxyisobutyric acid 24233 Metabolite - 9855 61 11.85 11605.3 462.2 - 24285 Metabolite - 10026 61 9.47 9300.3 259.1 - 27801 Metabolite - 10589 61 15.43 17536.8 619.3 - 30633 Metabolite - 10785 61 11.49 12073.4 363.0 + 30728 Metabolite - 10797 61 10.92 11563.3 352.2 - 31510 Metabolite - 10932 61 11.54 11928.0 190.0 + 31529 Metabolite - 10941 61 3.60 4101.0 191.8 + 32514 Metabolite-11200 200 5.62 5637 496.4 + 32516 Metabolite-11202 200 5.8 5823 524.4 + 32517 Metabolite-11203 200 5.65 5665 522.4 + 32518 Metabolite-11204 200 5.26 5263 229.2 + 32519 Metabolite-11205 200 5.55 5558 520.4 + 32520 Metabolite-11206 200 0.59 575 138.8 + 32545 Metabolite-11228 201 1.15 1136 278.1 - 32547 Metabolite-11230 201 1.44 1438 278.1 - 32548 Metabolite-11231 201 1.47 1471 330 - 32549 Metabolite-02269 201 1.55 1551 255.1 - 32550 Metabolite-02272 201 1.97 1958 189 - 32551 Metabolite-11234 201 2.01 2001 334.1 - 32552 Metabolite-11235 201 2.04 2033 326.1 - 32553 Metabolite-03832 201 2.2 2199 173.1 - 32557 Metabolite-06126 201 2.69 2684 203.1 - 32559 Metabolite-11242 201 2.96 2958 360 - 32560 Metabolite-07765 201 3.71 3705 245.1 - 32561 Metabolite-11244 201 3.78 3771 224.2 - 32562 Metabolite-11245 201 3.91 3902 238.3 - 32563 Metabolite-11246 201 3.94 3930 143.2 - 32564 Metabolite-11247 201 3.94 3932 213.1 - 32566 Metabolite-11249 200 1.24 1271 280.1 + 32567 Metabolite-11250 200 1.3 1339 150.2 + 32571 Metabolite-11254 200 2.05 2095 328.1 + 32572 Metabolite-11255 200 2.38 2442 247.1 + 32575 Metabolite-11258 200 2.89 2941 362 + 32578 Metabolite-11261 200 3.69 3732 286.2 + 32587 Metabolite-02249 201 4.03 4025 267.2 - 32588 Metabolite-01327 201 4.25 4242 583.2 - 32590 Metabolite-11273 201 4.56 4552 369.2 - 32593 Metabolite-02036 200 4.94 4985 616.2 + 32596 Metabolite-02250 200 5.14 5158 286.2 + 32599 Metabolite-11282 201 4.77 4763 254.8 - 32602 Metabolite-11285 200 5.28 5260 288.1 + 32609 Metabolite-01345 201 4.9 4887 369.2 - 32616 Metabolite-11299 201 4.9 4893 507.2 - 32619 Metabolite-11302 201 5.01 4998 397.3 - 32620 Metabolite-11303 201 5.02 5015 512.3 - 32621 Metabolite-11304 200 0.8 801 217.1 + 32625 Metabolite-11308 201 5.15 5133 365.3 - 32631 Metabolite-11314 200 0.64 634 243 + 32632 Metabolite-11315 200 1.19 1210 130.2 + 32634 Metabolite-11317 201 5.81 5703 219.3 - 32635 Metabolite-11318 201 5.81 5699 476.3 - 32636 Metabolite-11319 201 5.81 5700 269.4 - 32637 Metabolite-11320 201 5.65 5740 593.9 - 32638 Metabolite-11321 201 6.15 5997 569.9 - 32641 Metabolite-11324 201 6.24 6075 596 - 32643 Metabolite-11326 201 6.35 6160 213.2 - 32644 Metabolite-11327 200 5.16 5176 269.2 + 32648 Metabolite-11331 201 0.69 686 164.2 - 32651 Metabolite-11334 200 0.96 982 259.1 + 32652 Metabolite-11335 200 0.97 991 229.2 + 32654 Metabolite-11337 200 1 1020 160.2 + 32656 Metabolite-11339 201 0.69 689 156.2 - 32670 Metabolite-11353 200 0.8 811 203.2 + 32671 Metabolite-11354 200 0.76 770 146.2 + 32672 Metabolite-02546 200 0.75 764 129.2 + 32675 Metabolite-03951 200 1.87 1912 367.1 + 32682 Metabolite-11365 201 5.61 5527 303.3 - 32689 Metabolite-11372 201 5.35 5303 467.4 - 32691 Metabolite-11374 200 0.69 690 370.9 + 32692 Metabolite-11375 200 0.73 732 309.1 + 32694 Metabolite-11377 200 0.77 770 249.2 + 32696 Metabolite-11379 201 5.65 5566 267.3 - 32697 Metabolite-11380 200 1.04 1053 339.8 + 32698 Metabolite-11381 200 1.11 1126 186.2 + 32699 Metabolite-11382 200 1.16 1180 250.8 + 32702 Metabolite-11385 200 1.38 1430 312.1 + 32703 Metabolite-11386 200 1.47 1525 344.1 + 32704 Metabolite-11387 200 1.65 1699 294.1 + 32707 Metabolite-11390 200 2 2041 100.2 + 32709 Metabolite-03056 200 2.21 2264 185.2 + 32710 Metabolite-11393 200 2.34 2403 367.1 + 32717 Metabolite-11400 200 2.81 2855 710.1 + 32718 Metabolite-01342 200 2.8 2848 265.1 + 32722 Metabolite-11405 200 3.02 3075 264.8 + 32729 Metabolite-11412 200 3.78 3836 204.2 + 32732 Metabolite-11415 201 0.69 692 313.1 - 32734 Metabolite-10954 200 4.14 4229 288.2 + 32735 Metabolite-01911 200 4.26 4354 464.1 + 32738 Metabolite-11421 200 4.54 4634 314.2 + 32739 Metabolite-11422 201 0.89 884 151.1 - 32740 Metabolite-11423 201 1.05 1038 260.1 - 32741 Metabolite-11424 200 4.58 4664 227.1 + 32744 Metabolite-11427 201 1.16 1145 181.1 - 32746 Metabolite-11429 201 1.16 1151 245.1 - 32747 Metabolite-01142 201 1.19 1176 117.2 - 32748 Metabolite-11431 201 1.58 1575 330 - 32749 Metabolite-11432 201 1.89 1886 292.1 - 32751 Metabolite-11434 201 2.11 2107 370.1 - 32752 Metabolite-11435 201 2.14 2131 365.1 - 32753 Metabolite-09789 201 2.62 2613 153.1 - 32754 Metabolite-11437 201 2.89 2888 231 - 32755 Metabolite-11438 201 3.1 3092 241.2 - 32756 Metabolite-02276 201 3.35 3339 199.1 - 32757 Metabolite-11440 201 3.58 3571 246.3 - 32758 Metabolite-11441 201 3.78 3773 331.1 - 32759 Metabolite-11442 201 3.91 3902 331.1 - 32760 Metabolite-11443 201 3.92 3910 225.3 - 32761 Metabolite-11444 201 3.99 3983 541.2 - 32762 Metabolite-11445 201 4.01 3995 239.3 - 32764 Metabolite-11447 200 0.98 989 278.1 + 32767 Metabolite-11450 201 4.11 4103 224.2 - 32769 Metabolite-11452 201 4.12 4109 352.1 - 32776 Metabolite-11459 200 2.49 2545 246.2 + 32786 Metabolite-11469 200 3.82 3874 239.1 + 32787 Metabolite-11470 201 4.16 4151 525.2 - 32792 Metabolite-11475 201 4.25 4240 383.2 - 32793 Metabolite-11476 200 4.52 4616 189.1 + 32795 Metabolite-11478 201 4.3 4286 165.2 - 32797 Metabolite-11480 201 4.42 4406 229 - 32800 Metabolite-11483 201 4.45 4443 505.2 - 32802 Metabolite-11485 201 4.49 4478 378.2 - 32807 Metabolite-11490 201 4.77 4762 279.8 - 32808 Metabolite-11491 201 4.85 4846 567.3 - 32813 Metabolite-11496 201 5.58 5508 271.3 - 32814 Metabolite-11497 201 5.37 5324 233.3 - 32815 Metabolite-11498 201 5.78 5674 500.3 - 32822 Metabolite-11505 201 1.61 1614 101.2 - 32825 Metabolite-11508 201 2.97 2987 173.2 - 32827 Metabolite-11510 201 3.92 3925 385.2 - 32829 Metabolite-03653 200 0.82 826 144.2 + 32838 Metabolite-11521 200 3.71 3755 286.2 + 32839 Metabolite-11522 201 4.76 4754 313.2 - 32845 Metabolite-11528 200 4.74 4832 316.3 + 32846 Metabolite-11529 201 4.85 4845 624.3 - 32847 Metabolite-11530 201 4.87 4866 313.2 - 32848 Metabolite-11531 201 4.86 4850 391.3 - 32854 Metabolite-11537 200 5.14 5160 366.3 + 32855 Metabolite-11538 201 4.93 4920 311.3 - 32858 Metabolite-11541 201 4.99 4984 399 - 32863 Metabolite-11546 201 5.02 5015 448.4 - 32865 Metabolite-11548 201 5.09 5081 391.3 - 32866 Metabolite-11549 201 5.11 5093 339.3 - 32878 Metabolite-11561 201 1.26 1252 267.1 - 32879 Metabolite-11562 201 0.98 972 197.1 - 32880 Metabolite-11563 201 0.98 971 115.2 - 32881 Metabolite-11584 201 1.2 1188 177.1 - 32910 Metabolite-11593 201 0.79 790 189.2 - 32912 Metabolite-11595 201 0.92 919 665 - 32914 Metabolite-11597 201 1 991 665 - 32926 Metabolite-11609 201 1.48 1490 310.1 - 32945 Metabolite-11628 201 3.14 3133 360.1 - 32952 Metabolite-02277 201 3.61 3604 201.1 - 32954 Metabolite-06132 201 3.66 3655 321.1 - 32965 Metabolite-11648 201 4.84 4819 534.3 - 32970 Metabolite-11653 201 5.82 5686 331.3 - 32971 Metabolite-11654 200 2.53 2500 246.2 + 32978 Metabolite-11656 200 0.6 612 227 + 33012 Metabolite-11674 200 1.14 1151 189.1 + 33072 Metabolite-11727 200 0.71 709 241 + 33073 Metabolite-11728 200 0.8 804 427 + 33084 Metabolite-11739 200 3.15 3239 769 + 33131 Metabolite-11786 200 0.87 864 136 + 33132 Metabolite-11787 200 1.13 1126 148.1 + 33133 Metabolite-11788 200 1.17 1161 245 + 33138 Metabolite-11793 200 3.57 3634 601.1 + 33140 Metabolite-11795 200 1.46 1457 148.1 + 33154 Metabolite-11809 200 5.23 5248 381.5 + 33159 Metabolite-11814 200 2.39 2372 152.1 + 33163 Metabolite-11818 200 2.56 2535 146.1 + 33169 Metabolite-11824 201 1.4 1402 326.1 - 33171 Metabolite-11826 201 1.48 1489 194.1 - 33173 Metabolite-11828 201 1.69 1703 246.1 - 33174 Metabolite-11829 201 1.8 1813 230 - 33178 Metabolite-11833 201 1.97 1977 260.1 - 33183 Metabolite-11838 201 2.3 2314 276 - 33188 Metabolite-11843 201 2.69 2710 230.1 - 33190 Metabolite-11845 201 2.87 2891 615 - 33192 Metabolite-11847 201 3.05 3074 259.2 - 33194 Metabolite-11849 201 3.2 3229 266.2 - 33198 Metabolite-11853 201 3.59 3602 187.1 - 33203 Metabolite-11858 201 4.42 4400 437.1 - 33206 Metabolite-11861 201 4.63 4617 229.2 - 33209 Metabolite-11864 201 5.02 5012 280.9 - 33216 Metabolite-11871 200 5.25 5249 370.3 + 33219 Metabolite-11874 201 5.23 5199 197.3 - 33225 Metabolite-11880 201 5.44 5378 537.4 - 33227 Metabolite-11882 201 5.52 5445 301.3 - 33228 Metabolite-11883 200 5.54 5524 544.3 + 33232 Metabolite-11887 201 5.85 5736 307.4 - 33237 Metabolite-11892 201 0.71 710 367.1 - 33242 Metabolite-11897 201 1.69 1664 292.1 - 33248 Metabolite-11903 201 2.53 2484 283.1 - 33250 Metabolite-11905 201 4.44 4401 283.2 - 33252 Metabolite-11907 201 5.06 5036 313.3 - 33254 Metabolite-11909 201 5.3 5272 297.3 - 33258 Metabolite-11913 201 5.43 5402 275.3 - 33265 Metabolite-11920 200 0.68 686 268.1 + 33323 Metabolite-11977 200 3.21 3287 270.1 + 33366 Metabolite-12020 200 5.15 5178 424.4 + 33380 Metabolite-12029 201 0.68 683 329.1 - - While the invention has been described in detail and with reference to specific embodiments thereof, it will be apparent to one skilled in the art that various changes and modifications can be made without departing from the scope of the invention.
Claims (17)
- A method of diagnosing whether a subject has, or is predisposed to, steatohepatitis, comprising:analyzing a biological sample from a subject to determine the level of glycocholate in the sample, andcomparing the level of glycocholate in the sample to steatohepatitis-positive and/or steatohepatitis-negative reference levels of glycocholate in order to diagnose whether the subject has, or is predisposed to, steatohepatitis.
- The method of claim 1, further comprising analyzing the biological sample to determine the level(s) of one or more additional biomarkers for steatohepatitis in the sample, wherein the one or more additional biomarkers are selected from Tables 1, 3, 4B, 6B, 9, 10, 11, 12, 13, and/or Figure 2 and/or 3, and
comparing the level(s) of the one or more additional biomarkers in the sample to steatohepatitis-positive and/or steatohepatitis-negative reference levels of the one or more additional biomarkers in order to diagnose whether the subject has, or is predisposed to, steatohepatitis. - The method of claim 2, wherein the method is a method of diagnosing whether a subject has steatohepatitis and wherein the one or more additional biomarkers are selected from those biomarkers in Tables 1, 3, 4B, 6B, 9, 10, 11, 12, 13, and/or Figure 2 and/or 3 having p values of less than 0.05 and/or those biomarkers in Tables 1, 3, 4B, 6B, 9, 10, 11, 12, 13, and/or Figure 2 and/or 3 having q values of less than 0.10.
- The method of claim 2, wherein the method is a method of diagnosing whether a subject has steatohepatitis and wherein the sample analyzed is from a male subject and the biomarkers are selected from Table 12.
- The method of claim 2, wherein the method is a method of diagnosing whether a subject has steatohepatitis and wherein the sample analyzed is from a female subject and the biomarkers are selected from Table 13.
- The method of any one of the preceding claims, wherein the method is a method of diagnosing whether a subject has steatohepatitis and wherein the sample is analyzed using one or more techniques selected from the group consisting of mass spectrometry, enzymatic or biochemical reactions, clinical chemistry, ELISA, and antibody linkage.
- A method according to claim 2, wherein the method is a method of determining whether a subject is predisposed to developing steatohepatitis and
the level(s) of glycocholate and the one or more additional biomarkers in the sample are compared to steatohepatitis-positive and/or steatohepatitis-negative reference levels of glycocholate and the one or more additional biomarkers in order to determine whether the subject is predisposed to developing steatohepatitis. - A method of monitoring progression/regression of steatohepatitis in a subject comprising:analyzing a first biological sample from a subject to determine the level(s) of glycocholate and optionally one or more additional biomarkers for steatohepatitis in the sample, wherein the one or more biomarkers are selected from Tables 1, 3, 4B, 6B, 9, 10, 11, 12, 13, and/or Figure 2 and/or 3 and the first sample is obtained from the subject at a first time point;analyzing a second biological sample from a subject to determine the level(s) of glycocholate and optionally the one or more additional biomarkers, wherein the second sample is obtained from the subject at a second time point; andcomparing the level(s) of glycocholate and optionally the one or more additional biomarkers in the first sample to the level(s) of glycocholate and optionally the one or more additional biomarkers in the second sample in order to monitor the progression/regression of steatohepatitis in the subject.
- A method of assessing the efficacy of a composition for treating steatohepatitis comprising:analyzing, from a subject having steatohepatitis and currently or previously being treated with a composition, a biological sample to determine the level(s) of glycocholate and optionally one or more additional biomarkers for steatohepatitis selected from Tables 1, 3, 4B, 6B, 9, 10, 11, 12, 13, and/or Figure 2 and/or 3; andcomparing the level(s) of glycocholate and optionally the one or more additional biomarkers in the sample to (a) levels of glycocholate and optionally the one or more additional biomarkers in a previously-taken biological sample from the subject, wherein the previously-taken biological sample was obtained from the subject before being treated with the composition, (b) steatohepatitis-positive reference levels of glycocholate and optionally the one or more additional biomarkers, and/or (c) steatohepatitis-negative reference levels of glycocholate and optionally the one or more additional biomarkers.
- A method for assessing the efficacy of a composition in treating steatohepatitis, comprising:analyzing a first biological sample from a subject to determine the level(s) of glycocholate and optionally one or more additional biomarkers for steatohepatitis selected from Tables 1, 3, 4B, 6B, 9, 10, 11, 12, 13, and/or Figure 2 and/or 3, the first sample obtained from the subject at a first time point;analyzing a second biological sample from the subject administered with the composition to determine the level(s) of glycocholate and optionally the one or more additional biomarkers, the second sample obtained from the subject at a second time point after administration of the composition;comparing the level(s) of glycocholate and optionally the one or more additional biomarkers in the first sample to the level(s) of glycocholate and optionally the one or more additional biomarkers in the second sample in order to assess the efficacy of the composition for treating steatohepatitis.
- A method for screening a composition for activity in modulating glycocholate and optionally one or more additional biomarkers of steatohepatitis, comprising:contacting one or more cells with a composition;analyzing at least a portion of the one or more cells or a biological sample associated with the cells to determine the level(s) of glycocholate and optionally one or more additional biomarkers of steatohepatitis selected from Tables 1, 3, 4B, 6B, 9, 10, 11, 12, 13, and/or Figure 2 and/or 3; andcomparing the level(s) of glycocholate and optionally the one or more additional biomarkers with predetermined standard levels for glycocholate and optionally the one or more additional biomarkers to determine whether the composition modulated the level(s) of glycocholate and optionally the one or more additional biomarkers.
- In vitro use of a biomarker, or plurality of biomarkers, in the diagnosis of steatohepatitis, wherein said biomarker or plurality of biomarkers comprises glycocholate and optionally one or more additional biomarkers selected from Tables 1, 3, 4B, 6B, 9, 10, 11, 12, 13, and/or Figure 2 and/or 3.
- A method of distinguishing nonalcoholic fatty liver disease (NAFLD) from nonalcoholic steatohepatitis (NASH) in a subject having liver disease or disorder, comprising:analyzing a biological sample from a subject to determine the level(s) of glycocholate and optionally one or more additional biomarkers for NAFLD and/or NASH in the sample, wherein the one or more biomarkers are selected from Tables 1, 2, 3, 4B, 5B, 6B, 8, 9, 10, 11, 12, 13, and Figures 1, 2, 3comparing the level(s) of glycocholate and optionally the one or more additional biomarkers in the sample to NAFLD-positive reference levels that distinguish over NASH and/or to NASH-positive reference levels that distinguish over NAFLD in order to determine whether the subject has NASH.
- The method of claim 1, further comprising analyzing the biological sample from the subject to determine level(s) of one or more additional biomarkers for steatohepatitis in the sample, wherein the one or more additional biomarkers are selected from the group consisting of glycochenodeoxycholate, taurocholate, butyryl carnitine, gamma glutamyltyrosine, kynurenine, glutamyl valine, gamma glutamylphenylalanine, gamma glutamylleucine, glutamate, carnitine, propionylcamitine, and combinations thereof, and
comparing the level(s) of the one or more additional biomarkers in the sample to steatohepatitis-positive and/or steatohepatitis-negative reference levels of the one or more additional biomarkers in order to diagnose whether the subject has, or is predisposed to, steatohepatitis. - The method of claim 14, wherein the biological sample is analyzed using one or more techniques selected from the group consisting of mass spectrometry, enzymatic or biochemical reactions, clinical chemistry, ELISA, and antibody linkage.
- The method of claim 15, wherein the biological sample is a plasma sample or a urine sample.
- The method of claim 14, wherein the one or more additional biomarkers are selected from the group consisting of glycochenodeoxycholate, taurocholate, and combinations thereof.
Priority Applications (2)
| Application Number | Priority Date | Filing Date | Title |
|---|---|---|---|
| EP15155591.9A EP2930512B1 (en) | 2007-11-02 | 2008-10-31 | Biomarkers for fatty liver disease and methods using the same |
| EP12188223.7A EP2546649B1 (en) | 2007-11-02 | 2008-10-31 | Biomarkers for fatty liver disease and methods using the same |
Applications Claiming Priority (3)
| Application Number | Priority Date | Filing Date | Title |
|---|---|---|---|
| US98494207P | 2007-11-02 | 2007-11-02 | |
| US4245908P | 2008-04-04 | 2008-04-04 | |
| PCT/US2008/082013 WO2009059150A2 (en) | 2007-11-02 | 2008-10-31 | Biomarkers for fatty liver disease and methods using the same |
Related Child Applications (3)
| Application Number | Title | Priority Date | Filing Date |
|---|---|---|---|
| EP15155591.9A Division EP2930512B1 (en) | 2007-11-02 | 2008-10-31 | Biomarkers for fatty liver disease and methods using the same |
| EP12188223.7A Division EP2546649B1 (en) | 2007-11-02 | 2008-10-31 | Biomarkers for fatty liver disease and methods using the same |
| EP12188223.7 Division-Into | 2012-10-11 |
Publications (3)
| Publication Number | Publication Date |
|---|---|
| EP2227689A2 EP2227689A2 (en) | 2010-09-15 |
| EP2227689A4 EP2227689A4 (en) | 2011-03-30 |
| EP2227689B1 true EP2227689B1 (en) | 2012-12-26 |
Family
ID=40591773
Family Applications (3)
| Application Number | Title | Priority Date | Filing Date |
|---|---|---|---|
| EP12188223.7A Active EP2546649B1 (en) | 2007-11-02 | 2008-10-31 | Biomarkers for fatty liver disease and methods using the same |
| EP08845659A Active EP2227689B1 (en) | 2007-11-02 | 2008-10-31 | Biomarkers for fatty liver disease and methods using the same |
| EP15155591.9A Active EP2930512B1 (en) | 2007-11-02 | 2008-10-31 | Biomarkers for fatty liver disease and methods using the same |
Family Applications Before (1)
| Application Number | Title | Priority Date | Filing Date |
|---|---|---|---|
| EP12188223.7A Active EP2546649B1 (en) | 2007-11-02 | 2008-10-31 | Biomarkers for fatty liver disease and methods using the same |
Family Applications After (1)
| Application Number | Title | Priority Date | Filing Date |
|---|---|---|---|
| EP15155591.9A Active EP2930512B1 (en) | 2007-11-02 | 2008-10-31 | Biomarkers for fatty liver disease and methods using the same |
Country Status (6)
| Country | Link |
|---|---|
| US (3) | US20100279956A1 (en) |
| EP (3) | EP2546649B1 (en) |
| JP (1) | JP5270684B2 (en) |
| ES (1) | ES2402142T3 (en) |
| HK (1) | HK1216189A1 (en) |
| WO (1) | WO2009059150A2 (en) |
Families Citing this family (24)
| Publication number | Priority date | Publication date | Assignee | Title |
|---|---|---|---|---|
| EP2172775A4 (en) * | 2007-06-25 | 2010-12-01 | Ajinomoto Kk | Method of evaluating visceral fat accumulation |
| EP2546649B1 (en) * | 2007-11-02 | 2015-02-25 | Metabolon Inc. | Biomarkers for fatty liver disease and methods using the same |
| BRPI0912110A2 (en) | 2008-05-28 | 2015-10-06 | Basf Se | methods for diagnosing liver toxicity, for determining whether a compound is capable of inducing liver toxicity in an individual, and for identifying a substance for treating liver toxicity. |
| CN102105793A (en) * | 2008-05-28 | 2011-06-22 | 巴斯夫欧洲公司 | Means and methods for assessing liver enzyme induction |
| US20110256561A1 (en) * | 2008-12-24 | 2011-10-20 | The University Of Tokyo | Liver disease marker, method and apparatus for measuring the same, and method for assaying pharmaceutical preparation |
| EP3318644B1 (en) * | 2009-09-11 | 2021-02-24 | The Chinese University of Hong Kong | Methods for monitoring liver pathologies |
| JP2011232164A (en) * | 2010-04-27 | 2011-11-17 | Keio Gijuku | Liver disease marker, method and device for measuring the same, and method for verifying medicine |
| AU2011273748A1 (en) | 2010-06-10 | 2012-12-06 | Universitaetsklinikum Schleswig-Holstein | Methods to diagnose liver diseases |
| KR101867808B1 (en) * | 2010-06-18 | 2018-06-18 | 각고호우징 게이오기주크 | Liver disease marker, method and apparatus for measuring same, and test method for pharmaceutical preparation |
| US8728824B2 (en) * | 2011-06-22 | 2014-05-20 | Quest Diagnostics Investments Inc. | Mass spectrometric determination of fatty acids |
| JP6260275B2 (en) * | 2011-06-30 | 2018-01-17 | 味の素株式会社 | Fatty liver evaluation method, fatty liver evaluation device, fatty liver evaluation method, fatty liver evaluation program, fatty liver evaluation system, and terminal device |
| IN2015DN02868A (en) * | 2012-09-21 | 2015-09-11 | Univ Toronto | |
| CN107076753B (en) * | 2014-09-30 | 2019-01-18 | 深圳华大基因科技有限公司 | Specific biomarker composition for obese people and application thereof |
| EP3221463A4 (en) * | 2014-11-19 | 2018-07-25 | Metabolon, Inc. | Biomarkers for fatty liver disease and methods using the same |
| RU2617236C1 (en) * | 2015-12-02 | 2017-04-24 | государственное бюджетное образовательное учреждение высшего профессионального образования "Северо-Западный государственный медицинский университет им. И.И. Мечникова" Министерства здравоохранения Российской Федерации | Method for determination of feasibility of immunological study in patients with nonalcoholic fatty liver disease |
| EP3465218A4 (en) * | 2016-05-29 | 2020-06-17 | Human Metabolomics Institute, Inc. | Liver disease-related biomarkers and methods of use thereof |
| EP3502703A1 (en) | 2017-12-22 | 2019-06-26 | Metanomics Health GmbH | Method for the assessment of nafld |
| CN109060977A (en) * | 2018-07-13 | 2018-12-21 | 深圳市绘云生物科技有限公司 | Biomarker and kit and application method for liver fibrosis and liver cirrhosis diagnosis |
| US11693005B2 (en) | 2018-08-07 | 2023-07-04 | Florida Atlantic University Board Of Trustees | Methods for identifying treatments that reduce the actions of substances of abuse and addiction |
| JP6998023B2 (en) * | 2018-09-26 | 2022-02-10 | 株式会社島津製作所 | Non-alcoholic fatty liver disease detection method, non-alcoholic fatty liver disease detection kit and non-alcoholic fatty liver disease detection biomarker |
| WO2020154567A1 (en) * | 2019-01-25 | 2020-07-30 | Viscient Biosciences, Inc. | Compositions and methods for the diagnosis and treatment of diseases of the liver |
| WO2021226042A1 (en) * | 2020-05-04 | 2021-11-11 | University Of Florida Research Foundation, Incorporated | Biomarkers for assessing liver disease |
| US11754536B2 (en) | 2021-11-01 | 2023-09-12 | Matterworks Inc | Methods and compositions for analyte quantification |
| CN116165385B (en) * | 2023-04-25 | 2023-07-18 | 南方医科大学南方医院 | Serum metabolic marker for liver cancer diagnosis and screening method and application thereof |
Citations (2)
| Publication number | Priority date | Publication date | Assignee | Title |
|---|---|---|---|---|
| EP1739431A1 (en) * | 2004-04-23 | 2007-01-03 | Ajinomoto Co., Inc. | Method of judging non-alcoholic steatohepatitis |
| WO2007116975A1 (en) * | 2006-04-06 | 2007-10-18 | Eisai R & D Management Co., Ltd. | METHOD FOR NON-INVASIVE EXAMINATION OF NON-ALCOHOLIC STEATOHEPATITIS BY QUANTIFICATION OF CYTOCHROME-c, AND TEST KIT |
Family Cites Families (25)
| Publication number | Priority date | Publication date | Assignee | Title |
|---|---|---|---|---|
| JPS61260896A (en) * | 1985-05-15 | 1986-11-19 | Sekisui Chem Co Ltd | Method for analyzing bile acid |
| WO1996037777A1 (en) * | 1995-05-23 | 1996-11-28 | Nelson Randall W | Mass spectrometric immunoassay |
| US7329489B2 (en) | 2000-04-14 | 2008-02-12 | Matabolon, Inc. | Methods for drug discovery, disease treatment, and diagnosis using metabolomics |
| EP2330219A3 (en) | 2000-04-14 | 2011-11-23 | Metabolon, Inc. | Method for drug discovery, disease treatment and diagnosis using metabolomics |
| US20040234977A1 (en) * | 2001-05-14 | 2004-11-25 | Da-Wei Gong | Novel alanine transaminase enzyme and methods of use |
| JP2003139753A (en) * | 2001-11-02 | 2003-05-14 | Mitsubishi Pharma Corp | Method for simultaneous analysis for 18 components in bile acid |
| ES2226549B1 (en) * | 2002-12-18 | 2006-07-16 | One Way Liver Genomics, S.L. | METHOD FOR THE DIAGNOSIS OF NON-ALCOHOLIC ESTEATOHEPATITIS (NASH) THROUGH THE USE OF MOLECULAR MARKERS. |
| US20040121305A1 (en) * | 2002-12-18 | 2004-06-24 | Wiegand Roger Charles | Generation of efficacy, toxicity and disease signatures and methods of use thereof |
| US7452678B2 (en) * | 2003-06-24 | 2008-11-18 | Bristol-Myers Squibb Company | Identification of biomarkers for liver toxicity |
| KR20060109926A (en) * | 2003-11-19 | 2006-10-23 | 메타베이시스 테라퓨틱스, 인크. | Novel phosphorus-containing thyromimetics |
| US7078064B2 (en) * | 2003-12-03 | 2006-07-18 | George Zabrecky | Compositions and methods useful for treating and preventing chronic liver disease, chronic HCV infection and non-alcoholic steatohepatitis |
| EP1619257A1 (en) * | 2004-07-23 | 2006-01-25 | One Way Liver Genomics, S.L. | Method for the in vitro diagnosis of non-alcoholic steatohepatitis |
| US20060160237A1 (en) * | 2004-12-06 | 2006-07-20 | Applera Corporation | Method of screening urine for organic acids |
| US7860656B2 (en) * | 2005-02-03 | 2010-12-28 | Assistance Publique-Hopitaux De Paris (Ap-Hp) | Diagnosis method of hepatic steatosis using biochemical markers |
| US20070004045A1 (en) * | 2005-06-07 | 2007-01-04 | Xia Xu | Analysis of large numbers of estrogens and other steroids and applications thereof |
| US7972785B2 (en) * | 2006-01-24 | 2011-07-05 | Industrial Technology Research Institute (Itri) | Biomarkers for liver fibrotic injury |
| EP2003453B1 (en) * | 2006-03-29 | 2012-12-26 | Yamasa Corporation | Method for detection, determination or prediction of hepatic disorder |
| WO2007136674A1 (en) | 2006-05-19 | 2007-11-29 | The Cleveland Clinic Foundation | Detection and monitoring of liver damage |
| CN101523221A (en) * | 2006-08-08 | 2009-09-02 | 利普米克斯科技公司 | Markers of non-alcoholic fatty liver disease (NAFLD) and non-alcoholic steatohepatitis (NASH) and methods of use thereof |
| US20090075284A1 (en) * | 2006-09-19 | 2009-03-19 | The Regents Of The University Of Michigan | Metabolomic profiling of prostate cancer |
| EP2133692B1 (en) * | 2006-11-06 | 2013-10-09 | Yokohama City University | Diagnosis method for fatty liver disease, diagnosis apparatus, diagnosis program, diagnostic agent, and method for screening for therapeutic agent for fatty liver disease |
| WO2008156662A1 (en) * | 2007-06-14 | 2008-12-24 | George Mason Intellectual Properties, Inc. | Methods of diagnosing non-alcoholic steatohepatitis (nash) |
| AU2008279778B2 (en) * | 2007-07-17 | 2014-09-18 | Metabolon, Inc. | Method for Determining Insulin Sensitivity with Biomarkers |
| EP2546649B1 (en) * | 2007-11-02 | 2015-02-25 | Metabolon Inc. | Biomarkers for fatty liver disease and methods using the same |
| WO2010045180A1 (en) * | 2008-10-13 | 2010-04-22 | Metabolon, Inc. | Biomarkers for inflammatory bowel disease and methods using the same |
-
2008
- 2008-10-31 EP EP12188223.7A patent/EP2546649B1/en active Active
- 2008-10-31 ES ES08845659T patent/ES2402142T3/en active Active
- 2008-10-31 EP EP08845659A patent/EP2227689B1/en active Active
- 2008-10-31 EP EP15155591.9A patent/EP2930512B1/en active Active
- 2008-10-31 WO PCT/US2008/082013 patent/WO2009059150A2/en active Application Filing
- 2008-10-31 JP JP2010532284A patent/JP5270684B2/en active Active
-
2010
- 2010-04-30 US US12/771,729 patent/US20100279956A1/en not_active Abandoned
-
2015
- 2015-09-02 US US14/843,356 patent/US9977034B2/en active Active
-
2016
- 2016-04-08 HK HK16104033.3A patent/HK1216189A1/en unknown
-
2018
- 2018-04-18 US US15/955,883 patent/US20190120855A1/en not_active Abandoned
Patent Citations (2)
| Publication number | Priority date | Publication date | Assignee | Title |
|---|---|---|---|---|
| EP1739431A1 (en) * | 2004-04-23 | 2007-01-03 | Ajinomoto Co., Inc. | Method of judging non-alcoholic steatohepatitis |
| WO2007116975A1 (en) * | 2006-04-06 | 2007-10-18 | Eisai R & D Management Co., Ltd. | METHOD FOR NON-INVASIVE EXAMINATION OF NON-ALCOHOLIC STEATOHEPATITIS BY QUANTIFICATION OF CYTOCHROME-c, AND TEST KIT |
Also Published As
| Publication number | Publication date |
|---|---|
| EP2227689A4 (en) | 2011-03-30 |
| US20190120855A1 (en) | 2019-04-25 |
| US20100279956A1 (en) | 2010-11-04 |
| JP5270684B2 (en) | 2013-08-21 |
| EP2227689A2 (en) | 2010-09-15 |
| EP2930512A3 (en) | 2015-12-02 |
| EP2546649A3 (en) | 2013-03-27 |
| EP2546649B1 (en) | 2015-02-25 |
| EP2930512B1 (en) | 2018-01-31 |
| WO2009059150A2 (en) | 2009-05-07 |
| US20150377910A1 (en) | 2015-12-31 |
| HK1216189A1 (en) | 2016-10-21 |
| WO2009059150A3 (en) | 2009-06-18 |
| EP2546649A2 (en) | 2013-01-16 |
| ES2402142T3 (en) | 2013-04-29 |
| US9977034B2 (en) | 2018-05-22 |
| JP2011503547A (en) | 2011-01-27 |
| EP2930512A2 (en) | 2015-10-14 |
Similar Documents
| Publication | Publication Date | Title |
|---|---|---|
| EP2227689B1 (en) | Biomarkers for fatty liver disease and methods using the same | |
| US10175233B2 (en) | Biomarkers for cardiovascular diseases and methods using the same | |
| US8679457B2 (en) | Metabolite biomarkers to distinguish Crohn's disease from ulcerative colitis and methods using the same | |
| EP2951313B1 (en) | Biomarkers related to insulin resistance progression and methods using the same | |
| EP2428587A2 (en) | Biomarkers related to metabolic age and methods using the same | |
| WO2007100782A2 (en) | Biomarkers for amyotrophic lateral sclerosis and methods using the same | |
| US8394354B2 (en) | Biomarkers for depression and methods using the same | |
| JP2014532168A (en) | Biomarkers associated with insulin resistance and methods of using the same | |
| WO2019097089A1 (en) | Methods for prediction and early detection of diabetes | |
| US11204357B2 (en) | Method for the diagnosis of Farber's disease | |
| US20090318369A1 (en) | Biomarkers for alzheimer's disease and methods using the same | |
| KR102520048B1 (en) | Biomarkers for predicting therapeutic response of rheumatoid arthritis | |
| AU2016206265B2 (en) | Method for Determining Insulin Sensitivity with Biomarkers | |
| AU2014216035B2 (en) | Method for Determining Insulin Sensitivity with Biomarkers | |
| WO2024030680A1 (en) | Metabolic vulnerability analyzed by nmr | |
| CN114324902A (en) | Biomarkers of cholesterol homeostasis and uses thereof |
Legal Events
| Date | Code | Title | Description |
|---|---|---|---|
| PUAI | Public reference made under article 153(3) epc to a published international application that has entered the european phase |
Free format text: ORIGINAL CODE: 0009012 |
|
| 17P | Request for examination filed |
Effective date: 20100528 |
|
| AK | Designated contracting states |
Kind code of ref document: A2 Designated state(s): AT BE BG CH CY CZ DE DK EE ES FI FR GB GR HR HU IE IS IT LI LT LU LV MC MT NL NO PL PT RO SE SI SK TR |
|
| AX | Request for extension of the european patent |
Extension state: AL BA MK RS |
|
| RIN1 | Information on inventor provided before grant (corrected) |
Inventor name: HU, YUNFU Inventor name: KALHAN, SATISH, C. Inventor name: BERGER, ALVIN Inventor name: MCCREEDY, BRUCE, J., JR. |
|
| A4 | Supplementary search report drawn up and despatched |
Effective date: 20110301 |
|
| 17Q | First examination report despatched |
Effective date: 20111014 |
|
| REG | Reference to a national code |
Ref country code: DE Ref legal event code: R079 Ref document number: 602008021215 Country of ref document: DE Free format text: PREVIOUS MAIN CLASS: G01N0033480000 Ipc: G01N0033680000 |
|
| RIC1 | Information provided on ipc code assigned before grant |
Ipc: G01N 33/48 20060101ALI20120301BHEP Ipc: G01N 33/68 20060101AFI20120301BHEP |
|
| GRAP | Despatch of communication of intention to grant a patent |
Free format text: ORIGINAL CODE: EPIDOSNIGR1 |
|
| DAX | Request for extension of the european patent (deleted) | ||
| GRAS | Grant fee paid |
Free format text: ORIGINAL CODE: EPIDOSNIGR3 |
|
| GRAA | (expected) grant |
Free format text: ORIGINAL CODE: 0009210 |
|
| RAP1 | Party data changed (applicant data changed or rights of an application transferred) |
Owner name: THE CLEVELAND CLINIC FOUNDATION Owner name: METABOLON, INC. |
|
| AK | Designated contracting states |
Kind code of ref document: B1 Designated state(s): AT BE BG CH CY CZ DE DK EE ES FI FR GB GR HR HU IE IS IT LI LT LU LV MC MT NL NO PL PT RO SE SI SK TR |
|
| REG | Reference to a national code |
Ref country code: GB Ref legal event code: FG4D |
|
| REG | Reference to a national code |
Ref country code: CH Ref legal event code: EP |
|
| REG | Reference to a national code |
Ref country code: AT Ref legal event code: REF Ref document number: 590744 Country of ref document: AT Kind code of ref document: T Effective date: 20130115 |
|
| REG | Reference to a national code |
Ref country code: DE Ref legal event code: R096 Ref document number: 602008021215 Country of ref document: DE Effective date: 20130228 |
|
| REG | Reference to a national code |
Ref country code: CH Ref legal event code: NV Representative=s name: MURGITROYD AND COMPANY, CH |
|
| REG | Reference to a national code |
Ref country code: ES Ref legal event code: FG2A Ref document number: 2402142 Country of ref document: ES Kind code of ref document: T3 Effective date: 20130429 |
|
| PG25 | Lapsed in a contracting state [announced via postgrant information from national office to epo] |
Ref country code: NO Free format text: LAPSE BECAUSE OF FAILURE TO SUBMIT A TRANSLATION OF THE DESCRIPTION OR TO PAY THE FEE WITHIN THE PRESCRIBED TIME-LIMIT Effective date: 20130326 Ref country code: HR Free format text: LAPSE BECAUSE OF FAILURE TO SUBMIT A TRANSLATION OF THE DESCRIPTION OR TO PAY THE FEE WITHIN THE PRESCRIBED TIME-LIMIT Effective date: 20121226 Ref country code: LT Free format text: LAPSE BECAUSE OF FAILURE TO SUBMIT A TRANSLATION OF THE DESCRIPTION OR TO PAY THE FEE WITHIN THE PRESCRIBED TIME-LIMIT Effective date: 20121226 Ref country code: SE Free format text: LAPSE BECAUSE OF FAILURE TO SUBMIT A TRANSLATION OF THE DESCRIPTION OR TO PAY THE FEE WITHIN THE PRESCRIBED TIME-LIMIT Effective date: 20121226 Ref country code: FI Free format text: LAPSE BECAUSE OF FAILURE TO SUBMIT A TRANSLATION OF THE DESCRIPTION OR TO PAY THE FEE WITHIN THE PRESCRIBED TIME-LIMIT Effective date: 20121226 |
|
| REG | Reference to a national code |
Ref country code: AT Ref legal event code: MK05 Ref document number: 590744 Country of ref document: AT Kind code of ref document: T Effective date: 20121226 |
|
| REG | Reference to a national code |
Ref country code: LT Ref legal event code: MG4D |
|
| REG | Reference to a national code |
Ref country code: NL Ref legal event code: VDEP Effective date: 20121226 |
|
| PG25 | Lapsed in a contracting state [announced via postgrant information from national office to epo] |
Ref country code: LV Free format text: LAPSE BECAUSE OF FAILURE TO SUBMIT A TRANSLATION OF THE DESCRIPTION OR TO PAY THE FEE WITHIN THE PRESCRIBED TIME-LIMIT Effective date: 20121226 Ref country code: SI Free format text: LAPSE BECAUSE OF FAILURE TO SUBMIT A TRANSLATION OF THE DESCRIPTION OR TO PAY THE FEE WITHIN THE PRESCRIBED TIME-LIMIT Effective date: 20121226 Ref country code: GR Free format text: LAPSE BECAUSE OF FAILURE TO SUBMIT A TRANSLATION OF THE DESCRIPTION OR TO PAY THE FEE WITHIN THE PRESCRIBED TIME-LIMIT Effective date: 20130327 |
|
| PG25 | Lapsed in a contracting state [announced via postgrant information from national office to epo] |
Ref country code: AT Free format text: LAPSE BECAUSE OF FAILURE TO SUBMIT A TRANSLATION OF THE DESCRIPTION OR TO PAY THE FEE WITHIN THE PRESCRIBED TIME-LIMIT Effective date: 20121226 Ref country code: BG Free format text: LAPSE BECAUSE OF FAILURE TO SUBMIT A TRANSLATION OF THE DESCRIPTION OR TO PAY THE FEE WITHIN THE PRESCRIBED TIME-LIMIT Effective date: 20130326 Ref country code: CZ Free format text: LAPSE BECAUSE OF FAILURE TO SUBMIT A TRANSLATION OF THE DESCRIPTION OR TO PAY THE FEE WITHIN THE PRESCRIBED TIME-LIMIT Effective date: 20121226 Ref country code: SK Free format text: LAPSE BECAUSE OF FAILURE TO SUBMIT A TRANSLATION OF THE DESCRIPTION OR TO PAY THE FEE WITHIN THE PRESCRIBED TIME-LIMIT Effective date: 20121226 Ref country code: BE Free format text: LAPSE BECAUSE OF FAILURE TO SUBMIT A TRANSLATION OF THE DESCRIPTION OR TO PAY THE FEE WITHIN THE PRESCRIBED TIME-LIMIT Effective date: 20121226 Ref country code: IS Free format text: LAPSE BECAUSE OF FAILURE TO SUBMIT A TRANSLATION OF THE DESCRIPTION OR TO PAY THE FEE WITHIN THE PRESCRIBED TIME-LIMIT Effective date: 20130426 Ref country code: EE Free format text: LAPSE BECAUSE OF FAILURE TO SUBMIT A TRANSLATION OF THE DESCRIPTION OR TO PAY THE FEE WITHIN THE PRESCRIBED TIME-LIMIT Effective date: 20121226 |
|
| PG25 | Lapsed in a contracting state [announced via postgrant information from national office to epo] |
Ref country code: NL Free format text: LAPSE BECAUSE OF FAILURE TO SUBMIT A TRANSLATION OF THE DESCRIPTION OR TO PAY THE FEE WITHIN THE PRESCRIBED TIME-LIMIT Effective date: 20121226 Ref country code: PT Free format text: LAPSE BECAUSE OF FAILURE TO SUBMIT A TRANSLATION OF THE DESCRIPTION OR TO PAY THE FEE WITHIN THE PRESCRIBED TIME-LIMIT Effective date: 20130426 Ref country code: RO Free format text: LAPSE BECAUSE OF FAILURE TO SUBMIT A TRANSLATION OF THE DESCRIPTION OR TO PAY THE FEE WITHIN THE PRESCRIBED TIME-LIMIT Effective date: 20121226 Ref country code: PL Free format text: LAPSE BECAUSE OF FAILURE TO SUBMIT A TRANSLATION OF THE DESCRIPTION OR TO PAY THE FEE WITHIN THE PRESCRIBED TIME-LIMIT Effective date: 20121226 |
|
| PG25 | Lapsed in a contracting state [announced via postgrant information from national office to epo] |
Ref country code: DK Free format text: LAPSE BECAUSE OF FAILURE TO SUBMIT A TRANSLATION OF THE DESCRIPTION OR TO PAY THE FEE WITHIN THE PRESCRIBED TIME-LIMIT Effective date: 20121226 |
|
| PLBE | No opposition filed within time limit |
Free format text: ORIGINAL CODE: 0009261 |
|
| STAA | Information on the status of an ep patent application or granted ep patent |
Free format text: STATUS: NO OPPOSITION FILED WITHIN TIME LIMIT |
|
| PG25 | Lapsed in a contracting state [announced via postgrant information from national office to epo] |
Ref country code: CY Free format text: LAPSE BECAUSE OF FAILURE TO SUBMIT A TRANSLATION OF THE DESCRIPTION OR TO PAY THE FEE WITHIN THE PRESCRIBED TIME-LIMIT Effective date: 20121226 |
|
| 26N | No opposition filed |
Effective date: 20130927 |
|
| PG25 | Lapsed in a contracting state [announced via postgrant information from national office to epo] |
Ref country code: IT Free format text: LAPSE BECAUSE OF FAILURE TO SUBMIT A TRANSLATION OF THE DESCRIPTION OR TO PAY THE FEE WITHIN THE PRESCRIBED TIME-LIMIT Effective date: 20121226 |
|
| REG | Reference to a national code |
Ref country code: DE Ref legal event code: R097 Ref document number: 602008021215 Country of ref document: DE Effective date: 20130927 |
|
| PG25 | Lapsed in a contracting state [announced via postgrant information from national office to epo] |
Ref country code: MC Free format text: LAPSE BECAUSE OF FAILURE TO SUBMIT A TRANSLATION OF THE DESCRIPTION OR TO PAY THE FEE WITHIN THE PRESCRIBED TIME-LIMIT Effective date: 20121226 |
|
| PG25 | Lapsed in a contracting state [announced via postgrant information from national office to epo] |
Ref country code: TR Free format text: LAPSE BECAUSE OF FAILURE TO SUBMIT A TRANSLATION OF THE DESCRIPTION OR TO PAY THE FEE WITHIN THE PRESCRIBED TIME-LIMIT Effective date: 20121226 |
|
| PG25 | Lapsed in a contracting state [announced via postgrant information from national office to epo] |
Ref country code: HU Free format text: LAPSE BECAUSE OF FAILURE TO SUBMIT A TRANSLATION OF THE DESCRIPTION OR TO PAY THE FEE WITHIN THE PRESCRIBED TIME-LIMIT; INVALID AB INITIO Effective date: 20081031 Ref country code: LU Free format text: LAPSE BECAUSE OF NON-PAYMENT OF DUE FEES Effective date: 20131031 |
|
| PG25 | Lapsed in a contracting state [announced via postgrant information from national office to epo] |
Ref country code: MT Free format text: LAPSE BECAUSE OF FAILURE TO SUBMIT A TRANSLATION OF THE DESCRIPTION OR TO PAY THE FEE WITHIN THE PRESCRIBED TIME-LIMIT Effective date: 20121226 |
|
| REG | Reference to a national code |
Ref country code: FR Ref legal event code: PLFP Year of fee payment: 8 |
|
| REG | Reference to a national code |
Ref country code: FR Ref legal event code: PLFP Year of fee payment: 9 |
|
| REG | Reference to a national code |
Ref country code: FR Ref legal event code: PLFP Year of fee payment: 10 |
|
| REG | Reference to a national code |
Ref country code: FR Ref legal event code: PLFP Year of fee payment: 11 |
|
| P01 | Opt-out of the competence of the unified patent court (upc) registered |
Effective date: 20230523 |
|
| PGFP | Annual fee paid to national office [announced via postgrant information from national office to epo] |
Ref country code: GB Payment date: 20231019 Year of fee payment: 16 |
|
| PGFP | Annual fee paid to national office [announced via postgrant information from national office to epo] |
Ref country code: ES Payment date: 20231102 Year of fee payment: 16 |
|
| PGFP | Annual fee paid to national office [announced via postgrant information from national office to epo] |
Ref country code: IE Payment date: 20231027 Year of fee payment: 16 Ref country code: FR Payment date: 20231023 Year of fee payment: 16 Ref country code: DE Payment date: 20231018 Year of fee payment: 16 Ref country code: CH Payment date: 20231102 Year of fee payment: 16 |