EP2104073A2 - Verfahren und Vorrichtung zur Visualisierung von elektrischem Strom - Google Patents
Verfahren und Vorrichtung zur Visualisierung von elektrischem Strom Download PDFInfo
- Publication number
- EP2104073A2 EP2104073A2 EP09003475.2A EP09003475A EP2104073A2 EP 2104073 A2 EP2104073 A2 EP 2104073A2 EP 09003475 A EP09003475 A EP 09003475A EP 2104073 A2 EP2104073 A2 EP 2104073A2
- Authority
- EP
- European Patent Office
- Prior art keywords
- power
- intensity
- color saturation
- range
- hue
- Prior art date
- Legal status (The legal status is an assumption and is not a legal conclusion. Google has not performed a legal analysis and makes no representation as to the accuracy of the status listed.)
- Withdrawn
Links
Images


Classifications
-
- G—PHYSICS
- G06—COMPUTING; CALCULATING OR COUNTING
- G06T—IMAGE DATA PROCESSING OR GENERATION, IN GENERAL
- G06T11/00—2D [Two Dimensional] image generation
- G06T11/20—Drawing from basic elements, e.g. lines or circles
-
- G—PHYSICS
- G06—COMPUTING; CALCULATING OR COUNTING
- G06T—IMAGE DATA PROCESSING OR GENERATION, IN GENERAL
- G06T11/00—2D [Two Dimensional] image generation
- G06T11/001—Texturing; Colouring; Generation of texture or colour
Definitions
- Embodiments of the present disclosure relate generally to a method and apparatus for visualization of electrical power data.
- DGs distributed generators
- solar panels within the solar power system are comprised of photovoltaic (PV) modules that convert solar power received into a direct current (DC).
- An inverter then converts the DC current from the PV modules into an alternating current (AC).
- the power generated by the solar power system may then be used to run appliances at a home or business, or may be sold to the commercial power company.
- Variations in energy produced by the PV modules in a solar power system may be attributed to various causes such as variations in the inverters, PV module mismatch (i.e., variations in power output within the manufacturer's tolerance), PV module or inverter damage, or different insolation profiles for the PV modules.
- differences in insolation profiles may be due to a cause that cannot be altered or fixed, such as an immovable obstruction shading a PV module.
- differences in insolation profiles may be due to correctable causes, such as dust or dirt on the surface of a PV module.
- current monitoring systems do not provide sufficient granularity to remotely gather and analyze operation information per solar panel. Thus, an operator may only know whether the overall system is operating properly.
- Embodiments of the present invention generally relate to a method and apparatus for providing a visualization of power for display.
- the method establishes a power visualization scale based on a color saturation and intensity range for a hue and a range of power to be visualized, and generates a display image for at least one measured value of power as a level of color saturation and intensity for the hue based on the power visualization scale.
- Figure 1 is a block diagram of a system for providing electrical power visualization in accordance with one or more embodiments of the present invention
- FIG. 2 is a block diagram of a controller in accordance with one or more embodiments of the present invention.
- Figure 3 is a representation of a display for electrical power visualization in accordance with one or more embodiments of the present invention.
- Figure 4 is a representation of a power visualization scale in accordance with one or more embodiments of the present invention.
- Figure 5 is a representation of a power visualization scale in accordance with one or more embodiments of the present invention.
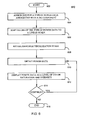
- Figure 6 is a flow diagram of a method for displaying a visualization of electrical power in accordance with one or more embodiments of the present invention.
- Figure 7 is a flow diagram of a method for displaying a visualization of electrical power production in accordance with one or more embodiments of the present invention.
- FIG. 1 is a block diagram of a system 100 for providing electrical power visualization in accordance with one or more embodiments of the present invention.
- the system 100 comprises a plurality of distributed generators (DGs) 102 1 , 102 2 , ... 102 n , (hereinafter, DGs 102), a plurality of controllers 104 1 , 104 2 , ..., 104 n . (hereinafter, controllers 104), a user 106, a master controller 108, and a communications network 110.
- the controllers 104, the user 106, and the master controller 108 are communicably coupled via the communications network 110, e.g., the Internet.
- the DGs 102 generate power from a renewable resource, such as solar energy, wind energy, hydroelectric energy, and the like.
- a DG 102 is comprised of a plurality of solar panels arranged in groups as solar arrays, where each solar panel is comprised one or more inverters coupled to one or more PV modules in a one-to-one correspondence.
- a DC-DC converter may be coupled between each PV module and each inverter (e.g., one converter per PV module).
- multiple PV modules may be coupled to a single inverter (i.e., a centralized inverter); in some such embodiments, a DC-DC converter may be coupled between the PV modules and the centralized inverter.
- the PV module generates a direct current (DC) relative to the amount of solar energy it receives.
- the inverter converts the DC current generated by the PV module to an alternating current (AC).
- the generated AC current may be used to operate appliances in a home or business, coupled to a commercial power grid and sold to the commercial power utility, or a combination of both.
- one or more of the DGs 102 may additionally or alternatively comprise a plurality of wind turbines, as in a "wind farm", for generating the DC current.
- Each DG 102 1 , 102 2 , ..., 102 n is coupled to a controller 104 1 , 104 2 , ..., 104 n , respectively, in a one-to-one correspondence.
- the controllers 104 collect data on the health and performance of the DGs 102, such as measurements of power generated by one of more components of the DG 102, power consumed from one of more components of the DG 102, and the like. Data may be collected at various levels of granularity; for example, for a DG 102 comprising a solar energy system, data may be collected for one or more individual PV modules, solar panels, and/or solar arrays, as well as for the entire solar energy system.
- the collected data is communicated from the controllers 104 to the master controller 108. Additionally, the controllers 104 and/or the master controller 108 may communicate operational instructions to the DGs 102 for purposes of operating the DGs 102 and their components.
- the user 106 may access a website 114 supported by the master controller 108 (or a server having access to the master controller 108 data) to obtain a data display based on the collected data, where the data display represents the operation of the DG 102 in a readily understandable format as described in detail with respect to Figure 3 . Additionally, a multitude of users may access one or more of such displays representing the DG 102 operation via a password protected portal.
- FIG. 2 is a block diagram of a controller 104 in accordance with one or more embodiments of the present invention.
- the controller 104 comprises a transceiver 202, at least one central processing unit (CPU) 204, support circuits 206, and a memory 208.
- the CPU 204 may comprise one or more conventionally available microprocessors. Alternatively, the CPU 204 may include one or more application specific integrated circuits (ASIC).
- the support circuits 206 are well known circuits used to promote functionality of the central processing unit. Such circuits include, but are not limited to, a cache, power supplies, clock circuits, buses, network cards, input/output (I/O) circuits, and the like.
- the memory 208 may comprise random access memory, read only memory, removable disk memory, flash memory, and various combinations of these types of memory.
- the memory 208 is sometimes referred to as main memory and may, in part, be used as cache memory or buffer memory.
- the memory 208 generally stores the operating system 214 of the controller 104.
- the operating system 214 may be one of a number of commercially available operating systems such as, but not limited to, SOLARIS from SUN Microsystems, Inc., AIX from IBM Inc., HP-UX from Hewlett Packard Corporation, LINUX from Red Hat Software, Windows 2000 from Microsoft Corporation, and the like.
- the memory 208 may store various forms of application software, such as data collection software 212 for collecting operational data (e.g., measurements of electrical power data) from the subtending DG 102.
- data collection software 212 for collecting operational data (e.g., measurements of electrical power data) from the subtending DG 102.
- the memory 208 may also store data 210 related to a subtending DG 102.
- data may be collected and stored at various levels of granularity; for example, for a DG 102 comprising a solar energy system, data may be collected and stored for one or more individual PV modules, solar panels, and/or solar arrays, as well as for the entire solar energy system
- the transceiver 202 couples the controller 104 to the DG 102 to facilitate command and control of the DG 102.
- the transceiver 202 may utilize wireless or wired techniques for such communication.
- the master controller 108 is a type of controller 104 that may contain additional elements, such as application software for managing a plurality of DGs 102, application software for managing the website 114, and/or application software pertaining to generating the data display representing the DG 102 operation.
- FIG. 3 is a representation of a display 300 for electrical power visualization in accordance with one or more embodiments of the present invention.
- the DG 102 is comprised of a plurality of solar panels arranged in one or more solar arrays, where each solar panel is comprised of one or more of inverters coupled to one or more PV modules in a one-to-one correspondence.
- the PV modules generate DC power that is subsequently converted to AC power by the inverters, where the power at the output of the inverters is relative to the level of solar energy the PV modules receive.
- the display 300 graphically comprises a plurality of display images 302 1,1 , 302 1,2 , ..., 302 n,m , collectively known as display images 302, where each display image 302 represents one of the solar panels in the DG 102 in a one-for-one correspondence.
- the display images 302 are arranged in accordance with the physical layout of the solar panels comprising the DG 102; additionally and/or alternatively, a tabular representation of the display images 302 may be provided.
- the corresponding display image 302 displays a visualization of associated electrical power data.
- a power visualization scale is established.
- the power visualization scale is based on a hue, saturation, and intensity (HSI) color description where a specific hue (e.g., blue) is assigned to represent a specific type of power to be visualized, such as an absolute power generated by the solar panels of the DG 102.
- HSUMI hue, saturation, and intensity
- blue or any other hue may be assigned to represent a different type of electrical power from any one of a myriad of types of electrical power pertaining to one or more components of the DG 102, such as relative power generated by the solar panels or PV modules.
- electrical power data related to consumption of power generated by the DG 102 may also be visualized.
- power consumption for one or more branch circuits of the DG 102 may be tracked on a sub-hourly basis and scaled by a time-of-use (TOU) rate schedule prior to being visualized.
- TOU time-of-use
- a visualization of power consumption cost such as this may help users optimize their power consumption against the TOU rate schedule to achieve the greatest financial benefit.
- the power visualization scale establishes a level of color saturation and intensity for the selected hue as a function of the absolute power generated at the output of a solar panel of the DG 102.
- a linear scale of the absolute power generated by a solar panel is established, for example ranging from 0 to 100, where 0 represents a minimum power value, such as no power output, and 100 represents a maximum power value, such as an absolute maximum power output (i.e., the nominal power output rating of the solar panel).
- a minimum and/or maximum power value of the electrical power data to be visualized may be obtained utilizing data collected from the DG 102. Additionally and/or alternatively, the minimum and/or maximum power value may be dynamically defined.
- the power visualization scale is then established by mapping color saturation and intensity to the linear scale.
- a linear interpolation of color saturation of the selected hue from 100% to 50% saturation is mapped to the range of values from 50 to 100 on the linear scale and a color saturation of 100% is mapped to values from 0 to 50 on the linear scale.
- a linear interpolation of intensity from 0% to 100% intensity is mapped to the range of values from 0 to 50 on the linear scale and an intensity level of 100% is mapped to values from 50 to 100 on the linear scale.
- the power visualization scale is established by mapping a linear interpolation of red/green/blue (RGB) components of a particular color to the linear scale of absolute power.
- RGB red/green/blue
- three colors (C 1 , C 2 , and C 3 ) of the same hue are selected, where C 1 is generally low-intensity and high-saturation, C 2 is high in both intensity and saturation, and C 3 is high-intensity but less saturated than C 2 .
- C 1 may be black, C 2 may be blue, and C 3 may be bluish-white.
- a linear interpolation of C 1 and C 2 is mapped to the values from 0 to 50 on the linear scale of absolute power, and a linear interpolation of C 2 and C 3 are mapped to the values from 50 to 100.
- C 1 may be selected as a color other than black, for example to reflect that a displayed value of "0" on the power visualization scale (i.e., a display of C 1 ) depicts a minimum-performance in terms of the corresponding type of electrical power rather than an absolute value of zero power.
- the values on the power visualization scale may be continuous (e.g., each distinct scaled value maps to a different color value) or quantized to obtain a small number (e.g., 128) of distinct values for display.
- the absolute power generated by each solar panel of the DG 102 may be obtained by the master controller 108 on a periodic basis and mapped to the power visualization scale for display; in some embodiments, individualized power visualization scales may be utilized for one or more of the solar panels based on their characteristics.
- the corresponding levels of color saturation and intensity are displayed in each of the display images 302 of the display 300, providing a visualization of the absolute power generated by each solar panel of the DG 102. As illustrated in Figure 3 , different levels of color saturation and intensity are depicted by different densities of cross-hatching.
- a numerical value of the absolute power generated by each solar panel of the DG 102 may be included in the corresponding display image 302, and/or a visual depiction of the power visualization scale may be included in the display 300, for example a display of the color saturation and intensity range from the minimum to the maximum power value.
- the periodicity of obtaining the absolute power generated by each solar panel of the DG 102 can be varied as needed.
- the absolute power data may be obtained on an hourly basis in order to observe variations in power generated per solar panel as the position of the sun changes throughout the day.
- data such as this obtained over successive time periods may also be displayed at a later time using time-lapse animation.
- Viewing the absolute power generated by each solar panel of the DG 102 over an extended time period as a time-lapse animation can help identify external shading obstacles. As shadows of the external shading objects move from west to east during the day, the associated changes in the absolute power generated by the affected solar panels of the DG 102 are clearly depicted in the time-lapse animation.
- power consumption data such as absolute or relative power consumption
- TOU Time-of-Use
- a visualization of power consumption in this manner may help users optimize their power consumption against the TOU rate schedule.
- Figure 4 is a representation of a power visualization scale 402 in accordance with one or more embodiments of the present invention.
- Values of a type of power 406 for a component of a DG are mapped to a linear scale 404.
- values of absolute power generated by a solar panel ranging from a minimum (e.g., 0) to a maximum (e.g., a manufacturer's nominal power output rating for the solar panel) are linearly mapped to a linear scale 404 ranging from 0 to 100, where the minimum and maximum values of absolute power generated correspond to values of 0 and 100, respectively.
- a level of color saturation 408 for a particular hue ranging from 50% to 100% is linearly mapped to values from 100 to 50 on the linear scale 404, where 50% color saturation corresponds to a value of 100 on the linear scale 404 and 100% color saturation corresponds to a value of 50 on the linear scale 404. Additionally, a color saturation of 100% for the hue is mapped to values from 50 to 0 on the linear scale 404.
- An intensity level 410 ranging from 0% to 100% is linearly mapped to values from 0 to 50 on the linear scale 404, where 0% intensity corresponds to a value of 0 on the linear scale 404 and 100% intensity corresponds to a value of 50 on the linear scale 404. Additionally, an intensity level of 100% is mapped to values from 50 to 100 on the linear scale 404.
- Figure 5 is a representation of a power visualization scale 502 in accordance with one or more embodiments of the present invention. Values of a type of power 406 for a component of a DG are mapped to a linear scale 404, as previously described.
- Colors C 1 , C 2 , and C 3 are mapped to values 0, 50, and 100, respectively, on the linear scale 404.
- C 1 is a color having low-intensity and high-saturation
- C 2 is high in both intensity and saturation
- C 3 is high-intensity but less saturated than C 2 .
- a linear interpolation of C 1 and C 2 506 i.e., a linear interpretation of C 1 and C 2 red/green/blue (RGB) components
- RGB red/green/blue
- a linear interpolation of C 2 and C 3 508 i.e., a linear interpretation of C 2 and C 3 red/green/blue (RGB) components
- FIG. 6 is a flow diagram of a method 600 for displaying a visualization of electrical power in accordance with one or more embodiments of the present invention.
- the method 600 begins at step 602 and proceeds to step 604, where a hue is assigned to represent a particular type of power associated with one or more components of a DG.
- a hue such as blue may be assigned to represent absolute or relative power generated by one or more solar panels or PV modules of the DG, or absolute or relative power consumption.
- a linear scale is established, such as the linear scale 404, and values of the type of power ranging from a minimum value to a maximum value are mapped (e.g., linearly mapped) to the linear scale.
- values of absolute power generated by a solar panel ranging from 0 to a maximum value e.g., a nominal power output rating for the solar panel
- values of relative power generated by a solar panel ranging from a minimum value to a maximum value may be linearly mapped to linear scale values from 0 to 100, respectively; in such an embodiment, the minimum and/or maximum values may be determined from analysis of actual data and in some cases may be dynamically determined.
- a maximum value of relative power production may be dynamically defined as the harvest of the best-producing solar panel of the DG during a particular interval.
- a power visualization scale is established.
- a level of color saturation ranging from 50% to 100% is linearly mapped to values from 100 to 50 on the linear scale, where 50% and 100% color saturation correspond to linear scale values of 100 and 50, respectively" and a color saturation of 100% is mapped to linear scale values from 50 to 0.
- an intensity level is mapped to the linear scale such that intensity levels ranging from 0% to 100% correspond to linear scare values from 0 to 50, respectively, and an intensity level of 100% corresponds to linear scale values from 50 to 100.
- the power visualization scale is established by mapping a linear interpolation of red/green/blue (RGB) components of a particular color to the linear scale.
- RGB red/green/blue
- the established power visualization scale provides a means for generating color saturation and intensity levels for a particular hue relative to the level of the type of power to be visualized.
- step 612 power data to be visualized, for example measurements of absolute power generated by each solar panel of the DG, is obtained.
- power data may be periodically obtained by a master controller communicably coupled to the DG.
- the power visualization scale is utilized to determine values of color saturation and intensity corresponding to the obtained power data and generate a display visualizing the obtained power data, such as the display 300. Additionally and/or alternatively, the resulting color saturation and intensity values may be applied to a tabular representation of the obtained power data presented to the user.
- the visualization of the obtained power data may be displayed in real time; in some embodiments, the visualization of power data over a period of time may be displayed in a time-lapse animation. Additionally and/or alternatively, the obtained power data may be scaled by a TOU rate prior to being displayed.
- the method 600 proceeds to step 614, where a determination is made whether to continue. If the result of such determination is yes, the method 600 returns to step 610 to obtain additional power data for display.
- the minimum and/or maximum power values utilized to generate the power visualization scale may be dynamically defined, requiring the range of power values from the minimum to the maximum to be re-mapped on the power visualization scale.
- step 614 If the result of the determination at step 614 is no, the method 600 proceeds to step 618 where it ends.
- FIG. 7 is a flow diagram of a method 700 for displaying a visualization of electrical power in accordance with one or more embodiments of the present invention.
- one or more DGs are each coupled to a controller in a one-to-one correspondence.
- a master controller is communicably coupled to the DGs via their respective controllers for facilitating command and control of the DGs and the visualization of corresponding electrical power.
- the method 700 begins at step 702 and proceeds to step 704.
- a user logs into (e.g., enters a user name and password) a website supported by the master controller, either locally or via a communications network, and selects one or more DGs of interest.
- each DG is comprised of a plurality of solar panels arranged in groups of solar arrays, each solar panel being comprised of one or more inverters coupled to one or more PV modules in a one-to-one correspondence.
- the user selects a type of electrical power and a granularity level that they would like displayed, for example an absolute power generated by each solar panel of the selected DGs.
- the electrical power to be displayed may be a relative power generated, an absolute power consumed, a relative power consumed, or a similar type of electrical power.
- the granularity level of data to be displayed may correspond to one or more individual components, a group of components, or a set of groups of components of one or more DGs.
- a power visualization scale is established as previously described, where color saturation and intensity values for a particular hue are established as a function of the desired electrical power to be displayed (i.e., absolute power generated by the solar panels of the DGs).
- the hue to be employed in the display may be pre-set or selected by the user as part of the method 700.
- Additional data to establish the power visualization scale such as a nominal power output rating of the solar panel or actual power output from one or more solar panels, may be obtained from the controllers, the master controller, and/or an alternative source.
- the power visualization scale may be dynamically defined; for example, a maximum power generated by a solar panel may be dynamically defined as the harvest from the best-performing solar panel in the DGs over a particular interval.
- the user selects a periodicity for the desired power data to be obtained and displayed.
- the periodicity may be pre-set.
- the method 700 then proceeds to step 712, where the controllers coupled to the selected DGs obtain the desired power data.
- the obtained electrical power data is mapped to the power visualization scale.
- the resulting levels of color saturation and intensity are displayed as display images, such as display images 302, providing a visualization of the desired power data.
- Such display images may be displayed as a two-dimensional grid corresponding to the layout of the selected DGs and/or as a tabular representation.
- the obtained electrical power data may be further scaled by a TOU rate prior to being displayed.
- the method 700 proceeds to step 716, where a determination is made whether to continue collecting the desired electrical power data for display. If the result of such determination is yes, the method 700 proceeds to step 718. At step 718, the method 700 waits the appropriate amount of time to begin the next cycle of electrical power data collection/display and then returns to step 712.
- the minimum and/or maximum power values utilized to generate the power visualization scale may be dynamically defined, requiring the range of power values from the minimum to the maximum to be re-mapped on the power visualization scale.
- the electrical power data collected over a period of time may be displayed in a time-lapse animation.
- step 716 the method 700 proceeds to step 720 where it ends.
- multiple users at one or more distinct locations may simultaneously perform the method 700 based on at least different types of power data, different granularities of power data, different hues, and/or different data displays (e.g., real-time display vs. time-lapse display).
- the users may remotely access the website to select their desired criteria, as described above, and remotely obtain the resulting displays of the desired power visualization.
Landscapes
- Physics & Mathematics (AREA)
- General Physics & Mathematics (AREA)
- Engineering & Computer Science (AREA)
- Theoretical Computer Science (AREA)
- Remote Monitoring And Control Of Power-Distribution Networks (AREA)
- Supply And Distribution Of Alternating Current (AREA)
- Testing, Inspecting, Measuring Of Stereoscopic Televisions And Televisions (AREA)
Applications Claiming Priority (1)
| Application Number | Priority Date | Filing Date | Title |
|---|---|---|---|
| US6892108P | 2008-03-11 | 2008-03-11 |
Publications (2)
| Publication Number | Publication Date |
|---|---|
| EP2104073A2 true EP2104073A2 (de) | 2009-09-23 |
| EP2104073A3 EP2104073A3 (de) | 2010-11-10 |
Family
ID=40792941
Family Applications (1)
| Application Number | Title | Priority Date | Filing Date |
|---|---|---|---|
| EP09003475A Withdrawn EP2104073A3 (de) | 2008-03-11 | 2009-03-10 | Verfahren und Vorrichtung zur Visualisierung von elektrischem Strom |
Country Status (2)
| Country | Link |
|---|---|
| US (3) | US8963923B2 (de) |
| EP (1) | EP2104073A3 (de) |
Cited By (3)
| Publication number | Priority date | Publication date | Assignee | Title |
|---|---|---|---|---|
| CN102118123A (zh) * | 2010-01-05 | 2011-07-06 | 通用电气公司 | 用于监测并且控制电力系统的方法和设备 |
| EP2355385A1 (de) * | 2010-02-03 | 2011-08-10 | Lg Electronics Inc. | Rundfunksignalempfänger mit Überwachungsfunktion eines Solarzellenmoduls |
| WO2022108784A1 (en) * | 2020-11-19 | 2022-05-27 | Enphase Energy, Inc. | Methods and apparatus for servicing distributed energy generation systems using an unmanned aerial vehicle |
Families Citing this family (8)
| Publication number | Priority date | Publication date | Assignee | Title |
|---|---|---|---|---|
| US8630293B2 (en) * | 2009-07-27 | 2014-01-14 | Acciona Solar Power | Solar power plant with scalable communications protocol |
| US8099197B2 (en) * | 2009-08-18 | 2012-01-17 | Enphase Energy, Inc. | Method and system for distributed energy generator message aggregation |
| US7913181B2 (en) * | 2009-10-26 | 2011-03-22 | General Electric Company | Method and apparatus for monitoring a power system |
| KR101801095B1 (ko) * | 2010-10-25 | 2017-11-24 | 삼성전자주식회사 | 전력 관리 장치, 그를 가지는 전력 관리 시스템 및 그 제어 방법 |
| US8780592B1 (en) | 2011-07-11 | 2014-07-15 | Chilicon Power, LLC | Systems and methods for increasing output current quality, output power, and reliability of grid-interactive inverters |
| WO2014117137A1 (en) * | 2013-01-28 | 2014-07-31 | Enphase Energy, Inc. | Method and apparatus for energy data visualization |
| TWI729611B (zh) * | 2019-12-06 | 2021-06-01 | 立端科技股份有限公司 | 電源時序的可視化系統 |
| US11500367B2 (en) * | 2020-09-23 | 2022-11-15 | Rockwell Automation Technologies, Inc. | Display for self-powered industrial automation component |
Citations (3)
| Publication number | Priority date | Publication date | Assignee | Title |
|---|---|---|---|---|
| US6892109B2 (en) | 1996-07-31 | 2005-05-10 | Canon Kabushiki Kaisha | Remote maintenance system |
| WO2006078685A2 (en) * | 2005-01-18 | 2006-07-27 | Presher Gordon E Jr | System and method for monitoring photovoltaic power generation systems |
| US20070176933A1 (en) | 2006-01-20 | 2007-08-02 | Newport Corporation | Self-centering zoom bar graph |
Family Cites Families (33)
| Publication number | Priority date | Publication date | Assignee | Title |
|---|---|---|---|---|
| JP2776120B2 (ja) * | 1992-03-10 | 1998-07-16 | 日本電気株式会社 | 集積回路の電源配線布設方法 |
| US6097399A (en) * | 1998-01-16 | 2000-08-01 | Honeywell Inc. | Display of visual data utilizing data aggregation |
| US6115493A (en) * | 1998-08-05 | 2000-09-05 | Xerox Corporation | Technique for fast computation of highlight color mappings |
| JP2000092718A (ja) * | 1998-09-09 | 2000-03-31 | Toshiba Corp | 分散型電源システム |
| US6515656B1 (en) * | 1999-04-14 | 2003-02-04 | Verizon Laboratories Inc. | Synchronized spatial-temporal browsing of images for assessment of content |
| US6587108B1 (en) * | 1999-07-01 | 2003-07-01 | Honeywell Inc. | Multivariable process matrix display and methods regarding same |
| US6754620B1 (en) * | 2000-03-29 | 2004-06-22 | Agilent Technologies, Inc. | System and method for rendering data indicative of the performance of a voice activity detector |
| US7333916B2 (en) * | 2003-04-04 | 2008-02-19 | Bp Corporation North America Inc. | Performance monitor for a photovoltaic supply |
| US20070141544A1 (en) * | 2003-11-28 | 2007-06-21 | Katsuaki Nakane | Apparatus for grading and evaluating compositional essays |
| US7262709B2 (en) * | 2004-04-26 | 2007-08-28 | Elster Electricity, Llc | System and method for efficient configuration in a fixed network automated meter reading system |
| JP3769286B2 (ja) * | 2004-09-09 | 2006-04-19 | コナミ株式会社 | 画像生成装置、荷重表示方法、ならびに、プログラム |
| US20060237058A1 (en) * | 2005-04-25 | 2006-10-26 | Mcclintock Ronald B | Direct current combiner box with power monitoring, ground fault detection and communications interface |
| US7720306B2 (en) * | 2005-08-29 | 2010-05-18 | Photomed Technologies, Inc. | Systems and methods for displaying changes in biological responses to therapy |
| WO2007041693A2 (en) * | 2005-10-04 | 2007-04-12 | Thompson Technology Industries, Inc. | System and method for array and string level monitoring of a grid-connected photovoltaic power system |
| US20070219932A1 (en) * | 2006-03-15 | 2007-09-20 | Carroll Scott T | Cooperative energy farms and virtual net metering |
| JP2007264890A (ja) * | 2006-03-28 | 2007-10-11 | Murata Mach Ltd | シミュレーションシステム |
| US8103389B2 (en) * | 2006-05-18 | 2012-01-24 | Gridpoint, Inc. | Modular energy control system |
| CN104300771B (zh) * | 2006-06-06 | 2018-10-30 | 威廉·亚历山大 | 通用功率变换器 |
| US7616153B2 (en) * | 2006-08-04 | 2009-11-10 | Seiko Epson Corporation | Electronic device and time adjustment method |
| US20080195561A1 (en) * | 2007-02-12 | 2008-08-14 | Michael Herzig | Systems and methods for providing renewable power systems by aggregate cost and usage |
| US7737979B2 (en) * | 2007-02-12 | 2010-06-15 | Microsoft Corporation | Animated transitions for data visualization |
| WO2008124185A1 (en) * | 2007-04-09 | 2008-10-16 | Live Data Systems, Inc. | System and method for monitoring and managing energy performance |
| DK2147585T3 (en) * | 2007-05-15 | 2017-01-16 | Schneider Electric It Corp | PROCEDURE AND SYSTEM FOR HANDLING EQUIPMENT AND COOLING |
| US8589138B2 (en) * | 2007-06-01 | 2013-11-19 | Solido Design Automation Inc. | On-the-fly improvement of certainty of statistical estimates in statistical design, with corresponding visual feedback |
| US9263895B2 (en) * | 2007-12-21 | 2016-02-16 | Sunpower Corporation | Distributed energy conversion systems |
| US7848897B2 (en) * | 2008-01-30 | 2010-12-07 | Southern Company Services, Inc. | Dynamic real-time power system monitoring |
| US20090210178A1 (en) * | 2008-02-15 | 2009-08-20 | Paul Bieganski | Systems and methods for producing power consumption data |
| WO2009151750A1 (en) * | 2008-04-03 | 2009-12-17 | Telcordia Technologies, Inc. | A formal language for multicast communication |
| US8476523B2 (en) * | 2008-08-25 | 2013-07-02 | Enpulz, L.L.C. | Solar panel ready tiles |
| US8344240B2 (en) * | 2008-08-25 | 2013-01-01 | Enpulz, Llc | Solar panel light indicator/decorative system |
| US8639392B2 (en) * | 2008-09-29 | 2014-01-28 | Battelle Memorial Institute | Electric power grid control using a market-based resource allocation system |
| JP5400678B2 (ja) * | 2010-03-19 | 2014-01-29 | シャープ株式会社 | 太陽光発電プラント監視システム |
| SG191407A1 (en) * | 2011-01-04 | 2013-08-30 | Zik Energy Points Inc | Method and system for energy efficiency and sustainability management |
-
2009
- 2009-03-10 EP EP09003475A patent/EP2104073A3/de not_active Withdrawn
- 2009-03-10 US US12/381,301 patent/US8963923B2/en active Active
-
2012
- 2012-09-14 US US13/618,288 patent/US8553035B2/en active Active
-
2015
- 2015-02-13 US US14/622,220 patent/US9495774B2/en active Active
Patent Citations (3)
| Publication number | Priority date | Publication date | Assignee | Title |
|---|---|---|---|---|
| US6892109B2 (en) | 1996-07-31 | 2005-05-10 | Canon Kabushiki Kaisha | Remote maintenance system |
| WO2006078685A2 (en) * | 2005-01-18 | 2006-07-27 | Presher Gordon E Jr | System and method for monitoring photovoltaic power generation systems |
| US20070176933A1 (en) | 2006-01-20 | 2007-08-02 | Newport Corporation | Self-centering zoom bar graph |
Non-Patent Citations (2)
| Title |
|---|
| FOLDVARI M: "Computer generation of harmonic equihue color scales", THE VISUAL COMPUTER, vol. 11, no. 4, 1995, pages 218 - 226, XP009139304, DOI: doi:10.1007/BF01901517 |
| RHEINGANS P: "Task-based Color Scale Design", PROCEEDINGS OF THE INTERNATIONAL SOCIETY FOR OPTICAL ENGINEERING (SPIE), SPIE, vol. 3905, 13 October 1999 (1999-10-13), pages 35 - 43, XP001033481, DOI: doi:10.1117/12.384882 |
Cited By (4)
| Publication number | Priority date | Publication date | Assignee | Title |
|---|---|---|---|---|
| CN102118123A (zh) * | 2010-01-05 | 2011-07-06 | 通用电气公司 | 用于监测并且控制电力系统的方法和设备 |
| EP2355385A1 (de) * | 2010-02-03 | 2011-08-10 | Lg Electronics Inc. | Rundfunksignalempfänger mit Überwachungsfunktion eines Solarzellenmoduls |
| WO2022108784A1 (en) * | 2020-11-19 | 2022-05-27 | Enphase Energy, Inc. | Methods and apparatus for servicing distributed energy generation systems using an unmanned aerial vehicle |
| US11928975B2 (en) | 2020-11-19 | 2024-03-12 | Enphase Energy, Inc. | Methods and apparatus for servicing distributed energy generation systems using an unmanned aerial vehicle |
Also Published As
| Publication number | Publication date |
|---|---|
| EP2104073A3 (de) | 2010-11-10 |
| US8553035B2 (en) | 2013-10-08 |
| US20150154770A1 (en) | 2015-06-04 |
| US20090231342A1 (en) | 2009-09-17 |
| US20130009960A1 (en) | 2013-01-10 |
| US8963923B2 (en) | 2015-02-24 |
| US9495774B2 (en) | 2016-11-15 |
Similar Documents
| Publication | Publication Date | Title |
|---|---|---|
| US9495774B2 (en) | Method and apparatus for electrical power visualization | |
| US10339682B2 (en) | Method and apparatus for energy data visualization | |
| Nguyen et al. | High PV penetration impacts on five local distribution networks using high resolution solar resource assessment with sky imager and quasi-steady state distribution system simulations | |
| US20200241170A1 (en) | System and method for variance-based photovoltaic fleet power statistics building with the aid of a digital computer | |
| US8577612B2 (en) | Computer-implemented system and method for bounding accuracy on a forecast of photovoltaic fleet power generation | |
| US8326535B1 (en) | Computer-implemented system and method for correlating overhead sky clearness for use in photovoltaic fleet output estimation | |
| US8326536B1 (en) | Computer-implemented system and method for correlating satellite imagery for use in photovoltaic fleet output estimation | |
| US9887544B2 (en) | System and method for mathematical predictive analytics and computational energy modeling | |
| US10474177B2 (en) | System and method for stability monitoring, analysis and control of electric power systems | |
| US20160084889A1 (en) | System and method for stability monitoring, analysis and control of electric power systems | |
| US20170363666A1 (en) | Method and apparatus for energy flow visualization | |
| Roy | Inclusion of short duration wind variations in economic load dispatch | |
| Black et al. | Weather data for energy analytics: From modeling outages and reliability indices to simulating distributed photovoltaic fleets | |
| Pruckner et al. | A hybrid simulation model for large-scaled electricity generation systems | |
| Hall et al. | Initial perspective on a 100% renewable electricity supply for Prince Edward Island | |
| CN116937569A (zh) | 光伏发电智能储能方法、装置及电子设备 | |
| Kumar et al. | Multi-objective control-based home energy management system with smart energy meter | |
| Saxena et al. | Analysis of smart electricity grid framework unified with renewably distributed generation | |
| Hummon et al. | Variability of photovoltaic power in the state of Gujarat using high resolution solar data | |
| Krishna et al. | Data acquisition system for performance monitoring of solar photovoltaic (PV) power generation | |
| US11200524B2 (en) | Technique for utility network management | |
| WO2016166992A1 (ja) | 異常監視システムおよびプログラム | |
| Muhaisen et al. | Feasibility analysis of implementing PV street lighting system in an arid region | |
| Azari et al. | Assessing the flexibility potential of the residential load in smart electricity grids—A data-driven approach | |
| Orlando et al. | Design of district-level photovoltaic installations for optimal power production and economic benefit |
Legal Events
| Date | Code | Title | Description |
|---|---|---|---|
| PUAI | Public reference made under article 153(3) epc to a published international application that has entered the european phase |
Free format text: ORIGINAL CODE: 0009012 |
|
| AK | Designated contracting states |
Kind code of ref document: A2 Designated state(s): AT BE BG CH CY CZ DE DK EE ES FI FR GB GR HR HU IE IS IT LI LT LU LV MC MK MT NL NO PL PT RO SE SI SK TR |
|
| AX | Request for extension of the european patent |
Extension state: AL BA RS |
|
| PUAL | Search report despatched |
Free format text: ORIGINAL CODE: 0009013 |
|
| AK | Designated contracting states |
Kind code of ref document: A3 Designated state(s): AT BE BG CH CY CZ DE DK EE ES FI FR GB GR HR HU IE IS IT LI LT LU LV MC MK MT NL NO PL PT RO SE SI SK TR |
|
| AX | Request for extension of the european patent |
Extension state: AL BA RS |
|
| RIC1 | Information provided on ipc code assigned before grant |
Ipc: G06T 11/00 20060101AFI20101001BHEP |
|
| 17P | Request for examination filed |
Effective date: 20110509 |
|
| AKX | Designation fees paid |
Designated state(s): AT BE BG CH CY CZ DE DK EE ES FI FR GB GR HR HU IE IS IT LI LT LU LV MC MK MT NL NO PL PT RO SE SI SK TR |
|
| 17Q | First examination report despatched |
Effective date: 20141118 |
|
| GRAP | Despatch of communication of intention to grant a patent |
Free format text: ORIGINAL CODE: EPIDOSNIGR1 |
|
| INTG | Intention to grant announced |
Effective date: 20161130 |
|
| RAP1 | Party data changed (applicant data changed or rights of an application transferred) |
Owner name: ENPHASE ENERGY, INC. |
|
| STAA | Information on the status of an ep patent application or granted ep patent |
Free format text: STATUS: THE APPLICATION IS DEEMED TO BE WITHDRAWN |
|
| 18D | Application deemed to be withdrawn |
Effective date: 20170411 |