EP2104014A1 - Apparatus and method for optimizing measurement points for measuring object to be controlled - Google Patents
Apparatus and method for optimizing measurement points for measuring object to be controlled Download PDFInfo
- Publication number
- EP2104014A1 EP2104014A1 EP09155647A EP09155647A EP2104014A1 EP 2104014 A1 EP2104014 A1 EP 2104014A1 EP 09155647 A EP09155647 A EP 09155647A EP 09155647 A EP09155647 A EP 09155647A EP 2104014 A1 EP2104014 A1 EP 2104014A1
- Authority
- EP
- European Patent Office
- Prior art keywords
- measurement points
- performance data
- dna
- optimization
- arrangement
- Prior art date
- Legal status (The legal status is an assumption and is not a legal conclusion. Google has not performed a legal analysis and makes no representation as to the accuracy of the status listed.)
- Granted
Links
Images


Classifications
-
- F—MECHANICAL ENGINEERING; LIGHTING; HEATING; WEAPONS; BLASTING
- F02—COMBUSTION ENGINES; HOT-GAS OR COMBUSTION-PRODUCT ENGINE PLANTS
- F02D—CONTROLLING COMBUSTION ENGINES
- F02D41/00—Electrical control of supply of combustible mixture or its constituents
- F02D41/02—Circuit arrangements for generating control signals
- F02D41/14—Introducing closed-loop corrections
- F02D41/1401—Introducing closed-loop corrections characterised by the control or regulation method
- F02D41/1406—Introducing closed-loop corrections characterised by the control or regulation method with use of a optimisation method, e.g. iteration
-
- F—MECHANICAL ENGINEERING; LIGHTING; HEATING; WEAPONS; BLASTING
- F02—COMBUSTION ENGINES; HOT-GAS OR COMBUSTION-PRODUCT ENGINE PLANTS
- F02D—CONTROLLING COMBUSTION ENGINES
- F02D41/00—Electrical control of supply of combustible mixture or its constituents
- F02D41/24—Electrical control of supply of combustible mixture or its constituents characterised by the use of digital means
- F02D41/2406—Electrical control of supply of combustible mixture or its constituents characterised by the use of digital means using essentially read only memories
- F02D41/2425—Particular ways of programming the data
- F02D41/2429—Methods of calibrating or learning
- F02D41/2432—Methods of calibration
-
- F—MECHANICAL ENGINEERING; LIGHTING; HEATING; WEAPONS; BLASTING
- F02—COMBUSTION ENGINES; HOT-GAS OR COMBUSTION-PRODUCT ENGINE PLANTS
- F02D—CONTROLLING COMBUSTION ENGINES
- F02D41/00—Electrical control of supply of combustible mixture or its constituents
- F02D41/24—Electrical control of supply of combustible mixture or its constituents characterised by the use of digital means
- F02D41/2406—Electrical control of supply of combustible mixture or its constituents characterised by the use of digital means using essentially read only memories
- F02D41/2425—Particular ways of programming the data
- F02D41/2429—Methods of calibrating or learning
- F02D41/2477—Methods of calibrating or learning characterised by the method used for learning
-
- F—MECHANICAL ENGINEERING; LIGHTING; HEATING; WEAPONS; BLASTING
- F02—COMBUSTION ENGINES; HOT-GAS OR COMBUSTION-PRODUCT ENGINE PLANTS
- F02D—CONTROLLING COMBUSTION ENGINES
- F02D41/00—Electrical control of supply of combustible mixture or its constituents
- F02D41/02—Circuit arrangements for generating control signals
- F02D41/14—Introducing closed-loop corrections
- F02D41/1401—Introducing closed-loop corrections characterised by the control or regulation method
- F02D2041/1433—Introducing closed-loop corrections characterised by the control or regulation method using a model or simulation of the system
-
- F—MECHANICAL ENGINEERING; LIGHTING; HEATING; WEAPONS; BLASTING
- F02—COMBUSTION ENGINES; HOT-GAS OR COMBUSTION-PRODUCT ENGINE PLANTS
- F02D—CONTROLLING COMBUSTION ENGINES
- F02D41/00—Electrical control of supply of combustible mixture or its constituents
- F02D41/24—Electrical control of supply of combustible mixture or its constituents characterised by the use of digital means
- F02D41/2406—Electrical control of supply of combustible mixture or its constituents characterised by the use of digital means using essentially read only memories
- F02D41/2425—Particular ways of programming the data
- F02D41/2429—Methods of calibrating or learning
- F02D41/2441—Methods of calibrating or learning characterised by the learning conditions
Definitions
- the present invention relates to an apparatus and a method for optimising measurement points for measuring an object to be controlled.
- Performance characteristic of a certain object to be controlled is automatically measured at predetermined measurement points (a combination of control parameters).
- the object to be controlled is an internal combustion engine (hereinafter referred to as an engine)
- various pieces of data and tables necessary for engine control are stored in an in-vehicle controller (referred to as an ECU). To generate such data and tables, performance characteristic of the engine needs to be accurately obtained. Automatic measurement of the engine is thus performed.
- Japanese Patent Application Laid-Open No. 2000-35379 shows a hardware configuration for automatically measuring performance characteristic of an engine.
- this document only shows a system configuration for automatically measuring engine performance, with which human labor can be alleviated, but the number of control parameters is enormous and the number of measurement points thus becomes large. Therefore, this configuration cannot meet a recent need for measuring engine performance characteristics in a shorter period of time.
- variable devices such as a universal moving valve system, a direct fuel injection system capable of injecting fuel several times in one combustion cycle, and a variable geometry supercharger
- control parameters is determined in a grid shape as shown in FIG. 1A by the use of the experimental design method, and automatic measurement is performed with the control parameters automatically held at respective set values.
- an object to be controlled is an engine
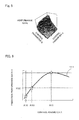
- the characteristic of the object to be controlled has a highly complicated curved surface with projections and depressions against control parameters as shown in FIG. 2 , and its changes are very abrupt.
- the number of measurement points is significantly reduced by the use of the experimental design method, it becomes impossible to catch the projections and depressions characteristics and peak points of actual engine performance characteristics.
- actual engine performance characteristic is indicated by the reference numeral 101.
- Measurement points by the use of the experimental design method are Ua1, Ua2, and Ua3 that the control parameter A may take.
- performance characteristic indicated by the reference numeral 103 is obtained.
- the performance characteristic obtained by measurement does not follow the actual performance characteristic.
- Actual projections and depressions characteristics and a peak point indicated by the reference numeral 105 cannot be obtained by the performance characteristic obtained by measurement.
- the missed projections and depressions characteristics and the missed peak point are the optimum values of performance data that need to be captured, the measurement is useless since the engine performance cannot be maximized. Accordingly, the technique based on the experimental design method that has been used in automatic measurement devices cannot practically reduce the number of measurement points and cannot shorten measuring time. In other words, when the number of measurement points is reduced, it is likely that an optimum point cannot be picked up, and that projections and depressions characteristics cannot be picked up.
- the present invention provides an apparatus for optimizing measurement points for measuring performance data of an object to be controlled corresponding to a predetermined control parameter.
- the apparatus has means for predicting performance characteristic of the object to be controlled corresponding to the control parameter using a model of the object to be controlled and calculating prediction performance data (RSM_est), means for sampling the prediction performance data at set measurement points and calculating sampled performance data (RSM_nm) based on the sampled performance data, and means for optimizing arrangement of the measurement points so as to minimize an error (Ersm_nm) between the prediction performance data and the sampled performance data.
- RSM_est prediction performance data
- RSSM_nm sampled performance data
- arrangement of measurement points of an object to be controlled such as an engine, having performance characteristic showing complicated increase and decrease, corresponding to a control parameter, can be optimized. If the object to be controlled is measured at the optimized measurement points, more accurate performance characteristic of the object to be controlled can be obtained. Based on the obtained performance characteristic, data and tables required for various controls to the object to be controlled are created. Control so as to maximize performance of the object to be controlled can be realized.
- performance includes emission, fuel economy, power, noise, and vibration (NV). For these parameters performance can be increased.
- the optimization is also performed for the number of measurement points. Not only arrangement of measurement points, but also the number of measurement points, is optimized. Time to measure performance characteristic of an object to be controlled, such as an engine, having performance characteristic showing complicated increase and decrease, corresponding to a control parameter, can be shortened. More accurate performance characteristic of the object to be controlled can be obtained.
- the actual object to be controlled is measured at the optimized measurement points to obtain actual performance characteristic of the object to be controlled. As described above, measurement is performed at the optimized measurement points and therefore more accurate performance characteristic of the actual object to be controlled can be obtained.
- the optimization of arrangement and the number of measurement points is performed by a genetic algorithm (GA).
- GA genetic algorithm
- a DNA element having a meaning to reduce the number of measurement points is incorporated into a DNA individual. Therefore, the number of measurement points can be reduced more efficiently.
- the evaluation function is weighted so as to lower evaluation of the evaluation function with increase in the number of measurement points.
- the number of measurement points is increased, a possibility that performance characteristic of an object to be controlled can be measured with a higher accuracy becomes higher. Therefore, even if the typical genetic algorithm is performed, it is difficult to efficiently reduce the number of measurement points.
- the present invention through the evaluation function weighting process, a probability of deriving a solution with a smaller number of measurement points can be enhanced. Thus, the number of measurement points can be efficiently reduced.
- a DNA individual in a selecting process in the genetic algorithm, is selected in decreasing order of evaluation of the evaluation function for each number of measurement points of each of DNA individuals.
- the optimization of arrangement of measurement points is performed by an optimization algorithm that calculates arrangement of measurement points for minimizing the error.
- optimization algorithm for example, the steepest descent method and the least squares method are known. Using such optimization algorithm, arrangement of measurement points can be optimized.
- the optimization of arrangement and the number of measurement points is performed by repeating a process by the use of the optimization algorithm while the number of measurement points is changed and determining arrangement and the number of measurement points in which the error is minimized after the repetition.
- both the number of measurement points and arrangement of measurement points cannot be optimized at the same time.
- the optimization algorithm such as the steepest descent method and the least squares method
- both the number of measurement points and arrangement of measurement points cannot be optimized at the same time.
- the optimization algorithm such as the steepest descent method and the least squares method
- by repeating the process by the use of the optimization algorithm with changing the number of measurement points not only arrangement of measurement points, but also the number of measurement points, can be optimized.
- performance characteristic of an actual object to be controlled can be obtained with a smaller number of measurement points.
- a predetermined evaluation function is used for determining arrangement and the number of measurement points in which the error is minimum and the evaluation function is weighted so as to lower evaluation of the evaluation function with increase in the number of measurement points.
- FIG. 4 is a block diagram of an apparatus for optimizing measurement points according to an embodiment of the present invention.
- the apparatus can be realized by an arbitrary computer.
- the computer has a CPU (central processing unit), a storage device (including a memory and a hard disk drive), an input device such as a keyboard and a mouse, and an output device such as a display.
- Functional blocks shown in the drawing can be realized by executing a computer program stored in the memory by the CPU.
- an internal combustion engine (hereinafter referred to as an engine) is an object to be controlled.
- the object to be controlled exhibits performance characteristic according to a control parameter.
- control parameters such as an amount of lift of an intake valve, a phase of an inlet cam, a negative pressure of an intake pipe, an air-fuel ratio, and a fuel injection amount.
- performance characteristics such as an engine output torque and emission (an amount of HC and NOx exhausted from the engine).
- the control parameters are an amount of lift of an intake valve and the phase of an inlet cam, an output torque according to the values of the control parameters can be obtained as performance characteristic of the engine.
- the present invention is applicable also to other objects to be controlled.
- a prediction performance unit 11 predicts predetermined performance characteristic of an engine corresponding to a predetermined control parameter using a predetermined engine model and generates a prediction performance model Rsm_est that shows performance data corresponding to the control parameter.
- the engine model models an actual engine and is generated by an arbitrary appropriate technique.
- an elementary chemical reaction model zero-dimensional
- the elementary chemical reaction model describes a chemical reaction in the engine by a combination of a large number of elementary reactions.
- the engine model may be a one-dimensional or three-dimensional model. An intake and exhaust flow of the engine is subjected to one-dimensional or three-dimensional analysis so as to be modeled.
- a control parameter and performance data corresponding to the control parameter are obtained as prediction performance data.
- the relation between both can be represented as the model.
- This model is called a prediction performance model RSM_est.
- RSM_est a prediction performance model
- Such a model can be generated by an arbitrary appropriate technique.
- performance data corresponding to the control parameter is represented by a response curved surface, which can be the prediction performance model.
- the Kriging method, a quadratic function curved surface, or a neural network can be used for generating the response curved surface.
- the value of the performance data corresponding to the values (combination) of control parameters is represented by one lattice point.
- the prediction performance model can also be represented as an interpolation map having an enormous number of the lattice points.
- FIG. 5 shows an example of a prediction performance model generated from control parameters A and B and performance data corresponding to the control parameters A and B in a predetermined engine model.
- the actually measured performance data is used as prediction performance data.
- the prediction performance model may be generated from the prediction performance data using the response curved surface or the like.
- the generated prediction performance model RSM_est is stored in the storage device of the computer.
- a designated measurement point determination unit 12 designates predetermined measurement points.
- the measurement points designated are called designated measurement points.
- the designated measurement points can be determined by an arbitrary criterion. In this embodiment, measurement points that are considered to be necessary or desired for controlling an engine are determined to be the designated measurement points.
- the designated measurement points can be determined as follows:
- the value 111 (represented by a prediction performance model) of prediction performance data corresponding to the value of the control parameter A is shown.
- a (i) is the designated measurement point that meets the above-mentioned 1) and is a control parameter value in which the prediction performance data is maximum.
- a (ii) is the designated measurement point that meets the above-mentioned 2) and is the designated measurement point in which the control parameter value is minimum.
- a (iii) is the designated measurement point in which the value of the prediction performance data meets a predetermined condition (a condition to take a value X (iii)).
- a necessary or desired measurement point can be included in optimum measurement points without being excluded.
- An initial group determination unit 13 determines an initial group (zero-generation) in a genetic algorithm so as to include the designated measurement points as chromosomes (hereinafter referred to as a DNA element) in each DNA individual.
- the initial group includes a predetermined number of DNA individuals.
- An optimization unit 15 optimizes arrangement of measurement points (what control parameter values should be combined) using the genetic algorithm.
- the optimization unit 15 optimizes, not only arrangement of measurement points, but also the number of measurement points, using the genetic algorithm.
- a sampled performance model generation unit 21 reads a prediction performance model RSM_est from the storage device, samples the prediction performance model RSM_est at control parameter values defined by each DNA individual, and generates a sampled performance model RSM_nm from the sampled prediction performance data.
- An evaluation unit 22 compares the prediction performance model RSM_est with the sampled performance model RSM_nm and evaluates the sampled performance model RSM_nm using an evaluation function.
- a DNA update unit 23 performs selection, crossover, and mutation processes in the genetic algorithm so as to leave a DNA individual having higher evaluation.
- a convergence judgment unit 24 judges whether optimization is converged based on a difference between one having the highest evaluation among DNA individuals in the current generation and one having the highest evaluation among DNA individuals in the previous generation. If it is judged that optimization is converged, control parameter values represented by the DNA individual having the highest evaluation in the current generation are determined to be optimized measurement points. Arrangement and the number of measurement points are optimized in such a way that a error between the prediction performance model RSM_est and the sampled performance model RSM_nm is minimized.
- a measurement unit 17 automatically measures an actual engine at the optimized measurement points.
- a known appropriate technique and apparatus can be used for measurement.
- As known as a bench test there is known an apparatus that measures performance of an engine to be tested by installing the engine on a mounting base (bench) and operating the engine via a connected test apparatus. What test is performed can be controlled by a computer connected to the test apparatus. The computer controls the test apparatus so as to automatically obtain engine performance data at each of the optimized measurement points. The obtained performance data can be fetched in the storage device of the computer and can be displayed on an output device such as a display.
- a prediction performance model is based on an engine model. Prediction performance data obtained from the prediction performance model imitates the behavior of projections and depressions characteristics or increase and decrease characteristics of actual engine performance. However, prediction performance data has an error in the magnitude of actual performance data. According to the present invention, arrangement and the number of measurement points suitable for the behavior of the prediction performance model are obtained. An actual engine is measured at the measurement points to obtain performance data that follows the behavior and magnitude of the actual engine.
- the performance data of the engine actually measured at the optimum measurement points can be used, for example, for generating data and tables to be stored in an ECU. Using the data and tables, engine control is executed so as to maximize engine performance.
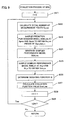
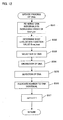
- FIGS. 7 to 15 there will be a detailed algorithm according to one embodiment of the present invention, executed by the CPU of the computer, more specifically, by the initial group determination unit 13 and the optimization unit 15 of FIG. 4 .
- step S11 a generation parameter m showing the generation of a group of DNA individuals in the genetic algorithm is initialized to zero.
- the designated measurement point determination unit 12 determines designated measurement points of the control parameter B.
- the control parameter A the three designated measurement points A (i) to A (iii) described with reference to FIG. 6 are used.
- the control parameter B for example, two designated measurement points B (i) and B (ii) that satisfy the conditions 1) and 2) are used.
- the number of designated measurement points of the control parameters A is oa.
- the number of designated measurement points of each of the control parameters can be arbitrarily determined.
- the number of the kinds of control parameters can be arbitrarily determined.
- the number of DNA individuals per generation is N.
- a maximum number of chromosomes (DNA elements) of the control parameter A is pa.
- a maximum number of DNA elements of the control parameter B is pb.
- pa shows a maximum number of measurement points of the control parameter A.
- pb shows a maximum number of measurement points of the control parameter B.
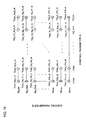
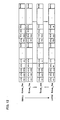
- the first figure shows the kind of a control parameter
- the second figure shows a DNA element number
- the third figure shows a DNA individual number
- the fourth figure shows a generation number.
- "A135" represents the first DNA element in the third DNA individual in the fifth generation of the control parameter A.
- the designated measurement point is included as the fixed DNA element.
- the designated measurement points of the control parameter A are included in the first to third DNA elements in each of the DNA individuals, and the designated measurement points of the control parameter B are included in the first and second DNA elements in each of the DNA individuals.
- the remaining DNA elements are generated by random numbers limited within the range in which the control parameters A and B may take. N DNA individuals are generated.
- the arbitrary DNA element is extracted by a random number.
- the extracted element is replaced by a value (in this embodiment, "99" that is a value outside the range in which the control parameters A and B may take is used) meaning that the measurement point represented by the element is nullified (or is not used as the measurement point).
- the DNA element to be nullified is extracted from the DNA elements other than the DNA elements having the defined designated measurement points.
- DNA elements of A420, B420, and A5n0 are nullified.
- the number of DNA elements to be nullified in each of the DNA individuals can be arbitrarily determined.
- the number of DNA elements to be nullified of the control parameter A B need not be equal.
- the respective maximum numbers of measurement points are pa and pb.
- the respective maximum numbers of measurement points are (pa -1) and (pb - 1).
- the respective maximum numbers of measurement points are (pa - 2) and (pb - 2).
- the total numbers of measurement points that are not replaced in the n-th DNA individual in the m generation are represented respectively by pa_ef_ nm and pb_ef_nm.
- step S13 a prediction performance model RSM_est stored in the storage device is read.
- the data is used for the later-described evaluation.
- va and vb be sufficiently large values, for example, (ten times pa and pb or more) so as to satisfy va » pa and vb » pb.
- va and vb may be generated by a general experimental design method and random numbers.
- step S14 an evaluation process of DNA individuals is executed.
- the evaluation process is shown in FIG. 9 .
- step S21 a repetition parameter i (identifying the DNA individual number n) is set to zero.
- step S22 as described above, the total numbers pa_ef_ nm and pb_ef_nm of measurement points that are not nullified by "99" are calculated respectively.
- a sampled performance model RSM_nm is generated based on the sampled prediction performance data Yapn_bqn_m.
- the prediction performance model RSM_est is obtained by calculating the relation between the control parameters and performance data corresponding to the control parameters by the computer.
- the sampled performance model RSM_nm can be generated from the control parameters Apnm and Bqnm and the performance data Yapb_bqn_m corresponding to the control parameters Apnm and Bqnm.
- the sampled performance model RSM_nm can represent engine performance characteristic that can be realized at the measurement points represented by the current DNA individual.
- step S25 the sampled performance model RSM_nm is sampled at the same control parameter values Av_r and Bv_s as in step S13 to obtain sampled performance data Vnm_rs.
- the same control parameter values Av_r and Bv_s as in step S13 are used for comparing the prediction performance model RSM_est with the sampled performance model RSM_nm under the same condition.
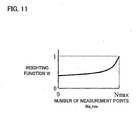
- Nmax pa x pb.
- W 1, and weighting is not performed.
- step S26 the weighting function W is calculated.
- the weighting function W may be calculated according to the above-mentioned equation or may be determined by referring to a table of the weighting function W.
- FIG. 11 shows an example of the table. As the number of measurement points Ns_nm is increased, the value of the weighting W becomes larger to lower evaluation.
- the table is stored in the memory, and is referred based on Ns _nm calculated in step S22 to determine the corresponding W.
- the evaluation function value Ersm_nm reflects an error of the sampled performance model RSM_nm relative to the prediction performance model RSM_est. As the evaluation function value Ersm_nm becomes smaller, evaluation of the DNA individual on which the sampled performance model RSM_nm is based becomes higher. It is evaluated how accurately the measurement point realized by the DNA individual can reproduce the performance data on the prediction performance model.
- step S28 the repetition parameter i is incremented by one. Steps S22 to S28 are executed for each of the DNA individuals until the value of i exceeds N showing the number of DNA individuals in step S29. If the judgment in step S29 is No, the routine is advanced to step S15 of FIG. 7 to execute a DNA update process. The update process is shown in FIG. 12 .
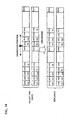
- step S31 N DNA individuals are arrayed in increasing order of evaluation function value Ersm_nm.
- An example of the arrayed results is shown in FIG. 13 .
- step S32 the individual with the smallest evaluation function value among the N DNA individuals is named as Ersm_best. This is used for the later-described optimization convergence judgment.
- step S33 DNA individuals are selected in increasing order of the evaluation function value Ersm_nm for each number of measurement points.
- the maximum value Nmax of the total number of measurement points is pa x pb, as described above.
- the DNA elements at the designated measurement points are not nullified.
- the numbers of the non-nullified DNA elements are oa and ob respectively.
- a possible minimum value Nmin of the total number of measurement points is oa x ob.
- Nsel ⁇ N
- step S34 two of the selected Nsel DNA individuals are selected at random and a crossover position is determined by random numbers.
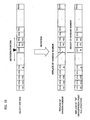
- a crossover position is determined by random numbers. Referring to FIG. 14 , an example of the two selected DNA individuals and the determined crossover position is shown. In this example, the crossover position is determined between the DNA element of the control parameter A and the DNA element of the control parameter B. The present invention is not limited to such crossover position.
- the DNA elements existing on the right side from the crossover position are exchanged to generate two new DNA individuals.
- a predetermined number of Ncros ( ⁇ N) DNA crossover individuals are generated.
- step S35 one of the selected the Nsel DNA individuals is selected at random and a mutation position is determined by a random number.
- the mutation position is determined so as to exclude DNA elements at designated measurement points.
- the value of the DNA element at the mutation position is replaced by a value determined by the random number or the value "99" showing nullification.
- the value determined by the random number is a value within the range that the control parameters A and B may take. It is preferred to determine, using the random number, which of the value determined by the random number and the value showing nullification is adopted for replacement.
- a predetermined number Nmut ( ⁇ N) of new DNA individuals are generated.
- step S36 numbers 1 to N are allocated to the N DNA individuals determined by selection, crossover, and mutation again.
- N Nsel + Ncros + Nmut.
- Nsel, Ncros, and Nmut are determined so as to have such relation.
- the number allocation order may be arbitrary.
- step S37 the generation parameter m is incremented by one and the routine is advanced to step S16 of FIG. 7 .
- step S16 an absolute value D_ersm_best of a difference between the best evaluation function value Ersm_best in the current generation calculated in step S32 and the best evaluation function value Ersm_best in the previous generation is calculated.
- (m - 1) shows the current generation
- (m - 2) shows the previous generation. This is because the generation parameter m is incremented by one in the update process of step S15 (S37 of FIG. 12 ).
- the best evaluation function value Ersm_best (m - 1) in the first generation the previous generation does not exist.
- a predetermined initial value is set to Ersm_best (m - 2).
- D_ersm_best Ersm_best m - 1 - Ersm_best m - 2
- step S17 if the difference D_ersm_best is equal to or less than a predetermined value D_ersm_conv, it is judged that optimization is converged and the routine is advanced to step S19. If not, the routine is advanced to step S18 to continue optimization.
- step S18 if the number of generations m is equal to or less than the predetermined maximum number of generations Mmax, the routine is advanced to step 14 to continue optimization. If the number of generations m is more than Mmax, the routine is advanced to step S19 to complete optimization.
- step S19 the values of the control parameters A and B defined by the DNA individual realizing the best evaluation function value Ersm_best (m - 1) in the current generation are determined to be optimum measurement points. The optimization is thus completed.
- the reason why (m - 1) shows the current generation is that, as described above, the generation parameter m is incremented by one in the update process of step S15.
- the optimum measurement points are measurement points that are determined so as to follow the behavior such as projections and depressions or a peak value (optimum value) of engine performance obtained from the engine model modeling the actual engine at the highest accuracy.
- the reference numeral 131 denotes actual engine performance characteristic
- the reference numeral 133 denotes performance data measured at measurement points A1 to A6 arranged with equal spacing by the conventional experimental design method.
- the reference numeral 131 denotes the same actual engine performance characteristic as in FIG. 16A
- the reference numeral 135 denotes performance data based on a prediction performance model RSM_est
- the reference numeral 137 denotes performance data obtained by measurement at measurement points that are optimized according to the present invention.
- the number of optimum measurement points is reduced to five by the technique of the present invention and optimum measurement points are arranged with unequal spacing.
- the prediction performance model imitates the behavior of the projections characteristic of the actual engine. Difference is generated in the magnitude of the performance data.
- the actual engine performance characteristic 131 and the engine performance characteristic 133 measured at the measurement points A1 to A6 are overlapped. With the six measurements points, the projections characteristic in the actual engine performance can be measured with a high accuracy at the measurement points A1 to A6.
- the engine performance characteristic calculated based on the measurement points A1 to A6 can represent the actual engine performance characteristic with a high accuracy.
- FIG. 16B the actual engine performance characteristic 131 and the engine performance characteristic 137 measured at the measurement points A1 to A6 are overlapped. According to the present invention, though the number of measurements points is reduced, the engine performance characteristic can be measured at the same accuracy as in FIG. 16A .
- FIGS. 17A and 17B differ from FIGS. 16A and 16B in that engine performance characteristic shows increase and decrease relatively significantly (for example, ignition time of a gasoline engine and emission of Nox and HC).
- FIG. 17A six measurement points are arranged with equal spacing by the conventional experimental design method.
- the increase and decrease characteristic of performance data in a region in which the value of the control parameter A is small cannot be accurately measured.
- the engine performance characteristic 133 determined based on the measurement points causes a large amount of departure from the actual engine performance characteristic 131 in the region in which the value of the control parameter A is small. To eliminate the error, more measurement points need to be arranged.
- the number of measurement points is reduced from six to five.
- the measurement points are arranged with unequal spacing at appropriate positions.
- engine performance characteristic can be measured with a high accuracy in the region in which the value of the control parameter A is small, without causing a large error between the measured engine performance characteristic 137 and the actual engine performance characteristic 131.
- a DNA individual need not be selected for each number of measurement points. All the DNA individuals may be arrayed in increasing order of the evaluation function value Ersm_nm. Nsel DNA individuals need to be selected from among them. In the mutation process in step S35, the replacement by the value showing nullification is not performed.
- arrangement of measurement points suitable for the behavior of the prediction performance model can be obtained via the genetic algorithm. By measuring an actual engine at the measurement points, performance data following the behavior and magnitude of the actual engine can be obtained.
- optimization is performed using the genetic algorithm.
- arrangement and the number of measurement points can be optimized at the same time.
- the genetic algorithm need not be used. The form will be described below.
- FIG. 18 is a block diagram of an apparatus for optimizing measurement points according to another embodiment of the present invention.
- the apparatus optimizes arrangement and the number of measurement points using an optimization algorithm different from the genetic algorithm.
- the apparatus according to another embodiment has a configuration similar to that of FIG. 1 .
- the same components as in FIG. 1 are indicated by similar reference numerals and the description is omitted.
- An optimization unit 115 optimizes arrangement of measurement points using the optimization algorithm different from the genetic algorithm.
- the optimization unit 115 optimizes, not only arrangement of measurement points, but also the number of measurement points.
- a measurement point set initialization unit 113 sets an initial values of a set of measurement points (hereinafter referred to as a measurement point set) of each control parameter.
- a sampled performance model generation unit 121 reads a prediction performance model RSM_est from the storage device, samples the prediction performance model RSM_est at control parameter values defined by the measurement point set that is set by the measurement point set initialization unit 113, and generates a sampled performance model RSM_nm from the sampled prediction performance data.
- An evaluation unit 122 calculates an error between the prediction performance model RSM_est and the sampled performance model RSM_nm to evaluate the sampled performance model RSM_nm.
- a measurement point set update unit 123 uses the optimization algorithm to execute the optimization algorithm calculating the measurement point set so as to minimize the error and then updates the measurement point set. Unlike the above-mentioned embodiment using the genetic algorithm, the number of measurement points is not changed in the update of the measurement point set.
- the optimization algorithm the known steepest descent method, least squares method, simplex method, and Karmarkar method can be used.
- a convergence judgment unit 124 judges whether the error is converged. If the error is not converged, a sampled performance model of the updated measurement point set is generated again to evaluate the measurement point set. If the error is converged, a number-of-measurement points update unit 125 updates the number of measurement points included in the measurement point set. The measurement point set including the updated number of measurement points is repeatedly subjected to the processing by the initial measurement point set setting unit 113, the sampled performance model generation unit 121, the evaluation unit 122, the measurement point set update unit 123, and the convergence judgment unit 124.
- the number of measurement points included in the measurement point set reaches a predetermined value in the number-of-measurement points update unit 125.
- An optimum measurement point selection unit 126 selects, from among the evaluated measurement point sets, the measurement point set having the smallest value of the error.
- the values of the control parameters defined by the selected measurement point set are determined to be optimum measurement points.
- a DNA element showing measurement point nullification is incorporated into a DNA individual to optimize arrangement and the number of measurement points at the same time.
- optimum measurement points can be determined.
- arrangement and the number of measurement points cannot be optimized at the same time.
- the optimization algorithm determines arrangement of a predetermined number of measurement points so as to minimize an error.
- FIGS. 19 and 20 there will be described a detailed algorithm according to the embodiment shown in FIG. 18 , executed by the CPU of the computer, more specifically, by the optimization unit 115 of FIG. 18 .
- Step S111 is similar to step S13 of FIG. 7 .
- the prediction performance model RSM_est is read from the storage device.
- an initial value pa_s is set to ia showing the number of measurement points of the control parameter A.
- an initial value pb_s is set to ib showing the number of measurement points of the control parameter B.
- the initial values can be set to an arbitrary value (e.g., 3).
- Aia_ib_n represents a set of measurement points (measurement point set) of the control parameter A
- Bia_ib_m represents a set of measurement points (measurement point set) of the control parameter B.
- Aia_ib_n (0) and Bia_ib_m (0) are shown in FIG. 21 .
- step S115 the optimization algorithm is executed.
- the optimization algorithm is shown in FIG. 20 .
- step S121 the repetition parameter i (showing a value identifying the measurement point set) is initialized to zero.
- Steps S122 to S126 are similar to steps S23 to S27 of FIG. 9 .
- the total number of measurement points is ia x ib. This is represented by Ns_nm.
- Ns_nm pieces of prediction performance data Yan_bm can be obtained.
- a sampled performance model RSM_nm is generated based on the sampled prediction performance data Yan_bm.
- the prediction performance model RSM_est is obtained by calculating the relation between the control parameters and performance data corresponding to the control parameters by the computer.
- the sampled performance model RSM_nm can be generated from the control parameters Aia_ib_n and Bia_ib_m and the performance data Yan_bm corresponding to the control parameters Aia_ib_n and Bia_ib_m.
- the sampled performance model RSM_mn can represent engine performance characteristic that can be realized at measurement points represented by the values of the control parameters A and B of the current (i-th) measurement point set.
- step S124 the sampled performance model RSM_nm is sampled at the same control parameter values Av_r and Bv_s as in step S111 to obtain sampled performance data Vnm_rs.
- the same control parameter values Av_r and Bv_s as in step S111 are used for comparing the prediction performance model RSM_est with the sampled performance model RSM_nm under the same condition.
- the table of the weighting function W in FIG. 11 may be stored in the storage device to refer to the table based on Ns_nm, thereby determining the weighting function W. As the number of measurement points Ns_nm is increased, the value of the weighting W becomes larger to lower evaluation.
- step S126 using the calculated weighting function W, the evaluation function value Ersm_nm of the sampled performance model is calculated according to the following equation.
- the evaluation function value Ersm_nm (i) reflects an amount of departure of the sampled performance model RSM_nm determined from the values Aia_ib_n (i) and Bia_ib_m (i) of the control parameters A and B of the current measurement point set from the prediction performance model RSM_est. As the value of the error is smaller, evaluation of the measurement points Aia_ib_n (i) and Bia_ib_m (i) on which the sampled performance model Rsm_nm is based becomes higher.
- the calculated evaluation function value Ersm_nm (i) is associated with the corresponding measurement point sets Aia_ib_n (i) and Bia_ib_m (j) and is then stored in the storage device such as memory.
- step S127 using the predetermined optimization algorithm, Aia_ib_n (i+1) and Bia_ib_m (i+1) are calculated. These are used as Aia_ib_n (i) and Bia_ib_m (i) in the next evaluation process (that is, Aia_ib_n (i) and Bia_ib_m (i) are updated).
- an arbitrary known algorithm that can calculate Aia_ib_n (i + 1) and Bia_ib_m (i + 1) so as to minimize the evaluation function value (error) Ersm_nm can be used.
- the algorithms based on the steepest descent method, the least squares method, the simplex method, and the Karmarkar method can be used.
- Aia_ib_n (i + 1) of the control parameter A is typically determined by Aia_ib-n (i) + K x Ersm_nm (i).
- These algorithms are different in a way to calculate a coefficient K. All algorithms are the same in that the coefficient K is calculated so as to minimize the error Ersm_nm and that the coefficient K is used to calculate Aia_ib_n (i + 1). Either of the algorithms may be used.
- the equation (1 - 1) shows an equation for calculating Aia_ib_n (i + 1) of the control parameter A.
- the equation (1 - 2) shows an equation for calculating Bia_ib_m (i + 1) of the control parameter B.
- KP A and KP B coincide with the coefficient K.
- ⁇ A and ⁇ B show update gains and can be previously set.
- KPn (i) and KPm (i) correspond to the coefficient K and are successively calculated.
- P shows an update gain and can be previously set.
- ⁇ shows a weighting parameter (0 ⁇ ⁇ ⁇ 1).
- step S1208 convergence judgment is performed. More specifically, if a difference between the current error value Ersm_nm (i) and the previous error value Ersm_nm (i. - 1) is the predetermined value Drsm_conv or more, it is judged that optimization is not converged.
- step S129 the repetition parameter i is incremented by one. Steps S122 to S128 are repeated for Aia_ib_n (i + 1) and Bia_ib_m (i + 1) calculated in step S127 (that is, the updated Aia_ib_n (i) and Bia_ib_m (i)). The repetition is performed until the repetition parameter i reaches the predetermined value N in step S130. While the number of measurement points is maintained at the predetermined number, each of the N measurement point sets is evaluated.
- step S1208 if a difference between the current error value Ersm_nm (i) and the previous error value Ersm_nm (i - 1) is less than the predetermined value Drsm_conv, it is judged that optimization is converged and the routine is returned to step S116 of the process of FIG. 19 .
- step S116 the number of measurement points ib of the control parameter B is incremented by one.
- step S117 if the number of measurement points ib does not reach pb (as described above, a maximum number of measurement points of the control parameter B), initialization and optimization of the measurement point set in steps S114 and S115 are performed again while the number of measurement points of the control parameter A is maintained.
- the number of measurement points of the control parameter B alone is incremented by one.
- the values of the increased number of measurement points are initialized by a random number (S114) and are then optimized (S115).
- the number of measurement points of the control parameter A remains the same so as to be initialized again (S114) and is then optimized (S115).
- step S117 If the number of measurement points ib reaches pb in step S117, the routine is advanced to step S118 to increment the number of measurement points ia of the control parameter A by one. If the number of measurement points ia does not reach pa (as described above, a maximum number of measurement points of the control parameter A) in step S119, the process will be as below. The incremented number of measurement points ia of the control parameter A is maintained. The number of measurement points of the control parameter B is changed from the initial value pb_s to pb (S113, S116). The initialization and optimization of the measurement point set in steps S114 and S115 are performed.
- step S120 If the number of measurement points ia reaches pa in step S119, an optimum measurement point is determined in step S120.
- step S120 among the evaluation function values Ersm_nm (i) calculated in step S126 of FIG. 20 and stored in the storage device, Aia_ib_n (i) and Bia_ib_m (i) corresponding to the evaluation function value Ersm_nm (i) having the smallest value are determined to be optimum measurement points. The optimization is thus completed.
- the designated measurement point determination unit 12 may be provided between the prediction performance unit 11 and the measurement point set initialization unit 113.
- designated measurement points are determined, and the values of a measurement point set are set by the measurement point set initialization unit 113 so as to include the designated measurement points. More specifically, pa_s and pb_s in steps S112 and S113 of FIG. 19 are set to a value of the number of designated measurement points or more, and in step S114, the value of a measurement point other than the designated measurement points are initialized by a random number. For example, in FIG.
- Aia_ib_1 to Aia_ib_3 and Bia_ib_1 to Bia_ib_2 are used as values representing designated measurement points, and Bia_ib_3 is initialized by a random number.
- the measurement point set update unit 123 updates a measurement point set so as to include the designated measurement points. More specifically, the optimization algorithm used in step S127 of FIG. 20 need to calculate Aia_ib_n (i + 1) and Bia_ib_m (i + 1) of measurement points except for the designated measurement points.
- an apparatus for optimizing measurement points for measuring performance data of an object to be controlled corresponding to a predetermined control parameter predicts performance characteristic of the object to be controlled corresponding to the control parameter using a model of the object to be controlled and calculates prediction performance data (RSM_est).
- the prediction performance data is sampled at the set measurement points.
- Sampled performance data (RSM_nm) is calculated based on the sampled performance data.
- Arrangement of the measurement points is optimized so as to minimize an error (Ersm_nm) between the prediction performance data and the sampled performance data.
- the number of the measurement points is also optimized.
Abstract
Description
- The present invention relates to an apparatus and a method for optimising measurement points for measuring an object to be controlled.
- Performance characteristic of a certain object to be controlled is automatically measured at predetermined measurement points (a combination of control parameters). When the object to be controlled is an internal combustion engine (hereinafter referred to as an engine), various pieces of data and tables necessary for engine control are stored in an in-vehicle controller (referred to as an ECU). To generate such data and tables, performance characteristic of the engine needs to be accurately obtained. Automatic measurement of the engine is thus performed.
- Japanese Patent Application Laid-Open No.
2000-35379 - Further, in the "CAMEO system" of AVL List GmbH (Austria), engine performance is automatically measured by the use of an experimental design method. In this system, the number of measurement points of engine performance is reduced by the experimental design method, reducing the measuring time (Real-Time Optimization by Extremum Seeking Control, Kartik B. Ariyur, Miroslav Krstic, Wiley-Interscience, 2003/09). However, in the case of applying this to measurement of an engine which has been undergoing drastic changes with respect to control parameters, extreme reduction of the number of measurement points might make it impossible to accurately observe irregular changes in engine performance. Therefore, it is practically not possible to sufficiently reduce the number of measurement points. Moreover, since approximate positions of variation points of engine performance need to be previously input for automatic measurement, it is difficult to perform automatic measurement of an engine for which any measurement has not been done in the past.
- Since a currently used engine has a large number of variable devices such as a universal moving valve system, a direct fuel injection system capable of injecting fuel several times in one combustion cycle, and a variable geometry supercharger, the number of command values given to those devices, namely combinations of control parameters, has become enormous.
- Hence it is necessary to measure combination conditions of an enormous number of combinations of control parameters for obtaining engine performance characteristics, which is time-consuming. It is further necessary to perform measurement in various conditions in order to optimize a combination of a plurality of control parameters for each of evaluation indexes (such as fuel consumption, output, emission).
- Accordingly, a combination of control parameters is determined in a grid shape as shown in
FIG. 1A by the use of the experimental design method, and automatic measurement is performed with the control parameters automatically held at respective set values. - In a conventional automatic measurement method shown in
FIG. 1B , for example, sequential steps have been adopted in which, after a certain combination of the values of control parameters A and B is changed to another combination (time t1), measurement is halted until performance data is stabilized, and measurement is performed in a subsequent predetermined period of time. Hence it takes several tens of seconds to several minutes to measure performance data for one measurement point. Therefore, even with the use of the experimental design method, the effect of reducing the number of measurement points is not sufficient, and it takes time as long as several weeks to several months to obtain engine performance in all conditions. - Moreover, when an object to be controlled is an engine, the characteristic of the object to be controlled has a highly complicated curved surface with projections and depressions against control parameters as shown in
FIG. 2 , and its changes are very abrupt. For this reason, when the number of measurement points is significantly reduced by the use of the experimental design method, it becomes impossible to catch the projections and depressions characteristics and peak points of actual engine performance characteristics. InFIG. 3 , for example, actual engine performance characteristic is indicated by thereference numeral 101. Measurement points by the use of the experimental design method are Ua1, Ua2, and Ua3 that the control parameter A may take. When performance data measured at the three measurement points are connected, performance characteristic indicated by thereference numeral 103 is obtained. As apparent from comparison of theactual performance characteristic 101 with theperformance characteristic 103 obtained by measurement, the performance characteristic obtained by measurement does not follow the actual performance characteristic. Actual projections and depressions characteristics and a peak point indicated by thereference numeral 105 cannot be obtained by the performance characteristic obtained by measurement. When the missed projections and depressions characteristics and the missed peak point are the optimum values of performance data that need to be captured, the measurement is useless since the engine performance cannot be maximized. Accordingly, the technique based on the experimental design method that has been used in automatic measurement devices cannot practically reduce the number of measurement points and cannot shorten measuring time. In other words, when the number of measurement points is reduced, it is likely that an optimum point cannot be picked up, and that projections and depressions characteristics cannot be picked up. - There has been desired an apparatus that can optimize arrangement of measurement points so as to reliably catch an optimum point and projections and depressions characteristics of performance data of an object to be controlled, such as an engine, having complicated performance characteristic. There has also been desired an apparatus that can optimize the number of measurement points so as to reduce the number of measurement points to a minimum.
- In order to solve the problems, the present invention provides an apparatus for optimizing measurement points for measuring performance data of an object to be controlled corresponding to a predetermined control parameter. The apparatus has means for predicting performance characteristic of the object to be controlled corresponding to the control parameter using a model of the object to be controlled and calculating prediction performance data (RSM_est), means for sampling the prediction performance data at set measurement points and calculating sampled performance data (RSM_nm) based on the sampled performance data, and means for optimizing arrangement of the measurement points so as to minimize an error (Ersm_nm) between the prediction performance data and the sampled performance data.
- According to the present invention, arrangement of measurement points of an object to be controlled, such as an engine, having performance characteristic showing complicated increase and decrease, corresponding to a control parameter, can be optimized. If the object to be controlled is measured at the optimized measurement points, more accurate performance characteristic of the object to be controlled can be obtained. Based on the obtained performance characteristic, data and tables required for various controls to the object to be controlled are created. Control so as to maximize performance of the object to be controlled can be realized. When the object to be controlled is an engine, for example, performance includes emission, fuel economy, power, noise, and vibration (NV). For these parameters performance can be increased.
- According to an embodiment of the present invention, the optimization is also performed for the number of measurement points. Not only arrangement of measurement points, but also the number of measurement points, is optimized. Time to measure performance characteristic of an object to be controlled, such as an engine, having performance characteristic showing complicated increase and decrease, corresponding to a control parameter, can be shortened. More accurate performance characteristic of the object to be controlled can be obtained.
- According to another embodiment of the present invention, the actual object to be controlled is measured at the optimized measurement points to obtain actual performance characteristic of the object to be controlled. As described above, measurement is performed at the optimized measurement points and therefore more accurate performance characteristic of the actual object to be controlled can be obtained.
- According to another embodiment of the present invention, the optimization of arrangement and the number of measurement points is performed by a genetic algorithm (GA).
- In the optimization of the measurement points, it is necessary to solve a complicated optimization problem that a local minimum (local optimum point) often exists. In a typical linear optimization algorithm, sufficient reduction of the number of measurement points and optimization of arrangement of measurement points are difficult. Depending on initial values of arrangement and the number of measurement points to be optimized, different arrangement and different number of measurement points can be obtained by the optimization. By application of the genetic algorithm, a possibility that arrangement and the number of measurement points can be widely searched without being caught by a local minimum can be increased.
- According to another embodiment of the present invention, in a mutation process in the genetic algorithm, a DNA element having a meaning to reduce the number of measurement points is incorporated into a DNA individual. Therefore, the number of measurement points can be reduced more efficiently.
- In the typical genetic algorithm, optimization so as to increase and decrease the number of DNA elements cannot be performed. It has hitherto been difficult to solve the problem of optimizing arrangement and the number of measurement points at the same time by the genetic algorithm. However, according to the present invention, a value (in the embodiment, "99") showing measurement point nullification (blockage) is incorporated into a DNA element to optimize arrangement and the number of measurement points at the same time.
- According to another embodiment of the present invention, when a DNA individual is evaluated using an evaluation function in the genetic algorithm, the evaluation function is weighted so as to lower evaluation of the evaluation function with increase in the number of measurement points.
- Typically, as the number of measurement points is increased, a possibility that performance characteristic of an object to be controlled can be measured with a higher accuracy becomes higher. Therefore, even if the typical genetic algorithm is performed, it is difficult to efficiently reduce the number of measurement points. However, according to the present invention, through the evaluation function weighting process, a probability of deriving a solution with a smaller number of measurement points can be enhanced. Thus, the number of measurement points can be efficiently reduced.
- According to another embodiment of the present invention, in a selecting process in the genetic algorithm, a DNA individual is selected in decreasing order of evaluation of the evaluation function for each number of measurement points of each of DNA individuals.
- As described above, typically, as the number of measurement points is increased, a possibility that performance characteristic of an object to be controlled can be measured with a higher accuracy becomes higher. Therefore, even if the typical genetic algorithm is performed, it is difficult to efficiently reduce the number of measurement points. However, according to the present invention, in a DNA evolution process, a continuation probability of a DNA individual with reduced number of measurement points can be enhanced. Thus, the number of measurement points can be more efficiently reduced.
- According to another embodiment of the present invention, when the number of measurement points is a predetermined value, the optimization of arrangement of measurement points is performed by an optimization algorithm that calculates arrangement of measurement points for minimizing the error.
- As such optimization algorithm, for example, the steepest descent method and the least squares method are known. Using such optimization algorithm, arrangement of measurement points can be optimized.
- According to another embodiment of the present invention, the optimization of arrangement and the number of measurement points is performed by repeating a process by the use of the optimization algorithm while the number of measurement points is changed and determining arrangement and the number of measurement points in which the error is minimized after the repetition.
- Typically, in the optimization algorithm, such as the steepest descent method and the least squares method, both the number of measurement points and arrangement of measurement points cannot be optimized at the same time. On the other hand, by repeating the process by the use of the optimization algorithm with changing the number of measurement points, not only arrangement of measurement points, but also the number of measurement points, can be optimized. Thus, performance characteristic of an actual object to be controlled can be obtained with a smaller number of measurement points.
- According to a another embodiment of the present invention, a predetermined evaluation function is used for determining arrangement and the number of measurement points in which the error is minimum and the evaluation function is weighted so as to lower evaluation of the evaluation function with increase in the number of measurement points.
- Using such weighted evaluation function, a probability of deriving a solution with reduced number of measurement points can be enhanced. Thus, the number of measurement points can be efficiently reduced.
-
-
FIG. 1A is a view showing a combination of control parameters in an experimental design method; -
FIG. 1B is a view showing a conventional automatic measurement technique; -
FIG. 2 is a view showing an engine performance characteristic; -
FIG. 3 is a view showing an adverse effect of reduction in the number of measurement points by the use of the experimental design method; -
FIG. 4 is a block diagram of an apparatus for calculating optimum measurement points according to the first embodiment of the present invention; -
FIG. 5 is a view showing an example of a prediction performance model according to the first embodiment of the present invention; -
FIG. 6 is a view showing an example of designated measurement points according to the first embodiment of the present invention; -
FIG. 7 is a flowchart of an optimization process according to the first embodiment of the present invention; -
FIG. 8 is a view showing an example of an initial group in a genetic algorithm according to the first embodiment of the present invention; -
FIG. 9 is a flowchart of an evaluation process in the genetic algorithm according to the first embodiment of the present invention; -
FIG. 10 is a view showing a combination of the value of a control parameter A and the value of a control parameter B in each DNA individual according to the first embodiment of the present invention; -
FIG. 11 is a view showing an example of a table for determining weighting of an evaluation function according to one embodiment of the present invention; -
FIG. 12 is a flowchart of a DNA update process in the genetic algorithm according to the first embodiment of the present invention; -
FIG. 13 is a view showing re-array of DNA individuals in accordance with an evaluation function value in the genetic algorithm according to the first embodiment of the present invention; -
FIG. 14 is a view showing a crossover process in the genetic algorithm according to the first embodiment of the present invention; -
FIG. 15 is a view showing a mutation process in the genetic algorithm according to the first embodiment of the present invention; -
FIGS. 16A and 16B are views of assistance in explaining an effect of optimum measurement points determined according to a technique of the present invention; -
FIGS. 17A and 17B are views of assistance in explaining an effect of optimum measurement points determined according to the technique of the present invention; -
FIG. 18 is a block diagram of an apparatus for calculating optimum measurement points according to the second embodiment of the present invention; -
FIG. 19 is a flowchrat of an optimization process according to the second embodiment of the present invention; -
FIG. 20 is a flowchart showing an optimization algorithm of the optimization process according to the second embodiment of the present invention; and -
FIG. 21 is a view schematically showing structures of measurement sets according to the second embodiment of the present invention. - Embodiments of the present invention will be described below with reference to the drawings.
FIG. 4 is a block diagram of an apparatus for optimizing measurement points according to an embodiment of the present invention. The apparatus can be realized by an arbitrary computer. The computer has a CPU (central processing unit), a storage device (including a memory and a hard disk drive), an input device such as a keyboard and a mouse, and an output device such as a display. Functional blocks shown in the drawing can be realized by executing a computer program stored in the memory by the CPU. - In the following embodiment, an internal combustion engine (hereinafter referred to as an engine) is an object to be controlled. The object to be controlled exhibits performance characteristic according to a control parameter. When the object to be controlled is an engine, there are control parameters, such as an amount of lift of an intake valve, a phase of an inlet cam, a negative pressure of an intake pipe, an air-fuel ratio, and a fuel injection amount. There are performance characteristics, such as an engine output torque and emission (an amount of HC and NOx exhausted from the engine). When the control parameters are an amount of lift of an intake valve and the phase of an inlet cam, an output torque according to the values of the control parameters can be obtained as performance characteristic of the engine. The present invention is applicable also to other objects to be controlled.
- A
prediction performance unit 11 predicts predetermined performance characteristic of an engine corresponding to a predetermined control parameter using a predetermined engine model and generates a prediction performance model Rsm_est that shows performance data corresponding to the control parameter. - The engine model models an actual engine and is generated by an arbitrary appropriate technique. For example, an elementary chemical reaction model (zero-dimensional) can be used. The elementary chemical reaction model describes a chemical reaction in the engine by a combination of a large number of elementary reactions. The engine model may be a one-dimensional or three-dimensional model. An intake and exhaust flow of the engine is subjected to one-dimensional or three-dimensional analysis so as to be modeled.
- Using such an engine model, a control parameter and performance data corresponding to the control parameter are obtained as prediction performance data. The relation between both can be represented as the model. This model is called a prediction performance model RSM_est. Such a model can be generated by an arbitrary appropriate technique. For example, performance data corresponding to the control parameter is represented by a response curved surface, which can be the prediction performance model. The Kriging method, a quadratic function curved surface, or a neural network can be used for generating the response curved surface. Alternatively, the value of the performance data corresponding to the values (combination) of control parameters is represented by one lattice point. The prediction performance model can also be represented as an interpolation map having an enormous number of the lattice points.
- Generation of such a prediction performance model can be realized using a commercially available tool (software). In such tool, an engine model is generated, a torque (performance data) corresponding to the opening (control parameter) of a throttle valve is obtained in the generated model, and the relation between the control parameter and the performance data corresponding to the control parameter can be determined, for example, by the response curved surface method.
FIG. 5 shows an example of a prediction performance model generated from control parameters A and B and performance data corresponding to the control parameters A and B in a predetermined engine model. - Alternatively, when there is actually measured performance data of an engine having specifications that are close to those of an engine to be measured, the actually measured performance data is used as prediction performance data. The prediction performance model may be generated from the prediction performance data using the response curved surface or the like.
- The generated prediction performance model RSM_est is stored in the storage device of the computer.
- A designated measurement
point determination unit 12 designates predetermined measurement points. The measurement points designated are called designated measurement points. The designated measurement points can be determined by an arbitrary criterion. In this embodiment, measurement points that are considered to be necessary or desired for controlling an engine are determined to be the designated measurement points. - By way of example, the designated measurement points can be determined as follows:
- 1) A point in which prediction performance data is maximized and/or minimized;
- 2) A point in which the value of a control parameter satisfies a predetermined condition or a point in which the value of the control parameter is maximum and/or minimum; and
- 3) A point in which the value of prediction performance data satisfies a predetermined condition or a point in which the prediction performance data is maximum and/or minimum.
- Referring to
FIG. 6 , the value 111 (represented by a prediction performance model) of prediction performance data corresponding to the value of the control parameter A is shown. Here, an example of the designated measurement points is shown. A (i) is the designated measurement point that meets the above-mentioned 1) and is a control parameter value in which the prediction performance data is maximum. A (ii) is the designated measurement point that meets the above-mentioned 2) and is the designated measurement point in which the control parameter value is minimum. A (iii) is the designated measurement point in which the value of the prediction performance data meets a predetermined condition (a condition to take a value X (iii)). - Using the designated measurement point, a necessary or desired measurement point can be included in optimum measurement points without being excluded.
- An initial
group determination unit 13 determines an initial group (zero-generation) in a genetic algorithm so as to include the designated measurement points as chromosomes (hereinafter referred to as a DNA element) in each DNA individual. The initial group includes a predetermined number of DNA individuals. - An
optimization unit 15 optimizes arrangement of measurement points (what control parameter values should be combined) using the genetic algorithm. In a preferred form, theoptimization unit 15 optimizes, not only arrangement of measurement points, but also the number of measurement points, using the genetic algorithm. - More specifically, a sampled performance
model generation unit 21 reads a prediction performance model RSM_est from the storage device, samples the prediction performance model RSM_est at control parameter values defined by each DNA individual, and generates a sampled performance model RSM_nm from the sampled prediction performance data. Anevaluation unit 22 compares the prediction performance model RSM_est with the sampled performance model RSM_nm and evaluates the sampled performance model RSM_nm using an evaluation function. - A
DNA update unit 23 performs selection, crossover, and mutation processes in the genetic algorithm so as to leave a DNA individual having higher evaluation. Aconvergence judgment unit 24 judges whether optimization is converged based on a difference between one having the highest evaluation among DNA individuals in the current generation and one having the highest evaluation among DNA individuals in the previous generation. If it is judged that optimization is converged, control parameter values represented by the DNA individual having the highest evaluation in the current generation are determined to be optimized measurement points. Arrangement and the number of measurement points are optimized in such a way that a error between the prediction performance model RSM_est and the sampled performance model RSM_nm is minimized. - A
measurement unit 17 automatically measures an actual engine at the optimized measurement points. A known appropriate technique and apparatus can be used for measurement. As known as a bench test, there is known an apparatus that measures performance of an engine to be tested by installing the engine on a mounting base (bench) and operating the engine via a connected test apparatus. What test is performed can be controlled by a computer connected to the test apparatus. The computer controls the test apparatus so as to automatically obtain engine performance data at each of the optimized measurement points. The obtained performance data can be fetched in the storage device of the computer and can be displayed on an output device such as a display. - A prediction performance model is based on an engine model. Prediction performance data obtained from the prediction performance model imitates the behavior of projections and depressions characteristics or increase and decrease characteristics of actual engine performance. However, prediction performance data has an error in the magnitude of actual performance data. According to the present invention, arrangement and the number of measurement points suitable for the behavior of the prediction performance model are obtained. An actual engine is measured at the measurement points to obtain performance data that follows the behavior and magnitude of the actual engine.
- The performance data of the engine actually measured at the optimum measurement points can be used, for example, for generating data and tables to be stored in an ECU. Using the data and tables, engine control is executed so as to maximize engine performance.
- Referring to
FIGS. 7 to 15 , there will be a detailed algorithm according to one embodiment of the present invention, executed by the CPU of the computer, more specifically, by the initialgroup determination unit 13 and theoptimization unit 15 ofFIG. 4 . - In step S11, a generation parameter m showing the generation of a group of DNA individuals in the genetic algorithm is initialized to zero.
- In step S12, an initial group (generation m = 0) is generated. Referring to
FIG. 8 , an example of the initial group is shown. In this embodiment, two kinds of control parameters, that is, the control parameters A and B, are used. The designated measurementpoint determination unit 12 determines designated measurement points of the control parameter B. As for the control parameter A, the three designated measurement points A (i) to A (iii) described with reference toFIG. 6 are used. As for the control parameter B, for example, two designated measurement points B (i) and B (ii) that satisfy the conditions 1) and 2) are used. The number of designated measurement points of the control parameters A is oa. The number of designated measurement points of the control parameters B is ob. In this embodiment, oa = 3 and ob = 2. The number of designated measurement points of each of the control parameters can be arbitrarily determined. The number of the kinds of control parameters can be arbitrarily determined. - The number of DNA individuals per generation is N. A maximum number of chromosomes (DNA elements) of the control parameter A is pa. A maximum number of DNA elements of the control parameter B is pb. pa shows a maximum number of measurement points of the control parameter A. pb shows a maximum number of measurement points of the control parameter B. These values can be arbitrarily determined.
- Here, in the notation of each of the DNA elements, the first figure shows the kind of a control parameter, the second figure shows a DNA element number, the third figure shows a DNA individual number, and the fourth figure shows a generation number. For instance, "A135" represents the first DNA element in the third DNA individual in the fifth generation of the control parameter A.
- In each of the DNA individuals, the designated measurement point is included as the fixed DNA element. In this example, the designated measurement points of the control parameter A are included in the first to third DNA elements in each of the DNA individuals, and the designated measurement points of the control parameter B are included in the first and second DNA elements in each of the DNA individuals.
- After the designated measurement points are defined as the DNA elements in each of the DNA individuals, the remaining DNA elements (pa - oa, pb - ob) are generated by random numbers limited within the range in which the control parameters A and B may take. N DNA individuals are generated.
- The arbitrary DNA element is extracted by a random number. The extracted element is replaced by a value (in this embodiment, "99" that is a value outside the range in which the control parameters A and B may take is used) meaning that the measurement point represented by the element is nullified (or is not used as the measurement point). The DNA element to be nullified is extracted from the DNA elements other than the DNA elements having the defined designated measurement points. In this example, DNA elements of A420, B420, and A5n0 are nullified. The number of DNA elements to be nullified in each of the DNA individuals can be arbitrarily determined. The number of DNA elements to be nullified of the control parameter A B need not be equal. When the number of the DNA elements replaced by "99" is zero in each of the DNA individuals, the respective maximum numbers of measurement points are pa and pb. When the number of the replaced DNA elements is one, the respective maximum numbers of measurement points are (pa -1) and (pb - 1). When the number of the replaced DNA elements is two, the respective maximum numbers of measurement points are (pa - 2) and (pb - 2). Here, the total numbers of measurement points that are not replaced in the n-th DNA individual in the m generation are represented respectively by pa_ef_ nm and pb_ef_nm.
- In step S13, a prediction performance model RSM_est stored in the storage device is read. The prediction performance model RSM_est is sampled at the value Av_r (r = 1 to va) of the control parameter A and the value Bv_s (s = 1 to vb) of the control parameter B to obtain prediction performance data Vest_rs. The data is used for the later-described evaluation.
- It is desired that va and vb be sufficiently large values, for example, (ten times pa and pb or more) so as to satisfy va » pa and vb » pb. va and vb may be generated by a general experimental design method and random numbers.
- In step S14, an evaluation process of DNA individuals is executed. The evaluation process is shown in
FIG. 9 . - In step S21, a repetition parameter i (identifying the DNA individual number n) is set to zero.
- In step S22, as described above, the total numbers pa_ef_ nm and pb_ef_nm of measurement points that are not nullified by "99" are calculated respectively. The total number of measurement points Ns_nm (the number of combinations of the values of the control parameter A and the values of the control parameter B) is calculated as follows:

- In step S23, the control parameters defined by the DNA elements in the n-th DNA individual in the m generation are represented by Apnm (p = 1 to pa) and Bqnm (q = 1 to pb). A prediction performance model Rsm_est is sampled at Apnm and Bqnm to obtain prediction performance data Yapn_bqn_m (p =1 to pa, q =1 to pb).
- Here, referring to
FIG. 10 , an example of Yapn_bqn_m is shown. When either of Apnm and Bqnm is nullified (or is replaced by "99"), the prediction performance data is not sampled. The total number of measurement points is Ns_nm, thereby obtaining Ns_nm pieces of Yapn_bqn_m. - In step S24, a sampled performance model RSM_nm is generated based on the sampled prediction performance data Yapn_bqn_m. As described above, the prediction performance model RSM_est is obtained by calculating the relation between the control parameters and performance data corresponding to the control parameters by the computer. By the same technique as the technique of generating the prediction performance model, the sampled performance model RSM_nm can be generated from the control parameters Apnm and Bqnm and the performance data Yapb_bqn_m corresponding to the control parameters Apnm and Bqnm. The sampled performance model RSM_nm can represent engine performance characteristic that can be realized at the measurement points represented by the current DNA individual.
- In step S25, the sampled performance model RSM_nm is sampled at the same control parameter values Av_r and Bv_s as in step S13 to obtain sampled performance data Vnm_rs. The same control parameter values Av_r and Bv_s as in step S13 are used for comparing the prediction performance model RSM_est with the sampled performance model RSM_nm under the same condition.
- Typically, with larger number of measurement points a sampled performance model RSM_nm with a higher accuracy can be obtained. In the present invention, arrangement of measurement points with which a sampled performance model RSM_nm with a higher accuracy can be obtained even with a smaller number of measurement points is sought. Accordingly, the evaluation function is multiplied by the following weighting function (penalty) W according to the number of measurement points.

- Alternatively, W = (Ns_nm)2/Nmax2 may be used. Here, Nmax = pa x pb. As for a DNA individual that does not have a nullified DNA element, W = 1, and weighting is not performed.
- In step S26, the weighting function W is calculated. The weighting function W may be calculated according to the above-mentioned equation or may be determined by referring to a table of the weighting function W.
FIG. 11 shows an example of the table. As the number of measurement points Ns_nm is increased, the value of the weighting W becomes larger to lower evaluation. The table is stored in the memory, and is referred based on Ns _nm calculated in step S22 to determine the corresponding W. - In step S27, to evaluate the sampled performance model RSM_nm, an evaluation function value Ersm_nm including the weighting function W is calculated as follows:

- The evaluation function value Ersm_nm reflects an error of the sampled performance model RSM_nm relative to the prediction performance model RSM_est. As the evaluation function value Ersm_nm becomes smaller, evaluation of the DNA individual on which the sampled performance model RSM_nm is based becomes higher. It is evaluated how accurately the measurement point realized by the DNA individual can reproduce the performance data on the prediction performance model.
- In step S28, the repetition parameter i is incremented by one. Steps S22 to S28 are executed for each of the DNA individuals until the value of i exceeds N showing the number of DNA individuals in step S29. If the judgment in step S29 is No, the routine is advanced to step S15 of
FIG. 7 to execute a DNA update process. The update process is shown inFIG. 12 . - In step S31, N DNA individuals are arrayed in increasing order of evaluation function value Ersm_nm. An example of the arrayed results is shown in
FIG. 13 . - In step S32, the individual with the smallest evaluation function value among the N DNA individuals is named as Ersm_best. This is used for the later-described optimization convergence judgment.
- In step S33, DNA individuals are selected in increasing order of the evaluation function value Ersm_nm for each number of measurement points. The maximum value Nmax of the total number of measurement points is pa x pb, as described above. As described above, the DNA elements at the designated measurement points are not nullified. The numbers of the non-nullified DNA elements are oa and ob respectively. A possible minimum value Nmin of the total number of measurement points is oa x ob.
- From among the DNA individuals in which Ns_nm = Nmin, one DNA individual having the smallest evaluation function value Ersm_nm is selected. From among the DNA individuals in which Ns_nm =
Nmin + 1, one DNA individual having the smallest evaluation function value Ersm_nm is selected. Such selecting operation is repeated for Ns_nm =Nmin + 2, Nmin + 3, ... Nmax. If Ns_nm = Nmax is reached, the routine is returned to Ns_nm = Nmin. As for Ns_nm = Nmin, Nmin + 1, ...Nmax, from among the unselected DNA individuals, one DNA individual having the smallest evaluation function value Ersm_nm is selected. When the number of the selected DNA's reaches a predetermined value Nsel (< N), the selecting operation is completed. - In the typical genetic algorithm, such selecting operation for each number of measurement points is not performed and Nsel DNA individuals are selected in increasing order of the evaluation function value Ersm_nm. In the present invention, to increase the survival rate of the DNA individual with a smaller number of measurement points, it is preferred that such selecting operation for each number of measurement points be operated.
- In step S34, two of the selected Nsel DNA individuals are selected at random and a crossover position is determined by random numbers. Referring to
FIG. 14 , an example of the two selected DNA individuals and the determined crossover position is shown. In this example, the crossover position is determined between the DNA element of the control parameter A and the DNA element of the control parameter B. The present invention is not limited to such crossover position. - Between the two DNA individuals, the DNA elements existing on the right side from the crossover position are exchanged to generate two new DNA individuals. A predetermined number of Ncros (< N) DNA crossover individuals are generated.
- In step S35, one of the selected the Nsel DNA individuals is selected at random and a mutation position is determined by a random number. The mutation position is determined so as to exclude DNA elements at designated measurement points. The value of the DNA element at the mutation position is replaced by a value determined by the random number or the value "99" showing nullification. Here, the value determined by the random number is a value within the range that the control parameters A and B may take. It is preferred to determine, using the random number, which of the value determined by the random number and the value showing nullification is adopted for replacement. A predetermined number Nmut (< N) of new DNA individuals are generated.
- In step S36,
numbers 1 to N are allocated to the N DNA individuals determined by selection, crossover, and mutation again. Here, N = Nsel + Ncros + Nmut. Nsel, Ncros, and Nmut are determined so as to have such relation. The number allocation order may be arbitrary. - In step S37, the generation parameter m is incremented by one and the routine is advanced to step S16 of
FIG. 7 . - In step S16, as shown in the following equation, an absolute value D_ersm_best of a difference between the best evaluation function value Ersm_best in the current generation calculated in step S32 and the best evaluation function value Ersm_best in the previous generation is calculated. In the equation, (m - 1) shows the current generation and (m - 2) shows the previous generation. This is because the generation parameter m is incremented by one in the update process of step S15 (S37 of
FIG. 12 ). In the case of the best evaluation function value Ersm_best (m - 1) in the first generation, the previous generation does not exist. A predetermined initial value is set to Ersm_best (m - 2).
- In step S17, if the difference D_ersm_best is equal to or less than a predetermined value D_ersm_conv, it is judged that optimization is converged and the routine is advanced to step S19. If not, the routine is advanced to step S18 to continue optimization.
- In step S18, if the number of generations m is equal to or less than the predetermined maximum number of generations Mmax, the routine is advanced to step 14 to continue optimization. If the number of generations m is more than Mmax, the routine is advanced to step S19 to complete optimization.
- In step S19, the values of the control parameters A and B defined by the DNA individual realizing the best evaluation function value Ersm_best (m - 1) in the current generation are determined to be optimum measurement points. The optimization is thus completed. The reason why (m - 1) shows the current generation is that, as described above, the generation parameter m is incremented by one in the update process of step S15.
- As described above, the actual engine is measured at the optimum measurement points. The optimum measurement points are measurement points that are determined so as to follow the behavior such as projections and depressions or a peak value (optimum value) of engine performance obtained from the engine model modeling the actual engine at the highest accuracy. By measuring the actual engine at the optimum measurement points, performance characteristic of the actual engine can be obtained with a higher accuracy.
- Referring to
FIGS. 16A, 16B ,17A, and 17B , effects of measurement points optimized according to the present invention will be described. In this example, as for performance data (e.g., an amount of intake, torque, combustion efficiency) showing relatively smooth projections characteristic against the control parameter A (e.g., an opening of a throttle valve and an amount of lift of an intake valve), there are shown (A) the case that arrangement of measurement points is determined according to the conventional experimental design method and (B) the case that arrangement and the number of measurement points are determined according to a technique of the present invention. - In
FIG. 16A , thereference numeral 131 denotes actual engine performance characteristic, and thereference numeral 133 denotes performance data measured at measurement points A1 to A6 arranged with equal spacing by the conventional experimental design method. - In
FIG. 16B , thereference numeral 131 denotes the same actual engine performance characteristic as inFIG. 16A , thereference numeral 135 denotes performance data based on a prediction performance model RSM_est, and the reference numeral 137 denotes performance data obtained by measurement at measurement points that are optimized according to the present invention. Here, a maximum number of measurement points is pa = 6. The number of optimum measurement points is reduced to five by the technique of the present invention and optimum measurement points are arranged with unequal spacing. As described above, the prediction performance model imitates the behavior of the projections characteristic of the actual engine. Difference is generated in the magnitude of the performance data. - In
FIG. 16A , the actual engine performance characteristic 131 and the engine performance characteristic 133 measured at the measurement points A1 to A6 are overlapped. With the six measurements points, the projections characteristic in the actual engine performance can be measured with a high accuracy at the measurement points A1 to A6. The engine performance characteristic calculated based on the measurement points A1 to A6 can represent the actual engine performance characteristic with a high accuracy. - In
FIG. 16B , the actual engine performance characteristic 131 and the engine performance characteristic 137 measured at the measurement points A1 to A6 are overlapped. According to the present invention, though the number of measurements points is reduced, the engine performance characteristic can be measured at the same accuracy as inFIG. 16A . - Referring to
FIGS. 17A and 17B , another example is shown.FIGS. 17A and 17B differ fromFIGS. 16A and 16B in that engine performance characteristic shows increase and decrease relatively significantly (for example, ignition time of a gasoline engine and emission of Nox and HC). - In
FIG. 17A , six measurement points are arranged with equal spacing by the conventional experimental design method. The increase and decrease characteristic of performance data in a region in which the value of the control parameter A is small cannot be accurately measured. The engine performance characteristic 133 determined based on the measurement points causes a large amount of departure from the actual engine performance characteristic 131 in the region in which the value of the control parameter A is small. To eliminate the error, more measurement points need to be arranged. - In
FIG. 17B , according to the technique of the present invention, the number of measurement points is reduced from six to five. The measurement points are arranged with unequal spacing at appropriate positions. Thus, though the number of measurement points is reduced, engine performance characteristic can be measured with a high accuracy in the region in which the value of the control parameter A is small, without causing a large error between the measured engine performance characteristic 137 and the actualengine performance characteristic 131. - In the above-mentioned embodiment, there has been described the form of optimizing, not only arrangement of measurement points, but also the number of measurement points, using the genetic algorithm. Alternatively, arrangement of measurement points alone may be optimized. In this case, when the initial group in step S12 of
FIG. 7 is generated, the process of inserting the value showing measurement point nullification into the DNA element is not necessary. The control parameter values need to be inserted into all the DNA individuals. The weighting function W in step S26 ofFIG. 9 is 1 because each of the DNA individuals does not have the nullified DNA element and the evaluation function is not weighted. Therefore, the calculation of the weighting function may be omitted. In the selecting process in step S33 ofFIG. 12 , the number of measurement points of all the DNA individuals is equal. A DNA individual need not be selected for each number of measurement points. All the DNA individuals may be arrayed in increasing order of the evaluation function value Ersm_nm. Nsel DNA individuals need to be selected from among them. In the mutation process in step S35, the replacement by the value showing nullification is not performed. In the alternative form, arrangement of measurement points suitable for the behavior of the prediction performance model can be obtained via the genetic algorithm. By measuring an actual engine at the measurement points, performance data following the behavior and magnitude of the actual engine can be obtained. - In the above embodiment, optimization is performed using the genetic algorithm. According to the genetic algorithm, arrangement and the number of measurement points can be optimized at the same time. In an alternative form, the genetic algorithm need not be used. The form will be described below.
-
FIG. 18 is a block diagram of an apparatus for optimizing measurement points according to another embodiment of the present invention. The apparatus optimizes arrangement and the number of measurement points using an optimization algorithm different from the genetic algorithm. - The apparatus according to another embodiment has a configuration similar to that of
FIG. 1 . The same components as inFIG. 1 are indicated by similar reference numerals and the description is omitted. - An
optimization unit 115 optimizes arrangement of measurement points using the optimization algorithm different from the genetic algorithm. In a preferred form, theoptimization unit 115 optimizes, not only arrangement of measurement points, but also the number of measurement points. - More specifically, a measurement point set
initialization unit 113 sets an initial values of a set of measurement points (hereinafter referred to as a measurement point set) of each control parameter. A sampled performancemodel generation unit 121 reads a prediction performance model RSM_est from the storage device, samples the prediction performance model RSM_est at control parameter values defined by the measurement point set that is set by the measurement point setinitialization unit 113, and generates a sampled performance model RSM_nm from the sampled prediction performance data. Anevaluation unit 122 calculates an error between the prediction performance model RSM_est and the sampled performance model RSM_nm to evaluate the sampled performance model RSM_nm. A measurement point setupdate unit 123 uses the optimization algorithm to execute the optimization algorithm calculating the measurement point set so as to minimize the error and then updates the measurement point set. Unlike the above-mentioned embodiment using the genetic algorithm, the number of measurement points is not changed in the update of the measurement point set. As the optimization algorithm, the known steepest descent method, least squares method, simplex method, and Karmarkar method can be used. - A
convergence judgment unit 124 judges whether the error is converged. If the error is not converged, a sampled performance model of the updated measurement point set is generated again to evaluate the measurement point set. If the error is converged, a number-of-measurementpoints update unit 125 updates the number of measurement points included in the measurement point set. The measurement point set including the updated number of measurement points is repeatedly subjected to the processing by the initial measurement point set settingunit 113, the sampled performancemodel generation unit 121, theevaluation unit 122, the measurement point setupdate unit 123, and theconvergence judgment unit 124. - The number of measurement points included in the measurement point set reaches a predetermined value in the number-of-measurement
points update unit 125. An optimum measurementpoint selection unit 126 selects, from among the evaluated measurement point sets, the measurement point set having the smallest value of the error. The values of the control parameters defined by the selected measurement point set are determined to be optimum measurement points. - In the above-mentioned embodiment using the genetic algorithm, a DNA element showing measurement point nullification is incorporated into a DNA individual to optimize arrangement and the number of measurement points at the same time. When evaluation of DNA individuals in a predetermined number of generations has been completed or it is judged that optimization has been converged, optimum measurement points can be determined. On the other hand, in the optimization algorithm used in the embodiment shown in
FIG. 18 , arrangement and the number of measurement points cannot be optimized at the same time. The optimization algorithm determines arrangement of a predetermined number of measurement points so as to minimize an error. By repeating optimization algorithm while the number of measurement points is changed, not only arrangement of measurement points, but also the number of measurement points, can be optimized. - Referring to
FIGS. 19 and20 , there will be described a detailed algorithm according to the embodiment shown inFIG. 18 , executed by the CPU of the computer, more specifically, by theoptimization unit 115 ofFIG. 18 . - Step S111 is similar to step S13 of
FIG. 7 . The prediction performance model RSM_est is read from the storage device. The prediction performance model RSM_est is sampled at the values Av_r (r =1 to va) of the control parameter A and the values Bv_s (s = 1 to vb) of the control parameter B to obtain prediction performance data Vest_rs. This is used for the later-described evaluation. - In step S112, an initial value pa_s is set to ia showing the number of measurement points of the control parameter A. In step S113, an initial value pb_s is set to ib showing the number of measurement points of the control parameter B. The initial values can be set to an arbitrary value (e.g., 3).
- In step S114, ia measurement points Aia_ib_n (n = 1 to ia) of the control parameter A and ib measurement points Bia_ib_m (m = 1 to ib) of the control parameter B are initialized by random numbers. As described above, Aia_ib_n represents a set of measurement points (measurement point set) of the control parameter A, and Bia_ib_m represents a set of measurement points (measurement point set) of the control parameter B. Aia_ib_n (0) and Bia_ib_m (0) are shown in
FIG. 21 . In this example, values representing three (ia = 3) measurement points of Aia_ib_1 to Aia_ib_3 are set to the measurement point set Aia_ib_n (0) of the control parameter A. These are initialized by random numbers. This is ditto for the control parameter B. - In step S115, the optimization algorithm is executed. The optimization algorithm is shown in
FIG. 20 . In step S121, the repetition parameter i (showing a value identifying the measurement point set) is initialized to zero. - Steps S122 to S126 are similar to steps S23 to S27 of
FIG. 9 . In step S122, the prediction performance model Rsm_est is sampled at Aia_ib_n (n = 1 to ia) and Bia_ib_m (m = 1 to ib) to obtain prediction performance data Yan_bm. The total number of measurement points is ia x ib. This is represented by Ns_nm. Ns_nm pieces of prediction performance data Yan_bm can be obtained. - In step S123, a sampled performance model RSM_nm is generated based on the sampled prediction performance data Yan_bm. As described above, the prediction performance model RSM_est is obtained by calculating the relation between the control parameters and performance data corresponding to the control parameters by the computer. By the same technique as the technique of generating the prediction performance model, the sampled performance model RSM_nm can be generated from the control parameters Aia_ib_n and Bia_ib_m and the performance data Yan_bm corresponding to the control parameters Aia_ib_n and Bia_ib_m. The sampled performance model RSM_mn can represent engine performance characteristic that can be realized at measurement points represented by the values of the control parameters A and B of the current (i-th) measurement point set.
- In step S124, the sampled performance model RSM_nm is sampled at the same control parameter values Av_r and Bv_s as in step S111 to obtain sampled performance data Vnm_rs. The same control parameter values Av_r and Bv_s as in step S111 are used for comparing the prediction performance model RSM_est with the sampled performance model RSM_nm under the same condition.
- In step S125, the weighting function (penalty) W is calculated. This can be performed according to the equation W = Ns_nm / Nmax. Alternatively, W = (Ns_nm)2 / Nmax2 may be used. Here, a maximum number of measurement points of the control parameter A is pa, and a maximum number of measurement points of the control parameter B is pb (these are previously determined). Then, Nmax = pa x pb.
- In place of calculating the weighting function W according to the above equation, the table of the weighting function W in
FIG. 11 may be stored in the storage device to refer to the table based on Ns_nm, thereby determining the weighting function W. As the number of measurement points Ns_nm is increased, the value of the weighting W becomes larger to lower evaluation. - In step S126, using the calculated weighting function W, the evaluation function value Ersm_nm of the sampled performance model is calculated according to the following equation.

- This equation is similar to the above-mentioned equation of the evaluation function. The evaluation function value Ersm_nm (i) reflects an amount of departure of the sampled performance model RSM_nm determined from the values Aia_ib_n (i) and Bia_ib_m (i) of the control parameters A and B of the current measurement point set from the prediction performance model RSM_est. As the value of the error is smaller, evaluation of the measurement points Aia_ib_n (i) and Bia_ib_m (i) on which the sampled performance model Rsm_nm is based becomes higher. The calculated evaluation function value Ersm_nm (i) is associated with the corresponding measurement point sets Aia_ib_n (i) and Bia_ib_m (j) and is then stored in the storage device such as memory.
- In step S127, using the predetermined optimization algorithm, Aia_ib_n (i+1) and Bia_ib_m (i+1) are calculated. These are used as Aia_ib_n (i) and Bia_ib_m (i) in the next evaluation process (that is, Aia_ib_n (i) and Bia_ib_m (i) are updated).
- As the optimization algorithm, an arbitrary known algorithm that can calculate Aia_ib_n (i + 1) and Bia_ib_m (i + 1) so as to minimize the evaluation function value (error) Ersm_nm can be used. For example, the algorithms based on the steepest descent method, the least squares method, the simplex method, and the Karmarkar method can be used. Aia_ib_n (i + 1) of the control parameter A is typically determined by Aia_ib-n (i) + K x Ersm_nm (i). These algorithms are different in a way to calculate a coefficient K. All algorithms are the same in that the coefficient K is calculated so as to minimize the error Ersm_nm and that the coefficient K is used to calculate Aia_ib_n (i + 1). Either of the algorithms may be used.
- Here, the case of using the steepest descent method and the least squares method will be described. The following shows an arithmetic equation using the steepest descent method. The equation (1 - 1) shows an equation for calculating Aia_ib_n (i + 1) of the control parameter A. The equation (1 - 2) shows an equation for calculating Bia_ib_m (i + 1) of the control parameter B. Here, KPA and KPB coincide with the coefficient K. µA and µB show update gains and can be previously set.

- An arithmetic equation in the case of using the least squares method of the successive type is shown. Here, KPn (i) and KPm (i) correspond to the coefficient K and are successively calculated. P shows an update gain and can be previously set. λ shows a weighting parameter (0 < λ < 1).

- In step S128, convergence judgment is performed. More specifically, if a difference between the current error value Ersm_nm (i) and the previous error value Ersm_nm (i. - 1) is the predetermined value Drsm_conv or more, it is judged that optimization is not converged. In step S129, the repetition parameter i is incremented by one. Steps S122 to S128 are repeated for Aia_ib_n (i + 1) and Bia_ib_m (i + 1) calculated in step S127 (that is, the updated Aia_ib_n (i) and Bia_ib_m (i)). The repetition is performed until the repetition parameter i reaches the predetermined value N in step S130. While the number of measurement points is maintained at the predetermined number, each of the N measurement point sets is evaluated.
- However, before i reaches N, in step S128, if a difference between the current error value Ersm_nm (i) and the previous error value Ersm_nm (i - 1) is less than the predetermined value Drsm_conv, it is judged that optimization is converged and the routine is returned to step S116 of the process of
FIG. 19 . - In step S116, the number of measurement points ib of the control parameter B is incremented by one. In step S117, if the number of measurement points ib does not reach pb (as described above, a maximum number of measurement points of the control parameter B), initialization and optimization of the measurement point set in steps S114 and S115 are performed again while the number of measurement points of the control parameter A is maintained. The number of measurement points of the control parameter B alone is incremented by one. The values of the increased number of measurement points are initialized by a random number (S114) and are then optimized (S115). The number of measurement points of the control parameter A remains the same so as to be initialized again (S114) and is then optimized (S115).
- If the number of measurement points ib reaches pb in step S117, the routine is advanced to step S118 to increment the number of measurement points ia of the control parameter A by one. If the number of measurement points ia does not reach pa (as described above, a maximum number of measurement points of the control parameter A) in step S119, the process will be as below. The incremented number of measurement points ia of the control parameter A is maintained. The number of measurement points of the control parameter B is changed from the initial value pb_s to pb (S113, S116). The initialization and optimization of the measurement point set in steps S114 and S115 are performed.
- If the number of measurement points ia reaches pa in step S119, an optimum measurement point is determined in step S120. In step S120, among the evaluation function values Ersm_nm (i) calculated in step S126 of
FIG. 20 and stored in the storage device, Aia_ib_n (i) and Bia_ib_m (i) corresponding to the evaluation function value Ersm_nm (i) having the smallest value are determined to be optimum measurement points. The optimization is thus completed. - In the above embodiment, there is described the form of optimizing, not only arrangement of measurement points, but also the number of measurement points, using the known optimization algorithm such as the steepest descent method and the least squares method. Alternatively, arrangement of measurement points alone may be optimized. In this case, in the process of
FIG. 19 , the update of the number of measurement points as shown in steps S116 and S118 is not necessary. It is only required to execute the initialization of the measurement point set of the predetermined number of measurement points and the optimization algorithm for the measurement point set as shown in steps S114 and S115. - In an embodiment shown in
FIG. 18 , as inFIG. 4 , the designated measurementpoint determination unit 12 may be provided between theprediction performance unit 11 and the measurement point setinitialization unit 113. In this case, as described with reference toFIG. 6 , designated measurement points are determined, and the values of a measurement point set are set by the measurement point setinitialization unit 113 so as to include the designated measurement points. More specifically, pa_s and pb_s in steps S112 and S113 ofFIG. 19 are set to a value of the number of designated measurement points or more, and in step S114, the value of a measurement point other than the designated measurement points are initialized by a random number. For example, inFIG. 21 , Aia_ib_1 to Aia_ib_3 and Bia_ib_1 to Bia_ib_2 are used as values representing designated measurement points, and Bia_ib_3 is initialized by a random number. The measurement point setupdate unit 123 updates a measurement point set so as to include the designated measurement points. More specifically, the optimization algorithm used in step S127 ofFIG. 20 need to calculate Aia_ib_n (i + 1) and Bia_ib_m (i + 1) of measurement points except for the designated measurement points. - Though the present invention has been described with regard to the specific embodiments, the present invention is not limited to such embodiments.
- There is provided an apparatus for optimizing measurement points for measuring performance data of an object to be controlled corresponding to a predetermined control parameter. The apparatus predicts performance characteristic of the object to be controlled corresponding to the control parameter using a model of the object to be controlled and calculates prediction performance data (RSM_est). The prediction performance data is sampled at the set measurement points. Sampled performance data (RSM_nm) is calculated based on the sampled performance data. Arrangement of the measurement points is optimized so as to minimize an error (Ersm_nm) between the prediction performance data and the sampled performance data. In a preferred form, the number of the measurement points is also optimized.
Claims (24)
- An apparatus for optimizing measurement points for measuring performance data of an object to be controlled corresponding to a predetermined control parameter, characterized in that the apparatus comprises:means for predicting performance characteristic of the object to be controlled corresponding to the control parameter using a model of the object to be controlled and calculating prediction performance data;means for sampling the prediction performance data at set measurement points and calculating sampled performance data based on the sampled performance data; andmeans for optimizing arrangement of the measurement points so as to minimize an error between the prediction performance data and the sampled performance data.
- The apparatus according to claim 1, wherein the optimization means further optimizes the number of measurement points.
- The apparatus according to claim 1 or 2, further comprising means for measuring the actual object to be controlled at the optimized measurement points to obtain actual performance characteristic of the object to be controlled.
- The apparatus according to any one of claims 1 to 3, wherein the optimization of arrangement of measurement points is performed by a genetic algorithm.
- The apparatus according to any one of claims 2 to 4, wherein the optimization of the number of measurement points is performed by a genetic algorithm.
- The apparatus according to claim 5, wherein in a mutation process in the genetic algorithm, a DNA element having a meaning to reduce the number of measurement points is incorporated into a DNA individual.
- The apparatus according to claim 5 or 6, wherein when a DNA individual is evaluated using an evaluation function in the genetic algorithm, the evaluation function is weighted so as to lower evaluation of the evaluation function with increase in the number of the measurement points.
- The apparatus according to claim 7, wherein in a selecting process in the genetic algorithm, a DNA individual is selected in decreasing order of evaluation by the use of the evaluation function for each number of measurement points of each of DNA individuals.
- The apparatus according to any one of claims 1 to 8, wherein the object to be controlled is an internal combustion engine.
- The apparatus according to claim 1 or 2, wherein when the number of the measurement points is a predetermined value, the optimization of arrangement of the measurement points is performed by an optimization algorithm that calculates arrangement of measurement points for minimizing the error.
- The apparatus according to claim 10, wherein the optimization of arrangement and the number of measurement points is performed by repeating a process by the use of the optimization algorithm while the number of the measurement points is changed and determining arrangement and the number of measurement points in which the error is minimized after the repetition.
- The apparatus according to claim 11, wherein a predetermined evaluation function is used for determining arrangement and the number of measurement points in which the error is minimum and the evaluation function is weighted so as to lower evaluation by the use of the evaluation function with increase in the number of measurement points.
- A method for optimizing measurement points for measuring performance data of an object to be controlled corresponding to a predetermined control parameter, characterized in that the method comprises the steps of:predicting performance characteristic of the object to be controlled corresponding to the control parameter using a model of the object to be controlled and calculating prediction performance data;sampling the prediction performance data at set measurement points and calculating sampled performance data based on the sampled performance data; andoptimizing arrangement of the measurement points so as to minimize an error between the prediction performance data and the sampled performance data.
- The method according to claim 13, wherein the number of measurement points is further optimized.
- The method according to claim 13 or 14, further comprising the step of measuring the actual object to be controlled at the optimized measurement points to obtain actual performance characteristic of the object to be controlled.
- The method according to any one of claims 13 to 15, wherein the optimization of arrangement of measurement points is performed by a genetic algorithm.
- The method according to any one of claims 14 to 16, wherein the optimization of the number of measurement points is performed by a genetic algorithm.
- The method according to claim 17, wherein in a mutation process in the genetic algorithm, a DNA element having a meaning to reduce the number of measurement points is incorporated into a DNA individual.
- The method according to claim 17 or 18, wherein when a DNA individual is evaluated using an evaluation function in the genetic algorithm, the evaluation function is weighted so as to lower evaluation of the evaluation function with increase in the number of the measurement points.
- The method according to claim 19, wherein in a selecting process in the genetic algorithm, a DNA individual is selected in decreasing order of evaluation by the use of the evaluation function for each number of measurement points of each of DNA individuals.
- The method according to any one of claims 13 to 20, wherein the object to be controlled is an internal combustion engine.
- The apparatus according to claim 13 or 14, wherein when the number of the measurement points is a predetermined value, the optimization of arrangement of the measurement points is performed by an optimization algorithm that calculates arrangement of measurement points for minimizing the error.
- The apparatus according to claim 22, wherein the optimization of arrangement and the number of measurement points is performed by repeating a process by the use of the optimization algorithm while the number of the measurement points is changed and determining arrangement and the number of measurement points in which the error is minimized after the repetition.
- The apparatus according to claim 23, wherein a predetermined evaluation function is used for determining arrangement and the number of measurement points in which the error is minimum and the evaluation function is weighted so as to lower evaluation by the use of the evaluation function with increase in the number of measurement points.
Applications Claiming Priority (2)
| Application Number | Priority Date | Filing Date | Title |
|---|---|---|---|
| JP2008073169 | 2008-03-21 | ||
| JP2008153591A JP4491491B2 (en) | 2008-03-21 | 2008-06-11 | Equipment for optimizing measurement points for measuring the controlled object |
Publications (2)
| Publication Number | Publication Date |
|---|---|
| EP2104014A1 true EP2104014A1 (en) | 2009-09-23 |
| EP2104014B1 EP2104014B1 (en) | 2012-12-05 |
Family
ID=40636693
Family Applications (1)
| Application Number | Title | Priority Date | Filing Date |
|---|---|---|---|
| EP09155647A Expired - Fee Related EP2104014B1 (en) | 2008-03-21 | 2009-03-19 | Apparatus and method for optimizing measurement points for measuring object to be controlled |
Country Status (2)
| Country | Link |
|---|---|
| EP (1) | EP2104014B1 (en) |
| JP (1) | JP4491491B2 (en) |
Cited By (4)
| Publication number | Priority date | Publication date | Assignee | Title |
|---|---|---|---|---|
| CN110442931A (en) * | 2019-07-19 | 2019-11-12 | 兰州理工大学 | A kind of motor multi-objective optimization design of power method based on RSM |
| CN111654413A (en) * | 2020-05-18 | 2020-09-11 | 长沙理工大学 | Method, equipment and storage medium for selecting effective measurement points of network flow |
| CN113008560A (en) * | 2021-02-24 | 2021-06-22 | 中国重汽集团济南动力有限公司 | Method for optimizing performance and emission of diesel engine of high-pressure common rail system |
| CN117371255A (en) * | 2023-12-06 | 2024-01-09 | 华中科技大学 | Construction method and application of rotary sound source radiation noise prediction model |
Families Citing this family (4)
| Publication number | Priority date | Publication date | Assignee | Title |
|---|---|---|---|---|
| JP5233660B2 (en) * | 2008-12-24 | 2013-07-10 | トヨタ自動車株式会社 | Method for adapting control parameters of an internal combustion engine |
| JP5218536B2 (en) * | 2010-12-10 | 2013-06-26 | 株式会社デンソー | Control device |
| JP2013221482A (en) * | 2012-04-19 | 2013-10-28 | Toyota Motor Corp | Abnormality in variation of air-fuel ratio among cylinder detection device |
| JP6472371B2 (en) * | 2015-12-08 | 2019-02-20 | 株式会社小野測器 | Engine characteristic test method and engine characteristic test system |
Citations (2)
| Publication number | Priority date | Publication date | Assignee | Title |
|---|---|---|---|---|
| JP2000035379A (en) | 1998-07-16 | 2000-02-02 | Tokyo Meeta Kk | Internal combustion engine tester |
| US6324529B1 (en) * | 1996-09-27 | 2001-11-27 | Yamaha Hatsudoki Kabushiki Kaisha | Evolutionary controlling system |
Family Cites Families (12)
| Publication number | Priority date | Publication date | Assignee | Title |
|---|---|---|---|---|
| JPH0811902A (en) * | 1994-07-05 | 1996-01-16 | Toppan Printing Co Ltd | Pouring tube for bag-in box |
| DE19908077A1 (en) * | 1999-02-25 | 2000-08-31 | Bosch Gmbh Robert | Method for datarization of a model for determining characteristic quantities for controlling an internal combustion engine, particularly one having direct or suction pipe injection |
| JP2001134783A (en) * | 1999-11-04 | 2001-05-18 | Hitachi Ltd | Optimal analytic modeling controller and method for optimal control for analytic modeling |
| JP2003013794A (en) * | 2001-04-24 | 2003-01-15 | Denso Corp | Adaptation method of control parameter for vehicle and adaptation device |
| JP3959980B2 (en) * | 2001-04-26 | 2007-08-15 | 三菱ふそうトラック・バス株式会社 | Data analysis method and apparatus based on experiment design method, data analysis program based on experiment design method, and computer-readable recording medium recording the program |
| JP2003242184A (en) * | 2002-02-20 | 2003-08-29 | Mitsubishi Electric Corp | Analysis model optimizing device and optimizing method |
| DE10209146A1 (en) * | 2002-03-01 | 2003-09-18 | Bayer Ag | Method and system for the automatic planning of experiments |
| JP2004116351A (en) * | 2002-09-25 | 2004-04-15 | Fuji Heavy Ind Ltd | Optimization system for control parameter |
| AT500978B8 (en) * | 2003-05-13 | 2007-02-15 | Avl List Gmbh | METHOD FOR OPTIMIZING VEHICLES |
| JP4453581B2 (en) * | 2004-06-03 | 2010-04-21 | トヨタ自動車株式会社 | Engine control parameter experiment plan setting method, program for causing computer to execute the experiment plan setting method, computer-readable recording medium storing the program, and engine control parameter experiment plan setting apparatus |
| US7499842B2 (en) * | 2005-11-18 | 2009-03-03 | Caterpillar Inc. | Process model based virtual sensor and method |
| JP4566900B2 (en) * | 2005-12-09 | 2010-10-20 | 株式会社エー・アンド・デイ | Engine measuring device |
-
2008
- 2008-06-11 JP JP2008153591A patent/JP4491491B2/en not_active Expired - Fee Related
-
2009
- 2009-03-19 EP EP09155647A patent/EP2104014B1/en not_active Expired - Fee Related
Patent Citations (2)
| Publication number | Priority date | Publication date | Assignee | Title |
|---|---|---|---|---|
| US6324529B1 (en) * | 1996-09-27 | 2001-11-27 | Yamaha Hatsudoki Kabushiki Kaisha | Evolutionary controlling system |
| JP2000035379A (en) | 1998-07-16 | 2000-02-02 | Tokyo Meeta Kk | Internal combustion engine tester |
Non-Patent Citations (4)
| Title |
|---|
| HUGUES HOPPE ET AL.: "Piecewise Smooth Surface Reconstruction", COMPUTER GRAPHICS PROCEEDINGS, 1994, pages 295 - 302 |
| HUGUES HOPPE ET AL: "Piecewise Smooth Surface Reconstruction", COMPUTER GRAPHICS PROCEEDINGS, 1994, pages 295 - 302, XP002530535 * |
| KADU S C; BHUSHAN M; GUDI R: "Optimal sensor network design for multirate systems", JOURNAL OF PROCESS CONTROL, OXFORD, GB, ODR, 3 December 2007 (2007-12-03) |
| KARTIK B. ARIYUR; MIROSLAV KRSTIC: "Real-Time Optimization by Extremum Seeking Control", September 2003, WLEY-INTERSDENCE |
Cited By (6)
| Publication number | Priority date | Publication date | Assignee | Title |
|---|---|---|---|---|
| CN110442931A (en) * | 2019-07-19 | 2019-11-12 | 兰州理工大学 | A kind of motor multi-objective optimization design of power method based on RSM |
| CN110442931B (en) * | 2019-07-19 | 2022-05-31 | 兰州理工大学 | Motor multi-objective optimization design method based on RSM |
| CN111654413A (en) * | 2020-05-18 | 2020-09-11 | 长沙理工大学 | Method, equipment and storage medium for selecting effective measurement points of network flow |
| CN113008560A (en) * | 2021-02-24 | 2021-06-22 | 中国重汽集团济南动力有限公司 | Method for optimizing performance and emission of diesel engine of high-pressure common rail system |
| CN117371255A (en) * | 2023-12-06 | 2024-01-09 | 华中科技大学 | Construction method and application of rotary sound source radiation noise prediction model |
| CN117371255B (en) * | 2023-12-06 | 2024-02-20 | 华中科技大学 | Construction method and application of rotary sound source radiation noise prediction model |
Also Published As
| Publication number | Publication date |
|---|---|
| EP2104014B1 (en) | 2012-12-05 |
| JP4491491B2 (en) | 2010-06-30 |
| JP2009258068A (en) | 2009-11-05 |
Similar Documents
| Publication | Publication Date | Title |
|---|---|---|
| EP2104014B1 (en) | Apparatus and method for optimizing measurement points for measuring object to be controlled | |
| JP4339321B2 (en) | Control device for internal combustion engine | |
| US11060953B2 (en) | Engine virtual test environment system and engine management system mapping method | |
| US8612107B2 (en) | Method, control apparatus and powertrain system controller for real-time, self-learning control based on individual operating style | |
| US8478506B2 (en) | Virtual sensor based engine control system and method | |
| KR102206324B1 (en) | Methods for ascertaining a model of a starting variable of a technical system | |
| Nikzadfar et al. | Investigating a new model-based calibration procedure for optimizing the emissions and performance of a turbocharged diesel engine | |
| CN108804850B (en) | Method for predicting parameters of aircraft engine in transient acceleration process based on spatial reconstruction | |
| US20070179917A1 (en) | Intelligent design optimization method and system | |
| Langouët et al. | Engine calibration: multi-objective constrained optimization of engine maps | |
| JP2005512168A (en) | Design optimization | |
| Kruse et al. | Modern statistical modeling and evolutionary optimization methods for the broad use in ECU calibration | |
| EP1985832A1 (en) | Control parameters for searching | |
| US11078856B2 (en) | Wiebe function parameter identification method and information processing device | |
| JP6610770B2 (en) | Wiebe function parameter identification apparatus, method and program | |
| Nishio et al. | Optimal calibration scheme for map-based control of diesel engines | |
| de Nola et al. | A Model-Based Computer Aided Calibration Methodology Enhancing Accuracy, Time and Experimental Effort Savings Through Regression Techniques and Neural Networks | |
| US20090204376A1 (en) | Method for measuring a nonlinear dynamic real system | |
| CN113283039A (en) | Engine exhaust system optimization method, device, medium and electronic equipment | |
| Yamamoto et al. | Optimization of heavy duty diesel engine parameters for low exhaust emissions using the design of experiments | |
| Langouët et al. | Optimization for engine calibration | |
| US20220235721A1 (en) | Internal combustion engine controller | |
| CN112782974A (en) | Control parameter calibration method | |
| JP2023506133A (en) | Method and system for calibrating engine controller | |
| Kaji et al. | Acceleration of experiment-based evolutionary multi-objective optimization of internal-combustion engine controllers using fitness estimation |
Legal Events
| Date | Code | Title | Description |
|---|---|---|---|
| PUAI | Public reference made under article 153(3) epc to a published international application that has entered the european phase |
Free format text: ORIGINAL CODE: 0009012 |
|
| 17P | Request for examination filed |
Effective date: 20090319 |
|
| AK | Designated contracting states |
Kind code of ref document: A1 Designated state(s): AT BE BG CH CY CZ DE DK EE ES FI FR GB GR HR HU IE IS IT LI LT LU LV MC MK MT NL NO PL PT RO SE SI SK TR |
|
| AX | Request for extension of the european patent |
Extension state: AL BA RS |
|
| AKX | Designation fees paid |
Designated state(s): DE FR |
|
| RIC1 | Information provided on ipc code assigned before grant |
Ipc: B60W 50/04 20060101AFI20110929BHEP |
|
| RIC1 | Information provided on ipc code assigned before grant |
Ipc: B60W 50/04 20060101ALI20120309BHEP Ipc: F02D 41/24 20060101ALI20120309BHEP Ipc: F02D 41/14 20060101AFI20120309BHEP |
|
| REG | Reference to a national code |
Ref country code: DE Ref legal event code: R079 Ref document number: 602009011661 Country of ref document: DE Free format text: PREVIOUS MAIN CLASS: G05B0023020000 Ipc: F02D0043020000 |
|
| RIC1 | Information provided on ipc code assigned before grant |
Ipc: B60W 50/04 20060101ALI20120503BHEP Ipc: F02D 43/02 20060101AFI20120503BHEP Ipc: F02D 41/14 20060101ALI20120503BHEP |
|
| GRAP | Despatch of communication of intention to grant a patent |
Free format text: ORIGINAL CODE: EPIDOSNIGR1 |
|
| GRAS | Grant fee paid |
Free format text: ORIGINAL CODE: EPIDOSNIGR3 |
|
| GRAA | (expected) grant |
Free format text: ORIGINAL CODE: 0009210 |
|
| AK | Designated contracting states |
Kind code of ref document: B1 Designated state(s): DE FR |
|
| REG | Reference to a national code |
Ref country code: DE Ref legal event code: R096 Ref document number: 602009011661 Country of ref document: DE Effective date: 20130131 |
|
| PGFP | Annual fee paid to national office [announced via postgrant information from national office to epo] |
Ref country code: FR Payment date: 20130325 Year of fee payment: 5 Ref country code: DE Payment date: 20130314 Year of fee payment: 5 |
|
| PLBE | No opposition filed within time limit |
Free format text: ORIGINAL CODE: 0009261 |
|
| STAA | Information on the status of an ep patent application or granted ep patent |
Free format text: STATUS: NO OPPOSITION FILED WITHIN TIME LIMIT |
|
| 26N | No opposition filed |
Effective date: 20130906 |
|
| REG | Reference to a national code |
Ref country code: DE Ref legal event code: R097 Ref document number: 602009011661 Country of ref document: DE Effective date: 20130906 |
|
| REG | Reference to a national code |
Ref country code: DE Ref legal event code: R119 Ref document number: 602009011661 Country of ref document: DE |
|
| REG | Reference to a national code |
Ref country code: FR Ref legal event code: ST Effective date: 20141128 |
|
| REG | Reference to a national code |
Ref country code: DE Ref legal event code: R119 Ref document number: 602009011661 Country of ref document: DE Effective date: 20141001 |
|
| PG25 | Lapsed in a contracting state [announced via postgrant information from national office to epo] |
Ref country code: FR Free format text: LAPSE BECAUSE OF NON-PAYMENT OF DUE FEES Effective date: 20140331 Ref country code: DE Free format text: LAPSE BECAUSE OF NON-PAYMENT OF DUE FEES Effective date: 20141001 |