EP1990624B1 - Apparatus and method for evaluating an optical system - Google Patents
Apparatus and method for evaluating an optical system Download PDFInfo
- Publication number
- EP1990624B1 EP1990624B1 EP08008432.0A EP08008432A EP1990624B1 EP 1990624 B1 EP1990624 B1 EP 1990624B1 EP 08008432 A EP08008432 A EP 08008432A EP 1990624 B1 EP1990624 B1 EP 1990624B1
- Authority
- EP
- European Patent Office
- Prior art keywords
- image
- point
- optical system
- distribution
- relative distance
- Prior art date
- Legal status (The legal status is an assumption and is not a legal conclusion. Google has not performed a legal analysis and makes no representation as to the accuracy of the status listed.)
- Active
Links
- 230000003287 optical effect Effects 0.000 title claims description 234
- 238000000034 method Methods 0.000 title claims description 57
- 238000009826 distribution Methods 0.000 claims description 150
- 238000011156 evaluation Methods 0.000 claims description 120
- 238000003384 imaging method Methods 0.000 claims description 98
- 238000004364 calculation method Methods 0.000 claims description 64
- 238000012545 processing Methods 0.000 claims description 60
- 230000004075 alteration Effects 0.000 claims description 39
- 230000008859 change Effects 0.000 claims description 24
- 238000005286 illumination Methods 0.000 claims description 14
- 238000004519 manufacturing process Methods 0.000 claims description 9
- 206010010071 Coma Diseases 0.000 claims description 6
- 238000001514 detection method Methods 0.000 claims description 6
- 238000004590 computer program Methods 0.000 claims description 3
- 238000005315 distribution function Methods 0.000 claims description 3
- 230000006870 function Effects 0.000 description 50
- 206010073261 Ovarian theca cell tumour Diseases 0.000 description 29
- 208000001644 thecoma Diseases 0.000 description 29
- 238000005259 measurement Methods 0.000 description 26
- 230000000875 corresponding effect Effects 0.000 description 21
- 238000003860 storage Methods 0.000 description 19
- 238000005070 sampling Methods 0.000 description 11
- 230000007246 mechanism Effects 0.000 description 10
- 238000012360 testing method Methods 0.000 description 9
- 238000007689 inspection Methods 0.000 description 7
- 239000002184 metal Substances 0.000 description 7
- 239000000758 substrate Substances 0.000 description 6
- 238000004458 analytical method Methods 0.000 description 5
- 230000005284 excitation Effects 0.000 description 5
- 238000012544 monitoring process Methods 0.000 description 4
- 239000013307 optical fiber Substances 0.000 description 4
- 238000012546 transfer Methods 0.000 description 4
- 230000008901 benefit Effects 0.000 description 3
- 238000006073 displacement reaction Methods 0.000 description 3
- 238000012986 modification Methods 0.000 description 3
- 230000004048 modification Effects 0.000 description 3
- 230000002250 progressing effect Effects 0.000 description 3
- 238000012935 Averaging Methods 0.000 description 2
- 239000011324 bead Substances 0.000 description 2
- 230000007423 decrease Effects 0.000 description 2
- 238000010586 diagram Methods 0.000 description 2
- 230000000694 effects Effects 0.000 description 2
- 230000004907 flux Effects 0.000 description 2
- 239000011521 glass Substances 0.000 description 2
- 230000009466 transformation Effects 0.000 description 2
- 238000006243 chemical reaction Methods 0.000 description 1
- 230000001276 controlling effect Effects 0.000 description 1
- 238000012937 correction Methods 0.000 description 1
- 230000002596 correlated effect Effects 0.000 description 1
- 238000013461 design Methods 0.000 description 1
- 238000009792 diffusion process Methods 0.000 description 1
- 230000007613 environmental effect Effects 0.000 description 1
- 229910052736 halogen Inorganic materials 0.000 description 1
- 150000002367 halogens Chemical class 0.000 description 1
- 239000011159 matrix material Substances 0.000 description 1
- 238000002834 transmittance Methods 0.000 description 1
- 229910052724 xenon Inorganic materials 0.000 description 1
- FHNFHKCVQCLJFQ-UHFFFAOYSA-N xenon atom Chemical compound [Xe] FHNFHKCVQCLJFQ-UHFFFAOYSA-N 0.000 description 1
Images


Classifications
-
- G—PHYSICS
- G01—MEASURING; TESTING
- G01M—TESTING STATIC OR DYNAMIC BALANCE OF MACHINES OR STRUCTURES; TESTING OF STRUCTURES OR APPARATUS, NOT OTHERWISE PROVIDED FOR
- G01M11/00—Testing of optical apparatus; Testing structures by optical methods not otherwise provided for
- G01M11/02—Testing optical properties
- G01M11/0228—Testing optical properties by measuring refractive power
-
- G—PHYSICS
- G01—MEASURING; TESTING
- G01M—TESTING STATIC OR DYNAMIC BALANCE OF MACHINES OR STRUCTURES; TESTING OF STRUCTURES OR APPARATUS, NOT OTHERWISE PROVIDED FOR
- G01M11/00—Testing of optical apparatus; Testing structures by optical methods not otherwise provided for
- G01M11/02—Testing optical properties
- G01M11/0242—Testing optical properties by measuring geometrical properties or aberrations
- G01M11/0257—Testing optical properties by measuring geometrical properties or aberrations by analyzing the image formed by the object to be tested
Definitions
- the present invention relates to an optical system evaluation apparatus, which evaluates optical characteristics of an optical system to be evaluated on the basis of an image forming position of a point image formed through the optical system and an optical system evaluation method.
- the optical system when an image imaged by using an optical system is used for length measurement, the optical system is required to have high telecentricity.
- the telecentricity represents a state in which all main beams at the object side or an image side are parallel to an optical axis, regardless of the distance from the optical axis.
- an object-side telecentric optical system is used in a length measuring microscope. In this case, even if an object to be imaged is moved away from the focus position, the image forming position corresponding to an arbitrary point on the object is not changed. Thus, it is possible to measure the distance between two points on the object with high accuracy without depending on the focusing state or a placement position of the object.
- FIG. 11 shows an example of evaluating an image-side telecentric optical system.
- a pin-hole 71 as a point light source is provided on an object surface of an optical system 72 to be evaluated, and is illuminated from behind by an illumination means (not shown).
- a point image 73 as the aerial image of the pin-hole 71 is formed on the image surface of the optical system 72 to be evaluated.
- this point image 73 is small, it is difficult to measure the image forming position with the maximum intensity with high accuracy even if the point image 73 is directly imaged by an imaging device. Therefore, the image enlarged by an enlargement optical system 74 is imaged by the imaging device 75.
- the image forming position of the point image 73 can be determined by retrieving a pixel with the maximum brightness from the image region in which the enlarged image is imaged.
- images are sequentially imaged while moving the enlargement optical system 74 and the imaging device 75 in the optical axis direction (Z axis direction) of the optical system 72 to be evaluated and a pixel with the maximum brightness is retrieved from each image sequentially imaged, whereby it is possible to detect the lateral shift of the X and Y coordinates of the image forming position accompanying the change of the Z coordinates. Further, the tendency of the change of the lateral shift with respect to the Z coordinates is calculated, whereby the telecentricity corresponding to the point image 73 can be evaluated. Moreover, this measurement is applied to a plurality of the point images 73, whereby the distribution of image-side telecentricity of the optical system 72 to be evaluated can be evaluated.
- the respective positions of the enlargement optical system 74 and the imaging device 75 should be monitored by a triaxial measuring instrument.
- the image should be measured while moving the pin-hole 71 to a plurality of positions on the object surface.
- the X and Y coordinates of the pin-hole 71 should also be monitored by the length measuring instrument.
- the coma aberration influences the tendency of the change of the lateral shift of the image forming position with respect to the Z coordinates.
- the lateral shift of the image forming position is linearly changed with respect to the Z coordinates, while as the coma aberration is increased, the lateral shift is changed in a curved line.
- WO 2003/091685 A1 discloses a method and apparatus for testing optical characteristics of a Device-Under-Test (DUT).
- a wavefront from a light source is directed through a Hartmann plate, and the location of intersection of the rays of light passing through the Hartmann plate onto a measurement plane are measured at a plurality of optical path locations. Then, the DUT is located in the system and the locations of the rays on the measurement plane are again measured with the DUT forming part of the system at each of the plurality of optical paths.
- the transverse aberration due to the DUT for the ray at each measurement plane is determined by comparing the measurements of the rays for each location with and without the DUT.
- the system is video based and is under the control of a computer which uses a windowing software program to provide the user with a graphical user interface by which the various components of the system and test lenses may be characterized and operated on through functions available via the interface.
- Lens performance measurements such as line spread and modulation transfer functions can be graphically and numerically displayed in real-time and/or recorded on other output devices or as files in computer memory.
- US 5402224 discloses a method for inspecting distortion characteristics of a projection optical system to be inspected by arranging a mask formed with measurement patterns at a plurality of predetermined positions on the object surface side of the projection optical system, transferring projected images of the plurality of measurement patterns onto a photosensitive substrate arranged on the image surface side of the projection optical system, and detecting transfer images of the measurement-patterns, including: the step of exposing a mask, on which pairs of first and second measurement patterns are arranged adjacent to each other to be separated by a predetermined interval delta T in one direction at positions on the mask corresponding to a plurality of points at which distortion amounts are to be inspected in a projection view field of the projection optical system, onto the photosensitive substrate via the projection optical system; the step of exposing the mask onto the photosensitive substrate via the projection optical system after the mask and the photosensitive substrate are moved relative to each other by an amount determined by the interval delta T with respect to the state in the preceding step; the step of measuring relative displacements between overlapping images of the first and second measurement patterns at
- US 2004212680 discloses a device for determining an intensity and/or color and/or sharpness profile in each case of an optical lens system, which projects a test pattern consisting of measuring fields, wherein the projection is directed indirectly or directly in each case toward a sensor area of electronic color and brightness sensors of high resolution, whose measured signals, which are correlated to the measuring fields, are sent to a computer, which determines from these the intensity and/or color and/or sharpness profile and/or distortion propagation profile, outputs them to an image processing system for an electronic image flaw correction of images that were generated by an identical lens system, and stores them or temporarily stores them on a data.
- US 6788401 discloses a lens inspection apparatus and an inspection sheet for evaluating the resolution of a lens at low cost.
- a lens inspection apparatus can include an inspection sheet having a test pattern, a sliding holding portion for holding the inspection sheet, a light source for introducing a light beam into the test pattern of the inspection sheet held by the sliding holding portion, a rotary holding portion for holding the sliding holding portion so that the sliding holding portion can rotate in a plane, and a measuring section for capturing an image projected on a screen through the inspection sheet and a projection lens to be inspected, and subjecting the image to image processing.
- the test pattern has a measuring region in which linear light-shielding portions are arranged in stripes so as to achieve a predetermined spatial frequency. By rotating the rotary holding portion, the resolution of the test pattern in which the light-shielding portions extend in different directions can be easily evaluated.
- US 6195159 discloses a system which determines one or more properties of a lens, which includes a light source and a target pattern illuminated by the light source, which illuminates and which is substantially positioned at a first conjugate position of the lens.
- a detector including an active surface, is positioned at a second conjugate position of the lens such that an image of the target pattern is formed on the active surface.
- the detector generates an analog electrical signal based on the image and the a generator converts the electrical signal to a representative digital signal for processing.
- the detector is movable relative to the lens to test the lens at plural focus positions, and plural detector output signals correspond to a feature of the target pattern at plural focus positions.
- a memory stores computer-executable process steps
- a processor executes the process steps stored in the memory so as to obtain a modulation transfer function value of the lens based on a position of the detector with respect to the lens, a rotational orientation of the lens about its optical axis, a color of the light and the lens distortion measured at a plurality of field positions.
- DE 10328145 discloses an imaging characteristics measuring method having a measured transparent object inserted in an imaging system, wherein the light is transmitted through the object used for providing images of relatively spaced raster structures at a receiver, and evaluating of the obtained images using the known relative positions of the raster structures and the receiver and the imaging characteristics of the imaging system.
- JP 2006195790 discloses a lens distortion estimation apparatus comprising: a feature point observation part for observing an image coordinate value showing an amount of time change of each image in an image coordinate system set time-series image of the subject acquired with a camera means; a factorization processing part for creating the matrix data from the image coordinate value to restore a camera viewpoint motion of the camera means and a three-dimensional form of the subject; and a parameter estimation part for acquiring a re-projection coordinate value from a restored camera viewpoint motion and three-dimensional form to estimate a lens distortion parameter of the camera means from the re-projection coordinate value and observed image coordinate value.
- An apparatus is for evaluating optical characteristics of an optical system based on an image forming position of a point image formed through the optical system.
- the apparatus includes a point image producing unit that has a plurality of point light sources arranged in a planar form, and forms a point image through the optical system in each of the point light sources; an imaging unit that images a plurality of the point images to produce a point image distribution image; and a moving unit that changes relative distance between the optical system and the point light source or the imaging unit in an optical axis direction of the optical system.
- the apparatus also includes an imaging control unit that controls the moving unit to change the relative distance, and controls the imaging unit to image the point image distribution image in every change of the relative distance; an image axis shape calculation unit (15) that performs processing of detecting an image forming position in each different relative distance of the point image based on image information of a plurality of the point image distribution images imaged at the different relative distance, the processing including calculating a regression expression for a plurality of detected image forming positions to obtain a shape parameter of the image axis determined by the regression expression in each of the plurality of point images; and an evaluation value calculation unit that fits a characteristic distribution model function representing distribution of the optical characteristics to the shape parameter in each of the plurality of point images, and calculates an evaluation value of the optical characteristics based on the fitting characteristics distribution model function.
- a method for evaluating optical characteristics of an optical system based on an image forming position of a point image formed through the optical system.
- the method includes forming a point image through the optical system in each of a plurality of point light sources arranged in a planar form; imaging a plurality of the point images by an imaging unit to produce a point image distribution image; changing relative distance between the optical system and the point light source or the imaging unit in an optical axis direction of the optical system; and controlling the imaging unit to image the point image distribution image in every change of the relative distance.
- the method also includes performing, in each of the plurality of point images, processing for detecting an image forming position in each different relative distance of the point image based on image information of a plurality of the point image distribution images imaged at the different relative distance, the processing including calculating a regression expression for a plurality of detected image forming positions to obtain a shape parameter of the image axis determined by the regression expression in each of the plurality of point images; fitting a characteristic distribution model function representing distribution of the optical characteristics to the shape parameter; and calculating an evaluation value of the optical characteristics based on the fitting characteristics distribution model function.
- a computer program product causes a computer to perform the method according to the present invention.
- the distribution of the optical characteristics of the optical system to be evaluated can be evaluated in a short time with high accuracy, and especially, at least one distribution of the telecentricity and the coma aberration of the optical system to be evaluated can be evaluated in a short time with high accuracy.
- FIG. 1 shows relevant parts of a lens evaluation apparatus 100, which is the optical system evaluation apparatus according to the first embodiment.
- the lens evaluation apparatus 100 is provided with a sample 4 in which a plurality of pin-holes are arranged in a planar form, a light source 1 as an illumination means for illuminating the sample 4, an optical fiber 2, a light intensity uniformization part 3, a Z axis stage 5 which is a movement means for holding the sample 4 and moving the sample 4 in the Z axis direction, and an XY stage 6 for moving the sample 4 in the X axis direction and the Y axis direction.
- the lens evaluation apparatus 100 is further provided with an image forming lens 7b which constitutes a microscope optical system 7 with an objective lens 7a as an optical system to be evaluated and forms an observation image of the sample 4, a lens barrel 11 holding the image forming lens 7b therein, a rotation part 8 which is provided in a bottom part of the lens barrel 11 and rotatably holds the objective lens 7a around an optical axis 9 thereof, an imaging device 10 which is provided in an upper part of the lens barrel 11 and images the observation image of the sample 4 formed by the microscope optical system 7, an up/down movable stage 12 which supports the lens barrel 11 movably in an up and down direction, and a mirror substrate 13 which supports the up/down movable stage 12.
- an image forming lens 7b which constitutes a microscope optical system 7 with an objective lens 7a as an optical system to be evaluated and forms an observation image of the sample 4
- a lens barrel 11 holding the image forming lens 7b therein a rotation part 8 which is provided in a bottom part of the lens barrel 11 and rotat
- the light source 1 includes a white light source (not shown), a wavelength selection mechanism, and a light intensity adjustment mechanism.
- a white light source for example a halogen lamp, a xenon lamp, an LED, or the like is used.
- the wavelength selection mechanism holds a plurality of interference filters, and is constituted by using a rotation holder which can selectively provide one of the interference filters in a light path.
- the light intensity adjustment mechanism is constituted by using for example a rotatable ND filter in which the transmittance can be continuously changed within a range of 0 to 100%.
- the wavelength selection mechanism and the light intensity adjustment mechanism are driven and controlled on the basis of a control signal from a control device 14 to be described later, and can arbitrarily set (select and switch) the central wave length of the light emitted from the light source 1 and the intensity within a predetermined range.
- the wavelength selection mechanism can be constituted by using other spectroscopic device.
- the light source 1 can be constituted by using a plurality of light sources emitting light having different wavelengths.
- the light emitted by the light source 1 is guided through the optical fiber 2, and thereafter uniformed in the intensity position and the angle distribution by the light intensity uniformization part 3 to trans-illuminate the sample 4.
- the light intensity uniformization part 3 is configured by using a rod glass, a diffusion plate, or the like in which internal reflection is repeated.
- the sample 4 is a pin-hole array specimen in which a plurality of pin-holes 4a are two-dimensionally arranged as shown in FIG. 2 .
- the pin-holes 4a arranged in a lattice pattern at an equal interval in the lateral and longitudinal directions are opened on an opaque metal film 4b evaporated on a glass substrate.
- the diameters of all the pin-holes 4a are the same and are smaller than the refraction limit of the objective lens 7a. Specifically, it is equivalent to or less than the resolution of the optical system to be evaluated.
- each pin-hole 4a acts as the point light source.
- the distribution range of the pin-holes 4a is made wider than the view field of the objective lens 7a as the optical system to be evaluated.
- the Z axis stage 5 moves the sample 4 up and down in the direction of the optical axis 9 of the microscope optical system 7.
- the optical axis 9 of the microscope optical system 7 is parallel to the Z axis.
- the Z axis stage 5 is constituted by using a piezo stage including an electrostatic capacity sensor for monitoring the amount of displacement and driven and controlled on the basis of a control signal from a control device 14 to be described later, and therefore can move the sample 4 to an arbitrary Z axis position in a predetermined range.
- An XY stage 6 is a manual stage which can move the Z axis stage 5 and the sample 4 in a direction perpendicular to the optical axis 9 of the microscopic optical system 7.
- the microscopic optical system 7 forms the observation image of the sample 4 on the imaging surface of an imaging device 10.
- the imaging device 10 is a two-dimensional imaging device, such as a two-dimensional CCD having an imaging surface which is larger than the image forming range of the observation image of the sample 4 formed by the microscopic optical system 7 or can image most part of the image forming range.
- the rotation part 8 can rotate and fix the objective lens 7a at an arbitrary angle using the optical axis 9 as the rotation axis.
- the lens evaluation apparatus 100 is further provided with the control device 14 which controls the entire processing and operation of the lens evaluation apparatus 100.
- the control device 14 is provided with an image axis shape calculation unit 15, an evaluation value calculation unit 16, a storage unit 17, and a control unit 18.
- the image axis shape calculation unit 15 calculates a shape parameter of an image axis to be described later in each pin-hole image, which is the observation image of the pin-holes 4a formed by the microscope optical system 7.
- the evaluation value calculation unit 16 fits a model function representing the distribution of the optical characteristics to be evaluated to the shape parameter of the image axis in each pin-hole image and calculates the evaluation value of the optical characteristics on the basis of the fitting model function.
- the storage unit 17 stores various information.
- the control unit 18 controls the processing and operation of each unit electrically connected to each other.
- the control unit 18 is electrically connected to the image axis shape calculation unit 15, the evaluation value calculation unit 16, and the storage unit 17, and in addition, electrically connected to the light source 1, the Z axis stage 5, the imaging device 10, and the like through an interface (not shown).
- the image axis shape calculation unit 15 is provided with a fitting range setting unit 15a and an intensity distribution fitting unit 15b.
- the fitting range setting unit 15a sets a fitting range where the intensity distribution model function for detecting the maximum intensity position in each pin-hole image is fitted.
- the intensity distribution fitting unit 15b fits the intensity distribution model function to a point image region on which the pin-hole image as the point image is imaged.
- the image axis shape calculation unit 15 is further provided with an intensity position calculation unit 15c and a curve fitting unit 15d.
- the intensity position calculation unit 15c detects a planar coordinate on the observation image with the maximum intensity distribution model function and calculates the maximum intensity position of the pin-hole image on the basis of the planar coordinate.
- the curve fitting unit 15d fits a curve model function to a plurality of the maximum intensity positions calculated at different positions in the Z axis direction and obtains a coefficient of the fitting curve model function as the shape parameter of the image axis determined by the fitting curve model function.
- the storage unit 17 stores image data of the observation image imaged by the imaging device 10 and the various information such as various processing parameters used for processing performed by the control unit 18. Especially, the storage unit 17 is provided with a control program storage unit 17a in which various control programs executed by the control unit 18 are stored and a model function storage unit 17b in which various model functions used for processing performed by the image axis shape calculation unit 15 or the evaluation value calculation unit 16 are stored.
- the control unit 18 executes the control program stored in the control program storage unit 17a and thereby controls the processing and operation of each unit. Specifically, the control unit 18 changes sequentially the relative distance between the sample 4 and the microscope optical system 7 in the direction of the optical axis 9 with the aid of the Z axis stage 5 to make the imaging device 10 image the pin-hole image of each pin-hole 4a in every change of the relative distance, and, thus, to control the production of the observation image. In addition, the control unit 18 controls the calculation of the evaluation value of the optical characteristics of the microscope optical system 7 by the image axis shape calculation unit 15 and the evaluation value calculation unit 16 on the basis of the image information of the observation images imaged at a different relative distance.
- the control device 14 is provided as a computer.
- the image axis shape calculation unit 15, the evaluation value calculation unit 16, and the control unit 18 are realized by a CPU.
- the storage unit 17 is realized by using a hard disk, ROM, RAM, and the like.
- the control device 14 further includes an input unit, a display unit, and an output unit which respectively perform the input, display, and output of various information.
- an operator mounts the objective lens 7a to be evaluated on the rotation part 8, and mounts the sample 4, in which the pin-holes 4a with a pin-hole diameter suitable for the objective lens 7a are formed, on the Z axis stage 5. Then, while the image to be imaged by the imaging device 10 is monitored on the screen of the display unit of the control device 14, positioning of the sample 4 on the XY stage 6 and focusing by the up/down movable stage 12 or the Z axis stage 5 are performed. This focusing may not be performed manually, but may be performed automatically by providing, for example, an automatic focusing unit in the lens evaluation apparatus 100.
- the control unit 18 of the control device 14 controls the automatic imaging of a stack image in each wavelength.
- the stack image represents a series of the observation images (observation image group), which have been sequentially imaged at a different relative distance by the imaging device 10 while the Z axis stage 5 changes sequentially the relative distance between the sample 4 and the objective lens 7a.
- the plurality of wavelengths represent a reference wavelength, which is a reference in the evaluation of the telecentricity and a coma aberration as the optical characteristics of the microscope optical system 7, and a plurality of evaluation wavelengths to be evaluated.
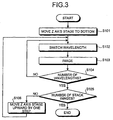
- FIG. 3 is a flowchart showing an imaging processing procedure for obtaining the stack image of a plurality of wavelengths by the execution of the imaging program by the control unit 18.
- the control unit 18 first moves the Z axis stage 5 from the focusing position (the above-mentioned position after focusing) to the bottom of the imaging range (step S101).
- the imaging range in the Z axis direction is desirably set to be several times of focal depth in such a way as to include the respective ranges of the field curvature and chromatic aberration in the longitudinal direction of the objective lens 7a to be evaluated.
- the control unit 18 switches an interference filter of the wavelength selection mechanism in the light source 1 and switches the illumination light to one wavelength in which the observation image is not imaged yet in the current Z axis stage position, among the plurality of wavelengths (step S102).
- the control unit 18 switches the light amount of the illumination light, applied to the sample 4, to an appropriate light amount by an ND filter (light amount adjustment mechanism) in the light source 1. This light amount is set in advance in such a way that the respective brightness of the stack image by the plurality of wavelengths is matched to the same level.
- control unit 18 makes the imaging device 10 image the observation image of the sample 4, and the imaging device 10 then transfers the image file to the control device 14 (step S103).
- the transferred image file is stored in the storage unit 17 in the control device 14.
- control unit 18 determines whether the steps S102 and S103 are applied to all of the plurality of wavelengths in the current Z axis stage position, in other words, determines whether the number of the wavelength used for imaging has reached a predetermined number (step S104).
- the control unit 18 proceeds to a step S105, while when the number has not reached the predetermined number (S104: No), the processing from the step S102 is repeated.
- the processings in the steps S102 and S103 are repeated until the number of the wavelength used for imaging has reached the predetermined number, whereby the image file of the observation image of each of the plurality of wavelengths in the current Z axis stage position is transferred to the control device 14 to be stored in the storage unit 17.
- the control unit 18 determines whether the number of the image file of each wavelength stored in the storage unit 17 has reached the number of the stack image covering a predetermined imaging range in the Z axis direction (step S105).
- the control unit 18 terminates the imaging processing, while when the number has not reached the number of the stack image (S105: No), the control unit 18 moves the Z axis stage 5 upward by one step (step S106), and thereafter, repeats the processing from the step S102.
- the movement amount of one step is desirably about 1/5 to 1/10 of the focal depth of the objective lens 7a to be evaluated.
- the steps S102 through S104 and S106 are repeated until the step S105 is satisfied, whereby, as the stack images, all the image files of the plurality of wavelengths for the number of stack images covering the predetermined imaging range in the Z axis direction are stored in the storage unit 17.
- the processing for sequentially switching the plurality of wavelengths every time the Z axis stage 5 is moved upward by one step to image the observation image of each wavelength is repeated, whereby the stack images with the plurality of wavelengths are simultaneously imaged.
- the drift of the position of the sample 4 progressing within a series of imaging processing time due to the change of environmental temperature or the like becomes almost the same in each wavelength. This is effective in reducing an error in the calculation of the telecentricity and the coma aberration, which is described later.
- This analysis program is a part of the control program stored in the control program storage unit 17a and controls to automatically calculate the evaluation value between the telecentricity and the coma aberration, which are the optical characteristics of the microscopic optical system 7 including the objective lens 7a, from the image file of the stack image stored in the storage unit 17.
- FIG. 4 is a flowchart showing an analysis processing procedure for calculating the evaluation values of the telecentricity and the coma aberration of the microscope optical system 7 by the execution of the analysis program by the control unit 18.
- the control unit 18 first reads the stack image of one length, in which the shape of the image axis is not obtained yet in the plurality of wavelengths, from the image file stored in the storage unit 17 (step S111).
- the control unit 18 makes the image axis shape calculation unit 15 calculate the shape of the image axis from one pin-hole image within the imaging range of the stack image of one wavelength, in which the shape of the image axis is not obtained yet (step S112).
- the shape of the image axis represents a relational expression of the movement amount of the pin-hole image in the X and Y axes directions in the imaging position to the movement amount in the Z axis direction of the sample 4.
- a sampling interval of imaging (a pixel interval of the imaging device 10) is approximately 1/5 to 1/10 of the size of the pin-hole image, the shape of the image axis cannot be obtained with high accuracy simply by retrieving for a pixel position with the maximum brightness. Therefore, in the step S112, the shape of the image axis is calculated according to the procedure shown in FIG. 5 .
- FIG. 5 is a flowchart showing a calculation processing procedure for calculating the shape of the image axis.
- the fitting range setting unit 15a first sets a range where an intensity distribution model function is fitted to a pin-hole image as the aerial image (step S121).
- to fit means to apply.
- the intensity of the pin-hole image gradually decreases as the pin-hole image is farther from the maximum intensity position.
- the fitting range of the longitudinal direction (Z axis direction) is assumed to be the focal depth of the objective lens 7a.
- the fitting range of the lateral direction (X and Y axes directions) is assumed to be within 1/2 of the radius of an airy disk.
- the fitting range setting unit 15a retrieves a pixel with the maximum brightness from the image region where the pin-hole image is imaged on the stack image.
- a sampling point included within the cylindrical fitting range with the pixel position as the center is made a fitting target, which is described below.
- the fitting range may also be finely adjusted by increasing or reducing the values.
- the intensity distribution fitting unit 15b fits the intensity distribution model function I(x, y) (step S122).
- the leaf image means each observation image included in the stack image.
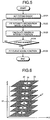
- FIG. 6 is a view showing the stack image in one pin-hole image.
- a cross section 22 of the pin-hole image is sampled (imaged) in each leaf image 23 for each Z axis position.
- the intensity distribution model function I(x, y) of the cross section 22 is fitted to the sampling point within the fitting range of one leaf image 23 by the least square method.
- the rotation-symmetrical two-dimensional Gaussian distribution function represented by the following equation (1), is adopted as the intensity distribution model function which can be easily fitted to the intensity distribution in the neighborhood of the maximum intensity position.
- I x y I max ⁇ exp ⁇ b 2 x ⁇ x c 2 + y ⁇ y c 2
- the intensity position calculation unit 15c calculates the maximum intensity position (x c , y c ) of one leaf image 23 from the fitting intensity distribution model function I(x, y) (step S123).
- the calculated maximum intensity position (x c , y c ) is also planar coordinates of the maximum value of the fitting intensity distribution model function I(x, y).
- the maximum intensity position (x c , y c ) of one leaf image can be obtained with higher accuracy than the sampling interval in the original X and Y axes directions.
- the sampling interval in the original X and Y axes directions is, for example, a sampling interval on the object side, which is determined by the pixel interval of the imaging device 10 and the lateral magnification of an optical system to be evaluated.
- the intensity position calculation unit 15c calculates the maximum intensity position (x c , y c ), alternatively a pixel with the maximum brightness value is retrieved from the sampling points within the fitting range of one leaf image, and the position of the brightness value is calculated.
- the control unit 18 determines whether the intensity distribution model function I(x, y) is fitted to all the leaf images included in the fitting range of the longitudinal direction, in other words, whether the number of the leaf images to which the intensity distribution model function I(x, y) is fitted has reached a predetermined fitting number (step S124).
- the control unit 18 proceeds to a step S125, while when the number has not reached the predetermined fitting number (S124: No), the processing from the step 122 is repeated.
- the maximum intensity position (x c , y c ) of each of the leaf images included in the fitting range of the longitudinal direction can be calculated.
- a position 24 of each leaf image 23 represents the maximum intensity position (x c , y c ) of each obtained leaf image.
- the curve fitting unit 15d fits a linear model function, which is a curve model function and represented by the following equations (2) and (3), to each component of the maximum intensity position (x c (z), y c (z)) of each leaf image as a function of Z axis coordinates by the least square method and calculates a straight line corresponding to the regression expression defining the image axis corresponding to the telecentricity (step S125).
- a linear model function which is a curve model function and represented by the following equations (2) and (3), to each component of the maximum intensity position (x c (z), y c (z)) of each leaf image as a function of Z axis coordinates by the least square method and calculates a straight line corresponding to the regression expression defining the image axis corresponding to the telecentricity (step S125).
- the inclination of the image axis by nontelecentricity can be approximated by the above straight line:
- x c z a x ⁇ z + b
- the curve fitting unit 15d fits a quadratic curve model function, which is a curve model function and represented by the following equations (4) and (5), to each component of the maximum intensity position (x c (z), y c (z)) of each leaf image by the least square method and calculates the quadratic curve corresponding to the regression expression defining the image axis corresponding to the coma aberration.
- the quadratic coefficients c x , c y of the respective quadratic curves represent the curvature of the image axis. When the coma aberration is small, the curvature of the image axis is approximately proportional to the coma aberration.
- the curve fitting unit 15d converts the inclination of the image axis a x and a y as the shape parameter of the image axis and the curvatures c x and c y which have been calculated as above described to the real coordinates on the object side or the image side, according to need.
- the sampling interval in the Z axis direction is converted into the step movement interval (unit: ⁇ m) of the Z axis stage 5.
- the sampling interval in the X and Y axes directions is converted into a value obtained by dividing the pixel interval (unit: ⁇ m) of the imaging device 10 by the lateral magnification of the microscope optical system 7. It is usually sufficient for this lateral magnification to be a design value of the microscope optical system 7. The same applies to the conversion to the real coordinates on the image side. Thereby, the calculation of one shape of the axis image is terminated.
- one shape of the image axis can be obtained with higher accuracy than the original sampling interval in the lens evaluation apparatus 100.
- the calculation processing procedure of the shape of the image axis shown in FIG. 5 has an advantage that such a complex transformation can be absorbed by the combination of relatively simple intensity distribution model functions.
- the control unit 18 determines whether the shape of the axis image is obtained in all the pin-hole images within the imaging range of the stack image of one wavelength, in other words, whether the number of the pin-hole images in which the shape of the image axis has been obtained, has reached the predetermined number (step S113).
- the control unit 18 proceeds to a step S114, while when the number has not reached the predetermined number (S113: No), the step 112 is repeated.
- S112 by repeating S112 until the step 113 is satisfied, all the shape of the image axis are calculated from all the pin-holes within the imaging range of the stack image with one wavelength.
- the control unit 18 determines whether the shape of the image axis corresponding to each pin-hole image is calculated for all of a plurality of wavelengths, in other words, whether the number of the wavelength in which the shape of the image axis of each pin-hole image is obtained has reached the predetermined number (step S114).
- the control unit 18 proceeds to a step S115, while when the number has not reached the predetermined number (S114: No), the processing from the step S111 is repeated.
- all the shapes of the image axis within the imaging range of each of the stack images with a plurality of wavelengths can be calculated. In other words, the distribution of the shape of the image axis of each wavelength can be calculated.
- control unit 18 makes the evaluation value calculation unit 16 calculate the evaluation equation showing each distribution of the telecentricity and the coma aberration, and accordingly calculates the evaluation value of the telecentricity and the coma aberration on the basis of the obtained evaluation equation (step S115).
- FIGS. 7A and 7B show an object side telecentric optical system as the optical system to be evaluated.
- a diaphragm 32 of an optical system 31 to be evaluated is disposed on a rear focal surface 35.
- FIG. 7A when a center position 33 of the diaphragm 32 is sifted from an optical axis 34 in the lateral direction (X and Y axes directions), a main beam 40 connecting the corresponding object point 38 and image point 39 is tilted to the optical axis 34 on the object side.
- the position of the image point 39 on the image surface 37 is not changed (however, this movement causes the blur of the image).
- the position of the image point 39 on the image surface 37 is shifted in the lateral direction.
- the shift in the lateral direction causes the inclination of the image axis.
- the relation between a lateral shift amount ⁇ and a vertical shift amount ⁇ of the center position 33 of the diaphragm 32 and inclination a on the object side of the main beam 40 is represented by the following equation (6) using the inclination a on the image side of the main beam 40, a position r of the object point 38, and focal length f of the optical system 31 to be evaluated.
- the inclination a and the position r are respectively represented by the following equations (7) and (8).
- the lateral shift amount ⁇ is represented by the following equation (9) using its X component ⁇ and Y component ⁇ .
- the inclination on the object side of the main beam 40 in other words, the inclination of the image axis a x and a y is represented by the primary expression in the X and Y axes directions.
- the linear model functions as characteristic distribution model functions represented by the following equations (10-1) and (10-2) are respectively fitted to the combination of the corresponding object point coordinates (x, y) and the inclination of the image axis ( a x , a y ) by the least square method, whereby the evaluation equation showing the distribution of the telecentricity can be obtained.
- a x Ax + B
- a y Ay + D
- the vertical shift amount ⁇ is preferably the average between the coefficients A and C for example.
- A ⁇ ⁇ / f 2
- D ⁇ / f
- the evaluation value calculation unit 16 calculates the evaluation value of the inclination of the image axis ( a x , a y ) corresponding to an arbitrary object coordinates (x, y) from the evaluation equation, obtained as above described, showing the distribution of the telecentricity.
- the evaluation value calculation unit 16 further can calculate the lateral shift amount ⁇ and the vertical shift amount ⁇ of the diaphragm of the objective lens 7a as the optical system to be evaluated by using the focal length f of the objective lens 7a.
- the distribution of the coma aberration is represented by the primary expression in the X and Y axes directions.
- the linear model functions as the characteristic distribution model functions represented by the following equations (12-1) and (12-2) are respectively fitted to the combination of the object point coordinates (x, y) and the curvature of the image axis (c x , c y ) by the least square method, whereby the evaluation equation showing the distribution of the coma aberration can be obtained.
- the evaluation value calculation unit 16 can obtain the evaluation value of the curvature of the image axis (c x , c y ) corresponding to the arbitrary object point coordinates (x, y) from the evaluation equation, obtained as above described, showing the distribution of the coma aberration.
- the evaluation value calculation unit 16 subtracts the shape of the image axis with the reference wavelength, obtained by the steps S111 to S114, from one shape of the image axis with the evaluation wavelength obtained by the steps S111 to S114. This calculation is applied to all the shapes of the image axis. Thereby, the evaluation value calculation unit 16 calculates the distributions of a difference of the inclination of the image axis ⁇ a x (x, y) and ⁇ a y (x, y) and the distributions of a difference of the curvature of the image axis ⁇ c x (x, y) and ⁇ c y (x, y) as the function of the object coordinates (x, y) (step S116).
- the distributions of the difference of the inclination of the image axis ⁇ a x (x, y) and ⁇ a y (x, y) and the distributions of the difference of the curvature of the image axis ⁇ c x (x, y) and ⁇ c y (x, y) are represented by the primary expression in the X and Y axes directions.
- the evaluation value calculation unit 16 fits the linear model function represented by the equations (10-1) and (10-2) to the combination of the corresponding object point coordinates (x, y) and the difference of the inclination of the image axis ( ⁇ a x , ⁇ a y ) by the least square method to obtain the evaluation equation of the difference of the telecentricity.
- the evaluation value calculation unit 16 fits the linear model function represented by the equations (12-1) and (12-2) to the combination of the corresponding object point coordinates (x, y) and the difference of the curvature of the image axis ( ⁇ c x , ⁇ c y ) by the least square method to obtain the evaluation equation of the difference of the coma aberration.
- the evaluation value calculation unit 16 can calculate the evaluation value of the difference of the inclination of the image axis and the evaluation value of the difference of the curvature of the image axis respectively corresponding to the arbitrary object point coordinates (x, y).
- a drift component such as a sample position progressing in the imaging time of the stack image is measured as the shape of the image axis.
- this drift component is eliminated by averaging the above-mentioned difference, whereby only the wavelength dependence of the telecentricity and the coma aberration is evaluated.
- the evaluation equation of each difference of the telecentricity and the coma aberration may be calculated by the difference of each evaluation equation of the telecentricity and the coma aberration calculated by the step S115.
- the control unit 18 determines whether the steps S115 and S116 are applied to all the plurality of wavelengths, in other words, whether the number of the wavelength used for the calculation of the evaluation equation has reached the predetermined number (step S117).
- the control unit 18 terminates the analysis processing, while when the number has not reached the predetermined number (S117: No), the processing from the step S115 is repeated.
- the steps S115 and S116 are repeated until the S117 is satisfied, whereby the respective evaluation equations of the telecentricity and the coma aberration with respect to the plurality of wavelengths can be calculated.
- Each shape of the image axis has measurement errors due to the error in the amount of movement of the Z axis stage 5, the error of imaging position calculation, and the like.
- the measurement errors of each shape of the image axis are balanced out by each other, whereby the respective evaluation equations of the telecentricity and the coma aberration can be obtained with high accuracy.
- the lens evaluation apparatus 100 in order to evaluate the distribution of the telecentricity and the distribution of the coma aberration in a single objective lens 7a, it is effective to add the following procedure.
- a component attributable to the objective lens 7a is rotated and moved upon the rotation of the objective lens 7a.
- the operation is described below with reference to FIG. 8 .
- the movement of the X and Y coordinates accompanying the rotation of the objective lens 7a draws the locus of a circle 45.
- the center 46 of the circle 45 does not always coincide with the center 47 of the view field.
- the difference 48 between both is a component attributable to the errors in the disposition of the optical system other than the objective lens 7a and devices.
- the radius 49 of the circle 45 is a component attributable to the objective lens 7a.
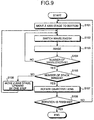
- steps S107 and S109 are added in a flowchart shown in FIG. 3 , whereby the stack images while the objective lens 7a is rotated is obtained.
- the objective lens 7a is rotated by 180° by the rotation part 8, and the same measurement is then performed.
- the average of the parameters of the X and Y coordinates of both is a component attributable to other than the objective lens 7a. 1/2 of the difference between both is a component attributable to the objective lens 7a.
- the rotation angle is divided, and the measurement is performed, for example, the center 46 and radius 49 of the circle 45 are calculated at four rotation positions of 0°, 90°, 180° and 270°, both components can be separated with further higher accuracy.
- the other parameters (vertical shift amount of a diaphragm), included in the respective evaluation equations of the distribution of the telecentricity and the distribution of the coma aberration never change accompanying the rotation of the objective lens 7a.
- the measurement errors of these values can be improved by averaging the plurality of measurement values.
- the drift of the positions of the sample 4 and the like progressing in the imaging time is also measured as the shape of the image axis.
- a measure using the following reciprocating measurement is effective.
- the shape of the image axis is calculated from the respective stack images of the forward path and the backward path.
- the shape of the image axis attributable to the telecentricity and the coma aberration is common to the forward path and the backward path, the inclination caused by the linear drift is inverted.
- the telecentricity and coma aberration and the drift components can be separated by taking the sum of both or the difference.
- the calculation of the shape of the image axis according to such a reciprocating change of the relative distance is performed one or more times, especially a plurality of times, whereby the error of the evaluation value can be further reduced.
- the lens evaluation apparatus 100 as the optical system evaluation apparatus according to the first embodiment has a plurality of pin-holes 4a as the point light sources arranged in a planar form, and is provided with the sample 4, which is a point image production means for forming, for each pin-hole 4a, a pin-hole image as the point image through the optical system to be evaluated, the light source 1, the optical fiber 2, the light intensity uniformization part 3, the image forming lens 7b, the imaging device 10, which images the plurality of pin-hole images to produce the observation image as the point image distribution image, the Z axis stage 5 as the movement means for changing the relative distance between the optical system to be evaluated and the sample 4 in the optical axis direction of the optical system to be evaluated, the control unit 18 which makes the Z axis stage 5 change the relative distance and makes the imaging device 10 image the observation image in every change of the relative distance, the image axis shape calculation unit 15 which, on the basis of the image information of the stack images which are formed from the plurality of the observation images formed at a different
- the evaluation value calculation unit 16 especially, fits the model function as the characteristic distribution model function representing at least one distribution of the telecentricity and the coma aberration to calculate the evaluation equation showing at lease one distribution of the telecentricity and the coma aberration as the distribution of the optical characteristics of the optical system to be evaluated, and, thus, to calculate the evaluation value on the basis of this evaluation equation.
- the lens evaluation apparatus 100 can evaluate the distribution of the optical characteristics of the optical system to be evaluated in a short time with high accuracy. Specifically, even when one pin-hole image cannot be imaged with particularly large number of pixels, the evaluation can be performed with high accuracy. In addition, in the lens evaluation apparatus 100, a laser length measuring machine with nm-order accuracy for monitoring the image forming position of the pin-hole image and the like is not required, whereby the high precision evaluation can be realized by simple and inexpensive configuration.
- the sample 4 is moved on the Z axis stage 5 in the optical direction, and the telecentricity on the object side is then evaluated; however, alternatively the imaging device 10 is moved in the optical axis direction, and the similar imaging processing and analysis processing are then performed, whereby the telecentricity on the image side can be evaluated.
- the imaging device 10 is moved in the optical axis direction, and the similar imaging processing and analysis processing are then performed, whereby the telecentricity on the image side can be evaluated.
- the interval of the step movement amount is not required to be constant.
- the sample 4 trans-illuminated by the light source 1 may have another form.
- it may be an incident end of an optical fiber, an illuminant like a fluorescent bead, or the like which are arranged in a planar form.
- the pin-hole array specimen as shown in FIG. 2 is assumed to "negative", its "positive” specimen can also be used. Specifically, a specimen in which only the parts of the metal film 4b corresponding to the pin-holes 4a in FIG. 2 are left and the other parts of metal film 4b are removed can be used.
- each metal film 4b can be regarded to be a plurality of point light sources when such a specimen is epi-illuminated.
- an illuminant with a single wavelength such as a light-emitting diode array can also be used. It is desirable for the size of this point light source to be equal to or less than the resolution of the optical system to be evaluated.
- FIG. 10 shows a relevant configuration of a fluorescent confocal microscope 200 as the optical system evaluation apparatus according to the second embodiment.
- the fluorescent confocal microscope 200 is provided with a laser light source 51, a dichroic mirror 53, an XY scanner 54, a total reflection mirror 55, an objective lens system 56, a sample 57, a Z axis stage 58, a confocal optical system 59, a light detection system 60, a control unit 61, a computer 62, and a display unit 63.
- the illumination light (excitation light) from the laser light source 51 for selectively emitting laser beams with a plurality of wavelengths is collected to the focal position of the sample 57 by the objective lens system 56 via the XY scanner 54 and the total reflection mirror 55.
- the reflection light (fluorescent) from the sample 57 is branched and reflected by the dichroic mirror 53, which is provided between the XY scanner 54 and the laser light source 51, via the objective lens system 56 and the total reflector 55 and is then received by the light detection system 60 via the confocal optical system 59.
- only reflection light from the focal position on the sample 57 is incident on the light detection system 60 by the confocal effect of the confocal optical system 59.
- the incident light is photoelectrically converted by the light detection system 60 to be transmitted to the computer 62 as brightness information.
- the XY scanner 54 is constituted by using an X galvano-mirror for swinging the luminous flux of the illumination light from the laser light source 51 to the X axis direction and a Y galvano-mirror for swinging the luminous flux to the Y axis direction perpendicular to the X axis direction, and can scan the light converging position in the sample 57 in the X and Y axes directions that are perpendicular to each other against the optical axis of the objective lens system 56.
- the Z axis stage 58 moves the sample 57 in the Z axis direction as the optical axis direction with holding the sample 57 placed thereon.
- the Z axis stage 58 moves the sample 57 in the optical axis direction and therefore can move the focal position of the sample 57 in the optical axis direction.
- the computer 62 builds up the scan image of the sample 57 on the basis of the brightness information output from the light detection system 60 in accordance with the scanning through the sample 57 of the illumination light by the XY scanner 54.
- the built scan image can be viewed by displaying it on the display unit 63.
- the computer 62 is provided with an image axis shape calculation unit, an evaluation value calculation unit, a storage unit, and a control unit (not shown) as with the control device 14 according to the first embodiment.
- the control unit 61 controls the laser light source 51, the XY scanner 54, the Z axis stage 58, and the like, which are connected to each other, on the basis of instructions of the computer 62.
- the sample 57 is a specimen having a plurality of reflective pin-holes formed therein in which only the parts of the metal film 4b corresponding to the pin-holes 4a shown in FIG. 2 are left and the other parts of the metal film 4b are removed.
- the metal film 4b is removed from the region other than the reflective pin-holes.
- the operator focuses a stack image by the Z axis stage 58 while monitoring the observation image obtained by the scanning of the XY scanner 54 on a display unit 63. Then, the CPU of the computer 62 starts executing an imaging program.
- This imaging program is a part of a control program recorded in the storage unit of the computer 62 and automatically controls to image the stack image with a plurality of wavelengths.
- the imaging processing procedure by this imaging program is described below with reference to FIG. 3 .
- the plurality of wavelengths can be alternatively oscillated from the laser light source 51 in accordance with the control from the control unit 61.
- the control unit 61 first moves the Z axis stage 58 from the focus position (position after the focusing) to the bottom of the imaging range (step S101). It is desirable to set the imaging range in the Z axis direction to approximately several times of focal depth in such a way as to include the field curvature and the chromatic aberration range in the longitudinal direction of the objective lens system 56 as the optical system to be evaluated.
- control unit 61 switches the wavelength of the laser light source 51, whereby switching the wavelength of the illumination light to one wavelength in which the observation image is not imaged yet in the current Z axis stage position, among the plurality of wavelengths (step S102).
- control unit 61 images the observation image of the sample 57 by the scanning of the XY scanner 54 to record the observation image in the storage unit of the computer 62 (step S103).
- the control unit 61 determines whether steps S112 and S113 are applied to all the plurality of wavelengths in the current Z axis stage position, in other words, whether the number of the wavelengths used for the imaging has reached the predetermined number (step S104).
- the control unit 61 proceeds to a step S105, while when the number has not reached the predetermined number (S104: No), the processing from S102 is repeated.
- the image files of the observation images of each of the plurality of wavelengths in the current Z axis stage position are stored in the storage unit of the computer 62.
- the control unit 61 determines whether the number of the image files of each wavelength stored in the storage unit of the computer 62 has reached the number of stack images covering a predetermined imaging range in the Z direction (Step S105).
- the control unit 61 terminates the imaging processing, while when the number has not reached the number of the stack images (S105: No), the Z axis stage 58 is moved upward by one step (step S106), and thereafter the processing from S102 is repeated.
- the movement amount of one step is desirably about 1/5 to 1/10 of the focal depth of the objective lens system 56 to be evaluated.
- the image files of each wavelength for the number of stack images covering the predetermined imaging range in the Z axis direction are stored as the stack images in the storage unit of the computer 62.
- the shape of the image axis corresponding to each pin-hole image is obtained by the analysis processing as in the lens evaluation apparatus 100, and, at the same time, the evaluation value of the distribution of the telecentricity and the distribution of the coma aberration as the distribution of the optical characteristics of the objective lens system 56 is calculated on the basis of the shape of the image axis. Accordingly, in the fluorescent confocal microscope 200, as with the lens evaluation apparatus 100, the distribution of the optical characteristics of the objective lens system 56 can be evaluated in a short time with high accuracy.
- the fluorescent confocal microscope 200 scans through the sample 57 by one light converging point
- the present invention is also applicable to a confocal microscope which uses a Nipknow disk or the like and scans through a sample by a plurality of light converging points.
- the excitation light and the fluorescent light are somewhat different in the fluorescent confocal microscope 200.
- the evaluation is performed by only excitation light wavelengths; however, when a plurality of fluorescent bead samples arranged in a planar form is adopted as the sample 57 with a point light source array, it is possible to realize more accurate evaluation including a wavelength difference between the excitation light and the fluorescent light.
- a point light source array may be formed by the trans-illumination, using a pin-hole array specimen.
- an arbitrary evaluation wavelength can be set to be different from a laser light source, the shape of the image axis and the distribution of the optical characteristics can be evaluated by a fluorescent light wavelength or the intermediate wavelength between the excitation light and the fluorescent light.
- the optical system evaluation apparatus can also be applied to optical systems other than a microscope.
- the optical system other than a microscope there are various image-forming optical systems including a reflection system, a catadioptric system, or the like, in addition to a lens system (refracting system).
- a lens system refracting system
- appropriate point light sources are required.
- This also applies to the step movement amount and movement range of a movement mechanism for imaging a stack image. The requirements necessary in that case is already clear from the above description.
- the processing procedure for calculating the evaluation equations of the respective distributions of the telecentricity and the coma aberration from the stack image the same one as in the microscopic optical system can be applied.
Landscapes
- Physics & Mathematics (AREA)
- Chemical & Material Sciences (AREA)
- Analytical Chemistry (AREA)
- General Physics & Mathematics (AREA)
- Geometry (AREA)
- Length Measuring Devices By Optical Means (AREA)
- Testing Of Optical Devices Or Fibers (AREA)
Description
- The present invention relates to an optical system evaluation apparatus, which evaluates optical characteristics of an optical system to be evaluated on the basis of an image forming position of a point image formed through the optical system and an optical system evaluation method.
- In general, when an image imaged by using an optical system is used for length measurement, the optical system is required to have high telecentricity. The telecentricity represents a state in which all main beams at the object side or an image side are parallel to an optical axis, regardless of the distance from the optical axis. By way of example, an object-side telecentric optical system is used in a length measuring microscope. In this case, even if an object to be imaged is moved away from the focus position, the image forming position corresponding to an arbitrary point on the object is not changed. Thus, it is possible to measure the distance between two points on the object with high accuracy without depending on the focusing state or a placement position of the object.
- In the prior art, as the evaluation apparatus for an optical system, there has been known especially the evaluation apparatus which evaluates resolution of lens (e.g., see Japanese Patent Application Laid-Open No.
2004-163207 FIG. 11. FIG. 11 shows an example of evaluating an image-side telecentric optical system. - As shown in
FIG. 11 , in the prior art optical system evaluation apparatus, a pin-hole 71 as a point light source is provided on an object surface of anoptical system 72 to be evaluated, and is illuminated from behind by an illumination means (not shown). Apoint image 73 as the aerial image of the pin-hole 71 is formed on the image surface of theoptical system 72 to be evaluated. However, since thispoint image 73 is small, it is difficult to measure the image forming position with the maximum intensity with high accuracy even if thepoint image 73 is directly imaged by an imaging device. Therefore, the image enlarged by an enlargementoptical system 74 is imaged by theimaging device 75. Thus, the image forming position of thepoint image 73 can be determined by retrieving a pixel with the maximum brightness from the image region in which the enlarged image is imaged. - Further, images are sequentially imaged while moving the enlargement
optical system 74 and theimaging device 75 in the optical axis direction (Z axis direction) of theoptical system 72 to be evaluated and a pixel with the maximum brightness is retrieved from each image sequentially imaged, whereby it is possible to detect the lateral shift of the X and Y coordinates of the image forming position accompanying the change of the Z coordinates. Further, the tendency of the change of the lateral shift with respect to the Z coordinates is calculated, whereby the telecentricity corresponding to thepoint image 73 can be evaluated. Moreover, this measurement is applied to a plurality of thepoint images 73, whereby the distribution of image-side telecentricity of theoptical system 72 to be evaluated can be evaluated. - However, in order to calculate the X, Y and Z coordinates of the image forming position of the
point image 73, the respective positions of the enlargementoptical system 74 and theimaging device 75 should be monitored by a triaxial measuring instrument. Meanwhile, in order to evaluate the distribution of the telecentricity in the entire view field of theoptical system 72 to be evaluated, the image should be measured while moving the pin-hole 71 to a plurality of positions on the object surface. In this case, the X and Y coordinates of the pin-hole 71 should also be monitored by the length measuring instrument. - There has been known that the coma aberration influences the tendency of the change of the lateral shift of the image forming position with respect to the Z coordinates. When there is no coma aberration, the lateral shift of the image forming position is linearly changed with respect to the Z coordinates, while as the coma aberration is increased, the lateral shift is changed in a curved line.
- However, such a method, in which the image forming position of the point image for one pin-hole is calculated for each of a plurality of positions on the image surface, requires monitoring the position of the pin-hole and the position of an enlarged optical system for observation of point images by measuring means, resulting in reduced accuracy of estimation of optical characteristics depending on the measurement accuracy of the measuring means. Furthermore, according to the method, the measurement while moving the pin-hole takes a long time to complete measuring the whole view field, and is difficult to maintain the stability of the optical system to be estimated and the optical system estimation apparatus during the measurement, resulting in reduced accuracy of estimation.
WO 2003/091685 A1 discloses a method and apparatus for testing optical characteristics of a Device-Under-Test (DUT). A wavefront from a light source is directed through a Hartmann plate, and the location of intersection of the rays of light passing through the Hartmann plate onto a measurement plane are measured at a plurality of optical path locations. Then, the DUT is located in the system and the locations of the rays on the measurement plane are again measured with the DUT forming part of the system at each of the plurality of optical paths. The transverse aberration due to the DUT for the ray at each measurement plane is determined by comparing the measurements of the rays for each location with and without the DUT. Several coefficients, which are the product of a combination of optical characteristics and the optical distance between the measurement plane and the appropriate principal plane of the DUT are calculated from estimates of the coefficients for each measurement plane and the optical distances between respective measurement planes. The transverse aberration is dependant upon the distance from the principal plane to the measurement plane. This distance is unknown, so characteristic-distance parameters are calculated for two measurement planes and compared. Thereby, principal planes for an optical system may be calculated taking into account effects of the spherical power, cylindrical power, prism, spherical aberration, and coma coefficients and their orientation.
US 5661816 discloses a system for quickly measuring and displaying in real-time a variety of performance characteristics of optical components such as lenses. The system is video based and is under the control of a computer which uses a windowing software program to provide the user with a graphical user interface by which the various components of the system and test lenses may be characterized and operated on through functions available via the interface. Lens performance measurements such as line spread and modulation transfer functions can be graphically and numerically displayed in real-time and/or recorded on other output devices or as files in computer memory.
US 5402224 discloses a method for inspecting distortion characteristics of a projection optical system to be inspected by arranging a mask formed with measurement patterns at a plurality of predetermined positions on the object surface side of the projection optical system, transferring projected images of the plurality of measurement patterns onto a photosensitive substrate arranged on the image surface side of the projection optical system, and detecting transfer images of the measurement-patterns, including: the step of exposing a mask, on which pairs of first and second measurement patterns are arranged adjacent to each other to be separated by a predetermined interval delta T in one direction at positions on the mask corresponding to a plurality of points at which distortion amounts are to be inspected in a projection view field of the projection optical system, onto the photosensitive substrate via the projection optical system; the step of exposing the mask onto the photosensitive substrate via the projection optical system after the mask and the photosensitive substrate are moved relative to each other by an amount determined by the interval delta T with respect to the state in the preceding step; the step of measuring relative displacements between overlapping images of the first and second measurement patterns at different image height points in the projection view field of the projection optical system; and the step of calculating a value obtained by sequentially accumulating the measured relative displacements in units of image height values as a distortion amount at the corresponding image height point.
US 2004212680 discloses a device for determining an intensity and/or color and/or sharpness profile in each case of an optical lens system, which projects a test pattern consisting of measuring fields, wherein the projection is directed indirectly or directly in each case toward a sensor area of electronic color and brightness sensors of high resolution, whose measured signals, which are correlated to the measuring fields, are sent to a computer, which determines from these the intensity and/or color and/or sharpness profile and/or distortion propagation profile, outputs them to an image processing system for an electronic image flaw correction of images that were generated by an identical lens system, and stores them or temporarily stores them on a data.
US 6788401 discloses a lens inspection apparatus and an inspection sheet for evaluating the resolution of a lens at low cost. A lens inspection apparatus can include an inspection sheet having a test pattern, a sliding holding portion for holding the inspection sheet, a light source for introducing a light beam into the test pattern of the inspection sheet held by the sliding holding portion, a rotary holding portion for holding the sliding holding portion so that the sliding holding portion can rotate in a plane, and a measuring section for capturing an image projected on a screen through the inspection sheet and a projection lens to be inspected, and subjecting the image to image processing. The test pattern has a measuring region in which linear light-shielding portions are arranged in stripes so as to achieve a predetermined spatial frequency. By rotating the rotary holding portion, the resolution of the test pattern in which the light-shielding portions extend in different directions can be easily evaluated.
US 6195159 discloses a system which determines one or more properties of a lens, which includes a light source and a target pattern illuminated by the light source, which illuminates and which is substantially positioned at a first conjugate position of the lens. A detector, including an active surface, is positioned at a second conjugate position of the lens such that an image of the target pattern is formed on the active surface. The detector generates an analog electrical signal based on the image and the a generator converts the electrical signal to a representative digital signal for processing. In the system, the detector is movable relative to the lens to test the lens at plural focus positions, and plural detector output signals correspond to a feature of the target pattern at plural focus positions. A memory stores computer-executable process steps, and a processor executes the process steps stored in the memory so as to obtain a modulation transfer function value of the lens based on a position of the detector with respect to the lens, a rotational orientation of the lens about its optical axis, a color of the light and the lens distortion measured at a plurality of field positions.
DE 10328145 discloses an imaging characteristics measuring method having a measured transparent object inserted in an imaging system, wherein the light is transmitted through the object used for providing images of relatively spaced raster structures at a receiver, and evaluating of the obtained images using the known relative positions of the raster structures and the receiver and the imaging characteristics of the imaging system.
JP 2006195790 - In view of the above-mentioned problems, an apparatus according to
claim 1, a method according toclaim 23, and a computer according toclaim 36 are provided. - An apparatus according to an aspect of the present invention is for evaluating optical characteristics of an optical system based on an image forming position of a point image formed through the optical system. The apparatus includes a point image producing unit that has a plurality of point light sources arranged in a planar form, and forms a point image through the optical system in each of the point light sources; an imaging unit that images a plurality of the point images to produce a point image distribution image; and a moving unit that changes relative distance between the optical system and the point light source or the imaging unit in an optical axis direction of the optical system. The apparatus also includes an imaging control unit that controls the moving unit to change the relative distance, and controls the imaging unit to image the point image distribution image in every change of the relative distance; an image axis shape calculation unit (15) that performs processing of detecting an image forming position in each different relative distance of the point image based on image information of a plurality of the point image distribution images imaged at the different relative distance, the processing including calculating a regression expression for a plurality of detected image forming positions to obtain a shape parameter of the image axis determined by the regression expression in each of the plurality of point images; and an evaluation value calculation unit that fits a characteristic distribution model function representing distribution of the optical characteristics to the shape parameter in each of the plurality of point images, and calculates an evaluation value of the optical characteristics based on the fitting characteristics distribution model function.
- A method according to another aspect of the present invention is for evaluating optical characteristics of an optical system based on an image forming position of a point image formed through the optical system. The method includes forming a point image through the optical system in each of a plurality of point light sources arranged in a planar form; imaging a plurality of the point images by an imaging unit to produce a point image distribution image; changing relative distance between the optical system and the point light source or the imaging unit in an optical axis direction of the optical system; and controlling the imaging unit to image the point image distribution image in every change of the relative distance. The method also includes performing, in each of the plurality of point images, processing for detecting an image forming position in each different relative distance of the point image based on image information of a plurality of the point image distribution images imaged at the different relative distance, the processing including calculating a regression expression for a plurality of detected image forming positions to obtain a shape parameter of the image axis determined by the regression expression in each of the plurality of point images; fitting a characteristic distribution model function representing distribution of the optical characteristics to the shape parameter; and calculating an evaluation value of the optical characteristics based on the fitting characteristics distribution model function.
- A computer program product according to still another aspect of the present invention causes a computer to perform the method according to the present invention.
- According to the apparatus, method, and computer program product, the distribution of the optical characteristics of the optical system to be evaluated can be evaluated in a short time with high accuracy, and especially, at least one distribution of the telecentricity and the coma aberration of the optical system to be evaluated can be evaluated in a short time with high accuracy.
- The above and other objects, features, advantages and technical and industrial significance of this invention will be better understood by reading the following detailed description of presently preferred embodiments of the invention, when considered in connection with the accompanying drawings.
-
-
FIG. 1 is a diagram showing a configuration of an optical system evaluation apparatus according to the first embodiment of the present invention; -
FIG. 2 is a view showing a pin-hole array specimen; -
FIG. 3 is a flowchart showing an imaging processing procedure of a stack image; -
FIG. 4 is a flowchart showing an analysis processing procedure for obtaining distribution of optical characteristics; -
FIG. 5 is a flowchart showing a processing procedure for calculating a shape of an image axis; -
FIG. 6 is a view for explaining the calculation processing of the shape of the image axis; -
FIGS. 7A and 7B are views for explaining telecentricity; -
FIG. 8 is a view for explaining the operation of a rotation part; -
FIG. 9 is a flowchart showing a processing procedure for imaging the stack image, including a rotation processing; -
FIG. 10 is a diagram showing a configuration of an optical system evaluation apparatus according to the second embodiment of the present invention; and -
FIG. 11 is a view showing a configuration of the prior art optical system evaluation apparatus. - Exemplary embodiments of an apparatus and a method for evaluating an optical system, according to the present invention, will be described in detail below with reference to the drawings. Note that the present invention is not limited to these embodiments. The same components are assigned the same reference numerals.
- First, an optical system evaluation apparatus according to a first embodiment of the present invention is described.
FIG. 1 shows relevant parts of alens evaluation apparatus 100, which is the optical system evaluation apparatus according to the first embodiment. As shown inFIG. 1 , thelens evaluation apparatus 100 is provided with asample 4 in which a plurality of pin-holes are arranged in a planar form, alight source 1 as an illumination means for illuminating thesample 4, anoptical fiber 2, a light intensity uniformization part 3, aZ axis stage 5 which is a movement means for holding thesample 4 and moving thesample 4 in the Z axis direction, and anXY stage 6 for moving thesample 4 in the X axis direction and the Y axis direction. - The
lens evaluation apparatus 100 is further provided with animage forming lens 7b which constitutes a microscopeoptical system 7 with anobjective lens 7a as an optical system to be evaluated and forms an observation image of thesample 4, alens barrel 11 holding theimage forming lens 7b therein, a rotation part 8 which is provided in a bottom part of thelens barrel 11 and rotatably holds theobjective lens 7a around anoptical axis 9 thereof, animaging device 10 which is provided in an upper part of thelens barrel 11 and images the observation image of thesample 4 formed by the microscopeoptical system 7, an up/downmovable stage 12 which supports thelens barrel 11 movably in an up and down direction, and amirror substrate 13 which supports the up/downmovable stage 12. - The
light source 1 includes a white light source (not shown), a wavelength selection mechanism, and a light intensity adjustment mechanism. As the white light source, for example a halogen lamp, a xenon lamp, an LED, or the like is used. The wavelength selection mechanism holds a plurality of interference filters, and is constituted by using a rotation holder which can selectively provide one of the interference filters in a light path. The light intensity adjustment mechanism is constituted by using for example a rotatable ND filter in which the transmittance can be continuously changed within a range of 0 to 100%. The wavelength selection mechanism and the light intensity adjustment mechanism are driven and controlled on the basis of a control signal from acontrol device 14 to be described later, and can arbitrarily set (select and switch) the central wave length of the light emitted from thelight source 1 and the intensity within a predetermined range. The wavelength selection mechanism can be constituted by using other spectroscopic device. Thelight source 1 can be constituted by using a plurality of light sources emitting light having different wavelengths. - The light emitted by the
light source 1 is guided through theoptical fiber 2, and thereafter uniformed in the intensity position and the angle distribution by the light intensity uniformization part 3 to trans-illuminate thesample 4. The light intensity uniformization part 3 is configured by using a rod glass, a diffusion plate, or the like in which internal reflection is repeated. - The
sample 4 is a pin-hole array specimen in which a plurality of pin-holes 4a are two-dimensionally arranged as shown inFIG. 2 . The pin-holes 4a arranged in a lattice pattern at an equal interval in the lateral and longitudinal directions are opened on anopaque metal film 4b evaporated on a glass substrate. The diameters of all the pin-holes 4a are the same and are smaller than the refraction limit of theobjective lens 7a. Specifically, it is equivalent to or less than the resolution of the optical system to be evaluated. Thus, in addition to the function of the optical intensity uniformization part 3, light whose intensity angle distribution is almost uniformed in a range wider than the angular aperture of theobjective lens 7a is emitted from each pin-hole 4a, whereby each pin-hole 4a acts as the point light source. The distribution range of the pin-holes 4a is made wider than the view field of theobjective lens 7a as the optical system to be evaluated. - The
Z axis stage 5 moves thesample 4 up and down in the direction of theoptical axis 9 of the microscopeoptical system 7. In thelens evaluation apparatus 100, theoptical axis 9 of the microscopeoptical system 7 is parallel to the Z axis. TheZ axis stage 5 is constituted by using a piezo stage including an electrostatic capacity sensor for monitoring the amount of displacement and driven and controlled on the basis of a control signal from acontrol device 14 to be described later, and therefore can move thesample 4 to an arbitrary Z axis position in a predetermined range. AnXY stage 6 is a manual stage which can move theZ axis stage 5 and thesample 4 in a direction perpendicular to theoptical axis 9 of the microscopicoptical system 7. - The microscopic
optical system 7 forms the observation image of thesample 4 on the imaging surface of animaging device 10. Theimaging device 10 is a two-dimensional imaging device, such as a two-dimensional CCD having an imaging surface which is larger than the image forming range of the observation image of thesample 4 formed by the microscopicoptical system 7 or can image most part of the image forming range. The rotation part 8 can rotate and fix theobjective lens 7a at an arbitrary angle using theoptical axis 9 as the rotation axis. - The
lens evaluation apparatus 100 is further provided with thecontrol device 14 which controls the entire processing and operation of thelens evaluation apparatus 100. Thecontrol device 14 is provided with an image axisshape calculation unit 15, an evaluationvalue calculation unit 16, astorage unit 17, and acontrol unit 18. The image axisshape calculation unit 15 calculates a shape parameter of an image axis to be described later in each pin-hole image, which is the observation image of the pin-holes 4a formed by the microscopeoptical system 7. The evaluationvalue calculation unit 16 fits a model function representing the distribution of the optical characteristics to be evaluated to the shape parameter of the image axis in each pin-hole image and calculates the evaluation value of the optical characteristics on the basis of the fitting model function. Thestorage unit 17 stores various information. Thecontrol unit 18 controls the processing and operation of each unit electrically connected to each other. Thecontrol unit 18 is electrically connected to the image axisshape calculation unit 15, the evaluationvalue calculation unit 16, and thestorage unit 17, and in addition, electrically connected to thelight source 1, theZ axis stage 5, theimaging device 10, and the like through an interface (not shown). - The image axis
shape calculation unit 15 is provided with a fittingrange setting unit 15a and an intensitydistribution fitting unit 15b. The fittingrange setting unit 15a sets a fitting range where the intensity distribution model function for detecting the maximum intensity position in each pin-hole image is fitted. Regarding the observation image imaged by theimaging device 10, in the observation image corresponding to the fitting range set by the fittingrange setting unit 15a, the intensitydistribution fitting unit 15b fits the intensity distribution model function to a point image region on which the pin-hole image as the point image is imaged. The image axisshape calculation unit 15 is further provided with an intensityposition calculation unit 15c and a curvefitting unit 15d. The intensityposition calculation unit 15c detects a planar coordinate on the observation image with the maximum intensity distribution model function and calculates the maximum intensity position of the pin-hole image on the basis of the planar coordinate. The curvefitting unit 15d fits a curve model function to a plurality of the maximum intensity positions calculated at different positions in the Z axis direction and obtains a coefficient of the fitting curve model function as the shape parameter of the image axis determined by the fitting curve model function. - The
storage unit 17 stores image data of the observation image imaged by theimaging device 10 and the various information such as various processing parameters used for processing performed by thecontrol unit 18. Especially, thestorage unit 17 is provided with a controlprogram storage unit 17a in which various control programs executed by thecontrol unit 18 are stored and a modelfunction storage unit 17b in which various model functions used for processing performed by the image axisshape calculation unit 15 or the evaluationvalue calculation unit 16 are stored. - The
control unit 18 executes the control program stored in the controlprogram storage unit 17a and thereby controls the processing and operation of each unit. Specifically, thecontrol unit 18 changes sequentially the relative distance between thesample 4 and the microscopeoptical system 7 in the direction of theoptical axis 9 with the aid of theZ axis stage 5 to make theimaging device 10 image the pin-hole image of each pin-hole 4a in every change of the relative distance, and, thus, to control the production of the observation image. In addition, thecontrol unit 18 controls the calculation of the evaluation value of the optical characteristics of the microscopeoptical system 7 by the image axisshape calculation unit 15 and the evaluationvalue calculation unit 16 on the basis of the image information of the observation images imaged at a different relative distance. - The
control device 14 is provided as a computer. The image axisshape calculation unit 15, the evaluationvalue calculation unit 16, and thecontrol unit 18 are realized by a CPU. Thestorage unit 17 is realized by using a hard disk, ROM, RAM, and the like. Thecontrol device 14 further includes an input unit, a display unit, and an output unit which respectively perform the input, display, and output of various information. - Next, the operation of the
lens evaluation apparatus 100 is described. First, an operator mounts theobjective lens 7a to be evaluated on the rotation part 8, and mounts thesample 4, in which the pin-holes 4a with a pin-hole diameter suitable for theobjective lens 7a are formed, on theZ axis stage 5. Then, while the image to be imaged by theimaging device 10 is monitored on the screen of the display unit of thecontrol device 14, positioning of thesample 4 on theXY stage 6 and focusing by the up/downmovable stage 12 or theZ axis stage 5 are performed. This focusing may not be performed manually, but may be performed automatically by providing, for example, an automatic focusing unit in thelens evaluation apparatus 100. - After focusing in this manner, the execution of a predetermined imaging program is started by the
control unit 18 of thecontrol device 14. This imaging program is a part of the control program stored in the controlprogram storage unit 17a and controls the automatic imaging of a stack image in each wavelength. The stack image represents a series of the observation images (observation image group), which have been sequentially imaged at a different relative distance by theimaging device 10 while theZ axis stage 5 changes sequentially the relative distance between thesample 4 and theobjective lens 7a. The plurality of wavelengths represent a reference wavelength, which is a reference in the evaluation of the telecentricity and a coma aberration as the optical characteristics of the microscopeoptical system 7, and a plurality of evaluation wavelengths to be evaluated. -
FIG. 3 is a flowchart showing an imaging processing procedure for obtaining the stack image of a plurality of wavelengths by the execution of the imaging program by thecontrol unit 18. As shown inFIG. 3 , thecontrol unit 18 first moves theZ axis stage 5 from the focusing position (the above-mentioned position after focusing) to the bottom of the imaging range (step S101). The imaging range in the Z axis direction is desirably set to be several times of focal depth in such a way as to include the respective ranges of the field curvature and chromatic aberration in the longitudinal direction of theobjective lens 7a to be evaluated. - Subsequently, the
control unit 18 switches an interference filter of the wavelength selection mechanism in thelight source 1 and switches the illumination light to one wavelength in which the observation image is not imaged yet in the current Z axis stage position, among the plurality of wavelengths (step S102). In addition, in the step S102, thecontrol unit 18 switches the light amount of the illumination light, applied to thesample 4, to an appropriate light amount by an ND filter (light amount adjustment mechanism) in thelight source 1. This light amount is set in advance in such a way that the respective brightness of the stack image by the plurality of wavelengths is matched to the same level. - Subsequently, the
control unit 18 makes theimaging device 10 image the observation image of thesample 4, and theimaging device 10 then transfers the image file to the control device 14 (step S103). The transferred image file is stored in thestorage unit 17 in thecontrol device 14. - Subsequently, the
control unit 18 determines whether the steps S102 and S103 are applied to all of the plurality of wavelengths in the current Z axis stage position, in other words, determines whether the number of the wavelength used for imaging has reached a predetermined number (step S104). When the number of the wavelength has reached the predetermined number (S104: Yes), thecontrol unit 18 proceeds to a step S105, while when the number has not reached the predetermined number (S104: No), the processing from the step S102 is repeated. As described above, the processings in the steps S102 and S103 are repeated until the number of the wavelength used for imaging has reached the predetermined number, whereby the image file of the observation image of each of the plurality of wavelengths in the current Z axis stage position is transferred to thecontrol device 14 to be stored in thestorage unit 17. - Subsequently, the
control unit 18 determines whether the number of the image file of each wavelength stored in thestorage unit 17 has reached the number of the stack image covering a predetermined imaging range in the Z axis direction (step S105). When the number has reached the number of the stack images (S105: Yes), thecontrol unit 18 terminates the imaging processing, while when the number has not reached the number of the stack image (S105: No), thecontrol unit 18 moves theZ axis stage 5 upward by one step (step S106), and thereafter, repeats the processing from the step S102. The movement amount of one step is desirably about 1/5 to 1/10 of the focal depth of theobjective lens 7a to be evaluated. - As described above, the steps S102 through S104 and S106 are repeated until the step S105 is satisfied, whereby, as the stack images, all the image files of the plurality of wavelengths for the number of stack images covering the predetermined imaging range in the Z axis direction are stored in the
storage unit 17. - In this imaging processing procedure, the processing for sequentially switching the plurality of wavelengths every time the
Z axis stage 5 is moved upward by one step to image the observation image of each wavelength is repeated, whereby the stack images with the plurality of wavelengths are simultaneously imaged. Thus, the drift of the position of thesample 4 progressing within a series of imaging processing time due to the change of environmental temperature or the like becomes almost the same in each wavelength. This is effective in reducing an error in the calculation of the telecentricity and the coma aberration, which is described later. - Next, a predetermined analysis program executed by the
control unit 18 of thecontrol device 14 is started. This analysis program is a part of the control program stored in the controlprogram storage unit 17a and controls to automatically calculate the evaluation value between the telecentricity and the coma aberration, which are the optical characteristics of the microscopicoptical system 7 including theobjective lens 7a, from the image file of the stack image stored in thestorage unit 17. -
FIG. 4 is a flowchart showing an analysis processing procedure for calculating the evaluation values of the telecentricity and the coma aberration of the microscopeoptical system 7 by the execution of the analysis program by thecontrol unit 18. As shown inFIG. 4 , thecontrol unit 18 first reads the stack image of one length, in which the shape of the image axis is not obtained yet in the plurality of wavelengths, from the image file stored in the storage unit 17 (step S111). - Subsequently, the
control unit 18 makes the image axisshape calculation unit 15 calculate the shape of the image axis from one pin-hole image within the imaging range of the stack image of one wavelength, in which the shape of the image axis is not obtained yet (step S112). The shape of the image axis represents a relational expression of the movement amount of the pin-hole image in the X and Y axes directions in the imaging position to the movement amount in the Z axis direction of thesample 4. However, since a sampling interval of imaging (a pixel interval of the imaging device 10) is approximately 1/5 to 1/10 of the size of the pin-hole image, the shape of the image axis cannot be obtained with high accuracy simply by retrieving for a pixel position with the maximum brightness. Therefore, in the step S112, the shape of the image axis is calculated according to the procedure shown inFIG. 5 . -
FIG. 5 is a flowchart showing a calculation processing procedure for calculating the shape of the image axis. As shown inFIG. 5 , the fittingrange setting unit 15a first sets a range where an intensity distribution model function is fitted to a pin-hole image as the aerial image (step S121). Here, to fit means to apply. - The intensity of the pin-hole image gradually decreases as the pin-hole image is farther from the maximum intensity position. In the neighborhood of the maximum intensity, since the change monotonously decreases and is gradual, it is easy to fit a simple intensity distribution model. In this case, the fitting range of the longitudinal direction (Z axis direction) is assumed to be the focal depth of the
objective lens 7a. The fitting range of the lateral direction (X and Y axes directions) is assumed to be within 1/2 of the radius of an airy disk. These values can be calculated to be λ/NA2 and 0.3λ/NA, respectively, with the numerical aperture NA of theobjective lens 7a to be evaluated and the wavelength λ of the illumination light. - Firstly, the fitting
range setting unit 15a retrieves a pixel with the maximum brightness from the image region where the pin-hole image is imaged on the stack image. A sampling point included within the cylindrical fitting range with the pixel position as the center is made a fitting target, which is described below. The fitting range may also be finely adjusted by increasing or reducing the values. - Subsequently, in order to calculate the maximum intensity Imax of one, to which the intensity distribution model function is not fitted yet, of the leaf images included in the fitting range of the longitudinal direction and its maximum intensity position (xc, yc), the intensity
distribution fitting unit 15b fits the intensity distribution model function I(x, y) (step S122). Here, the leaf image means each observation image included in the stack image. -
FIG. 6 is a view showing the stack image in one pin-hole image. In thisstack image 21, across section 22 of the pin-hole image is sampled (imaged) in eachleaf image 23 for each Z axis position. The intensity distribution model function I(x, y) of thecross section 22 is fitted to the sampling point within the fitting range of oneleaf image 23 by the least square method. In this embodiment, the rotation-symmetrical two-dimensional Gaussian distribution function, represented by the following equation (1), is adopted as the intensity distribution model function which can be easily fitted to the intensity distribution in the neighborhood of the maximum intensity position.
- Then, the intensity
position calculation unit 15c calculates the maximum intensity position (xc, yc) of oneleaf image 23 from the fitting intensity distribution model function I(x, y) (step S123). The calculated maximum intensity position (xc, yc) is also planar coordinates of the maximum value of the fitting intensity distribution model function I(x, y). By such a calculation, the maximum intensity position (xc, yc) of one leaf image can be obtained with higher accuracy than the sampling interval in the original X and Y axes directions. The sampling interval in the original X and Y axes directions is, for example, a sampling interval on the object side, which is determined by the pixel interval of theimaging device 10 and the lateral magnification of an optical system to be evaluated. - Although in the step S123, on the basis of the intensity distribution model function I(x, y) fitted to the sampling point in the fitting range of one leaf image, the intensity
position calculation unit 15c calculates the maximum intensity position (xc, yc), alternatively a pixel with the maximum brightness value is retrieved from the sampling points within the fitting range of one leaf image, and the position of the brightness value is calculated. In this case, although in the latter, the accuracy of an image forming position to be calculated is inferior to the former, if there are a sufficient number of pin-holes 4a within an imaging view field, an evaluation equation which represents each distribution of the telecentricity and the coma aberration and where the error of each shape of the image axis is balanced out by each other can be obtained by the fitting of a model function, which is described later. When the pixel with the maximum brightness value is retrieved, the fitting range set in the step S121 is used as the retrieval range of the pixel with the maximum brightness value. - Then, the
control unit 18 determines whether the intensity distribution model function I(x, y) is fitted to all the leaf images included in the fitting range of the longitudinal direction, in other words, whether the number of the leaf images to which the intensity distribution model function I(x, y) is fitted has reached a predetermined fitting number (step S124). When the number of the leaf images has reached the predetermined fitting number (S124: Yes), thecontrol unit 18 proceeds to a step S125, while when the number has not reached the predetermined fitting number (S124: No), the processing from the step 122 is repeated. As described above, by repeating the steps S122 and S123 until the step S124 is satisfied, the maximum intensity position (xc, yc) of each of the leaf images included in the fitting range of the longitudinal direction can be calculated. InFIG. 6 , aposition 24 of eachleaf image 23 represents the maximum intensity position (xc, yc) of each obtained leaf image. - Subsequently, the
curve fitting unit 15d fits a linear model function, which is a curve model function and represented by the following equations (2) and (3), to each component of the maximum intensity position (xc(z), yc(z)) of each leaf image as a function of Z axis coordinates by the least square method and calculates a straight line corresponding to the regression expression defining the image axis corresponding to the telecentricity (step S125). As described below, the inclination of the image axis by nontelecentricity can be approximated by the above straight line:

- In the step S125, the
curve fitting unit 15d fits a quadratic curve model function, which is a curve model function and represented by the following equations (4) and (5), to each component of the maximum intensity position (xc(z), yc(z)) of each leaf image by the least square method and calculates the quadratic curve corresponding to the regression expression defining the image axis corresponding to the coma aberration. The quadratic coefficients cx, cy of the respective quadratic curves represent the curvature of the image axis. When the coma aberration is small, the curvature of the image axis is approximately proportional to the coma aberration.

- Further, the
curve fitting unit 15d converts the inclination of the image axis ax and ay as the shape parameter of the image axis and the curvatures cx and cy which have been calculated as above described to the real coordinates on the object side or the image side, according to need. In order to convert them into the real coordinates on the object side, the sampling interval in the Z axis direction is converted into the step movement interval (unit: µm) of theZ axis stage 5. The sampling interval in the X and Y axes directions is converted into a value obtained by dividing the pixel interval (unit: µm) of theimaging device 10 by the lateral magnification of the microscopeoptical system 7. It is usually sufficient for this lateral magnification to be a design value of the microscopeoptical system 7. The same applies to the conversion to the real coordinates on the image side. Thereby, the calculation of one shape of the axis image is terminated. - By the calculation processing procedure described above, one shape of the image axis can be obtained with higher accuracy than the original sampling interval in the
lens evaluation apparatus 100. In addition to this, there is also a method of directly fitting a three-dimensional intensity distribution model. However, in that case, it is difficult to follow the complex transformation of the pin-hole image. The calculation processing procedure of the shape of the image axis shown inFIG. 5 has an advantage that such a complex transformation can be absorbed by the combination of relatively simple intensity distribution model functions. - Returning to
FIG. 4 , thecontrol unit 18 determines whether the shape of the axis image is obtained in all the pin-hole images within the imaging range of the stack image of one wavelength, in other words, whether the number of the pin-hole images in which the shape of the image axis has been obtained, has reached the predetermined number (step S113). When the number of the pin-hole images has reached the predetermined number (S113: Yes), thecontrol unit 18 proceeds to a step S114, while when the number has not reached the predetermined number (S113: No), the step 112 is repeated. As described above, by repeating S112 until the step 113 is satisfied, all the shape of the image axis are calculated from all the pin-holes within the imaging range of the stack image with one wavelength. - Then, the
control unit 18 determines whether the shape of the image axis corresponding to each pin-hole image is calculated for all of a plurality of wavelengths, in other words, whether the number of the wavelength in which the shape of the image axis of each pin-hole image is obtained has reached the predetermined number (step S114). When the number of the wavelength has reached the predetermined number (S114: Yes), thecontrol unit 18 proceeds to a step S115, while when the number has not reached the predetermined number (S114: No), the processing from the step S111 is repeated. As described above, by repeating the steps S111 through S113 until the S114 is satisfied, all the shapes of the image axis within the imaging range of each of the stack images with a plurality of wavelengths can be calculated. In other words, the distribution of the shape of the image axis of each wavelength can be calculated. - Subsequently, the
control unit 18 makes the evaluationvalue calculation unit 16 calculate the evaluation equation showing each distribution of the telecentricity and the coma aberration, and accordingly calculates the evaluation value of the telecentricity and the coma aberration on the basis of the obtained evaluation equation (step S115). - Here, the evaluation equation showing the distribution of the telecentricity is described with reference to
FIGS. 7A and 7B. FIGS. 7A and 7B show an object side telecentric optical system as the optical system to be evaluated. Adiaphragm 32 of anoptical system 31 to be evaluated is disposed on a rearfocal surface 35. As shown inFIG. 7A , when acenter position 33 of thediaphragm 32 is sifted from anoptical axis 34 in the lateral direction (X and Y axes directions), amain beam 40 connecting thecorresponding object point 38 andimage point 39 is tilted to theoptical axis 34 on the object side. If theobject point 38 is moved along the tiltedmain beam 40, the position of theimage point 39 on theimage surface 37 is not changed (however, this movement causes the blur of the image). However, if theobject point 38 is moved in parallel to the optical axis 34 (in the Z axis direction), the position of theimage point 39 on theimage surface 37 is shifted in the lateral direction. The shift in the lateral direction causes the inclination of the image axis. When thediaphragm 32 is shifted in the lateral direction, all themain beams 41 on theobject surface 36 are tilted to theoptical axis 34 while being parallel to each other. - Meanwhile, as shown in
FIG. 7B , also when thecenter position 33 of thediaphragm 32 is shifted in the longitudinal direction (Z axis direction), themain beam 40 connecting thecorresponding object point 38 andimage point 39 is tilted to theoptical axis 34 on the object side. However, the inclination of eachmain beam 41 on theobject surface 36 is larger as themain beam 41 is farther from theoptical axis 34. According to the calculation using simple paraxial optics, the relation between a lateral shift amount Δρ and a vertical shift amount Δζ of thecenter position 33 of thediaphragm 32 and inclination a on the object side of themain beam 40 is represented by the following equation (6) using the inclination a on the image side of themain beam 40, a position r of theobject point 38, and focal length f of theoptical system 31 to be evaluated. The inclination a and the position r are respectively represented by the following equations (7) and (8). The lateral shift amount Δρ is represented by the following equation (9) using its X component Δξ and Y component Δη.


- Namely, the inclination on the object side of the
main beam 40, in other words, the inclination of the image axis ax and ay is represented by the primary expression in the X and Y axes directions. The linear model functions as characteristic distribution model functions represented by the following equations (10-1) and (10-2) are respectively fitted to the combination of the corresponding object point coordinates (x, y) and the inclination of the image axis (ax, ay ) by the least square method, whereby the evaluation equation showing the distribution of the telecentricity can be obtained.

- After the linear model function is fitted, the relational expression between the coefficient of the evaluation equation showing the distribution of the telecentricity and each parameter is obtained as the following equations (11-1) to (11-4). The vertical shift amount Δζ is preferably the average between the coefficients A and C for example.


- In the step S115, the evaluation
value calculation unit 16 calculates the evaluation value of the inclination of the image axis (ax, ay ) corresponding to an arbitrary object coordinates (x, y) from the evaluation equation, obtained as above described, showing the distribution of the telecentricity. The evaluationvalue calculation unit 16 further can calculate the lateral shift amount Δρ and the vertical shift amount Δζ of the diaphragm of theobjective lens 7a as the optical system to be evaluated by using the focal length f of theobjective lens 7a. - As with the telecentricity, the distribution of the coma aberration is represented by the primary expression in the X and Y axes directions. Thus, the linear model functions as the characteristic distribution model functions represented by the following equations (12-1) and (12-2) are respectively fitted to the combination of the object point coordinates (x, y) and the curvature of the image axis (cx, cy) by the least square method, whereby the evaluation equation showing the distribution of the coma aberration can be obtained.


- In the step S115, the evaluation
value calculation unit 16 can obtain the evaluation value of the curvature of the image axis (cx, cy) corresponding to the arbitrary object point coordinates (x, y) from the evaluation equation, obtained as above described, showing the distribution of the coma aberration. - Even when the distributions of the inclination of the image axis and the curvature are further complicated due to vignetting in the optical system to be evaluated, it is possible to cope with such a case by modifying the fitting characteristic distribution model function to an appropriate form.
- Then, the evaluation
value calculation unit 16 subtracts the shape of the image axis with the reference wavelength, obtained by the steps S111 to S114, from one shape of the image axis with the evaluation wavelength obtained by the steps S111 to S114. This calculation is applied to all the shapes of the image axis. Thereby, the evaluationvalue calculation unit 16 calculates the distributions of a difference of the inclination of the image axis Δax (x, y) and Δay (x, y) and the distributions of a difference of the curvature of the image axis Δcx (x, y) and Δcy (x, y) as the function of the object coordinates (x, y) (step S116). - The distributions of the difference of the inclination of the image axis Δax (x, y) and Δay (x, y) and the distributions of the difference of the curvature of the image axis Δcx(x, y) and Δcy(x, y) are represented by the primary expression in the X and Y axes directions. Thus, the evaluation
value calculation unit 16 fits the linear model function represented by the equations (10-1) and (10-2) to the combination of the corresponding object point coordinates (x, y) and the difference of the inclination of the image axis (Δax , Δay ) by the least square method to obtain the evaluation equation of the difference of the telecentricity. In addition, the evaluationvalue calculation unit 16 fits the linear model function represented by the equations (12-1) and (12-2) to the combination of the corresponding object point coordinates (x, y) and the difference of the curvature of the image axis (Δcx, Δcy) by the least square method to obtain the evaluation equation of the difference of the coma aberration. On the basis of those evaluation equations, the evaluationvalue calculation unit 16 can calculate the evaluation value of the difference of the inclination of the image axis and the evaluation value of the difference of the curvature of the image axis respectively corresponding to the arbitrary object point coordinates (x, y). - A drift component such as a sample position progressing in the imaging time of the stack image is measured as the shape of the image axis. However, since the stack images with the plurality of wavelengths are simultaneously imaged, this drift component is eliminated by averaging the above-mentioned difference, whereby only the wavelength dependence of the telecentricity and the coma aberration is evaluated. The evaluation equation of each difference of the telecentricity and the coma aberration may be calculated by the difference of each evaluation equation of the telecentricity and the coma aberration calculated by the step S115.
- Then, the
control unit 18 determines whether the steps S115 and S116 are applied to all the plurality of wavelengths, in other words, whether the number of the wavelength used for the calculation of the evaluation equation has reached the predetermined number (step S117). When the number of the wavelength has reached the predetermined number (S117: Yes), thecontrol unit 18 terminates the analysis processing, while when the number has not reached the predetermined number (S117: No), the processing from the step S115 is repeated. As described above, the steps S115 and S116 are repeated until the S117 is satisfied, whereby the respective evaluation equations of the telecentricity and the coma aberration with respect to the plurality of wavelengths can be calculated. - Each shape of the image axis has measurement errors due to the error in the amount of movement of the
Z axis stage 5, the error of imaging position calculation, and the like. However, by fitting to the characteristic distribution model function as described above, the measurement errors of each shape of the image axis are balanced out by each other, whereby the respective evaluation equations of the telecentricity and the coma aberration can be obtained with high accuracy. - Note that in the
lens evaluation apparatus 100, in order to evaluate the distribution of the telecentricity and the distribution of the coma aberration in a singleobjective lens 7a, it is effective to add the following procedure. - When the
objective lens 7a is rotated by the rotation part 8, regarding the parameter of the X and Y coordinates (e.g., the lateral shift amount of the diaphragm) included in the respective evaluation equations of the distribution of the telecentricity and the distribution of the coma aberration, a component attributable to theobjective lens 7a is rotated and moved upon the rotation of theobjective lens 7a. The operation is described below with reference toFIG. 8 . As shown inFIG. 8 , the movement of the X and Y coordinates accompanying the rotation of theobjective lens 7a draws the locus of acircle 45. In this case, thecenter 46 of thecircle 45 does not always coincide with thecenter 47 of the view field. Thedifference 48 between both is a component attributable to the errors in the disposition of the optical system other than theobjective lens 7a and devices. Theradius 49 of thecircle 45 is a component attributable to theobjective lens 7a. - As shown in
FIG. 9 , the processings in steps S107 and S109 are added in a flowchart shown inFIG. 3 , whereby the stack images while theobjective lens 7a is rotated is obtained. By way of example, theobjective lens 7a is rotated by 180° by the rotation part 8, and the same measurement is then performed. The average of the parameters of the X and Y coordinates of both is a component attributable to other than the objective lens 7a. 1/2 of the difference between both is a component attributable to theobjective lens 7a. Further, if the rotation angle is divided, and the measurement is performed, for example, thecenter 46 andradius 49 of thecircle 45 are calculated at four rotation positions of 0°, 90°, 180° and 270°, both components can be separated with further higher accuracy. The other parameters (vertical shift amount of a diaphragm), included in the respective evaluation equations of the distribution of the telecentricity and the distribution of the coma aberration never change accompanying the rotation of theobjective lens 7a. The measurement errors of these values can be improved by averaging the plurality of measurement values. - Additionally, the drift of the positions of the
sample 4 and the like progressing in the imaging time is also measured as the shape of the image axis. However, in many cases, since the lateral shift amount due to drift is changed substantially linearly within the imaging time, a measure using the following reciprocating measurement is effective. - In the imaging processing procedure shown in
FIG. 3 , the stack images of "forward path", in which the relative distance between thesample 4 and theobjective lens 7a is sequentially reduced as the Z axis stage is moved from the lower end to the upper end, is imaged. Subsequently, likewise, the stack image of "backward path", in which the relative distance between thesample 4 and theobjective lens 7a is sequentially increased as the Z axis stage is moved from the lower end to the upper end, is imaged. Then, the shape of the image axis is calculated from the respective stack images of the forward path and the backward path. Although the shape of the image axis attributable to the telecentricity and the coma aberration is common to the forward path and the backward path, the inclination caused by the linear drift is inverted. Thus, the telecentricity and coma aberration and the drift components can be separated by taking the sum of both or the difference. The calculation of the shape of the image axis according to such a reciprocating change of the relative distance is performed one or more times, especially a plurality of times, whereby the error of the evaluation value can be further reduced. - In addition, increasing the movement amount of one step of the
Z axis stage 5 and reducing the imaging time of the stack images are effective to reduce the drift component. - As described above, the lens evaluation apparatus 100 as the optical system evaluation apparatus according to the first embodiment has a plurality of pin-holes 4a as the point light sources arranged in a planar form, and is provided with the sample 4, which is a point image production means for forming, for each pin-hole 4a, a pin-hole image as the point image through the optical system to be evaluated, the light source 1, the optical fiber 2, the light intensity uniformization part 3, the image forming lens 7b, the imaging device 10, which images the plurality of pin-hole images to produce the observation image as the point image distribution image, the Z axis stage 5 as the movement means for changing the relative distance between the optical system to be evaluated and the sample 4 in the optical axis direction of the optical system to be evaluated, the control unit 18 which makes the Z axis stage 5 change the relative distance and makes the imaging device 10 image the observation image in every change of the relative distance, the image axis shape calculation unit 15 which, on the basis of the image information of the stack images which are formed from the plurality of the observation images formed at a different relative distance between the sample 4 and the objective lens 7a, detects the image forming position for each different relative distance of the pin-hole image as the point image, fits the curve model function to the plurality of detected image forming positions to calculate the regression expression, and performs processing for obtaining the shape parameter of the image axis determined by this regression expression for each pin-hole image, and the evaluation value calculation unit 16 which fits the characteristic distribution model function, representing the distribution of the optical characteristics of the optical system to be evaluated, to the shape parameter of the image axis in each pin-hole image and calculates the evaluation value of the optical characteristics of the optical system to be evaluated on the basis of the fitting characteristic distribution model function. The evaluation
value calculation unit 16, especially, fits the model function as the characteristic distribution model function representing at least one distribution of the telecentricity and the coma aberration to calculate the evaluation equation showing at lease one distribution of the telecentricity and the coma aberration as the distribution of the optical characteristics of the optical system to be evaluated, and, thus, to calculate the evaluation value on the basis of this evaluation equation. - Therefore, the
lens evaluation apparatus 100 can evaluate the distribution of the optical characteristics of the optical system to be evaluated in a short time with high accuracy. Specifically, even when one pin-hole image cannot be imaged with particularly large number of pixels, the evaluation can be performed with high accuracy. In addition, in thelens evaluation apparatus 100, a laser length measuring machine with nm-order accuracy for monitoring the image forming position of the pin-hole image and the like is not required, whereby the high precision evaluation can be realized by simple and inexpensive configuration. - In the first embodiment, the
sample 4 is moved on theZ axis stage 5 in the optical direction, and the telecentricity on the object side is then evaluated; however, alternatively theimaging device 10 is moved in the optical axis direction, and the similar imaging processing and analysis processing are then performed, whereby the telecentricity on the image side can be evaluated. As can be seen in the above processing procedure, if the step movement amount of theZ axis stage 5 is recorded as the numerical value, the interval of the step movement amount is not required to be constant. - As long as the
sample 4 trans-illuminated by thelight source 1 satisfies conditions of being a plurality of point light sources arranged in a planar form, it may have another form. For instance, it may be an incident end of an optical fiber, an illuminant like a fluorescent bead, or the like which are arranged in a planar form. If the pin-hole array specimen as shown inFIG. 2 is assumed to "negative", its "positive" specimen can also be used. Specifically, a specimen in which only the parts of themetal film 4b corresponding to the pin-holes 4a inFIG. 2 are left and the other parts ofmetal film 4b are removed can be used. This is because the reflection light from eachmetal film 4b can be regarded to be a plurality of point light sources when such a specimen is epi-illuminated. When evaluating by only one wavelength, an illuminant with a single wavelength, such as a light-emitting diode array can also be used. It is desirable for the size of this point light source to be equal to or less than the resolution of the optical system to be evaluated. - An optical system evaluation apparatus according to a second embodiment of the present invention is described below.
FIG. 10 shows a relevant configuration of a fluorescentconfocal microscope 200 as the optical system evaluation apparatus according to the second embodiment. As shown inFIG. 10 , the fluorescentconfocal microscope 200 is provided with alaser light source 51, adichroic mirror 53, anXY scanner 54, atotal reflection mirror 55, anobjective lens system 56, asample 57, aZ axis stage 58, a confocaloptical system 59, alight detection system 60, acontrol unit 61, acomputer 62, and adisplay unit 63. - The illumination light (excitation light) from the
laser light source 51 for selectively emitting laser beams with a plurality of wavelengths is collected to the focal position of thesample 57 by theobjective lens system 56 via theXY scanner 54 and thetotal reflection mirror 55. The reflection light (fluorescent) from thesample 57 is branched and reflected by thedichroic mirror 53, which is provided between theXY scanner 54 and thelaser light source 51, via theobjective lens system 56 and thetotal reflector 55 and is then received by thelight detection system 60 via the confocaloptical system 59. In this case, only reflection light from the focal position on thesample 57 is incident on thelight detection system 60 by the confocal effect of the confocaloptical system 59. The incident light is photoelectrically converted by thelight detection system 60 to be transmitted to thecomputer 62 as brightness information. - The
XY scanner 54 is constituted by using an X galvano-mirror for swinging the luminous flux of the illumination light from thelaser light source 51 to the X axis direction and a Y galvano-mirror for swinging the luminous flux to the Y axis direction perpendicular to the X axis direction, and can scan the light converging position in thesample 57 in the X and Y axes directions that are perpendicular to each other against the optical axis of theobjective lens system 56. - The
Z axis stage 58 moves thesample 57 in the Z axis direction as the optical axis direction with holding thesample 57 placed thereon. TheZ axis stage 58 moves thesample 57 in the optical axis direction and therefore can move the focal position of thesample 57 in the optical axis direction. - The
computer 62 builds up the scan image of thesample 57 on the basis of the brightness information output from thelight detection system 60 in accordance with the scanning through thesample 57 of the illumination light by theXY scanner 54. The built scan image can be viewed by displaying it on thedisplay unit 63. In addition, thecomputer 62 is provided with an image axis shape calculation unit, an evaluation value calculation unit, a storage unit, and a control unit (not shown) as with thecontrol device 14 according to the first embodiment. Thecontrol unit 61 controls thelaser light source 51, theXY scanner 54, theZ axis stage 58, and the like, which are connected to each other, on the basis of instructions of thecomputer 62. - Next, the processing for imaging the stack image, which is used for calculating the evaluation values of the shape of the image axis, in the fluorescent
confocal microscope 200 is described. In this case, thesample 57 is a specimen having a plurality of reflective pin-holes formed therein in which only the parts of themetal film 4b corresponding to the pin-holes 4a shown inFIG. 2 are left and the other parts of themetal film 4b are removed. Themetal film 4b is removed from the region other than the reflective pin-holes. - The operator focuses a stack image by the
Z axis stage 58 while monitoring the observation image obtained by the scanning of theXY scanner 54 on adisplay unit 63. Then, the CPU of thecomputer 62 starts executing an imaging program. This imaging program is a part of a control program recorded in the storage unit of thecomputer 62 and automatically controls to image the stack image with a plurality of wavelengths. The imaging processing procedure by this imaging program is described below with reference toFIG. 3 . The plurality of wavelengths can be alternatively oscillated from thelaser light source 51 in accordance with the control from thecontrol unit 61. - The
control unit 61 first moves theZ axis stage 58 from the focus position (position after the focusing) to the bottom of the imaging range (step S101). It is desirable to set the imaging range in the Z axis direction to approximately several times of focal depth in such a way as to include the field curvature and the chromatic aberration range in the longitudinal direction of theobjective lens system 56 as the optical system to be evaluated. - Then, the
control unit 61 switches the wavelength of thelaser light source 51, whereby switching the wavelength of the illumination light to one wavelength in which the observation image is not imaged yet in the current Z axis stage position, among the plurality of wavelengths (step S102). - Then, the
control unit 61 images the observation image of thesample 57 by the scanning of theXY scanner 54 to record the observation image in the storage unit of the computer 62 (step S103). - Then, the
control unit 61 determines whether steps S112 and S113 are applied to all the plurality of wavelengths in the current Z axis stage position, in other words, whether the number of the wavelengths used for the imaging has reached the predetermined number (step S104). When the number of the wavelengths has reached the predetermined number (S104: Yes), thecontrol unit 61 proceeds to a step S105, while when the number has not reached the predetermined number (S104: No), the processing from S102 is repeated. As described above, by repeating the steps S102 and S103 until the step S104 is satisfied, the image files of the observation images of each of the plurality of wavelengths in the current Z axis stage position are stored in the storage unit of thecomputer 62. - Then, the
control unit 61 determines whether the number of the image files of each wavelength stored in the storage unit of thecomputer 62 has reached the number of stack images covering a predetermined imaging range in the Z direction (Step S105). When the number of the image files has reached the number of the stack images (S105: Yes), thecontrol unit 61 terminates the imaging processing, while when the number has not reached the number of the stack images (S105: No), theZ axis stage 58 is moved upward by one step (step S106), and thereafter the processing from S102 is repeated. The movement amount of one step is desirably about 1/5 to 1/10 of the focal depth of theobjective lens system 56 to be evaluated. - As described above, by repeating the steps S102 through S104 and S106 until the step S105 is satisfied, the image files of each wavelength for the number of stack images covering the predetermined imaging range in the Z axis direction are stored as the stack images in the storage unit of the
computer 62. - In the fluorescent
confocal microscope 200, on the basis of the stack images imaged as above described, the shape of the image axis corresponding to each pin-hole image is obtained by the analysis processing as in thelens evaluation apparatus 100, and, at the same time, the evaluation value of the distribution of the telecentricity and the distribution of the coma aberration as the distribution of the optical characteristics of theobjective lens system 56 is calculated on the basis of the shape of the image axis. Accordingly, in the fluorescentconfocal microscope 200, as with thelens evaluation apparatus 100, the distribution of the optical characteristics of theobjective lens system 56 can be evaluated in a short time with high accuracy. - In the second embodiment, although the fluorescent
confocal microscope 200 scans through thesample 57 by one light converging point, the present invention is also applicable to a confocal microscope which uses a Nipknow disk or the like and scans through a sample by a plurality of light converging points. - The excitation light and the fluorescent light are somewhat different in the fluorescent
confocal microscope 200. In the second embodiment, the evaluation is performed by only excitation light wavelengths; however, when a plurality of fluorescent bead samples arranged in a planar form is adopted as thesample 57 with a point light source array, it is possible to realize more accurate evaluation including a wavelength difference between the excitation light and the fluorescent light. Alternatively, as in the first embodiment, a point light source array may be formed by the trans-illumination, using a pin-hole array specimen. In this case, since an arbitrary evaluation wavelength can be set to be different from a laser light source, the shape of the image axis and the distribution of the optical characteristics can be evaluated by a fluorescent light wavelength or the intermediate wavelength between the excitation light and the fluorescent light. - As the preferred embodiments of the present invention, the first and the second embodiments have been described; however, the present invention is not limited to these embodiments, various modifications can be made without departing from the scope of the invention.
- By way of example, the optical system evaluation apparatus according to the present invention can also be applied to optical systems other than a microscope. As the optical system other than a microscope, there are various image-forming optical systems including a reflection system, a catadioptric system, or the like, in addition to a lens system (refracting system). However, in that case, depending on the size of the view field and the resolution of an optical system to be evaluated, appropriate point light sources are required. This also applies to the step movement amount and movement range of a movement mechanism for imaging a stack image. The requirements necessary in that case is already clear from the above description. For the processing procedure for calculating the evaluation equations of the respective distributions of the telecentricity and the coma aberration from the stack image, the same one as in the microscopic optical system can be applied.
- Additional advantages and modifications will readily occur to those skilled in the art. Therefore, the invention in its broader aspects is not limited to the specific details and representative embodiments shown and described herein. Accordingly, various modifications may be made without departing from the spirit or scope of the general inventive concept as defined by the appended claims and their equivalents.
Claims (37)
- An apparatus (100) adapted for evaluating optical characteristics of an optical system (7) based on an image forming position of a point image that is formed from a point light source (4a) through the optical system (7), the apparatus (100) comprising:a point image producing unit (1 to 4; 4b) having a plurality of the point light sources (4a) positioned in a vicinity of an object surface of the optical system (7) and arranged in a planar form, and adapted to form a plurality of the point images through the optical system (7) from the point light sources (4a);an imaging unit (10) adapted to image a plurality of the point images to produce a point image distribution image;a moving unit (5, 12) adapted to change a relative distance(i) between the point light source (4a) and the optical system (7) or(ii) between the optical system (7) and the imaging unit (10)in an optical axis direction (9) of the optical system (7);an imaging control unit (18) adapted to control the moving unit (5) to change the relative distance (i) between the point light source (4a) and the optical system (7), or (ii) between the optical system (7) and the imaging unit (10) and adapted to control the imaging unit (10) to image the point image distribution image in every change of the relative distance (i) between the point light source (4a) and the optical system (7) or (ii) between the optical system (7) and the imaging unit (10);an image axis shape calculation unit (15) adapted to perform processing of detecting an image forming position in each different relative distance of the point image based on image information of a plurality of the point image distribution images imaged at the different relative distance,characterized in that the processing includes calculating a regression expression concerning the image forming position and the relative distance for each of the point images to obtain a shape parameter of the image axis determined by the regression expression in each of the plurality of point images; andan evaluation value calculation unit (16) adapted to fits a characteristic distribution model function representing distribution of the optical characteristics to the shape parameter in each of the plurality of point images, and adapted to calculate an evaluation value of the optical characteristics based on the fitting characteristics distribution model function.
- The apparatus (100) according to claim 1, wherein the characteristic distribution model function represents at least one distribution of telecentricity and coma aberration.
- The apparatus (100) according to claim 1, wherein the image axis shape calculation unit (15) includesan intensity distribution fitting unit (15b) adapted to fit an intensity distribution model function representing two-dimensional intensity distribution of a point image region in which the point image is imaged to the point image region in each of the point distribution images imaged at the different relative distance;an intensity position calculation unit (15c) adapted to detect a planar coordinate on the point image distribution image with the maximum intensity distribution model function fitted by the intensity distribution fitting unit (15b) in each of the point image distribution images imaged at the different relative distance, and adapted to calculate the maximum intensity position of the point image in the relative distance in which the point image distribution image is imaged as the image forming position of the point image, using the detected planar coordinate; anda curve fitting unit (15d) adapted to fit a curve model function as the regression expression to a plurality of the maximum intensity positions at each of the different relative distance and adapted to obtain a coefficient of the fitting curve model function as the shape parameter.
- The apparatus (100) according to claim 3, whereinthe image axis shape calculation unit (15) includes a range setting unit adapted to set a fitting range of the intensity distribution model function to the point image, andthe intensity distribution fitting unit (15b) is adapted to fit the intensity distribution model function to the point image region in each of the point distribution image imaged at the different relative distance within the fitting range.
- The apparatus (100) according to claim 3, wherein the intensity distribution model function is a two-dimensional Gaussian distribution function.
- The apparatus (100) according to claim 1, wherein the image axis shape calculation unit (15) includesan intensity position calculation unit (15c) adapted to detect a pixel position representing the maximum brightness in the point image region in which the point image is imaged in each of the image distribution images imaged at the different relative distance and adapted to calculate, as the image forming position of the point image, the maximum intensity position of the point image in the relative distance, in which the point image distribution image is imaged, on the basis of the detected pixel position; anda curve fitting unit (15d) adapted to fit a curve model function as the regression expression to a plurality of the maximum intensity positions in each of the different relative distance and adapted to obtain a coefficient of the fitting curve model function as the shape parameter.
- The apparatus (100) according to claim 6, whereinthe image axis shape calculation unit (15) includes a range setting unit adapted to set a retrieval range of the pixel position to the point image, andthe intensity position calculation unit (15c) is adapted to detect the pixel position in each of the point image distribution images imaged at the different relative distance within the retrieval range.
- The apparatus (100) according to any one of claims 3 to 7, wherein the curve model function is a linear model function representing a straight line.
- The apparatus (100) according to any one of claims 3 to 7, wherein the curve model function is a quadratic curve model function representing a quadratic curve.
- The apparatus (100) according to any one of claims 1 to 7, whereinthe point image production unit is adapted to make the point light source emit light in a plurality of wavelength ranges in a switchable manner and is adapted to form the point image in each of the light in the plurality of wavelength ranges,the imaging control unit (18) is adapted to control the point image production unit to sequentially form the point image with light in the plurality of wavelength ranges in every change of the relative distance by the moving unit (5) and is adapted to control the imaging unit (10) to image the point image distribution image in each light in the plurality of wavelength ranges,the image axis shape calculation unit (15) ia adapted to perform processing for obtaining the shape parameter in each of the plurality of point images in each of the light in the plurality of wavelength ranges and is adapted to calculate a difference parameter representing a difference between the respective shape parameters in light in a first wavelength range and light in a second wavelength range, regarding the light in the plurality of wavelength ranges, andthe evaluation value calculation unit (16) is adapted to fit a difference distribution model function, representing the distribution of the difference of the respective optical characteristics in the light in the first wavelength range and the light in the second wavelength range, to each of the difference parameters in each of the plurality of point images and is adapted to calculate the evaluation value of the difference of the optical characteristics based on the fitting difference distribution model function.
- The apparatus (100) according to any one of claims 1 to 7, further comprisinga rotation unit adapted to rotate a partial optical system, including at least one part of the optical system (7), around an optical axis of the partial optical system,wherein the evaluation value calculation unit (16) is adapted to calculate an evaluation value of the optical characteristics to difference rotation positions of the partial optical system by the rotation unit and is adapted to separate the evaluation values of the optical characteristics into a component corresponding to the partial optical system and a component corresponding to other than the partial optical system based on the plurality of the calculated evaluation values of the optical characteristics.
- The apparatus (100) according to any one of claims 1 to 7, whereinthe imaging control unit (18) is adapted to control the moving unit (5) to perform at least one time of reciprocating change in which the relative distance is increased and reduced within a predetermined range and is adapted to control the imaging unit (10) to image the point image distribution image in every change of the relative distance while increasing and reducing the relative distance,the image axis shape calculation unit (15) is adapted to obtain the shape parameters, respectively corresponding to the relative distance being increased and the relative distance being reduced, in each of the plurality of point images on the basis of image information of a plurality of the point image distribution images imaged while increasing and reducing the relative distance, andthe evaluation value calculation unit (16) is adapted to calculate the evaluation value of the optical characteristics, respectively corresponding to the relative distance being increased and the relative distance being reduced, based on the shape parameter respectively corresponding to the relative distance being increased and the relative distance being reduced and is adapted to separate the evaluation value of the optical characteristics into a component corresponding to the optical system (7) and a component corresponding to other than the optical system (7) based on the plurality of calculated evaluation values of the optical characteristics.
- The apparatus (100) according to any one of claims 1 to 7, wherein the optical system (7) includes a diaphragm (32), the characteristics distribution model function represents distribution of telecentricity, and the evaluation value calculation unit (16) is adapted to calculate at least one of a lateral shift amount of the diaphragm and the vertical shift amount thereof based on the characteristics distribution model function.
- The apparatus (100) according to any one of claims 1 to 7, wherein the point image production unit includesa plurality of pin-holes each having a diameter equal to or less than the resolution of the optical system (7) and arranged in a planar form, andan illumination unit (1, 2, 3) adapted for trans-illuminating the plurality of pin-holes, andthe plurality of pin-holes illuminated by the illumination unit (1, 2, 3) are used as the plurality of point light sources (4a).
- The apparatus (100) according to any one of claims 1 to 7, wherein the point image production unit includesa plurality of micro reflecting mirrors (57) each having a diameter equal to or less than the resolution of the optical system (7) and arranged in a planar form, and an illumination unit (1, 2, 3) adapted for epi-illuminating the plurality of micro reflecting mirrors (57), andthe plurality of micro reflecting mirrors (57) illuminated by the illumination unit (1, 2, 3) are adapted to be used as the plurality of point light sources (4a).
- The apparatus (100) according to any one of claims 1 to 7, wherein the imaging unit (10) includes a two-dimensional imaging device adapted for imaging the plurality of point images.
- The apparatus (100) according to any one of claims 1 to 7, wherein the point image production unit comprises a confocal optical system (59) provided conjugate with the plurality of point light sources (4a) in the optical system (7) and is adapted to perform confocal detection to the point image through the confocal optical system (59) in each of the point light sources (4a).
- The apparatus (100) according to any one of claims 1 to 7, wherein the imaging control unit (18) is adapted to control the point image production unit to sequentially emit light from the plurality of point light sources (4a) to sequentially form the plurality of point images in each movement of the relative distance by the moving unit (5), and is adapted to control the imaging unit (10) to sequentially image the sequentially formed point images to produce the point image distribution image.
- The apparatus (100) according to any one of claims 1 to 7, wherein the optical system (7) to is a telecentric optical system.
- The apparatus (100) according to claim 19, wherein the moving unit (5) changes the relative distance on a telecentric side of the optical system (7).
- The apparatus (100) according to any one of claims 1 to 7, wherein the optical system (7) is a microscope optical system used for a microscope.
- The apparatus (100) according to claim 21, wherein at least a part of the optical system (7) is an objective lens.
- A method for evaluating optical characteristics of an optical system (7) based on an image forming position of a point image that is formed from a point light source through the optical system (7), the method comprising:forming a point image through the optical system (7) in each of a plurality of point light sources (4a) positioned in a vicinity of an object surface of the optical system (7) and arranged in a planar form;
imaging a plurality of the point images by an imaging unit (10) to produce a point image distribution image;changing a relative distance(i) between the point light source (4a) and the optical system (7) or(ii) between the optical system (7) and the imaging unit (10) in an optical axis direction (9) of the optical system (7);controlling the imaging unit (10), to image the point image distribution image in every change of the relative distance (i) between the point light source (4a) and the optical system (7) or (ii) between the optical system (7) and the imaging unit (10);performing, in each of the plurality of point images, processing for detecting an image forming position in each different relative distance of the point image based on image information of a plurality of the point image distribution images imaged at the different relative distance,characterized in that the processing includes calculating a regression expression concerning the image forming position and the relative distance for each of a the point images to obtain a shape parameter of the image axis determined by the regression expression in each of the plurality of point images;fitting a characteristic distribution model function representing distribution of the optical characteristics to the shape parameter; andcalculating an evaluation value of the optical characteristics based on the fitting characteristics distribution model function. - The method according to claim 23, wherein the characteristic distribution model function represents at least one distribution of telecentricity and coma aberration.
- The method according to claim 23, wherein
the processing includesfitting an intensity distribution model function representing two-dimensional intensity distribution of a point image region, in which the point image is imaged, to the point image region in each of the point distribution images imaged at the different relative distance;detecting a planar coordinate on the point image distribution image with the maximum intensity distribution model function, fitted by the intensity distribution fitting unit (15b), in each of the point image distribution images imaged at the different relative distance;calculating the maximum intensity position of the point image in the relative distance in which the point image distribution image is imaged as the image forming position of the point image, using the detected planar coordinate; andfitting a curve model function as the regression expression to a plurality of the maximum intensity positions at each of the different relative distance to obtain a coefficient of the fitting curve model function as the shape parameter. - The method according to claim 25, wherein the processing includes setting a fitting range of the intensity distribution model function to the point image, and the fitting the intensity distribution model function includes fitting the intensity distribution model function to the point image region in each of the point distribution image imaged at the different relative distance within the fitting range.
- The method according to claim 25, wherein the intensity distribution model function is a two-dimensional Gaussian distribution function.
- The method according to claim 23, wherein the processing includesdetecting a pixel position representing the maximum brightness in the point image region, in which the point image is imaged, in each of the image distribution images imaged at the different relative distance;calculating, as the image forming position of the point image, the maximum intensity position of the point image in the relative distance, in which the point image distribution image is imaged, on the basis of the detected pixel position; andfitting a curve model function as the regression expression to a plurality of the maximum intensity positions in each of the different relative distance to obtain a coefficient of the fitting curve model function as the shape parameter.
- The method according to claim 28, whereinthe processing includes setting a retrieval range of the pixel position to the point image, andthe calculating the maximum intensity position includes detecting the pixel position in each of the point image distribution images imaged at the different relative distance within the retrieval range.
- The method according to any one of claims 25 to 29, wherein the curve model function is a linear model function representing a straight line.
- The method according to any one of claims 25 to 29, wherein the curve model function is a quadratic curve model function representing a quadratic curve.
- The method according to any one of claims 23 to 29, whereinthe forming includes making the point light source emit light in a plurality of wavelength ranges in a switchable manner and forming the point image in each of the light in the plurality of wavelength ranges,the controlling the imaging unit (10) includes imaging control unit (18) controls the point image production unit to sequentially form the point image with light in the plurality of wavelength ranges in every change of the relative distance by the changing and controlling the imaging unit (10) to image the point image distribution image in each light in the plurality of wavelength ranges,the processing is performed in each light in the plurality of wavelength ranges, and calculating a difference parameter representing a difference between the respective shape parameters in light in a first wavelength range and light in a second wavelength range, andthe calculating the evaluation value includes fitting a difference distribution model function, representing the distribution of the difference of the respective optical characteristics in the light in the first wavelength range and the light in the second wavelength range, to each of the difference parameters in each of the plurality of point images, and calculating the evaluation value of the difference of the optical characteristics based on the fitting difference distribution model function.
- The method according to any one of claims 23 to 29, further comprisingrotating a partial optical system, including at least one part of the optical system (7), around an optical axis of the partial optical system,wherein the calculating the evaluation value includes calculating an evaluation value of the optical characteristics to difference rotation positions of the partial optical system by the rotating, andseparating the evaluation values of the optical characteristics into a component corresponding to the partial optical system and a component corresponding to other than the partial optical system based on the plurality of the calculated evaluation values of the optical characteristics.
- The method according to any one of claims 23 to 29, whereinthe controlling the imaging unit (10) includes controlling the moving unit (5) to perform at least one time of reciprocating change in which the relative distance is increased and reduced within a predetermined range and controlling the imaging unit (10) to image the point image distribution image in every change of the relative distance while increasing and reducing the relative distance,the processing includes obtaining the shape parameters, respectively corresponding to the relative distance being increased and the relative distance being reduced, in each of the plurality of point images based on image information of a plurality of the point image distribution images imaged while increasing and reducing the relative distance, andthe calculating the evaluation value includes calculating the evaluation value of the optical characteristics, respectively corresponding to the relative distance being increased and the relative distance being reduced, based on the shape parameter respectively corresponding to the relative distance being increased and the relative distance being reduced, and separating the evaluation value of the optical characteristics into a component corresponding to the optical system (7) and a component corresponding to other than the optical system (7) based on the plurality of calculated evaluation values of the optical characteristics.
- The method according to any one of claims 23 to 29, whereinthe optical system (7) includes a diaphragm,the characteristics distribution model function represents distribution of telecentricity, andthe evaluation value calculation unit (16) calculates at least one of a lateral shift amount of the diaphragm and the vertical shift amount thereof based on the characteristics distribution model function.
- A computer program product having a computer readable medium including programmed instructions, wherein the instructions, when executed by a computer, cause the computer to perform the method according to any one of claims 23 to 35.
- The apparatus according to claim 1, wherein
the plurality of point light sources (4a) is arranged on a plane orthogonal to an optical axis of the optical system (7); and
the imaging unit (10) is adapted to image, in the vicinity of the image forming position of the plurality of point light sources (4a), the point images formed through the optical system (7) to produce the point image distribution image.
Applications Claiming Priority (1)
| Application Number | Priority Date | Filing Date | Title |
|---|---|---|---|
| JP2007124682A JP5489392B2 (en) | 2007-05-09 | 2007-05-09 | Optical system evaluation apparatus, optical system evaluation method, and optical system evaluation program |
Publications (4)
| Publication Number | Publication Date |
|---|---|
| EP1990624A2 EP1990624A2 (en) | 2008-11-12 |
| EP1990624A3 EP1990624A3 (en) | 2009-08-19 |
| EP1990624B1 true EP1990624B1 (en) | 2016-09-14 |
| EP1990624B8 EP1990624B8 (en) | 2016-11-23 |
Family
ID=39683621
Family Applications (1)
| Application Number | Title | Priority Date | Filing Date |
|---|---|---|---|
| EP08008432.0A Active EP1990624B8 (en) | 2007-05-09 | 2008-05-05 | Apparatus and method for evaluating an optical system |
Country Status (4)
| Country | Link |
|---|---|
| US (1) | US7761257B2 (en) |
| EP (1) | EP1990624B8 (en) |
| JP (1) | JP5489392B2 (en) |
| CN (1) | CN101303269B (en) |
Families Citing this family (39)
| Publication number | Priority date | Publication date | Assignee | Title |
|---|---|---|---|---|
| CN1918513B (en) * | 2004-02-05 | 2011-02-02 | 皇家飞利浦电子股份有限公司 | Mask inspection apparatus and method |
| US8479125B2 (en) * | 2009-03-31 | 2013-07-02 | Christophe Pierrat | Lithography modeling and applications |
| JP5759232B2 (en) * | 2011-04-04 | 2015-08-05 | キヤノン株式会社 | measuring device |
| CN102507147B (en) * | 2011-10-14 | 2014-05-28 | 中国科学院光电技术研究所 | Real-time evaluation system for performance of self-adaptive optical system |
| US10100393B2 (en) | 2013-02-21 | 2018-10-16 | Nlight, Inc. | Laser patterning of multi-layer structures |
| US10464172B2 (en) | 2013-02-21 | 2019-11-05 | Nlight, Inc. | Patterning conductive films using variable focal plane to control feature size |
| US9842665B2 (en) | 2013-02-21 | 2017-12-12 | Nlight, Inc. | Optimization of high resolution digitally encoded laser scanners for fine feature marking |
| US9537042B2 (en) | 2013-02-21 | 2017-01-03 | Nlight, Inc. | Non-ablative laser patterning |
| TWI611855B (en) * | 2013-09-09 | 2018-01-21 | n萊特股份有限公司 | Optimization of high resolution digitally encoded laser scanners for fine feature marking |
| US9927371B2 (en) * | 2014-04-22 | 2018-03-27 | Kla-Tencor Corporation | Confocal line inspection optical system |
| US10618131B2 (en) | 2014-06-05 | 2020-04-14 | Nlight, Inc. | Laser patterning skew correction |
| JP2016017744A (en) * | 2014-07-04 | 2016-02-01 | キヤノン株式会社 | Non-spherical surface measuring method, non-spherical surface measuring apparatus, program, machining apparatus for optical elements, and optical elements |
| US9837783B2 (en) | 2015-01-26 | 2017-12-05 | Nlight, Inc. | High-power, single-mode fiber sources |
| US10050404B2 (en) | 2015-03-26 | 2018-08-14 | Nlight, Inc. | Fiber source with cascaded gain stages and/or multimode delivery fiber with low splice loss |
| WO2017008022A1 (en) | 2015-07-08 | 2017-01-12 | Nlight, Inc. | Fiber with depressed central index for increased beam parameter product |
| US10074960B2 (en) | 2015-11-23 | 2018-09-11 | Nlight, Inc. | Predictive modification of laser diode drive current waveform in order to optimize optical output waveform in high power laser systems |
| EP3978184A1 (en) | 2015-11-23 | 2022-04-06 | NLIGHT, Inc. | Method and apparatus for fine-scale temporal control for laser beam material processing |
| US11179807B2 (en) | 2015-11-23 | 2021-11-23 | Nlight, Inc. | Fine-scale temporal control for laser material processing |
| WO2017127573A1 (en) | 2016-01-19 | 2017-07-27 | Nlight, Inc. | Method of processing calibration data in 3d laser scanner systems |
| JP6546353B2 (en) | 2016-09-14 | 2019-07-17 | 富士フイルム株式会社 | Evaluation system and evaluation method |
| EP3519871A1 (en) | 2016-09-29 | 2019-08-07 | NLIGHT, Inc. | Adjustable beam characteristics |
| US10730785B2 (en) | 2016-09-29 | 2020-08-04 | Nlight, Inc. | Optical fiber bending mechanisms |
| US10732439B2 (en) | 2016-09-29 | 2020-08-04 | Nlight, Inc. | Fiber-coupled device for varying beam characteristics |
| KR102611837B1 (en) | 2017-04-04 | 2023-12-07 | 엔라이트 인크. | Generating optical references for calibrating galvanometer scanners |
| WO2018212008A1 (en) | 2017-05-16 | 2018-11-22 | 富士フイルム株式会社 | Image capturing device and image compositing device |
| CN109286798B (en) * | 2017-07-21 | 2020-03-20 | 深圳市Tcl高新技术开发有限公司 | Frame position identification method and system of projection screen and terminal equipment |
| CN108257177B (en) * | 2018-01-15 | 2021-05-04 | 深圳思蓝智创科技有限公司 | Positioning system and method based on space identification |
| SG10201803290VA (en) * | 2018-04-19 | 2019-11-28 | Emage Vision Pte Ltd | System and method for inspecting optical power and thickness of ophthalmic lenses immersed in a solution |
| AU2019289958B2 (en) | 2018-06-19 | 2021-12-23 | Borealis Ag | Method for evaluation of quality of laser printed samples |
| DE102018115991B4 (en) * | 2018-07-02 | 2023-12-07 | Basler Ag | DIGITAL CIRCUIT FOR CORRECTING A VIGNETTING EFFECT IN PIXEL VALUES OF AN ELECTRONIC CAMERA IMAGE |
| CN112291469A (en) * | 2018-07-23 | 2021-01-29 | 深圳市真迈生物科技有限公司 | Imaging method, device and system |
| CN112333378A (en) * | 2018-07-23 | 2021-02-05 | 深圳市真迈生物科技有限公司 | Imaging method, device and system |
| CN109005340A (en) * | 2018-07-27 | 2018-12-14 | 武汉精测电子集团股份有限公司 | The Atomatic focusing method and device of image definition curve matching are carried out based on least square method |
| US11857151B2 (en) * | 2018-09-12 | 2024-01-02 | Steris Instrument Management Services, Inc. | Systems and methods for standalone endoscopic objective image analysis |
| CN112602009B (en) * | 2018-09-28 | 2022-09-02 | 豪雅镜片泰国有限公司 | Curved surface shape evaluation method, method for manufacturing spectacle lens, and spectacle lens |
| CN110231254A (en) * | 2019-06-12 | 2019-09-13 | 刘华云 | A kind of built-in calculation method for contact angle measurement |
| WO2021026515A1 (en) * | 2019-08-07 | 2021-02-11 | Agilent Technologies, Inc. | Optical imaging performance test system and method |
| CN110307963B (en) * | 2019-08-08 | 2020-11-03 | 苏州维纳仪器有限责任公司 | Method for detecting any wavelength focal length of transmission type optical system |
| CN111337169B (en) * | 2020-03-16 | 2021-04-16 | 清华大学 | Tactile sensing device based on coding hole imaging technology |
Family Cites Families (19)
| Publication number | Priority date | Publication date | Assignee | Title |
|---|---|---|---|---|
| CN1019605B (en) * | 1989-10-24 | 1992-12-23 | 华东工学院 | Tester for amount of information on optical fibre panel |
| US5661816A (en) * | 1991-10-22 | 1997-08-26 | Optikos Corporation | Image analysis system |
| JP2793931B2 (en) * | 1992-06-26 | 1998-09-03 | 日本精機株式会社 | Light two-dimensional measuring method, surface roughness measuring method and measuring device |
| US5402224A (en) * | 1992-09-25 | 1995-03-28 | Nikon Corporation | Distortion inspecting method for projection optical system |
| EP0644411B1 (en) * | 1993-09-17 | 1997-03-26 | ESSILOR INTERNATIONAL (Compagnie Générale d'Optique) | Procedure and apparatus for the absolute measurement of the geometrical or optical structure of an optical component |
| JPH09159575A (en) * | 1995-12-06 | 1997-06-20 | Olympus Optical Co Ltd | Lens inspection device |
| JPH09288039A (en) * | 1996-04-19 | 1997-11-04 | Topcon Corp | Lens meter |
| WO1997046865A1 (en) * | 1996-06-04 | 1997-12-11 | Tencor Instruments | Optical scanning system for surface inspection |
| US6195159B1 (en) * | 1998-12-30 | 2001-02-27 | Agfa Corporation | Lens testing system |
| DE10126546A1 (en) * | 2001-05-30 | 2002-12-05 | Wilfried Donner | Arrangement for determining position-dependent intensity and color profile and/or focus profile of optical lens systems has measurement fields arranged in both dimensions of test image |
| JP3654220B2 (en) * | 2001-08-22 | 2005-06-02 | セイコーエプソン株式会社 | Lens inspection device |
| AUPS190002A0 (en) * | 2002-04-23 | 2002-05-30 | University Of Adelaide, The | Optical testing method and apparatus |
| JP2004163207A (en) * | 2002-11-12 | 2004-06-10 | Olympus Corp | Instrument and method for measuring lens |
| DE10328145A1 (en) * | 2003-06-21 | 2005-01-13 | Technische Universität Carolo-Wilhelmina Zu Braunschweig | Imaging characteristics measuring method for transparent object e.g. optical component, using light transmitted through object for providing images of spaced raster structures at receiver |
| JP4229782B2 (en) * | 2003-09-05 | 2009-02-25 | オリンパス株式会社 | Wavefront aberration measuring device |
| DE102004035595B4 (en) * | 2004-04-09 | 2008-02-07 | Carl Zeiss Smt Ag | Method for adjusting a projection objective |
| JP2006030016A (en) * | 2004-07-16 | 2006-02-02 | Nikon Corp | Calibration method for wavefront aberration measurement apparatus, wavefront aberration measurement method and apparatus, projection optical system, manufacturing method of same, projection exposure apparatus, manufacturing method of same, microdevice, manufacturing method of same |
| JP2006195790A (en) * | 2005-01-14 | 2006-07-27 | Nippon Telegr & Teleph Corp <Ntt> | Lens distortion estimation apparatus, lens distortion estimation method, and lens distortion estimation program |
| EP1785714B1 (en) * | 2005-11-15 | 2017-02-22 | Olympus Corporation | Lens evaluation device |
-
2007
- 2007-05-09 JP JP2007124682A patent/JP5489392B2/en active Active
-
2008
- 2008-05-05 EP EP08008432.0A patent/EP1990624B8/en active Active
- 2008-05-08 US US12/117,372 patent/US7761257B2/en active Active
- 2008-05-08 CN CN2008100975203A patent/CN101303269B/en active Active
Also Published As
| Publication number | Publication date |
|---|---|
| JP5489392B2 (en) | 2014-05-14 |
| CN101303269A (en) | 2008-11-12 |
| EP1990624B8 (en) | 2016-11-23 |
| CN101303269B (en) | 2011-12-14 |
| JP2008281395A (en) | 2008-11-20 |
| EP1990624A3 (en) | 2009-08-19 |
| US20080281556A1 (en) | 2008-11-13 |
| EP1990624A2 (en) | 2008-11-12 |
| US7761257B2 (en) | 2010-07-20 |
Similar Documents
| Publication | Publication Date | Title |
|---|---|---|
| EP1990624B1 (en) | Apparatus and method for evaluating an optical system | |
| EP1785714B1 (en) | Lens evaluation device | |
| US6819415B2 (en) | Assembly for increasing the depth discrimination of an optical imaging system | |
| JP6087993B2 (en) | Method and apparatus for image scanning | |
| JP6534658B2 (en) | Scanning microscope and method of determining point spread function (PSF) of scanning microscope | |
| JP6364193B2 (en) | Focus position adjustment method and inspection method | |
| JP7453981B2 (en) | Calibration of light field imaging systems | |
| US20210215923A1 (en) | Microscope system | |
| CN104515469A (en) | Light microscope and microscopy method for examining a microscopic specimen | |
| TW201504750A (en) | System and method for determining the position of defects on objects, coordinate measuring unit and computer program for coordinate measuring unit | |
| CN108885089A (en) | Focusing system for telecentric optics measurement machine | |
| US20220276125A1 (en) | Optical imaging performance test system and method | |
| JP4937686B2 (en) | Lens evaluation device | |
| JP7553446B2 (en) | Method for automatically identifying a location on a specimen placement site and corresponding microscope - Patents.com | |
| KR101826127B1 (en) | optical apparatus for inspecting pattern image of semiconductor wafer | |
| CN111896557A (en) | Three-dimensional measuring device and method for dark field microscopic defects of structured light modulation | |
| WO2022145391A1 (en) | Scanning confocal microscope and adjustment method for scanning confocal microscope | |
| JP2010091468A (en) | Aberration measurement apparatus | |
| JP7191632B2 (en) | Eccentricity measurement method | |
| JPWO2020157681A5 (en) | ||
| JP5325481B2 (en) | Measuring method of optical element and manufacturing method of optical element | |
| JP2022044113A (en) | Aberration estimation method, aberration estimation device, program and storage medium | |
| CN114279341B (en) | MEMS device measurement system, method and equipment based on multiple optical modes | |
| JP2007163455A (en) | Lens evaluation system | |
| CN117006969B (en) | Optical measuring system |
Legal Events
| Date | Code | Title | Description |
|---|---|---|---|
| PUAI | Public reference made under article 153(3) epc to a published international application that has entered the european phase |
Free format text: ORIGINAL CODE: 0009012 |
|
| AK | Designated contracting states |
Kind code of ref document: A2 Designated state(s): AT BE BG CH CY CZ DE DK EE ES FI FR GB GR HR HU IE IS IT LI LT LU LV MC MT NL NO PL PT RO SE SI SK TR |
|
| AX | Request for extension of the european patent |
Extension state: AL BA MK RS |
|
| PUAL | Search report despatched |
Free format text: ORIGINAL CODE: 0009013 |
|
| AK | Designated contracting states |
Kind code of ref document: A3 Designated state(s): AT BE BG CH CY CZ DE DK EE ES FI FR GB GR HR HU IE IS IT LI LT LU LV MC MT NL NO PL PT RO SE SI SK TR |
|
| AX | Request for extension of the european patent |
Extension state: AL BA MK RS |
|
| 17P | Request for examination filed |
Effective date: 20090811 |
|
| 17Q | First examination report despatched |
Effective date: 20091020 |
|
| AKX | Designation fees paid |
Designated state(s): DE FR GB |
|
| GRAP | Despatch of communication of intention to grant a patent |
Free format text: ORIGINAL CODE: EPIDOSNIGR1 |
|
| INTG | Intention to grant announced |
Effective date: 20160405 |
|
| GRAS | Grant fee paid |
Free format text: ORIGINAL CODE: EPIDOSNIGR3 |
|
| GRAA | (expected) grant |
Free format text: ORIGINAL CODE: 0009210 |
|
| AK | Designated contracting states |
Kind code of ref document: B1 Designated state(s): DE FR GB |
|
| REG | Reference to a national code |
Ref country code: GB Ref legal event code: FG4D |
|
| RAP2 | Party data changed (patent owner data changed or rights of a patent transferred) |
Owner name: OLYMPUS CORPORATION |
|
| RAP2 | Party data changed (patent owner data changed or rights of a patent transferred) |
Owner name: OLYMPUS CORPORATION |
|
| RIN2 | Information on inventor provided after grant (corrected) |
Inventor name: TOSHIAKI, MATSUZAWA |
|
| REG | Reference to a national code |
Ref country code: DE Ref legal event code: R096 Ref document number: 602008046247 Country of ref document: DE |
|
| REG | Reference to a national code |
Ref country code: DE Ref legal event code: R097 Ref document number: 602008046247 Country of ref document: DE |
|
| PLBE | No opposition filed within time limit |
Free format text: ORIGINAL CODE: 0009261 |
|
| STAA | Information on the status of an ep patent application or granted ep patent |
Free format text: STATUS: NO OPPOSITION FILED WITHIN TIME LIMIT |
|
| 26N | No opposition filed |
Effective date: 20170615 |
|
| GBPC | Gb: european patent ceased through non-payment of renewal fee |
Effective date: 20170505 |
|
| REG | Reference to a national code |
Ref country code: FR Ref legal event code: ST Effective date: 20180131 |
|
| PG25 | Lapsed in a contracting state [announced via postgrant information from national office to epo] |
Ref country code: GB Free format text: LAPSE BECAUSE OF NON-PAYMENT OF DUE FEES Effective date: 20170505 |
|
| PG25 | Lapsed in a contracting state [announced via postgrant information from national office to epo] |
Ref country code: FR Free format text: LAPSE BECAUSE OF NON-PAYMENT OF DUE FEES Effective date: 20170531 |
|
| REG | Reference to a national code |
Ref country code: DE Ref legal event code: R081 Ref document number: 602008046247 Country of ref document: DE Owner name: EVIDENT CORPORATION, JP Free format text: FORMER OWNER: OLYMPUS CORPORATION, TOKYO, JP |
|
| PGFP | Annual fee paid to national office [announced via postgrant information from national office to epo] |
Ref country code: DE Payment date: 20240328 Year of fee payment: 17 |