EP1870294A1 - Improved method using capacitive sensors for morphology discrimination of a passenger seating in an automotive seat - Google Patents
Improved method using capacitive sensors for morphology discrimination of a passenger seating in an automotive seat Download PDFInfo
- Publication number
- EP1870294A1 EP1870294A1 EP06291030A EP06291030A EP1870294A1 EP 1870294 A1 EP1870294 A1 EP 1870294A1 EP 06291030 A EP06291030 A EP 06291030A EP 06291030 A EP06291030 A EP 06291030A EP 1870294 A1 EP1870294 A1 EP 1870294A1
- Authority
- EP
- European Patent Office
- Prior art keywords
- sensor
- target
- seat
- sensors
- distance
- Prior art date
- Legal status (The legal status is an assumption and is not a legal conclusion. Google has not performed a legal analysis and makes no representation as to the accuracy of the status listed.)
- Granted
Links
Images


Classifications
-
- B—PERFORMING OPERATIONS; TRANSPORTING
- B60—VEHICLES IN GENERAL
- B60R—VEHICLES, VEHICLE FITTINGS, OR VEHICLE PARTS, NOT OTHERWISE PROVIDED FOR
- B60R21/00—Arrangements or fittings on vehicles for protecting or preventing injuries to occupants or pedestrians in case of accidents or other traffic risks
- B60R21/01—Electrical circuits for triggering passive safety arrangements, e.g. airbags, safety belt tighteners, in case of vehicle accidents or impending vehicle accidents
- B60R21/015—Electrical circuits for triggering passive safety arrangements, e.g. airbags, safety belt tighteners, in case of vehicle accidents or impending vehicle accidents including means for detecting the presence or position of passengers, passenger seats or child seats, and the related safety parameters therefor, e.g. speed or timing of airbag inflation in relation to occupant position or seat belt use
- B60R21/01512—Passenger detection systems
- B60R21/0153—Passenger detection systems using field detection presence sensors
- B60R21/01532—Passenger detection systems using field detection presence sensors using electric or capacitive field sensors
Definitions
- the present invention relates to the technical field of sensors area.
- the present invention concerns a system and a method to improve the morphology discrimination of a passenger seated in an automotive seat fitted with several capacitive sensors.
- a non exclusive implementation of the present invention relates to control the airbag triggering in a car.
- OCS Olecupant Classification System
- such constraints may be due to a wet obstacle present on the seat, such for example in the case of a passenger (adult or child) seated with a wet raincoat, a passenger coming from beach putting a damp towel on seat before sitting on it, beverage dropping damping partial surface of seat or a shower leading to a damped seat if the window pane is bad shut.
- the aim of the present invention is now to propose means for allowing a more reliable discrimination of the morphology of a passenger seated in an automotive seat fitted with several capacitive sensors, in severe constraints like in the case of wet obstacles covering a seat.
- This aim is achieved according to the present invention with a method comprising the steps of providing a set of a plurality of capacitive sensors covering substantially a transversal cross section of the seat, collecting the outputs of said plurality of capacitive sensors provided on the seat, determining the morphology of a target facing the seat on the basis of measured distance separating the target from the sensors and measured surface of the sensors covered by the target, from said outputs, and comparing the determined morphology with at least a reference so as to classify the determined morphology between a plurality of reference ones.
- the comparing step of the method of the present invention involves a mathematical function representing a morphology reference.
- the comparing step of the method of the present invention involves a 3D reference image representing a morphology reference.
- the present invention also relates to a system for implementing the above method as well as a seat for automotive car comprising such a system.
- the present invention proposes a method for reliable discrimination of the morphology of a passenger seated in an automotive seat fitted with several capacitive sensors, in severe constraints like in the case of wet obstacles covering a seat.
- the present invention allows in particular to control airbag triggering in function of such morphology discrimination.
- the present invention proposes a method comprising the steps of providing a set of a plurality of capacitive sensors 100 covering substantially a transversal cross section of a seat, collecting the outputs of said plurality of capacitive sensors 100 provided on the seat, determining the morphology of a target 10 facing the seat on the basis of measured distance separating the target 10 from the sensors 100 and measured surface of the sensors 100 covered by the target 10, from said outputs, and comparing the determined morphology with at least a reference so as to classify the determined morphology between a plurality of reference ones.
- capacitive sensor 100 in accordance with the present invention and an example of a set of such capacitive sensors 100 provided on a seat are illustrated on figures 1 and 2.
- Such capacitive sensor 100 of figure 1 and implantation of sensors 100 on a seat illustrated on figure 2 will be described more in detail in the following specification.
- the present invention proposes a method comprising preferentially the steps of collecting the outputs of a plurality of capacitive sensors 100 provided on a seat, determining for each capacitive sensors 100 a first value di representative of the distance separating a target 10 from the sensor 100 and a second value Sdi representative of the surface of the sensor 100 covered by the target 10, applying to the second values Sdi representative of the surface of the sensor 100 covered by the target 10 a respective weighting Wi based on the corresponding first value di representative of the distance separating the target 10 from the same sensor 100, and determining the morphology of the target 10 on the basis of the collection of weighted second values SdixWi.
- the distance di separating the target 10 and each sensor 100 and the surface Sdi of the target 10 covering each sensor 100 may be obtained by any efficient means.
- such distance di separating the target 10 and each sensor 100 as well as the surface Sdi of the target 10 covering each sensor 100 are preferentially obtained with a method which includes means for compensating drifts caused by temperature and humidity environment. Indeed the inventors have uncovered that generally capacitive measures are very sensitive to temperature and humidity environment.
- the method in accordance with the present invention is directed to reliable discrimination of the morphology of a passenger seated in an automotive seat fitted with several capacitive sensors, in severe constraints like in the case of wet obstacles covering a seat.
- This method allows for example to resolve the issue of a "Children seated over a wet obstacle on a seat".
- the method in accordance with the present invention allows to detect the right classification of an occupant of a seat even in a case of wet towel presence.
- Figure 4 illustrates an example of a realistic profile measurement which may be retained for further prosecution and of a non realistic profile measurement which must be rejected.
- profile measurements presenting holes are not realistic as well and must be also rejected.
- the reference is a mathematical functions S(p) (wherein p is the pixel index).
- the reference shape is chosen by the way of such mathematical function, one can by fitting the reference shape to the profile measurement, estimate whether the profile measurement is likely to correspond to that reference shape. It can be done for instance by calculating an error criteria (typically a mean square criteria) that will tell whether the profile measurement is likely or not likely to correspond that reference shape.
- an error criteria typically a mean square criteria
- the function considered is a "Bell like function" (eq 1) of order two or more.
- the parameter "b" can easily be deduced from the measured profile as well.
- b max(P(round( m )-1),P(round( m )),P(round( m )+1)) in order to take into account that the maximal value of the profile does not necessarily coincide with the medium pixel (for example pixel number four in the case of a measure implementing height pixels referenced from 0 to 8).
- the parameter "a" cannot be so simply estimated from the measured profile.
- the Bell like function (order 2) has been applied to selected measurements from a seat data base recorded.
- the selected measurement correspond to standard children profiles ( Figure 6), standard adult profiles ( Figure 7) and to standard big adult profiles (Figure 8).
- figure 10 illustrates a standard children profile with error simulating a hand on bolster.
- the classification is erroneous.
- the children would be classified as an adult.
- This example shows it is important to consider the error in the likeliness test. Indeed, as the profile measurement is not realistic, the error in that case is not less that 30% which is much larger than for the likely profiles presented before. The error allows rejecting the erroneous profile measurements that will not be classified.
- the above disclosed implementation of the present invention comprises a comparing step which involves a mathematical function representing a morphology reference.
- the comparing step involves a 3D reference image representing a morphology reference.
- a x.y mesh for example a 10 by 11 mesh
- the mesh step is chosen preferentially in accordance with the actual probe spacing as shown in figure 13.
- An image of the passenger profile is realized as follow by interpolation of the outputs issued by the sensors.
- the pixel value is interpolated from the nearest probes.
- the pixel ⁇ 2,10 ⁇ (Horizontal coordinate, vertical coordinate) of figure 13 is obtained by calculating the mean value between the measured pixels 110S4 and 120S1.
- the intermediate pixels values are linearly interpolated between the measured pixels 110S2 and 110S3 over the distance separating them as shown on figure 14.
- the pixel is interpolated between a measured pixel (here: pixel 110S4) and an interpolated pixel (here: pixel ⁇ 5.7 ⁇ ). This yields a more realistic interpolation.
- the image is set to the measured pixel value where there is a probe and to zero in the remaining pixels (greyed in Figure 13).
- the image can simply be obtained by interpolating the data as described above. This way leads to a standard image.
- any of those three or all three images can be computed from a single measurement.
- the dynamic profiles are fewer dependants on the passenger distance to the seat, but the signal intensity is lost. It is possible as well to use two or more kinds of image as well.
- An example of standard profile is presented on figure 15.
- the goal is firstly to determine whether the image corresponding to a profile measurement is likely or not, and secondly if the image is likely to give measurement of the passenger morphology.
- the measured image is compared to a set of reference images obtained from measurement in standard known positions for different morphologies. If the comparison yields poor results then the image is not very-similar and is rejected. When the comparison is correct, the comparison result is used to classify the measured image in the morphology class corresponding to the morphology used to create the reference image.
- the "template method” consists for each weight class (for example 0 kg - 36kg, 36kg - 60kg, 60kg - 80kg, 80kg - 120kg), to elaborate a maximal template limit and a minimal template limit.
- the measured images are compared to the template by counting the number of pixels that belong to the template (ie the number of pixels between the maximal template limit and the minimal template limit) as illustrated in figure 16.
- the number of pixels belonging to the template is expressed as a percentage of the total number of pixels. Considering the number x.y of pixels (for example 10x11) in each image, one pixel represents about 0.9% of the total template.
- Another method consists in calculating a distance to a "reference plane" which is the average image for the morphology to which the measurement is compared.
- P RP ( i ) are the pixels of the reference plane
- P l ( i ) are the pixels of the measured image
- D is the distance of the image to the reference plane.
- the Image "template prosecution” consists in applying the “templates methods” or the “reference plane methods” to the data base recorded in seat.
- Figure 18 displays the results obtained when applying the template method on a 0-36kg template. One can see that children fit the 0-36kg template. In the final prosecution, the measurements are compared to the templates starting by the heavy ones.
- a measurement that fits with a template is classified in the corresponding weight class.
- the measurements that fit no template are not classified.
- the present invention uses a capacitive sensor structure 100.
- This capacitive sensor 100 may be in conformity with a plurality of embodiments.
- the capacitive sensor 100 of the present invention comprises at least two electrodes 110, 120, in conformity with the disclosure of French patent application 05 08072 , covering complementary respective areas of a sensed zone so as to form two balanced pixel sensors.
- the function of such two electrodes 110, 120 and corresponding balanced pixel sensors will be described more in detail in the following specification.
- the capacitive sensor 100 of the present invention comprises 3 electrodes 110, 120, 130 as illustrated on figure 1, in conformity with the general disclosure of French patent application 05 08072 .
- the present invention is not limited to the specific embodiment and shape illustrated on figure 1.
- the two electrodes 110 and 120 correspond to main electrodes. They cover complementary respective areas of a detection or sensed zone. More precisely the two main electrodes 110 and 120 are preferentially made of rectilinear tracks. The two main electrodes 110 and 120 are preferentially aligned. Preferentially the two main electrodes 110 and 120 have the same surface. However the present invention may be implemented with main electrodes 110, 120 having non identical surfaces, taking into account the ratio between the respective surfaces of the two main electrodes 110 and 120 in the detecting prosecution.
- the third auxiliary electrode covers at least substantially both the two complementary respective areas of the two main electrodes 110 and 120. More precisely as illustrated on figure 1, preferentially the third electrode 130 surrounds said two main electrodes 110 and 120.
- the third electrode 130 is connected at its middle part to a transverse connecting track 132.
- the two main electrodes 110 and 120 are connected at their adjacent ends to transverse respective connecting tracks 112 and 122.
- Such a sensor 100 comprising only 3 outputs 112, 122 and 132 may deliver a number of output information greater than 3, corresponding to capacitor values depending of the connection of said electrodes 110, 120 and 130.
- French patent application 0508072 for example discloses the implementation of 8 output information from similar electrodes 110, 120 and 130.
- capacitor values are measured by applying judiciously an electric controlled dc field between some electrodes 110, 120, 130 and subsequently measuring and counting up electric charges on dedicated electrodes 110, 120, 130, after breaking said electric dc field.
- the present invention method converts the electric charges accumulated on a selected electrode 110 or 120, into an electric output signal, with supplying means suitable to apply a controlled dc electrical voltage on selected electrodes, integrator means including a capacitive switching system and control means suitable to define cyclically, at a selected frequency, a sequence of two following steps :
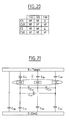
- Each of the 4 above combinations may be expressed as the summation of capacitive components composing the sensor system illustrated on figure 21 :
- C ⁇ 1 C 1 ⁇ U + C 1 ⁇ B + C 1 ⁇ G
- CU ⁇ 1 C 1 ⁇ B + C 1 ⁇ G
- C ⁇ 2 C 2 ⁇ U + C 2 ⁇ B + C 2 ⁇ G
- CU ⁇ 2 C 2 ⁇ B + C 2 ⁇ G
- the inventors took a conductive reference target 10 having a length which is equal to the length of the sensor 100 (ie equal to the length of the electrode 130 and equal to the sum of the lengths of the two electrodes 110 and 120 as illustrated on figure 22).
- the inventors successively displace step by step said reference target 10 in regard of the sensor 100, in parallel to the longitudinal direction of the sensor 100.
- the displacement starts arbitrary by left side and covers the sensor 100, on m successive steps, by incremental step of 1/4 of surface.
- the inventors move the reference target 10 progressively away the sensor 100, step by step, from a distance Z of 0 mm (contact) to 100 mm (considered as infinite distance).
- the inventors have determined that the 4 phases C1, CU1, C2 and CU2 lead to 3 typical combinations.
- phase ratio CU1/C1 (C 1B +C 1G ) / (C 1U +C 1B +C 1G ).
- denominator includes further term C 1U which represents the local capacitor between electrodes 110 and 130 which is sensitive at temperature and humidity (dependance of dielectric constant of support of the electrodes with temperature and humidity)
- C 1B is different from C 2B because these capacitors depend on the surface of the target 10 covering each pixel electrode 110 or 120. These two capacitors measure the unbalanced surface covering pixel 110 and pixel 120.
- the aim of this Table is to give a correspondence between real capacitive measures and the temperature and humidity parameters so as to compensate drift due to the temperature and humidity.
- Construction of this Table may be operated according to various process. A specific one of such process will be described as step 1 in regard of the illustration of figure 25.
- a Look Up Table of B (B1+B2)/2 is constructed as illustrated on figure 25.
- the Look Up Table LookTRH has of course oxp inputs.
- the shape of the LookTRH Table is oxp versus 2, ie an output B for each one the oxp inputs.
- the aim of Angle Look Up Table is to give a correspondence between a real capacitive measure or combination of real capacitive measures and the amount of target surface covering a sensor, for a plurality of temperature and humidity parameters.
- Construction of this Table may be operated according to various process. A specific one of such process will be described in regard of the illustration of figure 26.
- the shape of the LookAngle Table is oxpxm versus 2, ie an output ⁇ m for each one the oxpxm inputs.
- Look Up Table may be divided for example into oxp elementary Look Up Table having each m inputs.
- the inventors propose to construct two Tables LookOCU1 and LookOCU2 to give a correspondence between the abscissa and ordinate origins of the curves CU1 and CU2, with a plurality of temperature and humidity parameters.
- Construction of this Table may be operated according to various process. A specific one of such process will be described in regard of the illustration of figure 27.
- the Look Up Tables LookOCU1 and LookOCU2 have oxp inputs.
- the shape of the LookOCU1 and LookOCU2 Tables is oxp versus 2, ie an output "average of origin OCU1 or OCU2" for each one the oxp inputs.
- the aim of this Table is to give a correspondence between a real capacitive measure or a combination of capacitive measures and the distance separating a target from a capacitive sensor.
- Construction of this Table may be operated according to various process. A specific one of such process will be described as step 3 in regard of the illustration of figure 28.
- This process involves a calculation on the basis of a theorem known as Pythagore theorem.
- the inventors propose to calculate the distance separating the target 10 from the sensor 100 on the basis of a trigonometric function involving the values CU1 and CU2 corrected by specific abscissa origin OCU1(TRH) and ordinate origin OCU2(TRH).
- the value ABS corresponds to the distance between the target 10 and the sensor 100.
- the Look Up Table Lookabs has oxpxmxn inputs.
- the shape of the Lookabs Table is oxpxmxn versus 2, ie an output ABS for each one the oxpxmxn inputs.
- Such Look Up Table may be divided for example into oxp elementary Look Up Table having each mxn inputs.
- the surface of the target 10 covering the sensor 100 and the distance separating the target 10 and the sensor 100 may be calculated in "real time” during the "detection part".
- This detection part is divided in 4 main steps : 1) the calculation of an index pointer for "LookTRH", 2) the calculation of OCU1 and OCU2 origins, 3) the calculation of position m, and the calculation of the angle which give an information about surface occupation and 4) the calculation of distance between target 10 and sensor 100.
- Signals CU1, C1, CU2, C2 are acquired on sensor 100 in real time.
- the slope a (CU2-OCU2) / (CU1-OCU1) is calculated and from this calculated slope a, as well as from the T/RH couple information obtained at step 1, a value representative of position is pulled out from Look Up Table "LookAngle". This value is representative of surface occupation by a target 10, such as a passenger, in front of sensor 100.
- the value pulled out from the Look Up Table "LookAngle” is representative of the surface Sdi of the target 10, such as an occupant, covering the sensor 100.
- a value D ( C ⁇ U ⁇ 1 ⁇ n - O ⁇ C ⁇ U ⁇ 1 T ⁇ R ⁇ H ) 2 + ( C ⁇ U ⁇ 2 ⁇ n - O ⁇ C ⁇ U ⁇ 2 T ⁇ R ⁇ H ) 2 is calculated.
- the value pulled out from the Look Up Table "LookAbs" is representative of the distance di separating the target 10 from the sensor 100.
- Figures 30 and 31 show that this method offers a reliable determination both of the distance di separating a target 10 from a sensor 100 and the surface Sdi of the target 10 covering the sensor 100.
- This method allows to compensate the drifts caused by temperature and humidity.
- Figures 2 and 32 illustrate a preferential but non limitative implantation of such sensors 100 in a seat in accordance with the present invention.
- the sensors 100 illustrated on figures 2 and 32 are provided in the seating horizontal supporting part of a seat. Of course if necessary additional sensors 100 may be also provided in the back vertical part of the seat.
- each sensor 100 comprises 3 electrodes 110, 120 and 130 as described above and consequently each sensor 100 defines two pixels from respective main electrodes 110, 120.
- Sensors 100S1 and 100S6 are provided on the external lateral parts of the seat, named bolster.
- Sensors 100S2 and 100S5 are provided on the central part of the seat, in the vicinity of said bolster.
- Preferentially all four sensor 100S1, 100S2, 100S3 and 100S4 are aligned from left to right on the seat, approximately in the middle of the depth of the seat, ie approximately at the same distance from the front and the back of the seat.
- Sensor 100S3 and 100S4 are provided respectively on each side of the sensors 100S2 and 100S5, on the central part of the seat, sensor 100S3 being placed at onward of seat while sensor 100S4 is placed backward of seat.
- a surface occupation Sdi and an associated distance di is determined, as schematically illustrated by step 200 on figure 33.
- each sensor 100 comprises two pixels corresponding to main electrodes 110, 120, as it is the case with the specific embodiment illustrated on figure 1, using six sensors 100 leads to 12 individual information pixel.
- the method in accordance with the present invention comprises a filtering step to determine the values Sdi and di corresponding to an "empty" sensor, ie a sensor having no detected target in front of it.
- a distance threshold is used to decide if a sensor is empty or not. Such distance threshold is called d inf on figure 34.
- sensor ⁇ i' is considered empty. If di ⁇ d inf sensor 'i' is considered occupied.
- Such filtering step may be either operated preceding the weighting step 210 illustrated on figure 33, so as to eliminate the values Sdi and di corresponding to an "empty" sensor, or may be operated to prepare a step referenced 220 on figure 33 corresponding to an analysis of coherence so as to reject all non coherent profile of morphology.
- Si values being arbitrary comprised between 0.25 and 1.75, with step of 0.25.
- a very simple way to classify the occupant, ie to determine the morphology of an occupant detected on a seat, would be to operate a straight calculation by counting up the number of pixel of the sensors 100S1 to 100S6 which are covered by a target.
- the inventors propose, in accordance with the present invention, to balance the calculated surface Si by a weighting parameter Wi based on the corresponding respective distance di.
- the minimum distance di among sensors 100S1 to 100S6 (at least for the four sensors 100S1, 100S2, 100S5, 100S6) is detected. Then after for each sensor 100S1, 100S2, 100S5 and 100S6, a balanced coefficient called "Wi" is calculated.
- Coefficient Wi may be calculated according to a plurality of functions.
- each surface Si calculated for each sensor 100 is multiplied at step 210 by the corresponding Wi coefficient, and this for sensors 100S1, 100S2, 100S5, 100S6.
- Such weighting step 210 takes into account the passenger outline and get a passenger consistent pattern surface.
- weighting step 210 allows to distinguish between two occupant profiles being in a standard centred position on a seat, as illustrated on figure 35, one being a narrow profile and the other being a wide profile. Without such a weighting prosecution 210, the values of Si obtained for the two occupant profiles would have similar issues when determining the morphology.
- the inventors propose to operate a step 220 to eliminate non coherent profiles. Indeed the inventors have uncovered that some specific situations may lead to non coherent profiles.
- a specific non coherent profile is for example the case of a child well seated in the middle of the seat but with hand on bolster. This of course could cause an error because the sensors 100 "see” the child's breadth bigger and could cause a misclassification (a child is seen like an adult).
- the step 220 comprises firstly a "centre detection” step.
- the aim of this centre detection step is to retain only the information corresponding to a sensor 100 which is considered as totally covered. Indeed in practice, this is rarely reached since many passengers have bad positioning.
- figure 36 shows an atypical case of a child with hand on bolster leading to a down slope between sensor 100S4 and sensor 100S5.
- FIG 37 illustrates detection of a "hole” (that means a detected distance which is greater than dinf (for example but non limitatively a distance greater than 20 mm).
- a hole that means a detected distance which is greater than dinf (for example but non limitatively a distance greater than 20 mm).
- dinf for example but non limitatively a distance greater than 20 mm.
- the next adjacent sensor or pixel is not retained for classification.
- a hole that means a detected distance which is greater than dinf (for example but non limitatively a distance greater than 20 mm).
- the next adjacent sensor or pixel is not retained for classification.
- a hole is detected between sensor 100S2 and sensor 100S6
- sensors 100S1 and 100S2 are used for classification.
- Such operation is equivalent to force Si to 0 for sensor 100S6.
- So for opposite side if a hole is detected between sensor 100S1 and 100S5 only sensors 100S5 and 100S6 are used for classification.
- Such operation is equivalent to force Si
- the criteria ⁇ to determine if a sensor is covered or not and consequently if a hole exists or not, may change from a system to the other.
- the two first lines of figure 37 illustrates a case wherein a hole corresponds to a sensor fully not covered.
- the two last lines of figure 37 illustrates a case wherein a hole corresponds only to a 1 ⁇ 2 pixel, ie a 1 ⁇ 4 sensor, not covered.
- This last case may be implemented by the step referenced 230, 232, 234 and 236 on figure 33, wherein if sensor 100S2 is measured as no more than 3 ⁇ 4 covered, Si for sensor 100S1 is forced to 0, and if sensor 100S5 is measured as no more than 3 ⁇ 4 covered, Si for sensor 100S6 is forced to 0.
- the system Preferentially during analysis of no coherent profiles, the system considers the sign of the slope variation between 2 adjacent pixels for the central sensors 10081, 10052, 10055 and 10056. Examples of no coherent profile are given on figures 38 and 39 which illustrate an anomalous sign changing of slope between two adjacent pixels.
- an associated "confidence test” is operated before step 240.
- Confidence test is based preferentially on distance detection and may be calculated as follows:
- ⁇ d min d ⁇ 1 , d ⁇ 2 - d ⁇ 5 or d ⁇ 6 depending on case
- ⁇ d min d ⁇ 5 , d ⁇ 6 - d ⁇ 2 or d ⁇ 1 depending on case
- the classification of the passenger may be determined.
- this classification is operated by counting up the number of surface Si (number of pixel, or half pixel depending of the resolution wanted) of the central chain of sensors 10051, 10052, 10055, 100S6.
- a Data Base corresponding to recordation of a passengers sample is illustrated on figure 42.
- Figures 45 and 46 illustrate a variant of implantation for the sensors. More precisely, figures 45 and 46 illustrate a line of four sensors 100S1, 100S2, 100S5 and 100S6 similar to the corresponding sensors of figures 2 and 32, provided on the inset of the seat, near the back, and two additional short sensors 100S7 and 100S8 provided on the same inset of the seat, near the front part of the seat and respectively near the bolsters.
- Figure 47 illustrates another variant of implantation for the sensors, wherein the sensors 100S3 and 100S4 of figures 2 and 32 which are parallel to sensors 100S1, 100S2, 100S5 and 100S6, are replaced by sensors 100S9 and 100S10 transverse to sensors 100S1, 100S2, 100S5 and 100S6.
Abstract
Description
- The present invention relates to the technical field of sensors area.
- More precisely, the present invention concerns a system and a method to improve the morphology discrimination of a passenger seated in an automotive seat fitted with several capacitive sensors.
- A non exclusive implementation of the present invention relates to control the airbag triggering in a car.
- In the last past years, airbag in automotive area were triggered, in case of shock, by means of an accelerometer. This basic triggering didn't take in account the occupant morphology (child, small adult, medium adult, and large adult).
- Generally known airbags were triggered even if the seat is empty or occupied by a baby seated in a "CRS" (Child Restrain Seat). This last case very serious is the cause of numerous deaths.
- For these reasons henceforth some vehicles are fitted out with a switch allowing disabling airbag triggering when a CRS is mounted in seat. This switch is linked with a light indicator situated on dashboard showing the state of airbag device triggering: "on" state or "off' state.
- Since year 2003 a most restricting regulation was launched in US (FMV SS 208 regulation) compelling car manufacturer to fit out at least a third part of global car production with a detecting passenger device called "OCS" (Occupant Classification System).
- It is noticed that the airbag must not be triggered in the following conditions:
- If the seat is empty,
- If the seat is occupied by a baby seated in CRS,
- if the seat is occupied by a child less 6 years old (less than 26 kg).
- Independently regulations which will be set, business constraints all over the world, lay down an airbag smart triggering; that is to mean:
- No air bag triggering:
- for an empty seat,
- for a seat occupied by a baby seated in CRS,
- for a seat occupied by a child less 6 years old (less than 26 kg),
- Monitoring the airbag power according to occupant morphology defined as following:
- 5th percentile class (46-53 kg /1,40 -1,65 m) linked to small adult,
- 50 th percentile class (68-73 kg / 1,70-1,8 m) linked to medium adult,
- 95 th percentile class (94-98 kg /1,83-1,93 m) linked to large adult.
- However at the present time no system or method offers a fully satisfactory solution for that.
- The Applicant has filed on
July 28, 2005 a French patent application under number FR-0508072 - The Applicant has also filed on
May 17, 2006 a European patent application under number EP06290806.6 May 17, 2006 a European patent application under number EP06290807.4 - But in practice, some constraints may disturb the discrimination of passenger.
- Not restrictively such constraints may be due to a wet obstacle present on the seat, such for example in the case of a passenger (adult or child) seated with a wet raincoat, a passenger coming from beach putting a damp towel on seat before sitting on it, beverage dropping damping partial surface of seat or a shower leading to a damped seat if the window pane is bad shut..
- Other constraints may be due to no human occupation on the seat, like metallic object, suit case, pack of bottles of water, etc... provided on the seat.
- The aim of the present invention is now to propose means for allowing a more reliable discrimination of the morphology of a passenger seated in an automotive seat fitted with several capacitive sensors, in severe constraints like in the case of wet obstacles covering a seat.
- This aim is achieved according to the present invention with a method comprising the steps of providing a set of a plurality of capacitive sensors covering substantially a transversal cross section of the seat, collecting the outputs of said plurality of capacitive sensors provided on the seat, determining the morphology of a target facing the seat on the basis of measured distance separating the target from the sensors and measured surface of the sensors covered by the target, from said outputs, and comparing the determined morphology with at least a reference so as to classify the determined morphology between a plurality of reference ones.
- According to another preferential feature, the comparing step of the method of the present invention involves a mathematical function representing a morphology reference.
- According to another preferential feature, the comparing step of the method of the present invention involves a 3D reference image representing a morphology reference.
- The present invention also relates to a system for implementing the above method as well as a seat for automotive car comprising such a system.
- Other technical features, aims and advantages of the present invention will be understood from the following description which relates to the enclosed drawings wherein :
- . figure 1 illustrates a non limitative embodiment of a capacitive sensor according to the present invention,
- . figure 2 illustrates schematically the implantation of 6 capacitive sensors on a seat in conformity with an embodiment of the present invention,
- . figure 3 illustrates more precisely the implantation of 6 capacitive sensors, each comprising two pixels, on a seat in accordance with a non limitative embodiment of the present invention,
- . figure 4 illustrates an example of a realistic profile and of a non realistic profile,
- . figure 5 illustrates an example of a mathematical reference function in form of a Bell like function,
- . figures 6, 7 and 8 illustrate measurement corresponding respectively to standard children profiles, standard adult profiles and to standard big adult profiles,
- . figure 9 illustrates a table of morphology classification from a parameter issued of a comparison involving a Bell reference function,
- . figure 10 illustrates standard children profiles implementing selected erroneous inputs, so as to show the reliability of the process in accordance with the present invention,
- . figure 11 illustrates the results of a morphological classification in accordance with the present invention implementing a Bell reference function,
- . figure 12 illustrates the corresponding error distribution,
- . figure 13 illustrates schematically the construction of a mesh 3D image in accordance with the present invention,
- . figure 14 illustrates schematically the linear interpolation between two pixel sensors,
- .figure 15 illustrates an example of 3D standard profile,
- .figure 16 illustrates a 3D measured profile versus two maximal and minimal template limits,
- .figure 17 illustrates a 3D measured profile versus a 3D reference,
- .figure 18 illustrates the results of a template method on a 0-36 kg template,
- .figure 19 illustrates classification of measured profile in corresponding weight classes, in accordance with the present invention,
- . figure 20 illustrates an example of electrical potentials applied to the electrodes of said capacitive sensor during an initial step of a detecting prosecution in accordance with the present invention,
- . figure 21 illustrates schematically the individual capacitive components operating in the sensor system of the present invention,
- . figure 22 illustrates schematically the stepped displacement of a referenced target in regard of the sensor during a preparation part of the present invention,
- .figure 23 illustrates schematically the relative evolution of electrical outputs issued from the sensor in accordance with the present invention, which are used to determine parameters representative of the temperature and humidity, more precisely figure 23a illustrates curves CU1 = f (C1), while figure 23b illustrates curves CU2 = f (C2),
- . figure 24 illustrates schematically the relative evolution of other electrical outputs issued from the sensor in accordance with the present invention, which are used to determine the distance separating the target from the sensor and/or the amount of the surface of the sensor covered by said target,
- . figure 25 illustrates the construction of a look up table taking into account temperature and humidity parameters, more precisely figure 25a illustrates curves CU = f (C), figure 25b illustrates the definition of the origin of the curves and figure 25c illustrates the corresponding look up table,
- . figure 26 illustrates the dependency of a relative evolution of electrical outputs issued from the sensor with the relative position of a reference target in regard of the sensor, more precisely figure 26a illustrates curves CU2 = f (CU1) while figure 26b illustrates a sequence of relative displacements of the reference target in regard of the sensor,
- . figure 27 illustrates the construction of a look up table determining an initial offset of curve responses in relation with temperature and humidity parameters, more precisely figure 27a illustrates some points of curves CU2 = f (CU1) while figure 27b illustrates the corresponding look up table,
- . figure 28 illustrates the determination of the distance separating a target from the sensor on the basis of the combination of outputs issued from the capacitive sensor,
- . figure 29 illustrates schematically the complete detection method in accordance with the present invention,
- . figure 30 illustrates the performance of the present invention in determining the amount of the surface of the sensor covered by said target,
- . figure 31 illustrates the performance of the present invention in determining the distance separating the target from the senso,
- . figure 32 illustrates schematically the corresponding array of sensors,
- . figure 33 illustrates schematically the main steps of the method in accordance with the present invention,
- . figure 34 illustrates schematically an example of evolution of the measured distance from one sensor to the other,
- . figure 35 illustrates schematically two variants of position of occupant on a seat of car,
- . figure 36 illustrates on a curve, an example of partial rejected output due to incoherence,
- . figure 37 illustrates four other examples of partial outputs rejected for incoherence,
- . figures 38 and 39 illustrate schematically two other cases of partial rejected outputs,
- . figure 40 illustrates a Table providing an example of coherence analysis,
- . figure 41 illustrates an official regulation,
- . figure 42 illustrates a corresponding sample base,
- . figure 43 illustrates a data base obtained with the method in accordance with the present invention,
- .figure 44 illustrates an example of thresholds applied to such a data base,
- .figure 45 illustrates a second variant of implantation of capacitive sensors in accordance with the present invention,
- . figure 46 illustrates the same variant of sensors provided on a seat, and
- . figure 47 illustrates another variant of implantation of capacitive sensors in accordance with the present invention.
- As indicated above, the present invention proposes a method for reliable discrimination of the morphology of a passenger seated in an automotive seat fitted with several capacitive sensors, in severe constraints like in the case of wet obstacles covering a seat. The present invention allows in particular to control airbag triggering in function of such morphology discrimination.
- More precisely as indicated above the present invention proposes a method comprising the steps of providing a set of a plurality of
capacitive sensors 100 covering substantially a transversal cross section of a seat, collecting the outputs of said plurality ofcapacitive sensors 100 provided on the seat, determining the morphology of atarget 10 facing the seat on the basis of measured distance separating thetarget 10 from thesensors 100 and measured surface of thesensors 100 covered by thetarget 10, from said outputs, and comparing the determined morphology with at least a reference so as to classify the determined morphology between a plurality of reference ones. - An example of
capacitive sensor 100 in accordance with the present invention and an example of a set of suchcapacitive sensors 100 provided on a seat are illustrated on figures 1 and 2. Suchcapacitive sensor 100 of figure 1 and implantation ofsensors 100 on a seat illustrated on figure 2 will be described more in detail in the following specification. - More precisely the present invention proposes a method comprising preferentially the steps of collecting the outputs of a plurality of
capacitive sensors 100 provided on a seat, determining for each capacitive sensors 100 a first value di representative of the distance separating atarget 10 from thesensor 100 and a second value Sdi representative of the surface of thesensor 100 covered by thetarget 10, applying to the second values Sdi representative of the surface of thesensor 100 covered by the target 10 a respective weighting Wi based on the corresponding first value di representative of the distance separating thetarget 10 from thesame sensor 100, and determining the morphology of thetarget 10 on the basis of the collection of weighted second values SdixWi. - The distance di separating the
target 10 and eachsensor 100 and the surface Sdi of thetarget 10 covering eachsensor 100, may be obtained by any efficient means. - According to the present invention such distance di separating the
target 10 and eachsensor 100 as well as the surface Sdi of thetarget 10 covering eachsensor 100 are preferentially obtained with a method which includes means for compensating drifts caused by temperature and humidity environment. Indeed the inventors have uncovered that generally capacitive measures are very sensitive to temperature and humidity environment. - In the following description we will first describe A) the method in accordance with the present invention to discriminate the morphology of a passenger seated in an automotive seat fitted with several capacitive sensors, in severe constraints like in the case of wet obstacles covering a seat, and we will describe in a second time B) a preferential and non limitative method to obtain the distance di and the surface Sdi, and in a third time C) a preferential and non limitative method to determine the morphology of an occupant on the basis of such distance di and surface Sdi.
- The method in accordance with the present invention is directed to reliable discrimination of the morphology of a passenger seated in an automotive seat fitted with several capacitive sensors, in severe constraints like in the case of wet obstacles covering a seat.
- This method allows for example to resolve the issue of a "Children seated over a wet obstacle on a seat". In other words, the method in accordance with the present invention allows to detect the right classification of an occupant of a seat even in a case of wet towel presence.
- One of the problems that may remain with the implementation of the surface-distance determination method disclosed in European patent applications
EP06290806.6 EP06290807.4 - Considering:
- The position of
probes 100 on a seat, as illustrated on figures 2 and 3, which covers substantially the cross section of a seat (this position will be described more in detail in the following specification) - That each
probe 100 includes 2 pixels 110S1, 120S1; 110S2, 120S2; 110S3, 120S3; 110S4, 120S4; 110S5, 120S5; 110S6, 120S6 (as described in a non limitative example in patent:FR-0508072 - The different responses of each
sensor 100 resulting from the application of electric dc fields illustrated on figure 20 and treatment disclosed in patentFR-0508072 EP06290806.6 - As a passenger cannot present any kind of shape, it is possible to recognize a correct passenger buttock profile even if the profile measurement is perturbed by the distance or a wet obstacle. Furthermore as the buttock profile is linked to the passenger morphology, it should be possible to estimate the passenger morphology.
- First of all non realistic profile measurement may be rejected. Figure 4 illustrates an example of a realistic profile measurement which may be retained for further prosecution and of a non realistic profile measurement which must be rejected. Of course profile measurements presenting holes are not realistic as well and must be also rejected.
- At this point, it is possible to postulate that a realistic profile measurement must fit a given shape corresponding to a reference.
- And comparing a determined profile measurement corresponding to a measured morphology with at least such a reference allows to classify the determined morphology.
- The reference may correspond to numerous embodiments in accordance with the invention.
- According to a non limitative example in accordance with the present invention, the reference is a mathematical functions S(p) (wherein p is the pixel index).
- Once the reference shape is chosen by the way of such mathematical function, one can by fitting the reference shape to the profile measurement, estimate whether the profile measurement is likely to correspond to that reference shape. It can be done for instance by calculating an error criteria (typically a mean square criteria) that will tell whether the profile measurement is likely or not likely to correspond that reference shape.
- In addition to the likeliness test, it is possible by considering the fitting parameters values to quantify the measured shape or profile. In other words, it is possible to give a measurement of the profile that can be correlated to the passenger morphology.
- One specific mathematical function has been considered in accordance with the present invention. It was chosen because of its shape that is likely to fit a passenger buttock profile as well as because of its properties.
- The function considered is a "Bell like function" (eq 1) of order two or more.
- This Bell like function of order n is illustrated on figure 5 for
order 
wherein : - a depends on the inflexion of the bell
- b is the maximal value of S
- m is the index value p for which S(p) is maximal.
- Of course the above Bell like function S(p) may be replaced by any other equivalent function, such as and not restrictively a Gaussian function.
- This Bell like function is sharp on the edges as illustrated on Figure 5. This is interesting since the inflexion (parameter "a") which is the one that can be used for a morphology classification depends on the edges sharpness. In addition, when the order increases, the Bell like function presents an interesting flat part around its maximal value (see figure 5).
- Considering equation (1), as the parameter "m" centers the function, it can be estimated by taking the mean value.
- The parameter "b" can easily be deduced from the measured profile as well.
- As the parameter b is the maximal value the function can take, it is possible to use for instance: b = max(P(round(m)-1),P(round(m)),P(round(m)+1)) in order to take into account that the maximal value of the profile does not necessarily coincide with the medium pixel (for example pixel number four in the case of a measure implementing height pixels referenced from 0 to 8).
- The parameter "a" cannot be so simply estimated from the measured profile.
- As there is only one a parameter left to fit, it may be possible to calculate a by using an error minimizing algorithm.
- To do this work we can use the following prosecution to estimate "a".
- The surface S under the measured profile is worth:

- The surface Sb under the Bell like function is worth:

- By equalizing equation (2) and equation (3): S = Sb , one can obtain the parameter "a". Equalizing those two equations can be easily performed by using a lookup table for Sb . This method presents no convergence problem.
- The Bell like function (order 2) has been applied to selected measurements from a seat data base recorded. Here again, the selected measurement correspond to standard children profiles (Figure 6), standard adult profiles (Figure 7) and to standard big adult profiles (Figure 8).
- Considering these three figures 6, 7 and 8, one can see that the fitting is correct. The mean square error remains inferior to 4% in all cases. Furthermore the "a" parameter which is reported in the table of figure 9 clearly allows to morphologically classify the passenger whatever the distance.
- Indeed the "a" parameter is below 3 for children, and over 20 for big adults. "Standard" adults "a "parameter values stand in between 3 and 20 (about 5).
- The robustness, that is to say the resistance of the above method in accordance with the present invention to "incorrect profiles" has been tested by introducing erroneous points in the profiles as presented on figure 10. More precisely figure 10 illustrates a standard children profile with error simulating a hand on bolster.
- In this situation, the classification is erroneous. The children would be classified as an adult. This example shows it is important to consider the error in the likeliness test. Indeed, as the profile measurement is not realistic, the error in that case is not less that 30% which is much larger than for the likely profiles presented before. The error allows rejecting the erroneous profile measurements that will not be classified.
- The method using Bell like function described in the prior section has been applied to a data base recorded in a seat in order to test its performances. The results are presented in figure 11, and the corresponding error distribution in figure 12. One can see that most of the errors are grouped below 6%. This is the level that has been used to reject the points in figure 11. In this figure, the rejected points are circled. A correct classification is therefore obtained by only considering the profiles that are not rejected. The classification is correct because it allows separating children from small adults and big adults. All passenger are all classified alike over 70kg.
- The above disclosed implementation of the present invention comprises a comparing step which involves a mathematical function representing a morphology reference.
- According to another preferential implementation of the present invention, the comparing step involves a 3D reference image representing a morphology reference.
- Indeed in order to improve results, the inventors furthermore propose to deal with an image template prosecution. This image template prosecution applies the above verisimilitude or likeliness concept using all the seat probes 100.
- By using all the
probes 100, no information from the measurement is lost. - As finding a verisimilar function that works in three dimensions (up down and right left) is far more difficult than with two dimensions (a profile), the inventors propose to implement the following prosecution.
- To do so a x.y mesh (for example a 10 by 11 mesh) is used to create the profile. The mesh step is chosen preferentially in accordance with the actual probe spacing as shown in figure 13.
- An image of the passenger profile is realized as follow by interpolation of the outputs issued by the sensors.
- For the step of the mesh where there is no probe, the pixel value is interpolated from the nearest probes. For instance, the pixel {2,10} (Horizontal coordinate, vertical coordinate) of figure 13 is obtained by calculating the mean value between the measured pixels 110S4 and 120S1. When there is more than one pixel to interpolate between two real pixels such as for pixels {3,3} {3,4} and {3,5}, the intermediate pixels values are linearly interpolated between the measured pixels 110S2 and 110S3 over the distance separating them as shown on figure 14.
- In some cases, as for pixel {5,8}, the pixel is interpolated between a measured pixel (here: pixel 110S4) and an interpolated pixel (here: pixel {5.7}). This yields a more realistic interpolation.
- Finally, the image is set to the measured pixel value where there is a probe and to zero in the remaining pixels (greyed in Figure 13).
- There are three possible kinds of image.
- Firstly the image can simply be obtained by interpolating the data as described above. This way leads to a standard image.
- Secondly it is possible as well to create a dynamic image that emphasize on the measurement dynamic by subtracting the smallest measured pixel value. This way leads to an image which is restricted to its dynamic part.
- Finally one can compute a dynamic relative image by normalizing the profile between 0-100%.
- Any of those three or all three images can be computed from a single measurement. One should use one of the three kinds of image as needed. For instance, the dynamic profiles are fewer dependants on the passenger distance to the seat, but the signal intensity is lost. It is possible as well to use two or more kinds of image as well. An example of standard profile is presented on figure 15.
- As there is no simple mathematical function that simply yields a shape such as the one presented in figure 15, the inventors propose an alternate solution: "a template method" and "a reference plane method" which will be now described.
- For both methods, the goal is firstly to determine whether the image corresponding to a profile measurement is likely or not, and secondly if the image is likely to give measurement of the passenger morphology.
- To determine if an image corresponding to a profile measurement is verisimilar; the measured image is compared to a set of reference images obtained from measurement in standard known positions for different morphologies. If the comparison yields poor results then the image is not very-similar and is rejected. When the comparison is correct, the comparison result is used to classify the measured image in the morphology class corresponding to the morphology used to create the reference image.
- The "template method" consists for each weight class (for example 0 kg - 36kg, 36kg - 60kg, 60kg - 80kg, 80kg - 120kg), to elaborate a maximal template limit and a minimal template limit. The measured images are compared to the template by counting the number of pixels that belong to the template (ie the number of pixels between the maximal template limit and the minimal template limit) as illustrated in figure 16.The number of pixels belonging to the template is expressed as a percentage of the total number of pixels. Considering the number x.y of pixels (for example 10x11) in each image, one pixel represents about 0.9% of the total template.
- Another method consists in calculating a distance to a "reference plane" which is the average image for the morphology to which the measurement is compared.
- The distance to the reference plane in then calculated for example as follows:

- In equation (4), PRP (i) are the pixels of the reference plane, Pl (i) are the pixels of the measured image, and D is the distance of the image to the reference plane. Here again the distance is expressed in form of a percentage of the maximal value of the distance. This facilitates comparisons between different reference planes. In that
case 0% means that all pixels of the measured image are on the reference plane. 100% would mean that all pixels are whether worth zero or the maximal measurement value. Note that it could have been possible to use a classical normalized version for the distance:
- This method yields smoother comparisons than the template method presented previously.
- The Image "template prosecution" consists in applying the "templates methods" or the "reference plane methods" to the data base recorded in seat.
- Figure 18 displays the results obtained when applying the template method on a 0-36kg template. One can see that children fit the 0-36kg template. In the final prosecution, the measurements are compared to the templates starting by the heavy ones.
- A measurement that fits with a template is classified in the corresponding weight class. The measurements that fit no template are not classified.
- The results obtained in accordance with the above method of the present invention are presented on figure 19.
- The present invention uses a
capacitive sensor structure 100. - This
capacitive sensor 100 may be in conformity with a plurality of embodiments. - Preferentially the
capacitive sensor 100 of the present invention comprises at least twoelectrodes French patent application 05 08072 electrodes - Preferentially the
capacitive sensor 100 of the present invention comprises 3electrodes French patent application 05 08072 - The two
electrodes main electrodes main electrodes main electrodes main electrodes main electrodes - The third auxiliary electrode covers at least substantially both the two complementary respective areas of the two
main electrodes third electrode 130 surrounds said twomain electrodes - The
third electrode 130 is connected at its middle part to a transverse connectingtrack 132. Similarly the twomain electrodes tracks - Such a
sensor 100 comprising only 3outputs electrodes French patent application 0508072 similar electrodes - These capacitor values are measured by applying judiciously an electric controlled dc field between some
electrodes dedicated electrodes - These electric charges can be converted in voltage for example but not restrictively by using the means according to arrangement defined in document
WO-A-00/25098 - In other words preferentially the present invention method converts the electric charges accumulated on a selected
electrode - a first step wherein the supplying means are connected to at least one electrode so as to apply an electric field on this electrode and to accumulate electric charges on this electrode,
- and a second step wherein the supplying means are not connected to the selected electrode, and this selected electrode is connected to the input of the integrator means to transfer the electrical charges into the integrator means.
- More precisely although the disclosure of
French patent application 0508072 - (1) Phase C1 get with the following way :
- Application of Vf on
electrodes electrode 130. - Removal Vf from
electrodes electrode 130. - Put
electrodes - Count up the charges trapped on
electrode 110. This result is called C1
- Application of Vf on
- (2) Phase CU1 get with the following way :
- Application of Vf on
electrodes - Removal Vf from
electrodes - Put
electrodes - Count up the charges trapped on
electrode 110. This result is called CU1.
- Application of Vf on
- (3) Phase C2 get with the following way :
- Application of Vf on
electrodes electrode 130. - Removal Vf from
electrodes electrode 130. - Put
electrodes - Count up the charges trapped on
electrode 120. This result is called C2.
- Application of Vf on
- (4) Phase CU2 get with the following way :
- Application of Vf on
electrodes - Removal Vf from
electrodes - Put
electrodes - Count up the charges trapped on
electrode 120. This result is called CU2.
- Application of Vf on
- On figure 20 bold character identify the electrode where the charges are measured.
- The complete sensor system is illustrated in the form of an electric equivalent scheme of individual capacitive components on figure 21, wherein :
- . CBG corresponds to the capacitive component between the ground (for example the chassis of a car) and a target 10 (for example a passenger seated on a seat of a car),
- . C1B, C2B and CUB correspond respectively to the capacitive component between the
target 10 and theelectrodes - . C1G, C2G and CUG correspond respectively to the capacitive component between the ground and the
electrodes - . C1U, C12 and C2U correspond respectively to the capacitive component between the
electrodes electrodes electrodes - Each of the 4 above combinations may be expressed as the summation of capacitive components composing the sensor system illustrated on figure 21 :


- The inventors, after a lot of searches and experiments, have uncovered that using and combining some relevant information issued from the above 4 combinations can successively:
- 1 - Get information about drift caused by temperature and humidity,
- 2 - From this information, compensate drift on data, and
- 3 - From compensated data, determine, on reliable basis, surface of a target covering the sensor as well as the distance separating the sensor from the target.
- More precisely the inventors have uncovered that in order to know the behaviour of these 4 phases versus surface occupation, distance, temperature and humidity variation, it is necessary to run a measurement campaign to characterize them.
- For this, the inventors took a
conductive reference target 10 having a length which is equal to the length of the sensor 100 (ie equal to the length of theelectrode 130 and equal to the sum of the lengths of the twoelectrodes - The inventors successively displace step by step said
reference target 10 in regard of thesensor 100, in parallel to the longitudinal direction of thesensor 100. Arbitrary the inventors take a resolution of 1/4 of sensor length and m steps, with m = 7 in the non limitative example, for this displacement and surface variation. But of course any other resolution and/or number m of steps must be taken. - The displacement starts arbitrary by left side and covers the
sensor 100, on m successive steps, by incremental step of 1/4 of surface. - On figure 22:
- 1/4 L means 1 / 4 of sensor length covered by left side.
- 1 / 2 L means 1 / 2 of sensor length covered by left side.
- 3 / 4 L means 3/4 of sensor length covered by left side.
- C (for "center") means the target covers totally the
sensor 100. - 3/4 R means 3/4 of sensor length covered by right side.
- 1 / 2 R means 1 /2 of sensor length covered by right side.
- 1/ 4 R means 1 /4 of sensor length covered by right side.
- Moreover at each step of the m steps of this relative displacement, the inventors move the
reference target 10 progressively away thesensor 100, step by step, from a distance Z of 0 mm (contact) to 100 mm (considered as infinite distance). Arbitrary in a non limitative example, the inventors displaced thetarget 10 from thesensor 100 by a number n = 38 steps, from ○ mm to 100 mm. - And for each step of relative covering surface (m steps) and distance (n steps), the inventors change temperature and humidity. Arbitrary the inventors combined o = 4 different values of temperature (25°C, 40°C, 55°C and 70°C) with p = 3 different values of humidity (RH = 50%, 70% and 95%) leading to o.p = 4×3 = 12 combinations of temperature and humidity.
- All the responses corresponding to the 4 identified phases (C1, CU1, C2 and CU2) are recorded for each of the m = 7 relative positions illustrated on figure 4, that for each of n = 38 respective distances Z, and all that for each of oxp = 12 combinations of values of temperature and humidity.
- The inventors have determined that the 4 phases C1, CU1, C2 and CU2 lead to 3 typical combinations.
- First is CU1=f(C1).
- Second is CU2=f(C2).
- Third is CU1=f(CU2).
- Considering CU1=f(C1) (pixel 1) and CU2=f(C2) (pixel 2) (see figure 23) the inventors noticed that the slopes


- However the origin of each curves CUo for distance approaching the infinite is moving on, ie depends, with temperature and humidity.
- This observation of the inventors leads to a standout characteristic since the above 4 phases allow to obtain information about temperature (T°c) and humidity (RH%) couple : (T°c,RH%) = f(CUo)
- This characteristic may be explained with the phase ratio CU1/C1 = (C1B+C1G) / (C1U+C1B+C1G).
- The same terms are present at numerator and denominator, except that denominator includes further term C1U which represents the local capacitor between
electrodes - The same characteristic applies for
pixel 2, since
- Now considering CU2=f(CU1) (see figure 24) the inventors noticed :
- the angle α of CU2 versus CU1 is function of the surface of the
sensor 100 covered by the reference target 10 (here step of resolution is 1 / 4 of sensor length) whatever distance, temperature and humidity are, - the origin O of curves CU2 and CU1 are slightly depending of temperature and humidity, but the inventors determined that such offset can be compensated by means of information coming from CU1=f(C1) and CU2=f(C2),
- the position of a point P in plan CU2=f(CU1) is function of distance Z from
target 10 tosensor 100. - This characteristic can be explained with the phase ratio CU2/CU1 since

- When no
target 10 is in front of the sensor 100 (distance = infinite) slightly the same terms are at numerator and denominator of CU2 / CU1:
- In case a
target 10 partially covers thesensor 100, C1B is different from C2B because these capacitors depend on the surface of thetarget 10 covering eachpixel electrode surface covering pixel 110 andpixel 120. - The inventors have uncovered that these 3 outstanding characteristics can:
- compensate sensor drift caused by temperature and humidity,
- calculate surface occupied by a target facing the
sensor 100, and - calculate distance between
sensor 100 and a target. - More precisely on the basis of the above established facts, the inventors propose a method which is split in 2 parts : a "Preparation" part and a "Detection" part. These two parts will be described more in detail now.
- This preparation part is divided in 3 main steps : 1) the generation of a Temperature and Humidity Look Up Table "LookTRH", 2) the generation of 3 Look Up Tables corresponding to the Angle ("LookAngle")and the Origins (OCU1,OCU2) of curves Cu=f(C) ("LookOCU1" and "LookOCU2") and 3) the generation of a Distance Look Up Table ("Lookabs").
- The aim of this Table is to give a correspondence between real capacitive measures and the temperature and humidity parameters so as to compensate drift due to the temperature and humidity.
- Construction of this Table may be operated according to various process. A specific one of such process will be described as
step 1 in regard of the illustration of figure 25. - From the 2 curves:


- The 2 following slopes are calculated :


- After that interception of the 2 curves with abscissa, B1 and B2, is calculated.
writing CU1= α1 C1 + β1, abscissa B1=β1/α1
writing CU2=α2 C2 + β2, abscissa B2=β1/α2 - The average B = (B1+B2)/2 of the two calculated abscissa is determined.
- Then for each oxp couple of temperature and humidity, a Look Up Table of B = (B1+B2)/2 is constructed as illustrated on figure 25. With oxp combinations of temperature and humidity, the Look Up Table LookTRH has of course oxp inputs. In other words the shape of the LookTRH Table is oxp versus 2, ie an output B for each one the oxp inputs.
- Of course the specific table illustrated on figure 25 is only an example and may not be considered as limitative.
- The aim of Angle Look Up Table is to give a correspondence between a real capacitive measure or combination of real capacitive measures and the amount of target surface covering a sensor, for a plurality of temperature and humidity parameters.
- Construction of this Table may be operated according to various process. A specific one of such process will be described in regard of the illustration of figure 26.
- To construct the Angle Look Up Table "lookAngle", the angle Δm = ΔCU2 / ΔCU1 is calculated from the curves CU2=f(CU1) illustrated on figure 26a, for each oxp couple of temperature and humidity of Look Up Table "LookTRH" and for each of the m relative positions between the
reference target 10 and thesensor 100 illustrated on figure 26b. Figure 26b illustrates m = 7 relative positions, varying from one to the other of % of the length of thereference target 10. With oxp combinations of temperature and humidity and m relative positions, the Look Up Table LookAngle has oxpxm inputs. In other words the shape of the LookAngle Table is oxpxm versus 2, ie an output Δm for each one the oxpxm inputs. In practice such Look Up Table may be divided for example into oxp elementary Look Up Table having each m inputs. - Of course the invention is not limited to this specific embodiment.
- Then the inventors propose to construct two Tables LookOCU1 and LookOCU2 to give a correspondence between the abscissa and ordinate origins of the curves CU1 and CU2, with a plurality of temperature and humidity parameters.
- Construction of this Table may be operated according to various process. A specific one of such process will be described in regard of the illustration of figure 27.
- More precisely the inventors propose a) to calculate and trace a line CU2 = f (CU1) for m = C (for all oxp points of T/RH), b) to calculate and trace for each m a line for all oxp points of T/RH and c) to calculate the intersection of slope C and all other line m for all oxp points of T/RH.
- Then for each index T/RH, the point position averages of the abscissa origin OCU1 and the ordinate origin OCU2 of the curves CU2 = f (CU1) (see figure 27) are stored in two Look Up Tables called "LookOCU1","LookOCU2", as illustrated on figure 27b.
- With oxp combinations of temperature and humidity, the Look Up Tables LookOCU1 and LookOCU2 have oxp inputs. In other words the shape of the LookOCU1 and LookOCU2 Tables is oxp versus 2, ie an output "average of origin OCU1 or OCU2" for each one the oxp inputs.
- The aim of this Table is to give a correspondence between a real capacitive measure or a combination of capacitive measures and the distance separating a target from a capacitive sensor.
- Construction of this Table may be operated according to various process. A specific one of such process will be described as
step 3 in regard of the illustration of figure 28. - This process involves a calculation on the basis of a theorem known as Pythagore theorem.
- The inventors propose to calculate the distance separating the
target 10 from thesensor 100 on the basis of a trigonometric function involving the values CU1 and CU2 corrected by specific abscissa origin OCU1(TRH) and ordinate origin OCU2(TRH). - Considering CU2=f(CU1) and the previous Look Up Tables "LookTRH", "LookAngle", "LookOCU1" and "LookOCU2", a value

- The value ABS corresponds to the distance between the
target 10 and thesensor 100. - All the values calculated for ABS are stored in a Look Up Table called "LookAbs".
- With oxp combinations of temperature and humidity, m steps of relative displacement and n step of distances, the Look Up Table Lookabs has oxpxmxn inputs. In other words the shape of the Lookabs Table is oxpxmxn versus 2, ie an output ABS for each one the oxpxmxn inputs. In practice such Look Up Table may be divided for example into oxp elementary Look Up Table having each mxn inputs.
- In summary the preparation part leads to construction of 5 Look Up Tables: "LookTRH", "LookAngle", "LookOCU1" , "LookOCU2", "LookAbs" and 2 characteristics parameters : α1, α2 (slope of curves CU1=f(C1) and CU2=f(C2)).
- With these 5 Look Up Tables and the two characteristic parameters α1, α2, the surface of the
target 10 covering thesensor 100 and the distance separating thetarget 10 and thesensor 100 may be calculated in "real time" during the "detection part". - This detection part is divided in 4 main steps : 1) the calculation of an index pointer for "LookTRH", 2) the calculation of OCU1 and OCU2 origins, 3) the calculation of position m, and the calculation of the angle which give an information about surface occupation and 4) the calculation of distance between
target 10 andsensor 100. - Signals CU1, C1, CU2, C2 are acquired on
sensor 100 in real time. - From the two relationships CU1=f(C1) and CU2=f(C2), the α1, α2, interception abscissa and then the corresponding index pointer (B1+B2)/2 are calculated. With this index (straight or by interpolation) the T/RH couple information are pulled out from Look Up Table "LookTRH".
- 22 -STEP 2 : Calculation of OCU1 and OCU2 origins.
- With the previous T/RH couple information, the origins OCU1 and OCU2 for curve CU2=f(CU1) are pulled out from Look Up Tables "LookOCU1", "LookOCU2" (straight or by linear interpolation).
- 23 -STEP 3 : Calculation of position m, and calculation of the angle which give surface occupation .
- The slope a = (CU2-OCU2) / (CU1-OCU1) is calculated and from this calculated slope a, as well as from the T/RH couple information obtained at
step 1, a value representative of position is pulled out from Look Up Table "LookAngle". This value is representative of surface occupation by atarget 10, such as a passenger, in front ofsensor 100. - In other words for each
capacitive sensor 100, the value pulled out from the Look Up Table "LookAngle" is representative of the surface Sdi of thetarget 10, such as an occupant, covering thesensor 100. -

- Then on the basis of this value D, as well as from the T/RH couple information obtained at
step 1 and the angle value obtained atstep 3, an estimated distance is pulled out from Look Up Table "LookAbs" (straight or by linear interpolation). - In other words for each
capacitive sensor 100, the value pulled out from the Look Up Table "LookAbs" is representative of the distance di separating thetarget 10 from thesensor 100. - In summarize from data acquisition CU1, C1, CU2, C2 the above described method allows to determine to calculate surface occupation Sdi by a
target 10 placed in front ofsensor 100 and its distance di from saidsensor 100. - This complete detection method is illustrated on figure 29.
- It corresponds also to the
first step 200 of the method illustrated on figure 33. - Results got by the inventors by implementation of this method, for variation of surface in all temperature and humidity range, are displayed in figure 30. On this figure 30, Y axis corresponds to the estimated (calculated) surface Sdi while the X or abscissa axis corresponds to the real surface.
- Distances di calculated up to one inch on the basis of these results are displayed in figure 31.
- Figures 30 and 31 show that this method offers a reliable determination both of the distance di separating a
target 10 from asensor 100 and the surface Sdi of thetarget 10 covering thesensor 100. - Particularly this method allows to compensate the drifts caused by temperature and humidity.
- In order to get passenger discrimination it is necessary to place judiciously
several sensors 100 in a seat. Industrial constraints and cost issue limit of course the number of sensors. - Figures 2 and 32 illustrate a preferential but non limitative implantation of
such sensors 100 in a seat in accordance with the present invention. - The
sensors 100 illustrated on figures 2 and 32 are provided in the seating horizontal supporting part of a seat. Of course if necessaryadditional sensors 100 may be also provided in the back vertical part of the seat. - The specific and non limitative embodiment illustrated on figures 2 and 32 comprises 6
sensors 100. Preferentially eachsensor 100 comprises 3electrodes sensor 100 defines two pixels from respectivemain electrodes - We distinguish on figures 2 and 32 :
- four short pixel sensors (having typically a length about 9 cm) 100S1, 100S2, 100S5 and 100S6, and
- two long pixel sensors (having typically a length about 29 cm) 100S3 and 100S4.
- Sensors 100S1 and 100S6 are provided on the external lateral parts of the seat, named bolster.
- Sensors 100S2 and 100S5 are provided on the central part of the seat, in the vicinity of said bolster.
- Preferentially all four sensor 100S1, 100S2, 100S3 and 100S4 are aligned from left to right on the seat, approximately in the middle of the depth of the seat, ie approximately at the same distance from the front and the back of the seat.
- Sensor 100S3 and 100S4 are provided respectively on each side of the sensors 100S2 and 100S5, on the central part of the seat, sensor 100S3 being placed at onward of seat while sensor 100S4 is placed backward of seat.
- For each of the 6 sensors (100S1 to 100S6) a surface occupation Sdi and an associated distance di is determined, as schematically illustrated by
step 200 on figure 33. - When each
sensor 100 comprises two pixels corresponding tomain electrodes sensors 100 leads to 12 individual information pixel. - Preferentially the method in accordance with the present invention comprises a filtering step to determine the values Sdi and di corresponding to an "empty" sensor, ie a sensor having no detected target in front of it.
- A distance threshold is used to decide if a sensor is empty or not. Such distance threshold is called dinf on figure 34.
- If di > dinf then sensor `i' is considered empty. If di ≤ dinf sensor 'i' is considered occupied.
- For example we can choose dinf = 20mm
- Such filtering step may be either operated preceding the
weighting step 210 illustrated on figure 33, so as to eliminate the values Sdi and di corresponding to an "empty" sensor, or may be operated to prepare a step referenced 220 on figure 33 corresponding to an analysis of coherence so as to reject all non coherent profile of morphology. - The characterization of all the sensors 100S1 to 100S6 is done arbitrary from left side to right side. Depending of the value Sdi determined for each "occupied"
sensor 100, corresponding Si values are established, Si values being arbitrary comprised between 0.25 and 1.75, with step of 0.25. Si = 0.25 corresponds to the case illustrated on the bottom of figure 22 (1/4 of sensor covered from left). Si = 1 corresponds to the case illustrated on the middle of figure 22, ie a target centred on the sensor. Si = 1.75 corresponds to the case illustrated on the top of figure 22 (1/4 of sensor covered from right). - For using this characterization in the seat it is necessary to re-direct sensor sense because sensor placement is symmetrical and of course variation between left side and right side are in opposite.
- In other words for left side surface detected sense (sensor 100S1 and 100S2) the retained Si is moving from 0.25 to 1.75.
- For right side (sensor 100S5 and 100S6), sense surface detected is in opposite sense. Consequently the retained Si is =2-Sdetected.
- A very simple way to classify the occupant, ie to determine the morphology of an occupant detected on a seat, would be to operate a straight calculation by counting up the number of pixel of the sensors 100S1 to 100S6 which are covered by a target.
- However such a simple method is distorted and causes some errors.
- Indeed surface projection on
sensor 100 is always seen in the same way, whatever the distance di is. In other words with such a simple calculation method, the passenger's outline would not be taken into account and some time errors can occur. - To avoid this disturbance the inventors propose, in accordance with the present invention, to balance the calculated surface Si by a weighting parameter Wi based on the corresponding respective distance di.
- To do this, the minimum distance di among sensors 100S1 to 100S6 (at least for the four sensors 100S1, 100S2, 100S5, 100S6) is detected. Then after for each sensor 100S1, 100S2, 100S5 and 100S6, a balanced coefficient called "Wi" is calculated.
- Coefficient Wi may be calculated according to a plurality of functions.
- Preferentially coefficients Wi =(di-dinf)/ [min(d1 to dp) -dinf]
- Wherein
di = distance calculated for sensor i,
dinf = infinite distance, that is to mean when seat is considered empty (for example 20 mm),
min(d1 to dp) = minimum distance calculated for all p sensors 100S1, 100S2, 100S5,100S6. - After calculation of coefficients Wi, each surface Si calculated for each
sensor 100 is multiplied atstep 210 by the corresponding Wi coefficient, and this for sensors 100S1, 100S2, 100S5, 100S6.Such weighting step 210 takes into account the passenger outline and get a passenger consistent pattern surface. - For example
such weighting step 210 allows to distinguish between two occupant profiles being in a standard centred position on a seat, as illustrated on figure 35, one being a narrow profile and the other being a wide profile. Without such aweighting prosecution 210, the values of Si obtained for the two occupant profiles would have similar issues when determining the morphology. - Wi values are illustrated on the left of figure 33. Wi is maximum with the minimal distance di. Note that if measured di > dinf, then we consider di = dinf.
- After the
weighting step 210, and before counting up all elementary surfaces Si atstep 240, the inventors propose to operate astep 220 to eliminate non coherent profiles. Indeed the inventors have uncovered that some specific situations may lead to non coherent profiles. - A specific non coherent profile is for example the case of a child well seated in the middle of the seat but with hand on bolster. This of course could cause an error because the
sensors 100 "see" the child's breadth bigger and could cause a misclassification (a child is seen like an adult). - Preferentially the
step 220 comprises firstly a "centre detection" step. The aim of this centre detection step is to retain only the information corresponding to asensor 100 which is considered as totally covered. Indeed in practice, this is rarely reached since many passengers have bad positioning. - Preferentially the centre detection step considers a
sensor 100 is totally covered (centre position) if the surface Si is included between value defined as 1- α =< Si =< 1+ α, with for example α = 0.25. Threshold α may be modified if necessary. - Consequently the information issued from the sensor is not retained if Si<1- α or if Si >1+ α.
- Secondly the
coherence analysis step 220 comprises preferentially a step for distinguishing two adjacent sensors surface Si and Si+1 (greater or lesser) considering a second parameter β in order to know the slope progression from one sensor to another. That means if the surface Si move like : Si < S(i+1) + β or Si > S(i+1) - β there is variation and the slope of variation is calculated and compared with a respective threshold for coherence analysis. For example β =0.125. - Multiplying all surfaces Si by the balance coefficient Wi (Si*Wi) and managing surface tolerance as described above, allow to check the consistency of profile in order to detect anomaly and avoid misclassification.
- After these treatments, for all elementary surface Si by Wi, α, β, some atypical cases may be eliminated at
step 220. - For example figure 36 shows an atypical case of a child with hand on bolster leading to a down slope between sensor 100S4 and sensor 100S5.
- Such a profile is not contiguous like the one of figure 35. This profile which is typically a small child seated in the central inset of the seat with his left hand lay down on bolster, must be eliminated at
step 220. - Other typical non coherent cases are illustrated on figure 37. This figure 37 illustrates detection of a "hole" (that means a detected distance which is greater than dinf (for example but non limitatively a distance greater than 20 mm). In case of such detection of a hole, the next adjacent sensor or pixel is not retained for classification. For example if a hole is detected between sensor 100S2 and sensor 100S6, only sensors 100S1 and 100S2 are used for classification. Such operation is equivalent to force Si to 0 for sensor 100S6. So for opposite side if a hole is detected between sensor 100S1 and 100S5 only sensors 100S5 and 100S6 are used for classification. Such operation is equivalent to force Si to 0 for sensor 100S1.
- The criteria α to determine if a sensor is covered or not and consequently if a hole exists or not, may change from a system to the other.
- The two first lines of figure 37 illustrates a case wherein a hole corresponds to a sensor fully not covered.
- The two last lines of figure 37 illustrates a case wherein a hole corresponds only to a ½ pixel, ie a ¼ sensor, not covered. This last case may be implemented by the step referenced 230, 232, 234 and 236 on figure 33, wherein if sensor 100S2 is measured as no more than ¾ covered, Si for sensor 100S1 is forced to 0, and if sensor 100S5 is measured as no more than ¾ covered, Si for sensor 100S6 is forced to 0.
- Preferentially during analysis of no coherent profiles, the system considers the sign of the slope variation between 2 adjacent pixels for the
central sensors - After normalization of all elementary surfaces Si by Wi coefficients, all possible cases for "hole" detection and their treatment are considered, so for the detection of all abnormal slope variation between two adjacent sensors (with the treatment of α and β parameters described previously).
- An example of "truth table" for such treatment is illustrated on figure 40.
- Thirty two cases are listed. "Left side" relates to left sensors 100S1 and 100S2. "Right side" relates to right sensors 100S6 and 100S5. On figure 40 the state of each sensor is identified as E = empty, L= left occupation, C = center (means sensor totally covered) and R= right occupation.
- On figure 40 :
- first line corresponds to the case of two adjacent sensors 100S1 and 100S2 or 100S5 and 100S6 which are detected empty. This case is not taken into account.
- . second line corresponds to the case of an external sensor 100S1 or 100S6 empty, but only an adjacent part of the next sensor 100S2 and 100S5 being occupied. Such case is also considered as erroneous and is not taken into account.
- . third and fourth lines correspond to cases wherein external sensor 100S1 or 100S6 is empty, but the next sensor 100S2 and 100S5 is either fully occupied or occupied on its part opposite said external sensor. In this case the Si value obtained for sensor 100S2 and/or sensor 100S5 is retained.
- . 5th line corresponds to cases wherein the external sensor 100S1 or 100S6 is covered only on its external part, but the adjacent sensor 100S2 or 100S5 is empty. This is a hole detection which is not retained.
- . 6th line corresponds to cases wherein both the
external sensor 10051 or 100S6 and the adjacent sensor 100S2 or 10OS5 are covered only on their external part. Such case is also considered as erroneous and is not taken into account. - . 7th line corresponds to cases wherein the external sensor 100S1 or 100S6 is covered only on its external part, while the adjacent sensor 100S2 or 100S5 is fully covered. In this case the Si value obtained for sensor 100S2 and/or sensor 100S5 is retained.
- . 8th line corresponds to cases wherein the external sensor 100S1 or 100S6 is covered only on its external part, while the adjacent sensor 100S2 or 100S5 is covered on its opposite part. In this case the Si value obtained for sensor 100S2 and/or sensor 100S5 is retained.
- . 9th line corresponds to cases wherein the external sensor 100S1 or 100S6 is fully covered, but the adjacent sensor 100S2 or 100S5 is empty. This is a hole detection which is not retained.
- . 10th line corresponds to cases wherein the external sensor 100S1 or 100S6 is fully covered, but the adjacent sensor 100S2 or 100S5 is only covered on a part adjacent said external sensor. In this case a summation of the signal obtained from these couples of sensors (100S1 and 100S2 or 100S5 and 100S6) is operated only if the opposite internal sensor (ie respectively 100S5 and 100S2) is empty. Otherwise the signals are eliminated.
- . 11th line corresponds to cases wherein both the sensors 100S1 and 100S2 or 100S5 and 100S6 are fully covered. In such case the signals are summed.
- . 12th line corresponds to cases wherein the external sensor 100S1 or 100S6 is fully covered, but the adjacent sensor 100S2 or 100S5 is only covered on a part opposite this external sensor. In such a case, the signal issued from the internal sensor 100S2 and/or 100S5 is retained, but the signal issued from the external sensor 100S1 and/or 100S6 is retained only if S1 < S2 + β or S6 > S5 - β.
- . 13th line corresponds to cases wherein the external sensor 100S1 or 100S6 is covered only on its internal part, and the adjacent sensor 100S2 or 100S5 is empty. This is a hole detection which is not retained.
- . 14th line corresponds to cases wherein the external sensor 100S1 or 100S6 is covered only on its internal part, and the adjacent sensor 100S2 or 100S5 is only covered on a part adjacent said external sensor. In this case a summation of the signal obtained from these couples of sensors (100S1 and 100S2 or 100S5 and 100S6) is operated only if the opposite internal sensor (ie respectively 100S5 and 100S2) is empty. Otherwise the signals are eliminated.
15th line corresponds to cases wherein the external sensor 100S1 or 100S6 is covered only on its internal part, and the adjacent sensor 100S2 or 100S5 is fully covered. In such case the signals are summed. - . 16th line corresponds to cases wherein the external sensor 100S1 or 100S6, as well as the adjacent sensor 100S2 or 100S5 are covered only on their internal part. In such a case, the signal issued from the internal sensor 100S2 and/or 100S5 is retained, but the signal issued from the external sensor 100S1 and/or 100S6 is retained only if S1 < S2 + β or S6 > S5 - β.
- In order to have an information about the quality of the discrimination, preferentially an associated "confidence test" is operated before
step 240. - Confidence test is based preferentially on distance detection and may be calculated as follows:
- Confidence rate for empty seat cases :
c = 1 - (number of occupied sensors/ total number of sensors) - Confidence rate when classification is impossible (small sensors 100S1, 100S2, 100S3 and 100S4 are all empty) :
c=0 - The confidence rate for others cases (occupied seat) is based on distance parameter:

- In order to have a confidence, 0 < c < 1 :

- For backward position :

- For forward position :

- For left positioning :

- For right positioning :

- Of course as soon as an anomaly like no coherent profile, hole, no coherent slope, is detected, the confidence test is decreased.
- After these different treatments, the classification of the passenger may be determined.
- Preferentially this classification is operated by counting up the number of surface Si (number of pixel, or half pixel depending of the resolution wanted) of the central chain of
sensors 
- After regarding statistical distribution linked with hip width versus morphological class, different threshold are expressed as number of pixel for all classes.
- Typically FMVSS 208 regulation is displayed on Figure 41.
- A Data Base corresponding to recordation of a passengers sample is illustrated on figure 42.
- The results get with this Data Base are listed on figure 43.
- Analysis of these results leads to demonstration that a threshold separates the Σ SixWi values for child from the Σ SixWi values for adult. Typically this threshold is about 1.35 as illustrated on figure 43.
- A proposition of thresholds placement for class separation is done on figure 44. Such thresholds illustrated on figure 44 are of course only non limitative examples.
- To summarize the method illustrated on figure 33 comprises the steps of :
-
Calculation 200 of di and Si for eachindividual sensor 100, -
Calculation 210 of Wi for eachindividual sensor 100, -
Treatment 220 of no coherent profile, -
Classification 240 of passengers by calculating
- Of course the present invention is not limited to the above specification which is given only for illustration. The present invention includes any alternative in conformity with the enclosed claims.
- Figures 45 and 46 illustrate a variant of implantation for the sensors. More precisely, figures 45 and 46 illustrate a line of four sensors 100S1, 100S2, 100S5 and 100S6 similar to the corresponding sensors of figures 2 and 32, provided on the inset of the seat, near the back, and two additional short sensors 100S7 and 100S8 provided on the same inset of the seat, near the front part of the seat and respectively near the bolsters.
- Figure 47 illustrates another variant of implantation for the sensors, wherein the sensors 100S3 and 100S4 of figures 2 and 32 which are parallel to sensors 100S1, 100S2, 100S5 and 100S6, are replaced by sensors 100S9 and 100S10 transverse to sensors 100S1, 100S2, 100S5 and 100S6.
Claims (27)
- A method for discriminating the morphology of a passenger seating in an automotive seat, comprising the steps of i) providing a set of a plurality of capacitive sensors (100) covering substantially a transversal cross section of a seat, ii) collecting the outputs of said plurality of capacitive sensors (100) provided on the seat, iii) determining the morphology of a target (10) facing the seat on the basis of measured distance separating the target (10) from the sensors (100) and measured surface of the sensors (100) covered by the target (10), from said outputs, and iv) comparing the determined morphology with at least a reference so as to classify the determined morphology between a plurality of reference ones.
- The method of claim 1, characterized in that it comprises a step of rejecting all non realistic profile measurements.
- The method of one of claims 1 or 2, characterized in that the comparing step involves a mathematical function S(p) representing a morphology reference.
- The method of one of claims 1 to 3, characterized in that the comparing step involves a mathematical function of Gaussian type.
- The method of one of claims 1 to 4, characterized in that the comparing step involves a Bell like function S(p) of order n :

wherein :a depends on the inflexion of the bell,b is the maximal value of S, andm is the index value p for which S(p) is maximal. - The method of one of claims 1 to 5, characterized in that the comparing step comprises determining if a profile measurement corresponds to the shape of a mathematical function.
- The method of claim 6, characterized in that determining if a profile measurement corresponds to the shape of a mathematical function comprises calculating an error criteria like a mean square criteria.
- The method of claim 5, characterized in that it comprises calculation for each profile measurement of the parameter "a " by :. determining the surface S under the profile measurement :
 . determining the surface Sb under the Bell like function :
 . equalizing the two surfaces S = Sb , to obtain "a".
 - The method of claim 8, characterized in that the equalizing step is performed by using a lookup table for S b .
- The method of one of claims 1 to 9, characterized in that the comparing step involves a 3D reference image representing a morphology reference.
- The method of claim 10, characterized in that the comparing step involves construction of a n by m mesh, by interpolation of the profile measurements, to create a profile.
- The method of claim 11, characterized in that the construction of the n by m mesh is operated on the basis of the following rules :. for the pixels of the mesh where there is no probe, the pixel value is interpolated from the nearest probes,. for the areas of the mesh where there is more that one pixel to interpolate between two measured pixels, the intermediate pixels values are linearly interpolated between the measured pixels over the distance separating them.
- The method of claim 11 or 12, characterized in that the construction of the n by m mesh comprises generating some pixels of the mesh by interpolation between a measured pixel and a previously interpolated pixel.
- The method of one of claims 1 to 13, characterized in that the comparing step comprises comparing a profile measurement with a maximal template limit and with a minimal template limit.
- The method of claim 14, characterized in that the comparing step comprises counting the number of pixels of a profile measurement that belongs to the template.
- The method of one of claims 1 to 15, characterized in that the comparing step comprises calculating a distance between a profile measurement and a reference plane.
- The method of claim 16, characterized in that the distance to the reference plane in calculated as follows:

wherein, PRP (i) are the pixels of the reference plane, P,(i) are the pixels of the measured image, and D is the distance of the image to the reference plane. - The method of claim 16, characterized in that the distance to the reference plane in calculated using a normalized version for the distance:

- The method of one of claims 1 to 18, characterized in that the comparing step comprises applying both 1) an evaluation of profile measurements in regard of a template and 2) an evaluation in regard of a reference plane, and then selecting the evaluation which leads to the minimum error criteria.
- The method of one of claims 1 to 19, characterized in that the method implements a capacitive sensor (100) comprising at least two electrodes (110, 120) covering complementary respective areas of a sensed zone so as to form two balanced pixel sensors.
- The method of one of claims 1 to 20, characterized in that the method implements a capacitive sensor (100) comprising three electrodes : two main electrodes (110, 120) covering complementary respective areas of a sensed zone and a third auxiliary electrode (130) covering both said complementary respective areas.
- The method of claim 21, characterized in that the method implements a capacitive sensor wherein said third auxiliary electrode (130) surrounds the two main electrodes (110, 120).
- The method of one of claims 1 to 22, characterized in that it comprises the steps of collecting (200) the outputs of a plurality of capacitive sensors (100) provided on a seat, determining for each capacitive sensors (100) a first value representative of the distance (di) separating a target (10) from the sensor (100) and a second value (Sdi) representative of the surface of the sensor (100) covered by the target (10), applying (210) to the second values (Sdi) representative of the surface of the sensor (100) covered by the target (10) a respective weighting (Wi) based on the corresponding first value (di) representative of the distance separating the target (10) from the same sensor (100), and determining (240) the morphology of the target (10) on the basis of the collection of weighted second values (SdixWi).
- The method of one of claims 1 to 23, characterized in that the method implements at least four sensors (100S1, 100S2, 100S5, 100S6) substantially aligned from left to right on a seat.
- The method of one of claims 1 to 24, characterized in that the method implements a step of selecting a value representative of the distance (di) separating the target (10) from the sensor (100), from a look up table, using as input for this selection a combination of the outputs issued by the capacitive sensor and selecting a value representative of the amount (Sdi) of the surface of the sensor (100) covered by said target (10), from another look up table, using also as input for this selection a combination of the outputs issued by the capacitive sensor.
- The method of one of claims 1 to 25, characterized in that the method implements look up tables which contain values representative of the distance (di) separating the target (10) from the sensor (100) and/or values representative of the amount (Sdi) of the surface of the sensor (100) covered by said target (10), for a plurality of temperature and humidity values, and the method comprises the step of selecting in the look up tables an output value depending on a combination of the outputs issued by the capacitive sensor which represents real temperature and humidity.
- Seat for an automotive car characterized in that it comprises means for implementing the method in accordance with one of claims 1 to 26.
Priority Applications (4)
| Application Number | Priority Date | Filing Date | Title |
|---|---|---|---|
| EP06291030A EP1870294B1 (en) | 2006-06-23 | 2006-06-23 | Improved method using capacitive sensors for morphology discrimination of a passenger seating in an automotive seat |
| CA002592191A CA2592191A1 (en) | 2006-06-23 | 2007-06-18 | Improved method using capacitive sensors for morphology discrimination of a passenger seating in an automotive seat |
| US11/820,963 US7962311B2 (en) | 2006-06-23 | 2007-06-21 | Method using capacitive sensors for morphology discrimination of a passenger seating in an automotive seat |
| JP2007164562A JP2008046114A (en) | 2006-06-23 | 2007-06-22 | Improved method using capacitive sensor for morphology discrimination of passenger seating in automotive seat |
Applications Claiming Priority (1)
| Application Number | Priority Date | Filing Date | Title |
|---|---|---|---|
| EP06291030A EP1870294B1 (en) | 2006-06-23 | 2006-06-23 | Improved method using capacitive sensors for morphology discrimination of a passenger seating in an automotive seat |
Publications (2)
| Publication Number | Publication Date |
|---|---|
| EP1870294A1 true EP1870294A1 (en) | 2007-12-26 |
| EP1870294B1 EP1870294B1 (en) | 2012-05-23 |
Family
ID=37398818
Family Applications (1)
| Application Number | Title | Priority Date | Filing Date |
|---|---|---|---|
| EP06291030A Expired - Fee Related EP1870294B1 (en) | 2006-06-23 | 2006-06-23 | Improved method using capacitive sensors for morphology discrimination of a passenger seating in an automotive seat |
Country Status (4)
| Country | Link |
|---|---|
| US (1) | US7962311B2 (en) |
| EP (1) | EP1870294B1 (en) |
| JP (1) | JP2008046114A (en) |
| CA (1) | CA2592191A1 (en) |
Families Citing this family (8)
| Publication number | Priority date | Publication date | Assignee | Title |
|---|---|---|---|---|
| US8884916B2 (en) | 2010-12-09 | 2014-11-11 | Synaptics Incorporated | System and method for determining user input using polygons |
| EP2943383B1 (en) * | 2013-01-11 | 2020-11-04 | TK Holdings Inc. | Occupant classification system with seat back sensor |
| KR102131188B1 (en) | 2013-05-15 | 2020-07-07 | 젠썸 캐나다 유엘씨 | Combination heater and sensor |
| KR102089519B1 (en) | 2013-10-11 | 2020-03-16 | 젠썸 캐나다 유엘씨 | Occupancy sensing with heating devices |
| US9290147B2 (en) * | 2013-12-20 | 2016-03-22 | Johnson Controls Technology Company | Airbag control assembly |
| US9804717B2 (en) | 2015-03-11 | 2017-10-31 | Synaptics Incorporated | Input sensing and exclusion |
| US10112505B2 (en) * | 2016-09-21 | 2018-10-30 | Intel Corporation | Occupant profiling system |
| CN107219017A (en) * | 2017-05-26 | 2017-09-29 | 上海展扬通信技术有限公司 | Guard method, system and terminal |
Citations (2)
| Publication number | Priority date | Publication date | Assignee | Title |
|---|---|---|---|---|
| EP1308350A2 (en) * | 2001-11-02 | 2003-05-07 | Elesys North America Inc. | Wet seat and occupant detection system for protection of an air bag control |
| US20050253712A1 (en) | 2002-08-02 | 2005-11-17 | Honda Elesys Co., Ltd. | Occupant judgment device and occupant judgment method |
Family Cites Families (2)
| Publication number | Priority date | Publication date | Assignee | Title |
|---|---|---|---|---|
| US7164117B2 (en) * | 1992-05-05 | 2007-01-16 | Automotive Technologies International, Inc. | Vehicular restraint system control system and method using multiple optical imagers |
| US7436299B2 (en) * | 2001-03-02 | 2008-10-14 | Elesys North America Inc. | Vehicle occupant detection using relative impedance measurements |
-
2006
- 2006-06-23 EP EP06291030A patent/EP1870294B1/en not_active Expired - Fee Related
-
2007
- 2007-06-18 CA CA002592191A patent/CA2592191A1/en not_active Abandoned
- 2007-06-21 US US11/820,963 patent/US7962311B2/en not_active Expired - Fee Related
- 2007-06-22 JP JP2007164562A patent/JP2008046114A/en not_active Abandoned
Patent Citations (2)
| Publication number | Priority date | Publication date | Assignee | Title |
|---|---|---|---|---|
| EP1308350A2 (en) * | 2001-11-02 | 2003-05-07 | Elesys North America Inc. | Wet seat and occupant detection system for protection of an air bag control |
| US20050253712A1 (en) | 2002-08-02 | 2005-11-17 | Honda Elesys Co., Ltd. | Occupant judgment device and occupant judgment method |
Also Published As
| Publication number | Publication date |
|---|---|
| CA2592191A1 (en) | 2007-12-23 |
| JP2008046114A (en) | 2008-02-28 |
| US20080021650A1 (en) | 2008-01-24 |
| EP1870294B1 (en) | 2012-05-23 |
| US7962311B2 (en) | 2011-06-14 |
Similar Documents
| Publication | Publication Date | Title |
|---|---|---|
| EP1870294B1 (en) | Improved method using capacitive sensors for morphology discrimination of a passenger seating in an automotive seat | |
| EP1857330B1 (en) | Method for determining the morphology of an occupant in an automotive seat with capacitive sensors | |
| US7830246B2 (en) | Occupant sensor and method for seat belt or other monitoring | |
| US6831565B2 (en) | Seat occupation judging apparatus for a vehicle | |
| KR100635676B1 (en) | Vehicle occupant sensing system | |
| KR100415866B1 (en) | Identification of Occupied Shape of Vehicle Seat | |
| DE10235881B4 (en) | Occupant detection system in a motor vehicle | |
| US20060267321A1 (en) | On-board vehicle seat capacitive force sensing device and method | |
| DE10103661C1 (en) | Side impact sensing method in a vehicle | |
| US9604587B2 (en) | Occupant position detection device and airbag deployment control system | |
| US10457164B2 (en) | Seat-occupancy and occupant-class detector for motor-vehicle seat | |
| US6292727B1 (en) | Vehicle occupant presence and position sensing system | |
| EP3369610A1 (en) | System to determine the posture and weight of an occupant of a seat | |
| EP1857329A1 (en) | Method for improving the localisation of a target in regard of a sensor | |
| US7492923B2 (en) | Method and device for detecting the occupancy state of a seat | |
| US6808200B2 (en) | Method for occupant classification in a motor vehicle | |
| US20020069004A1 (en) | Method for determining a seating position of an object on a vehicle seat | |
| LU93319B1 (en) | Combined Seat Belt Buckle Monitoring and Seat Occupant Detection Circuit | |
| LU93318B1 (en) | Sensor Unit for Seat Occupant Detection and/or Seat Belt Buckle Status Detection | |
| Kumar et al. | Detection of Presence and Posture of Vehicle Occupants Using a Capacitance Sensing Mat | |
| JP2005172484A (en) | Load determination method for vehicular seat, and load determination device therefor |
Legal Events
| Date | Code | Title | Description |
|---|---|---|---|
| PUAI | Public reference made under article 153(3) epc to a published international application that has entered the european phase |
Free format text: ORIGINAL CODE: 0009012 |
|
| 17P | Request for examination filed |
Effective date: 20060718 |
|
| AK | Designated contracting states |
Kind code of ref document: A1 Designated state(s): AT BE BG CH CY CZ DE DK EE ES FI FR GB GR HU IE IS IT LI LT LU LV MC NL PL PT RO SE SI SK TR |
|
| AX | Request for extension of the european patent |
Extension state: AL BA HR MK YU |
|
| RIN1 | Information on inventor provided before grant (corrected) |
Inventor name: HIRAI, TOMOAKI Inventor name: VOISIN, FLORENT Inventor name: NINOMIYA, TAKANORI Inventor name: MAEDA, SHUNJI Inventor name: LAUNAY, CLAUDE Inventor name: DA SILVA, JOAQUIM |
|
| 17Q | First examination report despatched |
Effective date: 20080414 |
|
| AKX | Designation fees paid |
Designated state(s): DE FR GB |
|
| GRAP | Despatch of communication of intention to grant a patent |
Free format text: ORIGINAL CODE: EPIDOSNIGR1 |
|
| RIN1 | Information on inventor provided before grant (corrected) |
Inventor name: HIRAI, TOMOAKI Inventor name: DA SILVA, JOAQUIM Inventor name: MAEDA, SHUNJI Inventor name: NINOMIYA, TAKANORI Inventor name: VOISIN, FLORENT Inventor name: LAUNAY, CLAUDE |
|
| GRAS | Grant fee paid |
Free format text: ORIGINAL CODE: EPIDOSNIGR3 |
|
| GRAA | (expected) grant |
Free format text: ORIGINAL CODE: 0009210 |
|
| AK | Designated contracting states |
Kind code of ref document: B1 Designated state(s): DE FR GB |
|
| REG | Reference to a national code |
Ref country code: GB Ref legal event code: FG4D |
|
| REG | Reference to a national code |
Ref country code: DE Ref legal event code: R096 Ref document number: 602006029633 Country of ref document: DE Effective date: 20120719 |
|
| PLBE | No opposition filed within time limit |
Free format text: ORIGINAL CODE: 0009261 |
|
| REG | Reference to a national code |
Ref country code: FR Ref legal event code: ST Effective date: 20130228 |
|
| STAA | Information on the status of an ep patent application or granted ep patent |
Free format text: STATUS: NO OPPOSITION FILED WITHIN TIME LIMIT |
|
| REG | Reference to a national code |
Ref country code: DE Ref legal event code: R119 Ref document number: 602006029633 Country of ref document: DE Effective date: 20130101 |
|
| GBPC | Gb: european patent ceased through non-payment of renewal fee |
Effective date: 20120823 |
|
| PG25 | Lapsed in a contracting state [announced via postgrant information from national office to epo] |
Ref country code: DE Free format text: LAPSE BECAUSE OF NON-PAYMENT OF DUE FEES Effective date: 20130101 Ref country code: FR Free format text: LAPSE BECAUSE OF NON-PAYMENT OF DUE FEES Effective date: 20120723 |
|
| 26N | No opposition filed |
Effective date: 20130226 |
|
| PG25 | Lapsed in a contracting state [announced via postgrant information from national office to epo] |
Ref country code: GB Free format text: LAPSE BECAUSE OF NON-PAYMENT OF DUE FEES Effective date: 20120823 |