EP1818746A1 - Procédé de surveillance de condition - Google Patents
Procédé de surveillance de condition Download PDFInfo
- Publication number
- EP1818746A1 EP1818746A1 EP06119665A EP06119665A EP1818746A1 EP 1818746 A1 EP1818746 A1 EP 1818746A1 EP 06119665 A EP06119665 A EP 06119665A EP 06119665 A EP06119665 A EP 06119665A EP 1818746 A1 EP1818746 A1 EP 1818746A1
- Authority
- EP
- European Patent Office
- Prior art keywords
- data
- fleet
- monitoring
- scaling
- network
- Prior art date
- Legal status (The legal status is an assumption and is not a legal conclusion. Google has not performed a legal analysis and makes no representation as to the accuracy of the status listed.)
- Withdrawn
Links
Images


Classifications
-
- G—PHYSICS
- G05—CONTROLLING; REGULATING
- G05B—CONTROL OR REGULATING SYSTEMS IN GENERAL; FUNCTIONAL ELEMENTS OF SUCH SYSTEMS; MONITORING OR TESTING ARRANGEMENTS FOR SUCH SYSTEMS OR ELEMENTS
- G05B17/00—Systems involving the use of models or simulators of said systems
- G05B17/02—Systems involving the use of models or simulators of said systems electric
-
- G—PHYSICS
- G05—CONTROLLING; REGULATING
- G05B—CONTROL OR REGULATING SYSTEMS IN GENERAL; FUNCTIONAL ELEMENTS OF SUCH SYSTEMS; MONITORING OR TESTING ARRANGEMENTS FOR SUCH SYSTEMS OR ELEMENTS
- G05B23/00—Testing or monitoring of control systems or parts thereof
- G05B23/02—Electric testing or monitoring
- G05B23/0205—Electric testing or monitoring by means of a monitoring system capable of detecting and responding to faults
- G05B23/0218—Electric testing or monitoring by means of a monitoring system capable of detecting and responding to faults characterised by the fault detection method dealing with either existing or incipient faults
- G05B23/0243—Electric testing or monitoring by means of a monitoring system capable of detecting and responding to faults characterised by the fault detection method dealing with either existing or incipient faults model based detection method, e.g. first-principles knowledge model
- G05B23/0254—Electric testing or monitoring by means of a monitoring system capable of detecting and responding to faults characterised by the fault detection method dealing with either existing or incipient faults model based detection method, e.g. first-principles knowledge model based on a quantitative model, e.g. mathematical relationships between inputs and outputs; functions: observer, Kalman filter, residual calculation, Neural Networks
-
- G—PHYSICS
- G06—COMPUTING; CALCULATING OR COUNTING
- G06Q—INFORMATION AND COMMUNICATION TECHNOLOGY [ICT] SPECIALLY ADAPTED FOR ADMINISTRATIVE, COMMERCIAL, FINANCIAL, MANAGERIAL OR SUPERVISORY PURPOSES; SYSTEMS OR METHODS SPECIALLY ADAPTED FOR ADMINISTRATIVE, COMMERCIAL, FINANCIAL, MANAGERIAL OR SUPERVISORY PURPOSES, NOT OTHERWISE PROVIDED FOR
- G06Q10/00—Administration; Management
- G06Q10/06—Resources, workflows, human or project management; Enterprise or organisation planning; Enterprise or organisation modelling
-
- G—PHYSICS
- G06—COMPUTING; CALCULATING OR COUNTING
- G06Q—INFORMATION AND COMMUNICATION TECHNOLOGY [ICT] SPECIALLY ADAPTED FOR ADMINISTRATIVE, COMMERCIAL, FINANCIAL, MANAGERIAL OR SUPERVISORY PURPOSES; SYSTEMS OR METHODS SPECIALLY ADAPTED FOR ADMINISTRATIVE, COMMERCIAL, FINANCIAL, MANAGERIAL OR SUPERVISORY PURPOSES, NOT OTHERWISE PROVIDED FOR
- G06Q50/00—Systems or methods specially adapted for specific business sectors, e.g. utilities or tourism
- G06Q50/06—Electricity, gas or water supply
Definitions
- the invention pertains to a method of condition monitoring of a fleet of plants, machines, or processes. It pertains in particular to a method of condition monitoring of a fleet of electrical power generation plants as well as machines and processes associated with such power plants.
- Condition monitoring allows optimization of plant operation and determination of expected operational lifetime of its components. It is also intended for early detection of operational parameters that exceed given normal operational ranges and alerting of plant engineers of operational problems or failure developments. As such, it can effectively reduce potential and costly downtime and increase operation safety and performance of a power plant or its associated machines. It also allows reliable indication of necessary maintenance.
- WO 02/086726 discloses a method of monitoring and controlling a single machine or process using a combination of diagnostics and model-based monitoring and control. Estimated sensor values are generated by an empirical model based system and compared to actual sensor values. Residual values obtained by subtraction of estimated values from real values are subjected to a sequential probability ratio test, which allows early detection of deviations of the residuals from a threshold value.
- WO 02/057856 discloses a predictive monitoring of a single process or machine based on empirical model-based surveillance or control.
- a representative set of sensor data is used that is consistently adapted and updated by the addition of newly acquired values, which replace the previous values.
- US 2004/0243636 discloses a method of monitoring the condition of an entire fleet of power plants.
- a common software platform serves to monitor the fleet, where a modeling method is coupled with an incident logic engine for registering power plant incidents.
- a specific model is created for each member or asset of the fleet to be monitored. For this, historic data from each plant is used to create a model for an operating condition considered normal.
- Each specific model is called up individually to generate a model for that particular fleet member, which is used to estimate engine operation parameters during real-time operation. The estimated operational parameters are compared to actual measurements of the same parameters in order to produce residual signals, which can indicate the condition of the plant.
- Each individual empirical model is adapted incrementally requiring separate model maintenance for each member in the fleet.
- the maintenance of the models involves the analysis of a large amount of data for each member of the fleet and hence a large effort in terms of engineers' time and computing power.
- the method shall be developed and maintained with reduced effort compared to the methods of the state of the art. Furthermore, it shall not require prior knowledge of the physical process performed by the machine or processes.
- the method shall in particular ensure optimal monitoring sensitivity comparable to that of known methods.
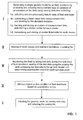
- a method of monitoring a fleet of plants, machines, or processes comprises a training or generating model mode followed by a monitoring or test mode, the method including the steps:
- the single generic model for all fleet members is based on past or historic data of members of the fleet operating in several normal operation modes.
- a normal operation mode of a plant or machine is, for example, the operation of an electrical power plant at a typical load within expected ranges of power output and efficiency and at typical environmental conditions.
- the single generic model here also referred to as a generic network, is generated using data-driven novelty detection (ND).
- ND data-driven novelty detection
- the use of such novelty-detection allows that no previous knowledge of the physical process occurring in the plant or machine is required.
- the generic network contains measurements of all pertinent parameters of all fleet members as well as the interrelationships between said measurements.
- the method comprises the steps of:
- a plant, machine, or process changes as time progresses, for example due to degradation of its components, properties such as size, shape, thermal and chemical composition, etc.
- it is necessary, or at least preferable, to adapt the generic network by adding new data points according to new measurements during operation of the machine or process while maintaining all previously existing data in the network.
- clustering of newly added data is first carried out before appending it to the network.
- the method according to the invention essentially comprises two stages, the generation or training of a generic network for the entire fleet and the actual monitoring of each fleet member using the generic network.
- the method is characterized by time and engineering efficiency realized by the concept of the generation of one single generic network for use for the entire fleet. Additionally, the generation of the generic network in itself is performed efficiently in terms of time and engineering effort due to the use of novelty detection and clustering.
- the generic network is maintained in a further stage of the method.
- the generic network is adapted or retrained by the addition of further new data without the deletion of previous data. The mere addition of data is enabled by the use of novelty detection.
- the adaptation of the network is again characterized by time and engineering efficiency as only one model must be adapted or maintained.
- the method according to the present invention uses an empirical data-driven model.
- the development of a data-driven empirical model is easier than that of a physical model, in particular for a multidimensional process as found in an electrical power plant.
- the generation of data-driven models for such plants is time consuming, especially if a model for each member of an entire fleet of plants must be generated. Therefore, it is desirable to limit the effort involved.
- the presently disclosed method is characterized by the use of a generic network that serves as a model for an entire fleet of plants, machines, or processes, as opposed to only for a single member of a fleet. It allows a time efficient generation, adaptation, and scaling of the model for the generation of the generic model and monitoring thereof.
- the model is efficiently generated by means of efficient analysis of historic data enabled by the use of novelty detection tools.
- the sensitivity of the generic model is upheld by scaling of the input data using the mean values and standard deviations from each individual fleet member.
- the use of a generic model or network effects a significant reduction of the engineering effort. For example, the time required to generate models is reduced from several weeks or months to only a few days for an entire fleet.
- the computing effort is also significantly reduced by the application of the novelty detection tools and clustering, which allow that only one data analysis needs to be performed for the generation of the generic model. Consequently, the updating and maintenance of the model is also realized in a shorter time frame. While an enormous advantage is gained in terms of time and the amounts of data to be handled, the monitoring sensitivity is maintained at a level comparable to that of methods of the state of the art due to the use of the mentioned scaling factors for each individual fleet member.
- the use of novelty detection and clustering methods enables the efficient data analysis in generating the model network and further enables the efficient adaptation of the model during monitoring.
- it allows the adaptation of the network by simple addition of new data to the network.
- Old states of a fleet member which represent valid operation condition of the fleet member could be encountered again and are thus of value in the model.
- the novelty detection tool is data-driven in that it uses past or historic data acquired during operation of the machine or plant during a given typical operation mode.
- the generation of the network or model generated from this data therefore requires no previous knowledge of the physical process performed by the machine or plant.
- the generated network encompasses not only all the acquired data but also all the interrelationships between the different measured data. For this reason the method according to this invention is particularly suited for large dimensional processes as found in an electrical power plant or a chemical process plant and where physical models are particularly difficult to obtain.
- the presently disclosed method ensures an optimal sensitivity in spite of the use of a generic network.
- the sensitivity is upheld due to the use of the individual scaling of the input data from each fleet member for the generic network.
- the sensitivity of the monitoring of a particular fleet member achieved by this method is close and comparable to the sensitivity that would be achieved by a model specifically generated for that particular fleet member without the use of the generic network.
- the method according to the invention has a particular advantage for the monitoring of a new fleet member added to an existing fleet. Normally, for a newly commissioned plant or machine, at first data would need to be collected in order to establish a data set to be added to the model.
- the method according to the invention however, enables immediate monitoring using the generic network and using scaling factors derived from other similar plants in the fleet.
- the derived scaling factors can be used for scaling the input data and then monitoring the plant operation. Since derived scaling factors are used in this case, as opposed to scaling factors specific to the fleet member, the sensitivity to faults would naturally be compromised. Such a set-up hence allows the detection of gross faults in the new plant until specific scaling factors are obtained for the new plant as operating data is collected.
- step I The generation of the generic network (step I), which is herein also referred to as the training of the generic network, is carried out by careful selection of a data set (or training data set) representing the normal operation of the monitored electrical power plant (step Ia).
- the normal operation refers, for example, to the operation of the power plant at a typical load, at typical atmospheric conditions (e.g. pressure, temperature, humidity), for a typical performance (e.g. power output, efficiency, pollutant levels) that the power plant was designed for.
- a selected data set includes for example data from over 250 variables monitoring the flow of compressed air from the compressor (pressure, temperature), outside temperature and pressure, flow of fuel into the combustion systems, temperature values at various turbine stages and components, vibration signals from bearings, etc.
- the data for the generation, or training, of the network is selected and pre-processed (step la).
- the pre-processing phase comprises outlier removal and transient data removal.
- Outliers can either be removed through manual inspection of the data or by an automated method using software designed to detect them.
- Transients associated with operating point changes or shifts are removed from the data sets. This can be performed either manually, which can be time consuming, or by an automated method using a software designed for each variable and/or operating condition.
- Generating or training the network is carried out using a thus carefully selected data set representing a normal or typical operation of a power plant to be monitored.
- step lb the data is standardized, normalized or scaled (step lb) in a way that ensures each variable has equal weight. This is done for example by first subtracting from the data the sample mean of each variable because the objective is to capture the variation of the data from the mean. Secondly, each variable of the mean centered data is divided by its standard deviation. This scales each variable to unit variance ensuring that the process variables with high variances do not dominate. This procedure must be carried out prior to generating or training the network. The mean values and standard deviations are stored in a file for further use in scaling of the individual input data from the individual fleet members during monitoring mode.
- step Ic clustering
- k-means clustering as known in the state of the art is used (e.g. J. B. MacQueen (1967): "Some Methods for classification and Analysis of Multivariate Observations, Proceedings of 5-th Berkeley Symposium on Mathematical Statistics and Probability", Berkeley, University of California Press, 1:281-297 ).
- the number of clusters to represent the data must also be determined.
- the choice of number of clusters affects how accurately the network represents the training data and hence affects the sensitivity of the network and the final condition monitoring.
- the number of clusters is determined by two different ways.
- the first is known as the Davies-Bouldin (DB) Cluster Validity Algorithm (described in Davies D.L. and Bouldin D.W., "A Cluster Separation Measure", IEEE Trans. Pattern Anal. Machine Intell. 1(4), p. 224-227 ).
- the algorithm maximizes the distances between clusters while minimizing the distances within a cluster itself.
- a DB-index is determined as a function of the ratio of the sum of the distances within a cluster to the distance between clusters. The smaller the DB-index, the greater the quality of the clustering achieved.
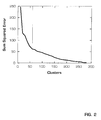
- the second way of determining the number of clusters is a visual method using a plot of the Sum Squared Error (SSE) vs. the number of clusters used in the network as shown in figure 2.
- SSE Sum Squared Error
- the extreme case would be if the number of clusters is chosen to be the same as the number of data samples, then the SSE would be zero.
- An optimal choice of number of clusters would be the point at the "knee" of the curve indicated by the intersection with the vertical line near the 50-mark.
- the network has to be trained using an incrementally increasing number of clusters and calculating the SSE for each. As this is time consuming, the procedure is speeded up by the use of random subsets of the original data set composed of a small fraction of the original data. To increase the accuracy of the estimation, the analysis is run several times using different random permutations of the data.
- This approach of using random permutations may also be applied to the obtaining of the DB-index.
- the positions of the cluster centers obtained by means of the k-means clustering are stored as reference profiles for the different operating conditions.
- Each cluster center represents the mean value of all the profiles attributed to that particular cluster during training of the network.
- thresholds for each individual cluster are calculated and stored for use by the novelty detection logic in the following test or monitoring mode.
- the cluster centers along with the calculated thresholds make up the network or model.
- the calculation of the threshold is performed by two preferred ways.
- One way is to choose a minimum/maximum threshold. This means that the threshold on a cluster center is set by the maximum deviation from the center of any of the samples in that cluster.
- Another way is to use statistical thresholds, which means to set the threshold level between 1 and several standard deviations. The choice between the two ways may be a weighing of the sensitivity of the resulting condition monitoring method and minimization of potential false alerts due to the monitoring.
- the historic input data from the individual fleet members is scaled, and the scaling factors are stored in a scaling file (step II).
- This file contains the mean values of the individual variables and their standard deviations.
- Each individual fleet member will have a set of scaling factors stored in this file.
- the stored scaling factors are based on an amount of data large enough such that it is representative of the particular fleet member in a particular operation mode.
- the scaling files are also updated during monitoring mode as the fleet members change with time.
- step III previously unseen data representing new samples collected from a power plant are tested against the stored network (step III).
- a measure of fit against the stored network is established using the Euclidean Distance (ED) or a similar multivariate distance measure.
- ED Euclidean Distance
- This is a three-phased process where the new sample of measurement data is first normalized or standardized using the stored normalization factors in the scaling file (mean and standard deviations relevant to each individual fleet member) and then in a second phase compared against all the cluster centers stored in the network.
- the measurement data sample is allocated to the Best Matching Center (BMC) according to the ED.
- BMC Best Matching Center
- the stored thresholds for the BMC in question are used to calculate the Quantization Error (QE), which is a measure of novelty or a measure of how far the measurement data during monitoring or test is away from the training data according to the network or model.
- QE is a measure of how far the test sample is outside the thresholds surrounding the BMC.
- an alert or warning signal, or any appropriate control signal is given, for example by email, to a control engineer or the plant operation control system (step lV).
- test data taken during monitoring mode is "cleansed" of transient data and outliers, in the same manner as the training data was selected by removal of such transients and outliers.
- this data can be prepared manually or by use of an automated process using appropriate software.
- the method according to the invention may be carried using computers with state of the art processors and current scientific analysis and display software such as MATLAB ® .
- the following shows and elaborates on the condition monitoring method performed on an electric power plant.
- a data set from a power plant representing data collected over a one-month period was used to train a network. Larger data sets would normally be used for training so that different operating conditions are included as well as varying atmospheric conditions.
- a set of test data collected over the subsequent month was presented to the network for testing.
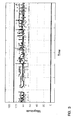
- the results are shown in the plot in figure 3.
- the plot relates to a first variable.
- the solid black line shows the trend of the actual test data as a function of time.
- the broken black lines at the top and bottom of the plot show the lower and upper range of data encountered in the training set for the particular variable.
- the dark gray lines and the light gray lines show the upper and lower thresholds respectively of the particular BMC selected as being closest to the current data sample.
- the control engineer or plant operator is enabled to detect and correct problems in time before larger problems or dropping plant performance develop.
- the monitoring process can be made relatively easy for the plant operator. Instead of having to analyze many variables, it is possible to focus on a particular problem with little effort. Large faults caused by one particular variable can sometimes mask other underlying problems of less severity. It is possible to overcome this problem with the novelty detection by for example excluding the top contributor and only showing the next highest contributors and focusing on the other variables and checking whether they remain within their expected ranges or a trend in the variable values.
- the generic network may be adapted or retrained as time progresses and individual components may degrade or operating conditions change (step V). For this, new measurement data is taken, standardized and scaled by subtraction of mean values and division by the standard deviation in the same manner as the initial data was standardized. The new standardized measurement data is then clustered in same manner as the initial data and finally added to the generic network.
- the network is retrained by simple addition of new data and without a complete retraining of the entire network. The addition of data is enabled by the use of novelty detection, which allows again an efficient adaptation of the network.
- the generic network is adapted in the case when a plant engineer identifies, based for example on the sum of quantization error QE or the QE of a particular set of variables, that a particular condition of the plant needs to be included in the network.
- the engineer may select interactively the data relating to the condition of the plant to be included, as shown by the boxed-in set of data in figure 5. In the shown example, only the section of data highlighted by the rectangle is chosen for the adaptation.
- the QE has values of about 4.
- the network is adapted without a retraining of the entire network and by adding the particular data to the network. Once new BMCs are added to the network, the QE is recalculated as shown in figure 6. Compared to the QE values in figure 5, the QE values in figure 6 have dropped considerably to values about 1 and 3. This indicates that the novel condition has been included and "learned" by the network.
- the method according to the invention ensures a sensitivity of monitoring comparable to models of the state of the art, such as for example a model that is specifically designed for an individual plant (as opposed to an entire fleet).
- Figures 7a-c demonstrate a comparison of the sensitivity of the method according to the invention and the sensitivity of two other models.
- Figure 7a shows the quantization error as a function of time calculated for a given power plant, i.e. the measure of novelty or of how far the test data deviates from the training data of a model.
- the plot results from a model that was specifically generated for that particular plant alone.
- the sensitivity achieved there may be considered the maximum achievable sensitivity.
- the quantization errors reach values up to 100 in one region and up to 20 in a second region of the plot.
- Figure 7b shows the quantization error calculated for the same plant over the same time period considered for figure 7a. It results from a comparison of test data against a generic fleet-wide model and scaled using a global scaling factor.
- Figure 7c finally shows the quantization errors calculated for the same plant in same time period using a generic network and individual scaling factors according to the invention.
- the magnitude of quantization errors again reach values around 100 and 20 in two different regions of the plot indicating a sensitivity comparable to that illustrated in figure 7a.
Applications Claiming Priority (1)
| Application Number | Priority Date | Filing Date | Title |
|---|---|---|---|
| US74326906P | 2006-02-10 | 2006-02-10 |
Publications (1)
| Publication Number | Publication Date |
|---|---|
| EP1818746A1 true EP1818746A1 (fr) | 2007-08-15 |
Family
ID=36998232
Family Applications (2)
| Application Number | Title | Priority Date | Filing Date |
|---|---|---|---|
| EP06119665A Withdrawn EP1818746A1 (fr) | 2006-02-10 | 2006-08-29 | Procédé de surveillance de condition |
| EP07726207.9A Not-in-force EP1982301B1 (fr) | 2006-02-10 | 2007-01-19 | Procédé de surveillance d'état |
Family Applications After (1)
| Application Number | Title | Priority Date | Filing Date |
|---|---|---|---|
| EP07726207.9A Not-in-force EP1982301B1 (fr) | 2006-02-10 | 2007-01-19 | Procédé de surveillance d'état |
Country Status (4)
| Country | Link |
|---|---|
| US (1) | US7275018B2 (fr) |
| EP (2) | EP1818746A1 (fr) |
| ES (1) | ES2688196T3 (fr) |
| WO (1) | WO2007090723A1 (fr) |
Cited By (2)
| Publication number | Priority date | Publication date | Assignee | Title |
|---|---|---|---|---|
| CN103635910A (zh) * | 2011-07-06 | 2014-03-12 | 霍尼韦尔国际公司 | 用于发电厂的操作参数的自动识别 |
| GB2529637A (en) * | 2014-08-26 | 2016-03-02 | Ge Aviat Systems Ltd | System for building and deploying inference model |
Families Citing this family (37)
| Publication number | Priority date | Publication date | Assignee | Title |
|---|---|---|---|---|
| WO2005089235A2 (fr) | 2004-03-13 | 2005-09-29 | Cluster Resources, Inc. | Systeme et procede pour fournir des messages d'objets dans un environnement informatique |
| US8782654B2 (en) | 2004-03-13 | 2014-07-15 | Adaptive Computing Enterprises, Inc. | Co-allocating a reservation spanning different compute resources types |
| US20070266388A1 (en) | 2004-06-18 | 2007-11-15 | Cluster Resources, Inc. | System and method for providing advanced reservations in a compute environment |
| US8176490B1 (en) | 2004-08-20 | 2012-05-08 | Adaptive Computing Enterprises, Inc. | System and method of interfacing a workload manager and scheduler with an identity manager |
| WO2006053093A2 (fr) | 2004-11-08 | 2006-05-18 | Cluster Resources, Inc. | Systeme et procede fournissant des executions de systeme au sein d'un environnement informatique |
| US8863143B2 (en) | 2006-03-16 | 2014-10-14 | Adaptive Computing Enterprises, Inc. | System and method for managing a hybrid compute environment |
| US9075657B2 (en) | 2005-04-07 | 2015-07-07 | Adaptive Computing Enterprises, Inc. | On-demand access to compute resources |
| US9231886B2 (en) | 2005-03-16 | 2016-01-05 | Adaptive Computing Enterprises, Inc. | Simple integration of an on-demand compute environment |
| US9249794B2 (en) * | 2006-01-24 | 2016-02-02 | American Air Liquide, Inc. | Condition-based and predictive maintenance of compressor systems |
| US8682835B1 (en) | 2006-12-15 | 2014-03-25 | Intellectual Assets Llc | Asset surveillance method and system comprising a dynamic model framework |
| US7949497B2 (en) * | 2007-04-12 | 2011-05-24 | Siemens Corporation | Machine condition monitoring using discontinuity detection |
| US8041773B2 (en) | 2007-09-24 | 2011-10-18 | The Research Foundation Of State University Of New York | Automatic clustering for self-organizing grids |
| US8712929B1 (en) | 2007-11-30 | 2014-04-29 | Intellectual Assets Llc | Dynamic data filtering system and method |
| US8700550B1 (en) | 2007-11-30 | 2014-04-15 | Intellectual Assets Llc | Adaptive model training system and method |
| US8145444B1 (en) | 2007-11-30 | 2012-03-27 | Intellectual Assets Llc | Asset surveillance system and method comprising self-calibrating fault detection |
| DE102008048956A1 (de) | 2008-09-25 | 2010-04-01 | Repower Systems Ag | Verfahren zum Überwachen eines Getriebes einer Windenergieanlage |
| US8560283B2 (en) * | 2009-07-10 | 2013-10-15 | Emerson Process Management Power And Water Solutions, Inc. | Methods and apparatus to compensate first principle-based simulation models |
| US10877695B2 (en) | 2009-10-30 | 2020-12-29 | Iii Holdings 2, Llc | Memcached server functionality in a cluster of data processing nodes |
| US11720290B2 (en) | 2009-10-30 | 2023-08-08 | Iii Holdings 2, Llc | Memcached server functionality in a cluster of data processing nodes |
| AU2013200491B2 (en) * | 2012-01-30 | 2015-02-12 | Joy Global Surface Mining Inc | System and method for remote monitoring of drilling equipment |
| US9336302B1 (en) | 2012-07-20 | 2016-05-10 | Zuci Realty Llc | Insight and algorithmic clustering for automated synthesis |
| US10222769B2 (en) | 2012-10-12 | 2019-03-05 | Emerson Process Management Power & Water Solutions, Inc. | Method for determining and tuning process characteristic parameters using a simulation system |
| US9146800B2 (en) | 2013-07-01 | 2015-09-29 | Mitsubishi Electric Research Laboratories, Inc. | Method for detecting anomalies in a time series data with trajectory and stochastic components |
| US9953271B2 (en) | 2013-11-22 | 2018-04-24 | California Institute Of Technology | Generation of weights in machine learning |
| US9858534B2 (en) | 2013-11-22 | 2018-01-02 | California Institute Of Technology | Weight generation in machine learning |
| US10558935B2 (en) | 2013-11-22 | 2020-02-11 | California Institute Of Technology | Weight benefit evaluator for training data |
| US10535014B2 (en) | 2014-03-10 | 2020-01-14 | California Institute Of Technology | Alternative training distribution data in machine learning |
| CN105511953B (zh) * | 2014-09-22 | 2019-04-05 | 中国银联股份有限公司 | 云环境下的虚拟机负载评估系统、方法以及服务节点 |
| JP6150934B1 (ja) * | 2016-10-17 | 2017-06-21 | 三菱重工業株式会社 | 情報処理方法、情報処理装置、プログラム、及び情報処理システム |
| US11205103B2 (en) | 2016-12-09 | 2021-12-21 | The Research Foundation for the State University | Semisupervised autoencoder for sentiment analysis |
| US10825262B2 (en) * | 2018-02-06 | 2020-11-03 | General Electric Company | Systems and methods for bearing health monitoring in power plants |
| US11300106B2 (en) | 2018-07-18 | 2022-04-12 | Poseidon Systems, LLC | System and method for utilizing wear debris sensor to reduce damage and extend remaining useful life of gearboxes |
| WO2020029155A1 (fr) * | 2018-08-09 | 2020-02-13 | Abb Schweiz Ag | Procédé de surveillance de disjoncteur, et appareil et internet des objets faisant appel audit procédé |
| CN110956564A (zh) * | 2019-10-29 | 2020-04-03 | 重庆特斯联智慧科技股份有限公司 | 一种基于大数据的社区老年人设施规划方法和系统 |
| CN112416996B (zh) * | 2020-10-14 | 2024-03-01 | 国能大渡河沙坪发电有限公司 | 振动区确定方法及装置 |
| CN112989587B (zh) * | 2021-03-04 | 2022-04-26 | 国网湖南省电力有限公司 | 一种电容式电压互感器劣化成因在线分析方法及系统 |
| CN117236075B (zh) * | 2023-11-10 | 2024-01-26 | 中国工业互联网研究院 | 基于自动生成经验值的模拟量异常波动分析方法及装置 |
Citations (1)
| Publication number | Priority date | Publication date | Assignee | Title |
|---|---|---|---|---|
| WO2001048571A1 (fr) * | 1999-12-29 | 2001-07-05 | Aspen Technology, Inc. | Procede et appareil de validation de capteurs |
Family Cites Families (10)
| Publication number | Priority date | Publication date | Assignee | Title |
|---|---|---|---|---|
| US20030126258A1 (en) * | 2000-02-22 | 2003-07-03 | Conkright Gary W. | Web based fault detection architecture |
| US7233886B2 (en) | 2001-01-19 | 2007-06-19 | Smartsignal Corporation | Adaptive modeling of changed states in predictive condition monitoring |
| US7539597B2 (en) * | 2001-04-10 | 2009-05-26 | Smartsignal Corporation | Diagnostic systems and methods for predictive condition monitoring |
| US20020183971A1 (en) * | 2001-04-10 | 2002-12-05 | Wegerich Stephan W. | Diagnostic systems and methods for predictive condition monitoring |
| US6609051B2 (en) * | 2001-09-10 | 2003-08-19 | Daimlerchrysler Ag | Method and system for condition monitoring of vehicles |
| PT1579288T (pt) | 2002-11-04 | 2017-06-23 | Ge Intelligent Platforms Inc | Monitorização do estado do sistema utilizando máquina de aprendizagem local recorrente |
| US6999884B2 (en) * | 2003-01-10 | 2006-02-14 | Oxford Biosignals Limited | Bearing anomaly detection and location |
| CA2634470C (fr) * | 2003-01-24 | 2013-05-14 | Pratt & Whitney Canada Corp. | Methode et systeme de detection et d'analyse de tendance |
| US20040243636A1 (en) * | 2003-03-18 | 2004-12-02 | Smartsignal Corporation | Equipment health monitoring architecture for fleets of assets |
| WO2005008420A2 (fr) | 2003-07-09 | 2005-01-27 | Smartsignal Corporation | Appareil et procede de traitement d'informations |
-
2006
- 2006-08-29 EP EP06119665A patent/EP1818746A1/fr not_active Withdrawn
- 2006-08-30 US US11/468,332 patent/US7275018B2/en active Active
-
2007
- 2007-01-19 EP EP07726207.9A patent/EP1982301B1/fr not_active Not-in-force
- 2007-01-19 WO PCT/EP2007/050529 patent/WO2007090723A1/fr active Application Filing
- 2007-01-19 ES ES07726207.9T patent/ES2688196T3/es active Active
Patent Citations (1)
| Publication number | Priority date | Publication date | Assignee | Title |
|---|---|---|---|---|
| WO2001048571A1 (fr) * | 1999-12-29 | 2001-07-05 | Aspen Technology, Inc. | Procede et appareil de validation de capteurs |
Non-Patent Citations (4)
| Title |
|---|
| HAI QUI ET AL: "Feature fusion and degradation using self-organizing map", MACHINE LEARNING AND APPLICATIONS, 2004. PROCEEDINGS. 2004 INTERNATIONAL CONFERENCE ON LOUISVILLE, KENTUCKY, USA 16-18 DECEMBER, 2004, PISCATAWAY, NJ, USA,IEEE, 16 December 2004 (2004-12-16), pages 107 - 114, XP010763583, ISBN: 0-7803-8823-2 * |
| MASCIOLI F M F ET AL: "A constructive approach to neuro-fuzzy networks", SIGNAL PROCESSING, ELSEVIER SCIENCE PUBLISHERS B.V. AMSTERDAM, NL, vol. 64, no. 3, February 1998 (1998-02-01), pages 347 - 358, XP004112602, ISSN: 0165-1684 * |
| NAIRAC A ET AL: "Choosing an appropriate model for novelty detection", ARTIFICIAL NEURAL NETWORKS, FIFTH INTERNATIONAL CONFERENCE ON (CONF. PUBL. NO. 440) CAMBRIDGE, UK 7-9 JULY 1997, LONDON, UK,IEE, UK, 7 July 1997 (1997-07-07), pages 117 - 122, XP006507571, ISBN: 0-85296-690-3 * |
| TARASSENKO L ET AL: "Novelty detection in jet engines", IEE COLLOQUIUM ON CONDITION MONITORING MACHINERY,EXTERNAL STRUCTURES AND HEALTH, 22 April 1999 (1999-04-22), pages 1 - 5, XP006500577 * |
Cited By (6)
| Publication number | Priority date | Publication date | Assignee | Title |
|---|---|---|---|---|
| CN103635910A (zh) * | 2011-07-06 | 2014-03-12 | 霍尼韦尔国际公司 | 用于发电厂的操作参数的自动识别 |
| EP2729891A4 (fr) * | 2011-07-06 | 2016-06-29 | Honeywell Int Inc | Identification automatique de paramètres de fonctionnement pour centrales électriques |
| CN103635910B (zh) * | 2011-07-06 | 2017-06-13 | 霍尼韦尔国际公司 | 用于发电厂的操作参数的自动识别 |
| GB2529637A (en) * | 2014-08-26 | 2016-03-02 | Ge Aviat Systems Ltd | System for building and deploying inference model |
| GB2529637B (en) * | 2014-08-26 | 2017-07-05 | Ge Aviat Systems Ltd | System for building and deploying inference model |
| US11113610B2 (en) | 2014-08-26 | 2021-09-07 | Ge Aviation Systems Limited | System for building and deploying inference model |
Also Published As
| Publication number | Publication date |
|---|---|
| EP1982301B1 (fr) | 2018-08-15 |
| ES2688196T3 (es) | 2018-10-31 |
| EP1982301A1 (fr) | 2008-10-22 |
| US20070192063A1 (en) | 2007-08-16 |
| US7275018B2 (en) | 2007-09-25 |
| WO2007090723A1 (fr) | 2007-08-16 |
Similar Documents
| Publication | Publication Date | Title |
|---|---|---|
| US7275018B2 (en) | Method of condition monitoring | |
| CN109524139B (zh) | 一种基于设备工况变化的实时设备性能监测方法 | |
| EP3454289B1 (fr) | Procédé et système de détection d'anomalies d'installation | |
| US11835030B2 (en) | Methods and systems for predicting risk of observable damage in wind turbine gearbox components | |
| CN104390657B (zh) | 一种发电机组运行参数测量传感器故障诊断方法及系统 | |
| US7873581B2 (en) | Method and system for determining the reliability of a DC motor system | |
| JP4276623B2 (ja) | 技術的設備の監視装置および方法 | |
| US20140365179A1 (en) | Method and Apparatus for Detecting and Identifying Faults in a Process | |
| KR101948604B1 (ko) | 센서 군집화 기반의 설비 건강 모니터링 방법 및 장치 | |
| KR102343752B1 (ko) | 프로세스 장치에서 전체 프로세스 섹션의 상태를 자동 모니터링하고 측정하는 컴퓨터 실행 방법 및 시스템 | |
| JP2009086896A (ja) | コンピュータの障害予測システムおよび障害予測方法 | |
| CN114077919A (zh) | 用于预测加工异常的系统 | |
| WO2020166236A1 (fr) | Procédé d'évaluation d'efficacité de travail, dispositif d'évaluation d'efficacité de travail et programme | |
| CN114576102A (zh) | 风电机组轴承状态的预测方法、装置、设备及存储介质 | |
| KR102110319B1 (ko) | 학습 데이터 생성 시스템 | |
| KR20230102431A (ko) | 인공지능 기반의 오일가스 플랜트 설비 고장 예측 및 진단시스템 | |
| CN116235121A (zh) | 识别用于执行生产过程的工业设施中的异常的装置和方法 | |
| CN113673600A (zh) | 一种工业信号异常预警方法、系统、存储介质及计算设备 | |
| KR20220096793A (ko) | 회전기계의 결함을 종합적으로 진단하는 방법 및 시스템 | |
| CN112378651A (zh) | 一种基于数据驱动的设备动态可靠性评估方法 | |
| CN117554218B (zh) | 直馏沥青浇筑式钢桥面复合梁试件疲劳试验装置及方法 | |
| CN116453437B (zh) | 显示屏模组的测试方法、装置、设备及存储介质 | |
| Grebenişan et al. | Validation of an algorithm for predicting the remaining useful life, for a model with linear degradation | |
| CN117927535A (en) | Servo hydraulic system fault determination method, device and equipment | |
| KR20240003469A (ko) | 원전설비의 예측진단방법 및 시스템 |
Legal Events
| Date | Code | Title | Description |
|---|---|---|---|
| PUAI | Public reference made under article 153(3) epc to a published international application that has entered the european phase |
Free format text: ORIGINAL CODE: 0009012 |
|
| AK | Designated contracting states |
Kind code of ref document: A1 Designated state(s): AT BE BG CH CY CZ DE DK EE ES FI FR GB GR HU IE IS IT LI LT LU LV MC NL PL PT RO SE SI SK TR |
|
| AX | Request for extension of the european patent |
Extension state: AL BA HR MK YU |
|
| AKX | Designation fees paid | ||
| REG | Reference to a national code |
Ref country code: DE Ref legal event code: 8566 |
|
| STAA | Information on the status of an ep patent application or granted ep patent |
Free format text: STATUS: THE APPLICATION IS DEEMED TO BE WITHDRAWN |
|
| 18D | Application deemed to be withdrawn |
Effective date: 20080216 |