EP1817718B1 - Method of processing mass spectrometry data - Google Patents
Method of processing mass spectrometry data Download PDFInfo
- Publication number
- EP1817718B1 EP1817718B1 EP05852176A EP05852176A EP1817718B1 EP 1817718 B1 EP1817718 B1 EP 1817718B1 EP 05852176 A EP05852176 A EP 05852176A EP 05852176 A EP05852176 A EP 05852176A EP 1817718 B1 EP1817718 B1 EP 1817718B1
- Authority
- EP
- European Patent Office
- Prior art keywords
- data
- peaks
- threshold
- frequency domain
- mass spectrometry
- Prior art date
- Legal status (The legal status is an assumption and is not a legal conclusion. Google has not performed a legal analysis and makes no representation as to the accuracy of the status listed.)
- Active
Links
- 238000000034 method Methods 0.000 title claims abstract description 42
- 238000012545 processing Methods 0.000 title claims abstract description 19
- 238000004949 mass spectrometry Methods 0.000 title claims description 19
- 150000002500 ions Chemical class 0.000 claims abstract description 24
- 230000001131 transforming effect Effects 0.000 claims description 11
- 230000000737 periodic effect Effects 0.000 claims description 2
- 238000004590 computer program Methods 0.000 claims 3
- 230000001052 transient effect Effects 0.000 abstract description 60
- 238000004252 FT/ICR mass spectrometry Methods 0.000 abstract description 35
- 230000002596 correlated effect Effects 0.000 abstract description 8
- 238000001228 spectrum Methods 0.000 description 18
- 238000001819 mass spectrum Methods 0.000 description 11
- 238000013459 approach Methods 0.000 description 4
- 230000008901 benefit Effects 0.000 description 4
- 238000001514 detection method Methods 0.000 description 4
- 238000005259 measurement Methods 0.000 description 4
- 238000004458 analytical method Methods 0.000 description 3
- 230000006872 improvement Effects 0.000 description 3
- 230000008569 process Effects 0.000 description 3
- 238000010420 art technique Methods 0.000 description 2
- 238000005040 ion trap Methods 0.000 description 2
- 238000007781 pre-processing Methods 0.000 description 2
- 238000011045 prefiltration Methods 0.000 description 2
- 230000003595 spectral effect Effects 0.000 description 2
- 238000004611 spectroscopical analysis Methods 0.000 description 2
- 238000001269 time-of-flight mass spectrometry Methods 0.000 description 2
- 230000009466 transformation Effects 0.000 description 2
- 238000011144 upstream manufacturing Methods 0.000 description 2
- 238000005033 Fourier transform infrared spectroscopy Methods 0.000 description 1
- 229920001222 biopolymer Polymers 0.000 description 1
- 238000007906 compression Methods 0.000 description 1
- 230000006835 compression Effects 0.000 description 1
- 230000001010 compromised effect Effects 0.000 description 1
- 230000000875 corresponding effect Effects 0.000 description 1
- 238000013144 data compression Methods 0.000 description 1
- 230000007423 decrease Effects 0.000 description 1
- 230000003247 decreasing effect Effects 0.000 description 1
- 230000005520 electrodynamics Effects 0.000 description 1
- 238000011156 evaluation Methods 0.000 description 1
- 230000005284 excitation Effects 0.000 description 1
- 230000007717 exclusion Effects 0.000 description 1
- 238000004896 high resolution mass spectrometry Methods 0.000 description 1
- 238000002347 injection Methods 0.000 description 1
- 239000007924 injection Substances 0.000 description 1
- 238000007689 inspection Methods 0.000 description 1
- 230000000155 isotopic effect Effects 0.000 description 1
- 238000004811 liquid chromatography Methods 0.000 description 1
- 238000004895 liquid chromatography mass spectrometry Methods 0.000 description 1
- 230000007246 mechanism Effects 0.000 description 1
- 238000012986 modification Methods 0.000 description 1
- 230000004048 modification Effects 0.000 description 1
- 238000001518 sector field mass spectrometry Methods 0.000 description 1
- 239000000243 solution Substances 0.000 description 1
- 238000010561 standard procedure Methods 0.000 description 1
- 238000007619 statistical method Methods 0.000 description 1
Images


Classifications
-
- G—PHYSICS
- G16—INFORMATION AND COMMUNICATION TECHNOLOGY [ICT] SPECIALLY ADAPTED FOR SPECIFIC APPLICATION FIELDS
- G16Z—INFORMATION AND COMMUNICATION TECHNOLOGY [ICT] SPECIALLY ADAPTED FOR SPECIFIC APPLICATION FIELDS, NOT OTHERWISE PROVIDED FOR
- G16Z99/00—Subject matter not provided for in other main groups of this subclass
-
- H—ELECTRICITY
- H01—ELECTRIC ELEMENTS
- H01J—ELECTRIC DISCHARGE TUBES OR DISCHARGE LAMPS
- H01J49/00—Particle spectrometers or separator tubes
- H01J49/26—Mass spectrometers or separator tubes
- H01J49/34—Dynamic spectrometers
- H01J49/36—Radio frequency spectrometers, e.g. Bennett-type spectrometers, Redhead-type spectrometers
- H01J49/38—Omegatrons ; using ion cyclotron resonance
-
- H—ELECTRICITY
- H01—ELECTRIC ELEMENTS
- H01J—ELECTRIC DISCHARGE TUBES OR DISCHARGE LAMPS
- H01J49/00—Particle spectrometers or separator tubes
- H01J49/0027—Methods for using particle spectrometers
- H01J49/0036—Step by step routines describing the handling of the data generated during a measurement
-
- H—ELECTRICITY
- H01—ELECTRIC ELEMENTS
- H01J—ELECTRIC DISCHARGE TUBES OR DISCHARGE LAMPS
- H01J49/00—Particle spectrometers or separator tubes
- H01J49/02—Details
-
- G—PHYSICS
- G06—COMPUTING; CALCULATING OR COUNTING
- G06F—ELECTRIC DIGITAL DATA PROCESSING
- G06F2218/00—Aspects of pattern recognition specially adapted for signal processing
- G06F2218/08—Feature extraction
Definitions
- This invention relates to a method of processing mass spectrometry data, particularly but not exclusively data obtained from Fourier Transform Ion Cyclotron Resonance Mass Spectrometry (FTMS).
- FTMS Fourier Transform Ion Cyclotron Resonance Mass Spectrometry
- FTMS Fourier transform mass spectrometry
- a standard acquisition from m/z 200-2000 in FTMS involves the measurement of one million data points. Measuring one scan per second (typical for liquid chromatography/mass spectrometry (LC/MS) applications) results in the generation of raw data at a rate of 7.2 GB/hour (approximately 170 GB/day).
- these spectra are stored in a computer memory or an alternative computer readable medium and a large amount of memory is thus required for storage.
- the bulk of such spectrometry data (perhaps 99%) does not contain valuable information but instead mostly comprises noise which is of no analytical value besides its overall amplitude and standard deviation.
- mass spectrometers will either store the entire data set or may try to reduce the size of the data set in one of two ways.
- the first is merely to store a list of peaks found in a mass spectrum (i.e. to store the position and magnitude of each peak).
- This method has the disadvantage that it is impossible for a user or software to re-evaluate data for further characteristics such as peak shape, background, signal-to-noise ratio or other information that cannot be generated without additional assumptions.
- Information about the non-peak part of a spectrum is very valuable when information is processed further either manually or automatically.
- the signal-to-noise ratio gives important hints about the significance of an event.
- groups of peaks are very helpful to the skilled user who can evaluate spectra with far greater skill than mere automatic processing of the location and intensity of peaks within a group.
- a second method of reducing the size of data file to be stored is.achieved by an operator pre-selecting a threshold value and software storing only data points of a spectrum whose value is greater than this threshold. If the operator guesses the threshold value correctly, only data points belonging to peaks will be stored. This has the advantage of preserving information about peak shape.
- this method has the disadvantage that it relies upon the skill of an operator to set the threshold level correctly. If the threshold level is set too low, typically a large quantity of noise data points will be stored along with peak data points and, if the threshold is set too high, valuable information relating to peak shape will be lost as data points of the base of peaks will be missed. Accordingly, such software is difficult for anyone other than an experienced operator to use successfully. In addition, no information relating to noise is stored such that all such information is lost.
- the techniques only result in the determination of peak locations and their intensity, and the valuable information regarding both the peak shape and the spectral noise are lost.
- the techniques are computationally relatively expensive, since, to obtain the parameters of the noise distribution, several iterations are necessary until these parameters stabilise.
- the present invention resides in a method as described in claim 1.
- the processing technique of this aspect of the invention permits improved discrimination against random noise, whether to remove random noise spikes at a "standard" threshold, in order to compress the data file to be stored, or to locate smaller real signals using a lower threshold (but where the data file may not be compressed).
- the invention is based on the observation that, as the resolution is increased (equivalent to the number of time domain data points), the number of random noise peaks found above a threshold increases, but with little or no increase in the number of "real" signal peaks, that is, peaks which genuinely represent the presence of ions having a mass to charge ratio within the selected range. The opposite is also true: as the resolution decreases, the number of random peaks also reduces.
- the number of real signal peaks is relatively constant at all resolutions. This is because, assuming that the random noise is Gaussian distributed, the more data points are present, the more of these there will be above any given threshold.
- the number of frequency domain data points is proportional to the number of time domain data points. Therefore, a smaller time domain data set produces fewer random noise peaks, and this can be used as a basis to threshold the full data set.
- the full data set may be transformed but only the data around the locations previously identified at the lower resolution need be analysed and/or saved. In other words, the problem of the larger number of false peaks that would be found if the threshold were just applied to the full data set in the frequency domain is avoided, because the false peaks can be ignored as a result of the prior threshold application at the lower resolution.
- substantially all of the data from the full transform may be displayed and/or stored, but only in the region(s) identified in the transform of the partial transient to be "real" data (because they are above the first threshold).
- no second intensity threshold need be applied to the full transform, and the total quantity of data, for example, is reduced primarily by identifying frequency/mass ranges within the scanned range that contain only noise data (through the application of the first threshold to the partial transient transform), and simply rejecting these corresponding regions in the full transient transform.
- a second threshold may be applied to the data in the full transient transform, with only data above that second threshold being kept for display, storage etc. That second threshold may be the same or may be different to the first threshold.
- a method of processing Fourier Transform Mass Spectrometry (FTMS) data comprising: (a) transforming a first set of FTMS data, obtained in the time domain in respect of a mass to charge ratio (m/z) range, into the frequency domain; (b) transforming a second set of time domain FTMS data, different from the said first set of FTMS data, into the frequency domain; and (c) correlating the first set of FTMS data in the frequency domain with the second set of FTMS data in the frequency domain so as to identify peaks common to each of the sets of data in the frequency domain.
- FTMS Fourier Transform Mass Spectrometry
- This aspect of the invention exploits the fact that the noise is essentially random. As such, different parts of a full data set in the time domain, when transformed into the frequency domain, should exhibit peaks at the same relative location, for example, where those peaks are "real" peaks, but peaks in the data resulting from random noise instead should not, statistically, occur at the same place in two separate subsets of the full data set.
- the first and second data sets may be obtained from different parts of the same transient (although overlap is possible).
- the first and second datasets may be subsets of different transients. In the latter case, of course, it is desirable that there is at least partial overlap of the m/z ranges included within each transient so that correlation between the two is meaningful.
- the subsets may overlap one another, for example, the first 25% and the first 50% of the full dataset may be transformed and cross-correlated respectively. Alternatively, separate subsets may be transformed (e.g. the first 25% and the second 25%). Still further, the first and second sets of the time domain FTMS data may be from different transients entirely.
- a method of processing mass spectrometry data comprising:(a) obtaining a set of mass spectrometry data in the time domain in respect of a mass to charge ratio range; (b) transforming a first subset of that obtained time domain data into the frequency domain; (c) transforming a second subset of that obtained time domain data into the frequency domain; (d) transforming substantially the full data set of the obtained time domain data into the frequency domain; (e) applying a first threshold to at least one of the said first and second subsets in the frequency domain, to identify one or more regions of that data which contain peak data; and (f) correlating the first subset of data in the frequency domain with the second subset of data in the frequency domain, to identify one or more regions of data common to each of the said subsets.
- the present invention provides an improved thresholding technique for FTMS data, that is, an improved approach to the decision making process by which a peak or spectral area is either included or excluded from the full data set when generating a reduced data set.
- the invention is based on a mathematical or logical combination of two or more of the following criteria:
- the significance levels used for the different criteria may be different.
- the logical operations may be of any type, for example AND, OR, XOR, NOT, implication.
- Mathematical,operations may be multiplication, addition, transformation, comparison of the result with a "master threshold", or otherwise.
- Figure 1 shows a full FTMS dataset in the form of a mass spectrum, including both peaks resulting from the presence of ions and also random noise;
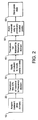
- Figure 2 shows a flow chart of a method of processing FTMS data embodying a first aspect of the invention
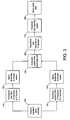
- Figure 3 shows a flow chart illustrating a data processing scheme in accordance with one embodiment of a second aspect of the present invention
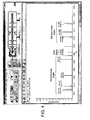
- Figure 4 shows a Fourier Transform Mass Spectrum produced using a thresholding technique in accordance with the prior art
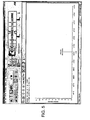
- Figure 5 shows a Fourier Transform Mass Spectrum produced using the improved thresholding technique of embodiments of the present invention
- Figure 6 shows a flow chart illustrating a data processing scheme in accordance with a further embodiment of the second aspect of the present invention
- Figure 7 shows a flow chart illustrating a data processing scheme similar to that of Figure 6 but with some variants.
- Figure 8 shows a flow chart illustrating still a further embodiment of the second aspect of the present invention.
- ions are generated at an ion source and are injected into a measurement cell, usually from a storage device such as a linear ion trap.
- a storage device such as a linear ion trap.
- the ions are detected by image currents in detection electrodes in the cell.
- the raw data which is obtained by this technique is in the time domain and is known as a transient.
- Transferring and storing a full FTMS data set is a relatively time consuming task which can require very large storage capacity.
- Much of the stored information is in fact noise which is analytically of little or no value.
- prior art techniques simply applied a threshold to the data in the frequency domain to remove all data points below that threshold. As has been explained in the introduction, for a fixed threshold this is a blunt mechanism as it risks either overcompressing or undercompressing the data so that too much noise remains or true peaks are erroneously removed.
- FIG. 2 shows a flow chart of a method of processing FTMS data embodying a first aspect of the present invention.
- a transient in the time domain is acquired by the FTMS in the manner described above.
- part but not all of this transient is Fourier transformed into the frequency domain.
- the amount of the transient which is Fourier transformed is a trade-off between computational speed and accuracy. On the one hand, transforming a relatively small percentage of the full transient can be completed rapidly. On the other hand, if too small a percentage of the transient is transformed into the frequency domain, true peaks in the data may be lost.
- the embodiment of Figure 2 employs 25% of the transient and typically this is the first 25%. The benefit of employing the first 25% is that the processor can commence subsequent processing of that 25% of the transient before the remainder of the full transient has been obtained.
- the data in the frequency domain contains peaks representative of the presence of ions having a mass to charge ratio within the range selected for evaluation by the FTMS device.
- the data in the frequency domain also contains a number of data points which are, in fact, a result of random noise but which may be erroneously determined to be true peaks.
- the number of such peaks reduces with decreasing resolution.
- Fourier transforming only 25% of the full transient should reduce the number of random noise peaks.
- an intensity threshold is applied to the partial Fourier transform obtained in step 20.
- the threshold is chosen relatively conservatively to minimise the risk of discarding true peaks. Nevertheless, because of the reduced number of false peaks in the partial data set, the risk of false peaks (that is, random noise peaks) above the intensity threshold being passed is reduced.
- the full transient is Fourier transformed into the frequency domain.
- an intensity threshold is applied to the frequency domain data obtained by Fourier transform of the full transient.
- This threshold may be the same as the threshold applied in step 30, or may be lower.
- the threshold applied at step 50 is only applied in the regions of the frequency domain spectrum (or mass spectrum) around the locations of the true data peaks as ascertained in step 30. In other words, data points between regions of these peaks, which would have fallen below the intensity threshold applied in step 30 are not examined further.
- step 60 the peak data falling above the threshold applied at step 50 is stored.
- a compression of perhaps 90 to 95% or more may be achieved, whilst the data relating to the peaks themselves are not compromised or compressed.
- a pseudo-spectrum can be reconstituted by assuming that the random noise data is Gaussian distributed and reconstituting that using determined Gaussian parameters.
- FIG. 3 shows a flow chart of a method of processing FTMS data in accordance with a second embodiment.
- a transient is once more obtained, using the full resolution selected by the operator (that is, a full transient is obtained).
- a first 25% of that transient is converted to the frequency domain, as is step 20 of Figure 2 .
- an intensity threshold is applied to the first 25% of the transient, now in the frequency domain, in order to locate true peaks in the data.
- a relatively conservative threshold may be employed, to minimise the risk of true data peaks being overlooked.
- a second 25% of the transient is converted to the frequency domain. This may be an overlapping 25% of the original data set, or a subsequent 25% (i.e. 25-50% of the original time domain transient required at step 100).
- An intensity threshold is then applied to that data as well, once more to identify true data peaks in that data.
- the threshold applied at step 140 may be the same or different to the intensity threshold applied at step 120. Particularly if a different size of data set is transformed at step 130 relative to step 110 (for example, if 50% of the original time domain transient is transformed at step 130), the threshold applied at step 140 might be slightly higher than the threshold applied at step 120 (since in the latter case there is an increased risk of false data peaks because more of the transient has been Fourier transformed).
- the data sets acquired as a result of the processing steps 120 and 140 are compared or correlated. Two signals should appear at the same place in each of the spectra obtained following steps 120 and 140. However, assuming that the noise is truly random and not correlated between the different sections of the full time domain data set (transient), then noise peaks will not appear in the same positions in the two different spectra. Thus, by identifying the location of peaks which correlate with one another in the two spectra resulting from steps 120 and 140 respectively, and by discarding regions of data where the peaks do not match, a "prefilter" to the total data set can be generated.
- the full transient is Fourier transformed into the frequency domain.
- the threshold (which may be higher than the threshold applied at step 120 and 140 to the partial data set) is applied to the full transient in the frequency domain, but only in the region of the peaks identified using the prefiltering techniques of steps 100 to 150.
- the stored peak data that is, the data above intensity threshold applied at step 170, is stored at step 180.
- the discarded random noise can be reconstituted by assuming that it is Gaussian distributed.
- Figure 4 shows an artificial time domain signal including a "real" peak at 409.6 kHz and a plurality of random noise peaks at other locations around the real signal peak.
- the intensity of the real signal at 409.6 kHz is just above the intensity threshold.
- Figure 4 shows the results of application of the prior art technique wherein the threshold is applied to the full Fourier transformed transient without any prefiltering. Relative to Figure 1 , which is a full mass spectrum, it will be seen that Figure 4 does not contain the "base line” noise (which has been removed through the application of the threshold) but there are 14 random noise peaks, a number of which have a higher intensity than the real signal at 409.6 kHz.
- the method can also be used to generate the data sets of comparable size to the standard method, but with a much lower detection threshold. This will allow the detection of signals which are currently below the simple intensity threshold, without increasing the total volume of data.
- the location of the peaks in the two data subsets is used to identify real peaks in the data
- other parameters can be correlated instead or as well, to identify the true peaks in the data.
- the intensity of the peaks can be correlated between the two data subsets (so that matching peak intensities are identified as "true" peaks).
- the phase for real signals will be consistent from one segment of the transient to the next, whilst the phase for random signal should, by contrast, be random.
- phase consistency can be used as an additional or alternative factor. If the charge state can be determined for a signal, then the position of associated isotope peaks can be predicted. The window of these isotopes can then be included in the final thresholding region, as a further improvement. As still a further improvement, data from more than one data set can be employed. This idea is explained further in connection with Figure 8 below. In preferred embodiments position and phase (at least) are both employed.
- Figure 6 shows still a further embodiment in accordance with the present invention.
- the embodiment of Figure 6 includes a further modification to the embodiment described in Figure 3 , to address peculiarities with certain signals. Specifically, larger molecules produce an unusual time domain signal or transient. Due to the numerous equally spaced isotope peaks, a strong "beat pattern" can be produced (see Hofstadler et al. "Isotopic beat patterns in Fourier transform ion cyclotron resonance mass spectrometry: implications for high resolution mass measurement by biopolymers", International Journal of Mass Spectrometry & Ion Processes 132:109-127(1994 ).
- one of the two time domain data segments may correlate with an "anti-node" of the full time domain data. Therefore, no above threshold signals would appear in this segment, and thus, no "common” peaks would occur, even though strong signals may appear in one of the two data sets. There is no way to predict the position of antinodes ahead of time, so there is no way of guaranteeing that an antinode would not appear in any selected subsection of the time domain transient.
- the solution to this problem is to use two separate thresholds.
- a full transient is required as previously.
- a first 25% of the transient is transformed to the frequency domain and, then, at step 220, a first, low intensity threshold (threshold 1) is applied to identify peaks of this threshold.
- Threshold 1 is applied to this frequency domain date to identify peaks in it, at step 240.
- the two data sets from steps 220 and 240 are correlated to identify common peaks.
- a higher threshold (threshold 2) is also applied to the data subsets obtained following steps 220 and 240, so that large peaks (which are assumed to be real peaks) are not discarded erroneously because of the strong beat pattern described above.
- the modified prefilter has been generated, that is, the location of true peaks has been determined at step 260, at step 270 the full transient is transformed to the frequency domain, and then, at step 280 a third threshold is applied to the full data transform in the data domain, but only in the regions determined following step 250 and 260.
- the peak data may be stored at step 290.
- steps 200 to 250 are the same in Figures 6 and 7 , that is, two separate fractions of the transient are transformed into the frequency domain, peak detected using a first, relatively low threshold (threshold 1) and then correlated to locate peaks that match in each data set.
- threshold 1 relatively low threshold
- step 265 instead of applying a higher threshold to each data subset, the whole transient is transformed into the frequency domain as a next step. Then, at step 275, the regions identified as peaks via steps 200-250 are subtracted or otherwise excluded from full frequency domain data set. At step 285, the remaining data set is subjected to a second threshold which is higher than the first threshold. This makes sure that no peak is omitted from the full spectrum if it reaches this second threshold, even if the pre-processing steps failed to locate that threshold.
- the data from the full data set in the frequency domain is stored but only in the regions which are identified to be peaks through the combination of correlation pre-processing (steps 200-250) and higher level threshold processing of the remaining data.
- peaks from two completely separate time domain data sets are correlated.
- the first transient is acquired from those sample ions.
- This is transformed at step 310 to the frequency domain, and at step 320, a threshold is applied to the Fourier transform in the frequency domain.
- a second transient is acquired. Typically, this is obtained from a fresh set of ions injected into the FTMS cell following the collection of the first transient and the subsequent emptying of the cell of those ions that created that first transient.
- the second transient is transformed to the frequency domain at step 340.
- the threshold is applied to that Fourier transform in the frequency domain as well, at step 350.
- the threshold applied at steps 320 and 350 may be the same or different.
- the first and second transients acquired at steps 300 and 330 respectively may be converted in their entirety into the frequency domain, instead only a part of each separate transient may be converted into the frequency domain at steps 310 and 340 before the threshold is applied.
- the mass range of the sample ions from which the first transient is obtained corresponds with the mass range of the sample ions that provides the second transient, the mass ranges do not need to be identical. By adjusting the parameter of the upstream ion-filter/trap, different mass ranges can be injected into the FTMS cell although, of course, they must at least overlap.
- step 360 correlation or matching data from each Fourier transform takes place (which is why the mass ranges from which the two transients are obtained must at least partially overlap). From this, the location of true peaks is identified, and the data in respect of those true peaks may be stored at step 370. Assuming the full transient is transformed in step 310 and 340, the two step process of the embodiments of Figures 3 and 6 is avoided. However there are some drawbacks to the embodiment of Figure 8 . Specifically, processing of the first data set cannot be completed unless the second data set has been collected.
- the invention would be applied to the output of electrostatic time of flight (TOF) mass spectrometers (see, for example, Benner, W.H. (1997) “A Gated Electrostatic Ion Trap To Repetitiously Measure the Charge and m/z of Large Electrospray Ions” Analytical Chemistry 69, pages 4162-4168 .
- Fourier transforms are not the only forms of frequency transforms that can be employed: the invention can equally be used with Hadamard transforms or Laplace transforms, for example. See also A. Brock, N. Rodriguez, and R. N. Zare, “Hadamard Transform Time-of-Flight Mass Spectrometry (HT-TOFMS)" Anal Chem. 70, 3735-3741 (1998 ).
- TOF electrostatic time of flight
Landscapes
- Chemical & Material Sciences (AREA)
- Analytical Chemistry (AREA)
- Other Investigation Or Analysis Of Materials By Electrical Means (AREA)
Priority Applications (1)
| Application Number | Priority Date | Filing Date | Title |
|---|---|---|---|
| EP08008405A EP1950690B1 (en) | 2004-11-29 | 2005-11-23 | Method of processing mass spectrometry data |
Applications Claiming Priority (2)
| Application Number | Priority Date | Filing Date | Title |
|---|---|---|---|
| GB0426174A GB2422049B (en) | 2004-11-29 | 2004-11-29 | Method of processing mass spectrometry data |
| PCT/US2005/042714 WO2006058198A2 (en) | 2004-11-29 | 2005-11-23 | Method of processing mass spectrometry data |
Related Child Applications (2)
| Application Number | Title | Priority Date | Filing Date |
|---|---|---|---|
| EP08008405A Division EP1950690B1 (en) | 2004-11-29 | 2005-11-23 | Method of processing mass spectrometry data |
| EP08008405.6 Division-Into | 2008-05-05 |
Publications (2)
| Publication Number | Publication Date |
|---|---|
| EP1817718A2 EP1817718A2 (en) | 2007-08-15 |
| EP1817718B1 true EP1817718B1 (en) | 2012-06-06 |
Family
ID=33561516
Family Applications (2)
| Application Number | Title | Priority Date | Filing Date |
|---|---|---|---|
| EP05852176A Active EP1817718B1 (en) | 2004-11-29 | 2005-11-23 | Method of processing mass spectrometry data |
| EP08008405A Active EP1950690B1 (en) | 2004-11-29 | 2005-11-23 | Method of processing mass spectrometry data |
Family Applications After (1)
| Application Number | Title | Priority Date | Filing Date |
|---|---|---|---|
| EP08008405A Active EP1950690B1 (en) | 2004-11-29 | 2005-11-23 | Method of processing mass spectrometry data |
Country Status (7)
| Country | Link |
|---|---|
| US (1) | US7987060B2 (ja) |
| EP (2) | EP1817718B1 (ja) |
| JP (2) | JP5153338B2 (ja) |
| CN (1) | CN101088096B (ja) |
| CA (1) | CA2583734C (ja) |
| GB (2) | GB2472951B (ja) |
| WO (1) | WO2006058198A2 (ja) |
Cited By (1)
| Publication number | Priority date | Publication date | Assignee | Title |
|---|---|---|---|---|
| US11521711B2 (en) | 2008-06-23 | 2022-12-06 | Atonarp Inc. | System for handling information relating to chemical substances |
Families Citing this family (20)
| Publication number | Priority date | Publication date | Assignee | Title |
|---|---|---|---|---|
| DE102007009272B3 (de) * | 2007-02-26 | 2008-05-15 | Bruker Daltonik Gmbh | Auswertung von Spektren in Schwingungs-Massenspektrometern |
| US8053723B2 (en) * | 2009-04-30 | 2011-11-08 | Thermo Finnigan Llc | Intrascan data dependency |
| DE102009035587B3 (de) * | 2009-07-31 | 2011-03-24 | Siemens Aktiengesellschaft | Verfahren zur Filterung eines Chromatogramms |
| US9348787B2 (en) * | 2010-07-06 | 2016-05-24 | Shimadzu Corporation | Method and system for processing analysis data |
| EP2447980B1 (en) * | 2010-11-02 | 2019-05-22 | Thermo Fisher Scientific (Bremen) GmbH | Method of generating a mass spectrum having improved resolving power |
| GB201100301D0 (en) * | 2011-01-10 | 2011-02-23 | Micromass Ltd | Method of processing multidmensional mass spectrometry data |
| US9812306B2 (en) | 2011-08-17 | 2017-11-07 | Smiths Detection Inc. | Shift correction for spectral analysis |
| CN104246495B (zh) * | 2012-03-29 | 2017-05-17 | 皇家飞利浦有限公司 | 用于过滤气相色谱法‑质谱法数据的方法与系统 |
| GB201205805D0 (en) * | 2012-03-30 | 2012-05-16 | Micromass Ltd | Mass spectrometer |
| US20130311136A1 (en) * | 2012-05-18 | 2013-11-21 | Mustard Tree Instruments, Llc | Rule-Based Sample Verification and Chemical Monitoring Methodology |
| US10840073B2 (en) * | 2012-05-18 | 2020-11-17 | Thermo Fisher Scientific (Bremen) Gmbh | Methods and apparatus for obtaining enhanced mass spectrometric data |
| GB201304491D0 (en) | 2013-03-13 | 2013-04-24 | Shimadzu Corp | A method of processing image charge/current signals |
| WO2016125060A1 (en) * | 2015-02-05 | 2016-08-11 | Dh Technologies Development Pte. Ltd. | Detecting mass spectrometry based similarity via curve subtraction |
| US11187685B2 (en) * | 2015-02-16 | 2021-11-30 | Shimadzu Corporation | Noise level estimation method, measurement data processing device, and program for processing measurement data |
| GB201518391D0 (en) * | 2015-10-16 | 2015-12-02 | Micromass Ltd | Processing mass spectral data |
| US10297433B2 (en) * | 2016-07-05 | 2019-05-21 | Bruker Daltonik Gmbh | Suppressing harmonic signals in ion cyclotron resonance mass spectrometry |
| EP3410109A1 (en) | 2017-06-02 | 2018-12-05 | Thermo Fisher Scientific (Bremen) GmbH | Systems and methods for extracting mass traces |
| US10957523B2 (en) * | 2018-06-08 | 2021-03-23 | Thermo Finnigan Llc | 3D mass spectrometry predictive classification |
| EP3660504A1 (en) | 2018-11-30 | 2020-06-03 | Thermo Fisher Scientific (Bremen) GmbH | Systems and methods for determining mass of an ion species |
| EP4012747A1 (en) * | 2020-12-10 | 2022-06-15 | Thermo Fisher Scientific (Bremen) GmbH | Methods and systems for processing mass spectra |
Family Cites Families (16)
| Publication number | Priority date | Publication date | Assignee | Title |
|---|---|---|---|---|
| JPS6165171A (ja) * | 1984-09-06 | 1986-04-03 | Jeol Ltd | フ−リエ変換装置 |
| US4761545A (en) * | 1986-05-23 | 1988-08-02 | The Ohio State University Research Foundation | Tailored excitation for trapped ion mass spectrometry |
| US4755670A (en) | 1986-10-01 | 1988-07-05 | Finnigan Corporation | Fourtier transform quadrupole mass spectrometer and method |
| JPH04244773A (ja) * | 1991-01-29 | 1992-09-01 | Asmo Co Ltd | 偏平ヨーク型直流機 |
| US5175430A (en) * | 1991-05-17 | 1992-12-29 | Meridian Instruments, Inc. | Time-compressed chromatography in mass spectrometry |
| US5418826A (en) * | 1992-10-11 | 1995-05-23 | Horiba, Ltd. | Fluorescent X-ray qualitative analytical method |
| GB9506695D0 (en) | 1995-03-31 | 1995-05-24 | Hd Technologies Limited | Improvements in or relating to a mass spectrometer |
| US5995989A (en) * | 1998-04-24 | 1999-11-30 | Eg&G Instruments, Inc. | Method and apparatus for compression and filtering of data associated with spectrometry |
| US6403955B1 (en) * | 2000-04-26 | 2002-06-11 | Thermo Finnigan Llc | Linear quadrupole mass spectrometer |
| CN1481502A (zh) * | 2000-12-15 | 2004-03-10 | 埃克森美孚研究工程公司 | 质谱仪的多变量分析 |
| US6608302B2 (en) * | 2001-05-30 | 2003-08-19 | Richard D. Smith | Method for calibrating a Fourier transform ion cyclotron resonance mass spectrometer |
| US20030078739A1 (en) * | 2001-10-05 | 2003-04-24 | Surromed, Inc. | Feature list extraction from data sets such as spectra |
| US7457708B2 (en) * | 2003-03-13 | 2008-11-25 | Agilent Technologies Inc | Methods and devices for identifying related ions from chromatographic mass spectral datasets containing overlapping components |
| EP1614140A4 (en) * | 2003-04-02 | 2008-05-07 | Merck & Co Inc | MASS DATA ANALYSIS TECHNIQUES |
| WO2004097581A2 (en) * | 2003-04-28 | 2004-11-11 | Cerno Bioscience Llc | Computational method and system for mass spectral analysis |
| GB2410123B (en) | 2003-09-25 | 2006-11-01 | Thermo Finnigan Llc | Method of processing and storing mass spectrometry data |
-
2004
- 2004-11-29 GB GB1020824A patent/GB2472951B/en not_active Expired - Fee Related
- 2004-11-29 GB GB0426174A patent/GB2422049B/en not_active Expired - Fee Related
-
2005
- 2005-11-23 EP EP05852176A patent/EP1817718B1/en active Active
- 2005-11-23 JP JP2007543516A patent/JP5153338B2/ja not_active Expired - Fee Related
- 2005-11-23 CN CN200580040696XA patent/CN101088096B/zh active Active
- 2005-11-23 WO PCT/US2005/042714 patent/WO2006058198A2/en active Application Filing
- 2005-11-23 US US11/791,647 patent/US7987060B2/en active Active
- 2005-11-23 CA CA2583734A patent/CA2583734C/en not_active Expired - Fee Related
- 2005-11-23 EP EP08008405A patent/EP1950690B1/en active Active
-
2011
- 2011-12-29 JP JP2011290308A patent/JP5562933B2/ja not_active Expired - Fee Related
Non-Patent Citations (1)
| Title |
|---|
| ALAN G MARSHALL: "Theoretical Signal-to-Noise Ratio and Mass Resolution in Fourier Transform Ion Cyclotron Resonance Mass Spectrometry", ANALYTICAL CHEMISTRY, AMERICAN CHEMICAL SOCIETY, vol. 51, no. 11, 1 September 1979 (1979-09-01), pages 1710 - 1715, XP007918756, DOI: 0003-2700/79/035 1-1710$01 .OO/O * |
Cited By (1)
| Publication number | Priority date | Publication date | Assignee | Title |
|---|---|---|---|---|
| US11521711B2 (en) | 2008-06-23 | 2022-12-06 | Atonarp Inc. | System for handling information relating to chemical substances |
Also Published As
| Publication number | Publication date |
|---|---|
| CA2583734C (en) | 2014-09-23 |
| JP5153338B2 (ja) | 2013-02-27 |
| GB2422049A (en) | 2006-07-12 |
| EP1817718A2 (en) | 2007-08-15 |
| EP1950690B1 (en) | 2012-06-06 |
| CA2583734A1 (en) | 2006-06-01 |
| GB2472951B (en) | 2011-04-27 |
| WO2006058198A2 (en) | 2006-06-01 |
| GB201020824D0 (en) | 2011-01-19 |
| WO2006058198A3 (en) | 2006-11-23 |
| EP1950690A1 (en) | 2008-07-30 |
| CN101088096B (zh) | 2011-02-16 |
| US7987060B2 (en) | 2011-07-26 |
| GB2472951A (en) | 2011-02-23 |
| GB0426174D0 (en) | 2004-12-29 |
| US20080270083A1 (en) | 2008-10-30 |
| GB2422049B (en) | 2011-04-13 |
| JP2012088332A (ja) | 2012-05-10 |
| CN101088096A (zh) | 2007-12-12 |
| JP5562933B2 (ja) | 2014-07-30 |
| JP2008522161A (ja) | 2008-06-26 |
Similar Documents
| Publication | Publication Date | Title |
|---|---|---|
| EP1817718B1 (en) | Method of processing mass spectrometry data | |
| US7962301B2 (en) | Method of processing and storing mass spectrometry data | |
| US10224191B2 (en) | MS/MS data processing | |
| US5072115A (en) | Interpretation of mass spectra of multiply charged ions of mixtures | |
| US6627875B2 (en) | Tailored waveform/charge reduction mass spectrometry | |
| US7511267B2 (en) | Data-dependent accurate mass neutral loss analysis | |
| WO2004111609A2 (en) | Methods for accurate component intensity extraction from separations-mass spectrometry data | |
| CN112534267A (zh) | 复杂样本中相关化合物的识别和评分 | |
| EP3204740B1 (en) | Improving information dependent analysis (ida) spectral output for database searches | |
| US20230384274A1 (en) | Methods, mediums, and systems for targeted isotope clustering | |
| AU2002307457A1 (en) | Tailored waveform/charge reduction mass spectrometry |
Legal Events
| Date | Code | Title | Description |
|---|---|---|---|
| PUAI | Public reference made under article 153(3) epc to a published international application that has entered the european phase |
Free format text: ORIGINAL CODE: 0009012 |
|
| 17P | Request for examination filed |
Effective date: 20070423 |
|
| AK | Designated contracting states |
Kind code of ref document: A2 Designated state(s): DE GB |
|
| 17Q | First examination report despatched |
Effective date: 20070904 |
|
| DAX | Request for extension of the european patent (deleted) | ||
| RBV | Designated contracting states (corrected) |
Designated state(s): DE GB |
|
| GRAP | Despatch of communication of intention to grant a patent |
Free format text: ORIGINAL CODE: EPIDOSNIGR1 |
|
| GRAS | Grant fee paid |
Free format text: ORIGINAL CODE: EPIDOSNIGR3 |
|
| GRAA | (expected) grant |
Free format text: ORIGINAL CODE: 0009210 |
|
| AK | Designated contracting states |
Kind code of ref document: B1 Designated state(s): DE GB |
|
| REG | Reference to a national code |
Ref country code: GB Ref legal event code: FG4D |
|
| REG | Reference to a national code |
Ref country code: DE Ref legal event code: R096 Ref document number: 602005034593 Country of ref document: DE Effective date: 20120802 |
|
| PLBE | No opposition filed within time limit |
Free format text: ORIGINAL CODE: 0009261 |
|
| STAA | Information on the status of an ep patent application or granted ep patent |
Free format text: STATUS: NO OPPOSITION FILED WITHIN TIME LIMIT |
|
| 26N | No opposition filed |
Effective date: 20130307 |
|
| REG | Reference to a national code |
Ref country code: DE Ref legal event code: R097 Ref document number: 602005034593 Country of ref document: DE Effective date: 20130307 |
|
| REG | Reference to a national code |
Ref country code: DE Ref legal event code: R079 Ref document number: 602005034593 Country of ref document: DE Free format text: PREVIOUS MAIN CLASS: G06K0009000000 Ipc: G06V0010000000 |
|
| PGFP | Annual fee paid to national office [announced via postgrant information from national office to epo] |
Ref country code: GB Payment date: 20231128 Year of fee payment: 19 |
|
| PGFP | Annual fee paid to national office [announced via postgrant information from national office to epo] |
Ref country code: DE Payment date: 20231120 Year of fee payment: 19 |