EP1716444B1 - Fluorescence microscope arrangement - Google Patents
Fluorescence microscope arrangement Download PDFInfo
- Publication number
- EP1716444B1 EP1716444B1 EP05702809A EP05702809A EP1716444B1 EP 1716444 B1 EP1716444 B1 EP 1716444B1 EP 05702809 A EP05702809 A EP 05702809A EP 05702809 A EP05702809 A EP 05702809A EP 1716444 B1 EP1716444 B1 EP 1716444B1
- Authority
- EP
- European Patent Office
- Prior art keywords
- sample
- field
- fluorescence
- microscope
- inhomogeneous
- Prior art date
- Legal status (The legal status is an assumption and is not a legal conclusion. Google has not performed a legal analysis and makes no representation as to the accuracy of the status listed.)
- Not-in-force
Links
- 239000003550 marker Substances 0.000 claims abstract description 42
- 238000000034 method Methods 0.000 claims abstract description 29
- 238000009826 distribution Methods 0.000 claims abstract description 28
- 230000005855 radiation Effects 0.000 claims abstract description 21
- 230000005684 electric field Effects 0.000 claims abstract description 17
- 230000003287 optical effect Effects 0.000 claims abstract description 10
- 238000003384 imaging method Methods 0.000 claims description 7
- 238000012545 processing Methods 0.000 claims description 7
- 230000005284 excitation Effects 0.000 claims description 4
- 239000000523 sample Substances 0.000 description 45
- 238000000799 fluorescence microscopy Methods 0.000 description 6
- 238000004458 analytical method Methods 0.000 description 5
- 230000005426 magnetic field effect Effects 0.000 description 4
- 239000012472 biological sample Substances 0.000 description 3
- 238000006243 chemical reaction Methods 0.000 description 3
- 230000000694 effects Effects 0.000 description 3
- RTZKZFJDLAIYFH-UHFFFAOYSA-N Diethyl ether Chemical compound CCOCC RTZKZFJDLAIYFH-UHFFFAOYSA-N 0.000 description 2
- 239000003086 colorant Substances 0.000 description 2
- 238000009792 diffusion process Methods 0.000 description 2
- 239000000539 dimer Substances 0.000 description 2
- 238000011156 evaluation Methods 0.000 description 2
- 230000005281 excited state Effects 0.000 description 2
- 230000003595 spectral effect Effects 0.000 description 2
- 239000003513 alkali Substances 0.000 description 1
- QVGXLLKOCUKJST-UHFFFAOYSA-N atomic oxygen Chemical compound [O] QVGXLLKOCUKJST-UHFFFAOYSA-N 0.000 description 1
- 238000004061 bleaching Methods 0.000 description 1
- 210000000170 cell membrane Anatomy 0.000 description 1
- 238000010226 confocal imaging Methods 0.000 description 1
- 230000008878 coupling Effects 0.000 description 1
- 238000010168 coupling process Methods 0.000 description 1
- 238000005859 coupling reaction Methods 0.000 description 1
- 230000001419 dependent effect Effects 0.000 description 1
- 238000001514 detection method Methods 0.000 description 1
- 238000010586 diagram Methods 0.000 description 1
- 239000003814 drug Substances 0.000 description 1
- 150000002170 ethers Chemical class 0.000 description 1
- 239000007850 fluorescent dye Substances 0.000 description 1
- 230000008014 freezing Effects 0.000 description 1
- 238000007710 freezing Methods 0.000 description 1
- 230000005283 ground state Effects 0.000 description 1
- 230000001744 histochemical effect Effects 0.000 description 1
- 230000010354 integration Effects 0.000 description 1
- 150000002605 large molecules Chemical class 0.000 description 1
- 229920002521 macromolecule Polymers 0.000 description 1
- 239000006249 magnetic particle Substances 0.000 description 1
- 230000002503 metabolic effect Effects 0.000 description 1
- 230000004060 metabolic process Effects 0.000 description 1
- 238000002156 mixing Methods 0.000 description 1
- 239000002773 nucleotide Substances 0.000 description 1
- 125000003729 nucleotide group Chemical group 0.000 description 1
- 229910052760 oxygen Inorganic materials 0.000 description 1
- 239000001301 oxygen Substances 0.000 description 1
- 230000010287 polarization Effects 0.000 description 1
- 102000004169 proteins and genes Human genes 0.000 description 1
- 108090000623 proteins and genes Proteins 0.000 description 1
- 230000011218 segmentation Effects 0.000 description 1
- 230000035945 sensitivity Effects 0.000 description 1
- 238000000926 separation method Methods 0.000 description 1
- 239000007787 solid Substances 0.000 description 1
- 238000007614 solvation Methods 0.000 description 1
- 239000011877 solvent mixture Substances 0.000 description 1
- 238000004611 spectroscopical analysis Methods 0.000 description 1
- 230000003068 static effect Effects 0.000 description 1
- 239000000126 substance Substances 0.000 description 1
- XLYOFNOQVPJJNP-UHFFFAOYSA-N water Substances O XLYOFNOQVPJJNP-UHFFFAOYSA-N 0.000 description 1
Images
Classifications
-
- G—PHYSICS
- G01—MEASURING; TESTING
- G01N—INVESTIGATING OR ANALYSING MATERIALS BY DETERMINING THEIR CHEMICAL OR PHYSICAL PROPERTIES
- G01N21/00—Investigating or analysing materials by the use of optical means, i.e. using sub-millimetre waves, infrared, visible or ultraviolet light
- G01N21/62—Systems in which the material investigated is excited whereby it emits light or causes a change in wavelength of the incident light
- G01N21/63—Systems in which the material investigated is excited whereby it emits light or causes a change in wavelength of the incident light optically excited
- G01N21/64—Fluorescence; Phosphorescence
- G01N21/6428—Measuring fluorescence of fluorescent products of reactions or of fluorochrome labelled reactive substances, e.g. measuring quenching effects, using measuring "optrodes"
-
- G—PHYSICS
- G01—MEASURING; TESTING
- G01N—INVESTIGATING OR ANALYSING MATERIALS BY DETERMINING THEIR CHEMICAL OR PHYSICAL PROPERTIES
- G01N21/00—Investigating or analysing materials by the use of optical means, i.e. using sub-millimetre waves, infrared, visible or ultraviolet light
- G01N21/62—Systems in which the material investigated is excited whereby it emits light or causes a change in wavelength of the incident light
- G01N21/63—Systems in which the material investigated is excited whereby it emits light or causes a change in wavelength of the incident light optically excited
- G01N21/64—Fluorescence; Phosphorescence
- G01N21/645—Specially adapted constructive features of fluorimeters
- G01N21/6456—Spatial resolved fluorescence measurements; Imaging
- G01N21/6458—Fluorescence microscopy
-
- G—PHYSICS
- G02—OPTICS
- G02B—OPTICAL ELEMENTS, SYSTEMS OR APPARATUS
- G02B21/00—Microscopes
- G02B21/16—Microscopes adapted for ultraviolet illumination ; Fluorescence microscopes
Definitions
- the invention relates to a microscope arrangement having a fluorescence microscope for imaging the distribution of a fluorescent marker in sample.
- the invention relates furthermore to a method for determining the spatial distribution of a fluorescent marker in a sample.
- fluorescent marker is a chemical substance, which, after being excited by suitable primary radiation, emits fluorescent light of a characteristic spectral range, which is why the term "fluorescent dye” is often used for it.
- fluorescent dye By coupling a fluorescent marker to other molecules, such as medicaments or proteins, information can be obtained, for example, about metabolic processes in biological systems. But the resolution that can be achieved with current fluorescence microscopes is limited to a range of about 100 nm to 30nm, so that the study of relatively small structures or of processes on a molecular level is not possible.
- US 5,807,677 describes a FCS apparatus comprising a laser, which illuminates a small probe volume, via a beam splitter and a confocal imaging optical system. This probe volume is imaged via the confocal optical system on a photodetector, and this is coupled to an electronic evaluation system for FCS analysis.
- US 5,807,677 describes an electric molecule trap, which consists of an annular electrode and a Neher capillary whose extended tip lies in the centre of the annular electrode. If an electric voltage is applied between the annular electrode and Neher capillary, the target sequences drift into the probe volume. If the primers and target sequences display different charges one simultaneously achieves an electrophoretic separation.
- the microscope arrangement according to the invention is used for imaging a sample (for example, a biological sample) that contains a fluorescent marker.
- the fluorescent marker shall be one that is magnetically and/or electrically sensitive, that is, with which the fluorescence behavior (fluorescence intensity, spectral shifts of fluorescence, polarization, variation in time of the intensity etc.) of the marker is influenced by an external magnetic or electric field.
- the microscope arrangement contains the following components:
- the microscope arrangement is designed to modify in a defined manner the inhomogeneous magnetic and/or electric field within the sample, for example, to shift its position and/or to change its distribution.
- important information can be obtained about the fluorescent marker contained therein. If, for example, the field has a small focal region with special conditions (e. g. a minimum of field strength), then, with this, selectively at different points within the sample the presence of the fluorescent marker can be analyzed.
- the field generator comprises a first pole body of a first polarity (in the case of magnetic fields, for example "North”, in the case of electric fields, for example, "negative"), which on at least two opposite sides is adjacent to second pole bodies of the other polarity ("South” respectively "positive").
- the first pole body preferably has a tip.
- the changes in fluorescence behavior in the sample caused by the magnetic or electric field can in the simplest case be observed by the user of the microscope arrangement purely by eye.
- an advanced image processing of the image recorded with the fluorescence microscope takes place by means of a data processing device.
- the data processing device is designed to reconstruct the distribution of the fluorescent marker in the sample from the known strength distribution of the (spatially and optionally also temporally) inhomogeneous field during one or more recordings and from the measured fluorescence radiation. If, for example, the field has a focal region of minimal field strength, the data processing device is able to take into account the fact that the fluorescence in this region is correspondingly changed (increased or reduced).
- the invention furthermore relates to a method for determining the spatial distribution of a magnetically and/or electrically sensitive fluorescent marker in a sample, which method comprises the following steps:
- the method concerns in a general way the steps that can be performed with a microscope arrangement of the kind described above. With regard to details, advantages and further aspects of the method, reference is made in particular to the above description.
- the method enables information to be extracted from the sample with high local resolution, by locally varying the conditions of the fluorescence within the sample by means of a spatially inhomogeneous field and the use of a fluorescent marker sensitive thereto.
- an inhomogeneous magnetic field preferably has (at one point at least) a gradient of at least 10 2 T/m, especially preferably of at least 10 3 T/m, and very especially preferably of at least 10 6 T/m.
- the magnetic field strength per nanometer varies by about 0.1 to 1 mT, wherein known magnetically sensitive fluorescent markers already respond to such changes.
- a spatial resolution in the region of 1 nm can be achieved.
- an inhomogeneous electric field preferably has (at one point at least) a gradient of at least 10 11 V/m 2 , especially preferably of at least 10 15 V/m 2 .
- a resolution in the nanometer range is likewise obtained.
- the inhomogeneous field is configured so that it has a local minimum of the field strength.
- this minimum can have the value zero, that is, can correspond to a field-free region.
- the width of the local minimum is smaller than the optical resolution of the fluorescence microscope.
- the "width" of the minimum is expediently defined in dependence on the effect of the field on the fluorescent marker under consideration. If the latter, for example, in the case of a vanishing field has a minimal fluorescence yield that increases to a maximum value as the field increases, the "width" can be defined as the region having a fluorescence yield below a specific percentage (for example, 50%) of the maximum value.
- special conditions are therefore created for the fluorescence, which lead to observable effects in the fluorescence radiation emitted from the sample.
- the minimum can therefore be used as the focal region for targeted analysis of small volumes within the sample.
- the sample is located during its analysis in a solution that contains the fluorescent marker.
- fluorescent marker that has been lost and/or degraded, for example, by bleaching is constantly replaced from the solution, so that the fluorescence in the sample can be maintained for a comparatively long period.
- the point is to determine the distribution of a fluorescent marker 21 within a sample 20; this distribution, for example, in the case of biological samples, can provide information about anatomical and/or metabolic conditions.
- Suitable fluorescence microscopes are found, for example, in the LSM 510 series of the firm Carl Zeiss in Oberkochen.
- the sample 20 is irradiated with (primary) photons ⁇ E , which are absorbed by the atoms and molecules of the fluorescent marker 21 and thus send them into an excited energy state. This energy state is then degraded again through emission of the fluorescence photons ⁇ F , which have a wavelength characteristic of the marker.
- an image of the intensity distribution of the fluorescence radiation is created by the optical system of the microscope. On this image, an observer can detect by eye, for example, areas of increased concentration of the fluorescent marker. Moreover, in the case of advanced evaluation methods as a rule the intensity distribution of the fluorescence radiation is measured quantitatively.
- the optical resolution is limited to values of about 100 to 30 nm.
- Magnetically sensitive fluorescent markers alter their fluorescence behavior in dependence on the strength of the external magnetic field in which they are located.
- Typical examples of such fluorescent markers are the so-called "exciplexes", which are formed from excited complexes. That is to say, a molecule crosses through a primary photon into an excited state and combines with another molecule to form a dimer. In the dimer, the energy levels of the singulet and triplet states are virtually degenerate and shuffle in the course of time.
- the triplet state splits into three different states, whereby the speed of mixing of singulet and triplet states is changed.
- the exciplex can cross into the ground state while emitting a fluorescence photon, the probability that this photon will be emitted being dependent on whether a singulet or triplet state was present.
- the fluorescence yield also depends on the external magnetic field. Changing of the fluorescence by the magnetic field can here amount to more than 30%, and effects can be achieved already with fields of less than 2 mT.
- the two reaction partners of the exciplex are chemically bonded with one another to form a so-called intramolecular exciplex.
- Examples of magnetically sensitive fluorescent markers are known also from studies relating to MARY ( MA gnetic field effect on R eaction Y ield) spectroscopy, cf. Günter Grampp et al.: RIEKEN Review No. 44 (February 2002 )). Further, one can refer in this regard to the publications of N.Kh. Petrov (e.g.: N.Kh. Petrov, V.N. Borisenko, A.V. Starostin, M.V. Alfimov, Amplification of the cage effect in binary solvents detected by technique of magnetic modulation of exciplex fluorescence, Izv. AN SSSR, ser. chim., 1991, no. 11, p. 2456 ;
- N.Kh. Petrov e.g.: N.Kh. Petrov, V.N. Borisenko, A.V. Starostin, M.V. Alfimov, Amplification of the cage effect in binary solvents detected by technique of magnetic modulation of exciplex fluorescence,
- N.Kh. Petrov, V.N. Borisenko, M.V. Alfimov Study of preferential solvation in binary solvent mixtures by the fluorescence-detected magnetic field effect. J. Chem. Soc., Faraday Trans., 1994, vol. 90, no. 1, 109-111 ; N.Kh. Petrov, V.N. Borisenko, M.V. Alfimov, Magnetic Field Effects of Exciplex Fluorescence of the Pyrene-Azacrown Ether System in the Presence of Alkali and Alkaline Earth Salts, J. Chem. Soc. Mendeleev Commun. 1995 ; N.Kh. Petrov, V.N. Borisenko, M.V.
- electrically sensitive fluorescent markers could be used instead of magnetically sensitive fluorescent markers. These are correspondingly distinguished by the fact that their fluorescence behavior depends on the external electric field in which they are located. Demonstrable changes in the fluorescence behavior frequently occur already at differences in the electric field strength of the order of magnitude of 10 6 V/m. Electrically sensitive fluorescent markers are also used for measuring naturally occurring electric field strengths (for example, within a cell membrane). For that purpose, electrically sensitive fluorescent markers are described, for example, in United States patent specification 2002/0155520 A9 ; the markers described therein can be used also in the present case and the document is fully incorporated by reference into the present application.
- a field generator 30 that is capable of generating an inhomogeneous magnetic field 33 within the sample 20 is positioned in the vicinity of the probe 20.
- the field generator 30 consists of three (for example, permanently magnetic) pole bodies.
- a first pole body 31 having the polarity "magnetic North” preferably has a tip in order to improve the optical accessibility to the sample.
- a focal region 22, in which the magnetic field strength is approximately zero occurs in front of the tip of the first pole body 31, as indicated by dashed field lines 33.
- the distance of the tip from the focal region 22 depends on the desired gradient and for gradients of 10 6 T/m is typically about 1 ⁇ m and, for gradients of 10 3 T/m, in the millimeter range.
- the width of the focal region can be, for example, about 1 nm.
- the field generator 30 is dimensioned so that the gradient of the magnetic field 33 around the focal region 22 is more than 10 6 T/m (in the case of an inhomogeneous electric field, the gradient should be more than 10 V/m 2 ).
- the distribution of the intensity IF of the fluorescence radiation ⁇ F from the sample 20 over the location x is reproduced. It is assumed in the example here that the fluorescent marker 21 is approximately uniformly distributed in the sample 20, so that in principle all points emit fluorescence radiation with the same intensity. Excluded from this, however, is the small focal region 22 of the inhomogeneous magnetic field 33, in which the intensity is reduced. At the associated point x 0 the intensity distribution IF thus exhibits a minimum. But because of the limited optical resolution of the microscope 10, the minimum cannot be sharply reproduced directly. Rather, the course of the fluorescence intensity I FM observed with the microscope arrangement has the course illustrated in the upper diagram of the Figure, in which the minimum is correspondingly broadened and flattened.
- This "blurred" reproduction of a focal region 22 can nevertheless be used to improve the resolution of the microscope arrangement, since the position of the inhomogeneous magnetic field 33 and hence of the focal region 22 within the sample can be varied.
- mathematical conclusions can be drawn about the conditions in the locally defined region 22.
- the concentration of the fluorescent marker can be scanned with a resolution in the nanometer range.
- the proportion of background radiation should preferably be minimized and hence the signal-noise ratio maximized.
- One way to do this comprises exciting only a small sample region by primary radiation ⁇ E , and restricting the observation to a correspondingly small region.
- a high-quality confocal scanning microscope is therefore used.
- techniques such as two-photon excitation and a stimulated emission are helpful.
- the signal-noise ratio can also be improved by integration over time and/or a high light level for the excitation. In this respect photobleaching of the fluorescent marker constrains this method.
- the numerous other techniques known from fluorescence microscopy can be used in combination with the present method.
- the fluorescent marker 21 will degenerate over the course of time as result of chemical reaction of the excited states (for example with oxygen).
- the degenerate marker molecules are replaced preferably by way of diffusion. If, for example, the surface of a sample is to be observed, this can be immersed in a solution of the fluorescent marker. The molecules of the fluorescent marker then absorb at the surface of the sample, degenerate molecules being replaced from time to time by unconsumed molecules of the fluorescent marker from the solution.
- the described microscope arrangement can be used in the imaging of solid bodies, similar to the way scanning currently occurs with electron microscopes. It is advantageous in the above-described magnetic field-based method that the sample does not need to be dried, and biological samples can even still be living. If an electric field is used, the sample should be electrically isolated. This can be achieved, for example, by placing it in oil or demineralized water or by freezing.
- the method can be used for detection of biological molecules.
- a sample of different molecules could be mixed with fluorescent markers (one or more colors), which bond specifically or non-specifically to the molecules to be identified. Identification of the molecules would then be effected by means of the observed spatial distribution of the fluorescent markers.
- fluorescent markers one or more colors
- large molecules could be identified, for example, by the fact that the fluorescent marker bonds to different points of the molecule and therefore renders the characteristic spatial form of the molecule recognizable.
- the method could, for example, allow rapid segmentation of a DNA sample; here, different colors could encode different nucleotides.
Abstract
Description
- The invention relates to a microscope arrangement having a fluorescence microscope for imaging the distribution of a fluorescent marker in sample. The invention relates furthermore to a method for determining the spatial distribution of a fluorescent marker in a sample.
- In fluorescence microscopy, the distribution of a fluorescent marker in a sample is observed with a microscope designed for that purpose. A fluorescent marker is a chemical substance, which, after being excited by suitable primary radiation, emits fluorescent light of a characteristic spectral range, which is why the term "fluorescent dye" is often used for it. By coupling a fluorescent marker to other molecules, such as medicaments or proteins, information can be obtained, for example, about metabolic processes in biological systems. But the resolution that can be achieved with current fluorescence microscopes is limited to a range of about 100 nm to 30nm, so that the study of relatively small structures or of processes on a molecular level is not possible.
-
US 5,807,677 describes a FCS apparatus comprising a laser, which illuminates a small probe volume, via a beam splitter and a confocal imaging optical system. This probe volume is imaged via the confocal optical system on a photodetector, and this is coupled to an electronic evaluation system for FCS analysis. In order to convey a target sequences which have been hybridized with primers into the probe volume faster than if controlled by diffusion,US 5,807,677 describes an electric molecule trap, which consists of an annular electrode and a Neher capillary whose extended tip lies in the centre of the annular electrode. If an electric voltage is applied between the annular electrode and Neher capillary, the target sequences drift into the probe volume. If the primers and target sequences display different charges one simultaneously achieves an electrophoretic separation. - Against this background, it was an object of the present invention to provide means for improving the resolution in fluorescence microscopy in clear and turbid media.
- That object is achieved by a microscope arrangement having the features of claim 1 and by a method having the features of claim 4. Advantageous embodiments are contained in the subsidiary claims.
- The microscope arrangement according to the invention is used for imaging a sample (for example, a biological sample) that contains a fluorescent marker. Here, the fluorescent marker shall be one that is magnetically and/or electrically sensitive, that is, with which the fluorescence behavior (fluorescence intensity, spectral shifts of fluorescence, polarization, variation in time of the intensity etc.) of the marker is influenced by an external magnetic or electric field.
- The microscope arrangement contains the following components:
- A fluorescence microscope for exciting and imaging fluorescence radiation from the sample. Suitable microscopes for this purpose are known from the field of fluorescence microscopy.
- A field generator for generating a spatially inhomogeneous magnetic and/or a spatially inhomogeneous electric field in the sample, wherein the inhomogeneity of the field must be present at least in a local region.
- Using the described microscope arrangement, it is possible to extract more information from the study of a sample than with conventional fluorescence microscopy.
- This is attributable to the fact that it is possible to generate in the sample a spatially inhomogeneous field that, in accordance with requirements, influences the emission behavior of the fluorescent marker to be observed. The field therefore gives the user the opportunity to vary the local conditions within the sample specifically and consequently to influence the fluorescence. In particular, in this way the resolution of the microscope arrangement in respect of the fluorescence radiation can be improved, specific applications of the arrangement being described in more detail below. Furthermore, using the microscope arrangement it is possible also to carry out analyses in turbid media with improved resolution.
- According to a first, preferred embodiment, the microscope arrangement is designed to modify in a defined manner the inhomogeneous magnetic and/or electric field within the sample, for example, to shift its position and/or to change its distribution. By observing how a given sample volume responds to the change in the field, important information can be obtained about the fluorescent marker contained therein. If, for example, the field has a small focal region with special conditions (e. g. a minimum of field strength), then, with this, selectively at different points within the sample the presence of the fluorescent marker can be analyzed.
- There are various possibilities for constructing a field generator having the desired properties. In this regard to some extent one can have recourse to solutions that are known for other applications, such as, for example, the imaging of magnetic particles(cf.
DE101 51 778 A1 ). According to a preferred embodiment, the field generator comprises a first pole body of a first polarity (in the case of magnetic fields, for example "North", in the case of electric fields, for example, "negative"), which on at least two opposite sides is adjacent to second pole bodies of the other polarity ("South" respectively "positive"). The first pole body preferably has a tip. As will be explained in detail within the scope of the description of the drawings, in the case of such a configuration there is generally a point-form region in the vicinity of the field generator at which the field strength assumes a minimum. This is then suitable as a focal region when observing a sample. - The changes in fluorescence behavior in the sample caused by the magnetic or electric field can in the simplest case be observed by the user of the microscope arrangement purely by eye. Preferably, however, an advanced image processing of the image recorded with the fluorescence microscope takes place by means of a data processing device. In this regard, the data processing device is designed to reconstruct the distribution of the fluorescent marker in the sample from the known strength distribution of the (spatially and optionally also temporally) inhomogeneous field during one or more recordings and from the measured fluorescence radiation. If, for example, the field has a focal region of minimal field strength, the data processing device is able to take into account the fact that the fluorescence in this region is correspondingly changed (increased or reduced).
- The invention furthermore relates to a method for determining the spatial distribution of a magnetically and/or electrically sensitive fluorescent marker in a sample, which method comprises the following steps:
- Generation of a temporally static or varying, inhomogeneous, magnetic and/or inhomogeneous electric field in the sample, so that the fluorescent marker comes across locally different conditions.
- Excitation of fluorescence radiation in the sample, for example by primary radiation of suitable quantum energy.
- Generation of at least one optical image of the fluorescence radiation coming from the sample.
- Calculation of the spatial distribution of the fluorescent marker by means of the at least one above-mentioned image and by means of the known associated strength distribution of the inhomogeneous field. Preferably, the calculation is based on at least two images in the case of spatially different field-strength distributions. If the field-strength distributions are such that they each allow analysis of a point-form region or pixel/voxel, normally N different field-strength distributions are required for the representation of N pixels/voxels.
- The method concerns in a general way the steps that can be performed with a microscope arrangement of the kind described above. With regard to details, advantages and further aspects of the method, reference is made in particular to the above description. The method enables information to be extracted from the sample with high local resolution, by locally varying the conditions of the fluorescence within the sample by means of a spatially inhomogeneous field and the use of a fluorescent marker sensitive thereto.
- If an inhomogeneous magnetic field is used in the method, it preferably has (at one point at least) a gradient of at least 102 T/m, especially preferably of at least 103 T/m, and very especially preferably of at least 106 T/m. At such values of the gradient, the magnetic field strength per nanometer varies by about 0.1 to 1 mT, wherein known magnetically sensitive fluorescent markers already respond to such changes. At said gradients, a spatial resolution in the region of 1 nm can be achieved.
- If an inhomogeneous electric field is used in the method, this preferably has (at one point at least) a gradient of at least 1011 V/m2, especially preferably of at least 1015 V/m2. At these values and with the use of ordinary electrically sensitive fluorescent markers, a resolution in the nanometer range is likewise obtained.
- According to a preferred embodiment of the method, the inhomogeneous field is configured so that it has a local minimum of the field strength. In particular, this minimum can have the value zero, that is, can correspond to a field-free region. Preferably, the width of the local minimum is smaller than the optical resolution of the fluorescence microscope. Here, the "width" of the minimum is expediently defined in dependence on the effect of the field on the fluorescent marker under consideration. If the latter, for example, in the case of a vanishing field has a minimal fluorescence yield that increases to a maximum value as the field increases, the "width" can be defined as the region having a fluorescence yield below a specific percentage (for example, 50%) of the maximum value. In the spatially confined region of the local minimum, special conditions are therefore created for the fluorescence, which lead to observable effects in the fluorescence radiation emitted from the sample. The minimum can therefore be used as the focal region for targeted analysis of small volumes within the sample.
- According to another aspect of the method, the sample is located during its analysis in a solution that contains the fluorescent marker. In this way, fluorescent marker that has been lost and/or degraded, for example, by bleaching, is constantly replaced from the solution, so that the fluorescence in the sample can be maintained for a comparatively long period.
- These and other aspects of the invention are apparent from and will be elucidated with reference to the embodiments described hereinafter.
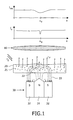
- In the drawings, the single Figure shows schematically the principle of the microscope arrangement according to the invention and its use.
- Within the field of fluorescence microscopy, the point is to determine the distribution of a
fluorescent marker 21 within asample 20; this distribution, for example, in the case of biological samples, can provide information about anatomical and/or metabolic conditions. Suitable fluorescence microscopes are found, for example, in the LSM 510 series of the firm Carl Zeiss in Oberkochen. To excite the fluorescence, thesample 20 is irradiated with (primary) photons νE, which are absorbed by the atoms and molecules of thefluorescent marker 21 and thus send them into an excited energy state. This energy state is then degraded again through emission of the fluorescence photons νF, which have a wavelength characteristic of the marker. - From the fluorescence photons νF entering an associated
microscope 10, an image of the intensity distribution of the fluorescence radiation is created by the optical system of the microscope. On this image, an observer can detect by eye, for example, areas of increased concentration of the fluorescent marker. Moreover, in the case of advanced evaluation methods as a rule the intensity distribution of the fluorescence radiation is measured quantitatively. Common to all known fluorescence microscopes operating according to the principle described so far is the fact that the optical resolution is limited to values of about 100 to 30 nm. - To overcome this limitation, with the arrangement illustrated in the Figure it is proposed to use a magnetically sensitive
fluorescent marker 21 as well as a spatially inhomogeneousmagnetic field 33 within thesample 20. Magnetically sensitive fluorescent markers alter their fluorescence behavior in dependence on the strength of the external magnetic field in which they are located. Typical examples of such fluorescent markers are the so-called "exciplexes", which are formed from excited complexes. That is to say, a molecule crosses through a primary photon into an excited state and combines with another molecule to form a dimer. In the dimer, the energy levels of the singulet and triplet states are virtually degenerate and shuffle in the course of time. If an external magnetic field is used, the triplet state splits into three different states, whereby the speed of mixing of singulet and triplet states is changed. The exciplex can cross into the ground state while emitting a fluorescence photon, the probability that this photon will be emitted being dependent on whether a singulet or triplet state was present. In this way, the fluorescence yield also depends on the external magnetic field. Changing of the fluorescence by the magnetic field can here amount to more than 30%, and effects can be achieved already with fields of less than 2 mT. Ideally, the two reaction partners of the exciplex are chemically bonded with one another to form a so-called intramolecular exciplex. Examples of magnetically sensitive fluorescent markers are known also from studies relating to MARY (MAgnetic field effect on Reaction Yield) spectroscopy, cf. Günter Grampp et al.: RIEKEN Review No. 44 (February 2002)). Further, one can refer in this regard to the publications of N.Kh. Petrov (e.g.: N.Kh. Petrov, V.N. Borisenko, A.V. Starostin, M.V. Alfimov, Amplification of the cage effect in binary solvents detected by technique of magnetic modulation of exciplex fluorescence, Izv. AN SSSR, ser. chim., 1991, no. 11, p. 2456; - N.Kh. Petrov, V.N. Borisenko, A.V. Starostin, M.V. Alfimov, Polar molecular clusters produced upon photoinduced electron transfer in an intermolecular exciplex in binary solvents, J. Phys. Chem., 1992, vol. 96, no. 7, p.2901;
- N.Kh. Petrov, V.N. Borisenko, M.V. Alfimov, Study of preferential solvation in binary solvent mixtures by the fluorescence-detected magnetic field effect. J. Chem. Soc., Faraday Trans., 1994, vol. 90, no. 1, 109-111; N.Kh. Petrov, V.N. Borisenko, M.V. Alfimov, Magnetic Field Effects of Exciplex Fluorescence of the Pyrene-Azacrown Ether System in the Presence of Alkali and Alkaline Earth Salts, J. Chem. Soc. Mendeleev Commun. 1995; N.Kh. Petrov, V.N. Borisenko, M.V. Alfimov, T. Fiebig, H. Staerk, Fluorescence-detected Magnetic Field Effects in Exciplex Systems Containing Azacrown Ethers as Electron Donor, J. Phys. chem., 1996, vol. 100, no. 16, 6368-6370.
- Alternatively, instead of magnetically sensitive fluorescent markers, electrically sensitive fluorescent markers could be used. These are correspondingly distinguished by the fact that their fluorescence behavior depends on the external electric field in which they are located. Demonstrable changes in the fluorescence behavior frequently occur already at differences in the electric field strength of the order of magnitude of 106 V/m. Electrically sensitive fluorescent markers are also used for measuring naturally occurring electric field strengths (for example, within a cell membrane). For that purpose, electrically sensitive fluorescent markers are described, for example, in United States patent specification
2002/0155520 A9 ; the markers described therein can be used also in the present case and the document is fully incorporated by reference into the present application. Furthermore, as regards this subject matter reference can be made to Jian-young Wu et al., Histochemical Journal, 30 169-187 (1998) as representative of further publications. For the record, the method described below for magnetically sensitive fluorescent markers can be carried out analogously for electrically sensitive markers as well. - To be able to exploit the sensitivity of the
fluorescent marker 21 to magnetic fields, afield generator 30 that is capable of generating an inhomogeneousmagnetic field 33 within thesample 20 is positioned in the vicinity of theprobe 20. In the example illustrated, thefield generator 30 consists of three (for example, permanently magnetic) pole bodies. Afirst pole body 31 having the polarity "magnetic North" preferably has a tip in order to improve the optical accessibility to the sample. On opposite sides of thefirst pole body 31 there are twofurther pole bodies 32 having the polarity "magnetic South". These could alternatively annularly surround thefirst pole body 31. With this configuration, afocal region 22, in which the magnetic field strength is approximately zero, occurs in front of the tip of thefirst pole body 31, as indicated by dashed field lines 33. The distance of the tip from thefocal region 22 depends on the desired gradient and for gradients of 106 T/m is typically about 1 µm and, for gradients of 103 T/m, in the millimeter range. The width of the focal region can be, for example, about 1 nm. Furthermore, thefield generator 30 is dimensioned so that the gradient of themagnetic field 33 around thefocal region 22 is more than 106 T/m (in the case of an inhomogeneous electric field, the gradient should be more than 10 V/m2). - In the Figure, above the microscope arrangement the distribution of the intensity IF of the fluorescence radiation νF from the
sample 20 over the location x is reproduced. It is assumed in the example here that thefluorescent marker 21 is approximately uniformly distributed in thesample 20, so that in principle all points emit fluorescence radiation with the same intensity. Excluded from this, however, is the smallfocal region 22 of the inhomogeneousmagnetic field 33, in which the intensity is reduced. At the associated point x0 the intensity distribution IF thus exhibits a minimum. But because of the limited optical resolution of themicroscope 10, the minimum cannot be sharply reproduced directly. Rather, the course of the fluorescence intensity IFM observed with the microscope arrangement has the course illustrated in the upper diagram of the Figure, in which the minimum is correspondingly broadened and flattened. This "blurred" reproduction of afocal region 22 can nevertheless be used to improve the resolution of the microscope arrangement, since the position of the inhomogeneousmagnetic field 33 and hence of thefocal region 22 within the sample can be varied. By simultaneously observing the changes in the measured intensity distribution IFM, mathematical conclusions can be drawn about the conditions in the locally definedregion 22. As a result, by moving thefocal region 22, the concentration of the fluorescent marker can be scanned with a resolution in the nanometer range. - To optimize the reproduction quality achievable with the microscope arrangement, the proportion of background radiation should preferably be minimized and hence the signal-noise ratio maximized. One way to do this comprises exciting only a small sample region by primary radiation νE, and restricting the observation to a correspondingly small region. Ideally, a high-quality confocal scanning microscope is therefore used. Furthermore, techniques such as two-photon excitation and a stimulated emission are helpful. The signal-noise ratio can also be improved by integration over time and/or a high light level for the excitation. In this respect photobleaching of the fluorescent marker constrains this method. Like all the above-mentioned techniques, in general also the numerous other techniques known from fluorescence microscopy can be used in combination with the present method.
- Moreover, it may be that the
fluorescent marker 21 will degenerate over the course of time as result of chemical reaction of the excited states (for example with oxygen). In that case, the degenerate marker molecules are replaced preferably by way of diffusion. If, for example, the surface of a sample is to be observed, this can be immersed in a solution of the fluorescent marker. The molecules of the fluorescent marker then absorb at the surface of the sample, degenerate molecules being replaced from time to time by unconsumed molecules of the fluorescent marker from the solution. - The described microscope arrangement can be used in the imaging of solid bodies, similar to the way scanning currently occurs with electron microscopes. It is advantageous in the above-described magnetic field-based method that the sample does not need to be dried, and biological samples can even still be living. If an electric field is used, the sample should be electrically isolated. This can be achieved, for example, by placing it in oil or demineralized water or by freezing.
- Moreover, the method can be used for detection of biological molecules. In that case, a sample of different molecules could be mixed with fluorescent markers (one or more colors), which bond specifically or non-specifically to the molecules to be identified. Identification of the molecules would then be effected by means of the observed spatial distribution of the fluorescent markers. In the case of a non-specific bond of the fluorescent marker to the molecules, large molecules could be identified, for example, by the fact that the fluorescent marker bonds to different points of the molecule and therefore renders the characteristic spatial form of the molecule recognizable. In the case of a specific bond of fluorescent markers, the method could, for example, allow rapid segmentation of a DNA sample; here, different colors could encode different nucleotides.
Claims (9)
- A microscope arrangement for imaging a sample (20) that contains a magnetically and/or electrically sensitive fluorescent marker(21), comprising:a fluorescence microscope (10) comprising means for exciting and imaging fluorescence radiation (νF) from the sample (20); anda field generator (30) for generating an inhomogeneous magnetic and/or inhomogeneous electric field (33) in the sample (20), the field generator having a first pole body (31) of a first polarity (N), which on at least two opposite sides is adjacent to second pole bodies (32) of different polarity (S), the field (33) having a local minimum (22) of field strength forming a focal region for observing the sample; the microscope being arranged to observe fluorescence radiation from said focal region while applying the inhomogeneous magnetic and/or electric field in order to improve the resolution of the fluorescence microscope.
- A microscope arrangement as claimed in claim 1, which is designed to alter the inhomogeneous field (33) within the sample (20) in a defined manner.
- A microscope arrangement as claimed in claim 1, characterized in that it comprises a data processing device for image processing of the image (IFM) recorded by the fluorescence microscope (10), the data processing device being designed to reconstruct the distribution of the fluorescent marker (21) in the sample (20) from the known spatial strength distribution of the inhomogeneous field (33) during one or preferably several recordings.
- A method of determining the spatial distribution of a magnetically and/or electrically sensitive fluorescent marker(21) in a sample (20), which method comprises the following steps:generation of an inhomogeneous magnetic and/or inhomogeneous electric field (33) in the sample (20), the field (33) having a local minimum (22) of field strength forming a focal region for observing the sample;excitation of fluorescence radiation(νF) in the sample (20);generation of an image (IFM) of the fluorescence radiation (νF) coming from said focal region of the sample (20) by means of a fluorescence microscope (10);calculation of the spatial distribution of the fluorescent marker (21) by means of the generated image (IFM) and by means of the known strength distribution of the field (33).
- A method as claimed in claim 4, characterized in that the inhomogeneous magnetic field (33) has a gradient of at least 102 T/m, preferably of at least 106 T/m.
- A method as claimed in claim 4, characterized in that the inhomogeneous electric field has a gradient of at least 1011 V/m2, preferably of at least 1015V/m2.
- A method as claimed in claim 4, characterized in that the inhomogeneous field (33) has a local minimum (22) of field strength in form of a field-free point or region.
- A method as claimed in claim 7, characterized in that the width of the local minimum (22) is smaller than the optical resolution of the fluorescence microscope (10).
- A method as claimed in claim 4, characterized in that the sample (20) is located in a solution with the fluorescent marker.
Priority Applications (1)
| Application Number | Priority Date | Filing Date | Title |
|---|---|---|---|
| EP05702809A EP1716444B1 (en) | 2004-02-09 | 2005-01-27 | Fluorescence microscope arrangement |
Applications Claiming Priority (3)
| Application Number | Priority Date | Filing Date | Title |
|---|---|---|---|
| EP04100462 | 2004-02-09 | ||
| EP05702809A EP1716444B1 (en) | 2004-02-09 | 2005-01-27 | Fluorescence microscope arrangement |
| PCT/IB2005/050354 WO2005076050A1 (en) | 2004-02-09 | 2005-01-27 | Fluorescence microscope arrangement |
Publications (2)
| Publication Number | Publication Date |
|---|---|
| EP1716444A1 EP1716444A1 (en) | 2006-11-02 |
| EP1716444B1 true EP1716444B1 (en) | 2008-12-17 |
Family
ID=34833743
Family Applications (1)
| Application Number | Title | Priority Date | Filing Date |
|---|---|---|---|
| EP05702809A Not-in-force EP1716444B1 (en) | 2004-02-09 | 2005-01-27 | Fluorescence microscope arrangement |
Country Status (7)
| Country | Link |
|---|---|
| US (1) | US20070161075A1 (en) |
| EP (1) | EP1716444B1 (en) |
| JP (1) | JP4804363B2 (en) |
| CN (1) | CN100526932C (en) |
| AT (1) | ATE418084T1 (en) |
| DE (1) | DE602005011763D1 (en) |
| WO (1) | WO2005076050A1 (en) |
Families Citing this family (10)
| Publication number | Priority date | Publication date | Assignee | Title |
|---|---|---|---|---|
| US20060248944A1 (en) * | 2003-04-15 | 2006-11-09 | Koninklijke Philips Electronics N.V. | Method to determine the spatial distribution of magnetic particles and magnetic particle administering compositions |
| DE102005017817A1 (en) * | 2005-04-18 | 2006-10-26 | Siemens Ag | Method and device for examining a biological tissue |
| EP1912557A2 (en) * | 2005-08-01 | 2008-04-23 | Philips Intellectual Property & Standards GmbH | Optical imaging |
| JP2011022201A (en) * | 2009-07-13 | 2011-02-03 | Jikei Univ | Light source device for microscope apparatus, observation sample-mounting implement with light source device, and microscope apparatus |
| CN103575716A (en) * | 2013-11-15 | 2014-02-12 | 中国科学院长春应用化学研究所 | Magnetic field regulated and controlled super-resolution fluorescence imaging method |
| EP3859425B1 (en) | 2015-09-17 | 2024-04-17 | S.D. Sight Diagnostics Ltd. | Methods and apparatus for detecting an entity in a bodily sample |
| US11733150B2 (en) | 2016-03-30 | 2023-08-22 | S.D. Sight Diagnostics Ltd. | Distinguishing between blood sample components |
| EP3455610B1 (en) | 2016-05-11 | 2023-01-04 | S.D. Sight Diagnostics Ltd. | Sample carrier for optical measurements |
| US11921272B2 (en) | 2017-11-14 | 2024-03-05 | S.D. Sight Diagnostics Ltd. | Sample carrier for optical measurements |
| DE102018206406B3 (en) * | 2018-04-25 | 2019-09-12 | Carl Zeiss Meditec Ag | Microscopy system and method for operating a microscopy system |
Family Cites Families (13)
| Publication number | Priority date | Publication date | Assignee | Title |
|---|---|---|---|---|
| US4578167A (en) * | 1982-09-28 | 1986-03-25 | Biofusion, Inc. | Cell fusion |
| US4676640A (en) * | 1984-09-12 | 1987-06-30 | Syntex (U.S.A.) Inc. | Fluctuation analysis for enhanced particle detection |
| DE19508366C2 (en) * | 1995-03-10 | 1998-01-29 | Evotec Biosystems Gmbh | Methods for the direct detection of fewer strands of nucleic acid |
| MY139225A (en) * | 1998-02-26 | 2009-08-28 | Anglo Operations Ltd | Method and apparatus for separating particles |
| DE19903001A1 (en) * | 1999-01-26 | 2000-08-24 | Evotec Biosystems Ag | Method and device for the detection of microscopic objects |
| US6271660B1 (en) * | 1999-06-11 | 2001-08-07 | Mts Sytems Corporation | Permanent multi-pole position magnet |
| US6437551B1 (en) * | 1999-11-02 | 2002-08-20 | The Regents Of The University Of California | Microfabricated AC impedance sensor |
| WO2002017219A1 (en) * | 2000-08-25 | 2002-02-28 | Amnis Corporation | Measuring the velocity of small moving objects such as cells |
| DE10103304A1 (en) * | 2001-01-25 | 2002-08-01 | Gnothis Holding Sa Ecublens | Process for fluorescence spectroscopic, in particular fluorescence correlation spectroscopic examination of a measurement sample and device for carrying it out |
| US20020127144A1 (en) * | 2001-03-08 | 2002-09-12 | Mehta Shailesh P. | Device for analyzing particles and method of use |
| EP1372828A4 (en) * | 2001-03-24 | 2008-10-29 | Aviva Biosciences Corp | Biochips including ion transport detecting structures and methods of use |
| DE10151778A1 (en) * | 2001-10-19 | 2003-05-08 | Philips Corp Intellectual Pty | Method for determining the spatial distribution of magnetic particles |
| CN1774200B (en) * | 2003-04-15 | 2010-07-28 | 皇家飞利浦电子股份有限公司 | Arrangement and method for the spatially resolved determination of state variables in an examination area |
-
2005
- 2005-01-27 EP EP05702809A patent/EP1716444B1/en not_active Not-in-force
- 2005-01-27 WO PCT/IB2005/050354 patent/WO2005076050A1/en not_active Application Discontinuation
- 2005-01-27 AT AT05702809T patent/ATE418084T1/en not_active IP Right Cessation
- 2005-01-27 DE DE602005011763T patent/DE602005011763D1/en active Active
- 2005-01-27 CN CNB2005800043133A patent/CN100526932C/en not_active Expired - Fee Related
- 2005-01-27 JP JP2006551974A patent/JP4804363B2/en not_active Expired - Fee Related
- 2005-01-27 US US10/597,667 patent/US20070161075A1/en not_active Abandoned
Also Published As
| Publication number | Publication date |
|---|---|
| US20070161075A1 (en) | 2007-07-12 |
| CN1918501A (en) | 2007-02-21 |
| WO2005076050A1 (en) | 2005-08-18 |
| CN100526932C (en) | 2009-08-12 |
| DE602005011763D1 (en) | 2009-01-29 |
| JP4804363B2 (en) | 2011-11-02 |
| JP2007522502A (en) | 2007-08-09 |
| EP1716444A1 (en) | 2006-11-02 |
| ATE418084T1 (en) | 2009-01-15 |
Similar Documents
| Publication | Publication Date | Title |
|---|---|---|
| EP1716444B1 (en) | Fluorescence microscope arrangement | |
| van de Linde et al. | Photoswitching microscopy with standard fluorophores | |
| Turkowyd et al. | From single molecules to life: microscopy at the nanoscale | |
| Nienhaus et al. | Where do we stand with super-resolution optical microscopy? | |
| JP2007522502A5 (en) | ||
| Squire et al. | Three dimensional image restoration in fluorescence lifetime imaging microscopy | |
| Padilla-Parra et al. | Quantitative FRET analysis by fast acquisition time domain FLIM at high spatial resolution in living cells | |
| Samanta et al. | Organic fluorescent probes for stochastic optical reconstruction microscopy (STORM): Recent highlights and future possibilities | |
| LiáJo et al. | Fast and background-free three-dimensional (3D) live-cell imaging with lanthanide-doped upconverting nanoparticles | |
| Hendrix et al. | Pulsed interleaved excitation fluctuation imaging | |
| Birk | Super-resolution microscopy: a practical guide | |
| Liu et al. | Single-molecule tracking and its application in biomolecular binding detection | |
| Buranachai et al. | Rapid frequency-domain FLIM spinning disk confocal microscope: lifetime resolution, image improvement and wavelet analysis | |
| Haring et al. | Automated sub-5 nm image registration in integrated correlative fluorescence and electron microscopy using cathodoluminescence pointers | |
| Petriella et al. | Superresolution imaging with switchable fluorophores based on oxazine auxochromes | |
| Szalai et al. | Super-resolution FRET measurements | |
| Kim et al. | Quantifying translational mobility in neurons: comparison between current optical techniques | |
| CN116670492A (en) | Method and microscope for recording trajectories of individual particles in a sample | |
| Ghanam et al. | Single molecule localization microscopy for studying small extracellular vesicles | |
| Owen et al. | Super-resolution imaging by localization microscopy | |
| Padilla-Parra et al. | Time-domain fluorescence lifetime imaging microscopy: a quantitative method to follow transient protein–protein interactions in living cells | |
| Richter et al. | Review of combined isotopic and optical nanoscopy | |
| Testa et al. | Spatial control of pa‐GFP photoactivation in living cells | |
| Botvinick et al. | Laser‐based measurements in cell biology | |
| Yoshida et al. | Super-resolution fluorescence imaging of extracellular environments |
Legal Events
| Date | Code | Title | Description |
|---|---|---|---|
| PUAI | Public reference made under article 153(3) epc to a published international application that has entered the european phase |
Free format text: ORIGINAL CODE: 0009012 |
|
| 17P | Request for examination filed |
Effective date: 20060911 |
|
| AK | Designated contracting states |
Kind code of ref document: A1 Designated state(s): AT BE BG CH CY CZ DE DK EE ES FI FR GB GR HU IE IS IT LI LT LU MC NL PL PT RO SE SI SK TR |
|
| 17Q | First examination report despatched |
Effective date: 20061208 |
|
| DAX | Request for extension of the european patent (deleted) | ||
| DAX | Request for extension of the european patent (deleted) | ||
| RAP1 | Party data changed (applicant data changed or rights of an application transferred) |
Owner name: KONINKLIJKE PHILIPS ELECTRONICS N.V. Owner name: PHILIPS INTELLECTUAL PROPERTY & STANDARDS GMBH |
|
| GRAP | Despatch of communication of intention to grant a patent |
Free format text: ORIGINAL CODE: EPIDOSNIGR1 |
|
| GRAS | Grant fee paid |
Free format text: ORIGINAL CODE: EPIDOSNIGR3 |
|
| GRAA | (expected) grant |
Free format text: ORIGINAL CODE: 0009210 |
|
| AK | Designated contracting states |
Kind code of ref document: B1 Designated state(s): AT BE BG CH CY CZ DE DK EE ES FI FR GB GR HU IE IS IT LI LT LU MC NL PL PT RO SE SI SK TR |
|
| REG | Reference to a national code |
Ref country code: GB Ref legal event code: FG4D |
|
| REG | Reference to a national code |
Ref country code: CH Ref legal event code: EP |
|
| REG | Reference to a national code |
Ref country code: IE Ref legal event code: FG4D |
|
| REF | Corresponds to: |
Ref document number: 602005011763 Country of ref document: DE Date of ref document: 20090129 Kind code of ref document: P |
|
| PG25 | Lapsed in a contracting state [announced via postgrant information from national office to epo] |
Ref country code: LT Free format text: LAPSE BECAUSE OF FAILURE TO SUBMIT A TRANSLATION OF THE DESCRIPTION OR TO PAY THE FEE WITHIN THE PRESCRIBED TIME-LIMIT Effective date: 20081217 |
|
| PG25 | Lapsed in a contracting state [announced via postgrant information from national office to epo] |
Ref country code: NL Free format text: LAPSE BECAUSE OF FAILURE TO SUBMIT A TRANSLATION OF THE DESCRIPTION OR TO PAY THE FEE WITHIN THE PRESCRIBED TIME-LIMIT Effective date: 20081217 Ref country code: PL Free format text: LAPSE BECAUSE OF FAILURE TO SUBMIT A TRANSLATION OF THE DESCRIPTION OR TO PAY THE FEE WITHIN THE PRESCRIBED TIME-LIMIT Effective date: 20081217 Ref country code: SI Free format text: LAPSE BECAUSE OF FAILURE TO SUBMIT A TRANSLATION OF THE DESCRIPTION OR TO PAY THE FEE WITHIN THE PRESCRIBED TIME-LIMIT Effective date: 20081217 Ref country code: FI Free format text: LAPSE BECAUSE OF FAILURE TO SUBMIT A TRANSLATION OF THE DESCRIPTION OR TO PAY THE FEE WITHIN THE PRESCRIBED TIME-LIMIT Effective date: 20081217 |
|
| NLV1 | Nl: lapsed or annulled due to failure to fulfill the requirements of art. 29p and 29m of the patents act | ||
| PG25 | Lapsed in a contracting state [announced via postgrant information from national office to epo] |
Ref country code: BG Free format text: LAPSE BECAUSE OF FAILURE TO SUBMIT A TRANSLATION OF THE DESCRIPTION OR TO PAY THE FEE WITHIN THE PRESCRIBED TIME-LIMIT Effective date: 20090317 Ref country code: RO Free format text: LAPSE BECAUSE OF FAILURE TO SUBMIT A TRANSLATION OF THE DESCRIPTION OR TO PAY THE FEE WITHIN THE PRESCRIBED TIME-LIMIT Effective date: 20081217 Ref country code: ES Free format text: LAPSE BECAUSE OF FAILURE TO SUBMIT A TRANSLATION OF THE DESCRIPTION OR TO PAY THE FEE WITHIN THE PRESCRIBED TIME-LIMIT Effective date: 20090328 Ref country code: EE Free format text: LAPSE BECAUSE OF FAILURE TO SUBMIT A TRANSLATION OF THE DESCRIPTION OR TO PAY THE FEE WITHIN THE PRESCRIBED TIME-LIMIT Effective date: 20081217 Ref country code: BE Free format text: LAPSE BECAUSE OF FAILURE TO SUBMIT A TRANSLATION OF THE DESCRIPTION OR TO PAY THE FEE WITHIN THE PRESCRIBED TIME-LIMIT Effective date: 20081217 |
|
| PG25 | Lapsed in a contracting state [announced via postgrant information from national office to epo] |
Ref country code: SE Free format text: LAPSE BECAUSE OF FAILURE TO SUBMIT A TRANSLATION OF THE DESCRIPTION OR TO PAY THE FEE WITHIN THE PRESCRIBED TIME-LIMIT Effective date: 20090317 Ref country code: IS Free format text: LAPSE BECAUSE OF FAILURE TO SUBMIT A TRANSLATION OF THE DESCRIPTION OR TO PAY THE FEE WITHIN THE PRESCRIBED TIME-LIMIT Effective date: 20090417 Ref country code: PT Free format text: LAPSE BECAUSE OF FAILURE TO SUBMIT A TRANSLATION OF THE DESCRIPTION OR TO PAY THE FEE WITHIN THE PRESCRIBED TIME-LIMIT Effective date: 20090518 Ref country code: CZ Free format text: LAPSE BECAUSE OF FAILURE TO SUBMIT A TRANSLATION OF THE DESCRIPTION OR TO PAY THE FEE WITHIN THE PRESCRIBED TIME-LIMIT Effective date: 20081217 Ref country code: MC Free format text: LAPSE BECAUSE OF NON-PAYMENT OF DUE FEES Effective date: 20090131 Ref country code: AT Free format text: LAPSE BECAUSE OF FAILURE TO SUBMIT A TRANSLATION OF THE DESCRIPTION OR TO PAY THE FEE WITHIN THE PRESCRIBED TIME-LIMIT Effective date: 20081217 |
|
| REG | Reference to a national code |
Ref country code: CH Ref legal event code: PL |
|
| PG25 | Lapsed in a contracting state [announced via postgrant information from national office to epo] |
Ref country code: SK Free format text: LAPSE BECAUSE OF FAILURE TO SUBMIT A TRANSLATION OF THE DESCRIPTION OR TO PAY THE FEE WITHIN THE PRESCRIBED TIME-LIMIT Effective date: 20081217 |
|
| PLBE | No opposition filed within time limit |
Free format text: ORIGINAL CODE: 0009261 |
|
| STAA | Information on the status of an ep patent application or granted ep patent |
Free format text: STATUS: NO OPPOSITION FILED WITHIN TIME LIMIT |
|
| PG25 | Lapsed in a contracting state [announced via postgrant information from national office to epo] |
Ref country code: DK Free format text: LAPSE BECAUSE OF FAILURE TO SUBMIT A TRANSLATION OF THE DESCRIPTION OR TO PAY THE FEE WITHIN THE PRESCRIBED TIME-LIMIT Effective date: 20081217 Ref country code: LI Free format text: LAPSE BECAUSE OF NON-PAYMENT OF DUE FEES Effective date: 20090131 Ref country code: CH Free format text: LAPSE BECAUSE OF NON-PAYMENT OF DUE FEES Effective date: 20090131 |
|
| 26N | No opposition filed |
Effective date: 20090918 |
|
| PG25 | Lapsed in a contracting state [announced via postgrant information from national office to epo] |
Ref country code: IE Free format text: LAPSE BECAUSE OF NON-PAYMENT OF DUE FEES Effective date: 20090127 |
|
| PG25 | Lapsed in a contracting state [announced via postgrant information from national office to epo] |
Ref country code: GR Free format text: LAPSE BECAUSE OF FAILURE TO SUBMIT A TRANSLATION OF THE DESCRIPTION OR TO PAY THE FEE WITHIN THE PRESCRIBED TIME-LIMIT Effective date: 20090318 |
|
| PG25 | Lapsed in a contracting state [announced via postgrant information from national office to epo] |
Ref country code: IT Free format text: LAPSE BECAUSE OF FAILURE TO SUBMIT A TRANSLATION OF THE DESCRIPTION OR TO PAY THE FEE WITHIN THE PRESCRIBED TIME-LIMIT Effective date: 20081217 |
|
| PG25 | Lapsed in a contracting state [announced via postgrant information from national office to epo] |
Ref country code: LU Free format text: LAPSE BECAUSE OF NON-PAYMENT OF DUE FEES Effective date: 20090127 |
|
| PGFP | Annual fee paid to national office [announced via postgrant information from national office to epo] |
Ref country code: FR Payment date: 20110217 Year of fee payment: 7 |
|
| PG25 | Lapsed in a contracting state [announced via postgrant information from national office to epo] |
Ref country code: HU Free format text: LAPSE BECAUSE OF FAILURE TO SUBMIT A TRANSLATION OF THE DESCRIPTION OR TO PAY THE FEE WITHIN THE PRESCRIBED TIME-LIMIT Effective date: 20090618 |
|
| PGFP | Annual fee paid to national office [announced via postgrant information from national office to epo] |
Ref country code: DE Payment date: 20110328 Year of fee payment: 7 Ref country code: GB Payment date: 20110131 Year of fee payment: 7 |
|
| PG25 | Lapsed in a contracting state [announced via postgrant information from national office to epo] |
Ref country code: TR Free format text: LAPSE BECAUSE OF FAILURE TO SUBMIT A TRANSLATION OF THE DESCRIPTION OR TO PAY THE FEE WITHIN THE PRESCRIBED TIME-LIMIT Effective date: 20081217 |
|
| PG25 | Lapsed in a contracting state [announced via postgrant information from national office to epo] |
Ref country code: CY Free format text: LAPSE BECAUSE OF FAILURE TO SUBMIT A TRANSLATION OF THE DESCRIPTION OR TO PAY THE FEE WITHIN THE PRESCRIBED TIME-LIMIT Effective date: 20081217 |
|
| GBPC | Gb: european patent ceased through non-payment of renewal fee |
Effective date: 20120127 |
|
| REG | Reference to a national code |
Ref country code: FR Ref legal event code: ST Effective date: 20120928 |
|
| PG25 | Lapsed in a contracting state [announced via postgrant information from national office to epo] |
Ref country code: DE Free format text: LAPSE BECAUSE OF NON-PAYMENT OF DUE FEES Effective date: 20120801 Ref country code: GB Free format text: LAPSE BECAUSE OF NON-PAYMENT OF DUE FEES Effective date: 20120127 |
|
| REG | Reference to a national code |
Ref country code: DE Ref legal event code: R119 Ref document number: 602005011763 Country of ref document: DE Effective date: 20120801 |
|
| PG25 | Lapsed in a contracting state [announced via postgrant information from national office to epo] |
Ref country code: FR Free format text: LAPSE BECAUSE OF NON-PAYMENT OF DUE FEES Effective date: 20120131 |