EP1682665B1 - Use of fibroblast growth factor fragments - Google Patents
Use of fibroblast growth factor fragments Download PDFInfo
- Publication number
- EP1682665B1 EP1682665B1 EP04797676A EP04797676A EP1682665B1 EP 1682665 B1 EP1682665 B1 EP 1682665B1 EP 04797676 A EP04797676 A EP 04797676A EP 04797676 A EP04797676 A EP 04797676A EP 1682665 B1 EP1682665 B1 EP 1682665B1
- Authority
- EP
- European Patent Office
- Prior art keywords
- protein
- source
- mrna
- homo sapiens
- receptor
- Prior art date
- Legal status (The legal status is an assumption and is not a legal conclusion. Google has not performed a legal analysis and makes no representation as to the accuracy of the status listed.)
- Expired - Lifetime
Links
- 239000012634 fragment Substances 0.000 title claims abstract description 60
- 102000018233 Fibroblast Growth Factor Human genes 0.000 title description 14
- 108050007372 Fibroblast Growth Factor Proteins 0.000 title description 14
- 229940126864 fibroblast growth factor Drugs 0.000 title description 9
- 108090000765 processed proteins & peptides Proteins 0.000 claims abstract description 213
- 102000004196 processed proteins & peptides Human genes 0.000 claims abstract description 184
- 229920001184 polypeptide Polymers 0.000 claims abstract description 158
- 208000037265 diseases, disorders, signs and symptoms Diseases 0.000 claims description 64
- 238000011282 treatment Methods 0.000 claims description 54
- 201000010099 disease Diseases 0.000 claims description 37
- 230000033115 angiogenesis Effects 0.000 claims description 31
- 239000003814 drug Substances 0.000 claims description 30
- 206010028980 Neoplasm Diseases 0.000 claims description 22
- 125000003275 alpha amino acid group Chemical group 0.000 claims description 19
- 239000008194 pharmaceutical composition Substances 0.000 claims description 13
- 238000004519 manufacturing process Methods 0.000 claims description 12
- 201000011510 cancer Diseases 0.000 claims description 11
- 206010038923 Retinopathy Diseases 0.000 claims description 8
- 230000001965 increasing effect Effects 0.000 claims description 7
- 208000017442 Retinal disease Diseases 0.000 claims description 4
- 206010064930 age-related macular degeneration Diseases 0.000 claims description 4
- 239000003937 drug carrier Substances 0.000 claims description 4
- 201000002222 hemangioblastoma Diseases 0.000 claims description 4
- 201000011066 hemangioma Diseases 0.000 claims description 4
- 208000002780 macular degeneration Diseases 0.000 claims description 4
- 238000006467 substitution reaction Methods 0.000 claims description 4
- 101001051973 Homo sapiens Fibroblast growth factor 23 Proteins 0.000 claims description 3
- 102100024802 Fibroblast growth factor 23 Human genes 0.000 claims 1
- 108090000623 proteins and genes Proteins 0.000 abstract description 301
- 102000004169 proteins and genes Human genes 0.000 abstract description 162
- 239000002299 complementary DNA Substances 0.000 abstract description 137
- 230000014509 gene expression Effects 0.000 abstract description 115
- 108090000569 Fibroblast Growth Factor-23 Proteins 0.000 abstract description 108
- 102000004042 Fibroblast Growth Factor-23 Human genes 0.000 abstract description 108
- 238000000034 method Methods 0.000 abstract description 80
- 150000001875 compounds Chemical class 0.000 abstract description 63
- 241001465754 Metazoa Species 0.000 abstract description 42
- 230000000694 effects Effects 0.000 abstract description 36
- 238000004458 analytical method Methods 0.000 abstract description 32
- 230000008569 process Effects 0.000 abstract description 28
- 239000000126 substance Substances 0.000 abstract description 19
- 238000012360 testing method Methods 0.000 abstract description 14
- 238000001727 in vivo Methods 0.000 abstract description 13
- 210000004899 c-terminal region Anatomy 0.000 abstract description 12
- 239000013612 plasmid Substances 0.000 abstract description 7
- 229930014626 natural product Natural products 0.000 abstract description 4
- 238000012750 in vivo screening Methods 0.000 abstract description 2
- 241000282414 Homo sapiens Species 0.000 description 396
- 108020004999 messenger RNA Proteins 0.000 description 383
- 235000018102 proteins Nutrition 0.000 description 158
- 210000004027 cell Anatomy 0.000 description 65
- 102000005962 receptors Human genes 0.000 description 58
- 108020003175 receptors Proteins 0.000 description 58
- 210000000056 organ Anatomy 0.000 description 52
- 108700017947 pasireotide Proteins 0.000 description 46
- 229960005415 pasireotide Drugs 0.000 description 46
- NEEFMPSSNFRRNC-HQUONIRXSA-N pasireotide aspartate Chemical compound OC(=O)[C@@H](N)CC(O)=O.OC(=O)[C@@H](N)CC(O)=O.C([C@H]1C(=O)N2C[C@@H](C[C@H]2C(=O)N[C@H](C(=O)N[C@H](CC=2C3=CC=CC=C3NC=2)C(=O)N[C@H](C(N[C@@H](CC=2C=CC(OCC=3C=CC=CC=3)=CC=2)C(=O)N1)=O)CCCCN)C=1C=CC=CC=1)OC(=O)NCCN)C1=CC=CC=C1 NEEFMPSSNFRRNC-HQUONIRXSA-N 0.000 description 45
- 230000036961 partial effect Effects 0.000 description 44
- 210000001519 tissue Anatomy 0.000 description 43
- 239000000523 sample Substances 0.000 description 41
- 229920002477 rna polymer Polymers 0.000 description 36
- 235000001014 amino acid Nutrition 0.000 description 33
- 230000037361 pathway Effects 0.000 description 33
- 229940024606 amino acid Drugs 0.000 description 32
- 150000001413 amino acids Chemical class 0.000 description 32
- 210000003734 kidney Anatomy 0.000 description 29
- 108091000080 Phosphotransferase Proteins 0.000 description 27
- 208000035475 disorder Diseases 0.000 description 27
- 210000004185 liver Anatomy 0.000 description 27
- 102000020233 phosphotransferase Human genes 0.000 description 27
- 108010029485 Protein Isoforms Proteins 0.000 description 24
- 230000001105 regulatory effect Effects 0.000 description 24
- 108020004414 DNA Proteins 0.000 description 23
- 102000001708 Protein Isoforms Human genes 0.000 description 23
- 102000001253 Protein Kinase Human genes 0.000 description 23
- 230000006870 function Effects 0.000 description 23
- 102000053602 DNA Human genes 0.000 description 22
- 230000001419 dependent effect Effects 0.000 description 22
- 102000039446 nucleic acids Human genes 0.000 description 22
- 108020004707 nucleic acids Proteins 0.000 description 22
- 150000007523 nucleic acids Chemical class 0.000 description 22
- 108060006633 protein kinase Proteins 0.000 description 22
- 239000002243 precursor Substances 0.000 description 21
- 102000016914 ras Proteins Human genes 0.000 description 21
- 102000014914 Carrier Proteins Human genes 0.000 description 20
- 241000699670 Mus sp. Species 0.000 description 20
- 230000003197 catalytic effect Effects 0.000 description 20
- 102000030782 GTP binding Human genes 0.000 description 19
- 108091000058 GTP-Binding Proteins 0.000 description 19
- 108091008324 binding proteins Proteins 0.000 description 19
- 229940079593 drug Drugs 0.000 description 19
- 125000003729 nucleotide group Chemical group 0.000 description 18
- 238000003556 assay Methods 0.000 description 17
- 210000001525 retina Anatomy 0.000 description 17
- 210000001685 thyroid gland Anatomy 0.000 description 17
- 108091006027 G proteins Proteins 0.000 description 16
- 108090000723 Insulin-Like Growth Factor I Proteins 0.000 description 16
- 240000004808 Saccharomyces cerevisiae Species 0.000 description 16
- 235000014680 Saccharomyces cerevisiae Nutrition 0.000 description 16
- 239000002773 nucleotide Substances 0.000 description 16
- 230000027455 binding Effects 0.000 description 15
- 210000004556 brain Anatomy 0.000 description 15
- 238000011223 gene expression profiling Methods 0.000 description 15
- UYTPUPDQBNUYGX-UHFFFAOYSA-N guanine Chemical compound O=C1NC(N)=NC2=C1N=CN2 UYTPUPDQBNUYGX-UHFFFAOYSA-N 0.000 description 15
- 239000003112 inhibitor Substances 0.000 description 15
- NHXLMOGPVYXJNR-ATOGVRKGSA-N somatostatin Chemical class C([C@H]1C(=O)N[C@H](C(N[C@@H](CO)C(=O)N[C@@H](CSSC[C@@H](C(=O)N[C@@H](CCCCN)C(=O)N[C@@H](CC(N)=O)C(=O)N[C@@H](CC=2C=CC=CC=2)C(=O)N[C@@H](CC=2C=CC=CC=2)C(=O)N[C@@H](CC=2C3=CC=CC=C3NC=2)C(=O)N[C@@H](CCCCN)C(=O)N[C@H](C(=O)N1)[C@@H](C)O)NC(=O)CNC(=O)[C@H](C)N)C(O)=O)=O)[C@H](O)C)C1=CC=CC=C1 NHXLMOGPVYXJNR-ATOGVRKGSA-N 0.000 description 15
- 210000000952 spleen Anatomy 0.000 description 15
- MTCFGRXMJLQNBG-UHFFFAOYSA-N Serine Natural products OCC(N)C(O)=O MTCFGRXMJLQNBG-UHFFFAOYSA-N 0.000 description 14
- 238000013459 approach Methods 0.000 description 14
- 230000001413 cellular effect Effects 0.000 description 14
- 230000002074 deregulated effect Effects 0.000 description 14
- 238000002493 microarray Methods 0.000 description 14
- 108010014186 ras Proteins Proteins 0.000 description 14
- 108091034117 Oligonucleotide Proteins 0.000 description 13
- 210000003486 adipose tissue brown Anatomy 0.000 description 13
- -1 for example Chemical class 0.000 description 13
- 210000003016 hypothalamus Anatomy 0.000 description 13
- 239000000203 mixture Substances 0.000 description 13
- 230000002062 proliferating effect Effects 0.000 description 13
- 241000282693 Cercopithecidae Species 0.000 description 12
- 101000617830 Homo sapiens Sterol O-acyltransferase 1 Proteins 0.000 description 12
- 102000004160 Phosphoric Monoester Hydrolases Human genes 0.000 description 12
- 108090000608 Phosphoric Monoester Hydrolases Proteins 0.000 description 12
- 102100021993 Sterol O-acyltransferase 1 Human genes 0.000 description 12
- 101000697584 Streptomyces lavendulae Streptothricin acetyltransferase Proteins 0.000 description 12
- 239000003102 growth factor Substances 0.000 description 12
- 238000009396 hybridization Methods 0.000 description 12
- 210000003205 muscle Anatomy 0.000 description 12
- 230000011664 signaling Effects 0.000 description 12
- QTBSBXVTEAMEQO-UHFFFAOYSA-N Acetic acid Chemical compound CC(O)=O QTBSBXVTEAMEQO-UHFFFAOYSA-N 0.000 description 11
- 102000004218 Insulin-Like Growth Factor I Human genes 0.000 description 11
- 108700020796 Oncogene Proteins 0.000 description 11
- 229910019142 PO4 Inorganic materials 0.000 description 11
- 239000000090 biomarker Substances 0.000 description 11
- 210000000496 pancreas Anatomy 0.000 description 11
- 239000010452 phosphate Substances 0.000 description 11
- 238000000746 purification Methods 0.000 description 11
- 230000001225 therapeutic effect Effects 0.000 description 11
- 102000003993 Phosphatidylinositol 3-kinases Human genes 0.000 description 10
- 108090000430 Phosphatidylinositol 3-kinases Proteins 0.000 description 10
- AYFVYJQAPQTCCC-UHFFFAOYSA-N Threonine Natural products CC(O)C(N)C(O)=O AYFVYJQAPQTCCC-UHFFFAOYSA-N 0.000 description 10
- 239000004473 Threonine Substances 0.000 description 10
- 239000002253 acid Substances 0.000 description 10
- 230000004048 modification Effects 0.000 description 10
- 238000012986 modification Methods 0.000 description 10
- NBIIXXVUZAFLBC-UHFFFAOYSA-K phosphate Chemical compound [O-]P([O-])([O-])=O NBIIXXVUZAFLBC-UHFFFAOYSA-K 0.000 description 10
- 150000003839 salts Chemical class 0.000 description 10
- OYPRJOBELJOOCE-UHFFFAOYSA-N Calcium Chemical compound [Ca] OYPRJOBELJOOCE-UHFFFAOYSA-N 0.000 description 9
- 108700012941 GNRH1 Proteins 0.000 description 9
- 101001076292 Homo sapiens Insulin-like growth factor II Proteins 0.000 description 9
- 102100025947 Insulin-like growth factor II Human genes 0.000 description 9
- 241000124008 Mammalia Species 0.000 description 9
- FAPWRFPIFSIZLT-UHFFFAOYSA-M Sodium chloride Chemical compound [Na+].[Cl-] FAPWRFPIFSIZLT-UHFFFAOYSA-M 0.000 description 9
- 102000005157 Somatostatin Human genes 0.000 description 9
- 108010056088 Somatostatin Proteins 0.000 description 9
- 102000004887 Transforming Growth Factor beta Human genes 0.000 description 9
- 108090001012 Transforming Growth Factor beta Proteins 0.000 description 9
- 230000000975 bioactive effect Effects 0.000 description 9
- 210000001185 bone marrow Anatomy 0.000 description 9
- 239000011575 calcium Substances 0.000 description 9
- 230000008859 change Effects 0.000 description 9
- 238000007418 data mining Methods 0.000 description 9
- 238000005516 engineering process Methods 0.000 description 9
- 239000013604 expression vector Substances 0.000 description 9
- 230000026731 phosphorylation Effects 0.000 description 9
- 238000006366 phosphorylation reaction Methods 0.000 description 9
- 108700042226 ras Genes Proteins 0.000 description 9
- 210000002966 serum Anatomy 0.000 description 9
- 239000013598 vector Substances 0.000 description 9
- ZHNUHDYFZUAESO-UHFFFAOYSA-N Formamide Chemical compound NC=O ZHNUHDYFZUAESO-UHFFFAOYSA-N 0.000 description 8
- 206010062767 Hypophysitis Diseases 0.000 description 8
- OUYCCCASQSFEME-QMMMGPOBSA-N L-tyrosine Chemical compound OC(=O)[C@@H](N)CC1=CC=C(O)C=C1 OUYCCCASQSFEME-QMMMGPOBSA-N 0.000 description 8
- 230000009471 action Effects 0.000 description 8
- 230000001919 adrenal effect Effects 0.000 description 8
- 210000001992 atrioventricular node Anatomy 0.000 description 8
- 229910052791 calcium Inorganic materials 0.000 description 8
- 230000003247 decreasing effect Effects 0.000 description 8
- 238000001514 detection method Methods 0.000 description 8
- 238000010195 expression analysis Methods 0.000 description 8
- 238000011835 investigation Methods 0.000 description 8
- 210000003635 pituitary gland Anatomy 0.000 description 8
- 230000002792 vascular Effects 0.000 description 8
- 108091006146 Channels Proteins 0.000 description 7
- 108050006400 Cyclin Proteins 0.000 description 7
- 102000012673 Follicle Stimulating Hormone Human genes 0.000 description 7
- 108010079345 Follicle Stimulating Hormone Proteins 0.000 description 7
- 102000009465 Growth Factor Receptors Human genes 0.000 description 7
- 108010009202 Growth Factor Receptors Proteins 0.000 description 7
- 101150026829 JUNB gene Proteins 0.000 description 7
- 102000004058 Leukemia inhibitory factor Human genes 0.000 description 7
- 108090000581 Leukemia inhibitory factor Proteins 0.000 description 7
- 241000282567 Macaca fascicularis Species 0.000 description 7
- 102000004022 Protein-Tyrosine Kinases Human genes 0.000 description 7
- 108090000412 Protein-Tyrosine Kinases Proteins 0.000 description 7
- 210000000988 bone and bone Anatomy 0.000 description 7
- 230000024245 cell differentiation Effects 0.000 description 7
- 230000001351 cycling effect Effects 0.000 description 7
- 229940028334 follicle stimulating hormone Drugs 0.000 description 7
- 229940068935 insulin-like growth factor 2 Drugs 0.000 description 7
- 238000002372 labelling Methods 0.000 description 7
- 238000012545 processing Methods 0.000 description 7
- 239000011347 resin Substances 0.000 description 7
- 229920005989 resin Polymers 0.000 description 7
- 229960000553 somatostatin Drugs 0.000 description 7
- OUYCCCASQSFEME-UHFFFAOYSA-N tyrosine Natural products OC(=O)C(N)CC1=CC=C(O)C=C1 OUYCCCASQSFEME-UHFFFAOYSA-N 0.000 description 7
- YBJHBAHKTGYVGT-ZKWXMUAHSA-N (+)-Biotin Chemical compound N1C(=O)N[C@@H]2[C@H](CCCCC(=O)O)SC[C@@H]21 YBJHBAHKTGYVGT-ZKWXMUAHSA-N 0.000 description 6
- 102000018898 GTPase-Activating Proteins Human genes 0.000 description 6
- 241000238631 Hexapoda Species 0.000 description 6
- 102000003839 Human Proteins Human genes 0.000 description 6
- 108090000144 Human Proteins Proteins 0.000 description 6
- 102100039364 Metalloproteinase inhibitor 1 Human genes 0.000 description 6
- 108091028043 Nucleic acid sequence Proteins 0.000 description 6
- 102100036691 Proliferating cell nuclear antigen Human genes 0.000 description 6
- 108090000315 Protein Kinase C Proteins 0.000 description 6
- 102000003923 Protein Kinase C Human genes 0.000 description 6
- XUIMIQQOPSSXEZ-UHFFFAOYSA-N Silicon Chemical compound [Si] XUIMIQQOPSSXEZ-UHFFFAOYSA-N 0.000 description 6
- 108010031374 Tissue Inhibitor of Metalloproteinase-1 Proteins 0.000 description 6
- 241000700605 Viruses Species 0.000 description 6
- 230000003213 activating effect Effects 0.000 description 6
- 239000000427 antigen Substances 0.000 description 6
- 102000036639 antigens Human genes 0.000 description 6
- 108091007433 antigens Proteins 0.000 description 6
- 230000006907 apoptotic process Effects 0.000 description 6
- 201000003674 autosomal dominant hypophosphatemic rickets Diseases 0.000 description 6
- 230000015572 biosynthetic process Effects 0.000 description 6
- 210000001124 body fluid Anatomy 0.000 description 6
- 239000010839 body fluid Substances 0.000 description 6
- 230000004663 cell proliferation Effects 0.000 description 6
- 239000003795 chemical substances by application Substances 0.000 description 6
- 210000001198 duodenum Anatomy 0.000 description 6
- 238000000338 in vitro Methods 0.000 description 6
- 238000003780 insertion Methods 0.000 description 6
- 230000037431 insertion Effects 0.000 description 6
- 239000007788 liquid Substances 0.000 description 6
- 230000002018 overexpression Effects 0.000 description 6
- 230000000144 pharmacologic effect Effects 0.000 description 6
- 238000002360 preparation method Methods 0.000 description 6
- 230000004044 response Effects 0.000 description 6
- 229910052710 silicon Inorganic materials 0.000 description 6
- 239000010703 silicon Substances 0.000 description 6
- 229940075620 somatostatin analogue Drugs 0.000 description 6
- 239000000758 substrate Substances 0.000 description 6
- OBMZMSLWNNWEJA-XNCRXQDQSA-N C1=CC=2C(C[C@@H]3NC(=O)[C@@H](NC(=O)[C@H](NC(=O)N(CC#CCN(CCCC[C@H](NC(=O)[C@@H](CC4=CC=CC=C4)NC3=O)C(=O)N)CC=C)NC(=O)[C@@H](N)C)CC3=CNC4=C3C=CC=C4)C)=CNC=2C=C1 Chemical compound C1=CC=2C(C[C@@H]3NC(=O)[C@@H](NC(=O)[C@H](NC(=O)N(CC#CCN(CCCC[C@H](NC(=O)[C@@H](CC4=CC=CC=C4)NC3=O)C(=O)N)CC=C)NC(=O)[C@@H](N)C)CC3=CNC4=C3C=CC=C4)C)=CNC=2C=C1 OBMZMSLWNNWEJA-XNCRXQDQSA-N 0.000 description 5
- 102100034799 CCAAT/enhancer-binding protein delta Human genes 0.000 description 5
- 101710130043 CCAAT/enhancer-binding protein delta Proteins 0.000 description 5
- 108010056281 Cyclic AMP Response Element Modulator Proteins 0.000 description 5
- 108010025464 Cyclin-Dependent Kinase 4 Proteins 0.000 description 5
- 102100036252 Cyclin-dependent kinase 4 Human genes 0.000 description 5
- 102000004190 Enzymes Human genes 0.000 description 5
- 108090000790 Enzymes Proteins 0.000 description 5
- 108091006094 GTPase-accelerating proteins Proteins 0.000 description 5
- 101000973177 Homo sapiens Nuclear factor interleukin-3-regulated protein Proteins 0.000 description 5
- 102000042838 JAK family Human genes 0.000 description 5
- 108091082332 JAK family Proteins 0.000 description 5
- 102000004232 Mitogen-Activated Protein Kinase Kinases Human genes 0.000 description 5
- 108090000744 Mitogen-Activated Protein Kinase Kinases Proteins 0.000 description 5
- 241000699666 Mus <mouse, genus> Species 0.000 description 5
- 102100022163 Nuclear factor interleukin-3-regulated protein Human genes 0.000 description 5
- 101710176384 Peptide 1 Proteins 0.000 description 5
- 102100025487 S-phase kinase-associated protein 1 Human genes 0.000 description 5
- 102000000395 SH3 domains Human genes 0.000 description 5
- 108050008861 SH3 domains Proteins 0.000 description 5
- 102000013275 Somatomedins Human genes 0.000 description 5
- 102100033456 TGF-beta receptor type-1 Human genes 0.000 description 5
- 102100039037 Vascular endothelial growth factor A Human genes 0.000 description 5
- 101710185494 Zinc finger protein Proteins 0.000 description 5
- 102100023597 Zinc finger protein 816 Human genes 0.000 description 5
- UDMBCSSLTHHNCD-KQYNXXCUSA-N adenosine 5'-monophosphate Chemical compound C1=NC=2C(N)=NC=NC=2N1[C@@H]1O[C@H](COP(O)(O)=O)[C@@H](O)[C@H]1O UDMBCSSLTHHNCD-KQYNXXCUSA-N 0.000 description 5
- 125000000539 amino acid group Chemical group 0.000 description 5
- 108700000707 bcl-2-Associated X Proteins 0.000 description 5
- 102000055102 bcl-2-Associated X Human genes 0.000 description 5
- 230000004071 biological effect Effects 0.000 description 5
- 210000004369 blood Anatomy 0.000 description 5
- 239000008280 blood Substances 0.000 description 5
- 102100029387 cAMP-responsive element modulator Human genes 0.000 description 5
- 230000000875 corresponding effect Effects 0.000 description 5
- 230000007423 decrease Effects 0.000 description 5
- 229940088598 enzyme Drugs 0.000 description 5
- 238000007901 in situ hybridization Methods 0.000 description 5
- 238000002347 injection Methods 0.000 description 5
- 239000007924 injection Substances 0.000 description 5
- 239000003550 marker Substances 0.000 description 5
- 230000035755 proliferation Effects 0.000 description 5
- 238000003753 real-time PCR Methods 0.000 description 5
- 238000012216 screening Methods 0.000 description 5
- 230000028327 secretion Effects 0.000 description 5
- 239000000243 solution Substances 0.000 description 5
- 238000007920 subcutaneous administration Methods 0.000 description 5
- 238000003786 synthesis reaction Methods 0.000 description 5
- 210000001541 thymus gland Anatomy 0.000 description 5
- 238000013518 transcription Methods 0.000 description 5
- 230000035897 transcription Effects 0.000 description 5
- 230000014616 translation Effects 0.000 description 5
- 239000003981 vehicle Substances 0.000 description 5
- 238000005406 washing Methods 0.000 description 5
- 206010003210 Arteriosclerosis Diseases 0.000 description 4
- 102000055006 Calcitonin Human genes 0.000 description 4
- 108060001064 Calcitonin Proteins 0.000 description 4
- 102100028559 Death domain-associated protein 6 Human genes 0.000 description 4
- 102100031480 Dual specificity mitogen-activated protein kinase kinase 1 Human genes 0.000 description 4
- 102000020086 Ephrin-A1 Human genes 0.000 description 4
- 108010043945 Ephrin-A1 Proteins 0.000 description 4
- WSFSSNUMVMOOMR-UHFFFAOYSA-N Formaldehyde Chemical compound O=C WSFSSNUMVMOOMR-UHFFFAOYSA-N 0.000 description 4
- 102000014702 Haptoglobin Human genes 0.000 description 4
- 108050005077 Haptoglobin Proteins 0.000 description 4
- 101000878540 Homo sapiens Protein-tyrosine kinase 2-beta Proteins 0.000 description 4
- 101000945093 Homo sapiens Ribosomal protein S6 kinase alpha-4 Proteins 0.000 description 4
- 108010001831 LDL receptors Proteins 0.000 description 4
- 102100024640 Low-density lipoprotein receptor Human genes 0.000 description 4
- 241000699660 Mus musculus Species 0.000 description 4
- 206010029260 Neuroblastoma Diseases 0.000 description 4
- 102100026379 Neurofibromin Human genes 0.000 description 4
- 108010085793 Neurofibromin 1 Proteins 0.000 description 4
- 238000000636 Northern blotting Methods 0.000 description 4
- 108091007960 PI3Ks Proteins 0.000 description 4
- 102100026918 Phospholipase A2 Human genes 0.000 description 4
- 102000015439 Phospholipases Human genes 0.000 description 4
- 108010064785 Phospholipases Proteins 0.000 description 4
- 108010073135 Phosphorylases Proteins 0.000 description 4
- 102000009097 Phosphorylases Human genes 0.000 description 4
- 108010076504 Protein Sorting Signals Proteins 0.000 description 4
- 102100037787 Protein-tyrosine kinase 2-beta Human genes 0.000 description 4
- 201000004681 Psoriasis Diseases 0.000 description 4
- 102000015097 RNA Splicing Factors Human genes 0.000 description 4
- 108010039259 RNA Splicing Factors Proteins 0.000 description 4
- 238000002123 RNA extraction Methods 0.000 description 4
- 108010034782 Ribosomal Protein S6 Kinases Proteins 0.000 description 4
- 102000009738 Ribosomal Protein S6 Kinases Human genes 0.000 description 4
- 102100033644 Ribosomal protein S6 kinase alpha-4 Human genes 0.000 description 4
- 230000018199 S phase Effects 0.000 description 4
- 108050007572 S-phase kinase-associated protein 1 Proteins 0.000 description 4
- 108050001286 Somatostatin Receptor Proteins 0.000 description 4
- 102000011096 Somatostatin receptor Human genes 0.000 description 4
- 108010009583 Transforming Growth Factors Proteins 0.000 description 4
- 102000009618 Transforming Growth Factors Human genes 0.000 description 4
- 108060008683 Tumor Necrosis Factor Receptor Proteins 0.000 description 4
- 102000018594 Tumour necrosis factor Human genes 0.000 description 4
- 108050007852 Tumour necrosis factor Proteins 0.000 description 4
- 108010073929 Vascular Endothelial Growth Factor A Proteins 0.000 description 4
- 108010019530 Vascular Endothelial Growth Factors Proteins 0.000 description 4
- 230000033228 biological regulation Effects 0.000 description 4
- 239000012472 biological sample Substances 0.000 description 4
- 210000001772 blood platelet Anatomy 0.000 description 4
- 108010018828 cadherin 5 Proteins 0.000 description 4
- BBBFJLBPOGFECG-VJVYQDLKSA-N calcitonin Chemical compound N([C@H](C(=O)N[C@@H](CC(C)C)C(=O)NCC(=O)N[C@@H](CCCCN)C(=O)N[C@@H](CC(C)C)C(=O)N[C@@H](CO)C(=O)N[C@@H](CCC(N)=O)C(=O)N[C@@H](CCC(O)=O)C(=O)N[C@@H](CC(C)C)C(=O)N[C@@H](CC=1NC=NC=1)C(=O)N[C@@H](CCCCN)C(=O)N[C@@H](CC(C)C)C(=O)N[C@@H](CCC(N)=O)C(=O)N[C@@H]([C@@H](C)O)C(=O)N[C@@H](CC=1C=CC(O)=CC=1)C(=O)N1[C@@H](CCC1)C(=O)N[C@@H](CCCNC(N)=N)C(=O)N[C@@H]([C@@H](C)O)C(=O)N[C@@H](CC(N)=O)C(=O)N[C@@H]([C@@H](C)O)C(=O)NCC(=O)N[C@@H](CO)C(=O)NCC(=O)N[C@@H]([C@@H](C)O)C(=O)N1[C@@H](CCC1)C(N)=O)C(C)C)C(=O)[C@@H]1CSSC[C@H](N)C(=O)N[C@@H](CO)C(=O)N[C@@H](CC(N)=O)C(=O)N[C@@H](CC(C)C)C(=O)N[C@@H](CO)C(=O)N[C@@H]([C@@H](C)O)C(=O)N1 BBBFJLBPOGFECG-VJVYQDLKSA-N 0.000 description 4
- 229960004015 calcitonin Drugs 0.000 description 4
- 238000006243 chemical reaction Methods 0.000 description 4
- 230000001684 chronic effect Effects 0.000 description 4
- 230000000295 complement effect Effects 0.000 description 4
- 230000001086 cytosolic effect Effects 0.000 description 4
- 238000011161 development Methods 0.000 description 4
- 230000018109 developmental process Effects 0.000 description 4
- 206010012601 diabetes mellitus Diseases 0.000 description 4
- 230000009977 dual effect Effects 0.000 description 4
- 238000001914 filtration Methods 0.000 description 4
- 230000008014 freezing Effects 0.000 description 4
- 238000007710 freezing Methods 0.000 description 4
- 230000013595 glycosylation Effects 0.000 description 4
- 238000006206 glycosylation reaction Methods 0.000 description 4
- 230000012010 growth Effects 0.000 description 4
- 210000002216 heart Anatomy 0.000 description 4
- 229940088597 hormone Drugs 0.000 description 4
- 239000005556 hormone Substances 0.000 description 4
- 239000000893 inhibin Substances 0.000 description 4
- 230000002401 inhibitory effect Effects 0.000 description 4
- ZPNFWUPYTFPOJU-LPYSRVMUSA-N iniprol Chemical compound C([C@H]1C(=O)NCC(=O)NCC(=O)N[C@H]2CSSC[C@H]3C(=O)N[C@@H](CCCCN)C(=O)N[C@@H](C)C(=O)N[C@@H](CCCNC(N)=N)C(=O)N[C@H](C(N[C@H](C(=O)N[C@@H](CCCNC(N)=N)C(=O)N[C@@H](CC=4C=CC(O)=CC=4)C(=O)N[C@@H](CC=4C=CC=CC=4)C(=O)N[C@@H](CC=4C=CC(O)=CC=4)C(=O)N[C@@H](CC(N)=O)C(=O)N[C@@H](C)C(=O)N[C@@H](CCCCN)C(=O)N[C@@H](C)C(=O)NCC(=O)N[C@@H](CC(C)C)C(=O)N[C@@H](CSSC[C@H](NC(=O)[C@H](CC(O)=O)NC(=O)[C@H](CCC(O)=O)NC(=O)[C@H](C)NC(=O)[C@H](CO)NC(=O)[C@H](CCCCN)NC(=O)[C@H](CC=4C=CC=CC=4)NC(=O)[C@H](CC(N)=O)NC(=O)[C@H](CC(N)=O)NC(=O)[C@H](CCCNC(N)=N)NC(=O)[C@H](CCCCN)NC(=O)[C@H](C)NC(=O)[C@H](CCCNC(N)=N)NC2=O)C(=O)N[C@@H](CCSC)C(=O)N[C@@H](CCCNC(N)=N)C(=O)N[C@@H]([C@@H](C)O)C(=O)N[C@@H](CSSC[C@H](NC(=O)[C@H](CC=2C=CC=CC=2)NC(=O)[C@H](CC(O)=O)NC(=O)[C@H]2N(CCC2)C(=O)[C@@H](N)CCCNC(N)=N)C(=O)N[C@@H](CC(C)C)C(=O)N[C@@H](CCC(O)=O)C(=O)N2[C@@H](CCC2)C(=O)N2[C@@H](CCC2)C(=O)N[C@@H](CC=2C=CC(O)=CC=2)C(=O)N[C@@H]([C@@H](C)O)C(=O)NCC(=O)N2[C@@H](CCC2)C(=O)N3)C(=O)NCC(=O)NCC(=O)N[C@@H](C)C(O)=O)C(=O)N[C@@H](CCC(N)=O)C(=O)N[C@H](C(=O)N[C@@H](CC=2C=CC=CC=2)C(=O)N[C@H](C(=O)N1)C(C)C)[C@@H](C)O)[C@@H](C)CC)=O)[C@@H](C)CC)C1=CC=C(O)C=C1 ZPNFWUPYTFPOJU-LPYSRVMUSA-N 0.000 description 4
- 108010021518 integrin beta5 Proteins 0.000 description 4
- 125000005647 linker group Chemical group 0.000 description 4
- 239000012528 membrane Substances 0.000 description 4
- 230000035772 mutation Effects 0.000 description 4
- 210000004498 neuroglial cell Anatomy 0.000 description 4
- 208000005368 osteomalacia Diseases 0.000 description 4
- 210000001672 ovary Anatomy 0.000 description 4
- 230000001817 pituitary effect Effects 0.000 description 4
- 102000040430 polynucleotide Human genes 0.000 description 4
- 108091033319 polynucleotide Proteins 0.000 description 4
- 239000002157 polynucleotide Substances 0.000 description 4
- 125000002924 primary amino group Chemical group [H]N([H])* 0.000 description 4
- 238000005070 sampling Methods 0.000 description 4
- 239000011780 sodium chloride Substances 0.000 description 4
- 239000001509 sodium citrate Substances 0.000 description 4
- NLJMYIDDQXHKNR-UHFFFAOYSA-K sodium citrate Chemical compound O.O.[Na+].[Na+].[Na+].[O-]C(=O)CC(O)(CC([O-])=O)C([O-])=O NLJMYIDDQXHKNR-UHFFFAOYSA-K 0.000 description 4
- 208000011580 syndromic disease Diseases 0.000 description 4
- 238000012546 transfer Methods 0.000 description 4
- 102000003298 tumor necrosis factor receptor Human genes 0.000 description 4
- 238000012795 verification Methods 0.000 description 4
- 108091006112 ATPases Proteins 0.000 description 3
- 108010085238 Actins Proteins 0.000 description 3
- 102000007469 Actins Human genes 0.000 description 3
- 108010059616 Activins Proteins 0.000 description 3
- 102000057290 Adenosine Triphosphatases Human genes 0.000 description 3
- 102100021569 Apoptosis regulator Bcl-2 Human genes 0.000 description 3
- 239000004475 Arginine Substances 0.000 description 3
- 201000001320 Atherosclerosis Diseases 0.000 description 3
- 238000012935 Averaging Methods 0.000 description 3
- 108091012583 BCL2 Proteins 0.000 description 3
- 241000894006 Bacteria Species 0.000 description 3
- 102100036597 Basement membrane-specific heparan sulfate proteoglycan core protein Human genes 0.000 description 3
- 102000004954 Biglycan Human genes 0.000 description 3
- 108090001138 Biglycan Proteins 0.000 description 3
- 102000007350 Bone Morphogenetic Proteins Human genes 0.000 description 3
- 108010007726 Bone Morphogenetic Proteins Proteins 0.000 description 3
- 102100026008 Breakpoint cluster region protein Human genes 0.000 description 3
- 102000000584 Calmodulin Human genes 0.000 description 3
- 108010041952 Calmodulin Proteins 0.000 description 3
- CURLTUGMZLYLDI-UHFFFAOYSA-N Carbon dioxide Chemical compound O=C=O CURLTUGMZLYLDI-UHFFFAOYSA-N 0.000 description 3
- 102000016362 Catenins Human genes 0.000 description 3
- 108010067316 Catenins Proteins 0.000 description 3
- 102100025051 Cell division control protein 42 homolog Human genes 0.000 description 3
- 108010042086 Collagen Type IV Proteins 0.000 description 3
- 102000004266 Collagen Type IV Human genes 0.000 description 3
- 102000001045 Connexin 43 Human genes 0.000 description 3
- 108010069241 Connexin 43 Proteins 0.000 description 3
- 108010049894 Cyclic AMP-Dependent Protein Kinases Proteins 0.000 description 3
- 102000008130 Cyclic AMP-Dependent Protein Kinases Human genes 0.000 description 3
- YMWUJEATGCHHMB-UHFFFAOYSA-N Dichloromethane Chemical compound ClCCl YMWUJEATGCHHMB-UHFFFAOYSA-N 0.000 description 3
- 101710146526 Dual specificity mitogen-activated protein kinase kinase 1 Proteins 0.000 description 3
- 102000001301 EGF receptor Human genes 0.000 description 3
- 108060006698 EGF receptor Proteins 0.000 description 3
- 201000009273 Endometriosis Diseases 0.000 description 3
- 108700024394 Exon Proteins 0.000 description 3
- 240000008168 Ficus benjamina Species 0.000 description 3
- 108090000852 Forkhead Transcription Factors Proteins 0.000 description 3
- 102000004315 Forkhead Transcription Factors Human genes 0.000 description 3
- 102000013446 GTP Phosphohydrolases Human genes 0.000 description 3
- 108091006109 GTPases Proteins 0.000 description 3
- 108010017544 Glucosylceramidase Proteins 0.000 description 3
- WHUUTDBJXJRKMK-UHFFFAOYSA-N Glutamic acid Natural products OC(=O)C(N)CCC(O)=O WHUUTDBJXJRKMK-UHFFFAOYSA-N 0.000 description 3
- 102100036442 Glutathione reductase, mitochondrial Human genes 0.000 description 3
- 108010078321 Guanylate Cyclase Proteins 0.000 description 3
- 102000014469 Guanylate cyclase Human genes 0.000 description 3
- SQUHHTBVTRBESD-UHFFFAOYSA-N Hexa-Ac-myo-Inositol Natural products CC(=O)OC1C(OC(C)=O)C(OC(C)=O)C(OC(C)=O)C(OC(C)=O)C1OC(C)=O SQUHHTBVTRBESD-UHFFFAOYSA-N 0.000 description 3
- 241000282412 Homo Species 0.000 description 3
- 101000933320 Homo sapiens Breakpoint cluster region protein Proteins 0.000 description 3
- 101100283943 Homo sapiens GSR gene Proteins 0.000 description 3
- 101000599951 Homo sapiens Insulin-like growth factor I Proteins 0.000 description 3
- 101001076418 Homo sapiens Interleukin-1 receptor type 1 Proteins 0.000 description 3
- 101000829138 Homo sapiens Somatostatin receptor type 3 Proteins 0.000 description 3
- 101000712674 Homo sapiens TGF-beta receptor type-1 Proteins 0.000 description 3
- 101000891649 Homo sapiens Transcription elongation factor A protein-like 1 Proteins 0.000 description 3
- 208000029663 Hypophosphatemia Diseases 0.000 description 3
- 206010062016 Immunosuppression Diseases 0.000 description 3
- 102100026818 Inhibin beta E chain Human genes 0.000 description 3
- 102100037852 Insulin-like growth factor I Human genes 0.000 description 3
- 102100033010 Integrin beta-5 Human genes 0.000 description 3
- 102100026016 Interleukin-1 receptor type 1 Human genes 0.000 description 3
- 102000004889 Interleukin-6 Human genes 0.000 description 3
- 108090001005 Interleukin-6 Proteins 0.000 description 3
- DCXYFEDJOCDNAF-REOHCLBHSA-N L-asparagine Chemical compound OC(=O)[C@@H](N)CC(N)=O DCXYFEDJOCDNAF-REOHCLBHSA-N 0.000 description 3
- CKLJMWTZIZZHCS-REOHCLBHSA-N L-aspartic acid Chemical compound OC(=O)[C@@H](N)CC(O)=O CKLJMWTZIZZHCS-REOHCLBHSA-N 0.000 description 3
- WHUUTDBJXJRKMK-VKHMYHEASA-N L-glutamic acid Chemical compound OC(=O)[C@@H](N)CCC(O)=O WHUUTDBJXJRKMK-VKHMYHEASA-N 0.000 description 3
- AGPKZVBTJJNPAG-WHFBIAKZSA-N L-isoleucine Chemical compound CC[C@H](C)[C@H](N)C(O)=O AGPKZVBTJJNPAG-WHFBIAKZSA-N 0.000 description 3
- ROHFNLRQFUQHCH-YFKPBYRVSA-N L-leucine Chemical compound CC(C)C[C@H](N)C(O)=O ROHFNLRQFUQHCH-YFKPBYRVSA-N 0.000 description 3
- COLNVLDHVKWLRT-QMMMGPOBSA-N L-phenylalanine Chemical compound OC(=O)[C@@H](N)CC1=CC=CC=C1 COLNVLDHVKWLRT-QMMMGPOBSA-N 0.000 description 3
- KDXKERNSBIXSRK-UHFFFAOYSA-N Lysine Natural products NCCCCC(N)C(O)=O KDXKERNSBIXSRK-UHFFFAOYSA-N 0.000 description 3
- 102100033342 Lysosomal acid glucosylceramidase Human genes 0.000 description 3
- 102100037801 Mitogen-activated protein kinase 6 Human genes 0.000 description 3
- ZMXDDKWLCZADIW-UHFFFAOYSA-N N,N-Dimethylformamide Chemical compound CN(C)C=O ZMXDDKWLCZADIW-UHFFFAOYSA-N 0.000 description 3
- 238000011887 Necropsy Methods 0.000 description 3
- 208000008589 Obesity Diseases 0.000 description 3
- 102000016304 Origin Recognition Complex Human genes 0.000 description 3
- 108010067244 Origin Recognition Complex Proteins 0.000 description 3
- 102000004264 Osteopontin Human genes 0.000 description 3
- 108010081689 Osteopontin Proteins 0.000 description 3
- 208000001132 Osteoporosis Diseases 0.000 description 3
- 102100038374 Pinin Human genes 0.000 description 3
- 108090000708 Proteasome Endopeptidase Complex Proteins 0.000 description 3
- 102000004245 Proteasome Endopeptidase Complex Human genes 0.000 description 3
- 102000009516 Protein Serine-Threonine Kinases Human genes 0.000 description 3
- 108010009341 Protein Serine-Threonine Kinases Proteins 0.000 description 3
- 102000002727 Protein Tyrosine Phosphatase Human genes 0.000 description 3
- 102000052575 Proto-Oncogene Human genes 0.000 description 3
- 108700020978 Proto-Oncogene Proteins 0.000 description 3
- 102100031379 Ras-related protein Rab-11B Human genes 0.000 description 3
- 102100028191 Ras-related protein Rab-1A Human genes 0.000 description 3
- 102100039100 Ras-related protein Rab-5A Human genes 0.000 description 3
- 201000000582 Retinoblastoma Diseases 0.000 description 3
- 102000002278 Ribosomal Proteins Human genes 0.000 description 3
- 108010000605 Ribosomal Proteins Proteins 0.000 description 3
- DBMJMQXJHONAFJ-UHFFFAOYSA-M Sodium laurylsulphate Chemical compound [Na+].CCCCCCCCCCCCOS([O-])(=O)=O DBMJMQXJHONAFJ-UHFFFAOYSA-M 0.000 description 3
- 102100023803 Somatostatin receptor type 3 Human genes 0.000 description 3
- 102000005890 Spectrin Human genes 0.000 description 3
- 108010019965 Spectrin Proteins 0.000 description 3
- 238000012896 Statistical algorithm Methods 0.000 description 3
- 102100023931 Transcriptional regulator ATRX Human genes 0.000 description 3
- 102000004357 Transferases Human genes 0.000 description 3
- 108090000992 Transferases Proteins 0.000 description 3
- KZSNJWFQEVHDMF-UHFFFAOYSA-N Valine Chemical compound CC(C)C(N)C(O)=O KZSNJWFQEVHDMF-UHFFFAOYSA-N 0.000 description 3
- 239000000488 activin Substances 0.000 description 3
- 230000001154 acute effect Effects 0.000 description 3
- 102000035181 adaptor proteins Human genes 0.000 description 3
- 108091005764 adaptor proteins Proteins 0.000 description 3
- ODKSFYDXXFIFQN-UHFFFAOYSA-N arginine Natural products OC(=O)C(N)CCCNC(N)=N ODKSFYDXXFIFQN-UHFFFAOYSA-N 0.000 description 3
- 238000003491 array Methods 0.000 description 3
- 208000011775 arteriosclerosis disease Diseases 0.000 description 3
- 230000008238 biochemical pathway Effects 0.000 description 3
- 229960002685 biotin Drugs 0.000 description 3
- 235000020958 biotin Nutrition 0.000 description 3
- 239000011616 biotin Substances 0.000 description 3
- 230000037396 body weight Effects 0.000 description 3
- 229940112869 bone morphogenetic protein Drugs 0.000 description 3
- 238000004422 calculation algorithm Methods 0.000 description 3
- 238000004113 cell culture Methods 0.000 description 3
- 230000003915 cell function Effects 0.000 description 3
- 230000002759 chromosomal effect Effects 0.000 description 3
- 210000000349 chromosome Anatomy 0.000 description 3
- 208000023819 chronic asthma Diseases 0.000 description 3
- KRKNYBCHXYNGOX-UHFFFAOYSA-N citric acid Chemical compound OC(=O)CC(O)(C(O)=O)CC(O)=O KRKNYBCHXYNGOX-UHFFFAOYSA-N 0.000 description 3
- 238000010367 cloning Methods 0.000 description 3
- 230000001276 controlling effect Effects 0.000 description 3
- 238000012937 correction Methods 0.000 description 3
- 239000002875 cyclin dependent kinase inhibitor Substances 0.000 description 3
- 229940043378 cyclin-dependent kinase inhibitor Drugs 0.000 description 3
- 238000012217 deletion Methods 0.000 description 3
- 230000037430 deletion Effects 0.000 description 3
- 238000010494 dissociation reaction Methods 0.000 description 3
- 230000005593 dissociations Effects 0.000 description 3
- 239000002552 dosage form Substances 0.000 description 3
- 238000012912 drug discovery process Methods 0.000 description 3
- 238000012869 ethanol precipitation Methods 0.000 description 3
- 238000000605 extraction Methods 0.000 description 3
- 235000012631 food intake Nutrition 0.000 description 3
- 210000001035 gastrointestinal tract Anatomy 0.000 description 3
- 238000003500 gene array Methods 0.000 description 3
- 210000001320 hippocampus Anatomy 0.000 description 3
- 230000001506 immunosuppresive effect Effects 0.000 description 3
- 230000001939 inductive effect Effects 0.000 description 3
- 229960000367 inositol Drugs 0.000 description 3
- 102000006495 integrins Human genes 0.000 description 3
- 108010044426 integrins Proteins 0.000 description 3
- 229940100601 interleukin-6 Drugs 0.000 description 3
- 238000002955 isolation Methods 0.000 description 3
- 208000017169 kidney disease Diseases 0.000 description 3
- 230000003211 malignant effect Effects 0.000 description 3
- 210000004962 mammalian cell Anatomy 0.000 description 3
- 239000000463 material Substances 0.000 description 3
- 230000007246 mechanism Effects 0.000 description 3
- 230000002503 metabolic effect Effects 0.000 description 3
- 239000003068 molecular probe Substances 0.000 description 3
- 230000008506 pathogenesis Effects 0.000 description 3
- 230000002974 pharmacogenomic effect Effects 0.000 description 3
- 239000012071 phase Substances 0.000 description 3
- 230000004983 pleiotropic effect Effects 0.000 description 3
- 108020000494 protein-tyrosine phosphatase Proteins 0.000 description 3
- 108010054067 rab1 GTP-Binding Proteins Proteins 0.000 description 3
- 108010032037 rab5 GTP-Binding Proteins Proteins 0.000 description 3
- CDAISMWEOUEBRE-UHFFFAOYSA-N scyllo-inosotol Natural products OC1C(O)C(O)C(O)C(O)C1O CDAISMWEOUEBRE-UHFFFAOYSA-N 0.000 description 3
- 230000019491 signal transduction Effects 0.000 description 3
- 150000003384 small molecules Chemical class 0.000 description 3
- 239000002904 solvent Substances 0.000 description 3
- 230000007704 transition Effects 0.000 description 3
- 230000032258 transport Effects 0.000 description 3
- 241001515965 unidentified phage Species 0.000 description 3
- 230000004862 vasculogenesis Effects 0.000 description 3
- 102000009310 vitamin D receptors Human genes 0.000 description 3
- 108050000156 vitamin D receptors Proteins 0.000 description 3
- PUPZLCDOIYMWBV-UHFFFAOYSA-N (+/-)-1,3-Butanediol Chemical compound CC(O)CCO PUPZLCDOIYMWBV-UHFFFAOYSA-N 0.000 description 2
- XUHRVZXFBWDCFB-QRTDKPMLSA-N (3R)-4-[[(3S,6S,9S,12R,15S,18R,21R,24R,27R,28R)-12-(3-amino-3-oxopropyl)-6-[(2S)-butan-2-yl]-3-(2-carboxyethyl)-18-(hydroxymethyl)-28-methyl-9,15,21,24-tetrakis(2-methylpropyl)-2,5,8,11,14,17,20,23,26-nonaoxo-1-oxa-4,7,10,13,16,19,22,25-octazacyclooctacos-27-yl]amino]-3-[[(2R)-2-[[(3S)-3-hydroxydecanoyl]amino]-4-methylpentanoyl]amino]-4-oxobutanoic acid Chemical compound CCCCCCC[C@H](O)CC(=O)N[C@H](CC(C)C)C(=O)N[C@H](CC(O)=O)C(=O)N[C@@H]1[C@@H](C)OC(=O)[C@H](CCC(O)=O)NC(=O)[C@@H](NC(=O)[C@H](CC(C)C)NC(=O)[C@@H](CCC(N)=O)NC(=O)[C@H](CC(C)C)NC(=O)[C@@H](CO)NC(=O)[C@@H](CC(C)C)NC(=O)[C@@H](CC(C)C)NC1=O)[C@@H](C)CC XUHRVZXFBWDCFB-QRTDKPMLSA-N 0.000 description 2
- 125000003088 (fluoren-9-ylmethoxy)carbonyl group Chemical group 0.000 description 2
- 108091032973 (ribonucleotides)n+m Proteins 0.000 description 2
- 108010041801 2',3'-Cyclic Nucleotide 3'-Phosphodiesterase Proteins 0.000 description 2
- 102100040458 2',3'-cyclic-nucleotide 3'-phosphodiesterase Human genes 0.000 description 2
- ZIIUUSVHCHPIQD-UHFFFAOYSA-N 2,4,6-trimethyl-N-[3-(trifluoromethyl)phenyl]benzenesulfonamide Chemical compound CC1=CC(C)=CC(C)=C1S(=O)(=O)NC1=CC=CC(C(F)(F)F)=C1 ZIIUUSVHCHPIQD-UHFFFAOYSA-N 0.000 description 2
- 238000012232 AGPC extraction Methods 0.000 description 2
- 208000024893 Acute lymphoblastic leukemia Diseases 0.000 description 2
- 208000014697 Acute lymphocytic leukaemia Diseases 0.000 description 2
- 108010001058 Acyl-CoA Dehydrogenase Proteins 0.000 description 2
- 102000002735 Acyl-CoA Dehydrogenase Human genes 0.000 description 2
- PQSUYGKTWSAVDQ-ZVIOFETBSA-N Aldosterone Chemical compound C([C@@]1([C@@H](C(=O)CO)CC[C@H]1[C@@H]1CC2)C=O)[C@H](O)[C@@H]1[C@]1(C)C2=CC(=O)CC1 PQSUYGKTWSAVDQ-ZVIOFETBSA-N 0.000 description 2
- PQSUYGKTWSAVDQ-UHFFFAOYSA-N Aldosterone Natural products C1CC2C3CCC(C(=O)CO)C3(C=O)CC(O)C2C2(C)C1=CC(=O)CC2 PQSUYGKTWSAVDQ-UHFFFAOYSA-N 0.000 description 2
- 108020004774 Alkaline Phosphatase Proteins 0.000 description 2
- 102000002260 Alkaline Phosphatase Human genes 0.000 description 2
- 102000014303 Amyloid beta-Protein Precursor Human genes 0.000 description 2
- 108010079054 Amyloid beta-Protein Precursor Proteins 0.000 description 2
- 101100018713 Arabidopsis thaliana ILR1 gene Proteins 0.000 description 2
- 102100029361 Aromatase Human genes 0.000 description 2
- 108010078554 Aromatase Proteins 0.000 description 2
- IJGRMHOSHXDMSA-UHFFFAOYSA-N Atomic nitrogen Chemical compound N#N IJGRMHOSHXDMSA-UHFFFAOYSA-N 0.000 description 2
- 102100021631 B-cell lymphoma 6 protein Human genes 0.000 description 2
- 208000032791 BCR-ABL1 positive chronic myelogenous leukemia Diseases 0.000 description 2
- 101150049556 Bcr gene Proteins 0.000 description 2
- 102000004506 Blood Proteins Human genes 0.000 description 2
- 108010017384 Blood Proteins Proteins 0.000 description 2
- 206010006187 Breast cancer Diseases 0.000 description 2
- 208000026310 Breast neoplasm Diseases 0.000 description 2
- 102100032752 C-reactive protein Human genes 0.000 description 2
- 102100033787 CMP-sialic acid transporter Human genes 0.000 description 2
- 101710150575 CMP-sialic acid transporter Proteins 0.000 description 2
- 102100029761 Cadherin-5 Human genes 0.000 description 2
- 108010042955 Calcineurin Proteins 0.000 description 2
- 102000004631 Calcineurin Human genes 0.000 description 2
- 108010017954 Calcium-Transporting ATPases Proteins 0.000 description 2
- 102000004612 Calcium-Transporting ATPases Human genes 0.000 description 2
- 101710200183 Calcium/calmodulin-dependent protein kinase I Proteins 0.000 description 2
- 102100033086 Calcium/calmodulin-dependent protein kinase type 1 Human genes 0.000 description 2
- 102100025579 Calmodulin-2 Human genes 0.000 description 2
- 101710164734 Calmodulin-2 Proteins 0.000 description 2
- 102000034342 Calnexin Human genes 0.000 description 2
- 108010056891 Calnexin Proteins 0.000 description 2
- 102100021973 Carbonyl reductase [NADPH] 1 Human genes 0.000 description 2
- 102000000844 Cell Surface Receptors Human genes 0.000 description 2
- 108010001857 Cell Surface Receptors Proteins 0.000 description 2
- HEDRZPFGACZZDS-UHFFFAOYSA-N Chloroform Chemical compound ClC(Cl)Cl HEDRZPFGACZZDS-UHFFFAOYSA-N 0.000 description 2
- 102100034927 Cholecystokinin receptor type A Human genes 0.000 description 2
- 208000010833 Chronic myeloid leukaemia Diseases 0.000 description 2
- 108020004705 Codon Proteins 0.000 description 2
- 108020004635 Complementary DNA Proteins 0.000 description 2
- 102000010970 Connexin Human genes 0.000 description 2
- 108050001175 Connexin Proteins 0.000 description 2
- 101710095468 Cyclase Proteins 0.000 description 2
- 108010058546 Cyclin D1 Proteins 0.000 description 2
- 108010058545 Cyclin D3 Proteins 0.000 description 2
- 108010068106 Cyclin T Proteins 0.000 description 2
- 102100024112 Cyclin-T2 Human genes 0.000 description 2
- 102100024463 Cyclin-dependent kinase 4 inhibitor D Human genes 0.000 description 2
- 102100033270 Cyclin-dependent kinase inhibitor 1 Human genes 0.000 description 2
- 101150077031 DAXX gene Proteins 0.000 description 2
- 102100022874 Dexamethasone-induced Ras-related protein 1 Human genes 0.000 description 2
- 208000007342 Diabetic Nephropathies Diseases 0.000 description 2
- 206010012689 Diabetic retinopathy Diseases 0.000 description 2
- 102000011107 Diacylglycerol Kinase Human genes 0.000 description 2
- 108010062677 Diacylglycerol Kinase Proteins 0.000 description 2
- 108050002772 E3 ubiquitin-protein ligase Mdm2 Proteins 0.000 description 2
- 102000012199 E3 ubiquitin-protein ligase Mdm2 Human genes 0.000 description 2
- 102000005593 Endopeptidases Human genes 0.000 description 2
- 108010059378 Endopeptidases Proteins 0.000 description 2
- 102000010834 Extracellular Matrix Proteins Human genes 0.000 description 2
- 108010037362 Extracellular Matrix Proteins Proteins 0.000 description 2
- 102100029328 FERM domain-containing protein 4B Human genes 0.000 description 2
- 208000005050 Familial Hypophosphatemic Rickets Diseases 0.000 description 2
- 102100036113 Far upstream element-binding protein 3 Human genes 0.000 description 2
- 102100037362 Fibronectin Human genes 0.000 description 2
- 108010067306 Fibronectins Proteins 0.000 description 2
- 108010014612 Follistatin Proteins 0.000 description 2
- 102000016970 Follistatin Human genes 0.000 description 2
- 102100037062 Forkhead box protein D2 Human genes 0.000 description 2
- 102000003688 G-Protein-Coupled Receptors Human genes 0.000 description 2
- 108090000045 G-Protein-Coupled Receptors Proteins 0.000 description 2
- 102100024165 G1/S-specific cyclin-D1 Human genes 0.000 description 2
- 102100037859 G1/S-specific cyclin-D3 Human genes 0.000 description 2
- 102000001534 GDP dissociation inhibitor Human genes 0.000 description 2
- 102100040225 Gamma-interferon-inducible lysosomal thiol reductase Human genes 0.000 description 2
- 208000034951 Genetic Translocation Diseases 0.000 description 2
- 102100031181 Glyceraldehyde-3-phosphate dehydrogenase Human genes 0.000 description 2
- DHMQDGOQFOQNFH-UHFFFAOYSA-N Glycine Chemical compound NCC(O)=O DHMQDGOQFOQNFH-UHFFFAOYSA-N 0.000 description 2
- 102000003886 Glycoproteins Human genes 0.000 description 2
- 108090000288 Glycoproteins Proteins 0.000 description 2
- 108010092964 Guanine Nucleotide Dissociation Inhibitors Proteins 0.000 description 2
- 108010066705 H-cadherin Proteins 0.000 description 2
- 208000005331 Hepatitis D Diseases 0.000 description 2
- 208000037262 Hepatitis delta Diseases 0.000 description 2
- 108010019372 Heterogeneous-Nuclear Ribonucleoproteins Proteins 0.000 description 2
- 102000006479 Heterogeneous-Nuclear Ribonucleoproteins Human genes 0.000 description 2
- 101001092424 Homo sapiens 60S ribosomal protein L37a Proteins 0.000 description 2
- 101000782077 Homo sapiens AN1-type zinc finger protein 5 Proteins 0.000 description 2
- 101000733623 Homo sapiens All-trans retinoic acid-induced differentiation factor Proteins 0.000 description 2
- 101000971234 Homo sapiens B-cell lymphoma 6 protein Proteins 0.000 description 2
- 101000896985 Homo sapiens Carbonyl reductase [NADPH] 1 Proteins 0.000 description 2
- 101000721661 Homo sapiens Cellular tumor antigen p53 Proteins 0.000 description 2
- 101000725583 Homo sapiens Cofilin-1 Proteins 0.000 description 2
- 101000980914 Homo sapiens Cyclin-dependent kinase 4 inhibitor C Proteins 0.000 description 2
- 101000980920 Homo sapiens Cyclin-dependent kinase 4 inhibitor D Proteins 0.000 description 2
- 101000915428 Homo sapiens Death domain-associated protein 6 Proteins 0.000 description 2
- 101000620808 Homo sapiens Dexamethasone-induced Ras-related protein 1 Proteins 0.000 description 2
- 101000615221 Homo sapiens Eukaryotic translation elongation factor 1 epsilon-1 Proteins 0.000 description 2
- 101001062452 Homo sapiens FERM domain-containing protein 4B Proteins 0.000 description 2
- 101000930753 Homo sapiens Far upstream element-binding protein 3 Proteins 0.000 description 2
- 101001023230 Homo sapiens Folate receptor alpha Proteins 0.000 description 2
- 101001029314 Homo sapiens Forkhead box protein D2 Proteins 0.000 description 2
- 101000828886 Homo sapiens GTP-binding protein 4 Proteins 0.000 description 2
- 101001037132 Homo sapiens Gamma-interferon-inducible lysosomal thiol reductase Proteins 0.000 description 2
- 101000957743 Homo sapiens Meiosis regulator and mRNA stability factor 1 Proteins 0.000 description 2
- 101000950669 Homo sapiens Mitogen-activated protein kinase 9 Proteins 0.000 description 2
- 101000896657 Homo sapiens Mitotic checkpoint serine/threonine-protein kinase BUB1 Proteins 0.000 description 2
- 101000605827 Homo sapiens Pinin Proteins 0.000 description 2
- 101000692455 Homo sapiens Platelet-derived growth factor receptor beta Proteins 0.000 description 2
- 101000904173 Homo sapiens Progonadoliberin-1 Proteins 0.000 description 2
- 101000911388 Homo sapiens Protein FAM98A Proteins 0.000 description 2
- 101000739146 Homo sapiens Protein SFI1 homolog Proteins 0.000 description 2
- 101000591312 Homo sapiens Putative MORF4 family-associated protein 1-like protein UPP Proteins 0.000 description 2
- 101100518359 Homo sapiens RHO gene Proteins 0.000 description 2
- 101000619497 Homo sapiens Ragulator complex protein LAMTOR1 Proteins 0.000 description 2
- 101001130576 Homo sapiens Ras-related protein Rab-11B Proteins 0.000 description 2
- 101001099877 Homo sapiens Ras-related protein Rab-43 Proteins 0.000 description 2
- 101001077400 Homo sapiens Ras-related protein Rab-6A Proteins 0.000 description 2
- 101000826081 Homo sapiens SRSF protein kinase 1 Proteins 0.000 description 2
- 101000939246 Homo sapiens SUMO-conjugating enzyme UBC9 Proteins 0.000 description 2
- 101000706557 Homo sapiens SUN domain-containing protein 1 Proteins 0.000 description 2
- 101000821926 Homo sapiens Solute carrier family 22 member 14 Proteins 0.000 description 2
- 101000829127 Homo sapiens Somatostatin receptor type 2 Proteins 0.000 description 2
- 101000890887 Homo sapiens Trace amine-associated receptor 1 Proteins 0.000 description 2
- 101000962463 Homo sapiens Transcription factor MafK Proteins 0.000 description 2
- 101000904868 Homo sapiens Transcriptional regulator ATRX Proteins 0.000 description 2
- 101000648518 Homo sapiens Transmembrane protein 251 Proteins 0.000 description 2
- 101000637036 Homo sapiens Tubulin polymerization-promoting protein family member 2 Proteins 0.000 description 2
- 101001017904 Homo sapiens U6 snRNA-associated Sm-like protein LSm2 Proteins 0.000 description 2
- 101000744885 Homo sapiens Zinc finger protein 197 Proteins 0.000 description 2
- 108091008585 IP3 receptors Proteins 0.000 description 2
- 206010061218 Inflammation Diseases 0.000 description 2
- 102000007640 Inositol 1,4,5-Trisphosphate Receptors Human genes 0.000 description 2
- 102000000426 Integrin alpha6 Human genes 0.000 description 2
- 108010041100 Integrin alpha6 Proteins 0.000 description 2
- 102000016921 Integrin-Binding Sialoprotein Human genes 0.000 description 2
- 108010028750 Integrin-Binding Sialoprotein Proteins 0.000 description 2
- 102000014746 Interferon-Stimulated Gene Factor 3 Human genes 0.000 description 2
- 108010064052 Interferon-Stimulated Gene Factor 3 Proteins 0.000 description 2
- 230000004163 JAK-STAT signaling pathway Effects 0.000 description 2
- 108700003486 Jagged-1 Proteins 0.000 description 2
- 201000007493 Kallmann syndrome Diseases 0.000 description 2
- 102000003855 L-lactate dehydrogenase Human genes 0.000 description 2
- 108700023483 L-lactate dehydrogenases Proteins 0.000 description 2
- FFEARJCKVFRZRR-BYPYZUCNSA-N L-methionine Chemical compound CSCC[C@H](N)C(O)=O FFEARJCKVFRZRR-BYPYZUCNSA-N 0.000 description 2
- 102100022699 Lymphoid enhancer-binding factor 1 Human genes 0.000 description 2
- 102100038620 Meiosis regulator and mRNA stability factor 1 Human genes 0.000 description 2
- 102000018697 Membrane Proteins Human genes 0.000 description 2
- 108010052285 Membrane Proteins Proteins 0.000 description 2
- 108010058682 Mitochondrial Proteins Proteins 0.000 description 2
- 102000006404 Mitochondrial Proteins Human genes 0.000 description 2
- 108700027647 Mitogen-Activated Protein Kinase 6 Proteins 0.000 description 2
- 108700027648 Mitogen-Activated Protein Kinase 8 Proteins 0.000 description 2
- 102100024193 Mitogen-activated protein kinase 1 Human genes 0.000 description 2
- 102100037808 Mitogen-activated protein kinase 8 Human genes 0.000 description 2
- 102100037809 Mitogen-activated protein kinase 9 Human genes 0.000 description 2
- 102100021691 Mitotic checkpoint serine/threonine-protein kinase BUB1 Human genes 0.000 description 2
- 208000003250 Mixed connective tissue disease Diseases 0.000 description 2
- 241000714177 Murine leukemia virus Species 0.000 description 2
- 101001051972 Mus musculus Fibroblast growth factor 23 Proteins 0.000 description 2
- 208000033761 Myelogenous Chronic BCR-ABL Positive Leukemia Diseases 0.000 description 2
- 108010067385 Myosin Light Chains Proteins 0.000 description 2
- 102000016349 Myosin Light Chains Human genes 0.000 description 2
- 108020001621 Natriuretic Peptide Proteins 0.000 description 2
- 102000004571 Natriuretic peptide Human genes 0.000 description 2
- 206010029113 Neovascularisation Diseases 0.000 description 2
- 102100033223 Nicotinamide phosphoribosyltransferase Human genes 0.000 description 2
- 102100032028 Non-receptor tyrosine-protein kinase TYK2 Human genes 0.000 description 2
- 102000007999 Nuclear Proteins Human genes 0.000 description 2
- 108010089610 Nuclear Proteins Proteins 0.000 description 2
- 102100032113 Nucleoside diphosphate kinase 6 Human genes 0.000 description 2
- 206010053142 Olfacto genital dysplasia Diseases 0.000 description 2
- 108010005298 Oligodendrocyte-Myelin Glycoprotein Proteins 0.000 description 2
- 102100026746 Oligodendrocyte-myelin glycoprotein Human genes 0.000 description 2
- 102000015636 Oligopeptides Human genes 0.000 description 2
- 108010038807 Oligopeptides Proteins 0.000 description 2
- 102000004067 Osteocalcin Human genes 0.000 description 2
- 108090000573 Osteocalcin Proteins 0.000 description 2
- 102400000050 Oxytocin Human genes 0.000 description 2
- XNOPRXBHLZRZKH-UHFFFAOYSA-N Oxytocin Natural products N1C(=O)C(N)CSSCC(C(=O)N2C(CCC2)C(=O)NC(CC(C)C)C(=O)NCC(N)=O)NC(=O)C(CC(N)=O)NC(=O)C(CCC(N)=O)NC(=O)C(C(C)CC)NC(=O)C1CC1=CC=C(O)C=C1 XNOPRXBHLZRZKH-UHFFFAOYSA-N 0.000 description 2
- 101800000989 Oxytocin Proteins 0.000 description 2
- 208000002193 Pain Diseases 0.000 description 2
- 102000035195 Peptidases Human genes 0.000 description 2
- 108091005804 Peptidases Proteins 0.000 description 2
- 108091093037 Peptide nucleic acid Proteins 0.000 description 2
- ISWSIDIOOBJBQZ-UHFFFAOYSA-N Phenol Chemical compound OC1=CC=CC=C1 ISWSIDIOOBJBQZ-UHFFFAOYSA-N 0.000 description 2
- 101710096328 Phospholipase A2 Proteins 0.000 description 2
- 108010058864 Phospholipases A2 Proteins 0.000 description 2
- NBIIXXVUZAFLBC-UHFFFAOYSA-N Phosphoric acid Chemical compound OP(O)(O)=O NBIIXXVUZAFLBC-UHFFFAOYSA-N 0.000 description 2
- NQRYJNQNLNOLGT-UHFFFAOYSA-N Piperidine Chemical compound C1CCNCC1 NQRYJNQNLNOLGT-UHFFFAOYSA-N 0.000 description 2
- 108010004684 Pituitary adenylate cyclase-activating polypeptide Proteins 0.000 description 2
- 102100026547 Platelet-derived growth factor receptor beta Human genes 0.000 description 2
- 102100030264 Pleckstrin Human genes 0.000 description 2
- 208000006664 Precursor Cell Lymphoblastic Leukemia-Lymphoma Diseases 0.000 description 2
- 102100022033 Presenilin-1 Human genes 0.000 description 2
- 108010036933 Presenilin-1 Proteins 0.000 description 2
- 241000288906 Primates Species 0.000 description 2
- 102100024028 Progonadoliberin-1 Human genes 0.000 description 2
- 102100034785 Programmed cell death protein 6 Human genes 0.000 description 2
- 239000004365 Protease Substances 0.000 description 2
- 102100026734 Protein FAM98A Human genes 0.000 description 2
- 102100033954 Protein PRRC2A Human genes 0.000 description 2
- 102100037271 Protein SFI1 homolog Human genes 0.000 description 2
- 108010026552 Proteome Proteins 0.000 description 2
- 102100034096 Putative MORF4 family-associated protein 1-like protein UPP Human genes 0.000 description 2
- 239000013614 RNA sample Substances 0.000 description 2
- 108090000292 RNA-binding protein FUS Proteins 0.000 description 2
- 102000003890 RNA-binding protein FUS Human genes 0.000 description 2
- 102100034485 Ras-related protein Rab-2A Human genes 0.000 description 2
- 102100025219 Ras-related protein Rab-6A Human genes 0.000 description 2
- 241000700159 Rattus Species 0.000 description 2
- 241000700157 Rattus norvegicus Species 0.000 description 2
- 102100029831 Reticulon-4 Human genes 0.000 description 2
- 108010071034 Retinoblastoma-Binding Protein 4 Proteins 0.000 description 2
- 102000007508 Retinoblastoma-Binding Protein 4 Human genes 0.000 description 2
- 108091028664 Ribonucleotide Proteins 0.000 description 2
- 108010041948 SNARE Proteins Proteins 0.000 description 2
- 102000000583 SNARE Proteins Human genes 0.000 description 2
- 108010017324 STAT3 Transcription Factor Proteins 0.000 description 2
- 102100031130 SUN domain-containing protein 1 Human genes 0.000 description 2
- 101100516032 Saccharomyces cerevisiae (strain ATCC 204508 / S288c) CBR1 gene Proteins 0.000 description 2
- 238000012300 Sequence Analysis Methods 0.000 description 2
- 102100020814 Sequestosome-1 Human genes 0.000 description 2
- 101710169730 Serine/threonine-protein phosphatase 2B catalytic subunit A1 Proteins 0.000 description 2
- 102100024040 Signal transducer and activator of transcription 3 Human genes 0.000 description 2
- 102000039471 Small Nuclear RNA Human genes 0.000 description 2
- 102100026940 Small ubiquitin-related modifier 1 Human genes 0.000 description 2
- 102000008858 Somatostatin receptor 4 Human genes 0.000 description 2
- 102100023802 Somatostatin receptor type 2 Human genes 0.000 description 2
- 102400000821 Somatostatin-28 Human genes 0.000 description 2
- 101800004701 Somatostatin-28 Proteins 0.000 description 2
- 102100038803 Somatotropin Human genes 0.000 description 2
- 108010061312 Sphingomyelin Phosphodiesterase Proteins 0.000 description 2
- 102000011971 Sphingomyelin Phosphodiesterase Human genes 0.000 description 2
- 108091081024 Start codon Proteins 0.000 description 2
- 238000000692 Student's t-test Methods 0.000 description 2
- 108010010057 TYK2 Kinase Proteins 0.000 description 2
- 102100024547 Tensin-1 Human genes 0.000 description 2
- 108010088950 Tensins Proteins 0.000 description 2
- 108091036066 Three prime untranslated region Proteins 0.000 description 2
- 102100029524 Thrombospondin-3 Human genes 0.000 description 2
- 102100040114 Trace amine-associated receptor 1 Human genes 0.000 description 2
- 102000040945 Transcription factor Human genes 0.000 description 2
- 108091023040 Transcription factor Proteins 0.000 description 2
- 102100038312 Transcription factor Dp-2 Human genes 0.000 description 2
- 102100024026 Transcription factor E2F1 Human genes 0.000 description 2
- 102100031632 Transcription factor E2F5 Human genes 0.000 description 2
- 102100028604 Transcription initiation factor IIA subunit 2 Human genes 0.000 description 2
- 102100034748 Transcription initiation factor TFIID subunit 7 Human genes 0.000 description 2
- 101710104820 Transcription initiation factor TFIID subunit 7 Proteins 0.000 description 2
- 108010011702 Transforming Growth Factor-beta Type I Receptor Proteins 0.000 description 2
- 102000056172 Transforming growth factor beta-3 Human genes 0.000 description 2
- 108090000097 Transforming growth factor beta-3 Proteins 0.000 description 2
- 102000003932 Transgelin Human genes 0.000 description 2
- 108090000333 Transgelin Proteins 0.000 description 2
- 102100028766 Transmembrane protein 251 Human genes 0.000 description 2
- DTQVDTLACAAQTR-UHFFFAOYSA-N Trifluoroacetic acid Chemical compound OC(=O)C(F)(F)F DTQVDTLACAAQTR-UHFFFAOYSA-N 0.000 description 2
- 108010030743 Tropomyosin Proteins 0.000 description 2
- 102000005937 Tropomyosin Human genes 0.000 description 2
- PEEAINPHPNDNGE-JQWIXIFHSA-N Trp-Asp Chemical compound C1=CC=C2C(C[C@H](N)C(=O)N[C@@H](CC(O)=O)C(O)=O)=CNC2=C1 PEEAINPHPNDNGE-JQWIXIFHSA-N 0.000 description 2
- 102000014384 Type C Phospholipases Human genes 0.000 description 2
- 108010079194 Type C Phospholipases Proteins 0.000 description 2
- 102100033438 Tyrosine-protein kinase JAK1 Human genes 0.000 description 2
- 102100039127 Tyrosine-protein kinase receptor TYRO3 Human genes 0.000 description 2
- 102100033019 Tyrosine-protein phosphatase non-receptor type 11 Human genes 0.000 description 2
- 101710116241 Tyrosine-protein phosphatase non-receptor type 11 Proteins 0.000 description 2
- 102000044159 Ubiquitin Human genes 0.000 description 2
- 108090000848 Ubiquitin Proteins 0.000 description 2
- 102000003990 Urokinase-type plasminogen activator Human genes 0.000 description 2
- 108090000435 Urokinase-type plasminogen activator Proteins 0.000 description 2
- 102000008790 VE-cadherin Human genes 0.000 description 2
- 241000251539 Vertebrata <Metazoa> Species 0.000 description 2
- IXKSXJFAGXLQOQ-XISFHERQSA-N WHWLQLKPGQPMY Chemical compound C([C@@H](C(=O)N[C@@H](CC=1C2=CC=CC=C2NC=1)C(=O)N[C@@H](CC(C)C)C(=O)N[C@@H](CCC(N)=O)C(=O)N[C@@H](CC(C)C)C(=O)N1CCC[C@H]1C(=O)NCC(=O)N[C@@H](CCC(N)=O)C(=O)N[C@@H](CC(O)=O)C(=O)N1CCC[C@H]1C(=O)N[C@@H](CCSC)C(=O)N[C@@H](CC=1C=CC(O)=CC=1)C(O)=O)NC(=O)[C@@H](N)CC=1C2=CC=CC=C2NC=1)C1=CNC=N1 IXKSXJFAGXLQOQ-XISFHERQSA-N 0.000 description 2
- 208000010399 Wasting Syndrome Diseases 0.000 description 2
- 201000006035 X-linked dominant hypophosphatemic rickets Diseases 0.000 description 2
- 208000031878 X-linked hypophosphatemia Diseases 0.000 description 2
- JLCPHMBAVCMARE-UHFFFAOYSA-N [3-[[3-[[3-[[3-[[3-[[3-[[3-[[3-[[3-[[3-[[3-[[5-(2-amino-6-oxo-1H-purin-9-yl)-3-[[3-[[3-[[3-[[3-[[3-[[5-(2-amino-6-oxo-1H-purin-9-yl)-3-[[5-(2-amino-6-oxo-1H-purin-9-yl)-3-hydroxyoxolan-2-yl]methoxy-hydroxyphosphoryl]oxyoxolan-2-yl]methoxy-hydroxyphosphoryl]oxy-5-(5-methyl-2,4-dioxopyrimidin-1-yl)oxolan-2-yl]methoxy-hydroxyphosphoryl]oxy-5-(6-aminopurin-9-yl)oxolan-2-yl]methoxy-hydroxyphosphoryl]oxy-5-(6-aminopurin-9-yl)oxolan-2-yl]methoxy-hydroxyphosphoryl]oxy-5-(6-aminopurin-9-yl)oxolan-2-yl]methoxy-hydroxyphosphoryl]oxy-5-(6-aminopurin-9-yl)oxolan-2-yl]methoxy-hydroxyphosphoryl]oxyoxolan-2-yl]methoxy-hydroxyphosphoryl]oxy-5-(5-methyl-2,4-dioxopyrimidin-1-yl)oxolan-2-yl]methoxy-hydroxyphosphoryl]oxy-5-(4-amino-2-oxopyrimidin-1-yl)oxolan-2-yl]methoxy-hydroxyphosphoryl]oxy-5-(5-methyl-2,4-dioxopyrimidin-1-yl)oxolan-2-yl]methoxy-hydroxyphosphoryl]oxy-5-(5-methyl-2,4-dioxopyrimidin-1-yl)oxolan-2-yl]methoxy-hydroxyphosphoryl]oxy-5-(6-aminopurin-9-yl)oxolan-2-yl]methoxy-hydroxyphosphoryl]oxy-5-(6-aminopurin-9-yl)oxolan-2-yl]methoxy-hydroxyphosphoryl]oxy-5-(4-amino-2-oxopyrimidin-1-yl)oxolan-2-yl]methoxy-hydroxyphosphoryl]oxy-5-(4-amino-2-oxopyrimidin-1-yl)oxolan-2-yl]methoxy-hydroxyphosphoryl]oxy-5-(4-amino-2-oxopyrimidin-1-yl)oxolan-2-yl]methoxy-hydroxyphosphoryl]oxy-5-(6-aminopurin-9-yl)oxolan-2-yl]methoxy-hydroxyphosphoryl]oxy-5-(4-amino-2-oxopyrimidin-1-yl)oxolan-2-yl]methyl [5-(6-aminopurin-9-yl)-2-(hydroxymethyl)oxolan-3-yl] hydrogen phosphate Polymers Cc1cn(C2CC(OP(O)(=O)OCC3OC(CC3OP(O)(=O)OCC3OC(CC3O)n3cnc4c3nc(N)[nH]c4=O)n3cnc4c3nc(N)[nH]c4=O)C(COP(O)(=O)OC3CC(OC3COP(O)(=O)OC3CC(OC3COP(O)(=O)OC3CC(OC3COP(O)(=O)OC3CC(OC3COP(O)(=O)OC3CC(OC3COP(O)(=O)OC3CC(OC3COP(O)(=O)OC3CC(OC3COP(O)(=O)OC3CC(OC3COP(O)(=O)OC3CC(OC3COP(O)(=O)OC3CC(OC3COP(O)(=O)OC3CC(OC3COP(O)(=O)OC3CC(OC3COP(O)(=O)OC3CC(OC3COP(O)(=O)OC3CC(OC3COP(O)(=O)OC3CC(OC3COP(O)(=O)OC3CC(OC3COP(O)(=O)OC3CC(OC3CO)n3cnc4c(N)ncnc34)n3ccc(N)nc3=O)n3cnc4c(N)ncnc34)n3ccc(N)nc3=O)n3ccc(N)nc3=O)n3ccc(N)nc3=O)n3cnc4c(N)ncnc34)n3cnc4c(N)ncnc34)n3cc(C)c(=O)[nH]c3=O)n3cc(C)c(=O)[nH]c3=O)n3ccc(N)nc3=O)n3cc(C)c(=O)[nH]c3=O)n3cnc4c3nc(N)[nH]c4=O)n3cnc4c(N)ncnc34)n3cnc4c(N)ncnc34)n3cnc4c(N)ncnc34)n3cnc4c(N)ncnc34)O2)c(=O)[nH]c1=O JLCPHMBAVCMARE-UHFFFAOYSA-N 0.000 description 2
- 238000002835 absorbance Methods 0.000 description 2
- 238000009825 accumulation Methods 0.000 description 2
- 230000021736 acetylation Effects 0.000 description 2
- 238000006640 acetylation reaction Methods 0.000 description 2
- 150000007513 acids Chemical class 0.000 description 2
- 239000012190 activator Substances 0.000 description 2
- 239000004480 active ingredient Substances 0.000 description 2
- 230000010933 acylation Effects 0.000 description 2
- 238000005917 acylation reaction Methods 0.000 description 2
- 102000030621 adenylate cyclase Human genes 0.000 description 2
- 108060000200 adenylate cyclase Proteins 0.000 description 2
- 229960002478 aldosterone Drugs 0.000 description 2
- 230000004075 alteration Effects 0.000 description 2
- 230000003321 amplification Effects 0.000 description 2
- 210000004102 animal cell Anatomy 0.000 description 2
- 150000001450 anions Chemical class 0.000 description 2
- 239000005557 antagonist Substances 0.000 description 2
- 230000001580 bacterial effect Effects 0.000 description 2
- 230000008901 benefit Effects 0.000 description 2
- 102000015736 beta 2-Microglobulin Human genes 0.000 description 2
- 108010081355 beta 2-Microglobulin Proteins 0.000 description 2
- 239000011230 binding agent Substances 0.000 description 2
- 230000004097 bone metabolism Effects 0.000 description 2
- 210000005013 brain tissue Anatomy 0.000 description 2
- 239000006172 buffering agent Substances 0.000 description 2
- 210000004900 c-terminal fragment Anatomy 0.000 description 2
- 125000003178 carboxy group Chemical group [H]OC(*)=O 0.000 description 2
- 230000015556 catabolic process Effects 0.000 description 2
- 230000009134 cell regulation Effects 0.000 description 2
- 230000005754 cellular signaling Effects 0.000 description 2
- OSASVXMJTNOKOY-UHFFFAOYSA-N chlorobutanol Chemical compound CC(C)(O)C(Cl)(Cl)Cl OSASVXMJTNOKOY-UHFFFAOYSA-N 0.000 description 2
- 238000004587 chromatography analysis Methods 0.000 description 2
- 238000003776 cleavage reaction Methods 0.000 description 2
- 210000001072 colon Anatomy 0.000 description 2
- 239000000356 contaminant Substances 0.000 description 2
- 210000004351 coronary vessel Anatomy 0.000 description 2
- 210000005220 cytoplasmic tail Anatomy 0.000 description 2
- 238000006731 degradation reaction Methods 0.000 description 2
- 208000033679 diabetic kidney disease Diseases 0.000 description 2
- 230000004069 differentiation Effects 0.000 description 2
- 239000003085 diluting agent Substances 0.000 description 2
- LOKCTEFSRHRXRJ-UHFFFAOYSA-I dipotassium trisodium dihydrogen phosphate hydrogen phosphate dichloride Chemical compound P(=O)(O)(O)[O-].[K+].P(=O)(O)([O-])[O-].[Na+].[Na+].[Cl-].[K+].[Cl-].[Na+] LOKCTEFSRHRXRJ-UHFFFAOYSA-I 0.000 description 2
- 229940000406 drug candidate Drugs 0.000 description 2
- 239000003596 drug target Substances 0.000 description 2
- 230000009762 endothelial cell differentiation Effects 0.000 description 2
- 230000003511 endothelial effect Effects 0.000 description 2
- 210000002744 extracellular matrix Anatomy 0.000 description 2
- 230000035558 fertility Effects 0.000 description 2
- 230000001605 fetal effect Effects 0.000 description 2
- 239000007850 fluorescent dye Substances 0.000 description 2
- 239000000499 gel Substances 0.000 description 2
- 230000002068 genetic effect Effects 0.000 description 2
- 150000004676 glycans Chemical class 0.000 description 2
- 108020004445 glyceraldehyde-3-phosphate dehydrogenase Proteins 0.000 description 2
- 238000003306 harvesting Methods 0.000 description 2
- 210000002837 heart atrium Anatomy 0.000 description 2
- 208000029570 hepatitis D virus infection Diseases 0.000 description 2
- 102000053180 human FOLR1 Human genes 0.000 description 2
- 230000000222 hyperoxic effect Effects 0.000 description 2
- 230000036039 immunity Effects 0.000 description 2
- 208000027866 inflammatory disease Diseases 0.000 description 2
- 230000004054 inflammatory process Effects 0.000 description 2
- 239000004615 ingredient Substances 0.000 description 2
- CDAISMWEOUEBRE-GPIVLXJGSA-N inositol Chemical compound O[C@H]1[C@H](O)[C@@H](O)[C@H](O)[C@H](O)[C@@H]1O CDAISMWEOUEBRE-GPIVLXJGSA-N 0.000 description 2
- NOESYZHRGYRDHS-UHFFFAOYSA-N insulin Chemical compound N1C(=O)C(NC(=O)C(CCC(N)=O)NC(=O)C(CCC(O)=O)NC(=O)C(C(C)C)NC(=O)C(NC(=O)CN)C(C)CC)CSSCC(C(NC(CO)C(=O)NC(CC(C)C)C(=O)NC(CC=2C=CC(O)=CC=2)C(=O)NC(CCC(N)=O)C(=O)NC(CC(C)C)C(=O)NC(CCC(O)=O)C(=O)NC(CC(N)=O)C(=O)NC(CC=2C=CC(O)=CC=2)C(=O)NC(CSSCC(NC(=O)C(C(C)C)NC(=O)C(CC(C)C)NC(=O)C(CC=2C=CC(O)=CC=2)NC(=O)C(CC(C)C)NC(=O)C(C)NC(=O)C(CCC(O)=O)NC(=O)C(C(C)C)NC(=O)C(CC(C)C)NC(=O)C(CC=2NC=NC=2)NC(=O)C(CO)NC(=O)CNC2=O)C(=O)NCC(=O)NC(CCC(O)=O)C(=O)NC(CCCNC(N)=N)C(=O)NCC(=O)NC(CC=3C=CC=CC=3)C(=O)NC(CC=3C=CC=CC=3)C(=O)NC(CC=3C=CC(O)=CC=3)C(=O)NC(C(C)O)C(=O)N3C(CCC3)C(=O)NC(CCCCN)C(=O)NC(C)C(O)=O)C(=O)NC(CC(N)=O)C(O)=O)=O)NC(=O)C(C(C)CC)NC(=O)C(CO)NC(=O)C(C(C)O)NC(=O)C1CSSCC2NC(=O)C(CC(C)C)NC(=O)C(NC(=O)C(CCC(N)=O)NC(=O)C(CC(N)=O)NC(=O)C(NC(=O)C(N)CC=1C=CC=CC=1)C(C)C)CC1=CN=CN1 NOESYZHRGYRDHS-UHFFFAOYSA-N 0.000 description 2
- 230000004068 intracellular signaling Effects 0.000 description 2
- 238000007918 intramuscular administration Methods 0.000 description 2
- 238000001990 intravenous administration Methods 0.000 description 2
- PHTQWCKDNZKARW-UHFFFAOYSA-N isoamylol Chemical compound CC(C)CCO PHTQWCKDNZKARW-UHFFFAOYSA-N 0.000 description 2
- 208000032839 leukemia Diseases 0.000 description 2
- 230000037356 lipid metabolism Effects 0.000 description 2
- 230000029226 lipidation Effects 0.000 description 2
- 230000004807 localization Effects 0.000 description 2
- 210000002540 macrophage Anatomy 0.000 description 2
- 238000012423 maintenance Methods 0.000 description 2
- 238000007726 management method Methods 0.000 description 2
- 210000002752 melanocyte Anatomy 0.000 description 2
- 201000001441 melanoma Diseases 0.000 description 2
- 230000004060 metabolic process Effects 0.000 description 2
- BDAGIHXWWSANSR-UHFFFAOYSA-N methanoic acid Natural products OC=O BDAGIHXWWSANSR-UHFFFAOYSA-N 0.000 description 2
- 229930182817 methionine Natural products 0.000 description 2
- 238000010369 molecular cloning Methods 0.000 description 2
- 239000000692 natriuretic peptide Substances 0.000 description 2
- 230000001613 neoplastic effect Effects 0.000 description 2
- 201000009925 nephrosclerosis Diseases 0.000 description 2
- 230000007935 neutral effect Effects 0.000 description 2
- 231100000252 nontoxic Toxicity 0.000 description 2
- 230000003000 nontoxic effect Effects 0.000 description 2
- 239000000346 nonvolatile oil Substances 0.000 description 2
- 238000003199 nucleic acid amplification method Methods 0.000 description 2
- 235000020824 obesity Nutrition 0.000 description 2
- 201000008482 osteoarthritis Diseases 0.000 description 2
- 230000002611 ovarian Effects 0.000 description 2
- XNOPRXBHLZRZKH-DSZYJQQASA-N oxytocin Chemical compound C([C@H]1C(=O)N[C@H](C(N[C@@H](CCC(N)=O)C(=O)N[C@@H](CC(N)=O)C(=O)N[C@@H](CSSC[C@H](N)C(=O)N1)C(=O)N1[C@@H](CCC1)C(=O)N[C@@H](CC(C)C)C(=O)NCC(N)=O)=O)[C@@H](C)CC)C1=CC=C(O)C=C1 XNOPRXBHLZRZKH-DSZYJQQASA-N 0.000 description 2
- 229960001723 oxytocin Drugs 0.000 description 2
- 102000022032 p53 binding proteins Human genes 0.000 description 2
- 230000036407 pain Effects 0.000 description 2
- 230000004203 pancreatic function Effects 0.000 description 2
- 230000001575 pathological effect Effects 0.000 description 2
- 102000014187 peptide receptors Human genes 0.000 description 2
- 108010011903 peptide receptors Proteins 0.000 description 2
- 238000010647 peptide synthesis reaction Methods 0.000 description 2
- 230000035699 permeability Effects 0.000 description 2
- 239000002953 phosphate buffered saline Substances 0.000 description 2
- 239000002797 plasminogen activator inhibitor Substances 0.000 description 2
- 108010026735 platelet protein P47 Proteins 0.000 description 2
- 230000003389 potentiating effect Effects 0.000 description 2
- 239000003755 preservative agent Substances 0.000 description 2
- 230000006337 proteolytic cleavage Effects 0.000 description 2
- 238000003908 quality control method Methods 0.000 description 2
- 101150024395 rab1A gene Proteins 0.000 description 2
- 108010036805 rap1 GTP-Binding Proteins Proteins 0.000 description 2
- 102000027426 receptor tyrosine kinases Human genes 0.000 description 2
- 108091008598 receptor tyrosine kinases Proteins 0.000 description 2
- 238000010188 recombinant method Methods 0.000 description 2
- 230000002829 reductive effect Effects 0.000 description 2
- 230000003252 repetitive effect Effects 0.000 description 2
- 230000010076 replication Effects 0.000 description 2
- 102000003702 retinoic acid receptors Human genes 0.000 description 2
- 108090000064 retinoic acid receptors Proteins 0.000 description 2
- 238000010839 reverse transcription Methods 0.000 description 2
- 238000012552 review Methods 0.000 description 2
- 108010033674 rho GTP-Binding Proteins Proteins 0.000 description 2
- 239000002336 ribonucleotide Substances 0.000 description 2
- 125000002652 ribonucleotide group Chemical group 0.000 description 2
- 230000007017 scission Effects 0.000 description 2
- 108091029842 small nuclear ribonucleic acid Proteins 0.000 description 2
- 239000011734 sodium Substances 0.000 description 2
- 239000007787 solid Substances 0.000 description 2
- 239000007790 solid phase Substances 0.000 description 2
- 108010064556 somatostatin receptor subtype-4 Proteins 0.000 description 2
- GGYTXJNZMFRSLX-DFTNLTQTSA-N somatostatin-28 Chemical compound N([C@@H](C)C(=O)N[C@@H](CCSC)C(=O)N[C@@H](C)C(=O)N1[C@@H](CCC1)C(=O)N[C@@H](CCCNC(N)=N)C(=O)N[C@@H](CCC(O)=O)C(=O)N[C@@H](CCCNC(N)=N)C(=O)N[C@@H](CCCCN)C(=O)N[C@@H](C)C(=O)NCC(=O)N[C@@H]1C(N[C@@H](CCCCN)C(=O)N[C@@H](CC(N)=O)C(=O)N[C@@H](CC=2C=CC=CC=2)C(=O)N[C@@H](CC=2C=CC=CC=2)C(=O)N[C@@H](CC=2C3=CC=CC=C3NC=2)C(=O)N[C@@H](CCCCN)C(=O)N[C@H](C(=O)N[C@@H](CC=2C=CC=CC=2)C(=O)N[C@H](C(=O)N[C@@H](CO)C(=O)N[C@@H](CSSC1)C(O)=O)[C@@H](C)O)[C@@H](C)O)=O)C(=O)[C@@H]1CCCN1C(=O)[C@H](CC(N)=O)NC(=O)[C@H](CO)NC(=O)[C@H](CC(N)=O)NC(=O)[C@H](C)NC(=O)[C@@H](N)CO GGYTXJNZMFRSLX-DFTNLTQTSA-N 0.000 description 2
- 238000010561 standard procedure Methods 0.000 description 2
- 238000007619 statistical method Methods 0.000 description 2
- 230000000638 stimulation Effects 0.000 description 2
- 239000000725 suspension Substances 0.000 description 2
- 238000012353 t test Methods 0.000 description 2
- 230000002381 testicular Effects 0.000 description 2
- 210000001550 testis Anatomy 0.000 description 2
- ZRKFYGHZFMAOKI-QMGMOQQFSA-N tgfbeta Chemical compound C([C@H](NC(=O)[C@H](C(C)C)NC(=O)CNC(=O)[C@H](CCC(O)=O)NC(=O)[C@H](CCCNC(N)=N)NC(=O)[C@H](CC(N)=O)NC(=O)[C@H](CC(C)C)NC(=O)[C@H]([C@@H](C)O)NC(=O)[C@H](CCC(O)=O)NC(=O)[C@H]([C@@H](C)O)NC(=O)[C@H](CC(C)C)NC(=O)CNC(=O)[C@H](C)NC(=O)[C@H](CO)NC(=O)[C@H](CCC(N)=O)NC(=O)[C@@H](NC(=O)[C@H](C)NC(=O)[C@H](C)NC(=O)[C@@H](NC(=O)[C@H](CC(C)C)NC(=O)[C@@H](N)CCSC)C(C)C)[C@@H](C)CC)C(=O)N[C@@H]([C@@H](C)O)C(=O)N[C@@H](C(C)C)C(=O)N[C@@H](CC=1C=CC=CC=1)C(=O)N[C@@H](C)C(=O)N1[C@@H](CCC1)C(=O)N[C@@H]([C@@H](C)O)C(=O)N[C@@H](CC(N)=O)C(=O)N[C@@H](CCC(O)=O)C(=O)N[C@@H](C)C(=O)N[C@@H](CC=1C=CC=CC=1)C(=O)N[C@@H](CCCNC(N)=N)C(=O)N[C@@H](C)C(=O)N[C@@H](CC(C)C)C(=O)N1[C@@H](CCC1)C(=O)N1[C@@H](CCC1)C(=O)N[C@@H](CCCNC(N)=N)C(=O)N[C@@H](CCC(O)=O)C(=O)N[C@@H](CCCNC(N)=N)C(=O)N[C@@H](CO)C(=O)N[C@@H](CCCNC(N)=N)C(=O)N[C@@H](CC(C)C)C(=O)N[C@@H](CC(C)C)C(O)=O)C1=CC=C(O)C=C1 ZRKFYGHZFMAOKI-QMGMOQQFSA-N 0.000 description 2
- 229940124597 therapeutic agent Drugs 0.000 description 2
- 108010060803 thrombospondin 3 Proteins 0.000 description 2
- 238000013519 translation Methods 0.000 description 2
- 238000000539 two dimensional gel electrophoresis Methods 0.000 description 2
- 241000701161 unidentified adenovirus Species 0.000 description 2
- 241000701447 unidentified baculovirus Species 0.000 description 2
- 238000011144 upstream manufacturing Methods 0.000 description 2
- 210000002700 urine Anatomy 0.000 description 2
- VBEQCZHXXJYVRD-GACYYNSASA-N uroanthelone Chemical compound C([C@@H](C(=O)N[C@H](C(=O)N[C@@H](CS)C(=O)N[C@@H](CC(N)=O)C(=O)N[C@@H](CS)C(=O)N[C@H](C(=O)N[C@@H]([C@@H](C)CC)C(=O)NCC(=O)N[C@@H](CC=1C=CC(O)=CC=1)C(=O)N[C@@H](CO)C(=O)NCC(=O)N[C@@H](CC(O)=O)C(=O)N[C@@H](CCCNC(N)=N)C(=O)N[C@@H](CS)C(=O)N[C@@H](CCC(N)=O)C(=O)N[C@@H]([C@@H](C)O)C(=O)N[C@@H](CCCNC(N)=N)C(=O)N[C@@H](CC(O)=O)C(=O)N[C@@H](CC(C)C)C(=O)N[C@@H](CCCNC(N)=N)C(=O)N[C@@H](CC=1C2=CC=CC=C2NC=1)C(=O)N[C@@H](CC=1C2=CC=CC=C2NC=1)C(=O)N[C@@H](CCC(O)=O)C(=O)N[C@@H](CC(C)C)C(=O)N[C@@H](CCCNC(N)=N)C(O)=O)C(C)C)[C@@H](C)O)NC(=O)[C@H](CO)NC(=O)[C@H](CC(O)=O)NC(=O)[C@H](CC(C)C)NC(=O)[C@H](CO)NC(=O)[C@H](CCC(O)=O)NC(=O)[C@@H](NC(=O)[C@H](CC=1NC=NC=1)NC(=O)[C@H](CCSC)NC(=O)[C@H](CS)NC(=O)[C@@H](NC(=O)CNC(=O)CNC(=O)[C@H](CC(N)=O)NC(=O)[C@H](CC(C)C)NC(=O)[C@H](CS)NC(=O)[C@H](CC=1C=CC(O)=CC=1)NC(=O)CNC(=O)[C@H](CC(O)=O)NC(=O)[C@H](CC=1C=CC(O)=CC=1)NC(=O)[C@H](CO)NC(=O)[C@H](CO)NC(=O)[C@H]1N(CCC1)C(=O)[C@H](CS)NC(=O)CNC(=O)[C@H]1N(CCC1)C(=O)[C@H](CC=1C=CC(O)=CC=1)NC(=O)[C@H](CO)NC(=O)[C@@H](N)CC(N)=O)C(C)C)[C@@H](C)CC)C1=CC=C(O)C=C1 VBEQCZHXXJYVRD-GACYYNSASA-N 0.000 description 2
- 229960005356 urokinase Drugs 0.000 description 2
- 238000010200 validation analysis Methods 0.000 description 2
- 210000002071 ventral thalamic nuclei Anatomy 0.000 description 2
- 230000003612 virological effect Effects 0.000 description 2
- DIGQNXIGRZPYDK-WKSCXVIASA-N (2R)-6-amino-2-[[2-[[(2S)-2-[[2-[[(2R)-2-[[(2S)-2-[[(2R,3S)-2-[[2-[[(2S)-2-[[2-[[(2S)-2-[[(2S)-2-[[(2R)-2-[[(2S,3S)-2-[[(2R)-2-[[(2S)-2-[[(2S)-2-[[(2S)-2-[[2-[[(2S)-2-[[(2R)-2-[[2-[[2-[[2-[(2-amino-1-hydroxyethylidene)amino]-3-carboxy-1-hydroxypropylidene]amino]-1-hydroxy-3-sulfanylpropylidene]amino]-1-hydroxyethylidene]amino]-1-hydroxy-3-sulfanylpropylidene]amino]-1,3-dihydroxypropylidene]amino]-1-hydroxyethylidene]amino]-1-hydroxypropylidene]amino]-1,3-dihydroxypropylidene]amino]-1,3-dihydroxypropylidene]amino]-1-hydroxy-3-sulfanylpropylidene]amino]-1,3-dihydroxybutylidene]amino]-1-hydroxy-3-sulfanylpropylidene]amino]-1-hydroxypropylidene]amino]-1,3-dihydroxypropylidene]amino]-1-hydroxyethylidene]amino]-1,5-dihydroxy-5-iminopentylidene]amino]-1-hydroxy-3-sulfanylpropylidene]amino]-1,3-dihydroxybutylidene]amino]-1-hydroxy-3-sulfanylpropylidene]amino]-1,3-dihydroxypropylidene]amino]-1-hydroxyethylidene]amino]-1-hydroxy-3-sulfanylpropylidene]amino]-1-hydroxyethylidene]amino]hexanoic acid Chemical compound C[C@@H]([C@@H](C(=N[C@@H](CS)C(=N[C@@H](C)C(=N[C@@H](CO)C(=NCC(=N[C@@H](CCC(=N)O)C(=NC(CS)C(=N[C@H]([C@H](C)O)C(=N[C@H](CS)C(=N[C@H](CO)C(=NCC(=N[C@H](CS)C(=NCC(=N[C@H](CCCCN)C(=O)O)O)O)O)O)O)O)O)O)O)O)O)O)O)N=C([C@H](CS)N=C([C@H](CO)N=C([C@H](CO)N=C([C@H](C)N=C(CN=C([C@H](CO)N=C([C@H](CS)N=C(CN=C(C(CS)N=C(C(CC(=O)O)N=C(CN)O)O)O)O)O)O)O)O)O)O)O)O DIGQNXIGRZPYDK-WKSCXVIASA-N 0.000 description 1
- YUXKOWPNKJSTPQ-AXWWPMSFSA-N (2s,3r)-2-amino-3-hydroxybutanoic acid;(2s)-2-amino-3-hydroxypropanoic acid Chemical compound OC[C@H](N)C(O)=O.C[C@@H](O)[C@H](N)C(O)=O YUXKOWPNKJSTPQ-AXWWPMSFSA-N 0.000 description 1
- DEQANNDTNATYII-OULOTJBUSA-N (4r,7s,10s,13r,16s,19r)-10-(4-aminobutyl)-19-[[(2r)-2-amino-3-phenylpropanoyl]amino]-16-benzyl-n-[(2r,3r)-1,3-dihydroxybutan-2-yl]-7-[(1r)-1-hydroxyethyl]-13-(1h-indol-3-ylmethyl)-6,9,12,15,18-pentaoxo-1,2-dithia-5,8,11,14,17-pentazacycloicosane-4-carboxa Chemical compound C([C@@H](N)C(=O)N[C@H]1CSSC[C@H](NC(=O)[C@H]([C@@H](C)O)NC(=O)[C@H](CCCCN)NC(=O)[C@@H](CC=2C3=CC=CC=C3NC=2)NC(=O)[C@H](CC=2C=CC=CC=2)NC1=O)C(=O)N[C@H](CO)[C@H](O)C)C1=CC=CC=C1 DEQANNDTNATYII-OULOTJBUSA-N 0.000 description 1
- WRIDQFICGBMAFQ-UHFFFAOYSA-N (E)-8-Octadecenoic acid Natural products CCCCCCCCCC=CCCCCCCC(O)=O WRIDQFICGBMAFQ-UHFFFAOYSA-N 0.000 description 1
- 102000040650 (ribonucleotides)n+m Human genes 0.000 description 1
- 108010029190 1-Phosphatidylinositol 4-Kinase Proteins 0.000 description 1
- 102000001556 1-Phosphatidylinositol 4-Kinase Human genes 0.000 description 1
- 102100026205 1-phosphatidylinositol 4,5-bisphosphate phosphodiesterase gamma-1 Human genes 0.000 description 1
- 102100027831 14-3-3 protein theta Human genes 0.000 description 1
- 101710108995 14-3-3 protein theta Proteins 0.000 description 1
- 108020004463 18S ribosomal RNA Proteins 0.000 description 1
- GOJUJUVQIVIZAV-UHFFFAOYSA-N 2-amino-4,6-dichloropyrimidine-5-carbaldehyde Chemical group NC1=NC(Cl)=C(C=O)C(Cl)=N1 GOJUJUVQIVIZAV-UHFFFAOYSA-N 0.000 description 1
- 108010090195 2-carboxybenzaldehyde reductase Proteins 0.000 description 1
- WRFPVMFCRNYQNR-UHFFFAOYSA-N 2-hydroxyphenylalanine Chemical compound OC(=O)C(N)CC1=CC=CC=C1O WRFPVMFCRNYQNR-UHFFFAOYSA-N 0.000 description 1
- LQJBNNIYVWPHFW-UHFFFAOYSA-N 20:1omega9c fatty acid Natural products CCCCCCCCCCC=CCCCCCCCC(O)=O LQJBNNIYVWPHFW-UHFFFAOYSA-N 0.000 description 1
- 102100032282 26S proteasome non-ATPase regulatory subunit 14 Human genes 0.000 description 1
- 102100033828 26S proteasome regulatory subunit 10B Human genes 0.000 description 1
- 102100029829 28S ribosomal protein S29, mitochondrial Human genes 0.000 description 1
- 108020005065 3' Flanking Region Proteins 0.000 description 1
- 108020005345 3' Untranslated Regions Proteins 0.000 description 1
- 102100026105 3-ketoacyl-CoA thiolase, mitochondrial Human genes 0.000 description 1
- 101710174731 3-ketoacyl-CoA thiolase, mitochondrial Proteins 0.000 description 1
- OSWFIVFLDKOXQC-UHFFFAOYSA-N 4-(3-methoxyphenyl)aniline Chemical compound COC1=CC=CC(C=2C=CC(N)=CC=2)=C1 OSWFIVFLDKOXQC-UHFFFAOYSA-N 0.000 description 1
- FWMNVWWHGCHHJJ-SKKKGAJSSA-N 4-amino-1-[(2r)-6-amino-2-[[(2r)-2-[[(2r)-2-[[(2r)-2-amino-3-phenylpropanoyl]amino]-3-phenylpropanoyl]amino]-4-methylpentanoyl]amino]hexanoyl]piperidine-4-carboxylic acid Chemical compound C([C@H](C(=O)N[C@H](CC(C)C)C(=O)N[C@H](CCCCN)C(=O)N1CCC(N)(CC1)C(O)=O)NC(=O)[C@H](N)CC=1C=CC=CC=1)C1=CC=CC=C1 FWMNVWWHGCHHJJ-SKKKGAJSSA-N 0.000 description 1
- 102100033646 40-kDa huntingtin-associated protein Human genes 0.000 description 1
- 101710126334 40-kDa huntingtin-associated protein Proteins 0.000 description 1
- 102100039882 40S ribosomal protein S17 Human genes 0.000 description 1
- 108020003589 5' Untranslated Regions Proteins 0.000 description 1
- 102000018727 5-Aminolevulinate Synthetase Human genes 0.000 description 1
- 108010052384 5-Aminolevulinate Synthetase Proteins 0.000 description 1
- 102100035916 60S ribosomal protein L11 Human genes 0.000 description 1
- 102100036126 60S ribosomal protein L37a Human genes 0.000 description 1
- 102100030982 60S ribosomal protein L38 Human genes 0.000 description 1
- 101150101112 7 gene Proteins 0.000 description 1
- 101710191936 70 kDa protein Proteins 0.000 description 1
- QSBYPNXLFMSGKH-UHFFFAOYSA-N 9-Heptadecensaeure Natural products CCCCCCCC=CCCCCCCCC(O)=O QSBYPNXLFMSGKH-UHFFFAOYSA-N 0.000 description 1
- 102100023818 ADP-ribosylation factor 3 Human genes 0.000 description 1
- 102100023826 ADP-ribosylation factor 4 Human genes 0.000 description 1
- 101710139741 ADP-ribosylation factor 4 Proteins 0.000 description 1
- 102100036610 AN1-type zinc finger protein 5 Human genes 0.000 description 1
- 102100034482 AP-1 complex subunit beta-1 Human genes 0.000 description 1
- 101710166029 AP-1 complex subunit beta-1 Proteins 0.000 description 1
- 102100022974 AP-2 complex subunit alpha-2 Human genes 0.000 description 1
- 102100033347 AP-2 complex subunit beta Human genes 0.000 description 1
- 102000000872 ATM Human genes 0.000 description 1
- 102000004482 ATP Translocases Mitochondrial ADP Human genes 0.000 description 1
- 108010017236 ATP Translocases Mitochondrial ADP Proteins 0.000 description 1
- 108010022579 ATP dependent 26S protease Proteins 0.000 description 1
- 102100027782 ATP synthase-coupling factor 6, mitochondrial Human genes 0.000 description 1
- 101710162331 ATP synthase-coupling factor 6, mitochondrial Proteins 0.000 description 1
- 102100032922 ATP-dependent 6-phosphofructokinase, muscle type Human genes 0.000 description 1
- 102100022413 ATP-dependent RNA helicase DHX30 Human genes 0.000 description 1
- 102100030089 ATP-dependent RNA helicase DHX8 Human genes 0.000 description 1
- 108040000931 ATP:ADP antiporter activity proteins Proteins 0.000 description 1
- 102000023805 ATP:ADP antiporter activity proteins Human genes 0.000 description 1
- 102100024825 ATPase MORC2 Human genes 0.000 description 1
- 101150020330 ATRX gene Proteins 0.000 description 1
- 240000005020 Acaciella glauca Species 0.000 description 1
- 208000002874 Acne Vulgaris Diseases 0.000 description 1
- 101710159080 Aconitate hydratase A Proteins 0.000 description 1
- 101710159078 Aconitate hydratase B Proteins 0.000 description 1
- 206010000599 Acromegaly Diseases 0.000 description 1
- 102000004373 Actin-related protein 2 Human genes 0.000 description 1
- 108090000963 Actin-related protein 2 Proteins 0.000 description 1
- 102100038820 Actin-related protein 2/3 complex subunit 1B Human genes 0.000 description 1
- 102100036464 Activated RNA polymerase II transcriptional coactivator p15 Human genes 0.000 description 1
- 101710111216 Activated RNA polymerase II transcriptional coactivator p15 Proteins 0.000 description 1
- 102100038740 Activator of RNA decay Human genes 0.000 description 1
- 102000011767 Acute-Phase Proteins Human genes 0.000 description 1
- 108010062271 Acute-Phase Proteins Proteins 0.000 description 1
- 108030001653 Adamalysin Proteins 0.000 description 1
- 102000034473 Adamalysin Human genes 0.000 description 1
- 108010087905 Adenovirus E1B Proteins Proteins 0.000 description 1
- 102100032157 Adenylate cyclase type 10 Human genes 0.000 description 1
- 101710136834 Adenylyl cyclase-associated protein Proteins 0.000 description 1
- 102100039736 Adhesion G protein-coupled receptor L1 Human genes 0.000 description 1
- 102400001318 Adrenomedullin Human genes 0.000 description 1
- 101800004616 Adrenomedullin Proteins 0.000 description 1
- 102100028443 Aflatoxin B1 aldehyde reductase member 2 Human genes 0.000 description 1
- 102100027211 Albumin Human genes 0.000 description 1
- 108010088751 Albumins Proteins 0.000 description 1
- 102000005602 Aldo-Keto Reductases Human genes 0.000 description 1
- 108010084469 Aldo-Keto Reductases Proteins 0.000 description 1
- 108091023043 Alu Element Proteins 0.000 description 1
- 108090000531 Amidohydrolases Proteins 0.000 description 1
- 102000004092 Amidohydrolases Human genes 0.000 description 1
- 102000013455 Amyloid beta-Peptides Human genes 0.000 description 1
- 108010090849 Amyloid beta-Peptides Proteins 0.000 description 1
- 241000272525 Anas platyrhynchos Species 0.000 description 1
- 102000009088 Angiopoietin-1 Human genes 0.000 description 1
- 108010048154 Angiopoietin-1 Proteins 0.000 description 1
- 102000009840 Angiopoietins Human genes 0.000 description 1
- 108010009906 Angiopoietins Proteins 0.000 description 1
- 102100034609 Ankyrin repeat domain-containing protein 17 Human genes 0.000 description 1
- 102100034613 Annexin A2 Human genes 0.000 description 1
- 108090000668 Annexin A2 Proteins 0.000 description 1
- 108090000656 Annexin A6 Proteins 0.000 description 1
- 102100021253 Antileukoproteinase Human genes 0.000 description 1
- 101710170876 Antileukoproteinase Proteins 0.000 description 1
- 108020005544 Antisense RNA Proteins 0.000 description 1
- 102000007592 Apolipoproteins Human genes 0.000 description 1
- 108010071619 Apolipoproteins Proteins 0.000 description 1
- 102100021986 Apoptosis-stimulating of p53 protein 2 Human genes 0.000 description 1
- 101000910349 Arabidopsis thaliana CDPK-related kinase 5 Proteins 0.000 description 1
- 101100153168 Arabidopsis thaliana TIC21 gene Proteins 0.000 description 1
- 241000384062 Armadillo Species 0.000 description 1
- 108010014223 Armadillo Domain Proteins Proteins 0.000 description 1
- 206010003445 Ascites Diseases 0.000 description 1
- DCXYFEDJOCDNAF-UHFFFAOYSA-N Asparagine Natural products OC(=O)C(N)CC(N)=O DCXYFEDJOCDNAF-UHFFFAOYSA-N 0.000 description 1
- 108010004586 Ataxia Telangiectasia Mutated Proteins Proteins 0.000 description 1
- 208000037260 Atherosclerotic Plaque Diseases 0.000 description 1
- 102100039339 Atrial natriuretic peptide receptor 1 Human genes 0.000 description 1
- 101710102163 Atrial natriuretic peptide receptor 1 Proteins 0.000 description 1
- 241000972773 Aulopiformes Species 0.000 description 1
- 102000003989 Aurora kinases Human genes 0.000 description 1
- 108090000433 Aurora kinases Proteins 0.000 description 1
- 208000023275 Autoimmune disease Diseases 0.000 description 1
- 102100032426 B-cell CLL/lymphoma 7 protein family member B Human genes 0.000 description 1
- 102100035656 BCL2/adenovirus E1B 19 kDa protein-interacting protein 3 Human genes 0.000 description 1
- 239000010754 BS 2869 Class F Substances 0.000 description 1
- 244000063299 Bacillus subtilis Species 0.000 description 1
- 235000014469 Bacillus subtilis Nutrition 0.000 description 1
- 108010027344 Basic Helix-Loop-Helix Transcription Factors Proteins 0.000 description 1
- 102000018720 Basic Helix-Loop-Helix Transcription Factors Human genes 0.000 description 1
- 102100023973 Bax inhibitor 1 Human genes 0.000 description 1
- 102100038495 Bile acid receptor Human genes 0.000 description 1
- 101710128505 Bile acid receptor Proteins 0.000 description 1
- 102100021961 Bis(5'-adenosyl)-triphosphatase ENPP4 Human genes 0.000 description 1
- 108010039209 Blood Coagulation Factors Proteins 0.000 description 1
- 102000015081 Blood Coagulation Factors Human genes 0.000 description 1
- 108010073466 Bombesin Receptors Proteins 0.000 description 1
- 208000010392 Bone Fractures Diseases 0.000 description 1
- 108010049931 Bone Morphogenetic Protein 2 Proteins 0.000 description 1
- 102000004152 Bone morphogenetic protein 1 Human genes 0.000 description 1
- 108090000654 Bone morphogenetic protein 1 Proteins 0.000 description 1
- 102100028726 Bone morphogenetic protein 10 Human genes 0.000 description 1
- 101710118482 Bone morphogenetic protein 10 Proteins 0.000 description 1
- 102100024506 Bone morphogenetic protein 2 Human genes 0.000 description 1
- 108030001720 Bontoxilysin Proteins 0.000 description 1
- 241000283690 Bos taurus Species 0.000 description 1
- 108091003079 Bovine Serum Albumin Proteins 0.000 description 1
- 208000003174 Brain Neoplasms Diseases 0.000 description 1
- 241000195940 Bryophyta Species 0.000 description 1
- 206010006811 Bursitis Diseases 0.000 description 1
- FERIUCNNQQJTOY-UHFFFAOYSA-M Butyrate Chemical compound CCCC([O-])=O FERIUCNNQQJTOY-UHFFFAOYSA-M 0.000 description 1
- FERIUCNNQQJTOY-UHFFFAOYSA-N Butyric acid Natural products CCCC(O)=O FERIUCNNQQJTOY-UHFFFAOYSA-N 0.000 description 1
- 101710117545 C protein Proteins 0.000 description 1
- 102100021943 C-C motif chemokine 2 Human genes 0.000 description 1
- 108010074051 C-Reactive Protein Proteins 0.000 description 1
- 102100028990 C-X-C chemokine receptor type 3 Human genes 0.000 description 1
- 102100031650 C-X-C chemokine receptor type 4 Human genes 0.000 description 1
- 125000001433 C-terminal amino-acid group Chemical group 0.000 description 1
- 102000053028 CD36 Antigens Human genes 0.000 description 1
- 108010045374 CD36 Antigens Proteins 0.000 description 1
- 108010040163 CREB-Binding Protein Proteins 0.000 description 1
- 102100021975 CREB-binding protein Human genes 0.000 description 1
- 108010069682 CSK Tyrosine-Protein Kinase Proteins 0.000 description 1
- 102000000905 Cadherin Human genes 0.000 description 1
- 108050007957 Cadherin Proteins 0.000 description 1
- 102000014818 Cadherin-13 Human genes 0.000 description 1
- 102100024154 Cadherin-13 Human genes 0.000 description 1
- 241000252983 Caecum Species 0.000 description 1
- 101000741929 Caenorhabditis elegans Serine/threonine-protein phosphatase 2A catalytic subunit Proteins 0.000 description 1
- 101100124795 Caenorhabditis elegans hsp-110 gene Proteins 0.000 description 1
- 101100252357 Caenorhabditis elegans rnp-1 gene Proteins 0.000 description 1
- 101710165661 Calcitonin-3 Proteins 0.000 description 1
- 102100025926 Calmodulin-3 Human genes 0.000 description 1
- 101710164738 Calmodulin-3 Proteins 0.000 description 1
- 102000004082 Calreticulin Human genes 0.000 description 1
- 108090000549 Calreticulin Proteins 0.000 description 1
- KLWPJMFMVPTNCC-UHFFFAOYSA-N Camptothecin Natural products CCC1(O)C(=O)OCC2=C1C=C3C4Nc5ccccc5C=C4CN3C2=O KLWPJMFMVPTNCC-UHFFFAOYSA-N 0.000 description 1
- 101001024441 Candida albicans (strain SC5314 / ATCC MYA-2876) Major facilitator superfamily multidrug transporter NAG3 Proteins 0.000 description 1
- 241000282472 Canis lupus familiaris Species 0.000 description 1
- 102100033868 Cannabinoid receptor 1 Human genes 0.000 description 1
- 101710187010 Cannabinoid receptor 1 Proteins 0.000 description 1
- 241000283707 Capra Species 0.000 description 1
- 101710132601 Capsid protein Proteins 0.000 description 1
- 208000024172 Cardiovascular disease Diseases 0.000 description 1
- 108010078791 Carrier Proteins Proteins 0.000 description 1
- 108090000994 Catalytic RNA Proteins 0.000 description 1
- 102000053642 Catalytic RNA Human genes 0.000 description 1
- 102100028914 Catenin beta-1 Human genes 0.000 description 1
- 102100025064 Cellular tumor antigen p53 Human genes 0.000 description 1
- 102100036179 Centrosomal protein of 170 kDa Human genes 0.000 description 1
- 102000016078 Chaperonin Containing TCP-1 Human genes 0.000 description 1
- 108010010706 Chaperonin Containing TCP-1 Proteins 0.000 description 1
- 102000009410 Chemokine receptor Human genes 0.000 description 1
- 108050000299 Chemokine receptor Proteins 0.000 description 1
- 102100038196 Chitinase-3-like protein 1 Human genes 0.000 description 1
- 101710128223 Chloride channel protein Proteins 0.000 description 1
- 101800001982 Cholecystokinin Proteins 0.000 description 1
- 102100025841 Cholecystokinin Human genes 0.000 description 1
- 108010089335 Cholecystokinin A Receptor Proteins 0.000 description 1
- 108010089448 Cholecystokinin B Receptor Proteins 0.000 description 1
- 108010009685 Cholinergic Receptors Proteins 0.000 description 1
- 102100025566 Chymotrypsin-like protease CTRL-1 Human genes 0.000 description 1
- 102100034467 Clathrin light chain A Human genes 0.000 description 1
- 101710093541 Clathrin light chain A Proteins 0.000 description 1
- 108010060434 Co-Repressor Proteins Proteins 0.000 description 1
- 102000008169 Co-Repressor Proteins Human genes 0.000 description 1
- 102100030972 Coatomer subunit beta Human genes 0.000 description 1
- 101710186199 Coatomer subunit beta Proteins 0.000 description 1
- 102000005870 Coenzyme A Ligases Human genes 0.000 description 1
- 102100037078 Complement component 1 Q subcomponent-binding protein, mitochondrial Human genes 0.000 description 1
- 108091035707 Consensus sequence Proteins 0.000 description 1
- 102000018361 Contactin Human genes 0.000 description 1
- 108060003955 Contactin Proteins 0.000 description 1
- 108010072732 Core Binding Factors Proteins 0.000 description 1
- 102000006990 Core Binding Factors Human genes 0.000 description 1
- 102100034528 Core histone macro-H2A.1 Human genes 0.000 description 1
- 102100038018 Corticotropin-releasing factor receptor 1 Human genes 0.000 description 1
- 102000016736 Cyclin Human genes 0.000 description 1
- 108010068192 Cyclin A Proteins 0.000 description 1
- 108010058544 Cyclin D2 Proteins 0.000 description 1
- 108090000264 Cyclin I Proteins 0.000 description 1
- 102000003907 Cyclin I Human genes 0.000 description 1
- 102100025191 Cyclin-A2 Human genes 0.000 description 1
- 108010024986 Cyclin-Dependent Kinase 2 Proteins 0.000 description 1
- 108010025454 Cyclin-Dependent Kinase 5 Proteins 0.000 description 1
- 102000009506 Cyclin-Dependent Kinase Inhibitor p19 Human genes 0.000 description 1
- 108010009361 Cyclin-Dependent Kinase Inhibitor p19 Proteins 0.000 description 1
- 108010016777 Cyclin-Dependent Kinase Inhibitor p27 Proteins 0.000 description 1
- 102000000577 Cyclin-Dependent Kinase Inhibitor p27 Human genes 0.000 description 1
- 108010017222 Cyclin-Dependent Kinase Inhibitor p57 Proteins 0.000 description 1
- 102000004480 Cyclin-Dependent Kinase Inhibitor p57 Human genes 0.000 description 1
- 102100038254 Cyclin-F Human genes 0.000 description 1
- 102100036239 Cyclin-dependent kinase 2 Human genes 0.000 description 1
- 102100033269 Cyclin-dependent kinase inhibitor 1C Human genes 0.000 description 1
- 102100026805 Cyclin-dependent-like kinase 5 Human genes 0.000 description 1
- 102100026846 Cytidine deaminase Human genes 0.000 description 1
- 108010031325 Cytidine deaminase Proteins 0.000 description 1
- 102100025287 Cytochrome b Human genes 0.000 description 1
- 102100039441 Cytochrome b-c1 complex subunit 2, mitochondrial Human genes 0.000 description 1
- 101710195468 Cytochrome b-c1 complex subunit 2, mitochondrial Proteins 0.000 description 1
- 102100030497 Cytochrome c Human genes 0.000 description 1
- 101710118142 Cytochrome c oxidase polypeptide VIIc Proteins 0.000 description 1
- 102100028202 Cytochrome c oxidase subunit 6C Human genes 0.000 description 1
- 101710198061 Cytochrome c oxidase subunit 6C Proteins 0.000 description 1
- 101710090949 Cytochrome c oxidase subunit 7C, mitochondrial Proteins 0.000 description 1
- 102100030512 Cytochrome c oxidase subunit 7C, mitochondrial Human genes 0.000 description 1
- 108010075028 Cytochromes b Proteins 0.000 description 1
- 108010075031 Cytochromes c Proteins 0.000 description 1
- 102000004127 Cytokines Human genes 0.000 description 1
- 108090000695 Cytokines Proteins 0.000 description 1
- 102100039221 Cytoplasmic polyadenylation element-binding protein 3 Human genes 0.000 description 1
- QNAYBMKLOCPYGJ-UWTATZPHSA-N D-alanine Chemical compound C[C@@H](N)C(O)=O QNAYBMKLOCPYGJ-UWTATZPHSA-N 0.000 description 1
- QNAYBMKLOCPYGJ-UHFFFAOYSA-N D-alpha-Ala Natural products CC([NH3+])C([O-])=O QNAYBMKLOCPYGJ-UHFFFAOYSA-N 0.000 description 1
- 102100025280 DENN domain-containing protein 4B Human genes 0.000 description 1
- 102100025267 DENN domain-containing protein 5A Human genes 0.000 description 1
- 108010001132 DNA Polymerase beta Proteins 0.000 description 1
- 108090000133 DNA helicases Proteins 0.000 description 1
- 102000003844 DNA helicases Human genes 0.000 description 1
- 238000000018 DNA microarray Methods 0.000 description 1
- 102100022302 DNA polymerase beta Human genes 0.000 description 1
- 108700036833 DNA polymerase zeta Proteins 0.000 description 1
- 102000052510 DNA-Binding Proteins Human genes 0.000 description 1
- 230000004568 DNA-binding Effects 0.000 description 1
- 101710096438 DNA-binding protein Proteins 0.000 description 1
- 102100039439 DNA-binding protein inhibitor ID-4 Human genes 0.000 description 1
- 101710152058 DNA-binding protein inhibitor ID-4 Proteins 0.000 description 1
- 108090000626 DNA-directed RNA polymerases Proteins 0.000 description 1
- 102000004163 DNA-directed RNA polymerases Human genes 0.000 description 1
- 101001031598 Dictyostelium discoideum Probable serine/threonine-protein kinase fhkC Proteins 0.000 description 1
- 101800001224 Disintegrin Proteins 0.000 description 1
- 102100034110 DnaJ homolog subfamily C member 16 Human genes 0.000 description 1
- 102100031605 Dolichol kinase Human genes 0.000 description 1
- 102000004073 Dopamine D3 Receptors Human genes 0.000 description 1
- 108090000525 Dopamine D3 Receptors Proteins 0.000 description 1
- 241000255581 Drosophila <fruit fly, genus> Species 0.000 description 1
- 108700003614 Drosophila ben Proteins 0.000 description 1
- 108700027743 Drosophila esc Proteins 0.000 description 1
- 241000255601 Drosophila melanogaster Species 0.000 description 1
- 101001081251 Drosophila melanogaster Protein held out wings Proteins 0.000 description 1
- 101100015729 Drosophila melanogaster drk gene Proteins 0.000 description 1
- 108700001011 Drosophila mnb Proteins 0.000 description 1
- 108700041764 Drosophila tud Proteins 0.000 description 1
- 102100023274 Dual specificity mitogen-activated protein kinase kinase 4 Human genes 0.000 description 1
- 101710146518 Dual specificity mitogen-activated protein kinase kinase 4 Proteins 0.000 description 1
- 102100023272 Dual specificity mitogen-activated protein kinase kinase 5 Human genes 0.000 description 1
- 101710146524 Dual specificity mitogen-activated protein kinase kinase 5 Proteins 0.000 description 1
- 102100027272 Dual specificity protein phosphatase 8 Human genes 0.000 description 1
- 108030004793 Dual-specificity kinases Proteins 0.000 description 1
- 102100025682 Dystroglycan 1 Human genes 0.000 description 1
- 108010069091 Dystrophin Proteins 0.000 description 1
- 108010036466 E2F2 Transcription Factor Proteins 0.000 description 1
- 102100021739 E3 ubiquitin-protein ligase BRE1B Human genes 0.000 description 1
- 102100037994 E3 ubiquitin-protein ligase MGRN1 Human genes 0.000 description 1
- 102100021820 E3 ubiquitin-protein ligase RNF4 Human genes 0.000 description 1
- 102100021810 E3 ubiquitin-protein ligase RNF6 Human genes 0.000 description 1
- 102100040068 E3 ubiquitin-protein ligase TRIM37 Human genes 0.000 description 1
- LTLYEAJONXGNFG-DCAQKATOSA-N E64 Chemical compound NC(=N)NCCCCNC(=O)[C@H](CC(C)C)NC(=O)[C@H]1O[C@@H]1C(O)=O LTLYEAJONXGNFG-DCAQKATOSA-N 0.000 description 1
- KCXVZYZYPLLWCC-UHFFFAOYSA-N EDTA Chemical compound OC(=O)CN(CC(O)=O)CCN(CC(O)=O)CC(O)=O KCXVZYZYPLLWCC-UHFFFAOYSA-N 0.000 description 1
- 102100029652 EH domain-binding protein 1 Human genes 0.000 description 1
- 238000002965 ELISA Methods 0.000 description 1
- 101710199711 Early E1A protein Proteins 0.000 description 1
- 108010089760 Electron Transport Complex I Proteins 0.000 description 1
- 102000008013 Electron Transport Complex I Human genes 0.000 description 1
- 102100040897 Embryonic growth/differentiation factor 1 Human genes 0.000 description 1
- 241000196324 Embryophyta Species 0.000 description 1
- 102000013128 Endothelin B Receptor Human genes 0.000 description 1
- 108010090557 Endothelin B Receptor Proteins 0.000 description 1
- 102100023721 Ephrin-B2 Human genes 0.000 description 1
- 108010044090 Ephrin-B2 Proteins 0.000 description 1
- 102400001368 Epidermal growth factor Human genes 0.000 description 1
- 101800003838 Epidermal growth factor Proteins 0.000 description 1
- 102100030083 Epsin-2 Human genes 0.000 description 1
- 241000283086 Equidae Species 0.000 description 1
- 241000588724 Escherichia coli Species 0.000 description 1
- 101100127166 Escherichia coli (strain K12) kefB gene Proteins 0.000 description 1
- 208000032027 Essential Thrombocythemia Diseases 0.000 description 1
- 102100023236 Eukaryotic translation initiation factor 3 subunit G Human genes 0.000 description 1
- 101710109055 Eukaryotic translation initiation factor 3 subunit G Proteins 0.000 description 1
- 102100039466 Eukaryotic translation initiation factor 5B Human genes 0.000 description 1
- 102100039540 Exocyst complex component 7 Human genes 0.000 description 1
- 208000005917 Exostoses Diseases 0.000 description 1
- 102100035976 Exostosin-like 3 Human genes 0.000 description 1
- 108010007457 Extracellular Signal-Regulated MAP Kinases Proteins 0.000 description 1
- 101710165567 Extracellular signal-regulated kinase 1 Proteins 0.000 description 1
- 108091008794 FGF receptors Proteins 0.000 description 1
- 241000282326 Felis catus Species 0.000 description 1
- 101100058548 Felis catus BMI1 gene Proteins 0.000 description 1
- 102100023600 Fibroblast growth factor receptor 2 Human genes 0.000 description 1
- 101710182389 Fibroblast growth factor receptor 2 Proteins 0.000 description 1
- 229920001917 Ficoll Polymers 0.000 description 1
- 238000000729 Fisher's exact test Methods 0.000 description 1
- 102100027627 Follicle-stimulating hormone receptor Human genes 0.000 description 1
- 102100029379 Follistatin-related protein 3 Human genes 0.000 description 1
- 102100041002 Forkhead box protein H1 Human genes 0.000 description 1
- 102100035128 Forkhead box protein J3 Human genes 0.000 description 1
- 241000700662 Fowlpox virus Species 0.000 description 1
- 241000233866 Fungi Species 0.000 description 1
- 102000034353 G alpha subunit Human genes 0.000 description 1
- 108091006099 G alpha subunit Proteins 0.000 description 1
- 102100024185 G1/S-specific cyclin-D2 Human genes 0.000 description 1
- 102100037854 G1/S-specific cyclin-E2 Human genes 0.000 description 1
- 101710082961 GATA-binding factor 2 Proteins 0.000 description 1
- 102000011852 GATA2 Transcription Factor Human genes 0.000 description 1
- 108010075641 GATA2 Transcription Factor Proteins 0.000 description 1
- 102100022688 GATOR complex protein DEPDC5 Human genes 0.000 description 1
- 102000031618 GDP binding proteins Human genes 0.000 description 1
- 108091009874 GDP binding proteins Proteins 0.000 description 1
- 102000009596 GDP-dissociation inhibitor activity proteins Human genes 0.000 description 1
- 229940122242 GTPase inhibitor Drugs 0.000 description 1
- 108010027920 GTPase-Activating Proteins Proteins 0.000 description 1
- 102100031351 Galectin-9 Human genes 0.000 description 1
- 101710121810 Galectin-9 Proteins 0.000 description 1
- 241000287828 Gallus gallus Species 0.000 description 1
- 102100022510 Gamma-aminobutyric acid receptor-associated protein-like 2 Human genes 0.000 description 1
- 101710106568 Gamma-aminobutyric acid receptor-associated protein-like 2 Proteins 0.000 description 1
- 102000052874 Gastrin receptors Human genes 0.000 description 1
- 102100030671 Gastrin-releasing peptide receptor Human genes 0.000 description 1
- 108700028146 Genetic Enhancer Elements Proteins 0.000 description 1
- 108010026318 Geranyltranstransferase Proteins 0.000 description 1
- 102000013404 Geranyltranstransferase Human genes 0.000 description 1
- 208000010412 Glaucoma Diseases 0.000 description 1
- 206010018338 Glioma Diseases 0.000 description 1
- 101710166358 Globin-1 Proteins 0.000 description 1
- 102000051325 Glucagon Human genes 0.000 description 1
- 108060003199 Glucagon Proteins 0.000 description 1
- 108010063919 Glucagon Receptors Proteins 0.000 description 1
- 102100040890 Glucagon receptor Human genes 0.000 description 1
- 102000018899 Glutamate Receptors Human genes 0.000 description 1
- 108010027915 Glutamate Receptors Proteins 0.000 description 1
- 102100022761 Glutamate receptor ionotropic, kainate 5 Human genes 0.000 description 1
- 101710112356 Glutamate receptor ionotropic, kainate 5 Proteins 0.000 description 1
- 108010093474 Glutamine-phenylpyruvate transaminase Proteins 0.000 description 1
- 102100023523 Glutathione S-transferase Mu 4 Human genes 0.000 description 1
- 102000005720 Glutathione transferase Human genes 0.000 description 1
- 108010070675 Glutathione transferase Proteins 0.000 description 1
- 102000002254 Glycogen Synthase Kinase 3 Human genes 0.000 description 1
- 108010014905 Glycogen Synthase Kinase 3 Proteins 0.000 description 1
- 239000000579 Gonadotropin-Releasing Hormone Substances 0.000 description 1
- 108010017080 Granulocyte Colony-Stimulating Factor Proteins 0.000 description 1
- 102100039619 Granulocyte colony-stimulating factor Human genes 0.000 description 1
- 102100039620 Granulocyte-macrophage colony-stimulating factor Human genes 0.000 description 1
- 108010090296 Growth Differentiation Factor 1 Proteins 0.000 description 1
- 108010051696 Growth Hormone Proteins 0.000 description 1
- 206010056438 Growth hormone deficiency Diseases 0.000 description 1
- 108010067218 Guanine Nucleotide Exchange Factors Proteins 0.000 description 1
- 102000016285 Guanine Nucleotide Exchange Factors Human genes 0.000 description 1
- 108020004202 Guanylate Kinase Proteins 0.000 description 1
- 102100028685 H(+)/Cl(-) exchange transporter 7 Human genes 0.000 description 1
- 102100039330 HMG box-containing protein 1 Human genes 0.000 description 1
- 101150022862 HSC70 gene Proteins 0.000 description 1
- 108010032952 HSP110 Heat-Shock Proteins Proteins 0.000 description 1
- 102000007369 HSP110 Heat-Shock Proteins Human genes 0.000 description 1
- 101100082540 Haemophilus influenzae (strain ATCC 51907 / DSM 11121 / KW20 / Rd) pcp gene Proteins 0.000 description 1
- 208000032759 Hemolytic-Uremic Syndrome Diseases 0.000 description 1
- 102100029283 Hepatocyte nuclear factor 3-alpha Human genes 0.000 description 1
- 102100027706 Heterogeneous nuclear ribonucleoprotein D-like Human genes 0.000 description 1
- 101710090093 Heterogeneous nuclear ribonucleoprotein D-like Proteins 0.000 description 1
- 102100028896 Heterogeneous nuclear ribonucleoprotein Q Human genes 0.000 description 1
- 101710141313 Heterogeneous nuclear ribonucleoprotein Q Proteins 0.000 description 1
- 102100023999 Heterogeneous nuclear ribonucleoprotein R Human genes 0.000 description 1
- 102100030338 Hexokinase-1 Human genes 0.000 description 1
- 102100031336 High mobility group nucleosome-binding domain-containing protein 3 Human genes 0.000 description 1
- 102100022128 High mobility group protein B2 Human genes 0.000 description 1
- 101710168540 High mobility group protein B2 Proteins 0.000 description 1
- 101710103773 Histone H2B Proteins 0.000 description 1
- 102100021639 Histone H2B type 1-K Human genes 0.000 description 1
- 102100039236 Histone H3.3 Human genes 0.000 description 1
- 102100021455 Histone deacetylase 3 Human genes 0.000 description 1
- 108010033040 Histones Proteins 0.000 description 1
- 108700005087 Homeobox Genes Proteins 0.000 description 1
- 102100032822 Homeodomain-interacting protein kinase 1 Human genes 0.000 description 1
- 101000691599 Homo sapiens 1-phosphatidylinositol 4,5-bisphosphate phosphodiesterase gamma-1 Proteins 0.000 description 1
- 101000590281 Homo sapiens 26S proteasome non-ATPase regulatory subunit 14 Proteins 0.000 description 1
- 101001135226 Homo sapiens 26S proteasome non-ATPase regulatory subunit 5 Proteins 0.000 description 1
- 101001135306 Homo sapiens 26S proteasome non-ATPase regulatory subunit 6 Proteins 0.000 description 1
- 101001069718 Homo sapiens 26S proteasome regulatory subunit 10B Proteins 0.000 description 1
- 101000727490 Homo sapiens 28S ribosomal protein S29, mitochondrial Proteins 0.000 description 1
- 101000899406 Homo sapiens 45 kDa calcium-binding protein Proteins 0.000 description 1
- 101001127039 Homo sapiens 60S ribosomal protein L38 Proteins 0.000 description 1
- 101000684275 Homo sapiens ADP-ribosylation factor 3 Proteins 0.000 description 1
- 101000684189 Homo sapiens ADP-ribosylation factor 4 Proteins 0.000 description 1
- 101100056291 Homo sapiens AKR7A2 gene Proteins 0.000 description 1
- 101000757394 Homo sapiens AP-2 complex subunit alpha-2 Proteins 0.000 description 1
- 101000732341 Homo sapiens AP-2 complex subunit beta Proteins 0.000 description 1
- 101000783770 Homo sapiens ATP-binding cassette sub-family D member 3 Proteins 0.000 description 1
- 101000730838 Homo sapiens ATP-dependent 6-phosphofructokinase, muscle type Proteins 0.000 description 1
- 101000743497 Homo sapiens ATP-dependent DNA helicase Q5 Proteins 0.000 description 1
- 101000901948 Homo sapiens ATP-dependent RNA helicase DHX30 Proteins 0.000 description 1
- 101000864666 Homo sapiens ATP-dependent RNA helicase DHX8 Proteins 0.000 description 1
- 101001051808 Homo sapiens ATPase MORC2 Proteins 0.000 description 1
- 101000806644 Homo sapiens Actin-related protein 2/3 complex subunit 1A Proteins 0.000 description 1
- 101000809459 Homo sapiens Actin-related protein 2/3 complex subunit 1B Proteins 0.000 description 1
- 101000741919 Homo sapiens Activator of RNA decay Proteins 0.000 description 1
- 101000796941 Homo sapiens Adenosine kinase Proteins 0.000 description 1
- 101000775498 Homo sapiens Adenylate cyclase type 10 Proteins 0.000 description 1
- 101000959588 Homo sapiens Adhesion G protein-coupled receptor L1 Proteins 0.000 description 1
- 101000779309 Homo sapiens Amyloid protein-binding protein 2 Proteins 0.000 description 1
- 101000936534 Homo sapiens Anion exchange protein 3 Proteins 0.000 description 1
- 101000924481 Homo sapiens Ankyrin repeat domain-containing protein 17 Proteins 0.000 description 1
- 101000752711 Homo sapiens Apoptosis-stimulating of p53 protein 2 Proteins 0.000 description 1
- 101000678879 Homo sapiens Atypical chemokine receptor 1 Proteins 0.000 description 1
- 101000798484 Homo sapiens B-cell CLL/lymphoma 7 protein family member B Proteins 0.000 description 1
- 101000803294 Homo sapiens BCL2/adenovirus E1B 19 kDa protein-interacting protein 3 Proteins 0.000 description 1
- 101000903937 Homo sapiens Bax inhibitor 1 Proteins 0.000 description 1
- 101000897056 Homo sapiens Bis(5'-adenosyl)-triphosphatase ENPP4 Proteins 0.000 description 1
- 101000713083 Homo sapiens C-C motif chemokine 22 Proteins 0.000 description 1
- 101000916050 Homo sapiens C-X-C chemokine receptor type 3 Proteins 0.000 description 1
- 101000922348 Homo sapiens C-X-C chemokine receptor type 4 Proteins 0.000 description 1
- 101100369037 Homo sapiens CCT8 gene Proteins 0.000 description 1
- 101000738354 Homo sapiens CD9 antigen Proteins 0.000 description 1
- 101100273813 Homo sapiens CDKN1A gene Proteins 0.000 description 1
- 101000943456 Homo sapiens Calcium and integrin-binding family member 2 Proteins 0.000 description 1
- 101000715694 Homo sapiens Centrosomal protein of 170 kDa Proteins 0.000 description 1
- 101000883515 Homo sapiens Chitinase-3-like protein 1 Proteins 0.000 description 1
- 101000932701 Homo sapiens Cholecystokinin Proteins 0.000 description 1
- 101000776619 Homo sapiens Choriogonadotropin subunit beta 3 Proteins 0.000 description 1
- 101000741348 Homo sapiens Chromatin assembly factor 1 subunit A Proteins 0.000 description 1
- 101000856199 Homo sapiens Chymotrypsin-like protease CTRL-1 Proteins 0.000 description 1
- 101000740725 Homo sapiens Complement component 1 Q subcomponent-binding protein, mitochondrial Proteins 0.000 description 1
- 101000878678 Homo sapiens Corticotropin-releasing factor receptor 1 Proteins 0.000 description 1
- 101000880187 Homo sapiens Craniofacial development protein 1 Proteins 0.000 description 1
- 101000884183 Homo sapiens Cyclin-F Proteins 0.000 description 1
- 101000944380 Homo sapiens Cyclin-dependent kinase inhibitor 1 Proteins 0.000 description 1
- 101000944365 Homo sapiens Cyclin-dependent kinase inhibitor 1C Proteins 0.000 description 1
- 101000777693 Homo sapiens Cytidine and dCMP deaminase domain-containing protein 1 Proteins 0.000 description 1
- 101000912053 Homo sapiens Cytidine deaminase Proteins 0.000 description 1
- 101000919466 Homo sapiens Cytochrome c oxidase subunit 7A-related protein, mitochondrial Proteins 0.000 description 1
- 101000745755 Homo sapiens Cytoplasmic polyadenylation element-binding protein 3 Proteins 0.000 description 1
- 101100442764 Homo sapiens DDX1 gene Proteins 0.000 description 1
- 101000722282 Homo sapiens DENN domain-containing protein 4B Proteins 0.000 description 1
- 101000722275 Homo sapiens DENN domain-containing protein 5A Proteins 0.000 description 1
- 101001080484 Homo sapiens DNA replication complex GINS protein PSF1 Proteins 0.000 description 1
- 101000955042 Homo sapiens Deoxycytidylate deaminase Proteins 0.000 description 1
- 101000870184 Homo sapiens DnaJ homolog subfamily C member 16 Proteins 0.000 description 1
- 101000845698 Homo sapiens Dolichol kinase Proteins 0.000 description 1
- 101001014196 Homo sapiens Dual specificity mitogen-activated protein kinase kinase 1 Proteins 0.000 description 1
- 101000749291 Homo sapiens Dual specificity protein kinase CLK2 Proteins 0.000 description 1
- 101001057604 Homo sapiens Dual specificity protein phosphatase 8 Proteins 0.000 description 1
- 101000855983 Homo sapiens Dystroglycan 1 Proteins 0.000 description 1
- 101000896080 Homo sapiens E3 ubiquitin-protein ligase BRE1B Proteins 0.000 description 1
- 101000951423 Homo sapiens E3 ubiquitin-protein ligase MGRN1 Proteins 0.000 description 1
- 101001107086 Homo sapiens E3 ubiquitin-protein ligase RNF4 Proteins 0.000 description 1
- 101001107079 Homo sapiens E3 ubiquitin-protein ligase RNF6 Proteins 0.000 description 1
- 101000610400 Homo sapiens E3 ubiquitin-protein ligase TRIM37 Proteins 0.000 description 1
- 101001012951 Homo sapiens EH domain-binding protein 1 Proteins 0.000 description 1
- 101000880998 Homo sapiens ER membrane protein complex subunit 2 Proteins 0.000 description 1
- 101100226362 Homo sapiens EXTL3 gene Proteins 0.000 description 1
- 101000632553 Homo sapiens Endophilin-A2 Proteins 0.000 description 1
- 101001012093 Homo sapiens Epsin-2 Proteins 0.000 description 1
- 101001054360 Homo sapiens Eukaryotic translation initiation factor 4H Proteins 0.000 description 1
- 101001002481 Homo sapiens Eukaryotic translation initiation factor 5 Proteins 0.000 description 1
- 101001036496 Homo sapiens Eukaryotic translation initiation factor 5B Proteins 0.000 description 1
- 101000813489 Homo sapiens Exocyst complex component 7 Proteins 0.000 description 1
- 101000862396 Homo sapiens Follicle-stimulating hormone receptor Proteins 0.000 description 1
- 101001062529 Homo sapiens Follistatin-related protein 3 Proteins 0.000 description 1
- 101000892840 Homo sapiens Forkhead box protein H1 Proteins 0.000 description 1
- 101001023387 Homo sapiens Forkhead box protein J3 Proteins 0.000 description 1
- 101000738575 Homo sapiens G1/S-specific cyclin-E2 Proteins 0.000 description 1
- 101001044724 Homo sapiens GATOR complex protein DEPDC5 Proteins 0.000 description 1
- 101001001372 Homo sapiens Gamma-aminobutyric acid receptor-associated protein Proteins 0.000 description 1
- 101000616435 Homo sapiens Gamma-sarcoglycan Proteins 0.000 description 1
- 101001034527 Homo sapiens Glutamate-cysteine ligase catalytic subunit Proteins 0.000 description 1
- 101000906399 Homo sapiens Glutathione S-transferase Mu 4 Proteins 0.000 description 1
- 101001038874 Homo sapiens Glycoprotein hormones alpha chain Proteins 0.000 description 1
- 101000746373 Homo sapiens Granulocyte-macrophage colony-stimulating factor Proteins 0.000 description 1
- 101001035846 Homo sapiens HMG box-containing protein 1 Proteins 0.000 description 1
- 101000897700 Homo sapiens Helix-loop-helix protein 2 Proteins 0.000 description 1
- 101001062353 Homo sapiens Hepatocyte nuclear factor 3-alpha Proteins 0.000 description 1
- 101001047853 Homo sapiens Heterogeneous nuclear ribonucleoprotein R Proteins 0.000 description 1
- 101000866771 Homo sapiens High mobility group nucleosome-binding domain-containing protein 3 Proteins 0.000 description 1
- 101001035011 Homo sapiens Histone deacetylase 2 Proteins 0.000 description 1
- 101000899282 Homo sapiens Histone deacetylase 3 Proteins 0.000 description 1
- 101001032118 Homo sapiens Histone deacetylase 8 Proteins 0.000 description 1
- 101000596925 Homo sapiens Homeobox protein TGIF1 Proteins 0.000 description 1
- 101001066404 Homo sapiens Homeodomain-interacting protein kinase 1 Proteins 0.000 description 1
- 101100508472 Homo sapiens IGSF3 gene Proteins 0.000 description 1
- 101001037256 Homo sapiens Indoleamine 2,3-dioxygenase 1 Proteins 0.000 description 1
- 101001078149 Homo sapiens Integrin alpha-10 Proteins 0.000 description 1
- 101001034842 Homo sapiens Interferon-induced transmembrane protein 2 Proteins 0.000 description 1
- 101001033233 Homo sapiens Interleukin-10 Proteins 0.000 description 1
- 101001006782 Homo sapiens Kinesin-associated protein 3 Proteins 0.000 description 1
- 101001054659 Homo sapiens Latent-transforming growth factor beta-binding protein 1 Proteins 0.000 description 1
- 101000984200 Homo sapiens Leukocyte immunoglobulin-like receptor subfamily A member 3 Proteins 0.000 description 1
- 101000942701 Homo sapiens Liprin-alpha-3 Proteins 0.000 description 1
- 101000972291 Homo sapiens Lymphoid enhancer-binding factor 1 Proteins 0.000 description 1
- 101000966782 Homo sapiens Lysophosphatidic acid receptor 1 Proteins 0.000 description 1
- 101001059644 Homo sapiens MAP kinase-activating death domain protein Proteins 0.000 description 1
- 101001051810 Homo sapiens MORC family CW-type zinc finger protein 3 Proteins 0.000 description 1
- 101001051152 Homo sapiens Major intrinsically disordered Notch2-binding receptor 1 Proteins 0.000 description 1
- 101001000302 Homo sapiens Max-interacting protein 1 Proteins 0.000 description 1
- 101000694615 Homo sapiens Membrane primary amine oxidase Proteins 0.000 description 1
- 101000578830 Homo sapiens Methionine aminopeptidase 1 Proteins 0.000 description 1
- 101001046529 Homo sapiens Mevalonate kinase Proteins 0.000 description 1
- 101000962664 Homo sapiens Microtubule-associated protein RP/EB family member 1 Proteins 0.000 description 1
- 101000957756 Homo sapiens Microtubule-associated protein RP/EB family member 2 Proteins 0.000 description 1
- 101000623667 Homo sapiens Mitochondrial carrier homolog 1 Proteins 0.000 description 1
- 101000648395 Homo sapiens Mitochondrial import receptor subunit TOM70 Proteins 0.000 description 1
- 101000950710 Homo sapiens Mitogen-activated protein kinase 6 Proteins 0.000 description 1
- 101000992748 Homo sapiens Mortality factor 4-like protein 2 Proteins 0.000 description 1
- 101000955254 Homo sapiens Multiple epidermal growth factor-like domains protein 9 Proteins 0.000 description 1
- 101000583839 Homo sapiens Muscleblind-like protein 1 Proteins 0.000 description 1
- 101000829958 Homo sapiens N-acetyllactosaminide beta-1,6-N-acetylglucosaminyl-transferase Proteins 0.000 description 1
- 101100026471 Homo sapiens NIPSNAP2 gene Proteins 0.000 description 1
- 101000588247 Homo sapiens Nascent polypeptide-associated complex subunit alpha Proteins 0.000 description 1
- 101000953653 Homo sapiens Neurosecretory protein VGF Proteins 0.000 description 1
- 101000998855 Homo sapiens Nicotinamide phosphoribosyltransferase Proteins 0.000 description 1
- 101001109719 Homo sapiens Nucleophosmin Proteins 0.000 description 1
- 101001121636 Homo sapiens Nucleoporin p58/p45 Proteins 0.000 description 1
- 101001128739 Homo sapiens Nucleoside diphosphate kinase 6 Proteins 0.000 description 1
- 101000982376 Homo sapiens Oligodendrocyte-myelin glycoprotein Proteins 0.000 description 1
- 101001122035 Homo sapiens Ornithine aminotransferase, mitochondrial Proteins 0.000 description 1
- 101000598781 Homo sapiens Oxidative stress-responsive serine-rich protein 1 Proteins 0.000 description 1
- 101001099381 Homo sapiens Peroxisomal biogenesis factor 19 Proteins 0.000 description 1
- 101000869517 Homo sapiens Phosphatidylinositol-3-phosphatase SAC1 Proteins 0.000 description 1
- 101000583553 Homo sapiens Phosphoglucomutase-1 Proteins 0.000 description 1
- 101000595923 Homo sapiens Placenta growth factor Proteins 0.000 description 1
- 101000735358 Homo sapiens Poly(rC)-binding protein 2 Proteins 0.000 description 1
- 101001134844 Homo sapiens Pre-mRNA cleavage complex 2 protein Pcf11 Proteins 0.000 description 1
- 101000914035 Homo sapiens Pre-mRNA-splicing regulator WTAP Proteins 0.000 description 1
- 101000742143 Homo sapiens Prenylated Rab acceptor protein 1 Proteins 0.000 description 1
- 101000864678 Homo sapiens Probable ATP-dependent RNA helicase DHX37 Proteins 0.000 description 1
- 101000836337 Homo sapiens Probable helicase senataxin Proteins 0.000 description 1
- 101000734646 Homo sapiens Programmed cell death protein 6 Proteins 0.000 description 1
- 101000738940 Homo sapiens Proline-rich nuclear receptor coactivator 1 Proteins 0.000 description 1
- 101000592466 Homo sapiens Proteasome subunit beta type-4 Proteins 0.000 description 1
- 101000933604 Homo sapiens Protein BTG2 Proteins 0.000 description 1
- 101001048947 Homo sapiens Protein FAM189B Proteins 0.000 description 1
- 101001046603 Homo sapiens Protein KIBRA Proteins 0.000 description 1
- 101001068634 Homo sapiens Protein PRRC2A Proteins 0.000 description 1
- 101001078674 Homo sapiens Putative heat shock 70 kDa protein 7 Proteins 0.000 description 1
- 101100247335 Homo sapiens RAB11B gene Proteins 0.000 description 1
- 101000668168 Homo sapiens RNA-binding motif, single-stranded-interacting protein 3 Proteins 0.000 description 1
- 101001061518 Homo sapiens RNA-binding protein FUS Proteins 0.000 description 1
- 101000604114 Homo sapiens RNA-binding protein Nova-1 Proteins 0.000 description 1
- 101000739046 Homo sapiens RNA-binding protein PNO1 Proteins 0.000 description 1
- 101000994790 Homo sapiens Ras GTPase-activating-like protein IQGAP2 Proteins 0.000 description 1
- 101000712958 Homo sapiens Ras association domain-containing protein 1 Proteins 0.000 description 1
- 101000620798 Homo sapiens Ras-related protein Rab-11A Proteins 0.000 description 1
- 101000620529 Homo sapiens Ras-related protein Rab-13 Proteins 0.000 description 1
- 101001132279 Homo sapiens Ras-related protein Rab-2A Proteins 0.000 description 1
- 101001100204 Homo sapiens Ras-related protein Rab-40A-like Proteins 0.000 description 1
- 101001077409 Homo sapiens Ras-related protein Rab-5B Proteins 0.000 description 1
- 101001077405 Homo sapiens Ras-related protein Rab-5C Proteins 0.000 description 1
- 101001130441 Homo sapiens Ras-related protein Rap-2a Proteins 0.000 description 1
- 101001130437 Homo sapiens Ras-related protein Rap-2b Proteins 0.000 description 1
- 101000584593 Homo sapiens Receptor activity-modifying protein 3 Proteins 0.000 description 1
- 101000606545 Homo sapiens Receptor-type tyrosine-protein phosphatase F Proteins 0.000 description 1
- 101000591205 Homo sapiens Receptor-type tyrosine-protein phosphatase mu Proteins 0.000 description 1
- 101001075488 Homo sapiens Regulator of G-protein signaling 19 Proteins 0.000 description 1
- 101000703242 Homo sapiens Regulator of G-protein signaling 9 Proteins 0.000 description 1
- 101000727472 Homo sapiens Reticulon-4 Proteins 0.000 description 1
- 101000742859 Homo sapiens Retinoblastoma-associated protein Proteins 0.000 description 1
- 101000666607 Homo sapiens Rho-related BTB domain-containing protein 3 Proteins 0.000 description 1
- 101000686685 Homo sapiens Ribonuclease P protein subunit p14 Proteins 0.000 description 1
- 101001010890 Homo sapiens S-formylglutathione hydrolase Proteins 0.000 description 1
- 101000836005 Homo sapiens S-phase kinase-associated protein 1 Proteins 0.000 description 1
- 101000825404 Homo sapiens SH2 domain-containing adapter protein B Proteins 0.000 description 1
- 101000588007 Homo sapiens SPARC-like protein 1 Proteins 0.000 description 1
- 101000873645 Homo sapiens Secretory carrier-associated membrane protein 3 Proteins 0.000 description 1
- 101000644537 Homo sapiens Sequestosome-1 Proteins 0.000 description 1
- 101001098464 Homo sapiens Serine/threonine-protein kinase OSR1 Proteins 0.000 description 1
- 101000709250 Homo sapiens Serine/threonine-protein kinase SIK2 Proteins 0.000 description 1
- 101000654491 Homo sapiens Serine/threonine-protein kinase SIK3 Proteins 0.000 description 1
- 101000611254 Homo sapiens Serine/threonine-protein phosphatase 2B catalytic subunit beta isoform Proteins 0.000 description 1
- 101000829012 Homo sapiens Signal peptidase complex subunit 2 Proteins 0.000 description 1
- 101000628899 Homo sapiens Small ubiquitin-related modifier 1 Proteins 0.000 description 1
- 101000974834 Homo sapiens Sodium/potassium-transporting ATPase subunit beta-3 Proteins 0.000 description 1
- 101000652224 Homo sapiens Suppressor of cytokine signaling 5 Proteins 0.000 description 1
- 101000652229 Homo sapiens Suppressor of cytokine signaling 7 Proteins 0.000 description 1
- 101000828537 Homo sapiens Synaptic functional regulator FMR1 Proteins 0.000 description 1
- 101000640289 Homo sapiens Synemin Proteins 0.000 description 1
- 101000934346 Homo sapiens T-cell surface antigen CD2 Proteins 0.000 description 1
- 101000652484 Homo sapiens TBC1 domain family member 9 Proteins 0.000 description 1
- 101100480759 Homo sapiens TBP gene Proteins 0.000 description 1
- 101000835665 Homo sapiens TRPM8 channel-associated factor 1 Proteins 0.000 description 1
- 101000658624 Homo sapiens Testis-specific Y-encoded-like protein 4 Proteins 0.000 description 1
- 101000633680 Homo sapiens Tetratricopeptide repeat protein 37 Proteins 0.000 description 1
- 101000662690 Homo sapiens Trafficking protein particle complex subunit 10 Proteins 0.000 description 1
- 101000904152 Homo sapiens Transcription factor E2F1 Proteins 0.000 description 1
- 101000866336 Homo sapiens Transcription factor E2F5 Proteins 0.000 description 1
- 101000664703 Homo sapiens Transcription factor SOX-10 Proteins 0.000 description 1
- 101000825010 Homo sapiens Transcription factor Sp3 Proteins 0.000 description 1
- 101000838169 Homo sapiens Transcription initiation factor IIA subunit 2 Proteins 0.000 description 1
- 101000638180 Homo sapiens Transmembrane emp24 domain-containing protein 2 Proteins 0.000 description 1
- 101000664599 Homo sapiens Tripartite motif-containing protein 2 Proteins 0.000 description 1
- 101000713575 Homo sapiens Tubulin beta-3 chain Proteins 0.000 description 1
- 101001052849 Homo sapiens Tyrosine-protein kinase Fer Proteins 0.000 description 1
- 101000997835 Homo sapiens Tyrosine-protein kinase JAK1 Proteins 0.000 description 1
- 101000606129 Homo sapiens Tyrosine-protein kinase receptor TYRO3 Proteins 0.000 description 1
- 101000607909 Homo sapiens Ubiquitin carboxyl-terminal hydrolase 1 Proteins 0.000 description 1
- 101000911513 Homo sapiens Uncharacterized protein FAM215A Proteins 0.000 description 1
- 101100317105 Homo sapiens VPS13B gene Proteins 0.000 description 1
- 101000808011 Homo sapiens Vascular endothelial growth factor A Proteins 0.000 description 1
- 101000742579 Homo sapiens Vascular endothelial growth factor B Proteins 0.000 description 1
- 101000743114 Homo sapiens WASH complex subunit 4 Proteins 0.000 description 1
- 101000650011 Homo sapiens WD repeat-containing protein 47 Proteins 0.000 description 1
- 101000781952 Homo sapiens Zinc finger C3H1 domain-containing protein Proteins 0.000 description 1
- 101000788845 Homo sapiens Zinc finger CCCH domain-containing protein 11A Proteins 0.000 description 1
- 101000781946 Homo sapiens Zinc finger CCCH domain-containing protein 4 Proteins 0.000 description 1
- 101000723833 Homo sapiens Zinc finger E-box-binding homeobox 2 Proteins 0.000 description 1
- 101000759188 Homo sapiens Zinc finger FYVE domain-containing protein 16 Proteins 0.000 description 1
- 101000788669 Homo sapiens Zinc finger MYM-type protein 2 Proteins 0.000 description 1
- 101000788741 Homo sapiens Zinc finger MYM-type protein 4 Proteins 0.000 description 1
- 101000976581 Homo sapiens Zinc finger protein 134 Proteins 0.000 description 1
- 101000976599 Homo sapiens Zinc finger protein 423 Proteins 0.000 description 1
- 101000976417 Homo sapiens Zinc finger protein 816 Proteins 0.000 description 1
- 101001026573 Homo sapiens cAMP-dependent protein kinase type I-alpha regulatory subunit Proteins 0.000 description 1
- 101000862627 Homo sapiens eIF-2-alpha kinase activator GCN1 Proteins 0.000 description 1
- 101000802094 Homo sapiens mRNA decay activator protein ZFP36L1 Proteins 0.000 description 1
- 101000802101 Homo sapiens mRNA decay activator protein ZFP36L2 Proteins 0.000 description 1
- 241001135569 Human adenovirus 5 Species 0.000 description 1
- 241000713772 Human immunodeficiency virus 1 Species 0.000 description 1
- UFHFLCQGNIYNRP-UHFFFAOYSA-N Hydrogen Chemical compound [H][H] UFHFLCQGNIYNRP-UHFFFAOYSA-N 0.000 description 1
- 102000004157 Hydrolases Human genes 0.000 description 1
- 108090000604 Hydrolases Proteins 0.000 description 1
- 208000035150 Hypercholesterolemia Diseases 0.000 description 1
- 206010060378 Hyperinsulinaemia Diseases 0.000 description 1
- 206010058490 Hyperoxia Diseases 0.000 description 1
- 206010020751 Hypersensitivity Diseases 0.000 description 1
- 206010020772 Hypertension Diseases 0.000 description 1
- 206010058359 Hypogonadism Diseases 0.000 description 1
- 206010021143 Hypoxia Diseases 0.000 description 1
- 102100022875 Hypoxia-inducible factor 1-alpha Human genes 0.000 description 1
- 108050009527 Hypoxia-inducible factor-1 alpha Proteins 0.000 description 1
- DGAQECJNVWCQMB-PUAWFVPOSA-M Ilexoside XXIX Chemical compound C[C@@H]1CC[C@@]2(CC[C@@]3(C(=CC[C@H]4[C@]3(CC[C@@H]5[C@@]4(CC[C@@H](C5(C)C)OS(=O)(=O)[O-])C)C)[C@@H]2[C@]1(C)O)C)C(=O)O[C@H]6[C@@H]([C@H]([C@@H]([C@H](O6)CO)O)O)O.[Na+] DGAQECJNVWCQMB-PUAWFVPOSA-M 0.000 description 1
- 102100022519 Immunoglobulin superfamily member 3 Human genes 0.000 description 1
- 102100040061 Indoleamine 2,3-dioxygenase 1 Human genes 0.000 description 1
- 102000004877 Insulin Human genes 0.000 description 1
- 108090001061 Insulin Proteins 0.000 description 1
- 102000003746 Insulin Receptor Human genes 0.000 description 1
- 108010001127 Insulin Receptor Proteins 0.000 description 1
- 108090001117 Insulin-Like Growth Factor II Proteins 0.000 description 1
- 108090000964 Insulin-like growth factor binding protein 2 Proteins 0.000 description 1
- 102100022710 Insulin-like growth factor-binding protein 2 Human genes 0.000 description 1
- 102000004369 Insulin-like growth factor-binding protein 4 Human genes 0.000 description 1
- 108090000969 Insulin-like growth factor-binding protein 4 Proteins 0.000 description 1
- 108010002352 Interleukin-1 Proteins 0.000 description 1
- 102000019223 Interleukin-1 receptor Human genes 0.000 description 1
- 108050006617 Interleukin-1 receptor Proteins 0.000 description 1
- 102100039068 Interleukin-10 Human genes 0.000 description 1
- 108010002386 Interleukin-3 Proteins 0.000 description 1
- 102000004388 Interleukin-4 Human genes 0.000 description 1
- 108090000978 Interleukin-4 Proteins 0.000 description 1
- 102000004310 Ion Channels Human genes 0.000 description 1
- 108090000862 Ion Channels Proteins 0.000 description 1
- 108010055717 JNK Mitogen-Activated Protein Kinases Proteins 0.000 description 1
- 102000019145 JUN kinase activity proteins Human genes 0.000 description 1
- 101150021395 JUND gene Proteins 0.000 description 1
- 102000049556 Jagged-1 Human genes 0.000 description 1
- 108010000837 Janus Kinase 1 Proteins 0.000 description 1
- 102100023408 KH domain-containing, RNA-binding, signal transduction-associated protein 1 Human genes 0.000 description 1
- 208000007766 Kaposi sarcoma Diseases 0.000 description 1
- 102100027930 Kinesin-associated protein 3 Human genes 0.000 description 1
- 102100023426 Kinesin-like protein KIF2A Human genes 0.000 description 1
- 101710134365 Kinesin-like protein KIF2A Proteins 0.000 description 1
- 241000235649 Kluyveromyces Species 0.000 description 1
- 102100021209 Kynurenine-oxoglutarate transaminase 1 Human genes 0.000 description 1
- ONIBWKKTOPOVIA-BYPYZUCNSA-N L-Proline Chemical compound OC(=O)[C@@H]1CCCN1 ONIBWKKTOPOVIA-BYPYZUCNSA-N 0.000 description 1
- QNAYBMKLOCPYGJ-REOHCLBHSA-N L-alanine Chemical compound C[C@H](N)C(O)=O QNAYBMKLOCPYGJ-REOHCLBHSA-N 0.000 description 1
- 125000000998 L-alanino group Chemical group [H]N([*])[C@](C([H])([H])[H])([H])C(=O)O[H] 0.000 description 1
- FBOZXECLQNJBKD-ZDUSSCGKSA-N L-methotrexate Chemical compound C=1N=C2N=C(N)N=C(N)C2=NC=1CN(C)C1=CC=C(C(=O)N[C@@H](CCC(O)=O)C(O)=O)C=C1 FBOZXECLQNJBKD-ZDUSSCGKSA-N 0.000 description 1
- QIVBCDIJIAJPQS-VIFPVBQESA-N L-tryptophane Chemical compound C1=CC=C2C(C[C@H](N)C(O)=O)=CNC2=C1 QIVBCDIJIAJPQS-VIFPVBQESA-N 0.000 description 1
- KZSNJWFQEVHDMF-BYPYZUCNSA-N L-valine Chemical compound CC(C)[C@H](N)C(O)=O KZSNJWFQEVHDMF-BYPYZUCNSA-N 0.000 description 1
- 101150066069 LANCL1 gene Proteins 0.000 description 1
- 102000008652 Lanthionine synthetase C-like Human genes 0.000 description 1
- 108050000440 Lanthionine synthetase C-like Proteins 0.000 description 1
- 102100027000 Latent-transforming growth factor beta-binding protein 1 Human genes 0.000 description 1
- 102000004856 Lectins Human genes 0.000 description 1
- 108090001090 Lectins Proteins 0.000 description 1
- ROHFNLRQFUQHCH-UHFFFAOYSA-N Leucine Natural products CC(C)CC(N)C(O)=O ROHFNLRQFUQHCH-UHFFFAOYSA-N 0.000 description 1
- 102100031036 Leucine-rich repeat-containing G-protein coupled receptor 5 Human genes 0.000 description 1
- 101710174256 Leucine-rich repeat-containing G-protein coupled receptor 5 Proteins 0.000 description 1
- 102100025556 Leukocyte immunoglobulin-like receptor subfamily A member 3 Human genes 0.000 description 1
- 102100032892 Liprin-alpha-3 Human genes 0.000 description 1
- 102100031955 Lon protease homolog, mitochondrial Human genes 0.000 description 1
- 101710167388 Lon protease homolog, mitochondrial Proteins 0.000 description 1
- 108010011449 Long-chain-fatty-acid-CoA ligase Proteins 0.000 description 1
- 108090001093 Lymphoid enhancer-binding factor 1 Proteins 0.000 description 1
- 206010025323 Lymphomas Diseases 0.000 description 1
- 239000004472 Lysine Substances 0.000 description 1
- 102100040607 Lysophosphatidic acid receptor 1 Human genes 0.000 description 1
- 102100023325 M-phase inducer phosphatase 2 Human genes 0.000 description 1
- 108010075639 MAP Kinase Kinase Kinase 5 Proteins 0.000 description 1
- 102000010049 MAP kinase kinase kinase kinase activity proteins Human genes 0.000 description 1
- 108040005742 MAP kinase kinase kinase kinase activity proteins Proteins 0.000 description 1
- 102100033610 MAP kinase-interacting serine/threonine-protein kinase 2 Human genes 0.000 description 1
- 101710138999 MAP kinase-interacting serine/threonine-protein kinase 2 Proteins 0.000 description 1
- 108010041955 MAP-kinase-activated kinase 2 Proteins 0.000 description 1
- 108700012928 MAPK14 Proteins 0.000 description 1
- 101150098805 MAPK6 gene Proteins 0.000 description 1
- 101150100520 MPV17 gene Proteins 0.000 description 1
- 241000829100 Macaca mulatta polyomavirus 1 Species 0.000 description 1
- 108010046938 Macrophage Colony-Stimulating Factor Proteins 0.000 description 1
- 102100028123 Macrophage colony-stimulating factor 1 Human genes 0.000 description 1
- FYYHWMGAXLPEAU-UHFFFAOYSA-N Magnesium Chemical compound [Mg] FYYHWMGAXLPEAU-UHFFFAOYSA-N 0.000 description 1
- 108700018351 Major Histocompatibility Complex Proteins 0.000 description 1
- 101710091439 Major capsid protein 1 Proteins 0.000 description 1
- 102100024589 Major intrinsically disordered Notch2-binding receptor 1 Human genes 0.000 description 1
- 102100024295 Maltase-glucoamylase Human genes 0.000 description 1
- 108010031099 Mannose Receptor Proteins 0.000 description 1
- 241001599018 Melanogaster Species 0.000 description 1
- 108010060408 Member 25 Tumor Necrosis Factor Receptors Proteins 0.000 description 1
- 102100027159 Membrane primary amine oxidase Human genes 0.000 description 1
- 206010066453 Mesangioproliferative glomerulonephritis Diseases 0.000 description 1
- 102000005741 Metalloproteases Human genes 0.000 description 1
- 108010006035 Metalloproteases Proteins 0.000 description 1
- 102000003792 Metallothionein Human genes 0.000 description 1
- 108090000157 Metallothionein Proteins 0.000 description 1
- 102100031603 Metaxin-1 Human genes 0.000 description 1
- 101710101647 Metaxin-1 Proteins 0.000 description 1
- 101710181812 Methionine aminopeptidase Proteins 0.000 description 1
- 102000006890 Methyl-CpG-Binding Protein 2 Human genes 0.000 description 1
- 108010072388 Methyl-CpG-Binding Protein 2 Proteins 0.000 description 1
- 102000002151 Microfilament Proteins Human genes 0.000 description 1
- 108010040897 Microfilament Proteins Proteins 0.000 description 1
- 108090000375 Mineralocorticoid Receptors Proteins 0.000 description 1
- 102100021316 Mineralocorticoid receptor Human genes 0.000 description 1
- 102100023198 Mitochondrial carrier homolog 1 Human genes 0.000 description 1
- 102100028811 Mitochondrial import receptor subunit TOM70 Human genes 0.000 description 1
- 101710111869 Mitochondrial phosphate carrier protein Proteins 0.000 description 1
- 108700027654 Mitogen-Activated Protein Kinase 10 Proteins 0.000 description 1
- 102100026931 Mitogen-activated protein kinase 10 Human genes 0.000 description 1
- 102100026932 Mitogen-activated protein kinase 12 Human genes 0.000 description 1
- 108700015929 Mitogen-activated protein kinase 12 Proteins 0.000 description 1
- 102100023482 Mitogen-activated protein kinase 14 Human genes 0.000 description 1
- 102100033127 Mitogen-activated protein kinase kinase kinase 5 Human genes 0.000 description 1
- 102100025748 Mothers against decapentaplegic homolog 3 Human genes 0.000 description 1
- 101710143111 Mothers against decapentaplegic homolog 3 Proteins 0.000 description 1
- 102100025725 Mothers against decapentaplegic homolog 4 Human genes 0.000 description 1
- 101710143112 Mothers against decapentaplegic homolog 4 Proteins 0.000 description 1
- 102100038989 Multiple epidermal growth factor-like domains protein 9 Human genes 0.000 description 1
- 241001529936 Murinae Species 0.000 description 1
- 101100058550 Mus musculus Bmi1 gene Proteins 0.000 description 1
- 101000878182 Mus musculus Fibroblast growth factor 15 Proteins 0.000 description 1
- 101000743586 Mus musculus Vacuolar protein sorting-associated protein 26A Proteins 0.000 description 1
- 102100038895 Myc proto-oncogene protein Human genes 0.000 description 1
- 101710135898 Myc proto-oncogene protein Proteins 0.000 description 1
- 102000006386 Myelin Proteins Human genes 0.000 description 1
- 108010083674 Myelin Proteins Proteins 0.000 description 1
- 102000003505 Myosin Human genes 0.000 description 1
- 108060008487 Myosin Proteins 0.000 description 1
- 102000026889 Myosin VIIa Human genes 0.000 description 1
- 108010009047 Myosin VIIa Proteins 0.000 description 1
- 206010068871 Myotonic dystrophy Diseases 0.000 description 1
- WGZDBVOTUVNQFP-UHFFFAOYSA-N N-(1-phthalazinylamino)carbamic acid ethyl ester Chemical compound C1=CC=C2C(NNC(=O)OCC)=NN=CC2=C1 WGZDBVOTUVNQFP-UHFFFAOYSA-N 0.000 description 1
- 230000004988 N-glycosylation Effects 0.000 description 1
- 102100026374 NADH dehydrogenase [ubiquinone] 1 alpha subcomplex subunit 7 Human genes 0.000 description 1
- 101710192703 NADH dehydrogenase [ubiquinone] 1 alpha subcomplex subunit 7 Proteins 0.000 description 1
- 102100037507 NADH dehydrogenase [ubiquinone] 1 beta subcomplex subunit 5, mitochondrial Human genes 0.000 description 1
- 101710097537 NADH dehydrogenase [ubiquinone] 1 beta subcomplex subunit 5, mitochondrial Proteins 0.000 description 1
- XJLXINKUBYWONI-NNYOXOHSSA-O NADP(+) Chemical compound NC(=O)C1=CC=C[N+]([C@H]2[C@@H]([C@H](O)[C@@H](COP(O)(=O)OP(O)(=O)OC[C@@H]3[C@H]([C@@H](OP(O)(O)=O)[C@@H](O3)N3C4=NC=NC(N)=C4N=C3)O)O2)O)=C1 XJLXINKUBYWONI-NNYOXOHSSA-O 0.000 description 1
- 108091061960 Naked DNA Proteins 0.000 description 1
- 206010028851 Necrosis Diseases 0.000 description 1
- 241000244206 Nematoda Species 0.000 description 1
- 229930193140 Neomycin Natural products 0.000 description 1
- 208000012902 Nervous system disease Diseases 0.000 description 1
- 108010069196 Neural Cell Adhesion Molecules Proteins 0.000 description 1
- 102100027347 Neural cell adhesion molecule 1 Human genes 0.000 description 1
- 108050003738 Neural cell adhesion molecule 1 Proteins 0.000 description 1
- 102100023616 Neural cell adhesion molecule L1-like protein Human genes 0.000 description 1
- 102400000058 Neuregulin-1 Human genes 0.000 description 1
- 108090000556 Neuregulin-1 Proteins 0.000 description 1
- 101800000675 Neuregulin-2 Proteins 0.000 description 1
- 208000009905 Neurofibromatoses Diseases 0.000 description 1
- 102000002710 Neurophysins Human genes 0.000 description 1
- 108010018674 Neurophysins Proteins 0.000 description 1
- 102100037571 Neurosecretory protein VGF Human genes 0.000 description 1
- 101100290388 Neurospora crassa (strain ATCC 24698 / 74-OR23-1A / CBS 708.71 / DSM 1257 / FGSC 987) rnp-2 gene Proteins 0.000 description 1
- 108010064862 Nicotinamide phosphoribosyltransferase Proteins 0.000 description 1
- 102000019315 Nicotinic acetylcholine receptors Human genes 0.000 description 1
- 108050006807 Nicotinic acetylcholine receptors Proteins 0.000 description 1
- 108010077641 Nogo Proteins Proteins 0.000 description 1
- 108010032109 Non-Receptor Type 12 Protein Tyrosine Phosphatase Proteins 0.000 description 1
- 101150056950 Ntrk2 gene Proteins 0.000 description 1
- 102000015863 Nuclear Factor 90 Proteins Human genes 0.000 description 1
- 108010010424 Nuclear Factor 90 Proteins Proteins 0.000 description 1
- 108091005461 Nucleic proteins Proteins 0.000 description 1
- 108010016076 Octreotide Proteins 0.000 description 1
- 239000005642 Oleic acid Substances 0.000 description 1
- ZQPPMHVWECSIRJ-UHFFFAOYSA-N Oleic acid Natural products CCCCCCCCC=CCCCCCCCC(O)=O ZQPPMHVWECSIRJ-UHFFFAOYSA-N 0.000 description 1
- 102000043276 Oncogene Human genes 0.000 description 1
- 208000005072 Oncogenic osteomalacia Diseases 0.000 description 1
- 108090000630 Oncostatin M Proteins 0.000 description 1
- 102000004140 Oncostatin M Human genes 0.000 description 1
- 102100021079 Ornithine decarboxylase Human genes 0.000 description 1
- 108700005126 Ornithine decarboxylases Proteins 0.000 description 1
- 101000615913 Oryza sativa subsp. japonica Mitogen-activated protein kinase kinase 1 Proteins 0.000 description 1
- 101710116435 Outer membrane protein Proteins 0.000 description 1
- 102100039983 PDZ domain-containing protein GIPC1 Human genes 0.000 description 1
- 101150051239 PEX3 gene Proteins 0.000 description 1
- 101150004854 PHEX gene Proteins 0.000 description 1
- 102000005327 Palmitoyl protein thioesterase Human genes 0.000 description 1
- 108020002591 Palmitoyl protein thioesterase Proteins 0.000 description 1
- 102000003982 Parathyroid hormone Human genes 0.000 description 1
- 108090000445 Parathyroid hormone Proteins 0.000 description 1
- 208000000733 Paroxysmal Hemoglobinuria Diseases 0.000 description 1
- 241001494479 Pecora Species 0.000 description 1
- 108010087702 Penicillinase Proteins 0.000 description 1
- 108010044843 Peptide Initiation Factors Proteins 0.000 description 1
- 102000005877 Peptide Initiation Factors Human genes 0.000 description 1
- 101800001442 Peptide pr Proteins 0.000 description 1
- 102100031166 Peripheral plasma membrane protein CASK Human genes 0.000 description 1
- 101710112366 Peripheral plasma membrane protein CASK Proteins 0.000 description 1
- 102100034601 Peroxidasin homolog Human genes 0.000 description 1
- 108090000709 Phakinin Proteins 0.000 description 1
- 102100035832 Phakinin Human genes 0.000 description 1
- 102100036050 Phosphatidylinositol N-acetylglucosaminyltransferase subunit A Human genes 0.000 description 1
- 102100032286 Phosphatidylinositol-3-phosphatase SAC1 Human genes 0.000 description 1
- 108010069341 Phosphofructokinases Proteins 0.000 description 1
- 102000001105 Phosphofructokinases Human genes 0.000 description 1
- 101710105361 Phosphoglucomutase 1 Proteins 0.000 description 1
- 102100030999 Phosphoglucomutase-1 Human genes 0.000 description 1
- 101710177166 Phosphoprotein Proteins 0.000 description 1
- 101710170343 Phosphoprotein 85 Proteins 0.000 description 1
- 102000045595 Phosphoprotein Phosphatases Human genes 0.000 description 1
- 108700019535 Phosphoprotein Phosphatases Proteins 0.000 description 1
- 102000007982 Phosphoproteins Human genes 0.000 description 1
- 108010089430 Phosphoproteins Proteins 0.000 description 1
- 101150056413 Pim1 gene Proteins 0.000 description 1
- 101710173952 Pinin Proteins 0.000 description 1
- 102000002808 Pituitary adenylate cyclase-activating polypeptide Human genes 0.000 description 1
- 101710129981 Pituitary-specific positive transcription factor 1 Proteins 0.000 description 1
- 102100035194 Placenta growth factor Human genes 0.000 description 1
- 206010035226 Plasma cell myeloma Diseases 0.000 description 1
- 108010077971 Plasminogen Inactivators Proteins 0.000 description 1
- 102000010752 Plasminogen Inactivators Human genes 0.000 description 1
- 102100037596 Platelet-derived growth factor subunit A Human genes 0.000 description 1
- 102100034961 Poly(rC)-binding protein 2 Human genes 0.000 description 1
- 108010022429 Polycomb-Group Proteins Proteins 0.000 description 1
- 102000012425 Polycomb-Group Proteins Human genes 0.000 description 1
- 239000002202 Polyethylene glycol Substances 0.000 description 1
- 229920001213 Polysorbate 20 Polymers 0.000 description 1
- 108010068086 Polyubiquitin Proteins 0.000 description 1
- 102100037935 Polyubiquitin-C Human genes 0.000 description 1
- 102100033427 Pre-mRNA cleavage complex 2 protein Pcf11 Human genes 0.000 description 1
- 108010071690 Prealbumin Proteins 0.000 description 1
- 102100038619 Prenylated Rab acceptor protein 1 Human genes 0.000 description 1
- 102100022668 Pro-neuregulin-2, membrane-bound isoform Human genes 0.000 description 1
- 102100030093 Probable ATP-dependent RNA helicase DHX37 Human genes 0.000 description 1
- 102100027178 Probable helicase senataxin Human genes 0.000 description 1
- 101710089369 Programmed cell death protein 6 Proteins 0.000 description 1
- ONIBWKKTOPOVIA-UHFFFAOYSA-N Proline Natural products OC(=O)C1CCCN1 ONIBWKKTOPOVIA-UHFFFAOYSA-N 0.000 description 1
- 102100037394 Proline-rich nuclear receptor coactivator 1 Human genes 0.000 description 1
- 102100033190 Proteasome subunit beta type-4 Human genes 0.000 description 1
- 102100036127 Proteasome subunit beta type-5 Human genes 0.000 description 1
- 101710094502 Proteasome subunit beta type-5 Proteins 0.000 description 1
- 102100026034 Protein BTG2 Human genes 0.000 description 1
- 102100023844 Protein FAM189B Human genes 0.000 description 1
- 102100022309 Protein KIBRA Human genes 0.000 description 1
- 102100022564 Protein NipSnap homolog 2 Human genes 0.000 description 1
- 101710130886 Protein PRRC2A Proteins 0.000 description 1
- 108010001267 Protein Subunits Proteins 0.000 description 1
- 102000002067 Protein Subunits Human genes 0.000 description 1
- 101710150593 Protein beta Proteins 0.000 description 1
- 102100032702 Protein jagged-1 Human genes 0.000 description 1
- 108700037966 Protein jagged-1 Proteins 0.000 description 1
- 102000006831 Protein phosphatase 2C Human genes 0.000 description 1
- 108010047313 Protein phosphatase 2C Proteins 0.000 description 1
- 108010094028 Prothrombin Proteins 0.000 description 1
- 108010029869 Proto-Oncogene Proteins c-raf Proteins 0.000 description 1
- 108010021833 Proto-Oncogene Proteins c-yes Proteins 0.000 description 1
- 108010039518 Proton-Translocating ATPases Proteins 0.000 description 1
- 102000015176 Proton-Translocating ATPases Human genes 0.000 description 1
- 101710167959 Putative UTP-glucose-1-phosphate uridylyltransferase Proteins 0.000 description 1
- 101710104378 Putative malate oxidoreductase [NAD] Proteins 0.000 description 1
- 101710148009 Putative uracil phosphoribosyltransferase Proteins 0.000 description 1
- 102000012751 Pyruvate Dehydrogenase Complex Human genes 0.000 description 1
- 108010090051 Pyruvate Dehydrogenase Complex Proteins 0.000 description 1
- 102100033479 RAF proto-oncogene serine/threonine-protein kinase Human genes 0.000 description 1
- 238000013381 RNA quantification Methods 0.000 description 1
- 102000044126 RNA-Binding Proteins Human genes 0.000 description 1
- 230000004570 RNA-binding Effects 0.000 description 1
- 101710105008 RNA-binding protein Proteins 0.000 description 1
- 102100038427 RNA-binding protein Nova-1 Human genes 0.000 description 1
- 238000011529 RT qPCR Methods 0.000 description 1
- 102000011070 Rab3 Human genes 0.000 description 1
- 108050001276 Rab3 Proteins 0.000 description 1
- 102000028589 Rab4 Human genes 0.000 description 1
- 108090001066 Racemases and epimerases Proteins 0.000 description 1
- 102100023320 Ral guanine nucleotide dissociation stimulator Human genes 0.000 description 1
- 108050008437 Ral guanine nucleotide dissociation stimulator Proteins 0.000 description 1
- 102100038473 Ran GTPase-activating protein 1 Human genes 0.000 description 1
- 101710160162 Ran GTPase-activating protein 1 Proteins 0.000 description 1
- 102100031426 Ras GTPase-activating protein 1 Human genes 0.000 description 1
- 108050004017 Ras GTPase-activating protein 1 Proteins 0.000 description 1
- 102100034418 Ras GTPase-activating-like protein IQGAP2 Human genes 0.000 description 1
- 102100033243 Ras association domain-containing protein 1 Human genes 0.000 description 1
- 102100022873 Ras-related protein Rab-11A Human genes 0.000 description 1
- 102100022303 Ras-related protein Rab-13 Human genes 0.000 description 1
- 102100038416 Ras-related protein Rab-40A-like Human genes 0.000 description 1
- 102100025132 Ras-related protein Rab-5B Human genes 0.000 description 1
- 102100025138 Ras-related protein Rab-5C Human genes 0.000 description 1
- 102100030706 Ras-related protein Rap-1A Human genes 0.000 description 1
- 102100031420 Ras-related protein Rap-2a Human genes 0.000 description 1
- 101000995042 Rattus norvegicus Nuclear transcription factor Y subunit alpha Proteins 0.000 description 1
- 101100153544 Rattus norvegicus Tor1aip1 gene Proteins 0.000 description 1
- 102100030711 Receptor activity-modifying protein 3 Human genes 0.000 description 1
- 102100039663 Receptor-type tyrosine-protein phosphatase F Human genes 0.000 description 1
- 108020004511 Recombinant DNA Proteins 0.000 description 1
- 102100030814 Regulator of G-protein signaling 9 Human genes 0.000 description 1
- 108090000783 Renin Proteins 0.000 description 1
- 102100028255 Renin Human genes 0.000 description 1
- 108010023377 Retinoblastoma Binding Proteins Proteins 0.000 description 1
- 102000011260 Retinoblastoma Binding Proteins Human genes 0.000 description 1
- 108700025701 Retinoblastoma Genes Proteins 0.000 description 1
- 108050002653 Retinoblastoma protein Proteins 0.000 description 1
- 102100038042 Retinoblastoma-associated protein Human genes 0.000 description 1
- 102100034253 Retinoic acid receptor RXR-beta Human genes 0.000 description 1
- 102100034262 Retinoic acid receptor RXR-gamma Human genes 0.000 description 1
- 108010006212 Retinoid X Receptor beta Proteins 0.000 description 1
- 108010063619 Retinoid X Receptor gamma Proteins 0.000 description 1
- 206010038933 Retinopathy of prematurity Diseases 0.000 description 1
- 208000025747 Rheumatic disease Diseases 0.000 description 1
- 102100038342 Rho-related BTB domain-containing protein 3 Human genes 0.000 description 1
- 108010083644 Ribonucleases Proteins 0.000 description 1
- 102000006382 Ribonucleases Human genes 0.000 description 1
- 102000004389 Ribonucleoproteins Human genes 0.000 description 1
- 108010081734 Ribonucleoproteins Proteins 0.000 description 1
- 108010055623 S-Phase Kinase-Associated Proteins Proteins 0.000 description 1
- 102000000341 S-Phase Kinase-Associated Proteins Human genes 0.000 description 1
- 101150040428 SEC4 gene Proteins 0.000 description 1
- 102100022342 SH2 domain-containing adapter protein B Human genes 0.000 description 1
- 102100022944 SHC-transforming protein 3 Human genes 0.000 description 1
- 101710135811 SHC-transforming protein 3 Proteins 0.000 description 1
- 102000042052 SMC family Human genes 0.000 description 1
- 108091079931 SMC family Proteins 0.000 description 1
- 102100031581 SPARC-like protein 1 Human genes 0.000 description 1
- 102100023015 SRSF protein kinase 2 Human genes 0.000 description 1
- 101710190447 SRSF protein kinase 2 Proteins 0.000 description 1
- 108010044012 STAT1 Transcription Factor Proteins 0.000 description 1
- 102100030571 STE20-like serine/threonine-protein kinase Human genes 0.000 description 1
- 101710157230 STE20-like serine/threonine-protein kinase Proteins 0.000 description 1
- 108700038981 SUMO-1 Proteins 0.000 description 1
- 102100029807 SUMO-conjugating enzyme UBC9 Human genes 0.000 description 1
- 241000235070 Saccharomyces Species 0.000 description 1
- 101100477851 Saccharomyces cerevisiae (strain ATCC 204508 / S288c) SNF12 gene Proteins 0.000 description 1
- 108010083379 Sarcoglycans Proteins 0.000 description 1
- 102000006308 Sarcoglycans Human genes 0.000 description 1
- 206010039491 Sarcoma Diseases 0.000 description 1
- 241000235347 Schizosaccharomyces pombe Species 0.000 description 1
- 101100488212 Schizosaccharomyces pombe (strain 972 / ATCC 24843) SPAC2F3.16 gene Proteins 0.000 description 1
- 101100083337 Schizosaccharomyces pombe (strain 972 / ATCC 24843) pic1 gene Proteins 0.000 description 1
- 102100021675 Scrapie-responsive protein 1 Human genes 0.000 description 1
- 101710183898 Scrapie-responsive protein 1 Proteins 0.000 description 1
- 102100035895 Secretory carrier-associated membrane protein 3 Human genes 0.000 description 1
- LDEBVRIURYMKQS-WISUUJSJSA-N Ser-Thr Chemical compound C[C@@H](O)[C@@H](C(O)=O)NC(=O)[C@@H](N)CO LDEBVRIURYMKQS-WISUUJSJSA-N 0.000 description 1
- 102100037143 Serine/threonine-protein kinase OSR1 Human genes 0.000 description 1
- 102100034377 Serine/threonine-protein kinase SIK2 Human genes 0.000 description 1
- 102100031445 Serine/threonine-protein kinase SIK3 Human genes 0.000 description 1
- 102100040321 Serine/threonine-protein phosphatase 2B catalytic subunit beta isoform Human genes 0.000 description 1
- 102100027287 Serpin H1 Human genes 0.000 description 1
- 108050008290 Serpin H1 Proteins 0.000 description 1
- 102100034258 Sialomucin core protein 24 Human genes 0.000 description 1
- 101710148833 Sialomucin core protein 24 Proteins 0.000 description 1
- 108010063499 Sigma Factor Proteins 0.000 description 1
- 102100029904 Signal transducer and activator of transcription 1-alpha/beta Human genes 0.000 description 1
- 206010041067 Small cell lung cancer Diseases 0.000 description 1
- 102000052126 Sodium-Hydrogen Exchangers Human genes 0.000 description 1
- 101710152941 Sodium/hydrogen exchanger 6 Proteins 0.000 description 1
- 102100029972 Sodium/hydrogen exchanger 6 Human genes 0.000 description 1
- 102100022792 Sodium/potassium-transporting ATPase subunit beta-3 Human genes 0.000 description 1
- 108091006672 Sodium–hydrogen antiporter Proteins 0.000 description 1
- 102100021476 Solute carrier family 22 member 14 Human genes 0.000 description 1
- 102100038650 Sorting nexin-4 Human genes 0.000 description 1
- 101710103886 Sorting nexin-4 Proteins 0.000 description 1
- 238000002105 Southern blotting Methods 0.000 description 1
- 241000256248 Spodoptera Species 0.000 description 1
- 102000005782 Squalene Monooxygenase Human genes 0.000 description 1
- 108020003891 Squalene monooxygenase Proteins 0.000 description 1
- 101000857870 Squalus acanthias Gonadoliberin Proteins 0.000 description 1
- 241000295644 Staphylococcaceae Species 0.000 description 1
- 108010085012 Steroid Receptors Proteins 0.000 description 1
- 108010090804 Streptavidin Proteins 0.000 description 1
- 241000187747 Streptomyces Species 0.000 description 1
- 102000011929 Succinate-CoA Ligases Human genes 0.000 description 1
- 108010075728 Succinate-CoA Ligases Proteins 0.000 description 1
- 241000701093 Suid alphaherpesvirus 1 Species 0.000 description 1
- 241000282887 Suidae Species 0.000 description 1
- 102100034371 Sulfhydryl oxidase 1 Human genes 0.000 description 1
- 101710159725 Sulfhydryl oxidase 1 Proteins 0.000 description 1
- 102100030523 Suppressor of cytokine signaling 5 Human genes 0.000 description 1
- 102100030529 Suppressor of cytokine signaling 7 Human genes 0.000 description 1
- 101000996723 Sus scrofa Gonadotropin-releasing hormone receptor Proteins 0.000 description 1
- 102100039485 Symplekin Human genes 0.000 description 1
- 101710138921 Symplekin Proteins 0.000 description 1
- 102100025237 T-cell surface antigen CD2 Human genes 0.000 description 1
- 210000001744 T-lymphocyte Anatomy 0.000 description 1
- 102100040296 TATA-box-binding protein Human genes 0.000 description 1
- 102100030306 TBC1 domain family member 9 Human genes 0.000 description 1
- 102100024815 TNF receptor-associated factor 5 Human genes 0.000 description 1
- 108090000001 TNF receptor-associated factor 5 Proteins 0.000 description 1
- 102100037667 TNFAIP3-interacting protein 1 Human genes 0.000 description 1
- 101710149776 TNFAIP3-interacting protein 1 Proteins 0.000 description 1
- 102100026351 TRPM8 channel-associated factor 1 Human genes 0.000 description 1
- 108010083809 Talin Proteins 0.000 description 1
- 102000006463 Talin Human genes 0.000 description 1
- 102100034918 Testis-specific Y-encoded-like protein 4 Human genes 0.000 description 1
- 239000004098 Tetracycline Substances 0.000 description 1
- RYYWUUFWQRZTIU-UHFFFAOYSA-N Thiophosphoric acid Chemical class OP(O)(S)=O RYYWUUFWQRZTIU-UHFFFAOYSA-N 0.000 description 1
- 102100029529 Thrombospondin-2 Human genes 0.000 description 1
- 102100037456 Trafficking protein particle complex subunit 10 Human genes 0.000 description 1
- 108090000340 Transaminases Proteins 0.000 description 1
- 102000003929 Transaminases Human genes 0.000 description 1
- 108010083268 Transcription Factor TFIID Proteins 0.000 description 1
- 102100026043 Transcription factor BTF3 Human genes 0.000 description 1
- 101710102998 Transcription factor Dp-2 Proteins 0.000 description 1
- 101710138750 Transcription factor E2F1 Proteins 0.000 description 1
- 102100024024 Transcription factor E2F2 Human genes 0.000 description 1
- 108050002596 Transcription factor E2F5 Proteins 0.000 description 1
- 102100038808 Transcription factor SOX-10 Human genes 0.000 description 1
- 102100022425 Transcription factor Sp3 Human genes 0.000 description 1
- 101710145409 Transcription initiation factor IIA subunit 2 Proteins 0.000 description 1
- 101710113296 Transcriptional regulator ATRX Proteins 0.000 description 1
- 101710150448 Transcriptional regulator Myc Proteins 0.000 description 1
- 108020004566 Transfer RNA Proteins 0.000 description 1
- 108010033576 Transferrin Receptors Proteins 0.000 description 1
- 102100026144 Transferrin receptor protein 1 Human genes 0.000 description 1
- 102000011117 Transforming Growth Factor beta2 Human genes 0.000 description 1
- 101800000304 Transforming growth factor beta-2 Proteins 0.000 description 1
- 101710157927 Translationally-controlled tumor protein Proteins 0.000 description 1
- 102100029007 Translocation protein SEC62 Human genes 0.000 description 1
- 108050005134 Translocation protein Sec62 Proteins 0.000 description 1
- 102100031987 Transmembrane emp24 domain-containing protein 2 Human genes 0.000 description 1
- 206010052779 Transplant rejections Diseases 0.000 description 1
- 102000009190 Transthyretin Human genes 0.000 description 1
- 102100038799 Tripartite motif-containing protein 2 Human genes 0.000 description 1
- 229920004890 Triton X-100 Polymers 0.000 description 1
- 102100024944 Tropomyosin alpha-4 chain Human genes 0.000 description 1
- 101710193115 Tropomyosin alpha-4 chain Proteins 0.000 description 1
- 102100036471 Tropomyosin beta chain Human genes 0.000 description 1
- 101710186456 Tropomyosin beta chain Proteins 0.000 description 1
- QIVBCDIJIAJPQS-UHFFFAOYSA-N Tryptophan Natural products C1=CC=C2C(CC(N)C(O)=O)=CNC2=C1 QIVBCDIJIAJPQS-UHFFFAOYSA-N 0.000 description 1
- 102000004243 Tubulin Human genes 0.000 description 1
- 108090000704 Tubulin Proteins 0.000 description 1
- 241000722921 Tulipa gesneriana Species 0.000 description 1
- 102100022205 Tumor necrosis factor receptor superfamily member 21 Human genes 0.000 description 1
- 101710187751 Tumor necrosis factor receptor superfamily member 21 Proteins 0.000 description 1
- 102100022203 Tumor necrosis factor receptor superfamily member 25 Human genes 0.000 description 1
- 108010037584 Type 4 Cyclic Nucleotide Phosphodiesterases Proteins 0.000 description 1
- 102100031167 Tyrosine-protein kinase CSK Human genes 0.000 description 1
- 102100024537 Tyrosine-protein kinase Fer Human genes 0.000 description 1
- 102100021788 Tyrosine-protein kinase Yes Human genes 0.000 description 1
- 102100033020 Tyrosine-protein phosphatase non-receptor type 12 Human genes 0.000 description 1
- 108010091281 U1 Small Nuclear Ribonucleoprotein Proteins 0.000 description 1
- 102000018165 U1 Small Nuclear Ribonucleoprotein Human genes 0.000 description 1
- 108010072724 U2 Small Nuclear Ribonucleoprotein Proteins 0.000 description 1
- 102000006986 U2 Small Nuclear Ribonucleoprotein Human genes 0.000 description 1
- 102100033309 U6 snRNA-associated Sm-like protein LSm2 Human genes 0.000 description 1
- 102000003431 Ubiquitin-Conjugating Enzyme Human genes 0.000 description 1
- 108060008747 Ubiquitin-Conjugating Enzyme Proteins 0.000 description 1
- 108010066496 Ubiquitin-Specific Proteases Proteins 0.000 description 1
- 102000018390 Ubiquitin-Specific Proteases Human genes 0.000 description 1
- 108091007492 Ubiquitin-like domain 1 Proteins 0.000 description 1
- 101800001117 Ubiquitin-related Proteins 0.000 description 1
- 102100026728 Uncharacterized protein FAM215A Human genes 0.000 description 1
- 101710100170 Unknown protein Proteins 0.000 description 1
- 102000007410 Uridine kinase Human genes 0.000 description 1
- 241000700618 Vaccinia virus Species 0.000 description 1
- 102000011731 Vacuolar Proton-Translocating ATPases Human genes 0.000 description 1
- 108010037026 Vacuolar Proton-Translocating ATPases Proteins 0.000 description 1
- 102100039113 Vacuolar protein sorting-associated protein 13B Human genes 0.000 description 1
- 108010053099 Vascular Endothelial Growth Factor Receptor-2 Proteins 0.000 description 1
- 102000016549 Vascular Endothelial Growth Factor Receptor-2 Human genes 0.000 description 1
- 102100038217 Vascular endothelial growth factor B Human genes 0.000 description 1
- 102100033178 Vascular endothelial growth factor receptor 1 Human genes 0.000 description 1
- GXBMIBRIOWHPDT-UHFFFAOYSA-N Vasopressin Natural products N1C(=O)C(CC=2C=C(O)C=CC=2)NC(=O)C(N)CSSCC(C(=O)N2C(CCC2)C(=O)NC(CCCN=C(N)N)C(=O)NCC(N)=O)NC(=O)C(CC(N)=O)NC(=O)C(CCC(N)=O)NC(=O)C1CC1=CC=CC=C1 GXBMIBRIOWHPDT-UHFFFAOYSA-N 0.000 description 1
- 108010004977 Vasopressins Proteins 0.000 description 1
- 102000002852 Vasopressins Human genes 0.000 description 1
- 108010031770 Vesicular Transport Adaptor Proteins Proteins 0.000 description 1
- 102000005456 Vesicular Transport Adaptor Proteins Human genes 0.000 description 1
- 108020005202 Viral DNA Proteins 0.000 description 1
- QYSXJUFSXHHAJI-XFEUOLMDSA-N Vitamin D3 Natural products C1(/[C@@H]2CC[C@@H]([C@]2(CCC1)C)[C@H](C)CCCC(C)C)=C/C=C1\C[C@@H](O)CCC1=C QYSXJUFSXHHAJI-XFEUOLMDSA-N 0.000 description 1
- 102000003734 Voltage-Gated Potassium Channels Human genes 0.000 description 1
- 108090000013 Voltage-Gated Potassium Channels Proteins 0.000 description 1
- 102100038143 WASH complex subunit 4 Human genes 0.000 description 1
- 102100028271 WD repeat-containing protein 47 Human genes 0.000 description 1
- 102000013814 Wnt Human genes 0.000 description 1
- 108050003627 Wnt Proteins 0.000 description 1
- HCHKCACWOHOZIP-UHFFFAOYSA-N Zinc Chemical compound [Zn] HCHKCACWOHOZIP-UHFFFAOYSA-N 0.000 description 1
- 102100036583 Zinc finger C3H1 domain-containing protein Human genes 0.000 description 1
- 102100025402 Zinc finger CCCH domain-containing protein 11A Human genes 0.000 description 1
- 102100036582 Zinc finger CCCH domain-containing protein 4 Human genes 0.000 description 1
- 102100028458 Zinc finger E-box-binding homeobox 2 Human genes 0.000 description 1
- 102100025085 Zinc finger MYM-type protein 2 Human genes 0.000 description 1
- 102100023574 Zinc finger protein 134 Human genes 0.000 description 1
- 102100023563 Zinc finger protein 423 Human genes 0.000 description 1
- 102100029024 Zinc finger protein 473 Human genes 0.000 description 1
- 101710143614 Zinc finger protein 473 Proteins 0.000 description 1
- 102000034337 acetylcholine receptors Human genes 0.000 description 1
- 102000005421 acetyltransferase Human genes 0.000 description 1
- 108020002494 acetyltransferase Proteins 0.000 description 1
- 230000002378 acidificating effect Effects 0.000 description 1
- 206010000496 acne Diseases 0.000 description 1
- 208000017733 acquired polycythemia vera Diseases 0.000 description 1
- 208000009621 actinic keratosis Diseases 0.000 description 1
- 230000004913 activation Effects 0.000 description 1
- 239000013543 active substance Substances 0.000 description 1
- 108010023082 activin A Proteins 0.000 description 1
- 208000038016 acute inflammation Diseases 0.000 description 1
- 230000006022 acute inflammation Effects 0.000 description 1
- 208000009956 adenocarcinoma Diseases 0.000 description 1
- 239000002671 adjuvant Substances 0.000 description 1
- 210000004100 adrenal gland Anatomy 0.000 description 1
- 230000001800 adrenalinergic effect Effects 0.000 description 1
- ULCUCJFASIJEOE-NPECTJMMSA-N adrenomedullin Chemical compound C([C@@H](C(=O)N[C@@H](CCC(N)=O)C(=O)NCC(=O)N[C@@H]([C@@H](C)CC)C(=O)N[C@@H](CCCNC(N)=N)C(=O)N[C@@H](CO)C(=O)N[C@@H](CC=1C=CC=CC=1)C(=O)NCC(=O)N[C@@H]1C(N[C@@H](CCCNC(N)=N)C(=O)N[C@@H](CC=2C=CC=CC=2)C(=O)NCC(=O)N[C@H](C(=O)N[C@@H](CSSC1)C(=O)N[C@@H]([C@@H](C)O)C(=O)N[C@@H](C(C)C)C(=O)N[C@@H](CCC(N)=O)C(=O)N[C@@H](CCCCN)C(=O)N[C@@H](CC(C)C)C(=O)N[C@@H](C)C(=O)N[C@@H](CC=1NC=NC=1)C(=O)N[C@@H](CCC(N)=O)C(=O)N[C@@H]([C@@H](C)CC)C(=O)N[C@@H](CC=1C=CC(O)=CC=1)C(=O)N[C@@H](CCC(N)=O)C(=O)N[C@@H](CC=1C=CC=CC=1)C(=O)N[C@@H]([C@@H](C)O)C(=O)N[C@@H](CC(O)=O)C(=O)N[C@@H](CCCCN)C(=O)N[C@@H](CC(O)=O)C(=O)N[C@@H](CCCCN)C(=O)N[C@@H](CC(O)=O)C(=O)N[C@@H](CC(N)=O)C(=O)N[C@@H](C(C)C)C(=O)N[C@@H](C)C(=O)N1[C@@H](CCC1)C(=O)N[C@@H](CCCNC(N)=N)C(=O)N[C@@H](CO)C(=O)N[C@@H](CCCCN)C(=O)N[C@@H]([C@@H](C)CC)C(=O)N[C@@H](CO)C(=O)N1[C@@H](CCC1)C(=O)N[C@@H](CCC(N)=O)C(=O)NCC(=O)N[C@@H](CC=1C=CC(O)=CC=1)C(N)=O)[C@@H](C)O)=O)NC(=O)[C@H](CC(N)=O)NC(=O)[C@H](CC(N)=O)NC(=O)[C@H](CCSC)NC(=O)[C@H](CO)NC(=O)[C@H](CCC(N)=O)NC(=O)[C@H](CCCNC(N)=N)NC(=O)[C@@H](N)CC=1C=CC(O)=CC=1)C1=CC=CC=C1 ULCUCJFASIJEOE-NPECTJMMSA-N 0.000 description 1
- 238000001042 affinity chromatography Methods 0.000 description 1
- 238000000246 agarose gel electrophoresis Methods 0.000 description 1
- 239000000556 agonist Substances 0.000 description 1
- 235000004279 alanine Nutrition 0.000 description 1
- 230000029936 alkylation Effects 0.000 description 1
- 238000005804 alkylation reaction Methods 0.000 description 1
- 208000026935 allergic disease Diseases 0.000 description 1
- 230000007815 allergy Effects 0.000 description 1
- 108010070113 alpha-1,3-mannosyl-glycoprotein beta-1,2-N-acetylglucosaminyltransferase I Proteins 0.000 description 1
- 108010028144 alpha-Glucosidases Proteins 0.000 description 1
- 108010061314 alpha-L-Fucosidase Proteins 0.000 description 1
- 102000012086 alpha-L-Fucosidase Human genes 0.000 description 1
- 229910000147 aluminium phosphate Inorganic materials 0.000 description 1
- 150000001408 amides Chemical class 0.000 description 1
- 150000001412 amines Chemical class 0.000 description 1
- 150000003862 amino acid derivatives Chemical class 0.000 description 1
- BFNBIHQBYMNNAN-UHFFFAOYSA-N ammonium sulfate Chemical compound N.N.OS(O)(=O)=O BFNBIHQBYMNNAN-UHFFFAOYSA-N 0.000 description 1
- 229910052921 ammonium sulfate Inorganic materials 0.000 description 1
- 238000012870 ammonium sulfate precipitation Methods 0.000 description 1
- 235000011130 ammonium sulphate Nutrition 0.000 description 1
- 229960000723 ampicillin Drugs 0.000 description 1
- AVKUERGKIZMTKX-NJBDSQKTSA-N ampicillin Chemical compound C1([C@@H](N)C(=O)N[C@H]2[C@H]3SC([C@@H](N3C2=O)C(O)=O)(C)C)=CC=CC=C1 AVKUERGKIZMTKX-NJBDSQKTSA-N 0.000 description 1
- 238000010171 animal model Methods 0.000 description 1
- 238000005571 anion exchange chromatography Methods 0.000 description 1
- 238000000137 annealing Methods 0.000 description 1
- 239000003242 anti bacterial agent Substances 0.000 description 1
- 230000003527 anti-angiogenesis Effects 0.000 description 1
- 230000002942 anti-growth Effects 0.000 description 1
- 230000001028 anti-proliverative effect Effects 0.000 description 1
- 229940088710 antibiotic agent Drugs 0.000 description 1
- 230000000890 antigenic effect Effects 0.000 description 1
- 239000002246 antineoplastic agent Substances 0.000 description 1
- 210000000709 aorta Anatomy 0.000 description 1
- 206010003246 arthritis Diseases 0.000 description 1
- 125000003118 aryl group Chemical group 0.000 description 1
- 235000009582 asparagine Nutrition 0.000 description 1
- 229960001230 asparagine Drugs 0.000 description 1
- 235000003704 aspartic acid Nutrition 0.000 description 1
- 208000006673 asthma Diseases 0.000 description 1
- 210000001130 astrocyte Anatomy 0.000 description 1
- 230000001746 atrial effect Effects 0.000 description 1
- 239000005441 aurora Substances 0.000 description 1
- 210000003719 b-lymphocyte Anatomy 0.000 description 1
- 230000003542 behavioural effect Effects 0.000 description 1
- 230000009286 beneficial effect Effects 0.000 description 1
- 229960000686 benzalkonium chloride Drugs 0.000 description 1
- 125000001797 benzyl group Chemical group [H]C1=C([H])C([H])=C(C([H])=C1[H])C([H])([H])* 0.000 description 1
- CADWTSSKOVRVJC-UHFFFAOYSA-N benzyl(dimethyl)azanium;chloride Chemical compound [Cl-].C[NH+](C)CC1=CC=CC=C1 CADWTSSKOVRVJC-UHFFFAOYSA-N 0.000 description 1
- 108010051210 beta-Fructofuranosidase Proteins 0.000 description 1
- OQFSQFPPLPISGP-UHFFFAOYSA-N beta-carboxyaspartic acid Natural products OC(=O)C(N)C(C(O)=O)C(O)=O OQFSQFPPLPISGP-UHFFFAOYSA-N 0.000 description 1
- 239000013060 biological fluid Substances 0.000 description 1
- 238000010170 biological method Methods 0.000 description 1
- 230000031018 biological processes and functions Effects 0.000 description 1
- 230000033558 biomineral tissue development Effects 0.000 description 1
- 238000001574 biopsy Methods 0.000 description 1
- XFLVBMBRLSCJAI-ZKWXMUAHSA-N biotin amide Chemical compound N1C(=O)N[C@@H]2[C@H](CCCCC(=O)N)SC[C@@H]21 XFLVBMBRLSCJAI-ZKWXMUAHSA-N 0.000 description 1
- XFLVBMBRLSCJAI-UHFFFAOYSA-N biotin amide Natural products N1C(=O)NC2C(CCCCC(=O)N)SCC21 XFLVBMBRLSCJAI-UHFFFAOYSA-N 0.000 description 1
- 239000003114 blood coagulation factor Substances 0.000 description 1
- 238000006664 bond formation reaction Methods 0.000 description 1
- KGBXLFKZBHKPEV-UHFFFAOYSA-N boric acid Chemical compound OB(O)O KGBXLFKZBHKPEV-UHFFFAOYSA-N 0.000 description 1
- 239000004327 boric acid Substances 0.000 description 1
- 229940053031 botulinum toxin Drugs 0.000 description 1
- 229940098773 bovine serum albumin Drugs 0.000 description 1
- 210000000481 breast Anatomy 0.000 description 1
- 235000019437 butane-1,3-diol Nutrition 0.000 description 1
- 102100037490 cAMP-dependent protein kinase type I-alpha regulatory subunit Human genes 0.000 description 1
- 102100029168 cAMP-specific 3',5'-cyclic phosphodiesterase 4B Human genes 0.000 description 1
- 238000010805 cDNA synthesis kit Methods 0.000 description 1
- 235000020964 calcitriol Nutrition 0.000 description 1
- 239000011612 calcitriol Substances 0.000 description 1
- 229960005084 calcitriol Drugs 0.000 description 1
- GMRQFYUYWCNGIN-NKMMMXOESA-N calcitriol Chemical compound C1(/[C@@H]2CC[C@@H]([C@]2(CCC1)C)[C@@H](CCCC(C)(C)O)C)=C\C=C1\C[C@@H](O)C[C@H](O)C1=C GMRQFYUYWCNGIN-NKMMMXOESA-N 0.000 description 1
- 238000004364 calculation method Methods 0.000 description 1
- 108010068032 caltractin Proteins 0.000 description 1
- 229940127093 camptothecin Drugs 0.000 description 1
- VSJKWCGYPAHWDS-FQEVSTJZSA-N camptothecin Chemical compound C1=CC=C2C=C(CN3C4=CC5=C(C3=O)COC(=O)[C@]5(O)CC)C4=NC2=C1 VSJKWCGYPAHWDS-FQEVSTJZSA-N 0.000 description 1
- 239000002775 capsule Substances 0.000 description 1
- 239000001569 carbon dioxide Substances 0.000 description 1
- 229910002092 carbon dioxide Inorganic materials 0.000 description 1
- 235000011089 carbon dioxide Nutrition 0.000 description 1
- JJWKPURADFRFRB-UHFFFAOYSA-N carbonyl sulfide Chemical compound O=C=S JJWKPURADFRFRB-UHFFFAOYSA-N 0.000 description 1
- 230000021523 carboxylation Effects 0.000 description 1
- 238000006473 carboxylation reaction Methods 0.000 description 1
- 230000009084 cardiovascular function Effects 0.000 description 1
- 239000000969 carrier Substances 0.000 description 1
- 150000003943 catecholamines Chemical class 0.000 description 1
- 238000005277 cation exchange chromatography Methods 0.000 description 1
- 108010046616 cdc25 Phosphatases Proteins 0.000 description 1
- 108010051348 cdc42 GTP-Binding Protein Proteins 0.000 description 1
- 210000004534 cecum Anatomy 0.000 description 1
- 238000000423 cell based assay Methods 0.000 description 1
- 230000022131 cell cycle Effects 0.000 description 1
- 230000010261 cell growth Effects 0.000 description 1
- 239000013592 cell lysate Substances 0.000 description 1
- 230000012292 cell migration Effects 0.000 description 1
- 230000004640 cellular pathway Effects 0.000 description 1
- 208000025434 cerebellar degeneration Diseases 0.000 description 1
- 210000003679 cervix uteri Anatomy 0.000 description 1
- 238000012512 characterization method Methods 0.000 description 1
- 238000007385 chemical modification Methods 0.000 description 1
- 239000003153 chemical reaction reagent Substances 0.000 description 1
- 229960004926 chlorobutanol Drugs 0.000 description 1
- 229940107137 cholecystokinin Drugs 0.000 description 1
- 235000012000 cholesterol Nutrition 0.000 description 1
- HVYWMOMLDIMFJA-DPAQBDIFSA-N cholesterol Natural products C1C=C2C[C@@H](O)CC[C@]2(C)[C@@H]2[C@@H]1[C@@H]1CC[C@H]([C@H](C)CCCC(C)C)[C@@]1(C)CC2 HVYWMOMLDIMFJA-DPAQBDIFSA-N 0.000 description 1
- 230000001713 cholinergic effect Effects 0.000 description 1
- 208000037976 chronic inflammation Diseases 0.000 description 1
- 208000037893 chronic inflammatory disorder Diseases 0.000 description 1
- 208000019425 cirrhosis of liver Diseases 0.000 description 1
- KNHUKKLJHYUCFP-UHFFFAOYSA-N clofibrate Chemical compound CCOC(=O)C(C)(C)OC1=CC=C(Cl)C=C1 KNHUKKLJHYUCFP-UHFFFAOYSA-N 0.000 description 1
- 230000003081 coactivator Effects 0.000 description 1
- 230000015271 coagulation Effects 0.000 description 1
- 238000005345 coagulation Methods 0.000 description 1
- AGVAZMGAQJOSFJ-WZHZPDAFSA-M cobalt(2+);[(2r,3s,4r,5s)-5-(5,6-dimethylbenzimidazol-1-yl)-4-hydroxy-2-(hydroxymethyl)oxolan-3-yl] [(2r)-1-[3-[(1r,2r,3r,4z,7s,9z,12s,13s,14z,17s,18s,19r)-2,13,18-tris(2-amino-2-oxoethyl)-7,12,17-tris(3-amino-3-oxopropyl)-3,5,8,8,13,15,18,19-octamethyl-2 Chemical compound [Co+2].N#[C-].[N-]([C@@H]1[C@H](CC(N)=O)[C@@]2(C)CCC(=O)NC[C@@H](C)OP(O)(=O)O[C@H]3[C@H]([C@H](O[C@@H]3CO)N3C4=CC(C)=C(C)C=C4N=C3)O)\C2=C(C)/C([C@H](C\2(C)C)CCC(N)=O)=N/C/2=C\C([C@H]([C@@]/2(CC(N)=O)C)CCC(N)=O)=N\C\2=C(C)/C2=N[C@]1(C)[C@@](C)(CC(N)=O)[C@@H]2CCC(N)=O AGVAZMGAQJOSFJ-WZHZPDAFSA-M 0.000 description 1
- 230000001427 coherent effect Effects 0.000 description 1
- 210000001520 comb Anatomy 0.000 description 1
- 238000002648 combination therapy Methods 0.000 description 1
- 230000000052 comparative effect Effects 0.000 description 1
- 239000003184 complementary RNA Substances 0.000 description 1
- 208000012696 congenital leptin deficiency Diseases 0.000 description 1
- 230000021615 conjugation Effects 0.000 description 1
- 238000010276 construction Methods 0.000 description 1
- 238000005112 continuous flow technique Methods 0.000 description 1
- 230000036461 convulsion Effects 0.000 description 1
- 210000003683 corneal stroma Anatomy 0.000 description 1
- 208000029078 coronary artery disease Diseases 0.000 description 1
- 230000002596 correlated effect Effects 0.000 description 1
- 230000008878 coupling Effects 0.000 description 1
- 239000007822 coupling agent Substances 0.000 description 1
- 238000010168 coupling process Methods 0.000 description 1
- 238000005859 coupling reaction Methods 0.000 description 1
- 238000012258 culturing Methods 0.000 description 1
- 235000018417 cysteine Nutrition 0.000 description 1
- XUJNEKJLAYXESH-UHFFFAOYSA-N cysteine Natural products SCC(N)C(O)=O XUJNEKJLAYXESH-UHFFFAOYSA-N 0.000 description 1
- 239000002852 cysteine proteinase inhibitor Substances 0.000 description 1
- 229940127089 cytotoxic agent Drugs 0.000 description 1
- 238000007405 data analysis Methods 0.000 description 1
- 230000034994 death Effects 0.000 description 1
- 230000007812 deficiency Effects 0.000 description 1
- 230000002950 deficient Effects 0.000 description 1
- 230000003111 delayed effect Effects 0.000 description 1
- 238000005115 demineralization Methods 0.000 description 1
- 230000002328 demineralizing effect Effects 0.000 description 1
- 238000003936 denaturing gel electrophoresis Methods 0.000 description 1
- 238000010511 deprotection reaction Methods 0.000 description 1
- 238000013461 design Methods 0.000 description 1
- 239000003599 detergent Substances 0.000 description 1
- 229960000633 dextran sulfate Drugs 0.000 description 1
- 201000009101 diabetic angiopathy Diseases 0.000 description 1
- 201000002249 diabetic peripheral angiopathy Diseases 0.000 description 1
- 238000002405 diagnostic procedure Methods 0.000 description 1
- 238000010586 diagram Methods 0.000 description 1
- 238000000502 dialysis Methods 0.000 description 1
- 235000014113 dietary fatty acids Nutrition 0.000 description 1
- 238000003748 differential diagnosis Methods 0.000 description 1
- 238000004819 disease profiling Methods 0.000 description 1
- BFMYDTVEBKDAKJ-UHFFFAOYSA-L disodium;(2',7'-dibromo-3',6'-dioxido-3-oxospiro[2-benzofuran-1,9'-xanthene]-4'-yl)mercury;hydrate Chemical compound O.[Na+].[Na+].O1C(=O)C2=CC=CC=C2C21C1=CC(Br)=C([O-])C([Hg])=C1OC1=C2C=C(Br)C([O-])=C1 BFMYDTVEBKDAKJ-UHFFFAOYSA-L 0.000 description 1
- 239000002270 dispersing agent Substances 0.000 description 1
- 239000002934 diuretic Substances 0.000 description 1
- VSJKWCGYPAHWDS-UHFFFAOYSA-N dl-camptothecin Natural products C1=CC=C2C=C(CN3C4=CC5=C(C3=O)COC(=O)C5(O)CC)C4=NC2=C1 VSJKWCGYPAHWDS-UHFFFAOYSA-N 0.000 description 1
- 238000007876 drug discovery Methods 0.000 description 1
- 229940126534 drug product Drugs 0.000 description 1
- 102100030495 eIF-2-alpha kinase activator GCN1 Human genes 0.000 description 1
- 230000005014 ectopic expression Effects 0.000 description 1
- 230000002526 effect on cardiovascular system Effects 0.000 description 1
- 230000008030 elimination Effects 0.000 description 1
- 238000003379 elimination reaction Methods 0.000 description 1
- 230000013020 embryo development Effects 0.000 description 1
- 239000000839 emulsion Substances 0.000 description 1
- 210000002472 endoplasmic reticulum Anatomy 0.000 description 1
- 210000002889 endothelial cell Anatomy 0.000 description 1
- 230000002708 enhancing effect Effects 0.000 description 1
- 230000002255 enzymatic effect Effects 0.000 description 1
- 210000003979 eosinophil Anatomy 0.000 description 1
- 102000012803 ephrin Human genes 0.000 description 1
- 108060002566 ephrin Proteins 0.000 description 1
- 229940116977 epidermal growth factor Drugs 0.000 description 1
- 230000008472 epithelial growth Effects 0.000 description 1
- 210000000981 epithelium Anatomy 0.000 description 1
- KAQKFAOMNZTLHT-VVUHWYTRSA-N epoprostenol Chemical compound O1C(=CCCCC(O)=O)C[C@@H]2[C@@H](/C=C/[C@@H](O)CCCCC)[C@H](O)C[C@@H]21 KAQKFAOMNZTLHT-VVUHWYTRSA-N 0.000 description 1
- 229960001123 epoprostenol Drugs 0.000 description 1
- 238000011156 evaluation Methods 0.000 description 1
- 238000002474 experimental method Methods 0.000 description 1
- 239000013613 expression plasmid Substances 0.000 description 1
- 229930195729 fatty acid Natural products 0.000 description 1
- 239000000194 fatty acid Substances 0.000 description 1
- 150000004665 fatty acids Chemical class 0.000 description 1
- 102000013370 fibrillin Human genes 0.000 description 1
- 108060002895 fibrillin Proteins 0.000 description 1
- 210000002950 fibroblast Anatomy 0.000 description 1
- 102000052178 fibroblast growth factor receptor activity proteins Human genes 0.000 description 1
- 239000000945 filler Substances 0.000 description 1
- 108060000864 flotillin Proteins 0.000 description 1
- 102000010660 flotillin Human genes 0.000 description 1
- 239000012530 fluid Substances 0.000 description 1
- 238000002376 fluorescence recovery after photobleaching Methods 0.000 description 1
- 230000037406 food intake Effects 0.000 description 1
- 235000019253 formic acid Nutrition 0.000 description 1
- 238000009472 formulation Methods 0.000 description 1
- 238000007306 functionalization reaction Methods 0.000 description 1
- 230000002538 fungal effect Effects 0.000 description 1
- 230000004927 fusion Effects 0.000 description 1
- 210000000232 gallbladder Anatomy 0.000 description 1
- 210000000609 ganglia Anatomy 0.000 description 1
- 230000002496 gastric effect Effects 0.000 description 1
- 238000003633 gene expression assay Methods 0.000 description 1
- 238000001415 gene therapy Methods 0.000 description 1
- 102000034356 gene-regulatory proteins Human genes 0.000 description 1
- 108091006104 gene-regulatory proteins Proteins 0.000 description 1
- 210000004907 gland Anatomy 0.000 description 1
- 239000011521 glass Substances 0.000 description 1
- 208000005017 glioblastoma Diseases 0.000 description 1
- MASNOZXLGMXCHN-ZLPAWPGGSA-N glucagon Chemical compound C([C@@H](C(=O)N[C@H](C(=O)N[C@@H](CCC(N)=O)C(=O)N[C@@H](CC=1C2=CC=CC=C2NC=1)C(=O)N[C@@H](CC(C)C)C(=O)N[C@@H](CCSC)C(=O)N[C@@H](CC(N)=O)C(=O)N[C@@H]([C@@H](C)O)C(O)=O)C(C)C)NC(=O)[C@H](CC(O)=O)NC(=O)[C@H](CCC(N)=O)NC(=O)[C@H](C)NC(=O)[C@H](CCCNC(N)=N)NC(=O)[C@H](CCCNC(N)=N)NC(=O)[C@H](CO)NC(=O)[C@H](CC(O)=O)NC(=O)[C@H](CC(C)C)NC(=O)[C@H](CC=1C=CC(O)=CC=1)NC(=O)[C@H](CCCCN)NC(=O)[C@H](CO)NC(=O)[C@H](CC=1C=CC(O)=CC=1)NC(=O)[C@H](CC(O)=O)NC(=O)[C@H](CO)NC(=O)[C@@H](NC(=O)[C@H](CC=1C=CC=CC=1)NC(=O)[C@@H](NC(=O)CNC(=O)[C@H](CCC(N)=O)NC(=O)[C@H](CO)NC(=O)[C@@H](N)CC=1NC=NC=1)[C@@H](C)O)[C@@H](C)O)C1=CC=CC=C1 MASNOZXLGMXCHN-ZLPAWPGGSA-N 0.000 description 1
- 229960004666 glucagon Drugs 0.000 description 1
- 235000013922 glutamic acid Nutrition 0.000 description 1
- 239000004220 glutamic acid Substances 0.000 description 1
- ZDXPYRJPNDTMRX-UHFFFAOYSA-N glutamine Natural products OC(=O)C(N)CCC(N)=O ZDXPYRJPNDTMRX-UHFFFAOYSA-N 0.000 description 1
- 230000034659 glycolysis Effects 0.000 description 1
- XLXSAKCOAKORKW-AQJXLSMYSA-N gonadorelin Chemical compound C([C@@H](C(=O)NCC(=O)N[C@@H](CC(C)C)C(=O)N[C@@H](CCCNC(N)=N)C(=O)N1[C@@H](CCC1)C(=O)NCC(N)=O)NC(=O)[C@H](CO)NC(=O)[C@H](CC=1C2=CC=CC=C2NC=1)NC(=O)[C@H](CC=1N=CNC=1)NC(=O)[C@H]1NC(=O)CC1)C1=CC=C(O)C=C1 XLXSAKCOAKORKW-AQJXLSMYSA-N 0.000 description 1
- XLXSAKCOAKORKW-UHFFFAOYSA-N gonadorelin Chemical compound C1CCC(C(=O)NCC(N)=O)N1C(=O)C(CCCN=C(N)N)NC(=O)C(CC(C)C)NC(=O)CNC(=O)C(NC(=O)C(CO)NC(=O)C(CC=1C2=CC=CC=C2NC=1)NC(=O)C(CC=1NC=NC=1)NC(=O)C1NC(=O)CC1)CC1=CC=C(O)C=C1 XLXSAKCOAKORKW-UHFFFAOYSA-N 0.000 description 1
- 229940035638 gonadotropin-releasing hormone Drugs 0.000 description 1
- 210000003714 granulocyte Anatomy 0.000 description 1
- 101150098203 grb2 gene Proteins 0.000 description 1
- 239000000122 growth hormone Substances 0.000 description 1
- 239000001963 growth medium Substances 0.000 description 1
- 102000006638 guanylate kinase Human genes 0.000 description 1
- 230000003394 haemopoietic effect Effects 0.000 description 1
- 230000036541 health Effects 0.000 description 1
- 108010067006 heat stable toxin (E coli) Proteins 0.000 description 1
- 208000006454 hepatitis Diseases 0.000 description 1
- 231100000283 hepatitis Toxicity 0.000 description 1
- 238000004128 high performance liquid chromatography Methods 0.000 description 1
- HNDVDQJCIGZPNO-UHFFFAOYSA-N histidine Natural products OC(=O)C(N)CC1=CN=CN1 HNDVDQJCIGZPNO-UHFFFAOYSA-N 0.000 description 1
- 238000007489 histopathology method Methods 0.000 description 1
- 230000003284 homeostatic effect Effects 0.000 description 1
- 230000013632 homeostatic process Effects 0.000 description 1
- 102000056909 human ARF4 Human genes 0.000 description 1
- 102000043530 human CD9 Human genes 0.000 description 1
- 102000052528 human CHAF1A Human genes 0.000 description 1
- 102000045839 human FUS Human genes 0.000 description 1
- 102000057554 human MXI1 Human genes 0.000 description 1
- 102000044075 human OAT Human genes 0.000 description 1
- 102000056546 human OMG Human genes 0.000 description 1
- 102000056184 human PGM1 Human genes 0.000 description 1
- 102000052231 human SLC4A3 Human genes 0.000 description 1
- 210000003917 human chromosome Anatomy 0.000 description 1
- 229910052739 hydrogen Inorganic materials 0.000 description 1
- 239000001257 hydrogen Substances 0.000 description 1
- 230000002209 hydrophobic effect Effects 0.000 description 1
- 238000004191 hydrophobic interaction chromatography Methods 0.000 description 1
- 238000012872 hydroxylapatite chromatography Methods 0.000 description 1
- 230000003451 hyperinsulinaemic effect Effects 0.000 description 1
- 201000008980 hyperinsulinism Diseases 0.000 description 1
- 230000001631 hypertensive effect Effects 0.000 description 1
- 230000002267 hypothalamic effect Effects 0.000 description 1
- 230000001146 hypoxic effect Effects 0.000 description 1
- 230000006303 immediate early viral mRNA transcription Effects 0.000 description 1
- 210000000987 immune system Anatomy 0.000 description 1
- 230000003053 immunization Effects 0.000 description 1
- 238000002649 immunization Methods 0.000 description 1
- 238000010166 immunofluorescence Methods 0.000 description 1
- 238000011532 immunohistochemical staining Methods 0.000 description 1
- 238000010324 immunological assay Methods 0.000 description 1
- 238000001114 immunoprecipitation Methods 0.000 description 1
- 230000008676 import Effects 0.000 description 1
- 238000000126 in silico method Methods 0.000 description 1
- 230000006698 induction Effects 0.000 description 1
- 230000002757 inflammatory effect Effects 0.000 description 1
- 238000001802 infusion Methods 0.000 description 1
- 239000003999 initiator Substances 0.000 description 1
- 229940102223 injectable solution Drugs 0.000 description 1
- 229940102213 injectable suspension Drugs 0.000 description 1
- 230000015788 innate immune response Effects 0.000 description 1
- 229940125396 insulin Drugs 0.000 description 1
- 102000028416 insulin-like growth factor binding Human genes 0.000 description 1
- 108091022911 insulin-like growth factor binding Proteins 0.000 description 1
- 230000003993 interaction Effects 0.000 description 1
- 108010079515 intersectin 1 Proteins 0.000 description 1
- 210000002011 intestinal secretion Anatomy 0.000 description 1
- 238000007912 intraperitoneal administration Methods 0.000 description 1
- 238000010253 intravenous injection Methods 0.000 description 1
- 239000001573 invertase Substances 0.000 description 1
- 235000011073 invertase Nutrition 0.000 description 1
- 230000037427 ion transport Effects 0.000 description 1
- 208000028867 ischemia Diseases 0.000 description 1
- AGPKZVBTJJNPAG-UHFFFAOYSA-N isoleucine Natural products CCC(C)C(N)C(O)=O AGPKZVBTJJNPAG-UHFFFAOYSA-N 0.000 description 1
- 229960000310 isoleucine Drugs 0.000 description 1
- QXJSBBXBKPUZAA-UHFFFAOYSA-N isooleic acid Natural products CCCCCCCC=CCCCCCCCCC(O)=O QXJSBBXBKPUZAA-UHFFFAOYSA-N 0.000 description 1
- 230000000155 isotopic effect Effects 0.000 description 1
- 230000003907 kidney function Effects 0.000 description 1
- 229940043355 kinase inhibitor Drugs 0.000 description 1
- 239000002523 lectin Substances 0.000 description 1
- 125000001909 leucine group Chemical group [H]N(*)C(C(*)=O)C([H])([H])C(C([H])([H])[H])C([H])([H])[H] 0.000 description 1
- 210000000265 leukocyte Anatomy 0.000 description 1
- 239000003446 ligand Substances 0.000 description 1
- 230000000670 limiting effect Effects 0.000 description 1
- 239000007937 lozenge Substances 0.000 description 1
- 101150074251 lpp gene Proteins 0.000 description 1
- 210000004072 lung Anatomy 0.000 description 1
- 210000003563 lymphoid tissue Anatomy 0.000 description 1
- 230000002934 lysing effect Effects 0.000 description 1
- 230000002132 lysosomal effect Effects 0.000 description 1
- 230000002101 lytic effect Effects 0.000 description 1
- 102100034702 mRNA decay activator protein ZFP36L1 Human genes 0.000 description 1
- 102100034703 mRNA decay activator protein ZFP36L2 Human genes 0.000 description 1
- 108010034959 macroH2A histone Proteins 0.000 description 1
- 239000011777 magnesium Substances 0.000 description 1
- 238000004949 mass spectrometry Methods 0.000 description 1
- 239000011159 matrix material Substances 0.000 description 1
- 230000035800 maturation Effects 0.000 description 1
- 230000001404 mediated effect Effects 0.000 description 1
- 238000002483 medication Methods 0.000 description 1
- 239000002609 medium Substances 0.000 description 1
- 210000003593 megakaryocyte Anatomy 0.000 description 1
- 238000002844 melting Methods 0.000 description 1
- 230000008018 melting Effects 0.000 description 1
- 230000003847 mesoderm development Effects 0.000 description 1
- 238000010197 meta-analysis Methods 0.000 description 1
- 229960000485 methotrexate Drugs 0.000 description 1
- 206010062198 microangiopathy Diseases 0.000 description 1
- 238000010208 microarray analysis Methods 0.000 description 1
- 238000012775 microarray technology Methods 0.000 description 1
- 244000005700 microbiome Species 0.000 description 1
- 230000003228 microsomal effect Effects 0.000 description 1
- 238000013508 migration Methods 0.000 description 1
- 210000003470 mitochondria Anatomy 0.000 description 1
- 230000002438 mitochondrial effect Effects 0.000 description 1
- 230000001483 mobilizing effect Effects 0.000 description 1
- 230000004879 molecular function Effects 0.000 description 1
- 230000003990 molecular pathway Effects 0.000 description 1
- 208000001022 morbid obesity Diseases 0.000 description 1
- 230000000921 morphogenic effect Effects 0.000 description 1
- 230000004660 morphological change Effects 0.000 description 1
- 238000010172 mouse model Methods 0.000 description 1
- 235000011929 mousse Nutrition 0.000 description 1
- 230000003551 muscarinic effect Effects 0.000 description 1
- 210000000663 muscle cell Anatomy 0.000 description 1
- 210000005012 myelin Anatomy 0.000 description 1
- 206010028537 myelofibrosis Diseases 0.000 description 1
- 210000000066 myeloid cell Anatomy 0.000 description 1
- 208000025113 myeloid leukemia Diseases 0.000 description 1
- 201000000050 myeloid neoplasm Diseases 0.000 description 1
- 210000004165 myocardium Anatomy 0.000 description 1
- 210000004897 n-terminal region Anatomy 0.000 description 1
- 230000001452 natriuretic effect Effects 0.000 description 1
- 230000017074 necrotic cell death Effects 0.000 description 1
- 230000017095 negative regulation of cell growth Effects 0.000 description 1
- 229960004927 neomycin Drugs 0.000 description 1
- 208000015122 neurodegenerative disease Diseases 0.000 description 1
- 230000000955 neuroendocrine Effects 0.000 description 1
- 201000004931 neurofibromatosis Diseases 0.000 description 1
- 230000004112 neuroprotection Effects 0.000 description 1
- 239000002858 neurotransmitter agent Substances 0.000 description 1
- 229910052757 nitrogen Inorganic materials 0.000 description 1
- 108091027963 non-coding RNA Proteins 0.000 description 1
- 102000042567 non-coding RNA Human genes 0.000 description 1
- 108700020942 nucleic acid binding protein Proteins 0.000 description 1
- 210000004940 nucleus Anatomy 0.000 description 1
- 235000015097 nutrients Nutrition 0.000 description 1
- ZQPPMHVWECSIRJ-KTKRTIGZSA-N oleic acid Chemical compound CCCCCCCC\C=C/CCCCCCCC(O)=O ZQPPMHVWECSIRJ-KTKRTIGZSA-N 0.000 description 1
- 210000004248 oligodendroglia Anatomy 0.000 description 1
- 238000003305 oral gavage Methods 0.000 description 1
- 238000012261 overproduction Methods 0.000 description 1
- 230000003647 oxidation Effects 0.000 description 1
- 238000007254 oxidation reaction Methods 0.000 description 1
- 101800002723 p18 Proteins 0.000 description 1
- 108091012362 p53 binding proteins Proteins 0.000 description 1
- 230000009996 pancreatic endocrine effect Effects 0.000 description 1
- 230000000849 parathyroid Effects 0.000 description 1
- 239000000199 parathyroid hormone Substances 0.000 description 1
- 229960001319 parathyroid hormone Drugs 0.000 description 1
- 238000007911 parenteral administration Methods 0.000 description 1
- 201000003045 paroxysmal nocturnal hemoglobinuria Diseases 0.000 description 1
- VMZMNAABQBOLAK-DBILLSOUSA-N pasireotide Chemical compound C([C@H]1C(=O)N2C[C@@H](C[C@H]2C(=O)N[C@H](C(=O)N[C@H](CC=2C3=CC=CC=C3NC=2)C(=O)N[C@H](C(N[C@@H](CC=2C=CC(OCC=3C=CC=CC=3)=CC=2)C(=O)N1)=O)CCCCN)C=1C=CC=CC=1)OC(=O)NCCN)C1=CC=CC=C1 VMZMNAABQBOLAK-DBILLSOUSA-N 0.000 description 1
- 230000007170 pathology Effects 0.000 description 1
- 229950009506 penicillinase Drugs 0.000 description 1
- 210000003899 penis Anatomy 0.000 description 1
- 210000001322 periplasm Anatomy 0.000 description 1
- 108090000959 peroxidasin Proteins 0.000 description 1
- 239000000825 pharmaceutical preparation Substances 0.000 description 1
- 230000003285 pharmacodynamic effect Effects 0.000 description 1
- COLNVLDHVKWLRT-UHFFFAOYSA-N phenylalanine Natural products OC(=O)C(N)CC1=CC=CC=C1 COLNVLDHVKWLRT-UHFFFAOYSA-N 0.000 description 1
- 125000002467 phosphate group Chemical group [H]OP(=O)(O[H])O[*] 0.000 description 1
- 125000001095 phosphatidyl group Chemical group 0.000 description 1
- 229940080469 phosphocellulose Drugs 0.000 description 1
- 239000003757 phosphotransferase inhibitor Substances 0.000 description 1
- DCWXELXMIBXGTH-UHFFFAOYSA-N phosphotyrosine Chemical compound OC(=O)C(N)CC1=CC=C(OP(O)(O)=O)C=C1 DCWXELXMIBXGTH-UHFFFAOYSA-N 0.000 description 1
- UFTCZKMBJOPXDM-XXFCQBPRSA-N pituitary adenylate cyclase-activating polypeptide Chemical compound C([C@H](N)C(=O)N[C@@H](CO)C(=O)N[C@@H](CC(O)=O)C(=O)NCC(=O)N[C@@H]([C@@H](C)CC)C(=O)N[C@@H](CC=1C=CC=CC=1)C(=O)N[C@@H]([C@@H](C)O)C(=O)N[C@@H](CC(O)=O)C(=O)N[C@@H](CO)C(=O)N[C@@H](CC=1C=CC(O)=CC=1)C(=O)N[C@@H](CO)C(=O)N[C@@H](CCCNC(N)=N)C(=O)N[C@@H](CC=1C=CC(O)=CC=1)C(=O)N[C@@H](CCCNC(N)=N)C(=O)N[C@@H](CCCCN)C(=O)N[C@@H](CCC(N)=O)C(=O)N[C@@H](CCSC)C(=O)N[C@@H](C)C(=O)N[C@@H](C(C)C)C(=O)N[C@@H](CCCCN)C(=O)N[C@@H](CCCCN)C(=O)N[C@@H](CC=1C=CC(O)=CC=1)C(=O)N[C@@H](CC(C)C)C(=O)N[C@@H](C)C(=O)N[C@@H](C)C(=O)N[C@@H](C(C)C)C(=O)N[C@@H](CC(C)C)C(=O)NCC(=O)N[C@@H](CCCCN)C(=O)N[C@@H](CCCNC(N)=N)C(=O)N[C@@H](CC=1C=CC(O)=CC=1)C(=O)N[C@@H](CCCCN)C(=O)N[C@@H](CCC(N)=O)C(=O)N[C@@H](CCCNC(N)=N)C(=O)N[C@@H](C(C)C)C(=O)N[C@@H](CCCCN)C(=O)N[C@@H](CC(N)=O)C(=O)N[C@@H](CCCCN)C(N)=O)C1=CN=CN1 UFTCZKMBJOPXDM-XXFCQBPRSA-N 0.000 description 1
- 239000000902 placebo Substances 0.000 description 1
- 229940068196 placebo Drugs 0.000 description 1
- 108010036225 placental lactogen A-2 Proteins 0.000 description 1
- 108010017843 platelet-derived growth factor A Proteins 0.000 description 1
- 229920000352 poly(styrene-co-divinylbenzene) Polymers 0.000 description 1
- 108700032676 polycystic kidney disease 2 Proteins 0.000 description 1
- 208000037244 polycythemia vera Diseases 0.000 description 1
- 229920001223 polyethylene glycol Polymers 0.000 description 1
- 108010050934 polyleucine Proteins 0.000 description 1
- 239000000256 polyoxyethylene sorbitan monolaurate Substances 0.000 description 1
- 235000010486 polyoxyethylene sorbitan monolaurate Nutrition 0.000 description 1
- 239000001267 polyvinylpyrrolidone Substances 0.000 description 1
- 229920000036 polyvinylpyrrolidone Polymers 0.000 description 1
- 235000013855 polyvinylpyrrolidone Nutrition 0.000 description 1
- 230000029279 positive regulation of transcription, DNA-dependent Effects 0.000 description 1
- 230000004481 post-translational protein modification Effects 0.000 description 1
- 238000011886 postmortem examination Methods 0.000 description 1
- 230000001323 posttranslational effect Effects 0.000 description 1
- 208000006155 precocious puberty Diseases 0.000 description 1
- 230000002028 premature Effects 0.000 description 1
- 238000002953 preparative HPLC Methods 0.000 description 1
- 238000012913 prioritisation Methods 0.000 description 1
- 230000000861 pro-apoptotic effect Effects 0.000 description 1
- 108091008777 probable nuclear hormone receptor HR3 Proteins 0.000 description 1
- VYXXMAGSIYIYGD-NWAYQTQBSA-N propan-2-yl 2-[[[(2R)-1-(6-aminopurin-9-yl)propan-2-yl]oxymethyl-(pyrimidine-4-carbonylamino)phosphoryl]amino]-2-methylpropanoate Chemical compound CC(C)OC(=O)C(C)(C)NP(=O)(CO[C@H](C)Cn1cnc2c(N)ncnc12)NC(=O)c1ccncn1 VYXXMAGSIYIYGD-NWAYQTQBSA-N 0.000 description 1
- 230000000069 prophylactic effect Effects 0.000 description 1
- 210000002307 prostate Anatomy 0.000 description 1
- 125000006239 protecting group Chemical group 0.000 description 1
- 230000004224 protection Effects 0.000 description 1
- 102000021127 protein binding proteins Human genes 0.000 description 1
- 108091011138 protein binding proteins Proteins 0.000 description 1
- 229940121649 protein inhibitor Drugs 0.000 description 1
- 239000012268 protein inhibitor Substances 0.000 description 1
- 230000006916 protein interaction Effects 0.000 description 1
- 230000009145 protein modification Effects 0.000 description 1
- 238000001742 protein purification Methods 0.000 description 1
- 108010067765 rab2 GTP Binding protein Proteins 0.000 description 1
- 108010044923 rab4 GTP-Binding Proteins Proteins 0.000 description 1
- 230000002285 radioactive effect Effects 0.000 description 1
- 102000012356 rap1 GTP-Binding Proteins Human genes 0.000 description 1
- 230000009103 reabsorption Effects 0.000 description 1
- 235000003499 redwood Nutrition 0.000 description 1
- 230000022983 regulation of cell cycle Effects 0.000 description 1
- 239000003488 releasing hormone Substances 0.000 description 1
- 230000001850 reproductive effect Effects 0.000 description 1
- 238000011160 research Methods 0.000 description 1
- 230000008458 response to injury Effects 0.000 description 1
- 108091008146 restriction endonucleases Proteins 0.000 description 1
- 208000037822 retinal angiopathy Diseases 0.000 description 1
- 230000002207 retinal effect Effects 0.000 description 1
- 230000001177 retroviral effect Effects 0.000 description 1
- 238000003757 reverse transcription PCR Methods 0.000 description 1
- 230000002441 reversible effect Effects 0.000 description 1
- 230000000552 rheumatic effect Effects 0.000 description 1
- 206010039073 rheumatoid arthritis Diseases 0.000 description 1
- 108010025552 ribosomal protein L11 Proteins 0.000 description 1
- 108010093121 ribosomal protein S17 Proteins 0.000 description 1
- 210000003705 ribosome Anatomy 0.000 description 1
- 108091092562 ribozyme Proteins 0.000 description 1
- 208000007442 rickets Diseases 0.000 description 1
- 210000003296 saliva Anatomy 0.000 description 1
- 210000003079 salivary gland Anatomy 0.000 description 1
- 235000019515 salmon Nutrition 0.000 description 1
- 229940072272 sandostatin Drugs 0.000 description 1
- 238000013515 script Methods 0.000 description 1
- 230000003248 secreting effect Effects 0.000 description 1
- 102000029751 selenium binding Human genes 0.000 description 1
- 108091022876 selenium binding Proteins 0.000 description 1
- 230000035945 sensitivity Effects 0.000 description 1
- 238000000926 separation method Methods 0.000 description 1
- 238000012163 sequencing technique Methods 0.000 description 1
- 238000007493 shaping process Methods 0.000 description 1
- 230000035939 shock Effects 0.000 description 1
- IZTQOLKUZKXIRV-YRVFCXMDSA-N sincalide Chemical compound C([C@@H](C(=O)N[C@@H](CCSC)C(=O)NCC(=O)N[C@@H](CC=1C2=CC=CC=C2NC=1)C(=O)N[C@@H](CCSC)C(=O)N[C@@H](CC(O)=O)C(=O)N[C@@H](CC=1C=CC=CC=1)C(N)=O)NC(=O)[C@@H](N)CC(O)=O)C1=CC=C(OS(O)(=O)=O)C=C1 IZTQOLKUZKXIRV-YRVFCXMDSA-N 0.000 description 1
- 231100001055 skeletal defect Toxicity 0.000 description 1
- 210000002027 skeletal muscle Anatomy 0.000 description 1
- 210000003491 skin Anatomy 0.000 description 1
- 208000000587 small cell lung carcinoma Diseases 0.000 description 1
- 229910052708 sodium Inorganic materials 0.000 description 1
- FQENQNTWSFEDLI-UHFFFAOYSA-J sodium diphosphate Chemical compound [Na+].[Na+].[Na+].[Na+].[O-]P([O-])(=O)OP([O-])([O-])=O FQENQNTWSFEDLI-UHFFFAOYSA-J 0.000 description 1
- 239000001488 sodium phosphate Substances 0.000 description 1
- 229910000162 sodium phosphate Inorganic materials 0.000 description 1
- 239000012064 sodium phosphate buffer Substances 0.000 description 1
- 229940048086 sodium pyrophosphate Drugs 0.000 description 1
- 238000000527 sonication Methods 0.000 description 1
- 241000894007 species Species 0.000 description 1
- 108010087686 src-Family Kinases Proteins 0.000 description 1
- 102000009076 src-Family Kinases Human genes 0.000 description 1
- 238000010186 staining Methods 0.000 description 1
- 238000000528 statistical test Methods 0.000 description 1
- 210000000130 stem cell Anatomy 0.000 description 1
- 102000005969 steroid hormone receptors Human genes 0.000 description 1
- 230000010009 steroidogenesis Effects 0.000 description 1
- 230000001629 suppression Effects 0.000 description 1
- 230000020382 suppression by virus of host antigen processing and presentation of peptide antigen via MHC class I Effects 0.000 description 1
- 230000004083 survival effect Effects 0.000 description 1
- 239000000375 suspending agent Substances 0.000 description 1
- 208000024891 symptom Diseases 0.000 description 1
- 239000006188 syrup Substances 0.000 description 1
- 235000020357 syrup Nutrition 0.000 description 1
- 230000009897 systematic effect Effects 0.000 description 1
- 239000003826 tablet Substances 0.000 description 1
- 230000008685 targeting Effects 0.000 description 1
- 108010052178 teleocalcin Proteins 0.000 description 1
- 208000001608 teratocarcinoma Diseases 0.000 description 1
- 229960002180 tetracycline Drugs 0.000 description 1
- 229930101283 tetracycline Natural products 0.000 description 1
- 235000019364 tetracycline Nutrition 0.000 description 1
- 150000003522 tetracyclines Chemical class 0.000 description 1
- 235000019818 tetrasodium diphosphate Nutrition 0.000 description 1
- 239000001577 tetrasodium phosphonato phosphate Substances 0.000 description 1
- 210000001103 thalamus Anatomy 0.000 description 1
- 238000011287 therapeutic dose Methods 0.000 description 1
- 229940126585 therapeutic drug Drugs 0.000 description 1
- 238000002560 therapeutic procedure Methods 0.000 description 1
- RTKIYNMVFMVABJ-UHFFFAOYSA-L thimerosal Chemical compound [Na+].CC[Hg]SC1=CC=CC=C1C([O-])=O RTKIYNMVFMVABJ-UHFFFAOYSA-L 0.000 description 1
- 229940033663 thimerosal Drugs 0.000 description 1
- 229960004072 thrombin Drugs 0.000 description 1
- 108010060887 thrombospondin 2 Proteins 0.000 description 1
- 108091023025 thyroid hormone binding Proteins 0.000 description 1
- 102000004217 thyroid hormone receptors Human genes 0.000 description 1
- 108090000721 thyroid hormone receptors Proteins 0.000 description 1
- 102000028501 thyroid hormone-binding Human genes 0.000 description 1
- 230000017423 tissue regeneration Effects 0.000 description 1
- 230000000699 topical effect Effects 0.000 description 1
- 231100000331 toxic Toxicity 0.000 description 1
- 230000002588 toxic effect Effects 0.000 description 1
- 231100000419 toxicity Toxicity 0.000 description 1
- 230000001988 toxicity Effects 0.000 description 1
- 231100000041 toxicology testing Toxicity 0.000 description 1
- 239000003053 toxin Substances 0.000 description 1
- 231100000765 toxin Toxicity 0.000 description 1
- 108700012359 toxins Proteins 0.000 description 1
- 230000005030 transcription termination Effects 0.000 description 1
- 108091006108 transcriptional coactivators Proteins 0.000 description 1
- 230000002103 transcriptional effect Effects 0.000 description 1
- 229940072041 transforming growth factor beta 2 Drugs 0.000 description 1
- 238000011830 transgenic mouse model Methods 0.000 description 1
- 230000014621 translational initiation Effects 0.000 description 1
- 238000002054 transplantation Methods 0.000 description 1
- RYFMWSXOAZQYPI-UHFFFAOYSA-K trisodium phosphate Chemical compound [Na+].[Na+].[Na+].[O-]P([O-])([O-])=O RYFMWSXOAZQYPI-UHFFFAOYSA-K 0.000 description 1
- 210000004881 tumor cell Anatomy 0.000 description 1
- 238000010396 two-hybrid screening Methods 0.000 description 1
- 229940035936 ubiquinone Drugs 0.000 description 1
- 238000000108 ultra-filtration Methods 0.000 description 1
- 241001529453 unidentified herpesvirus Species 0.000 description 1
- 241001430294 unidentified retrovirus Species 0.000 description 1
- 230000003827 upregulation Effects 0.000 description 1
- 210000003932 urinary bladder Anatomy 0.000 description 1
- 230000002485 urinary effect Effects 0.000 description 1
- 210000004291 uterus Anatomy 0.000 description 1
- 239000004474 valine Substances 0.000 description 1
- 229960003726 vasopressin Drugs 0.000 description 1
- 230000028973 vesicle-mediated transport Effects 0.000 description 1
- 235000005282 vitamin D3 Nutrition 0.000 description 1
- 239000011647 vitamin D3 Substances 0.000 description 1
- QYSXJUFSXHHAJI-YRZJJWOYSA-N vitamin D3 Chemical compound C1(/[C@@H]2CC[C@@H]([C@]2(CCC1)C)[C@H](C)CCCC(C)C)=C\C=C1\C[C@@H](O)CCC1=C QYSXJUFSXHHAJI-YRZJJWOYSA-N 0.000 description 1
- 229940021056 vitamin d3 Drugs 0.000 description 1
- XLYOFNOQVPJJNP-UHFFFAOYSA-N water Substances O XLYOFNOQVPJJNP-UHFFFAOYSA-N 0.000 description 1
- 238000001262 western blot Methods 0.000 description 1
- 239000000080 wetting agent Substances 0.000 description 1
- 210000005253 yeast cell Anatomy 0.000 description 1
- 101150039646 ypt3 gene Proteins 0.000 description 1
- 239000011701 zinc Substances 0.000 description 1
- 229910052725 zinc Inorganic materials 0.000 description 1
Images
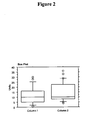
Classifications
-
- C—CHEMISTRY; METALLURGY
- C12—BIOCHEMISTRY; BEER; SPIRITS; WINE; VINEGAR; MICROBIOLOGY; ENZYMOLOGY; MUTATION OR GENETIC ENGINEERING
- C12N—MICROORGANISMS OR ENZYMES; COMPOSITIONS THEREOF; PROPAGATING, PRESERVING, OR MAINTAINING MICROORGANISMS; MUTATION OR GENETIC ENGINEERING; CULTURE MEDIA
- C12N9/00—Enzymes; Proenzymes; Compositions thereof; Processes for preparing, activating, inhibiting, separating or purifying enzymes
- C12N9/0004—Oxidoreductases (1.)
- C12N9/0071—Oxidoreductases (1.) acting on paired donors with incorporation of molecular oxygen (1.14)
- C12N9/0073—Oxidoreductases (1.) acting on paired donors with incorporation of molecular oxygen (1.14) with NADH or NADPH as one donor, and incorporation of one atom of oxygen 1.14.13
-
- A—HUMAN NECESSITIES
- A61—MEDICAL OR VETERINARY SCIENCE; HYGIENE
- A61P—SPECIFIC THERAPEUTIC ACTIVITY OF CHEMICAL COMPOUNDS OR MEDICINAL PREPARATIONS
- A61P11/00—Drugs for disorders of the respiratory system
- A61P11/06—Antiasthmatics
-
- A—HUMAN NECESSITIES
- A61—MEDICAL OR VETERINARY SCIENCE; HYGIENE
- A61P—SPECIFIC THERAPEUTIC ACTIVITY OF CHEMICAL COMPOUNDS OR MEDICINAL PREPARATIONS
- A61P11/00—Drugs for disorders of the respiratory system
- A61P11/16—Central respiratory analeptics
-
- A—HUMAN NECESSITIES
- A61—MEDICAL OR VETERINARY SCIENCE; HYGIENE
- A61P—SPECIFIC THERAPEUTIC ACTIVITY OF CHEMICAL COMPOUNDS OR MEDICINAL PREPARATIONS
- A61P13/00—Drugs for disorders of the urinary system
- A61P13/12—Drugs for disorders of the urinary system of the kidneys
-
- A—HUMAN NECESSITIES
- A61—MEDICAL OR VETERINARY SCIENCE; HYGIENE
- A61P—SPECIFIC THERAPEUTIC ACTIVITY OF CHEMICAL COMPOUNDS OR MEDICINAL PREPARATIONS
- A61P15/00—Drugs for genital or sexual disorders; Contraceptives
-
- A—HUMAN NECESSITIES
- A61—MEDICAL OR VETERINARY SCIENCE; HYGIENE
- A61P—SPECIFIC THERAPEUTIC ACTIVITY OF CHEMICAL COMPOUNDS OR MEDICINAL PREPARATIONS
- A61P17/00—Drugs for dermatological disorders
- A61P17/06—Antipsoriatics
-
- A—HUMAN NECESSITIES
- A61—MEDICAL OR VETERINARY SCIENCE; HYGIENE
- A61P—SPECIFIC THERAPEUTIC ACTIVITY OF CHEMICAL COMPOUNDS OR MEDICINAL PREPARATIONS
- A61P17/00—Drugs for dermatological disorders
- A61P17/16—Emollients or protectives, e.g. against radiation
-
- A—HUMAN NECESSITIES
- A61—MEDICAL OR VETERINARY SCIENCE; HYGIENE
- A61P—SPECIFIC THERAPEUTIC ACTIVITY OF CHEMICAL COMPOUNDS OR MEDICINAL PREPARATIONS
- A61P27/00—Drugs for disorders of the senses
- A61P27/02—Ophthalmic agents
-
- A—HUMAN NECESSITIES
- A61—MEDICAL OR VETERINARY SCIENCE; HYGIENE
- A61P—SPECIFIC THERAPEUTIC ACTIVITY OF CHEMICAL COMPOUNDS OR MEDICINAL PREPARATIONS
- A61P3/00—Drugs for disorders of the metabolism
- A61P3/08—Drugs for disorders of the metabolism for glucose homeostasis
- A61P3/10—Drugs for disorders of the metabolism for glucose homeostasis for hyperglycaemia, e.g. antidiabetics
-
- A—HUMAN NECESSITIES
- A61—MEDICAL OR VETERINARY SCIENCE; HYGIENE
- A61P—SPECIFIC THERAPEUTIC ACTIVITY OF CHEMICAL COMPOUNDS OR MEDICINAL PREPARATIONS
- A61P31/00—Antiinfectives, i.e. antibiotics, antiseptics, chemotherapeutics
-
- A—HUMAN NECESSITIES
- A61—MEDICAL OR VETERINARY SCIENCE; HYGIENE
- A61P—SPECIFIC THERAPEUTIC ACTIVITY OF CHEMICAL COMPOUNDS OR MEDICINAL PREPARATIONS
- A61P35/00—Antineoplastic agents
-
- A—HUMAN NECESSITIES
- A61—MEDICAL OR VETERINARY SCIENCE; HYGIENE
- A61P—SPECIFIC THERAPEUTIC ACTIVITY OF CHEMICAL COMPOUNDS OR MEDICINAL PREPARATIONS
- A61P9/00—Drugs for disorders of the cardiovascular system
-
- A—HUMAN NECESSITIES
- A61—MEDICAL OR VETERINARY SCIENCE; HYGIENE
- A61P—SPECIFIC THERAPEUTIC ACTIVITY OF CHEMICAL COMPOUNDS OR MEDICINAL PREPARATIONS
- A61P9/00—Drugs for disorders of the cardiovascular system
- A61P9/10—Drugs for disorders of the cardiovascular system for treating ischaemic or atherosclerotic diseases, e.g. antianginal drugs, coronary vasodilators, drugs for myocardial infarction, retinopathy, cerebrovascula insufficiency, renal arteriosclerosis
-
- G—PHYSICS
- G16—INFORMATION AND COMMUNICATION TECHNOLOGY [ICT] SPECIALLY ADAPTED FOR SPECIFIC APPLICATION FIELDS
- G16H—HEALTHCARE INFORMATICS, i.e. INFORMATION AND COMMUNICATION TECHNOLOGY [ICT] SPECIALLY ADAPTED FOR THE HANDLING OR PROCESSING OF MEDICAL OR HEALTHCARE DATA
- G16H10/00—ICT specially adapted for the handling or processing of patient-related medical or healthcare data
- G16H10/40—ICT specially adapted for the handling or processing of patient-related medical or healthcare data for data related to laboratory analysis, e.g. patient specimen analysis
-
- C—CHEMISTRY; METALLURGY
- C07—ORGANIC CHEMISTRY
- C07K—PEPTIDES
- C07K2319/00—Fusion polypeptide
-
- Y—GENERAL TAGGING OF NEW TECHNOLOGICAL DEVELOPMENTS; GENERAL TAGGING OF CROSS-SECTIONAL TECHNOLOGIES SPANNING OVER SEVERAL SECTIONS OF THE IPC; TECHNICAL SUBJECTS COVERED BY FORMER USPC CROSS-REFERENCE ART COLLECTIONS [XRACs] AND DIGESTS
- Y02—TECHNOLOGIES OR APPLICATIONS FOR MITIGATION OR ADAPTATION AGAINST CLIMATE CHANGE
- Y02A—TECHNOLOGIES FOR ADAPTATION TO CLIMATE CHANGE
- Y02A90/00—Technologies having an indirect contribution to adaptation to climate change
- Y02A90/10—Information and communication technologies [ICT] supporting adaptation to climate change, e.g. for weather forecasting or climate simulation
Definitions
- the invention relates generally to the in vivo testing of the efficacy of a compound or composition, and particularly to the testing and biologically functionalizing of classical small molecules, natural products, genes, peptides and proteins by activity in vivo.
- the invention further relates to medical uses of fibroblast growth factor 23 (FGF-23), FGF-23 fragments, FGF-23 C-terminal polypeptides, FGF-23 homologs and/or FGF-23 variants, in particular for the manufacture of a medicament for the treatment of diseases associated with deregulated angiogenesis or cell proliferative disorders.
- FGF-23 fibroblast growth factor 23
- FGF-23 fragments FGF-23 fragments
- FGF-23 C-terminal polypeptides FGF-23 homologs
- FGF-23 homologs FGF-23 variants
- a gene sequence alone does not provide information about the actual function of the protein in the cell or organism physiology.
- the genome has a relatively well defined number of genes, there is no known limit to the possible number of protein variants.
- the potential number of proteins encoded by these genes is estimated to be from two to at least one-hundred times higher than the number of genes, since it has recently been found that proteins can also be produced by splicing at the protein level not just at the RNA level.
- the current process of drug discovery proceeds from single target to single drug product.
- the current process is a long process, frequently with late attrition for lack of efficacy, wrong design or false indication.
- the invention provides a discovery process for biologically functionalizing peptides, proteins, genes, small molecules and natural products using organism-wide gene expression profiling.
- the discovery process of the invention proceeds from single lead or drug to multiple targets and indications (as indicated by an impact on any target in the cascade chain of a pathway), and multiple drug products, thus providing rapid guidance to a correct human proof-of-concept.
- the discovery process of the invention begins with administration of test substances to animals, followed by screening of the resulting gene expression in many organs obtained from the test animal.
- the invention can be used to biologically functionalize the entire genome of any organism where micoarray chips are available.
- the invention is not restricted to the type of compound to be functionalized. Small molecules, proteins, natural products, cDNA (for functionalizing any gene of interest), etc . are all susceptible to the strategy of the invention.
- polypeptides can be selected for testing in the absence of any biological selection criteria other than peptide sequence.
- the resulting organism-wide pattern of the gene expression changes in the transcriptome provides an overview of the activities at the molecular and organism-wide levels. Accordingly, the unbiased approach of the invention regarding the administration of a compound can provide information about the physiological relationships throughout the entire body that are caused by the compound's administration.
- the discovery process of the invention then integrates in vivo profiling with internal and external genomic databases to elucidate the function of unknown proteins, typically within few months.
- the unbiased approach of the invention in regards to the administration of a compound advantageously provides genomic signatures from multiple organs.
- the resulting data can be analyzed either by using tools that are known to those of skill in the art or by using mols that compare the compound signatures produced by the administration of the compound among the different organs.
- This multi-organ analysis is in contrast to standard approaches, which, since they do not use an unbiased approach of compound administration, do not result in a multi-organ identification of the function of the compound. Instead the standard approaches provide analysis on a case-by-case basis, which can make cross-experimental comparisons difficult.
- the identification of the function of the compound using the method of the invention allows for the identification of the function of the compound in many metabolic and regulatory pathways.
- the identification of the function of the compound using the method of the invention advantageously results in an understanding of the stability of the active compound in the body, a property of the administered compound which would otherwise not be predictable a priori using standard approaches.
- the identification of the function of the compound using the method of the invention can be multi-step, as one step or part of the identification leads to another step or part of the identification, to provide a more complete understanding of the administered compound's activity in vivo.
- the identification of compound function in one organ can lead to an understanding of the compound function in other organs.
- the standard approaches which rely on immediate access to tests on a limited number of organs, depend on anecdotal evidence from other experiments to further steps in the identification of compound function.
- the invention is suitable for several stages of drug discovery, identifying both drug targets and biomarkers.
- the discovery process of the invention advantageously delivers an increased number of validated drug candidates and identified drug targets and biomarkers along with a savings in time, resources and animals.
- the discovery process of the invention advantageously integrates into one process standard exploratory tools with new genomic approaches.
- the discovery process of the invention can also be used for the reprofiling of safe compounds stopped after the initial stages of drug approval (e.g. , Phase I) for re-indication.
- the invention can be used for adjusting the best fit for combination therapies, by optimally matching of gene expression signatures between two compounds, cancelling of side effects and the potentiation of efficacy.
- the discovery process of the invention can be used for the profiling of the more advanced development portfolio to guide the later stages af drug approval process (e.g. Phase II and Phase III)
- the process can be used to analyze tissues or body fluids (such as coronary heart disease, breast cancer and another indication; each compared to healthy controls). Plasma proteins that are differentially expressed between normal. subjects and coronary artery diseased patients, with known or unknown function, are analyzed for potential target identification/validation, and biomarker identification.
- tissues or body fluids such as coronary heart disease, breast cancer and another indication; each compared to healthy controls.
- Plasma proteins that are differentially expressed between normal. subjects and coronary artery diseased patients, with known or unknown function are analyzed for potential target identification/validation, and biomarker identification.
- the discovery process of the invention begins with an in vivo screening of proteins, peptides and reference compounds in mice. Based on the results of the mice screening, an in vivo verification of selected proteins, peptides or reference compounds is then conducted in non-human primates or animal models of human pathology or disease. The comparison of the resultant information to a profile of reference drugs, with well characterized pharmacological activity, facilitates biological interpretation of the profiles of unknown compounds.
- the selection rate for the proteins, peptides or reference compounds is ⁇ 20%.
- the discovery process of the invention combines in one process: (a) pre-screening in mice; (b) verification of selected proteins/peptides/reference compounds in monkeys; (c) large number of the analyzed tissues (up to 25 in mice, up to 120 in monkeys); (d) homogeneity of the tissue sample (e) high quality mRNA; (f) a genome-wide approach with hybridization chips; (g) powerful bioinformation tools for clustering and statistics; (h) the possibility of cross-assay meta-analysis; and (i) localization at the cellular level of the affected genes or pathways by in situ hybridization.
- polypeptides relating to FGF-23 affect key genes controlling cellular differentiation and proliferation, as well as angiogenesis.
- Fibroblast growth factors make up a large family of polypeptide growth factors that are found in organisms ranging from nematodes to humans. During embryonic development, FGFs have diverse roles in regulating cell proliferation, migration and differentiation. In the adult organism, FGFs are homeostatic factors and function in tissue repair and response to injury. Inappropriate expression of some FGFs can contribute to the pathogenesis of cancer.
- Mouse FGF-23 has been identified by homology-search in the GenBank Nucleotide Sequence Database with amino acid sequence of mousse FGF-15. Mousse IGF-23 and human FGF-23 are highly identical ( ⁇ 72% amino acid identity). Both, mouse and human FGF-23, cDNAs encode a protein of 251 amino acids, having a hydrophobic amino terminus ( ⁇ 24 amino acids) typical for secreted proteins, and a unique C-terminus having no homology to other FGF family members. In the mouse, FGF-23 mRNA is expressed in the brain, preferentially in the ventrolateral thalamic nucleus, and in the thymus at low levels.
- Recombinant FGF-23 induces hypophosphatemia in vivo as a result of urinary phosphate wasting ( Shimada T., et al., Proc. Natl. Acad. Sci. U. S. A. 98: 6500-6505 (2001) ).
- FGF-23 overexpression has been observed in tumors that are responsible for oncogenic osteomalacia (OOM) ( White K.E., et al., J. Clin. Endocrinol. Metab. 86: 497-500 (2001) ).
- ADHR Autosomal dominant hypophosphatemic rickets
- X-linked hypophosphatemia X-linked hypophosphatemia
- PHEX encodes a membrane-bound endopeptidase ( The HYP Consortium, Nat. Genet. 11: 130-136 (1995) ) and it is hypothesized that FGF-23 is a PHEX substrate, while FGF-23 ADHR mutant (FGF-23(R179Q) being undegradeable by PHEX.
- Each of the above described syndromes is characterized by hypophosphatemia, decreased renal phosphate reabsorption, normal or low serum calcitriol concentrations, normal serum concentrations of calcium and parathyroid hormone, and defective skeletal mineralization ( Quarles L. D. and Drezner M. K., J. Clin. Endocrino/. Metab. 86:494-496 (2001) ).
- FGF-23 is at least one of the causative factors of OOM and is an important regulator of phosphate and bone metabolism ( Shimada T., Proc. Natl. Acad. Sci. USA 98: 6500-6505(2001) ).
- the molecular targets of FGF-23 or of FGF-23 proteolytic cleavage products are so far unknown, as is the mechanism of how FGF-23 or FGF-23 derived proteins or peptides cause renal and skeletal abnormalities ( Quarles L. D., Am. J. Physiol. Endocrinol. Metab. 285: E1 - 9 (2003 )).
- the present invention thus relates the use of a polypeptide for the manufacture of a medicament for use in the treatment of a disease associated with deregulated angiogenesis, wherein the polypeptide is selected from the groups consisting of (a) fibroblast growth factor 23 (FGF-23) (SEQ. ID No: 1) or a fragment of FGF-23; (b) a bioactive polypeptide having a percentage of identity of at least 50% with the amino acid sequence of any one of the polypeptides of (a); or (c) a bioactive variant of any one of the polypeptides of (a) or (b).
- FGF-23 fibroblast growth factor 23
- FGF-283 SEQ. ID No: 1
- the present invention relates to the use of a polypeptide as defined above for the manufacture of a medicament for use in the treatment of a cell proliferative disorder.
- the present invention relates to a method for the treatment of a disease associated with deregulated angiogenesis or of a cell proliferative disorder comprising administering an effective amount of a polypeptide as defined above to a mammal including a human suffering from the disease or disorder.
- the present invention relates to a pharmaceutical composition for use in a disease associated with deregulated angiogenesis or a cell proliferative disorder comprising a polypeptide as defined above and a pharmaceutically-acceptable carrier.
- FIG. 1 is a set of polypeptide sequences and putative polypeptide sequence correlations for GPA018, GPA019, GPA020, GPA022 and GPA023.
- FIG. 2 is a box plot of the proliferation scores (Units) relating to vascular changes on retinal flatmounts of animals treated with FGF-23 C-terminal polypeptide (FGF23CTP; (right eye; column 1) and PBS (left eye; columm 2);
- the classical discovery process in the pharmaceutical industry is based on targets (enzymes, receptors, cellular assays, animal and disease models, etc. ). Chemicals or biological products are tested, in a high throughput mode, on a battery of pre-selected different targets.
- targets enzymes, receptors, cellular assays, animal and disease models, etc.
- Chemicals or biological products are tested, in a high throughput mode, on a battery of pre-selected different targets.
- the weakness of the classical approach are the "artificially disconnected" in vitro target models compared to the tightly interconnected and interdependent relationship of the different targets in a whole organism and the fact that biological activity on all non selected targets is missed.
- the invention is a "non pre-conceived hypothesis" discovery process to rapidly identify and analyze the biological activity of new products in the whole organism, multi-organs and whole transcriptome. All physiological interactions between the different organs or tissues are present and any cellular pathway or any potential targets could potentially be analyzed in a non artificial system.
- proteomics involves the systematic separation, identification and characterization of the proteins present in a sample of tissue, or in a biological fluid, at a given time. All biological processes, including diseases and responses to drugs, induce changes in proteins, and the global protein profile (the "proteome") varies during the development of an organism, maturation of cell types or tissues, and progression or treatment of disease. Each cell type may express different patterns of proteins at different times. Each protein in turn may be modified chemically in an equally diverse number of ways to serve different cellular functions. As proteins derived from the same gene can be largely identical, and might differ only in small but functionally relevant details, protein identification tools not only identify a large number of proteins but also differentiate between close relatives.
- the classical proteomics approach combines high resolution two-dimensional gel electrophoresis (2-DGE) with imaging software to quantitatively and qualitatively screen for proteins that differ in abundance, molecular weight (Mr) or charge between the gels. These protein differences can then be identified with high speed and sensitivity by using acombination of "state-of-the-art” mass spectrometry (MS) approaches and robotics, alongside sensitive bioinformatics search tools.
- 2-DGE high resolution two-dimensional gel electrophoresis
- Mr molecular weight
- MS mass spectrometry
- RNA transcripts represent the intermediate form between the DNA and the proteins that are among the most active molecules involved in the cellular functions.
- the total content of RNA is called the "transcriptome".
- the high-density DNA chip technology gives potential access to the analysis of all the transcripts produced by a cell population or tissue at any determined time point. Genome-scale RNA expression analysis can thus provide new insights into the cellular events induced upon administration of an animal with peptides or other chemicals. This provides a broad view of the metabolic, signalling, regulatory or other biochemical pathways in the animal being tested. The analysis of the induced perturbations in cellular transcription gives a detailed molecular description of the activity of the administered compound.
- RNA quantification system An analysis of a transcriptome has become an approachable reality with the implementation of high throughput RNA quantification system.
- the high-density microarrays allow collecting thousands of information points of a transcriptome at once, reaching the order of magnitude of the probable number of genes expressed and producing a broad and detailed view of the cellular events.
- Administration of compounds tiggers multiple cascades of intracellular signalling events, involving complex networks (pathways) and relying on protein modifications such as phosphorylation, glycosylation, etc. These events eventually lead to modifications of gene expression levels.
- Administration of an active compound therefore leads to multiple and interdependent changes in the composition of the transcriptome.
- the test animal is a vertebrate.
- the vertebrate is a mammal.
- the mammal is a primate, such as a cynomolgus monkey or a human.
- the administration of an agent or drug to a subject or patient includes self-administration and the administration by another.
- natural or synthetic substances of biological or non-biological sources e.g. amino acids, peptides, proteins, nucleotides, cDNAs, chemicals
- animals e.g. mice (Mus musculus), rat (Rattus norvegicus), monkey (Macaca fascicularis), by methods known in the art, e.g. by injection, inhalation, or oral administration. Administration of those substances can be adjusted in terms of time of exposure and dosage, and combinations thereof.
- the "treatment group" of animals should receive a substance or a combination of substances in a vehicle compound suitable for administration of the substance or the combination of substances, while the "control" (or “baseline”) group should receive the vehicle compound only.
- biological specimen such as tissue pieces ( e.g. obtained by biopsy), or body fluids, such as blood, urine, or saliva, can be sampled.
- tissue pieces e.g. obtained by biopsy
- body fluids such as blood, urine, or saliva
- all animals of all groups can be sacrificed and biological specimen such as whole organs or pieces thereof can be sampled. All sampled specimen can be stored as known in the art for further analysis that include, but are not limited to, RT-PCR, Northern blotting, in-situ hybridization, gene expression profiling with microarrays.
- direct administration is the injecting, oral gavage, feeding or other administration of a compound, such as a protein, into animals. After some time, i.e . hours, days or weeks, organs and tissues are collected from the animals and the geneexpression profiles determined. This procedure is commonly used in pharmacotoxigenomics, pharmacogenomics and the like.
- the invention begins with differentially expressed proteins in plasma between normal subjects and coronary artery diseased patients with regard to the identification and validation of potential targets and the identification of biomarkers.
- the drug discovery process of the invention is particularly amenable to the analysis of the smaller proteins of a proteome (ranging from 0.5 to 20 kDa) escaping the classical detection methods.
- Small molecular weight proteins can be readily synthesized by commercial methods (e.g. , MicroprotTM method, GeneProt, Geneva, Switzerland). Chemically-synthesized proteins can be rapidly produced and do not contain biological contaminants.
- mice For mice, a minimal amount of the compound to be functionalized (only ca. 5 mg) is used.
- indirect administration is the injecting of a gene that codes for that protein (as a cDNA plasmid) and then doing the gene expression profiling.
- the technology is the use of 'naked' DNA (a cDNA expression plasmid) injected into mice (or other animals). This technique is widely published for either DNA immunization ( Kim J-M et al., Gene Ther. 10(15): 1216-24 (August 2003 )) and delivery of genes for therapeutic purposes (Ali ⁇ o SF et al., Gene Ther. 10(19):1672-9 (September 2003 )).
- Gene expression profiles After a period of time (e.g., two weeks) of protein administration, the treated animals are necropsied. Selected tissues (e.g. , 25 tissues for mice/ 120 tissues for monkeys) are dissected and rapidly snap-frozen for genomics analysis. Organ samples (e.g. , fifty organs samples for monkeys) can be isolated for histopathological examinations and for gene expression localizations, such as by in situ hybridization. Initial studies have shown that for mice, 3-10 tissues out of twenty five sampled tissues are generally sufficient to characterize a compound by gene expression and - hybridization; for monkeys, twenty tissues out of 120 sampled tissues are generally sufficient.
- the methods of detecting the level of expression of mRNA are well-known in the art and include, but are not limited to, reverse transcription PCR, real time quantitative PCR, Northern blotting and other hybridization methods.
- a particularly useful method for detecting the level of mRNA transcripts obtained from a plurality of genes involves hybridization of labelled mRNA to an ordered array of oligonucleotides. Such a method allows the level of transcription of a plurality of these genes to be determined simultaneously to generate gene expression profiles or patterns.
- a gene expression profile is diagnostic when the increased or decreased gene expression is an increase or decrease (e.g. , at least a 1.2-fold difference) over the baseline gene expression following administration of a compound.
- a gene expression pattern is "higher than normal” when the gene expression ( e.g. , in a sample from a treated subject) shows a 1.2-fold difference ( i.e. , higher) in the level of expression compared to the baseline samples.
- a gene expression pattern is "lower than normal” when the gene expression ( e.g. , in a sample from a treated subject) shows a 1.2-fold difference ( i.e. , lower) in the level of expression compared to the baseline samples.
- a 1.5-fold change may be used as the criteria.
- Techniques for the detection of gene expression of the genes described by this invention include, but are not limited to northern blots, RT-PCT, real time PCR, primer extension, RNase protection, RNA expression profiling and related techniques.
- Techniques for the detection of gene expression by detection of the protein products encoded by the genes described by this invention include, but are not limited to, antibodies recognizing the protein products, western blots, immunofluorescence, immunoprecipitation, ELISAs and related techniques. These techniques are well known to those of skill in the art. Sambrook J et al., Molecular Cloning: A Laboratory Manual, Third Edition (Cold Spring Harbor Press, Cold Spring Harbor, 2000 ).
- the technique for detecting gene expression includes the use of a gene chip.
- Gene expression profiles can be generated using e.g. the Affymetrix microarray technology. Briefly, total or, preferably, polyA+-RNA from a biological sample is extracted using standard procedures known in the art, e.g. the RNeasy® kit (Qiagen, MD, USA). In a following step, double stranded cDNA is prepared in a process termed "reverse transcription (RT)" which is known in the art, using e.g. the "SuperScript Double-Stranded cDNA Synthesis Kit” (Invitrogen, CA, USA).
- RT reverse transcription
- double stranded cDNA obtained in a previous step is labelled with a fluorochrome by methods known in the art, using e.g. the ENZO Labeling Kit (ENZO, NY, USA).
- Labelled RNA is hybridized to oligonucleotide microarrays. These are known in the art and consist of a surface to which probes that correspond in sequence to gene products (e.g. mRNAs, polypeptides, fragments thereof etc.) can be specifically hybridized or bound to a known position.
- Processing of the microarrays including e.g. washing, staining, scanning, is performed according to the manufacturer's instructions.
- Hybridization intensity data detected by the scanner are automatically acquired and processed by analytical software components, e.g. the GENECHIP® software (Affymetrix, CA, USA). Raw data is normalized to expression levels using a target intensity of 200.
- Two elements of value in expression profiling are the quality and homogeneity of the tissue samples and the mRNA quality.
- the location of tissues to be sampled and each sample can be carefully dissected from the other surrounding tissues using a binocular microscope.
- the samples are then transferred to a molecular biology laboratory for RNA extraction.
- the protocol for RNA extraction can be partially automated thus increasing the reproducibility and speed of this step.
- the extracted RNA can be stored for long periods of time in a frozen state and kept as an archive.
- RNA is reverse transcribed to obtain a cDNA.
- cDNA is transcribed in the presence of a fluorescent label to obtain cRNA.
- the composition of the cRNA obtained is identical to the original composition of the RNA in the samples, but each molecule now carries a fluorescent marker.
- the labelled mixture of cRNA is used for the hybridization process, e.g. using GeneChip® assays (Affymetrix, Santa Clara, California USA).
- the raw data obtained after laser-scanning of the chip
- the raw data are processed by a specific algorithm condensing for each gene all available information in a unique value. This value called average difference represents the level of expression of the gene.
- the information can be further refined by the use of complementary techniques.
- In situ hybridization for example, can indicate precisely which cell type inside an organ is specifically expressing a given gene. This technique based on the detection of RNA is independent of the availability of an antibody. Quantitative PCR may also be used to confirm expression levels of particular genes of interest.
- clustering helps to reduce the complexity and the size of the data sets. Different types of clustering can be used to separate the different genes according to their behavioural similarity across the different conditions and to establish links between genes that may be related to the same biological phenomenon. Data processing also includes statistical tests to separate significant variations from experimental noise. However, the stringency of the various filtering steps must be modulated to integrate the biological nature of the data.
- the list of different affected genes is then compared to the information collected in the scientific literature.
- the synthesis of the available knowledge related to the different genes points to one or several signalling, metabolic or other biochemical pathways or to known modifications.
- the profiles may be associated with potential indications. The discrimination between the different hypotheses follows a process closely related to differential diagnosis.
- RNA expression profile of an unknown compound can be easily matched with existing information harvested from the general scientific knowledge. Linking this information with a potential indication or a potential side effect is then straightforward. Some combinations of expression changes are more difficult to translate into pharmacological information. In such cases, matching of the RNA expression profile of an unknown compound to the profile of a reference drug or disease may facilitate the interpretation. It may then not be necessary to reconstruct the entire cellular modifications to find a potential indication. The reference drugs and disease profiling will also help to build the critical mass of information into the database.
- microarray datasets can be analyzed by the use of analytical software components, such as GeneSpring® (Silicon Genetics, CA, USA).
- Microarray datasets consist in part of probe set identifiers that refer to an oligonucleotide sequence that is bound to the glass slide and to which a labelled cDNA (see above) with complementary sequence binds if it is present in the tissue or body fluid sample.
- the scanned intensity of the signal that is detected and converted into numeric values by a software, for example MAS5 (Affymetrix, CA, USA), is an indirect measure for the amount, or expression level of the cDNA present in the biological samples under investigation.
- the entity of gene expression levels as indicated by signal intensity values for all probe sets in a microarray dataset of a biological sample can be referred to as expression profile of that sample.
- signal intensity values, cDNA or gene annotations, as well as quality parameters that can be created by software, for example MAS5 (Affymetrix, CA, USA) are informational results associated with the probe set ID.
- probe sets can be filtered based on the associated values given by the software used to create the values, for example MAS5 (Affymetrix, CA, USA). Filters can be based on quality parameters, expression level, changes of expression levels in the samples from treated versus control specimen, as well as significance.
- the resulting list of probe sets refers to such genes that experience a significant change in their expression level as a direct or indirect result of the treatment of the biological samples they are derived from.
- the present invention also provides for the use of a polypeptide for the manufacture of a medicament for use in the treatment of a disease associated with deregulated angiogenesis, wherein the polypeptide is selected from the groups consisting of (a) fibroblast growth factor 23 (FGF-23) (SEQ. ID No: 1) or a fragment of FGF-23; (b) a bioactive polypeptide having a percentage of identity of at least 50% with the amino acid sequence of any one of the polypeptides of (a); or (c) a bioactive variant of any one of the polypeptides of (a) or (b).
- FGF-23 fibroblast growth factor 23
- the present invention provides for the use of a polypeptide as defined above for the manufacture of a medicament for use in the treatment of a cell proliferative disorder.
- polypeptide refers to a protein, peptide, oligopeptide or synthetic oligopeptide. These terms are intended to be used interchangeably. Any one of said terms refers to a chain of two or more amino acids which are linked together with peptide or amide bonds, regardless of post-translational modification such as glycosylation or phosphorylation.
- the polypeptides may also comprise more than one subunit, where each subunit is encoded by a separate DNA sequence.
- biological event refers to a molecule that elicits or affects a biological event.
- biological event may for example be related to a disease associated with deregulated angiogenesis or to a cell proliferative disorder.
- a "bioactive polypeptide” of the invention includes FGF-23, fragments of FGF-23 such as fragments derived from the C-terminus of FGF-23 . Also included are homologs which have an amino acid sequence having a percentage of identity of at least 50% to FGF-23 or fragments thereof and variants of FGF-23 or of FGF-23 fragments.
- the polypeptide according to the invention may comprise FGF-23 having the amino acid sequence of SEQ ID NO: I.
- a fragment of FGF 23 may comprise at least 10 amino acids, preferably at least 15, 20, 25 or 30 amino acids. More preferably a fragment of FGF-23 may comprise at least 50, 60, or 70 amino acids. Most preferably a fragment of FGF-23 comprises 75 amino acids.
- a fragment of FGF-23 may comprise at least 80 or 100 amino acids, and most preferred at least 120 or 150 amino acids.
- the fragment may comprise at least 180 amino acids, such as e.g. 200 amino acids.
- Such polypeptide may also be a proteolytic cleavage product of FGF-23 generated by proteases such as a membrane-bound endopeptidase including PHEX.
- a polypeptide according to the invention may comprise a C-terminal fragment of FGF-23.
- Such C-terminal fragment may comprise at least 15 amino acids of the C-terminus of FGF-23, preferably at least 25, at least 35 or 45, more preferably at least 55 or at least 65, most preferred at least 70, such as e.g. 75 amino acids.
- the at least 15 amino acids may comprise the most C-terminal at least 15 amino acids, it may also comprise the at least 15 amino acids within the C-terminal part of FGF-23.
- the polypeptide may comprise the at least 75 most C-terminal amino acids of FGF-23 and it may have the amino acid sequence of SEQ ID NO: 2, designated FGF-23 C-terminal polypeptide (FGF23CTP).
- the polypeptide may also have an amino acid sequence having a percentage of identity of at least 50%, preferably at least 60%, more preferred at least 70% or 80%, and most preferably at least 90% such as 95%, 97%, or 99% identity with the amino acid sequence of any one of the aforementioned polypeptides.
- bioactive polypeptides of the present invention as described above may also be referred to as FGF-23, FGF-23 protein or polypeptide, FGF-23 derived or related polypeptides, FGF-23 C-terminal derived or related polypeptides, or FGF-23 C-terminal Polypeptides.
- Amino acid residues are referred to herein by their standard single-letter or three-letter notations:A (Ala) alanine; C (Cys) cysteine; D (Asp) aspartic acid; E (Glu) glutamic acid; F (Phe) phenylalanine; G (Gly) glycine; H (His) histidine; I (Ile) isoleucine; K (Lys) lysine; L (Leu) leucine; M (Met) methionine; N (Asn) asparagine; P (Pro) proline; Q (Gln) glutamine; R (Arg) arginine; S (Ser) serine; T (Thr) threonine; V (Val) valine; W (Trp) tryptophan; Y (Tyr) tyrosine.
- percentage (%) of identity means that in an optimal alignment between the two sequences, the candidate sequence is identical to the reference sequence in a number of subunit positions equivalent to the indicated percentage, the subunits being nucleotides for polynucleotide comparisons or amino acids for polypeptide comparisons.
- an "optimal alignment" of sequences being compared is one that maximizes matches between subunits and minimizes the number of gaps employed in constructing an alignment. Percent identities may be determined with commercially available implementations of algorithms described by Needleman and Wunsch, J. Mol. Biol.
- a % amino acid sequence identity value is determined by the number of matching identical residues divided by the total number of residues in the aligned region. For example, to obtain a polypeptide having an amino acid sequence at least 95% identical to a reference amino acid sequence, up to five percent of the amino acid residues in the reference sequence may be deleted or substituted with another amino acid, or a number of amino acids up to five percent of the total amino acid residues in the reference sequence may be inserted into the reference sequence.
- candidate sequence may be a component or segment of a larger polypeptide or polynucleotide and that such comparisons for the purpose computing percentage identity is to be carried out with respect to the relevant component or segment.
- a polypeptide of the invention also includes a polypeptide fragment of a polypeptide of the invention.
- polypeptide fragment is meant to be a polypeptide having an amino acid sequence that entirely is the same in part, but not in all, of the amino acid sequence of a polypeptide of the invention.
- Such polypeptide fragment may be "freestanding,” or may be part of a larger polypeptide of which such polypeptide fragment forms a part or region, most preferably as a single continuous region.
- Preferably such polypeptide or polypeptide fragment retains the biological activity of the corresponding polypeptide of the invention.
- the invention also includes functionally preserved variants of the polypeptides or polypeptide fragments described herein.
- variants may be made using methods standard in the art, for example, by conservative amino acid substitutions. Typically such substitutions are among Ala, Val, Leu and Ile; among Ser and Thr; among the acidic residues Asp and Glu; among Asn and Gln; and among the basic residues Lys and Arg; or aromatic residues Phe and Tyr.
- Particularly preferred are variants in which several, 5 to 10, 1 to 5, or 2 amino acids are substituted, deleted or added, in any combination.
- polypeptide (fragment) or polypeptide variant may be linear or branched, it may comprise modified amino acids, it may be interrupted by non-amino acids, and/or it may be assembled into a complex of more than one polypeptide chain.
- a polypeptide may be modified naturally or by intervention; for example, disulfide bond formation, glycosylation, lipidation, acetylation phosphorylation, or any other manipulation or modification, such as conjugation with a labeling component.
- polypeptides or polypeptide fragments contain one or more analogs of an amino acid (including; for example, unnatural amino acids, etc.), as well as other modifications known in the art.
- a polypeptide or a polypeptide fragment of the invention includes isolated naturally occurring polypeptides.
- such a naturally occurring polypeptide has a frequency in a selected population of at least five percent, and most preferably, of at least ten percent.
- the selected population may be any recognized population of study in the field of population genetics.
- the selected population is Caucasian, Negroid, or Asian. More preferably, the selected population is French, German, English, Spanish, Swiss, Japanese, Chinese, Korean, Singaporean of Chinese ancestry, Icelandic, North American, Israeli, Arab, Turkish, Greek, Italian, Polish, Pacific Islander, or Indian.
- a polypeptide (fragment) of the invention may also include recombinantly produced polypeptides, synthetically produced polypeptides and a combination of such polypeptides of the invention, and fragments thereof.
- Means for preparing such polypeptides are well understood in the art.
- a polynucleotide fragment or a polypeptide of the invention can be isolated from body fluids including, but not limited to, serum, urine, and ascites, or synthesized by chemical or biological methods (for example, cell culture, recombinant gene expression).
- isolated if not otherwise specified herein includes the meaning "separated from coexisting material”.
- Recombinant polypeptides of the present invention may be prepared by processes well known in the art from genetically engineered host cells comprising expression systems. Accordingly, in a further aspect, the present invention relates to the production of polypeptides by recombinant techniques, to expression system which comprises a nucleic acid or nucleic acids encoding the polypeptides of the present invention, to host cells which are genetically engineered with such expression systems, and to methods to isolate the polypeptides.
- nucleic acid which hybridizes under stringent conditions to SEQ. ID No: 3 or to SEQ. ID No:4.
- the nucleic acid comprises at least 50, at least 75, at least 100, at least 125, or at least 150 nucleotides.
- the nucleic acid comprises at least 175 or ar least 200 nucleotides. In particular it comprises 225 or 228 nucleotides.
- the nucleic acid may also comprise at least 300, or at least 400 or 500 nucleotides.
- it may comprise at least 600 or at least 700 nucleotides.
- Such nucleic acids may comprise contiguous nucleotides of SEQ ID No: 3 or 4 or contiguous nucleotides able to hybridize to SEQ ID NO: 3 or 4 under stringent conditions.
- nucleic acid means natural or semi-synthetic or synthetic or modified nucleic acid molecules. It refers to nucleotide sequences, oligonucleotides or polynucleotides including deoxyribonucleic acid (DNA) and/or ribonucleic acid (RNA) and/or modified nucleotides. These terms are intended to be used interchangeably.
- RNA may be in the form of an tRNA (transfer RNA), snRNA (small nuclear RNA), rRNA (ribosomal RNA), mRNA (messenger RNA), anti-sense RNA, and ribozymes.
- DNA may be in form of plasmid DNA, viral DNA, linear DNA, chromosomal or genomic DNA, cDNA, or derivatives of these groups.
- these DNAs and RNAs may be single, double, triple, or quadruple stranded.
- PNAs peptide nucleic acids
- phosphorothioates and other variants of the phosphate backbone of native nucleic acids.
- “Stringent conditions" of hybridization reactions is readily determinable by one of ordinary skill in the art, and generally is an empirical calculation dependent upon probe length, washing temperature, and salt concentration. In general, longer probes require higher temperatures for proper annealing, while shorter probes need lower temperatures. Hybridization generally depends upon the ability of a denatured nucleic acid to reanneal when complementary strands are present in an environment near but below their melting temperature. The higher the degree of homology between the probe and the hybridizable sequence such as SEQ. ID No: 3 or 4, the higher the relative temperature which can be used. As a result, it follows that higher relative temperatures would tend to make the reaction conditions more stringent, while lower temperatures less so. Moreover, stringency is also inversely proportional to salt concentrations.
- “Stringent conditions” are exemplified by reaction conditions characterized by: (1) low ionic strength and high temperature for washing, for example 0.015 M sodium Chloride/0.0015 M sodium citrate/0.1 % sodium dodecyl sulfate at 50°C; (2) the use of a denaturing agent, such as formamide, for example, 50% (vol/vol) formamide with 0.1% bovine serum albumin/0.1 % Ficoll/0.1% polyvinylpyrrolidone/50 mM sodium phosphate buffer at pH 6.5 with 750 mM sodium chloride, 75 mM sodium citrate at 42°C.
- a denaturing agent such as formamide, for example, 50% (vol/vol) formamide with 0.1% bovine serum albumin/0.1 % Ficoll/0.1% polyvinylpyrrolidone/50 mM sodium phosphate buffer at pH 6.5 with 750 mM sodium chloride, 75 mM sodium citrate at 42°C.
- stringent conditions can be: 50% formamide, 5x SSC (0.75 M NaCl, 0.075 M sodium citrate), 50 mM sodium phosphate (pH 6.8), 0.1% sodium pyrophosphate, 5x Denhardt's solution, sonicated salmon sperm DNA (50 ⁇ g/ml), 0.1% SDS, and 10% dextran sulfate at 42°C, with washes at 42°C in 0.2x SSC (sodium chloride/sodium citrate) and 50% formamide at 55°C, followed by a high-stringency wash consisting of 0.1x SSC containing EDTA at 55°C.
- nucleic acids described herein such as SEQ. ID No: 3 or 4 may be used in recombinant DNA molecules to direct the expression of the corresponding polypeptides in appropriate host cells. Because of the degeneracy in the genetic code, other DNA sequences may encode the equivalent amino acid sequence, and maybe used to clone and express FGF-23 or fragments thereof. Codons preferred by a particular host cell may be selected and substitued into the naturally occuring nucleotide sequences, to increase the rate and/or efficiency of expression.
- the nucleic acid e.g., cDNA or genomic DNA
- encoding the desired FGF-23 or FGF-23 fragments such as FGF23CTP may be inserted into a replicable vector for cloning (amplification of the DNA), and/or for expression.
- polypeptide can be expressed recombinantly in any of a number of expression systems according to methods known in the art ( Ausubel, et al., editors, Current Protocols in Molecular Biology, John Wiley Sons, New York, 1990 ).
- Such expression systems include chromosomal, episomal and virus-derived systems, e.g., vectors derived from bacterial plasmids, from bacteriophage, from transposons, from yeast episomes, from insertion elements, from yeast chromosomal elements, from viruses such as baculoviruses, papova viruses, such as SV40, vaccinia viruses, adenoviruses, fowl pox viruses, pseudorabies viruses and retroviruses, and vectors derived from combinations thereof, such as those derived from plasmid and bacteriophage genetic elements, such as cosmids and phagemids.
- the expression systems may contain control regions that regulate as well as engender expression.
- any system or vector which is able to maintain, propagate or express a nucleic acid to produce a polypeptide in a host may be used.
- the appropriate nucleotide sequence may be inserted into an expression system by any of a variety of well-known and routine techniques, such as, for example, those set forth in Sambrook et al., Molecular Cloning: A Laboratory Manual, 2nd Ed., Cold Spring Harbor Laboratory Press, Cold Spring Harbor, N.Y. (1989 ).
- DNA is inserted into an appropriate restriction endonuclease site using techniques known in the art.
- Vector components generally include, but are not limited to, one or more of an origin of replication, one or more marker genes, an enhancer element, a promoter, a signal or secretion sequence, and a transcription termination sequence:
- the expression vector may have two replication systems, thus allowing it to be maintained in two organisms, for example in mammalian or insect cells for expression and in a prokaryotic host for cloning and amplification.
- Such sequences are well known for a variety of bacteria, yeast strains, and viruses.
- the expression vector contains a marker gene to allow the selection of transformed host cells.
- Selection genes are well known in the art and will vary with the host cell used _
- Expression and cloning vectors will typically contain a selection gene, also termed a selectable marker.
- Typical selection genes encode proteins that (a) confer resistance to antibiotics or other toxins, e.g., ampicillin, neomycin, methotrexate, or tetracycline, (b) complement auxotrophic deficiencies, or (c) supply critical nutrients e.g., the D-alanine racemase gene.
- Promoter sequences encode either constitutive or inducible promoters.
- the promoters may be either naturally occurring promoters or hybrid promoters. Hybrid promoters, which combine elements of more than one promoter, are also known in the art, and are useful in the present invention.
- the expression vector contains at least one sequence homologous to the host cell genome, and preferably, two homologous sequences which flank the expression construct.
- the integrating vector may be directed to a specific locus in the host cell by insertion of the appropriate homologous sequence in the vector. Constructs for integrating vectors are well known in the art.
- An appropriate secretion signal may be incorporated into the desired polypeptide to allow secretion of the polypeptide into the lumen of the endoplasmic reticulum, the periplasmic space or the extracellular environment. These signals may be endogenous to the polypeptide or they may be heterologous signals.
- the signal sequence may be a prokaryotic signal sequence selected, for example, from the group of the alkaline phosphatase, penicillinase, lpp, or heat-stable enterotoxin II leaders.
- yeast secretion the signal sequence may be, e.g., the yeast invertase leader, the alpha factor leader (including Saccharomyces and Kluyveromyces ⁇ -factor leaders).
- mammalian signal sequences from secreted polypeptides of the same or related species, as well as viral secretory leaders may be used to direct secretion of FGF-23 or fragments thereof such as FGF23CTP.
- Appropriate host cells include yeast, bacteria, archebacteria, fungi, and insect and animal cells, including mammalian cells, for example primary cells, including but not limited to stem cells.
- suitable hosts include bacterial cells, such as E. coli. Streptococci, Staphylococci, Streptomyces, and Bacillus subtilis, fungal cells, such as Saccharomyces cerevisiae, other yeast cells orAspergillus; insect cells such as Drosophila S2 and Spodoptera Sf9 cells; animal cells such as CHO, COS, HeLa, C127, 3T3, BHK, HEK 293 and Bowes melanoma cells, and plant cells.
- a host cell strain may be chosen for its ability to modulate the expression of the inserted sequences or to process the expressed polypeptide in the desired fashion.
- modifications of the polypeptide include, but are not limited to, acetylation, carboxylation, glycosylation, phosphorylation, lipidation and acylation.
- Post-translational processing which cleaves a "prepro" form of the polypeptide, may also be important for correct insertion, folding and/or function.
- FGF-23 or fragments thereof such as FGF23CTP may be produced by culturing a host cell transformed with an expression vector containing a nucleic acid encoding an FGF-23 or fragments thereof under the appropriate conditions to induce or cause expression of the protein or polypeptide.
- a host cell is provided which is stably or transiently transfected with a nucleic acid of SEQ. ID No: 3 or 4 or transfected with a nucleic acid which hybridizes under stringent conditions to SEQ. ID No: 3 or 4.
- said host cell is cultured to allow expression of FGF-23 or of an FGF-23 fragment, and the polypeptide is isolated from the cell culture.
- Transformed host cells include, but are not limited to, microorganisms such as bacteria transformed with recombinant bacteriophage, plasmid or cosmic DNA expression vectors, yeast transformed with yeast expression vectors, and insect cells infected with a recombinant insect virus (such as baculovirus), and mammalian expression systems.
- microorganisms such as bacteria transformed with recombinant bacteriophage, plasmid or cosmic DNA expression vectors, yeast transformed with yeast expression vectors, and insect cells infected with a recombinant insect virus (such as baculovirus), and mammalian expression systems.
- FGF-23 or fragments thereof such as FGF23CTP will vary with the choice of the expression vector and the host cell, and will be easily ascertained by one skilled in the art through routine experimentation.
- the use of constitutive promoters in the expression vector will require optimizing the growth and proliferation of the host cell, while the use of an inducible promoter requires the appropriate growth conditions for induction.
- the timing of the harvest is important.
- the baculoviral systems used together with insect cells are lytic viruses, and thus harvest time selection can be crucial for product yield,
- the desired FGF-23 or FGF-23 fragment may be produced recombinantly not only directly, but also as a fusion polypeptide with a heterologous polypeptide.
- Such heterologous polypeptide is generally placed at the amino- or carboxyl-terminus of FGF-23 or of an FGF-23 fragment and may provide for an epitope tag to which an anti-tag antibody can selectively bind.
- epitope tag enables FGF-23 or a fragment thereof to be readily purified by using an anti-tag antibody or another type of affinity matrix that binds to the epitope tag.
- epitope tags are 6xHis or c-myc tag.
- FGF-23 or a fragment thereof may be expressed in the form of e.g.
- an GST-fusion protein an GST-fusion protein.
- Appropriate constructs are generally known in the art and are available from commercial suppliers such as Invitrogen (San Diego, Calif.), Stratagene (La Jolla, Calif.), Gibco BRL (Rockville, Md.) or Clontech (Palo Alto, Calif.).
- Gene expression may be evaluated in a sample directly, for example, by standard techniques known to those of skill in the art, e.g., Southern blotting for DNA detection, Northern blotting to determine the transcription of mRNA, dot blotting (DNA or RNA), or in situ hybridization, using an appropriately labeled probe, based on the sequences provided herein.
- antibodies may be used in assays for detection of nucleic acids, such as specific duplexes, including DNA duplexes, RNA duplexes, and DNA-RNA hybrid duplexes or DNA-protein duplexes.
- Such antibodies may be labeled and the assay carried out where the duplex is bound to a surface, so that upon the formation of duplex on the surface, the presence of antibody bound to the duplex can be detected.
- Gene expression alternatively, may be measured by immunohistochemical staining of cells or tissue sections and assay of cell culture or body fluids, to directly evaluate the expression of FGF-23 or of an FGF-23 fragment.
- Antibodies useful for such immunological assays may be either monoclonal or polyclonal, and may be prepared against a native sequence FGF-23 or FGF-23 fragments based on the DNA sequences provided herein.
- Expressed FGF-23 or an FGF-23 fragment such as FGF23CTP may be purified or isolated after expression, using any of a variety of methods known to those skilled in the art. The appropriate technique will vary depending upon the way of expression of FGF-23 or an FGF-23 fragment.
- the polypeptide may for example be recovered from culture medium in the form of a secreted potein or from host cell lysates. Cells can be disrupted by various physical or chemical means, such as freeze thaw cycling, sonication, mechanical disruption, or by use of cell lysing agents, whereas membrane-bound polypeptides may be released from the membrane using a suitable detergent solution (e.g.
- Triton-X100 Triton-X100 or by enzymatic cleavage.
- the appropriate technique for polypeptide purification or isolation will also vary depending upon what other components are present in the sample.
- the degree of purification necessary will also vary depending on the use of FGF-23 or a fragment thereof.
- Contaminant components that are removed by isolation or purification are materials that would typically interfere with diagnostic or therapeutic uses for the polypeptide, and may include enzymes, hormones, and other solutes.
- the purification step(s) selected will depend, for example, on the nature of the production process used and the particular FGF-23 or FGF-23 fragment produced.
- isolated FGF-23 or a fragment thereof will be prepared by at least one purification step.
- Well-known methods for purification include ammonium sulfate or ethanol precipitation, acid extraction, anion or cation exchange chromatography, phosphocellulose chromatography, hydrophobic interaction chromatography, high performance liquid chromatography, hydroxylapatite chromatography and lectin chromatography.
- affinity chromatography is employed for purification.
- the FGF-23 or a fragment thereof such as FGF23CTP may be purified using a standard anti-FGF-23 C-terminal polypeptide antibody column.
- Ultrafiltration and dialysis techniques in conjunction with protein concentration, are also useful (see, for example, Scopes, R., Protein Purification, Springer-Verlag, New York, N.Y., 1982).
- Well-known techniques for refolding proteins may be employed to regenerate active conformation when the polypeptide is denatured during isolation and or purification
- the nucleic acids, proteins and antibodies of the invention may be labeled.
- labeled herein is meant that a compound has at least one element, isotope or chemical compound attached to enable the detection of the compound.
- labels fall into three classes: a) isotopic labels, which may be radioactive or heavy isotopes; b) immune labels, which may be antibodies or antigens; and c) colored or fluorescent dyes.
- the labels may be incorporated into the compound at any position that does not interfere with the biological activity or characteristic of the compound which is being detected.
- FGF-23 and FGF-23 fragments Polypeptides or fragments thereof may be produced not only by recombinant methods, but also by using chemical methods well known in the art.
- Solid phase peptide synthesis may be carried out in a batchwise or continuous flow process which sequentially adds alpha-amino and side chain-protected amino acid residues to an insoluble polymeric support via a linker group.
- a linker group such as methylamine-derivatized polyethylene glycol is attached to poly(styrene-co-divinylbenzene) to form the support resin.
- the amino acid residues are Nalpha-protected by acid labile Boc (t-butyloxycarbonyl) or base-labile Fmoc (9-fluorenylmethoxycarbonyl).
- the carboxyl group of the protected amino acid is coupled to the amine of the linker group to anchor the residue to the solid phase support resin.
- Trifluoroacetic acid or piperidine are used to remove the protecting group in the case of Boc or Fmoc, respectively.
- Each additional amino acid is added to the anchored residue using a coupling agent or pre-activated amino acid derivative, and the resin is washed.
- the full length peptide is synthesized by sequential deprotection, coupling of derivatized amino acids, and washing with dichloromethane and/or N, N-dimethylformamide.
- the peptide is cleaved between the peptide carboxy terminus and the linker group to yield a peptide acid or amide.
- Automated synthesis may also be carried out on machines such as the ABI 431 A peptide synthesizer (Applied Biosystems).
- a polypeptide or a fragment thereof may be purified by preparative high performance liquid chromatography and its composition confirmed by amino acid analysis or by sequencing ( Creighton T.E. (1984) Proteins, Structures and Molecular Properties, W H Freeman, New York N.Y .).
- Variants of the natural polypeptide may be desirable in a variety of circumstances. For example, undesirable side effects might be reduced by certain variants, particularly if the side effect activity is associated with a different part of the polypeptide from that of the desired activity.
- the native polypeptide may be susceptible to degradation by proteases. In such cases, selected substitutions and/or deletions of amino acids which change the susceptible sequences can significantly enhance yields. Variants may also increase yields in purification procedures and/or increase shelf lives of proteins by eliminating amino acids susceptible to oxidation, acylation, alkylation, or other chemical modifications.
- such variants include alterations that are conformationally neutral, i.e.
- variant polypeptides are designed to produce minimal changes in the tertiary structure of the variant polypeptides as compared to the native polypeptide, and (ii) antigenically neutral i.e. they are designed to produce minimal changes in the antigenic determinants of the variant polypeptides as compared to the native polypeptide.
- the aforementioned polypeptides may according to the invention be used for the manufacture of a medicament for use in the treatment of a disease associated with deregulated angiogenesis or a cell proliferative disorder.
- treatment refers to both therapeutic treatment and prophylactic or preventative measures. Those in need of treatment include those already with the disorder as well as those in which the disorder is to be prevented.
- a “disorder” or a “disease” is any condition that would benefit from treatment with FGF-23 or a fragment of FGF-23 as defined above and further below. This includes both chronic and acute disorders, as well as those pathological conditions which predispose to the disorder or disease in question.
- disorders or diseases to be treated herein include any condition which results from deregulated angiogenesis or from deregulated cell proliferation.
- diseases associated with deregulated angiogenesis include: ocular neovascularisation, such as retinopathies (including diabetic retinopathy), age-related macular degeneration, psoriasis, haemangioblastoma, haemangioma, arteriosclerosis, inflammatory diseases, such as rheumatoid or rheumatic inflammatory diseases, especially arthritis, such as rheumatoid arthritis, or other chronic inflammatory disorders, such as chronic asthma, arterial or post-transplantational atherosclerosis, endometriosis, and especially neoplastic diseases, for example so-called solid tumors and liquid tumors (such as leukemias).
- ocular neovascularisation such as retinopathies (including diabetic retinopathy), age-related macular degeneration, psoriasis, haemangioblastoma, haemangioma, arteriosclerosis
- inflammatory diseases such as rheumatoid or r
- a preferred example of a diseases associated with deregulated angiogenesis is selected from the group of retinopathies, age-related macular degeneration, haemangioblastoma, haemangioma, and tumors.
- a particularly preferred example of a diseases associated with deregulated angiogenesis is retinopathy.
- cell proliferative disorders include: chronic or acute renal diseases, e.g. diabetic nephropathy, malignant nephrosclerosis, thrombic microangiopathy syndromes or transplant rejection, or especially inflammatory renal disease, such as glomemloncephritis, especially mesangioproliferative glomerulonephritis, haemolyticuraemic syndrome, diabetic nephropathy, hypertensive nephrosclerosis, atheroma, arterial restinosis, actinic keratosis, arteriosclerosis, atherosclerosis, bursitis, hepatitis, mixed connective tissue disease (MCTD), myelofibrosis, paroxysmal nocturnal hemoglobinuria, polycythemia vera, psoriasis, primary thrombocythemia, and autoimmune diseases, acute inflammation, fibric disorders (e.g.
- chronic or acute renal diseases e.g. diabetic nephropathy, malignant
- hepatic cirrhosis diabetes, endometriosis, chronic asthma, neurodegenerative disorders and especially neoplastic diseases such as adenocarcinoma, gliomas, leukemia, lymphoma, melanoma, myeloma, sarcoma, Kaposi's sarcoma, teratocarcinoma, and, in particular, cancers of the adrenal gland, bladder, bone, bone marrow, brain, breast, cervix, colon, gall bladder, ganglia, gastrointestinal tract, heart, kidney, liver, lung (especially small-cell lung cancer), muscle, ovary, pancreas, parathyroid, penis, prostate, salivary glands, skin, spleen, testis, thymus, thyroid, and uterus.
- neoplastic diseases such as adenocarcinoma, gliomas, leukemia, lymphoma, melanoma, myeloma, sarcoma,
- a preferred example of a cell proliferative disorder is selected from the group of chronic or acute renal diseases, arteriosclerosis, atherosclerosis, psoriasis, endometriosis, diabetes, chronic asthma and cancer.
- a particularly preferred example of a cell proliferative disorder is cancer.
- Another aspect of the invention relates to a method for the treatment of a disease associated with deregulated angiogenesis which comprises administering an effective amount of a polypeptide to a mammal including a human suffering from the disease, wherein the polypeptide is selected from the groups consisting of (a) FGF-23 (SEQ. ID No: 1) or a fragment of FGF-23; (b) a bioactive polypeptide having a percentage of identity of at least 50% with the amino acid sequence of any one of the polypeptides of (a); or (c) a bioactive variant of any one of the polypeptides of (a) or (b). Accordingly, a polypeptide as described above may be administered.
- a polypeptide as described above may be administered.
- Another aspect of the invention relates to a method for the treatment of a cell proliferative disorder comprising administering an effective amount of FGF-23 or an FGF-23 fragment such as FGF23CTP as described above to a mammal including a human suffering from the disorder.
- mammal for purposes of treatment refers to any animal classified as a mammal, including humans, domestic and from animals, and zoo, sports, or pet animals, such as dogs, horses, cats, sheep, pigs, cattle, etc. Preferably, the mammal is human.
- the composition of the invention is administered in effective amounts.
- compositions may be used in the foregoing methods of treatment.
- Such compositions are preferably sterile and contain an effective amount of FGF-23 or an FGF-23 fragment such as FGF23CTP or a nucleic acid encoding the polypeptide for inducing the desired response in a unit of weight or volume suitable for administration to a patient.
- an “effective amount" of FGF-23 or fragment thereof, compound, or pharmaceutical composition is an amount sufficient to effect beneficial or desired results including clinical results such as inhibiting premature or diabetic retinopathy, inhibiting angiogenesis, shrinking the size of the tumor, retardation of cancerous cell growth, decreasing one or more symptoms resulting from the disease or disorder, increasing the quality of life of those suffering from the disease or disorder, decreasing the dose of other medications required to treat the disease or disorder, enhancing effect of another medication, delaying the progression of the disease or disorder, and/or prolonging survival of patients, either directly or indirectly.
- an effective amount can be administered in one or more administrations and may or may not be achieved in conjunction with another drug, compound, or pharmaceutical composition.
- an "effective amount" may be considered in the context of administering one or more therapeutic agents, and a single agent may be considered to be given in an effective amount if, in conjunction with one or more other agents, a desirable result may be or is achieved.
- An effective amount of FGF-23 or an FGF-23 fragment or the pharmaceutical composition comprising the polypeptide of the invention, alone or in conjunction with another drug, compound, or pharmaceutical composition can be administered by any conventional route, including injection or by gradual infusion over time.
- the administration may, for example, be oral, intravenous, intraperitoneal, intramuscular, intracavity, subcutaneous, topical or transdermal.
- the pharmaceutical composition of the present invention When administered, the pharmaceutical composition of the present invention is administered in pharmaceutically acceptable preparations.
- pharmaceutically-acceptable carrier means one or more compatible solid or liquid fillers, diluents or encapsulating substances which are suitable for administration into mammals including humans.
- carrier denotes an organic or inorganic ingredient, natural or synthetic, with which the active ingredient is combined to facilitate the application.
- pharmaceutically acceptable means a non-toxic material that does not interfere with the effectiveness of the biological activity of the active ingredients. Such preparations may routinely contain pharmaceutically acceptable concentrations of salts, buffering agents, preservatives, compatible carriers, supplementary immune potentiating agents such as adjuvants and cytokines and optionally other therapeutic agents, such as chemotherapeutic agents.
- salts When used in medicine, the salts should be pharmaceutically acceptable, but non-pharmaceutically acceptable salts may conveniently be used to prepare pharmaceutically-acceptable salts thereof and are not excluded from the scope of the invention.
- the pharmaceutical compositions may contain suitable buffering agents, including: acetic acid in a salt; citric acid in a salt; boric acid in a salt; and phosphoric acid in a salt.
- suitable buffering agents including: acetic acid in a salt; citric acid in a salt; boric acid in a salt; and phosphoric acid in a salt.
- compositions also may contain, optionally, suitable preservatives, such as: benzalkonium chloride; chlorobutanol; parabens and thimerosal.
- suitable preservatives such as: benzalkonium chloride; chlorobutanol; parabens and thimerosal.
- the doses of polypeptide or nucleic acid encoding said polypeptide administered to a subject can be chosen in accordance with different parameters, in particular in accordance with the mode of administration used and the state of the subject Other factors include the desired period of treatment. In the event that a response subject is insufficient at the initial doses applied, higher doses (or effectively higher doses by a different, more localized delivery route) may be employed to the extent that patient tolerance permits.
- compositions may conveniently be presented in unit dosage form and may be prepared by any of the methods well-known in the art of pharmacy. All methods include the step of bringing the active agent into association with a carrier which constitutes one or more accessory ingredients. In general, the compositions are prepared by uniformly and intimately bringing the active compound into association with a liquid carrier, a finely divided solid carrier, or both, and then, if necessary, shaping the product.
- compositions suitable for oral administration may be presented as discrete units, such as capsules, tablets, lozenges, each containing a predetermined amount of the active compound.
- Other compositions include suspensions in aqueous liquids or non-aqueous liquids such as a syrup, elixir or an emulsion.
- compositions suitable for parenteral administration conveniently comprise a sterile aqueous or non-aqueous preparation of a polypeptide or nucleic acid encoding the polypeptide, which is preferably isotonic with the blood of the recipient.
- This preparation may be formulated according to known methods using suitable dispersing or wetting agents and suspending agents.
- the sterile injectable preparation also may be a sterile injectable solution or suspension in a non-toxic parenterally-acceptable diluent or solvent, for example, as a solution in 1,3-butane diol.
- acceptable vehicles and solvents that may be employed are water, Ringer's solution, and isotonic sodium chloride solution.
- sterile, fixed oils are conventionally employed as a solvent or suspending medium.
- any bland fixed oil may be employed including synthetic mono- or diglycerides.
- fatty acids such as oleic acid may be used in the preparation of injectables.
- Carrier formulation suitable for oral, subcutaneous, intravenous, intramuscular, etc. administrations can be found in Remington's Pharmaceutical Sciences, Mack Publishing Co., Easton, PA.
- reference drugs are concurrently investigated with the discovery method of the invention. For this screening, one control and four treated groups of six males are treated for two weeks by daily administration by the subcutaneous route of the proteins.
- the reference drugs can be active for treating conditions in the areas of glaucoma, neuroprotection, neovascularisation, antiangiogenesis, acne, asthma and allergy, cardiovascular diseases, neurological disorder, pain, diabetes, hypercholesterolemia, osteoporosis and oncology.
- the expectations from those selected active peptides are that (a) several potential therapeutic drugs could be identified; (b) target peptides for therapeutic antibodies could be identified; (c) new targets for research, deduced from the reconstructed biochemical pathways, could be identified; and (d) biomarkers, to be used to develop diagnostic tests could be identified.
- Bioinformatic investigations of gene expression in mice suggest therapeutic indications and insight through the analysis of molecular pathways and functions, which allow prioritizing for the verification of selected proteins/peptides in monkeys.
- the protein/peptide selection rate is approximately 20%.
- the selection/prioritization criteria are the type of activity, the therapeutic interest and the suspected toxicity.
- mice Five peptides with unidentified function were tested in mice to obtain biochemical and pharmacogenomic data that would allow a specification of their activity.
- Outbred CD-1 mice were treated with peptides GPA018, GPA019, GPA020, GPA022, and GPA023 for seven days, observed for clinical signs of treatment effects (mortality, clinical signs, body weight, food consumption, haematology, clinical biochemistry) and, after sacrifice, a selected set of tissues were used for gene expression profiling. A snap freezing sampling of the tissues was performed at necropsy at the end of the treatment period. These tissues were used for mRNA expression profiling and for histopathological analysis (formalin fixation). In addition, parameters investigated in a standard exploratory study were recorded. None of the peptides had any influence on clinical or pharmacogenomic parameters. Gene expression profiling revealed no significant changes between control and treated animals. It was concluded that the peptides were inactive and decided that no further investigations on these peptides would follow.
- Peptides GPA018, GPA019, GPA020, GPA022, and GPA023 were administered subcutaneously to CD-1 mice for seven days at a dose of 300 mcg/day.
- the choice of CD-1 mice (an outbred strain from Charles River Laboratories, l'Arberesle, France) was made to increase the mouse organ weight and, hence, yield of RNA for microarray analysis.
- Four animals per treatment arm and gender were used. At the beginning of the treatment period, the animals were 12 to 14 weeks old. Body weight averaged 42.2g (38 to 45.6 g). Animals were kept under standard conditions for animal welfare.
- Dosage forms were prepared once before the beginning of the treatment period. Each test item was dissolved in the vehicle (PBS) in order to achieve the required concentration. The dosage forms obtained were divided into aliquots and stored at -20°C pending use. Two aliquots were prepared for each group and day. The aliquots for treatment were delivered twice on each day of treatment to the animal room.
- PBS vehicle
- the dosage forms obtained were divided into aliquots and stored at -20°C pending use. Two aliquots were prepared for each group and day. The aliquots for treatment were delivered twice on each day of treatment to the animal room.
- Blood samples were collected from each animal. The serum samples were deep frozen (approximately -80°C) until analyses for hormone determination.
- tissues were sampled, including brain, duodenum (caecum), liver, kidney, muscle and spleen (blood).
- duodenum caecum
- liver liver
- kidney muscle
- spleen blood
- male and female animals were used in the kidney and in the liver assays. All other tissue samples were derived from males only.
- Samples for gene expression profiling were quick-frozen in liquid nitrogen immediately after excision, stored on dry ice and subsequently in a deep-freezer at approximately -80°C until further use.
- GeneChip ® assays All GeneChip® assays were conducted as recommended by the manufacturer of the GeneChip system (Affymetrix, Expression Analysis Technical Manual, (Affymetrix, Santa Clara, Calif. USA, 2003). Genome MG-U74Av2 expression probe array set (Affymetrix, Inc., San Diego, Calif. USA) were used.
- Double stranded cDNA was synthesized with a starting amount of approximately 5 ⁇ g full-length total RNA using the Superscript Choice System (Invitrogen Life Technologies) in the presence of a T7-(dT)24 DNA oligonucleotide primer.
- the cDNA was purified by phenovchloroformlisoamylalcohol extraction and ethanol precipitation.
- the purified cDNA was then transcribed in vitro using the BioArray® High Yield RNA Transcript Labeling Kit (ENZO, Farmingdale, New York, USA) in the presence of biotinylated ribonucleotides form biotin labelled cRNA.
- the labelled cRNA was then purified on an affinity resin (Rneasy®, Qiagen), quantified and fragmented. An amount of approximately 10 ⁇ g labelled cRNA was hybridized for approximately 16 hours at 45°C to an expression probe array. The array was then washed and stained twice with streptavidin-phycoerythrin (Molecular Probes, Eugene, Oregon, USA) using the GeneChip® Fluidics Workstation 400 (Affymetrix).
- the array was then scanned twice using a confocal laser scanner (GeneArray® Scanner, Agilent, Palo Alto, Calif. USA) resulting in one scanned image.
- This resulting ".dat-file” was processed using the MAS4 program (Affymetrix) into a "cel-life”.
- the ".cel file” was captured and loaded into the Affymetrix GeneChip Laboratory Information Management System (LIMS).
- the LIMS database is connected to a UNIX Sun Solaris server through a network filing system that allows for the average intensities for all probes cells (CEL file) to be downloaded into an Oracle database.
- Raw data was converted to expression levels using a "target intensity” of 150.
- the data were checked for quality and loaded into the GeneSpring® software 5.0.3 (Silicon Genetics, Redwood City, Calif. USA) for analysis.
- hybridizations were performed using GAPDH or ⁇ -action probes.
- RNA samples were studied by using the human Affymetrix MG-U74Av2 GeneChip®.
- probe-sets for individual genes contain 20 oligonucleotide pairs, each composed of a "perfect match” 25-mer and a "mismatch” 25-mer differing from the "perfect” match oligonucleotide at a single base.
- the expression level is estimated by averaging the differences in signal intensity measured by oligonucleotide pairs of a given probe (AvgDiff value).
- the image acquisition and numerical translation software used for this study was the Affymetrix Microarray Suite version 4 (MAS5). The numerical values were stored and transferred for the analysis into the Silicon Genetics GeneSpring® 5.0.3 software toolkit.
- an expression restriction filter was applied (ADV >60 in 50% of the samples), and a statistical filter as described above was added.
- a fold change filter (provided by Silicon Genetics) was used after the expression restriction to find genes with a change in gene expression above a certain level, and then a statistical filter applied.
- the decision to considers a specific gene relevant is based on a conjunction of numerical changes identified by exploratory filtering and statistical algorithms as described above and the relationship to other modulated genes that point to a common biological theme. The weight of that relationship is assessed by the analyst through a review of the relevant scientific literature.
- GPA018 shows some sequence similarity to the N-terminal region of mLTBP-2 (murine latent transforming growth factor binding protein-2). LTBP proteins aid the LAP (latency associated protein)-TGF ⁇ complex to become secreted and binds it to the ECM (extracellular matrix)-structural protein fibrillin ( Annes JP et al., J. Cell Sci. 116(Pt2):217-24 (2003 ); Chen S et al., Nucl. Acids Res.
- TGF ⁇ type I-receptor (ALK-5) Overexpression downregulates integrin ⁇ 5 and LTBP1 expression ( Ota T et al., J. Cell Physiol. 193(3):299-318 (2002) ) LEF TGF ⁇ induces expression of LEF1 target genes; crosstalk between wnt and TGF ⁇ pathway ( Hu MC et al., Development 130(12):2753-2766 (2002) ; Letamendia A et al., J. Bone Joint Surg. Am.
- Amyloid ⁇ precursor protein TGF ⁇ 1 potentates amyloid- ⁇ generation in astrocytes and in transgenic mice; induces overexpression of APP ( Lesne S et al., J. Biol. Chem. 278(20):18408-18 (2003) ) Transgelin (SM22 ⁇ ) TGF ⁇ type I-receptor (ALK-5) overexpression leads to upregulation of SM22 ⁇ ( Chen S et al., Nucl. Acids Res. 31(4):1302-10 (2003) ; Ota T et al., J. Cell Physiol.
- Vitamin D receptor Vitamin D3 induces expression of TGF ⁇ 2; Smad3 binds and activates VDR ( Yang L et al., J. Cell Physiol. 188(3):383-93 (2001) ; Aschenbrenner JK et al., T. Surg. Res. 100(2):171-5 (2001) ) Ephrin B2 Ephrin A1 expression is decreased by ALK-5 overexpression ( Ota T et al., J. Cell Physiol.
- the aim of this EXAMPLE was to identify for the peptide FGF23CTP modes of action with possible therapeutic applications by multi-organ microarray profiling in monkey.
- the peptide FGF23CTP (GPA006, GeneProt, Geneva, Switzerland) is derived from a unique COOH-terminal domain of the FGF-23. It is a unique 75-mer COOH-terminal peptide of FGF-23 with no homology to regions of other FGF family members. See, PCT patent application WO 02/088,358 , the contents of which are incorporated by reference.
- FGF-23 transcripts are preferentially expressed in the thalamus ( Yamashita T et al., Biochem. Biophys. Res.
- FGF-23 is expressed in the ventrolateral thalamic nucleus of the brain.
- FGF23CTP has been derived in silico as a possible processing product of the fibroblast growth factor FGF-23 known to be involved in renal phosphate wasting syndromes. It was hypothesized that the 75-mer peptide could affect phosphate homeostasis.
- FGF23CTP is given two weeks subcutaneously to cynomolgus monkeys and is found to affect critical pathways of cell differentiation in a multi-organ gene expression profiling analysis with high density human microarray assays. Comparison of the expression changes in sixteen different organs indicated common transcript level changes for genes involved in cell to cell signalling of growth and lineage determination, in cell cycling and in amino acid and ion transport. Although the FGF23CTP domain is unique and not found in other FGF family members, transcript levels for components of the FGF signalling pathway are affected in several organs. Serum protein levels of circulating IGF2-binding protein are.decreased in the treated animals.
- FGF23CTP is administered subcutaneously to cynomolgus monkeys for two weeks at a dose of 100 ⁇ g/day.
- samples from all organs are subjected to snap freezing at necropsy and are analyzed with GeneChip® expression profiling.
- RNA is used to synthesize double-stranded cDNA using the Superscript® Choice System (Technologies, Gaithersburg, Maryland USA).
- the cDNA is then in vitro transcribed (MEGAscriptTM T7 Kit, Ambion) to form biotin labelled cRNA.
- 12 to 15 ⁇ g of labelled cRNA is hybridized to the Affymetrix Human U95A Version 2 expression probe arrays for 16 hours at 45°C. Arrays are then washed according to the EukGE-WS2 protocol (Affymetrix), and stained with 10 ⁇ g/ml of streptavidin-phycoerythrin conjugate (Molecular Probes).
- the signal is antibody-amplified with 2 mg/ml acetylated BSA (Life Technologies, Gaithersburg, Maryland USA), 100 mM MES, 1 M [Na+], 0.05 % Tween 20, 0.005 % Antiofoam (Sigma), 0.1 mg/ml goat IgG and 0.5 mg/ml biotinylated antibody and re-stained with the streptavidin solution. After washing, the arrays are scanned twice with the Gene Array® scanner (Affymetrix).
- the expression level is estimated by averaging the differences in signal intensity measured by oligonucleotide pairs of a given probe (AvgDiff value).
- the image acquisition and numerical translation software used was the Affymetrix Microaray Suite version 4 (MAS4).
- the dataset is initially filtered to exclude in a first wave of analysis genes whose values are systematically in the lower expression ranges where the experimental noise is high (at least an AvgDiff value of 80 in a number of assays corresponding to the smallest number of replicas of any assay point).
- a threshold t-test p-value (0.05) identifies genes with different values between treated and non-treated based on a two component error model (Global Error Model) and, where possible, with a stepdown correction for multi-hypothesis testing (Benjamini and Hochberg false discovery rate).
- the selected genelists are then compared with established genelists for pathways and cellular components using Fisher's exact test. Venn diagrams are used to identify the gene changes that are in common between the different organs. Expression profiles of highly relevant genes are used to find genes with correlated changes at individual assay points, using several distance metrics (standard, Pearson).
- the decision to consider a specific gene relevant is based on a conjunction of numerical changes identified by exploratory filtering and statistical algorithms as described above and the relationship to other modulated genes that point to a common biological theme.
- a filter is applied on the FGF23CTP rostral hypothalamus expression raw data from a raw value of at least 80.0 in at least four out of eight conditions.
- RNA level it is clear that the compound affects key genes controlling cellular differentiation and proliferation, especially growth factors and growth factor receptors. Genes critically involved in angiogenesis are found in several organs. There is also a multi-organ effect on transcripts for components of the retinoblastoma cycling control checkpoint. The rostral hypothalamus shows the most pronounced changes especially for transport proteins and cytoarchitecture.
- FGF23CTP affects the same or closely related pathways and provokes similar cellular effects. No routine clinical or biochemical changes are observed in the treated animals. Surprisingly, no effect on phosphate metabolism is observed.
- FGF23CTP affects key genes controlling cellular differentiation and proliferation, especially growth factors and growth factor receptors (TABLE 3).
- Genes critically involved in angiogenesis are found to be altered in several organs upon treatment with FGF23CTP (TABLE 4).
- the rostral hypothalamus shows the most pronounced changes especially on transcripts corresponding to proteins involved in transport and cytoarchitecture (TABLE 6).
- FGF23CTP affects several molecules that have been described to play a role in the pathogenesis of malignant proliferation of glial cells and precursors: Epidermal growth factor (EGF) ( Hoi Sang U et al., J. Neurosurg. 82: 841-846 (1995) ; Wu CJ et al., Oncogene 19: 3999-4010 (2000) ), Bax ( Streffer JR et al., J. Neurooncol. 56: 43-49 (2002) ; Martin S et al., J. Neurooncol. 52: 129-139 (2001) ), connexin 43 ( Huang R et al., Cancer Res.
- EGF Epidermal growth factor
- FGF fibroblast growth factor
- BMP bone morphogenetic proteins
- TGF transforming growth factor
- IGF insulin-like growth factor
- TNF tumour necrosis factor
- Angiogenesis / vasculogenesis Transcript level changes for genes specifically involved in angiogenesis/vasculogenesis are found in several organs of animals treated with FGF23CTP (TABLE 4).
- TABLE 4 Genes for Angiogenesis Treatment group of 2 males and 2 females Control FGF23CTP Gene name Organ Gene expression level after 2 weeks(mean and range) Vascular endothelial growth ROHY 491 (431.1 to 570.1) 326.175 (309.6 to 366.3) factor-A (VEGFA) AV node 170.3 (106.6 to 234.9) 363.7 (302.7 to 506.7) VEGFB ROHY 484 (421.6 to 535.3) 626.2 (527.4 to 776.7) Placental growth factor Muscle 45.6 (20 to 78.4) 91.4 (60.8 to 112.6) FLT receptor tyrosine kinase 1 Duodenum 30.1 (20 to 60.5) 70.7 (52.3 to 80.6) AV node 56.5 (22.7 to 76.1) 120.1 (77 to 156.4) FLK1 receptor
- Retinoblastoma checkpoint Transcript levels of genes involved in cell cycle control, especially those genes involved in the transition from the G1 to S-phase, are affected in several organs by treatment with FGF23CTP (TABLE 5). In particular, expression of those genes upstream or downstream of the retinoblastoma gene product (Rb) phosphorylation step, a major downstream control step for growth factor-induced proliferation, is altered. FGF23CTP also affects transcript levels for cyclin-dependent kinase 4 and cyclins D2, D3 and E2 involved in Rb phosphorylation.
- Rb retinoblastoma gene product
- a second control level is also mobilized with cyclin kinase inhibitors like p19INK4D, p21CIP1 and p27Kip1. Also affected is the inhibitor of p53 and Rb, Mdm2.
- the targets of the retinoblastoma protein are also involved: E2F1, E2F2, E2F5 and their binding partner Dp-2.
- Rostral hypothalamus The rostral hypothalamus is the organ with the most pronounced changes in transcript levels in animals treated with FGF23CTP. TABLE6 reflects genes of defined pathways and cellular actions with the most significant changes in this organ. In particular, effects on cytoarchitecture genes are especially pronounced in brain tissues.
- Source H. sapiens mRNA for glutamine transaminase K. 51 36542_at 0.008458 Source: Homo sapiens sodium-hydrogen exchanger 6 (NHE-6) mRNA, nuclear gene encoding mitochondrial protein, complete cds. 52 40631_at 0.008458 Source: Human mRNA for Tob, complete cds.
- NHE-6 Homo sapiens sodium-hydrogen exchanger 6
- hg04325 cDNA clone for KIAA0542 has a 933-bp insertion between 3296-3297, and a 187-bp insertion between 3368-3369 of the sequence of KIAA0542 57 39767_at 0.009584
- Source Human mRNA for KIAA0002 gene, complete cds. 58 36110_at 0.009584
- Source Homo sapiens GTP-binding protein (RAB5) mRNA, complete cds. 59 38093_at 0.009584
- Source Human clone 23722 mRNA sequence. 60 37826_at 0.009584
- Source Homo sapiens unknown mRNA, sequence.
- 87 35767_at 0.011436 Source: tn20b01.x1 NCI_CGAP_Brn25 Homo sapiens cDNA clone IMAGE:2168137 3' similar to TR:O08765 008765 GEF-2. ;, mRNA sequence. 88 34819_at 0.011497 Source: Human mRNA for MGC-24, complete cds. 89 40861_at 0.011497 Source: Human mRNA for KIAA0026 gene, complete cds. 90 34302_at 0.011497 Source: Human translation initiation factor eIF3 p44 subunit mRNA, complete cds.
- Source Homo sapiens mRNA for KIAA0898 protein, partial cds. 97 35297_at 0.012932 Transcriptional coactivator P15 like 98 35999_r_at 0.012932
- Source Homo sapiens mRNA for KIAA0781 protein, partial cds. 99 40864_at 0.013006
- Source Homo sapiens mRNA, clone:P02ST9. 100 41178_at 0.013006
- Source H. sapiens mRNA for ribosomal protein L11.
- 106 35005_at 0.013006 Source: Homo sapiens type 6 nucleoside diphosphate kinase NM23-H6 (NM23-H6) mRNA, complete cds. 107 32781_f_at 0.013006 Source: zk65d06.r1 Soares_pregnant_uterus_NhHPU Homo sapiens cDNA clone IMAGE:487691 5', mRNA sequence.
- Source Human mRNA for precursor of epidermal growth factor receptor.
- Source Homo sapiens mRNA for Hmob33 protein, 3' untranslated region.
- 116 33440_at 0.013327 Source: Human two-handed zinc finger protein ZEB mRMA, partial cds.
- 117 37359_at 0.013357 Source: Human mRNA for KIAA0102 gene, complete cds.
- Source Homo sapiens mRNA for KIAA0569 protein, complete cds.
- hh01734 cDNA clone for KIAA0430 has a 61-bp deletion at the region from 3167 to 3227 of the sequence of KIAA0430 134 40146_at 0.016164 Human mRNA for Rap1B protein 135 34231_at 0.016164 binds the large subunit (ORC I L) of the origin recognition complex (ORC) 136 38375_at 0.016327
- ORC I L large subunit
- ORC origin recognition complex
- Source Human mRNA for KIAA0105 gene, complete cds. 141 35221_at 0.017213
- Source H. sapiens mRNA for pur alpha extended 3'untranslated region.
- 142 33456_at 0.017213
- Source Homo sapiens EB1 mRNA, complete cds.
- 41866_s_at 0.017213 member of the dystrophin gene family 144 39733_at 0.017293 similar to Homo sapiens KIA0025 product encoded by GenBank Accession Number D14695 145 35826_at 0.017369
- Source Homo sapiens transcription factor Tat-CT1 mRNA, complete cds.
- 171 38470_i_at 0.019104 Human mRNA for KIAA0228 gene, partial cds. 172 36627_at 0.019304
- Source H. sapiens mRNA for hevin like protein. 173 32183_at 0.019304 Gene product is 54 kDa but migrates aberrantly on SDS gels as a 70 kDa protein.; In mammalian cells, the protein colocalizes with many components of the pre-mRNA splicing machinery in the nucleus.
- 174 32597_at 0.019304 Source: H. sapiens p130 mRNA for 130K protein.
- Source Homo sapiens mRNA for famesylated-proteins converting enzyme 1. 176 36112_r_at 0.019346
- Source H. sapiens PR264 gene. 177 40125_at 0.019346
- Source Homo sapiens integral membrane protein, calnexin, (IP90) mRNA, complete cds.
- Source Homo sapiens clone 24781 mRNA sequence. 180 39762_at 0.019389
- Source Homo sapiens KIAA0425 mRNA, complete cds.
- Source Homo sapiens mRNA for KIAA1064 protein, partial cds. 182 409_at 0.01939
- Source Human mRNA for 14.3.3 protein, a protein kinase regulator.
- 183 731_f_at 0.019479 184 31526_f_at 0.019479
- Source H . sapiens mRNA for tre oncogene (clone 213).
- 185 36975 _at 0.019479 Source: 34d2 Human retina cDNA randomly primed sublibrary Homo sapiens cDNA, mRNA sequence.
- Source Homo sapiens mRNA for KIAA0821 protein, complete cds.
- Source Homo sapiens ORCTL4 mRNA for organic cation transporter like 4, complete cds. 192 33740_at 0.019673
- Source Human p62 mRNA, complete cds.
- Source Homo sapiens calcium binding protein (ALG-2) mRNA, complete cds. 208 34312_at 0.020243 Source: oy33a12.x1 Soares_parathyroid_tumour_NbHPA Homo sapiens cDNA clone IMAGE:1667614 3',mRNA sequence. 209 40083_at 0.020243 Source: Homo sapiens mRNA for KIAA0625 protein, partial cds. 210 40832_s_at 0.020283 strong similarity to rat lamina associated polypeptide 1C 211 1696_at 0.020317 Source: Human mRNA for DNA polymerase beta, complete cds.
- Source Homo sapiens mRNA for oxidative-stress responsive 1, complete cds. 213 34808_at 0.020317
- Source Homo sapiens mRNA for KIAA0999 protein, partial cds. 214 33433_at 0.020449
- Source Homo sapiens mRNA; cDNA DKFZp564F0522 (from clone DKFZp564F0522).
- Source Homo sapiens mRNA for RING-H2 protein RNF6, alternative exon 1a.
- Source Homo sapiens mRNA for cytochrome c, partial cds.
- Source Human pre-B cell enhancing factor(PBEF) mRNA, complete cds. 236 32624_at 0.021292 strong similarity to rat tulip 1/2 237 38974_at 0.021292
- Source Homo sapiens RNA-binding protein regulatory subunit mRNA, complete cds. 238 36754_at 0.021292
- Source H. sapiens gene PACAP for pituitary adenylate cyclase activating polypeptide. 239 40637_at 0.021292
- Source Human hsc70 gene for 71 kd heat shock cognate protein.
- Source Human phosphofructokinase (PFKM) mRNA, complete cds. 245 36459_at 0.021356
- Source Homo sapiens mRNA for KIAA0879 protein, complete cds. 246 40423_at 0.021356
- Source Homo sapiens mRNA for KIAA0903 protein, partial cds. 247 32879_at 0.021356
- Source Homo sapiens mRNA; cDNA DKFZp586L111 (from clone DKFZp586L111). 248 39389_at 0.021356
- Source Human CD9 antigen mRNA, complete cds.
- Source H. sapiens mRNA for Lon protease-like protein. 250 41127_at 0.021356 2 potential N-linked glycosylation sites at residues 201 and 206; in-frame stop codon 24 bp upstream of initiator methionine 251 38443_at 0.021356
- Source Human clone 23721 mRNA sequence. 252 297_g_at 0.021356 253 37392_at 0.021356 beta subunit 254 32205_at 0.021356 PKR interacting protein 255 32665_at 0.02145
- Source Homo sapiens mRNA for protein phosphatase 2C (beta).
- Source Homo sapiens clone 24775 mRNA sequence.
- 263 37668_at 0.022175
- Source Human pre-mRNA splicing factor SF2p32, complete sequence.
- 264 37868_s_at 0.022178 MOG-25.6kD 265 38809_s_at 0.022233
- Source Homo sapiens mRNA for KIAA0519 protein, complete cds. 266 810_at 0.022455 similar to Dbl exchange factor and to pleckstrin 267 1612_s_at 0.022455
- Source Human junD mRNA.
- Source Homo sapiens clone 24452 mRNA sequence. 269 40570_at 0.022455
- Source Homo sapiens forkhead protein (FKHR) mRNA, complete cds. 270 36536_at 0.022475
- Source Homo sapiens clone 24732 unknown mRNA, partial cds. 271 38801_at 0.022475
- Source wg46h09.x1 Soares_NSF_F8_9W_OT_PA_P_SI Homo sapiens cDNA clone IMAGE:2368193 3' similar to TR:O75453 075453 VAMP-ASSOCIATED PROTEIN OF 33 KDA.
- mRNA sequence 272 35777_at 0.027475 Source: Homo sapiens mRNA for zinc finger protein, complete cds, clone: RES4-26 273 38254_at 0.022475
- sapiens hH3.3B gene for histone H3.3. 278 32667_at 0.023142 Source: Human alpha-5 collagen type IV (COL4A5) mRNA, 3' end. 279 41536_at 0.023264 match: proteins P47928 P41139 Q13005 280 34387_at 0.023264 similar to putative product coded in C. elegans cosmid C01C10. 281 36042_at 0.023264 Source: H. sapiens trkB mRNA for protein-tyrosine kinase. 282 38357_at 0.023264 Source: Homo sapiens mRNA; cDNA DKFZp564D156 (from clone DKFZp564D156).
- Source Homo sapiens mRNA for steroid receptor coactivator 1e. 284 34680_s_at 0.023336
- Source Human mRNA for KIAA0107 gene, complete cds. 285 31962_at 0.023449
- Source Homo sapiens ribosomal protein L37a (RPL37A) mRNA, complete cds. 286 33158_at 0.023449
- Source Homo sapiens Kallmann syndrome (KAL) mRNA, complete cds. 287 35184_at 0.023449
- KAL Homo sapiens Kallmann syndrome
- Source Homo sapiens mRNA for MEGF9, partial cds. 295 33666_at 0.024001 C protein 296 39150_at 0.024001
- Source U69559 Soares infant brain 1NIB Homo sapiens cDNA clone 26077, mRNA sequence. 297 471_f_at 0.024001 class III isotype; beta-3 298 33118_at 0.024016 match to U03056 (PID:g532974); H_LUCA14.3 299 36988_at 0.024016
- Source Human B12 protein mRNA, complete cds.
- the ha1225 gene product is related to human alpha-glucosidase.
- 302 36845_at 0.024145 The KIAA0136 gene product is novel.
- ABL is the cellular homolog proto-oncogene of Abelson's murine leukemia virus and is associated with the t9:22 chromosomal translocation with the BCR gene in chronic myelogenous and acute lymphoblastic leukemia; alternative splicing using exon 1a
- Source Homo sapiens mRNA; cDNA DKFZp564E242 (from clone DKFZp564E242).
- 305 37914_at 0.024734 Source: Human mRNA for KIAA0305 gene, complete cds.
- 306 34355_at 0.024895 Source: Homo sapiens mRNA for methyl-CpG-binding protein 2.
- 307 1311_art 0.024965 Source: Human mRNA for proteasome subunit HsN3, complete cds.
- 308 35294_at 0.024965 ribonucleoprotein autoantigen 60 kd subunit 309 32313_at 0.025167 fibroblast tropomyosin 310 33082_at 0.025167
- 314 612_s_at 0.025167 2',3'-cyclic-nucleotide 3'-phosphodiesterase (EC 3.1.4.37) 315 36164 _at 0.025167 similar to the Ratins norvegiens dihydroliponamide acetyltransferase component (E2) of pyruvate dehydrogenase complex: Swiss Prot Accession Number P08461 316 38805_at 0.025167 Source: H. sapiens mRNA for TGIF protein.
- 33373_at 0.026577 Source: Homo sapiens mRNA; cDNA DKFZp564O0122 (from clone DKFZp56400122). 330 34647_at 0.026577 p68 protein (AA 1-614) 331 32240_at 0.026673 Source: Human mRNA for KIAA0072 gene, partial cds. 332 37324_at 0.026673 put. transferrin receptor (aa 1-760) 333 36337_at 0.02682 Source: wi67f11.x1 NCI_CGAP_Kid12 Homo sapiens cDNA clone IMAGE:2398413 3' similar to TR:O75257 075257 R31180_1.
- 341 35790_at 0.026839 Source: Homo sapiens H beta 58 homolog mRNA, complete cds. 342 32730_at 0.027032
- Source Homo sapiens mRNA; cDNA DKFZp564H142 (from clone DKFZp564H142).
- 351 36580_at 0.027139 Source: Homo sapiens mRNA; cDNA DKFZp586M141 (from clone DKFZp586M141). 352 40387_at 0.027139 similar to mouse vzg-1 353 38657_s_at 0.027139 clathrin light chain a 354 33110_at 0.027139 Source: qy22a10.x1 NCI_CGAP_Brn23 Homo sapiens cDNA clone IMAGE:201 2730 3' similar to gb:X71136 SOX-10 PROTEIN (HUMAN);, mRNA sequence.
- 361 37373_at 0.027634 similar to uridine diphosphoglucose pyrophosphorylase in human liver, Swiss-Prot Accession Number Q07131; the 5'UTR and 3'UTR of this clone are completely different from those of the liver form 362 41338_at 0.027634 Source: wx39f10.x1 NCI_CGAP_Pit1 Homo sapiens cDNA clone IMAGE:2546059 3', mRNA sequence. 363 35837_at 0.027634 Source: Homo sapiens mRNA for scrapie responsive protein 1.
- GTP-ase-activating protein GAP
- GAP GTP-ase-activating protein
- Source Homo sapiens mRNA for vacuolar ATPase, complete cds.
- 366 41759_at 0.027634 Source: H. sapiens mRNA for RNA polymerase II elongation factor-like protein. 367 36046_at 0.027634 similarity to SPAC2F3.16
- 368 35468_at 0.027854 Homo sapiens mRNA; cDNA DKFZp586B2023 (from clone DKFZp586B2023).
- 373 38190_r_at 0.028018 Homo sapiens mRNA for KIAA0645 protein, complete cds. 374 35218_at 0.028018 apoptosis-related protein 375 41528_at 0.02862
- Source zd62h08.s1 Soares_fetal_heart_NbHH19W Homo sapiens cDNA clone IMAGE:345279 3', mRNA sequence.
- 376 37666_at 0.02862 Source: Human mRNA for proteasome subunit X, complete cds.
- 387 41850_s_at 0.030352 isolated in a two hybrid screen to identity cellular proteins that interact with hepatitis delta antigen; similar to hepatitis delta antigen, and has two regions predicted to form coiled-coil protein interaction domains 388 40480_s_at 0.0309 c-syn protooncogene; belongs to the protein-tyrosine kinase family of retroviral oncogenes 389 1463_at 0.0309 Source: Human protein tyrosine phosphatase (PTP-PEST) mRNA, complete cds.
- PTP-PEST Human protein tyrosine phosphatase
- 397 556_s_at 0.032345 Source: Human glutathione transferase class mu number 4 (GSTM4) gene, complete cds. 398 38336_at 0.032745 hj06791 cDNA clone for KIAA1013 has a 4-bp deletion at position between 1855 and 1860 of the sequence of KIAA1013. 399 33913_at 0.032745 HLA-B-associated transcript 2 (BAT2) 400 33358_at 0.03283 Source: 56b8 Human retina cDNA randomly primed sublibrary Homo sapiens cDNA, mRNA sequence.
- GSTM4 Human glutathione transferase class mu number 4
- Source Human Chromosome 16 BAC clone CIT987SK-A-815A9, complete sequence. 402 35163_at 0.033005
- Source Homo sapiens mRNA for KIAA1041 protein, complete cds. 403 1278_at 0.033089 404 1695_at 0.033089
- Source Homo sapiens mRNA for ubiquitin-like protein, complete cds. 405 34648_at 0.033089
- Source H. sapiens mRNA for SSR alpha subunit.
- 406 40211_at 0.033171
- Source Human gene for heterogeneous nuclear ribonucleoprotein (hnRNP) core protein A1.
- Source H. sapiens gene for ribosomal protein L38. 408 1635_at 0.033329 ABL is the cellular homolog proto-oncogene of Abelson's murine leukemia virus and is associated with the t9:22 chromosomal translocation with the BCR gene in chronic myelogenous and acute lymphoblastic leukemia; alternative splicing using exon 1a 409 37675_at 0.033565
- Source H. sapiens mRNA for mitochondrial phosphate carrier protein.
- Source Homo sapiens mRNA for KIAA0630 protein, partial cds. 417 39380_at 0.033775
- Source Homo sapiens mRNA for KIAA0697 protein, partial cds.
- C2H2 zinc finger zinger repeats from 520 to 691 in protein sequence 419 33866_at 0.03399 tropomyosin (AA 1-248) 420 34809_at 0.03399
- Source yq87g03.r1 Soares fetal liver spleen INFLS Homo sapiens cDNA clone IMAGE:202804 5', mRNA sequence. 421 39778_at 0.03402
- Source Homo sapiens mRNA for Ribosomal protein kinase B (RSK-B). 437 41170_at 0.036255
- Source Homo sapiens clone 24658 mRNA sequence. 450 32543_at 0.036921
- Source Human protein-tyrosine kinase (JAK1) mRNA, complete cds.
- Source Homo sapiens mRNA; cDNA DKFZp564E1922 (from clone DKFZp564E1922). 456 41128_at 0.03697
- Source Homo sapiens clone 24606 mRNA sequence.
- 457 35903_at 0.037598
- Source Human oligodendrocyte-myelin glycoprotein (OMGP) mRNA, complete cds.
- OMGP Human oligodendrocyte-myelin glycoprotein
- Gi alpha-1 chain 459 33466_at 0.037604
- Source Homo sapiens clone 23860 mRNA sequence.
- Source yy39g07.s1 Soares melanocyte 2NbHM Homo sapiens cDNA clone IMAGE:273660 3'; mRNA sequence. 461 34950_at 0.037937
- Source Homo sapiens mRNA for KIAA0760 protein, partial cds. 462 41530_at 0.037937
- Source Human mRNA for mitochondrial 3-oxoacyl-CoA thiolase, complete cds. 463 34753_at 0.037937
- Source H. sapiens mRNA for novel gene in Xq28 region.
- Source Human protein tyrosine phosphatase receptor pi (PTPRP) mRNA, complete cds. 465 34592_g_at 0.037937 ribosomal protein S 17 466 34752_at 0.038065
- Source Homo sapiens ; mRNA; cDNA DKFZp586G2222 (from clone DKFZp586G2222). 467 34213_at 0-038065
- Source Homo sapiens mRNA for KIAA0869 protein, partial cds. 468 33893_r_at 0.038065
- Source Homo sapiens mRNA for KIAA0470 protein; complete cds.
- 485 35833_at 0.038065 Source: Homo sapiens mRNA; cDNA DKFZp4340071 (from clone DKFZp434O071). 486 35845_at 0.038065 Source: Homo sapiens mRNA for Sec24 protein (Sec24B isoform). 487 36271_at 0.038065 Source: Homo sapiens mRNA for KIAA1024 protein, partial cds. 488 41715_at 0.038065 Source: H. sapiens mRNA for phosphoinositide 3-kinase. 489 41665_at 0.038065 Source: Homo sapiens mRNA for KIAA0824 protein, partial cds.
- Source Homo sapiens mRNA for lanthionine synthetase C-like protein 1 (LANCL1 gene). 496 38398_at 0.038994 Source: Human mRNA for KIAA0358 gene, complete cds. 497 33108_i_at 0.039132 putative 498 35102_at 0.039332 Source: Homo sapiens zinc finger protein mRNA, 3' end. 499 2065_s_at 0.039432 Source: Human Bax alpha mRNA, complete cds.
- Source DKFZp434D0717_s1 434 (synonym: htes3) Homo sapiens cDNA clone DKFZp434D0717 3', mRNA sequence. 501 41436_at 0.039781
- Source Homo sapiens mRNA for ZNF198 protein.
- 502 33451_s_at 0.039781
- Source DU3.2-7.G09 DU-145 Homo sapiens cDNA 3', mRNA sequence.
- Source Human anion exchanger 3 brain isoform (bAE3) mRNA, complete cds.
- Source Human mRNA for KIAK0002 gene, complete cds. 505 34849_at 0.040102
- Source H. sapiens mRNA for seryl-tRNA synthase.
- Source Human epidermoid carcinum mRNA for ubiquitin-conjugating enzyme EZ similar to Drosophila bendless gene product, complete cds. 509 428_s_at 0.040122
- Source Human messenger RNA fragment for the beta-2 microglobulin.
- Source Human breast cancer cytosolic NADP(+)-dependent malic enzyme mRNA, partial cds. 511 38652_at 0.040388
- Source Homo sapiens clone 24742 mRNA sequence.
- Source Homo sapiens mRNA for GDP dissociation inhibitor beta.
- Source Homo sapiens mRNA for KIAA0741 protein, complete cds. 515 40018_at 0.040659
- Source Homo sapiens KIAA0410 mRNA, complete cds.
- Source 32a12 Human retina cDNA randomly primed sublibrary Homo sapiens cDNA, mRNA sequence. 517 33369_at 0.040683 Source: P9-C4.T3.P9.D4 conorm Homo sapiens cDNA 3', mRNA sequence. 518 38065_at 0.040683 Source: H. sapiens HMG-2 mRNA. 519 630_at 0.040702 Source: Homo sapiens deoxycytidylate deaminase gene, complete cds. 520 39026_r_at 0.040775 Source: Homo sapiens clone 23887 mRNA sequence.
- Source Human nuclear factor NF90 mRNA, complete cds. 531 38664 at 0.041338
- Source Homo sapiens BCNT mRNA, complete cds. 532 41283_at 0.041494
- Source Homo sapiens clone 23930 mRNA sequence. 533 38042_at 0.041843 G6PD(AA 1-515) 534 1627_at 0.041843 535 35152_at 0.041927
- Source Homo sapiens mRNA encoding RAMP3.
- 536 33864_at 0.041927 binds directly to adenovirus type 5 E1A protein 537 32254_at 0.041979
- 538 40435_at 0.041983 ADP.ATP translocase 539 37616_at 0.041993
- 560 33443_at 0.044411 match: proteins P38533 Q03933 P38530 P41154 Q00613 P38529 P38531 Q63717 P38532 Q99472 561 555_at 0.044411 small GTP binding protein, homologous to Saccharomyces cerevisiae SEC4, Swiss-Prot Accession Number P07560 562 38120_at 0.044659 autosomal dominant polycystic kidney disease type II 563 40263_at 0.045291
- Source Homo sapiens clone lambda MENI region unknown protein mRNA, complete cds.
- Source Human DNA sequence from clone 73H22 on chromosome 6q23, complete sequence. 56541194_at 0.046069
- Source PT1.3_04_C04.r tumour1 Homo sapiens cDNA 5', mRNA sequence. 566 37532_at 0.0468
- Source Human medium-chain acyl-CoA dehydrogenase (MCAD) gene, exon 12.
- MCAD medium-chain acyl-CoA dehydrogenase
- Source Human h-pim-1 protein (h-pim-1) mRNA, complete cds. 568
- Source Human 18S rRNA gene, complete.
- Source HSZ78368 Human fetal brain S. Meier-Ewert Homo sapiens cDNA clone 3.142 (CEPH), mRNA sequence. 570 33249_at 0.047068 mineralocorticoid receptor 571 36480_at 0.047068 alpha subunit 572 36563_at 0.047068 Source: Homo sapiens clone 23582 mRNA sequence. 573 35746_r_at 0.047095 Source: H. sapiens hnRNP-E2 mRNA. 574 38743_f_at 0.047214 Source: Human mRNA fragment for activated c-raf-1 (exons 8-17).
- Source H. sapiens mRNA for vasopressin activated calcium mobilizing receptor-like protein. 576 35187_at 0.048079 Source: Homo sapiens mRNA; cDNA DKFZp586K1123 (from clone DKFZp586K1123). 577 41296_s_at 0.048079 Source: 37c5 Human retina cDNA randomly primed sublibrary Homo sapiens cDNA, mRNA sequence. 578 781_at 0.048079 subunit of modification enzyme; beta subunit 579 32228_at 0.048079 Source: Homo sapiens mRNA for KIAA0899 protein, partial cds.
- 580 35090_g_at 0.048079 Homo sapiens mRNA for NTAK, complete cds. 581 457_s_at 0.048079 conjugated post-transiationally to RanGAP1; ubiquitin-related protein; similar to UBL1 encoded by GenBank Accession Number U38784, PIC1 encoded by GenBank Accession Number U61397 and GMP1 encoded by GenBank Accession Number U72722 582 37333_at 0.048079 Source: H. sapiens mRNA for DNA (cytosin-5)-methyltransferase. 583 35683_at 0.048079 Source: Homo sapiens mRNA for KIAA0852 protein, complete cds.
- Source Human protein kinase mRNA, complete cds. 585 31807_at 6.04809
- Source U69190 Soares infant brain 1N1B
- Source we38g03.x1 NCI_CGAP_Lu24 Homo sapiens cDNA clone IMAGE:2343412 3', mRNA sequence.
- Serum levels were determined for IGFB2 and found to be decreased, in agreement with the decreased transcript levels in several organs, including the liver. TABLE 8 Serum Determination of Insulin-Like Growth Factor Binding Protein 2 Treatment conc (ng/mL) mean (ng/mL) 1467 1742 control 922 1583 2201 1239.8 FGF23CTP100 ⁇ g/day 987.6 893 596.7 749.5
- Angiogenesis is further shown to be inhibited by FGF23CTP in a hyperoxia-induced angioproliferative retinopathy model ( Aiello FP et al., Proc. Natl. Acad. Sci. USA, 92: 10457-61(1995) , Ozaki H et al., Am. J. Pathol. 156: 697-707 (2000) ) in C57/B6 mice (see EXAMPLE VIII).
- FGF23CTP affects several molecules that have been described to play a role in the pathogenesis of malignant proliferation of glial cells and precursors (malignant brain tumours): epithelial growth factor (EGF; Hoi Sang U et al., J. Neurosurg. 82: 841-6 (1995) , Wu CJ et al., Oncogene 19: 3999-4010 (2000) ), Bax ( Streffer JR et al., J. Neurooncol. 56: 43-9 (2002) ; Martin et al., (2001)), connexin 43 ( Huang R et al., Cancer Res.
- EGF epithelial growth factor
- Bax Streffer JR et al., J. Neurooncol. 56: 43-9 (2002) ; Martin et al., (2001)
- connexin 43 Huang R et al., Cancer Res.
- the discovery method of the invention has been validated through a "blind” monkey trial using three peptides of well known pharmacological activity: (1) the somatostatin analogue SOM230, (2) gonadotrophin releasing hormone (GnRH), (3) and leukemia inhibitory factor (LIF).
- a "blind” test with 3 "unknown” polypeptides was performed.
- the results demonstrated the capacity of the gene expression analyst teams to identify, within four months, the pharmacological activities, most of the therapeutic indications and side effects, and even the identity of the proteins.
- one control and four treated groups i.e. , each of three peptides and placebo
- the proteins dissolved in autologous serum e.g. , in each animal's own serum
- the administration of the peptides was blinded.
- the amount of peptide administrated was 100 ⁇ g/animal /day (5-6 mg of peptide total).
- Drug profiling in these non-human primates was analyzed using gene expression profiling of more than 100 organs on Affymetrix U95 chips (each containing 1/3 of the human genome). In addition, extensive biochemistry and clinical chemistry screening (> 60 parameters) and histopathology (ca. 60 organs) were performed.
- Peptide 1 was SOM230.
- SOM230 (pasireotide) has a chemical structure cyclo[4-(NH 2 -C 2 H 4 -NH-CO-O)Pro-Phg-DTrp-Lys-Tyr(4-Bzl)-Phe] as follows:
- Phg means -HN-CH(C 6 H 5 )-CO- and Bzl means benzyl.
- SOM230 is a somatostatin analogue with binding affinities for the five somatostatin receptors except somatostatin receptor 4 (SSTR4).
- S O M 2 3 0 has been developed for several indications, including those disclosed above for other somatostatin analogues. See, Lewis I et al., J. Med. Chem.
- SOM230 was developed for the approved Sandostatin® indications, but as a more potent somatostatin analogue with a longer plasma half-life in vivo. Lewis I et al., J Med Chem 46(12): 2334-44 (June 5, 2003 ); Weckbecker G et al., Endocrinology 143(10): 4123-30 (October 2002 ). In contrast with other analogues, SOM230 binds to all somatostatin receptors except SSTR4. The binding affinity for the different somatostatin receptors was a basis for defining the scope of possible new clinical indications for SOM230.
- SOM230 was selected for further development as a somatostatin analogue to treat the somatostatin-approved neuroendocrine indications (e.g. , acromegaly, gastroenteropancreatic tumours) and also has potential for further indications with a pancreatic endocrine eetiology such as diabetic angiopathy and morbid obesity associated with hyperinsulinemia.
- IGF-1 serum level was proposed as surrogate marker.
- Other potential indications for SOM230 are therefore inflammation ( e.g. , psoriasis), pain and immunosuppression (e.g. , chronic rejection).
- the predicted indications for the administered Peptide 2 were be for gonadotrophin releasing hormone-related indications or for lutenizing hormone releasing hormone-related indications, such as antiproliferative disorders (cancer), ovarian and testicular functions (hypothalamic gonadotropc hypogonadism, fertility control and delayed or arrested puberty/ precocious puberty), and growth hormone deficiencies.
- the Data Mining Team made predictions as to the identity of the administered Peptide 2 TABLE 17 Predicted Identity of Peptide 3 (LIF) Data miner Prediction 1 TGF ⁇ 2, IL-6, IFN gamma 2 TGF ⁇ 2, IL-6, Calcitonin 3 VIP 4 PDGF, GMCSF, Sertonin 5 LIF, IL3, TGF ⁇ 2 6 Oncostatin M, TGF ⁇ 2, IL3 Summary Prediction IL-6, IL-3, TGF ⁇ 2, LIF/Onccostatin
- the predicted actions for the administered Peptide 3 would be to increase platelets, myeloid cells and megakaryocytes; to increase acute phase proteins (such as C-Reactive Protein (CRP)and haptoglobin); to decrease lipogenicity (with therapeutic indications for treating obesity and cardiovascular risk); to decrease transaminase, albumin and lactate dehydrogenase (LDH); and to decrease alkaline phosphatase, bone sialoprotein (BSP) and osteocalcin (with therapeutic indications for treating osteoarthritis and osteoporosis).
- CRP C-Reactive Protein
- haptoglobin haptoglobin
- lipogenicity with therapeutic indications for treating obesity and cardiovascular risk
- transaminase albumin and lactate dehydrogenase (LDH)
- LDH lactate dehydrogenase
- BSP bone sialoprotein
- osteocalcin with therapeutic indications for treating osteoarthritis and osteoporosis
- Microarray gene expression assays were performed using tissues of monkeys treated with SOM230 at sub-therapeutic dose for 14 days. The assays were analyzed to identify the modes of actions of SOM230 with possible relationships to therapeutic applications. For a description of SOM230, see the EXAMPLE above.
- biomarker biological marker
- RNA expression profiling was conducted by means of the HG-U95A gene expression probe array (Affymetrix; Santa Clara, Calif., USA), containing more than 12,600 probe sets interrogating primarily full-length human genes and also some control probe sets. The assays were conducted according to the recommendations of the manufacturer. Briefly, total RNA was obtained by acid guanidinium thiocyanate-phenol-chloroform extraction (TRIzol®, Invitrogen Life Technologies, San Diego, Calif., USA) from each frozen tissue section. The total RNA was then purified on an affinity resin (Rneasy®, Qiagen) and quantified.
- TRIzol® acid guanidinium thiocyanate-phenol-chloroform extraction
- Double stranded cDNA was synthesized with a starting amount of appproximately 5 ⁇ g full-length total RNa using the Superscript® Choice System (Invitrogen Life Technologies, Carlsbad, Calif. USA) in the presence of a T7-(dT)24 DNA oligonucleotide primer.
- the cDNA was purified by phenol/chloroform/isoamylalcohol extraction and ethanol precipitation. The purified cDNA was then transcribed in vitro using the BioArray® High Yield RNA Transcript Labelling Kit (ENZO, Farmingdale, New York USA) in the presence of biotinylated ribonucleotides form biotin labelled cRNA.
- the labelled cRNA was then purified on an affinity resin (Rneasy®, Qiagen), quantified and fragmented. An amount of approximately 10 ⁇ g labelled cRNA was hybridized for 16 hours at 45°C to an expression probe array. The array was then washed and stained twice with streptavidin-phycoerythrin (Molecular Probes, ) using the GeneChip® Fluidics Workstation 400 (Affymetrix, Santa Clara, Calif. USA). The array was then scanned twice using a confocal laser scanner (GeneArray® Scanner, Agilent, Palo Alto, Calif. USA) resulting in one scanned image.
- a confocal laser scanner GeneArray® Scanner, Agilent, Palo Alto, Calif. USA
- This resulting “.dat-file” was processed using the MAS4 program (Affymetrix) into a “.cel-file”.
- the ".cel file” was captured and loaded into the Affymetrix GeneChip® Laboratory Information Management System (LIMS).
- the LIMS database is connected to a UNIX Sun Solaris server through a network filing system that allows for the average intensities for all probes cells (CEL file) to be downloaded into an Oracle database (NPGN).
- Raw data was converted to expression levels using a "target intensity” of 150. The data were evaluated for quality control and loaded in the GeneSpring® software 4.2.4 (Silicon Genetics, Calif. USA) for analysis.
- probe sets for individual genes contain 20 oligonucleotide pairs, each composed of a "perfect match” 25-mer and a “mismatch” 25-mer differing from the "perfect” match oligonucleotide at a single base.
- the expression level was estimated by averaging the differences in signal intensity measured by oligonucleotide pairs of a given probe (AvgDiff value). The fold changes and directions were calculated for selected genes, from the differences of the AvgDiff values between control and treated.
- a threshold p-value of 0.05 (based on a t-test) identified differences between treated and control based on a two component error model (Global Error Model) and, whenever possible, with a stepdown correction for multi-hypothesis testing (Benjamini and Hochberg false discovery rate).
- the decision to keep or reject a specific gene was based on the conjunction of numerical changes identified by comparative and statistical algorithms and the relationship to other modulated genes that point to a common biological theme. The weight of this relationship was assessed by the analyst through a review of the relevant scientific literature.
- RNA expression level unless specifically stated.
- probe set designed for sense target was favored.
- RT-PCR is used to identify the extent of absolute change in mRNA levels, but this method in general does not add more information on the relevance of the transcript level changes.
- cytokines IL-1, TNF, IFN
- regulators of T and B cell genesis and function CD2 antigen, IL-2 receptor, B-lymphoid tyrosine kinase, IL-2 inducible T cell kinase, p561ck, RAG1, TCR ⁇ chain precursor, RAG2, FLT 3 ligand
- Atrial natriuretic peptide and its receptor guanylyl cyclase A, arginine vasopressin and its receptor Aguilera G et al., Nature 292: 262-3 (1981) ; Aguilera G et al., Endocrinology 111: 1376-84 (1982) ; Ray C et al., Clin Sci (Lond) 84: 455-60 (1993) ; Cheng H et al., Biochem J 364: 33-9 (2002) ).
- a specific gene involved in the control of fat storage is the adrenergic ⁇ 3 receptor in brown fat ( Bachman E et al., Science 297: 843- 45 (2002) ).
- Protein products of the above genes are useful as surrogate markers of the biological activity of SOM230, especially the findings for IGF-2 in the pituitary and kidneys.
- Calcitonins are endogenous regulator of calcium homeostasis and can be used as anti resorptive agents for the treatment of hypercalcaemia-associated disorders.
- Various calcitonins including e.g. salmon and eel calcitonin, are commercially available and are commonly employed in the treatment of e.g. Paget's disease and osteoporosis. See, U.S. Pat. Nos. 5,733,569 and 5,759,565 , the contents of which are incorporated by reference. See also, U.S. Pat. Nos. 5,719,122 , 5,175,146 , and 5,698,6721 , and U.S. Pat. Appln. 003015815 .
- Miacalcin® calcitonin-salmon nasal spray.
- Information regarding the administration of Miacalcin® (calcitonin-salmon) nasal spray is available in the Miacalcin® Prescribing Information (Novartis, November 2002).
- Parathyroid hormone is a polypeptide of 84 amino acids. Parathyroid hormone regulates borne remodeling and Ca 2+ homeostasis. Parathyroid hormone is also a known paracrine activator of ostaoclast differentiation and activity. PTS893 is an analogue of the endogenous parathyroid hormone, in which certain sites of chemical instability are eliminated within N-terminal parathyroid hormone fragments by making appropriate amino acid substitutions at particular residues which results in stable and biologically active human parathyroid hormone fragments.
- PTS893 [SDZ PTS 893; Leu8, Asp10, Lys11, Ala16, Gln18, Thr33, Ala34 human PTH 1-34 [hPTH(1-34)]] is a 34 amino acid parathyroid analogue that enhances bone mass and biomechanical properties. Kneissel M et al., Bone 28: 237-50 (March 2001 ); Stewart AF et al., J. Bone. Miner. Res. 15(8): 1517-25 (March 2000 ); Thomsen JS et al., Bone 25(5):561-9 (November 1999 ). N-terminal fragments of human parathyroid hormones include hPTH(1-34)OH muteins and hPTH(1-38)OH muteins.
- PTS893 comprises at least the first 27 N-terminal amino acid units of parathyroid hormone.
- Preferred parathyroid hormone derivatives are those comprising at least one amino acid unit replaced in one or more of the following positions of the parathyroid hormone sequence: 8-11, 13, 16-19, 21, 22, 29 to 34, particularly 8-11, 16-19, 33 and/or 34. These compounds exhibit desirable bone-forming properties both in vivo and in vitro which are equal to or above the level of natural PTH and its N-terminal fragments.
- This EXAMPLE was to evaluate the gene expression changes in cynomolgus monkeys following a two-week subcutaneous treatment with salmon calcitonin (sCT) at 50 ⁇ g/animal/day and PTS893 at 5 ⁇ g/animal/day to elucidate the mechanisms of action mediating their effects as well as the identification of biomarkers of therapeutic indications.
- This EXAMPLE is believed to be the first analysis that globally describes the molecular mechanisms of action of salmon calcitonin and a parathyroid hormone analogue by multiorgan-gene-profiling analysis in primates. This is also believed to be the first gene profiling analysis which describes the molecular mechanisms of action of hormonal-mediated bone remodeling by salmon calcitonin and PTS893.
- salmon calcitonin and PTS993 were both found to have modulating effects on genes affecting the direct, antocrine, paracrine and endocrine regulation of the mesenchymal cell functions such as transforming growth factor betas (TGF- ⁇ s), insulin-like growth factors (IGFs), bone morphogenetic proteins (BMPs) and vascular endothelial growth factor (VEGF). Both compounds also regulate the synthesis and degradation of extracellular matrix components. Salmon calcitonin also regulates estrogen receptor and steroidogenic factor, whereas PTS893 produced a strong up-regulation on nuclear receptors of the steroid/thyroid receptor family. These data therefore support the role of calcitonin as an anabolic agent.
- TGF- ⁇ s transforming growth factor betas
- IGFs insulin-like growth factors
- BMPs bone morphogenetic proteins
- VEGF vascular endothelial growth factor
- Both compounds also regulate the synthesis and degradation of extracellular matrix components.
- Salmon calcitonin also regulate
- salmon calcitonin and PTS893 also influenced some aspects of the mineralization of the extracellular matrix, since changes in amelogenin, dentin and ectonucleotide pyrophosphatases were observed.
- PTS893 showed an effect on mediating the paracrine activation of osteoclast differentiation and activity, through cytokine and RANK ligand.
- gene profiling analysis in this EXAMPLE allowed the reconstruction of the pathways involved in calcitonin and parathyroid hormone signal transduction, triggered by protein-G-linked-receptor stimulation and their influence on cell cycle, as indicated by the changes observed in cyclins.
- the animals used in this analysis were cynomolgus monkeys (Macaca fascicularis), supplied by Centre de fürs Primatiquess, Port Louis, Mauritius. Two animals were used per group and sex. At the beginning of the treatment period, the animals were at least 24 months old, with a body weight of approximately 3 kg. Animals were kept under standard conditions for animal welfare. Animals were examined daily for mortality, food consumption and clinical observations. Body weight was recorded once per week. The dosages were 0 ⁇ g/animal/day (as the control), 50 ⁇ g/animal/day of salmon calcitonin and 5 ⁇ g/animal/day of PTS893.
- W62S02 100 75 75 100 100 100 75 100 50 91.7 Both animals 91.7 Salmon Calcitonin Day -6 -5 -4 -3 -2 -1 1 2 3 4 5 Animal no.
- W62505 50 100 100 100 75 100 100 100 100 100 100 100 100 100 100 100 Animal no.
- W62S06 50 100 100 100 100 100 100 100 100 100 100 100 100 100 100 100 100 100 100 100 Day 6 7 8 9 10 11 12 13 14 Avg. Animal no. W62505 100 100 100 100 100 100 100 100 100 100 50 75 875 Animal no. W62506 100 100 100 100 100 100 100 100 100 100 91.7 Both animals 89.6
- Blood sampling Animals were fasted overnight before blood collection but had free access to water. Blood samples were taken from a peripheral vein. Standard haematology and clinical chemistry analysis were performed once during pretest and at the end of the treatment period. Blood samples were collected from each animal at the same intervals as described for the clinical chemistry investigations. The serum samples were deep-frozen (approximately -80°C) until analyses for hormone determination.
- d-6, d7 and d13 indicate day -6, day 7 and day 13 relative to the starting day of dosing d-6, d7 and d13 indicate day -6, day 7 and day 13 relative to the starting day of dosing TABLE 29 Clinical Chemistry - Females Control Animal no.
- ESTR nmol/l n/a n/a n/a n/a n/a n/a PROG pmol/l n/a n/a n/a n/a n/a n/a n/a d-6, d7 and d13 indicate day -6, day 7 and day 13 relative to the starting day of dosing Salmon Calcitonin Animal no.
- ESTR nmol/l n/a n/a n/a n/a n/a n/a PROG pmol/l n/a n/a n/a n/a n/a n/a n/a d-6, d7 and d13 indicate day -6, day 7 and day 13 relative to the starting day of dosing PTS893 Animal no.
- ESTR nmol/l n/a n/a n/a n/a n/a n/a PROG pmol/l n/a n/a n/a n/a n/a n/a n/a d-6, d7 and d13 indicate day -6, day 7 and day 13 relative to the starting day of dosing TABLE 33 Hormones - Females Control Animal no.
- Tissue sampling Animals were killed by deep anaesthesia induced by intravenous injection of Pentothal®, followed by exsanguinations. All relevant tissues were sampled for histopathology and gene expression profiling. The following tissue samples were processed for analysis: liver, kidney, pituitary, muscle, bone, duodenum, spleen and trachea. Samples for histopathology were fixed in phosphate-buffered 10% formalin. Bone demineralization was performed with 10% formic acid. Tissue samples were embedded in Paraplast® and sectioned at 4 microns, for staining with haematoxylin and eosin. Samples for gene expression profiling were quickly frozen in liquid nitrogen immediately after excision, stored on dry ice and subsequently in a deep-freezer at approximately -80°C until. further use. All selected tissues for gene expression profiling were examined histopathologically.
- Histopathological examination of the tissues selected for gene profiling analysis exhibited a normal spectrum of incidental lesions which were in terms of severity and distribution of lesions not different to the controls in all groups of treatment.
- Bone sections were stained for osteonectin, osteopontin and osteocalcin and were evaluated histopathologically. Histomorphometry of the bone tissue was performed regarding parameters for bone resorption and synthesis (osteoid formation).
- osteonectin, osteopontin, and osteocalcin staining of the tibia showed no difference between the groups one (control) and two (salmon calcitonin). Osteonectin exhibited a major enlargement and deterioration of the epiphysial growth plate of animal no 2553 due to a severe non-treatment related pathological status (severe, subacute epiphysiolysis).
- Histomorphometry of bone tissue was performed to determine parameters related to bone resorption and bone synthesis (osteoid formation).
- Histomorphometry showed inconsistent results between tibial and vertebral bone, except for an increase in osteoid synthesis induced by PTS893. This effect is well documented for parathyroid hormone, when administered in a discontinuous way.
- Hybridization assay Transcript profiling by means of GeneChip® expression probe arrays was done as recommended by the manufacturer of the GeneChip® system (GeneChip Expression Analysis Technical Manual, Affymetrix Inc., Santa Clara, Calif. USA). HG-U95Av2 GeneChip® expression probe arrays (Affymetrix, Santa Clara Calif. USA) were used. Double stranded cDNA was synthesized with a starting amount of approximately 5 ⁇ g full-length total RNA using the Superscript Choice System (Invitrogen Life Technologies) in the presence of a T7-(dT) 24 DNA oligonucleotide primer.
- the cDNA was purified by phenol/chlorofom/isoamylalcohol extraction and ethanol precipitation.
- the purified cDNA was then transcribed in vitro using the BioArray® High Yield RNA Transcript Labeling Kit (ENZO) in the presence of biotinylated ribonucleotides form biotin labeled cRNA.
- the labeled cRNA was then purified on an affinity resin (Rneasy®, Qiagen), quantified and fragmented. An amount of approximately 10 ⁇ g labeled cRNA was hybridized for approximately 16 hours at 45°C to an expression probe array.
- the array was then washed and stained twice with streptavidin-phycoerythrin (Molecular Probes) using the GeneChip Fluidics. Workstation 400 (Affymetrix). The array was then scanned twice using a confocal laser scanner (GeneArray® Scanner, Agilent) resulting in one scanned image.
- This resulting ".data-file” was processed using the Micro Array Analysis Suite version 4 (MAS4) program (Affymetrix) into a ".cel-file”.
- the ".cel file” was captured and loaded into the Affymetrix GeneChip Laboratory Information Management System (LIMS).
- the LIMS database is connected to a UNIX Sun Solaris server through a network filing system that allows for the average intensities for all probes cells (CEL file) to be downloaded into an Oracle database.
- Raw data was converted to expression levels using a "target intensity" of 150.
- the numerical values displayed are weighted averages of the signal intensities of the probe-pairs comprised in a probe-set for a given transcript sequence (AvgDiff value).
- the data were checked for quality and loaded into the GeneSpring® software versions 4.Z.4 and 5 (Silicon Genetics, Calif. USA) for analysis.
- the threshold range for considering as up or down regulation was determined within the context of the biological interpretation of the study.
- the information content of these data sets is a conjunction of numerical changes and biological information.
- the decision to consider a specific gene relevant was based on a conjunction of numerical changes identified by comparative and statistical algorithms and the relationship to other modulated genes that point to a common biological theme. The weight of that relationship was assessed by the analyst through a review of the relevant scientific literature.
- Multiorgan comparative gene profiling analysis was performed in the group administered salmon calcitonin at 50 ⁇ g/animal/day.
- the organs chosen for analysis were liver, kidney, pituitary, skeletal muscle, bone, duodenum, spleen and trachea.
- RT-PCR Real-time PCR. Based on the DNA microarray data a set of transcripts was chosen for quantitative analysis by real time-PCR (RT-PCR).
- the method exploits the SyBr Green dye which intercalates into double stranded DNA. Accumulation of PCR products is detected directly by monitoring the increase in fluorescence of the SyBr Green dye. Reactions are characterised by the point in time during cycling when amplification of a PCR product is first detected rather than the amount of PCR product accumulated after a fixed number of cycles. The higher the starting copy number of nucleic acid target, the sooner a significant increase in fluorescence is observed.
- cDNA was made using an Applied Biosystem kit (Applied Biosystems # N808-0234) following the recommendation of the manufacturer.
- the PCR mixture was prepared using the SyBr Green Universal PCR Master Mix (Applied Biosystems # 4309155) as follows: 5 ⁇ l cDNA template, 400 nM of each primer, 0.2 mM deoxynucleotide triphosphates, 1 mM MgCl2 and 0.5 U Taq DNA polymerase, 5 ⁇ l SyBr. Green PCR buffer and RNase free water up to a final volume of 50 ⁇ l.
- the PCR was performed using the ABI Prism 7700 Sequence Detection System, after a step at 95°C for 10 min, the step-cycle program was performed for a total of 40 cycles as follows: 95°C for 30 s, 60°C for 1 min. A negative control was included: PCR reaction mixture with water in place of the cDNA sample.
- the initial template concentration was determined based on the threshold cycle.
- the threshold cycle is the PCR cycle at which fluorescence is first detected above background and has been shown to be inversely proportional to the number of target copies present in the sample.
- Quantification was performed by calculating the unknown target concentration relative to an absolute standard and by normalizing to a validated endogenous control such as a housekeeping gene ( ⁇ -action). Results are presented as percentage of control, once the ratio between the numbers of molecule for the gene of interest divided by the number of molecule for beta-actin has been calculated.
- transcripts were chosen for quantitative analysis by RT-PCR: adhesion receptor CD44, angiopoietin, bone morphogenetic protein 5, carbonic anhydrase II, cartilage oligomeric matrix protein, cathepsin K, osteopontin, pre-pro-alpha-2 type I collagen, Spi-B and Y-box binding protein.
- RT-PCR confirmed in most of the cases the changes observed in the gene profiling analysis, as it was the case for bone morphogenetic protein 5, carbonic anhydrase II, cathepsin K, cartilage oligomeric matrix protein, pre-pro-alpha-2 type I collagen, Spi-B and Y-Box binding protein. No changes were however detected in the level of expression of adhesion receptor CD44, angiopoietin-1 and osteopontin.
- Calcitonin is known to exert an effect on the differentiation, survival and resorptive activity of osteoclasts, resulting in a decreased osteoclastic activity.
- Pondel M Intl. J. Exp. Pathol. 81 (6): 405-22 (2000) . These effects could be reconstructed by multiorgan gene profiling (TABLE 39).
- B, L P Cathepsin K ALL ODF/OPGL: osteoprotegerin ligand B Osteoclast motility Tubulins ALL PAK4 protein
- PU.1 is involved in the initial stages of osteoclastogenesis. Tondravi MM et al., Nature 386(6620): 81-4 (1997) .
- CSF-1 is imperative for macrophage maturation; it binds to its receptor c- fms on early osteoclast precursors, providing signals required for their survival and proliferation. Teitelbaum SL, Science 289(5484):1504-1508 (2000) .
- PTS893 also regulates the genes implicated in osteoclast differentiation and survival, SPI1, CSF-1 and MMD. This osteoclast regulation has not been previously described.
- Salmon calcitonin was shown to regulate the expression of the gene coding for osteoclast stimulating factor (OSF), which is an intracellular protein produced by osteoclasts that indirectly induces osteoclast formation and bone resorption. Reddy S et al., J. Cell Physiol. 177 (4): 636-45 (1998) . This would imply an autocrine effect of salmon calcitonin in the regulation of the osteoclast function, which is described here for the first time.
- OSF osteoclast stimulating factor
- TGF- ⁇ s transforming growth factor betas
- IGFs insulin-like growth factors
- BMPs bone morphogenetic proteins
- VEGF vascular endothelial growth factor
- Salmon calcitonin and PTS893 were also shown to modulate the expression of the genes coding for vascular endothelial growth factor (VEGF).
- VEGF is known for playing a key role in normal and pathological angiogenesis. The critical role of angiogenesis for successful osteogenesis during the endochondral ossification is well documented.
- VEGF indirectly induces proliferation and differentiation of osteoblasts by stimulating endothelial cells to produce osteoanabolic growth factors. Wang DS et al., Endocrinology 138(7): 2953-62 (1997) .
- VEGF stimulates chemotactic migration of primary human osteoblasts, suggesting a functional role in bone formation and remodeling. Mayr-Wohlfahrt U et al., Bone 30 (3): 472-7 (2002) .
- Both calcitonin and parathyroid hormone receptors belong to the G-protein receptor superfamily. After receptor stimulation, signal transduction is mediated by adenylate cyclase/cAMP/protein kinase, phospholipase C, phospholipase D, and MAPK (as a late effecter) pathways in the case of calcitonin, and by adenylate cyclase and phospholipase C in the case of parathyroid hormone.
- Gene profiling analysis allowed the reconstruction of these pathways, showing genes that were modulated by the treatment and that are localised at different levels of the signal transduction pathway. TABLE 41 Effects on Signal Transduction and Cell Cycle Function Coding Gene Salmon Calcitonin PTS893 Signal transduction .
- Bone morphogenetic protein controls osteoblast proliferation and differentiation through Smad proteins.
- Tob a member of the emerging family of antiproliferative proteins, is a negative regulator of BMP/Smad signalling in osteoblasts.
- Smad pathway as well as Tob as one of their regulators were also identified as genes modulated by the sCT and PTS893 treatment, in agreement with the hypothesised effect of both compounds on BMP regulation of bone remodelling.
- both compounds seem to exert a direct influence on cell cycle, since changes in cyclins and cyclin-related proteins could be also observed.
- YB-1 Y-Box binding protein
- YB-1 is a protein that interacts with a TGF- ⁇ response element in the distal region of the collagen alpha 1(I) gene.
- YB-1 protein activates the collagen promoter and translocates into the nucleus during TGF- ⁇ addition to fibroblasts, suggesting a role for this protein in TGF- ⁇ signalling.
- the compound of formula (II) was developed for the treatment of bone-resorbing diseases generally, including osteoporosis, metastatic bone cancer, osteolytic lesions with orthopedic implants, Paget's disease, and bone loss associated with hyperthyroidism.
- the compound of formula (II) can also be used to treat other conditions associated with IL-6 including various cancers ( e.g . breast cancer, prostate cancer, colon cancer, endometrial cancer, multiple myeloma, renal cell carcinoma, and cervical carcinoma) and arthritis ( e.g . adjuvant-, collagen- and antigen-induced arthritis, particularly rhenmatoid arthritis). See, published PCT patent applications WO 96/31206 , WO 00/39120 , WO 01/49673 .
- the compound of formula (II) has estrogenic, antiestrogenic, antifertility and uterotropic activity.
- the purpose of this EXAMPLE is to identify the "compound signature" of the compound of formula (II), to define a strategy for further development.
- the main concerns are the potential stimulation of the uterus and the induction of deep venous thrombosis (DVT).
- a goal of the EXAMPLE is to identify biomarkers for efficacy or risk assessment of the compound of formula (II).
- SERMs Selective Estrogen Receptor Modulators
- Gene expression microarray technology allows for the simultaneous detection and measurement of the expression of thousands of genes in a given cell or tissue sample in a single experiment. van de Rijn M & Gilks CB. Histopathology 44:97-108 (2004) . This technique has significant advantages over previous methods for measuring gene expression, such as the reverse transcriptase-polymerase chain reaction and Northern blot analysis, which are limited to evaluation of small numbers of genes per experiment.
- microarray technology enables rapid global gene expression profiling (GEP), it provides a powerful tool for analysis of a wide range of diseases, pharmacogenomic research, high throughput screening in drug discovery, and diagnostic screening for various diseases.
- GEP global gene expression profiling
- Gene expression profiling can be used to identify the genes whose altered expression may be directly related to causing a particular disease. By systematically evaluating the genes identified by such screens, researchers increase the likelihood of uncovering suitable targets for therapeutic intervention.
- the use of gene expression profiling in pharmacogenomics can be useful to identify potential undesirable effects of drug treatment by identifying changes in gene expression.
- gene expression profiling may be useful in identifying patients that have a greater likelihood of achieving a meaningful outcome from a given therapeutic treatment. While methods for detecting changes in gene expression in response to therapy have been used, a method for scoring (or ranking) treatment agents based on their respective gene expression profilings has not been described.
- Tamoxifen a selective estrogen receptor modulator (SERM) is a nonsteroidal hormonally active agent that has agonistic and antagonistic effects in different target tissues; it is an antagonist in breast tissue and an agonist in the uterus.
- Kiang DT & Kennedy BJ Ann Intern Med. 87:687-690 (1997) ; Jordan VC & Allen KE, Eur. J. Cancer 16:239-251 (1980) ; Jordan VC et al., Breast Cancer Res Treat. 10:31-35 (1987) ; Gottardis MM et al., Cancer Res. 48:812-815 (1998) ; Fornander T et al., Lancet 1:117-120 (1989) .
- Tamoxifen is an effective antitumour agent that is used in the treatment of estrogen-mediated breast cancer and as a chemopreventative agent; it decreases the risk of both invasive and noninvasive breast cancer.
- tamoxifen increases the risk for uterine hyperplasia and cancer through its proestrogenic effects on the endometrium. These undesired effects led to a search for SERMs with better safety profiles.
- Raloxifene a second generation SERM that has a more favorable therapeutic and safety profile than tamoxifen, was subsequently developed. Cohen FJ et al., Obstet. Gynecol. 95:104-110 (2000) ; Ring J et al.
- Raloxifene has a reduced antagonistic effect on the endometrium compared with tamoxifen is not associated with endometrial cancer risk.
- ovaries were removed following anesthesia with a combined intramuscular injection of xylazine (Rompun ® : 0.4 mL/animal, Bayer Pharma Division Santé Animale, Puteaux, France) and ketamine hydrochloride (Imal dire ® : 0.6 mL/kg, Mérial, Lyon, France). Sham-operated animals were subjected to the same surgical procedure, except for the removal of ovaries.
- Estradiol Assay Estradiol serum levels were determined in each animal approximately 2 weeks after surgery in order to verify the effect of ovarectomy. Venous blood samples (approximately 1.5 mL) of unfasted animals were collected in tubes without anticoagulant and analyzed using radioimmunoassay (Sorin, autoimmune Nationale Vcierinaire de Lyon, France).
- Tissue Preparation Gene expression was determined in the pituitary and uterus at the end of drug therapy. Tissues to be analyzed (pituitary glands and uterus) were excised, snap frozen in liquid nitrogen, and stored at -80°C until RNA extraction was performed.
- RNA was obtained by acid guanidinium isothiocyanate-phenol-chloroform extraction (Trizol; Invitrogen Life Technologies, San Diego, CA, USA) and purified on an affinity resin column (RNeasy; Qiagen, Hilden, Germany) according to manufacturer instructions. Chomczynski P & Sacchi N. Anal Biochem. 1987;162:156-159 . DNA microarray experiments were conducted as recommended by the manufacturer of the GeneChip system (Affymetrix, Inc. 2002) and as previously described. Lockhart DJ, Dong H, Byrne MC, et al. Nat Biotechnol. 1996;14:1675-1680 .
- PCA Principal Component Analysis. To calculate the axis of drug action, a principal component axis (PCA) was performed using only the 2 treatment groups that were at the extremes (the untreated OVX animals vs. the estrodiol-treated OVX animals). Massart DL et al., Handbook for Chemometrics and Qualimetrics, Part a. (Elsevier; 1997 ); Jolliffe IT. Principal Component Analysis. 2nd Edition (Springer; New York, NY, 2002 ). Only 1 principal component (PC) was calculated, which was a weighted linear combination of all features in the input data pointing in the direction of maximum variance.
- weights of the probe sets in this linear combination were called "loadings” and their absolute value is a measure of their importance in explaining the difference between the 2 groups. Every measurement in the experiment (e.g . microarray) could then be represented by its coordinate (score) on the PC. Alternatively, to obtain an even better separation between the groups, the PLS-DA (Partial-Least-Squares Discriminate Analysis) method with a 0/1 dummy variable as response vector was used. Barker M & Rayens W. Journal of Chemometrics 17:166-173 (2004) . Massart DL et al., Handbook of Chemometrics and Qualimetrics, Part b. (Elsevier; 1997 ).
- the next step was identification of the features that were important for the definition of the axis. This was based on the magnitude of their loadings and their statistical significance using error estimates based on cross-validation and/or normal probability plots of the loadings.
- the transcript levels were 7.6- and 6.2-fold greater (LH and FSH, respectively) in untreated OVX animals.
- Administration of estradiol reversed the effects of ovariectomy, and decreased the expression of LH and FSH transcripts 16.4- and 73.4-fold, respectively, well below normal physiological values.
- Tamoxifen had a weak estrogenic effect, downregulating pituitary LH and FSH gene expression by 2.4- and 2.7-fold in OVX monkeys.
- Raloxifene had a minimal effect on gonadotropin expression, reducing LH and FSH transcripts by 1.2- to 1.3-fold.
- Progesterone receptor, secreted frizzled-related protein 1, secreted frizzled-related protein 4, Dishevelled associated activator of morphogenesis 1, wingless-type MMTV integration site (family, member 2B; wnt2B), and integrin (beta 5) were increased 9.8-, 7.1-, 4.2-, 3.1-, and 2.6, and 1.7 fold, respectively, compared with untreated OVX controls.
- These same genes were up regulated by 1.2- to 4.5-fold following tamoxifen therapy.
- raloxifene therapy was associated with more modest changes in gene expression for these same signal transduction proteins (0.9- to 1.9-fold).
- the remaining genes examined were all downregulated by estradiol, tamoxifen (except for LDL receptor adaptor protein), and raloxifine.
- Estradiol increased the expression of several genes encoding growth factors (GFs) as outlined in TABLE 47.
- TABLE 47 Comparative GEP for Cell Cycle Genes in the Uterus Following Treatment with Estradiol, Tamoxifen, and Raloxifene in Ovariectomized Monkeys Fold change relative to OVX OVX (average) SD Sham EE Tamoxifen Raloxifene CDC28 protein kinase regulatory subunit 2 58 15 1.7 3.8 3.1 0.8 G1 to S phase transition 1 227 45 1.2 1.6 1.6 0.9 Testis Enhanced Gene Transcript (Bax Inhibitor 1) 1516 492 1.0 1.8 1.5 1.1 H2A histone family, member Y 482 94 1.2 1.4 1.7 1.0 H3 histone, family 3A 9692 447 1.1 1.4 1.4 1.0 H3 histone, family 3A 9495 1003 1.0 1.5 1.4 0.9 Histone H2A.F/Z variant 890 89 1.0 1.4 1.5
- Estradiol also upregulated insulin-like growth factor binding protein 5, latent transforming growth factor beta binding protein 1, and cysteine-rich angiogenic inducer 61 by 5.2-, 3.6-, and 3.5-fold, respectively, compared with OVX controls.
- tamoxifen and raloxifene were associated with only modest changes in genes encoding these growth factors, similar to the levels observed in the sham group (TABLE 46).
- Extracellular matrix A number of diverse extracellular matrix proteins were upregulated by estradiol as outlined in TABLE 47. Collagen type I alpha 2, collagen type III alpha 1, collagen type I alphal, and collagen type IV alpha.1 were upregulated by estradiol treatment 13.2-, 6.8-, 6.6-, and 4.3-fold, respectively compared with OVX controls. Tamoxifen therapy also upregulated genes encoding these matrix proteins by 6.1-, 3.4-, 3.5-, and 3.2-fold, respectively. For the majority of the rest of the genes in this category, after treatment with tamoxifen or raloxifene, overall expression was brought back up to levels not that dissimilar to sham controls.
- Estrodial treatment downregulated expression of the gene for the redox protein, thioredoxin interacting protein, 3-fold and the gene for the cell cycle protein, cyclin-dependent kinase inhibitor 1C (p57, Kip2), by 2- to 4-fold compared with OVX control.
- tamoxifen exerted similar effects whereas raloxifene had little or no effect on any of the transporter, redox, and cell cycle genes studied.
- Estrogen-induced genes were upregulated by estradiol by 3- to 10-fold compared to OVX control.
- Several estrogen-induced genes (brain creatine kinase; cytoplasmic dynein; hippocalcin-like 1; light polypeptide 1; brain prostaglandin D2 synthase 21kDa; hexokinase 1; and osteoblast cadherin 11, type 2) were upregulated by estradiol by 3- to 10-fold compared to OVX control
- the significance of these changes to uterine physiology and pathology has yet to be defined.
- a potency axis was constructed by assigning a median GEP score of "0" for OVX controls (no estrogen) and a median GEP score of "100" for estradiol treated animals (maximum estradiol effect). The respective GEP scores for tamoxifen and raloxifene were plotted to determine their relative estrogenic potencies.
- wnt genes are controlled by sex steroids, including estrogen, the relevance of these findings to estrogen-induced uterine growth is not known.
- Tulac S et al. J Clin Endocrinol Metab. 88:3860-3866 (2003) .
- wnt2B signaling appears to play a role in tumourigenesis.
- Katoh M Int J Mol Med. 8:657-660 (2001) ; Ricken A et al., Endocrinology. 143:2741-2749 (2002) .
- Estradiol also increased uterine expression of other functional classes of genes, including extracellular matrix proteins (TABLE 47) and genes generally associated with cell proliferation (e.g ., cell cycle, redox, and transport; TABLE 48). These effects are likely related to estrogen-induced uterine hyperplasia, which is characterized by increased cell proliferation and tissue growth. Cline JM et al., Toxicol Pathol. 29:84-90 (2001) .
- GEP gene expression profiling
- GEP gene expression profiling
- gene expression profiling using DNA microarray combined with the novel method of ranking therapeutic agents described here is a powerful technique for defining and predicting the relative pharmacological and toxicological actions of new chemical entities, and represents a new paradigm for drug development in the pharmaceutical industry. Moreover, this procedure has enormous potential for identifying efficacy and safety biomarkers that can be used to refine the drug screening process, reducing the time and costs required for taking a drug from discovery to clinic.
- the aim of this EXAMPLE is to further evaluate the effect of FGF23CTP on angiogenesis as shown in EXAMPLE III by using a hypoxic vascular retinopathy mouse model.
- mice are anesthetized by inhalation of isoflurane. Five days later the animals are sacrificed after perfusion with dextran-florescein and retinal flatmounts are prepared. The coded whole mounts allow to evaluate the vascular changes of the retinal brindly.
- the proliferation score includes quantification of the proliferation including the papilla, vascular development, vasoconstriction, retinal bleeding and tortuosity of the vessels, features also seen in human retinal disease.
- Evaluation of the angioproliferative changes Evaluation of the angioproliferative changes in the retinal preparations is performed in a masked way on coded preparations.
- Retinopathy scoring system is adapted from Higgins, R. D., et al. (J. AAPOS 3: 114-116 (1999) ) that was developed after modification of a scoring system used clinically in the neonatal intensive care unit. The following features are taken into consideration: neovascularisation of the optic disc, blood vessel tufts formation, large clusters of blood vessel tufts, central vasoconstriction and tortuosity of the vessels. Retinal haemorrhages are not taken into account as they may also result from the intraocular injection.
- a defined number of points (P) is assigned, which are summed up to a total proliferation score. The higher the score, the worse the hypoxia induced retinopathy.
- Neovascularisation of the optic disc either 1 or 0 points are assigned in case optic disc proliferation is measured (1 P) or absence (0 P).
- Blood vessel tufts formation the score for blood vessel tufts is determined by dividing every clock hour of the preparation surface in 4 zones: Zone 1 (optic disc zone) is evaluated in addition; Zone 2: one point for every wing (maximal 4 P); Zone 3: one point for every clock hour (maximal 12 P); and Zone 4: one point for every clock hour (maximal 12 P).
- Zone 1 optical disc zone
- Zone 2 one point for every wing
- Zone 3 one point for every clock hour
- Zone 4 one point for every clock hour (maximal 12 P).
- 1 point is assigned to a vasoconstriction of zone 1 of greater than 50%; I point is allocated if the vasoconstriction is greater than 50% of every wing of zone 2 and 3.
- maximal 1 point can be assigned to zone 1, and maximal 4 points each for zones 2, 3 and 4. Since so far no vasoconstriction is ever observed for zone 4, a maximum of total 9 points (without zone 4) can be allotted.
- Tortuosity of the vessels 2 points are assigned if less than one-third of the vessels are tortuous; if the amount of tortuous blood vessels is between one-third and two-thirds, 4 points are allocated, and in case more than two-thirds of the vessels are tortuous, than 6 points are given.
- Zone 4 never shows avascular zones. Proliferation in avascular zones is never observed. This is in principle a mutual exclusion of criteria; the existence of vascular proliferations has a higher impact on the retinopathy score than large avascular areas. Therefore, the maximum score ever counted with this system is 38 points using a substance which is considered to enhance vascular proliferation.
- the proliferation score relating to vascular changes on retinal flatmounts for individual animals treated with FGF23CTP (right eye) and PBS control (left eye) are measured as described above.
- the severity of retinopathy varies from animal to animal.
- TABLE 52 summarizes the determined proliferation score.
- Proliferation score right eye left eye right eye left eye Animal No. FGF23CTP PBS Animal No.
- FGF23CTP PBS 146.1 4 4 150.1 14 16 146.2 13 8 150.2 8 26 146.3 8 9 150.3 17 24 146.4 3 5 150.4 30 29 146.5 6 8 160.2 10 7 146.6 1 9 160.3 10 7 146.7 2 4 160.4 16 20 146.8 5 6 160.5 28 28 147.1 9 8 161.1 30 15 147.2 8 9 161.2 21 33 147.3 2 8 161.3 17 22 147.4 11 12 147.5 1 11 149.1 5 26 149.2 14 36 149.3 8 10 149.4 17 12 149.5 10 8
- the total thickness of the outer nuclear layer, the inner nuclear layer and the ganglion cell layer is measured using a standardized magnification after paraffin embedding and hematoxylin and eosin (HE)-staining. Three sections of each eye are measured at three locations each.
- TABLE 58 shows the result of the measurements in mm using a x200 magnification. Sections are encoded for evaluation.
- FGF23CTP is found not to induce any neuronal damage in the eye.
Landscapes
- Health & Medical Sciences (AREA)
- Chemical & Material Sciences (AREA)
- Life Sciences & Earth Sciences (AREA)
- Engineering & Computer Science (AREA)
- General Health & Medical Sciences (AREA)
- Organic Chemistry (AREA)
- Bioinformatics & Cheminformatics (AREA)
- Public Health (AREA)
- Medicinal Chemistry (AREA)
- Animal Behavior & Ethology (AREA)
- Veterinary Medicine (AREA)
- Chemical Kinetics & Catalysis (AREA)
- General Chemical & Material Sciences (AREA)
- Nuclear Medicine, Radiotherapy & Molecular Imaging (AREA)
- Pharmacology & Pharmacy (AREA)
- Wood Science & Technology (AREA)
- Zoology (AREA)
- Genetics & Genomics (AREA)
- Pulmonology (AREA)
- Diabetes (AREA)
- Epidemiology (AREA)
- Primary Health Care (AREA)
- Endocrinology (AREA)
- Medical Informatics (AREA)
- Heart & Thoracic Surgery (AREA)
- General Engineering & Computer Science (AREA)
- Biochemistry (AREA)
- Cardiology (AREA)
- Urology & Nephrology (AREA)
- Dermatology (AREA)
- Microbiology (AREA)
- Molecular Biology (AREA)
- Biomedical Technology (AREA)
- Biotechnology (AREA)
- Ophthalmology & Optometry (AREA)
- Obesity (AREA)
- Toxicology (AREA)
- Emergency Medicine (AREA)
- Oncology (AREA)
- Communicable Diseases (AREA)
Abstract
Description
- The invention relates generally to the in vivo testing of the efficacy of a compound or composition, and particularly to the testing and biologically functionalizing of classical small molecules, natural products, genes, peptides and proteins by activity in vivo.
- The invention further relates to medical uses of fibroblast growth factor 23 (FGF-23), FGF-23 fragments, FGF-23 C-terminal polypeptides, FGF-23 homologs and/or FGF-23 variants, in particular for the manufacture of a medicament for the treatment of diseases associated with deregulated angiogenesis or cell proliferative disorders.
- Pharmaceutical companies are interested in evaluating and understanding the function and regulation of newly discovered genes and gene products (proteins), especially newly discovered genes and proteins, which could help in the understanding of the mechanisms linked to diseases or compounds action. In addition, the genes and gene products can become potential drugs or biomarkers. Grenet O, Pharmacogenomics J. 1(1):11-2 (2001).
- However, a gene sequence alone does not provide information about the actual function of the protein in the cell or organism physiology. In addition, while the genome has a relatively well defined number of genes, there is no known limit to the possible number of protein variants. The potential number of proteins encoded by these genes is estimated to be from two to at least one-hundred times higher than the number of genes, since it has recently been found that proteins can also be produced by splicing at the protein level not just at the RNA level.
- The current process of drug discovery proceeds from single target to single drug product. The current process is a long process, frequently with late attrition for lack of efficacy, wrong design or false indication.
- Thus, there is a need in the art for a more efficient method for discovering and identifying drug candidates, gene targets and biomarkers.
- The invention provides a discovery process for biologically functionalizing peptides, proteins, genes, small molecules and natural products using organism-wide gene expression profiling. The discovery process of the invention proceeds from single lead or drug to multiple targets and indications (as indicated by an impact on any target in the cascade chain of a pathway), and multiple drug products, thus providing rapid guidance to a correct human proof-of-concept.
- The discovery process of the invention begins with administration of test substances to animals, followed by screening of the resulting gene expression in many organs obtained from the test animal. The invention can be used to biologically functionalize the entire genome of any organism where micoarray chips are available. The invention is not restricted to the type of compound to be functionalized. Small molecules, proteins, natural products, cDNA (for functionalizing any gene of interest), etc. are all susceptible to the strategy of the invention.
- Since the discovery process of the invention is based on a non-preconceived hypothesis and whole organism multi-organ analysis, polypeptides can be selected for testing in the absence of any biological selection criteria other than peptide sequence. The resulting organism-wide pattern of the gene expression changes in the transcriptome provides an overview of the activities at the molecular and organism-wide levels. Accordingly, the unbiased approach of the invention regarding the administration of a compound can provide information about the physiological relationships throughout the entire body that are caused by the compound's administration.
- The discovery process of the invention then integrates in vivo profiling with internal and external genomic databases to elucidate the function of unknown proteins, typically within few months. The unbiased approach of the invention in regards to the administration of a compound advantageously provides genomic signatures from multiple organs. The resulting data can be analyzed either by using tools that are known to those of skill in the art or by using mols that compare the compound signatures produced by the administration of the compound among the different organs. This multi-organ analysis is in contrast to standard approaches, which, since they do not use an unbiased approach of compound administration, do not result in a multi-organ identification of the function of the compound. Instead the standard approaches provide analysis on a case-by-case basis, which can make cross-experimental comparisons difficult. In contrast to the standard approaches, the identification of the function of the compound using the method of the invention allows for the identification of the function of the compound in many metabolic and regulatory pathways. In addition, the identification of the function of the compound using the method of the invention advantageously results in an understanding of the stability of the active compound in the body, a property of the administered compound which would otherwise not be predictable a priori using standard approaches.
- The identification of the function of the compound using the method of the invention can be multi-step, as one step or part of the identification leads to another step or part of the identification, to provide a more complete understanding of the administered compound's activity in vivo. For example, the identification of compound function in one organ (such as the spleen) can lead to an understanding of the compound function in other organs. By contrast, the standard approaches, which rely on immediate access to tests on a limited number of organs, depend on anecdotal evidence from other experiments to further steps in the identification of compound function.
- The invention is suitable for several stages of drug discovery, identifying both drug targets and biomarkers. The discovery process of the invention advantageously delivers an increased number of validated drug candidates and identified drug targets and biomarkers along with a savings in time, resources and animals. The discovery process of the invention advantageously integrates into one process standard exploratory tools with new genomic approaches. The discovery process of the invention can also be used for the reprofiling of safe compounds stopped after the initial stages of drug approval (e.g., Phase I) for re-indication. The invention can be used for adjusting the best fit for combination therapies, by optimally matching of gene expression signatures between two compounds, cancelling of side effects and the potentiation of efficacy. The discovery process of the invention can be used for the profiling of the more advanced development portfolio to guide the later stages af drug approval process (e.g. Phase II and Phase III)
- In several embodiments, the process can be used to analyze tissues or body fluids (such as coronary heart disease, breast cancer and another indication; each compared to healthy controls). Plasma proteins that are differentially expressed between normal. subjects and coronary artery diseased patients, with known or unknown function, are analyzed for potential target identification/validation, and biomarker identification.
- In one embodiment, the discovery process of the invention begins with an in vivo screening of proteins, peptides and reference compounds in mice. Based on the results of the mice screening, an in vivo verification of selected proteins, peptides or reference compounds is then conducted in non-human primates or animal models of human pathology or disease. The comparison of the resultant information to a profile of reference drugs, with well characterized pharmacological activity, facilitates biological interpretation of the profiles of unknown compounds. In a particular embodiment, the selection rate for the proteins, peptides or reference compounds is ~20%.
- In one embodiment the discovery process of the invention combines in one process: (a) pre-screening in mice; (b) verification of selected proteins/peptides/reference compounds in monkeys; (c) large number of the analyzed tissues (up to 25 in mice, up to 120 in monkeys); (d) homogeneity of the tissue sample (e) high quality mRNA; (f) a genome-wide approach with hybridization chips; (g) powerful bioinformation tools for clustering and statistics; (h) the possibility of cross-assay meta-analysis; and (i) localization at the cellular level of the affected genes or pathways by in situ hybridization.
- By use of the discovery process of the invention, it has now surprisingly been found that polypeptides relating to FGF-23 affect key genes controlling cellular differentiation and proliferation, as well as angiogenesis.
- Fibroblast growth factors (FGFs) make up a large family of polypeptide growth factors that are found in organisms ranging from nematodes to humans. During embryonic development, FGFs have diverse roles in regulating cell proliferation, migration and differentiation. In the adult organism, FGFs are homeostatic factors and function in tissue repair and response to injury. Inappropriate expression of some FGFs can contribute to the pathogenesis of cancer.
- Mouse FGF-23 has been identified by homology-search in the GenBank Nucleotide Sequence Database with amino acid sequence of mousse FGF-15. Mousse IGF-23 and human FGF-23 are highly identical (~72% amino acid identity). Both, mouse and human FGF-23, cDNAs encode a protein of 251 amino acids, having a hydrophobic amino terminus (~24 amino acids) typical for secreted proteins, and a unique C-terminus having no homology to other FGF family members. In the mouse, FGF-23 mRNA is expressed in the brain, preferentially in the ventrolateral thalamic nucleus, and in the thymus at low levels.
- Overexpression of FGF-23 or expression of mutated FGF-23 has been demonstrated to be associated with several pathological findings:
- Recombinant FGF-23 induces hypophosphatemia in vivo as a result of urinary phosphate wasting (Shimada T., et al., Proc. Natl. Acad. Sci. U. S. A. 98: 6500-6505 (2001)).
- FGF-23 overexpression has been observed in tumors that are responsible for oncogenic osteomalacia (OOM) (White K.E., et al., J. Clin. Endocrinol. Metab. 86: 497-500 (2001)).
- Autosomal dominant hypophosphatemic rickets (ADHR) has been shown to be associated with mutations of FGF-23 within the 176-RXXXR-179 cleavage site, preventing degradation of FGF-23 (The ADHR Consortium, Nat. Genet. 26: 345-348 (2000)).
- While OOM and ADHR have been demonstrated to be associated with FGF-23, a further disorder, X-linked hypophosphatemia (XLH), which is phenotypically similar to OOM and ADHR, has been shown to result from mutations in the PHEX gene. PHEX encodes a membrane-bound endopeptidase (The HYP Consortium, Nat. Genet. 11: 130-136 (1995)) and it is hypothesized that FGF-23 is a PHEX substrate, while FGF-23 ADHR mutant (FGF-23(R179Q) being undegradeable by PHEX.
- Each of the above described syndromes is characterized by hypophosphatemia, decreased renal phosphate reabsorption, normal or low serum calcitriol concentrations, normal serum concentrations of calcium and parathyroid hormone, and defective skeletal mineralization (Quarles L. D. and Drezner M. K., J. Clin. Endocrino/. Metab. 86:494-496 (2001)).
- Because both the overproduction and missense mutations of FGF-23 cause hypophosphatemia with renal phosphate wasting, it is concluded that FGF-23 is at least one of the causative factors of OOM and is an important regulator of phosphate and bone metabolism (Shimada T., Proc. Natl. Acad. Sci. USA 98: 6500-6505(2001)). However, the molecular targets of FGF-23 or of FGF-23 proteolytic cleavage products are so far unknown, as is the mechanism of how FGF-23 or FGF-23 derived proteins or peptides cause renal and skeletal abnormalities (Quarles L. D., Am. J. Physiol. Endocrinol. Metab. 285: E1 - 9 (2003)).
- The present invention thus relates the use of a polypeptide for the manufacture of a medicament for use in the treatment of a disease associated with deregulated angiogenesis, wherein the polypeptide is selected from the groups consisting of (a) fibroblast growth factor 23 (FGF-23) (SEQ. ID No: 1) or a fragment of FGF-23; (b) a bioactive polypeptide having a percentage of identity of at least 50% with the amino acid sequence of any one of the polypeptides of (a); or (c) a bioactive variant of any one of the polypeptides of (a) or (b).
- In a further aspect, the present invention relates to the use of a polypeptide as defined above for the manufacture of a medicament for use in the treatment of a cell proliferative disorder.
- In a further aspect, the present invention relates to a method for the treatment of a disease associated with deregulated angiogenesis or of a cell proliferative disorder comprising administering an effective amount of a polypeptide as defined above to a mammal including a human suffering from the disease or disorder.
- In another aspect, the present invention relates to a pharmaceutical composition for use in a disease associated with deregulated angiogenesis or a cell proliferative disorder comprising a polypeptide as defined above and a pharmaceutically-acceptable carrier.
-
FIG. 1 is a set of polypeptide sequences and putative polypeptide sequence correlations for GPA018, GPA019, GPA020, GPA022 and GPA023. -
FIG. 2 is a box plot of the proliferation scores (Units) relating to vascular changes on retinal flatmounts of animals treated with FGF-23 C-terminal polypeptide (FGF23CTP; (right eye; column 1) and PBS (left eye; columm 2); - Introduction and overview. The classical discovery process in the pharmaceutical industry is based on targets (enzymes, receptors, cellular assays, animal and disease models, etc.). Chemicals or biological products are tested, in a high throughput mode, on a battery of pre-selected different targets. The weakness of the classical approach are the "artificially disconnected" in vitro target models compared to the tightly interconnected and interdependent relationship of the different targets in a whole organism and the fact that biological activity on all non selected targets is missed.
- By contrast, the invention is a "non pre-conceived hypothesis" discovery process to rapidly identify and analyze the biological activity of new products in the whole organism, multi-organs and whole transcriptome. All physiological interactions between the different organs or tissues are present and any cellular pathway or any potential targets could potentially be analyzed in a non artificial system.
- The drug discovery process of the invention advantageously increases the capabilities in the field of proteomics and functionalization. Proteomics involves the systematic separation, identification and characterization of the proteins present in a sample of tissue, or in a biological fluid, at a given time. All biological processes, including diseases and responses to drugs, induce changes in proteins, and the global protein profile (the "proteome") varies during the development of an organism, maturation of cell types or tissues, and progression or treatment of disease. Each cell type may express different patterns of proteins at different times. Each protein in turn may be modified chemically in an equally diverse number of ways to serve different cellular functions. As proteins derived from the same gene can be largely identical, and might differ only in small but functionally relevant details, protein identification tools not only identify a large number of proteins but also differentiate between close relatives.
- The classical proteomics approach combines high resolution two-dimensional gel electrophoresis (2-DGE) with imaging software to quantitatively and qualitatively screen for proteins that differ in abundance, molecular weight (Mr) or charge between the gels. These protein differences can then be identified with high speed and sensitivity by using acombination of "state-of-the-art" mass spectrometry (MS) approaches and robotics, alongside sensitive bioinformatics search tools.
- RNA transcripts represent the intermediate form between the DNA and the proteins that are among the most active molecules involved in the cellular functions. The total content of RNA is called the "transcriptome". The high-density DNA chip technology gives potential access to the analysis of all the transcripts produced by a cell population or tissue at any determined time point. Genome-scale RNA expression analysis can thus provide new insights into the cellular events induced upon administration of an animal with peptides or other chemicals. This provides a broad view of the metabolic, signalling, regulatory or other biochemical pathways in the animal being tested. The analysis of the induced perturbations in cellular transcription gives a detailed molecular description of the activity of the administered compound.
- An analysis of a transcriptome has become an approachable reality with the implementation of high throughput RNA quantification system. The high-density microarrays allow collecting thousands of information points of a transcriptome at once, reaching the order of magnitude of the probable number of genes expressed and producing a broad and detailed view of the cellular events.
- As the changes of the different functions inside a cell are tightly interconnected, the changes in different organs inside an organism are linked. Applying gene profiling to different organs submitted to the same treatment gives a complete overview of the effects and modifications of the physiological status. The identification of common changes in organs with originally very different transcriptomes facilitates the elimination of the experimental noise. The presence or absence of identical signals can indicate if the treatment has a pleiotropic effect or is affecting a target organ. If a compound is targeting a primary organ, the other organs will reflect the functional modifications of the first organ impacted. This type of information can be collected in correlation to the pharmacological effect or to the potential toxic effects. The organism-wide pattern of expression changes can also provide useful information on the pharmacodynamic of the compound, precisely delineating the range of organs affected.
- The accumulation of information in different organs not only helps to elucidate the precise mode of action but also provides a complete reconstruction of the compound-induced modifications at the organism scale.
- Administration of compounds. Administration of the protein or other drug compound tiggers multiple cascades of intracellular signalling events, involving complex networks (pathways) and relying on protein modifications such as phosphorylation, glycosylation, etc. These events eventually lead to modifications of gene expression levels. Administration of an active compound therefore leads to multiple and interdependent changes in the composition of the transcriptome.
- In one embodiment, the test animal is a vertebrate. In a particular embodiment, the vertebrate is a mammal. In a more particular embodiment, the mammal is a primate, such as a cynomolgus monkey or a human. As used herein, the administration of an agent or drug to a subject or patient includes self-administration and the administration by another.
- In more particular embodiments, natural or synthetic substances of biological or non-biological sources, e.g. amino acids, peptides, proteins, nucleotides, cDNAs, chemicals, can be administered to animals, e.g. mice (Mus musculus), rat (Rattus norvegicus), monkey (Macaca fascicularis), by methods known in the art, e.g. by injection, inhalation, or oral administration. Administration of those substances can be adjusted in terms of time of exposure and dosage, and combinations thereof. The "treatment group" of animals should receive a substance or a combination of substances in a vehicle compound suitable for administration of the substance or the combination of substances, while the "control" (or "baseline") group should receive the vehicle compound only. During the treatment period biological specimen such as tissue pieces (e.g. obtained by biopsy), or body fluids, such as blood, urine, or saliva, can be sampled. At the end of the treatment time all animals of all groups can be sacrificed and biological specimen such as whole organs or pieces thereof can be sampled. All sampled specimen can be stored as known in the art for further analysis that include, but are not limited to, RT-PCR, Northern blotting, in-situ hybridization, gene expression profiling with microarrays.
- As used herein, "direct administration" is the injecting, oral gavage, feeding or other administration of a compound, such as a protein, into animals. After some time, i.e. hours, days or weeks, organs and tissues are collected from the animals and the geneexpression profiles determined. This procedure is commonly used in pharmacotoxigenomics, pharmacogenomics and the like.
- In one embodiment, the invention begins with differentially expressed proteins in plasma between normal subjects and coronary artery diseased patients with regard to the identification and validation of potential targets and the identification of biomarkers.
- The drug discovery process of the invention is particularly amenable to the analysis of the smaller proteins of a proteome (ranging from 0.5 to 20 kDa) escaping the classical detection methods. Small molecular weight proteins can be readily synthesized by commercial methods (e.g., Microprot™ method, GeneProt, Geneva, Switzerland). Chemically-synthesized proteins can be rapidly produced and do not contain biological contaminants.
- For mice, a minimal amount of the compound to be functionalized (only ca. 5 mg) is used.
- As used herein, "indirect administration" is the injecting of a gene that codes for that protein (as a cDNA plasmid) and then doing the gene expression profiling. In one embodiment, the technology is the use of 'naked' DNA (a cDNA expression plasmid) injected into mice (or other animals). This technique is widely published for either DNA immunization (Kim J-M et al., Gene Ther. 10(15): 1216-24 (August 2003)) and delivery of genes for therapeutic purposes (Aliño SF et al., Gene Ther. 10(19):1672-9 (September 2003)). Among a number of techniques for gene transfer in vivo, intravenous injection or the direct injection of plasmid DNA into muscle are simple, inexpensive, and safe. Kim J-M et al., Gene Ther. 10(15): 1216-24 (August 2003). The important efficacy of nonviral genomic DNA opens a new avenue in the safety applications of human gene therapy. Aliño SF et al., Gene Ther. 10(19):1672-9 (September 2003).
- Administration of naked DNA can be by methods known to those of skill in the art, see,
U.S. Pat. Nos. 6,165,754 ;6,309,370 ;6,566,342 ;6,620,617 and6,651,655 , and references cited therein. - Gene expression profiles. After a period of time (e.g., two weeks) of protein administration, the treated animals are necropsied. Selected tissues (e.g., 25 tissues for mice/ 120 tissues for monkeys) are dissected and rapidly snap-frozen for genomics analysis. Organ samples (e.g., fifty organs samples for monkeys) can be isolated for histopathological examinations and for gene expression localizations, such as by in situ hybridization. Initial studies have shown that for mice, 3-10 tissues out of twenty five sampled tissues are generally sufficient to characterize a compound by gene expression and - hybridization; for monkeys, twenty tissues out of 120 sampled tissues are generally sufficient.
- In more particular embodiments, the methods of detecting the level of expression of mRNA are well-known in the art and include, but are not limited to, reverse transcription PCR, real time quantitative PCR, Northern blotting and other hybridization methods. A particularly useful method for detecting the level of mRNA transcripts obtained from a plurality of genes involves hybridization of labelled mRNA to an ordered array of oligonucleotides. Such a method allows the level of transcription of a plurality of these genes to be determined simultaneously to generate gene expression profiles or patterns.
- As used herein, a gene expression profile is diagnostic when the increased or decreased gene expression is an increase or decrease (e.g., at least a 1.2-fold difference) over the baseline gene expression following administration of a compound. As used herein, a gene expression pattern is "higher than normal" when the gene expression (e.g., in a sample from a treated subject) shows a 1.2-fold difference (i.e., higher) in the level of expression compared to the baseline samples. A gene expression pattern is "lower than normal" when the gene expression (e.g., in a sample from a treated subject) shows a 1.2-fold difference (i.e., lower) in the level of expression compared to the baseline samples. In other embodiments, a 1.5-fold change may be used as the criteria.
- Techniques for the detection of gene expression of the genes described by this invention include, but are not limited to northern blots, RT-PCT, real time PCR, primer extension, RNase protection, RNA expression profiling and related techniques. Techniques for the detection of gene expression by detection of the protein products encoded by the genes described by this invention include, but are not limited to, antibodies recognizing the protein products, western blots, immunofluorescence, immunoprecipitation, ELISAs and related techniques. These techniques are well known to those of skill in the art. Sambrook J et al., Molecular Cloning: A Laboratory Manual, Third Edition (Cold Spring Harbor Press, Cold Spring Harbor, 2000). In one embodiment, the technique for detecting gene expression includes the use of a gene chip. The construction and use of gene chips are well know in the art. See,
U.S. Pat Nos. 5,202,232 ;5,445,934 ;5,525,464 ;5,695,940 ;5,744,305 ;5,795,716 and5,800,992 . See also, Johnston, M. Curr Biol 8:K171-174 (1998), Iyer VR et al., Science 283:83-8T (1999) and Elias P, "New human genome 'chip' is a revolution in the offing" Los Angeles Daily News (October 3, 2003): - Gene expression profiles can be generated using e.g. the Affymetrix microarray technology. Briefly, total or, preferably, polyA+-RNA from a biological sample is extracted using standard procedures known in the art, e.g. the RNeasy® kit (Qiagen, MD, USA). In a following step, double stranded cDNA is prepared in a process termed "reverse transcription (RT)" which is known in the art, using e.g. the "SuperScript Double-Stranded cDNA Synthesis Kit" (Invitrogen, CA, USA). In a subsequent step, termed "in-vitro transcription", double stranded cDNA obtained in a previous step is labelled with a fluorochrome by methods known in the art, using e.g. the ENZO Labeling Kit (ENZO, NY, USA). Labelled RNA is hybridized to oligonucleotide microarrays. These are known in the art and consist of a surface to which probes that correspond in sequence to gene products (e.g. mRNAs, polypeptides, fragments thereof etc.) can be specifically hybridized or bound to a known position. Processing of the microarrays, including e.g. washing, staining, scanning, is performed according to the manufacturer's instructions. Hybridization intensity data detected by the scanner are automatically acquired and processed by analytical software components, e.g. the GENECHIP® software (Affymetrix, CA, USA). Raw data is normalized to expression levels using a target intensity of 200.
- Two elements of value in expression profiling are the quality and homogeneity of the tissue samples and the mRNA quality. For this purpose, the location of tissues to be sampled and each sample can be carefully dissected from the other surrounding tissues using a binocular microscope.
- The samples are then transferred to a molecular biology laboratory for RNA extraction. The protocol for RNA extraction can be partially automated thus increasing the reproducibility and speed of this step. The extracted RNA can be stored for long periods of time in a frozen state and kept as an archive.
- An aliquot of the extracted RNA is reverse transcribed to obtain a cDNA. In a second step, cDNA is transcribed in the presence of a fluorescent label to obtain cRNA. The composition of the cRNA obtained is identical to the original composition of the RNA in the samples, but each molecule now carries a fluorescent marker. The labelled mixture of cRNA is used for the hybridization process, e.g. using GeneChip® assays (Affymetrix, Santa Clara, California USA). The raw data (obtained after laser-scanning of the chip) are processed by a specific algorithm condensing for each gene all available information in a unique value. This value called average difference represents the level of expression of the gene.
- The information can be further refined by the use of complementary techniques. In situ hybridization, for example, can indicate precisely which cell type inside an organ is specifically expressing a given gene. This technique based on the detection of RNA is independent of the availability of an antibody. Quantitative PCR may also be used to confirm expression levels of particular genes of interest.
- Analysis. Mathematical and statistical processing of the data (clustering) help to reduce the complexity and the size of the data sets. Different types of clustering can be used to separate the different genes according to their behavioural similarity across the different conditions and to establish links between genes that may be related to the same biological phenomenon. Data processing also includes statistical tests to separate significant variations from experimental noise. However, the stringency of the various filtering steps must be modulated to integrate the biological nature of the data.
- The list of different affected genes is then compared to the information collected in the scientific literature. The synthesis of the available knowledge related to the different genes, points to one or several signalling, metabolic or other biochemical pathways or to known modifications. Once a coherent picture has been reconstructed, the profiles may be associated with potential indications. The discrimination between the different hypotheses follows a process closely related to differential diagnosis.
- During the analysis, a constant comparison between the expression data and the current knowledge on cell signalling and regulation is established. Such a permanent bridge provides an efficient way to refine the existing models, particularly in the field of intra- and inter-cellular signalling. The interdependence of gene expression changes is assessed in different organs and under different stimuli. New players in the pathways can be identified and the link between the already described players can be refined. Even if only a part or the cellular regulation depends on the RNA' expression changes, the accumulation of expression data can help to build new and more accurate model of the cell functions. The information collected could help to identify the critical elements of the pathways to be used as target or biomarker.
- Some of the expression profiles can be easily matched with existing information harvested from the general scientific knowledge. Linking this information with a potential indication or a potential side effect is then straightforward. Some combinations of expression changes are more difficult to translate into pharmacological information. In such cases, matching of the RNA expression profile of an unknown compound to the profile of a reference drug or disease may facilitate the interpretation. It may then not be necessary to reconstruct the entire cellular modifications to find a potential indication. The reference drugs and disease profiling will also help to build the critical mass of information into the database.
- In more particular statistical analysis embodiments, microarray datasets can be analyzed by the use of analytical software components, such as GeneSpring® (Silicon Genetics, CA, USA). Microarray datasets consist in part of probe set identifiers that refer to an oligonucleotide sequence that is bound to the glass slide and to which a labelled cDNA (see above) with complementary sequence binds if it is present in the tissue or body fluid sample. The scanned intensity of the signal that is detected and converted into numeric values by a software, for example MAS5 (Affymetrix, CA, USA), is an indirect measure for the amount, or expression level of the cDNA present in the biological samples under investigation. The entity of gene expression levels as indicated by signal intensity values for all probe sets in a microarray dataset of a biological sample can be referred to as expression profile of that sample. In each microarray dataset, signal intensity values, cDNA or gene annotations, as well as quality parameters that can be created by software, for example MAS5 (Affymetrix, CA, USA), are informational results associated with the probe set ID.
- In the cDNA microarray system, expressions of genes from the experimental cells of interest are measured relative to the expressions of the same genes in a fixed reference or control cell type. To identify statistically relevant effects of a substance on the expression profile of samples or tissue or body fluid under investigation, probe sets can be filtered based on the associated values given by the software used to create the values, for example MAS5 (Affymetrix, CA, USA). Filters can be based on quality parameters, expression level, changes of expression levels in the samples from treated versus control specimen, as well as significance. The resulting list of probe sets refers to such genes that experience a significant change in their expression level as a direct or indirect result of the treatment of the biological samples they are derived from.
- The interpretation of such gene lists with regards to effects of a substance on biological systems and pathways is subject to the investigators knowledge and experience. Application of analytical software components such as GeneSifter® (VizXLabs, Seattle, WA, USA) assists in the interpretation of such gene lists.
- Moreover, we have developed software for a multiorgan analysis of the data generated by the method of the invention, which compares the compound signatures produced by the administration of the compound among the different organs.
- New uses identified by the drug discovery process of the invention. The present invention also provides for the use of a polypeptide for the manufacture of a medicament for use in the treatment of a disease associated with deregulated angiogenesis, wherein the polypeptide is selected from the groups consisting of (a) fibroblast growth factor 23 (FGF-23) (SEQ. ID No: 1) or a fragment of FGF-23; (b) a bioactive polypeptide having a percentage of identity of at least 50% with the amino acid sequence of any one of the polypeptides of (a); or (c) a bioactive variant of any one of the polypeptides of (a) or (b).
- According to another aspect, the present invention provides for the use of a polypeptide as defined above for the manufacture of a medicament for use in the treatment of a cell proliferative disorder.

- The term "polypeptide" as used herein, refers to a protein, peptide, oligopeptide or synthetic oligopeptide. These terms are intended to be used interchangeably. Any one of said terms refers to a chain of two or more amino acids which are linked together with peptide or amide bonds, regardless of post-translational modification such as glycosylation or phosphorylation. The polypeptides may also comprise more than one subunit, where each subunit is encoded by a separate DNA sequence.
- The term "bioactive", as used herein, refers to a molecule that elicits or affects a biological event. Such biological event may for example be related to a disease associated with deregulated angiogenesis or to a cell proliferative disorder.
- A "bioactive polypeptide" of the invention includes FGF-23, fragments of FGF-23 such as fragments derived from the C-terminus of FGF-23 . Also included are homologs which have an amino acid sequence having a percentage of identity of at least 50% to FGF-23 or fragments thereof and variants of FGF-23 or of FGF-23 fragments. The polypeptide according to the invention may comprise FGF-23 having the amino acid sequence of SEQ ID NO: I. A fragment of
FGF 23 may comprise at least 10 amino acids, preferably at least 15, 20, 25 or 30 amino acids. More preferably a fragment of FGF-23 may comprise at least 50, 60, or 70 amino acids. Most preferably a fragment of FGF-23 comprises 75 amino acids. Alternatively, a fragment of FGF-23 may comprise at least 80 or 100 amino acids, and most preferred at least 120 or 150 amino acids. In particular, the fragment may comprise at least 180 amino acids, such as e.g. 200 amino acids. - Such polypeptide may also be a proteolytic cleavage product of FGF-23 generated by proteases such as a membrane-bound endopeptidase including PHEX. A polypeptide according to the invention may comprise a C-terminal fragment of FGF-23. Such C-terminal fragment may comprise at least 15 amino acids of the C-terminus of FGF-23, preferably at least 25, at least 35 or 45, more preferably at least 55 or at least 65, most preferred at least 70, such as e.g. 75 amino acids. The at least 15 amino acids may comprise the most C-terminal at least 15 amino acids, it may also comprise the at least 15 amino acids within the C-terminal part of FGF-23. The polypeptide may comprise the at least 75 most C-terminal amino acids of FGF-23 and it may have the amino acid sequence of SEQ ID NO: 2, designated FGF-23 C-terminal polypeptide (FGF23CTP).

- The polypeptide may also have an amino acid sequence having a percentage of identity of at least 50%, preferably at least 60%, more preferred at least 70% or 80%, and most preferably at least 90% such as 95%, 97%, or 99% identity with the amino acid sequence of any one of the aforementioned polypeptides.
- The bioactive polypeptides of the present invention as described above may also be referred to as FGF-23, FGF-23 protein or polypeptide, FGF-23 derived or related polypeptides, FGF-23 C-terminal derived or related polypeptides, or FGF-23 C-terminal Polypeptides.
- Amino acid residues are referred to herein by their standard single-letter or three-letter notations:A (Ala) alanine; C (Cys) cysteine; D (Asp) aspartic acid; E (Glu) glutamic acid; F (Phe) phenylalanine; G (Gly) glycine; H (His) histidine; I (Ile) isoleucine; K (Lys) lysine; L (Leu) leucine; M (Met) methionine; N (Asn) asparagine; P (Pro) proline; Q (Gln) glutamine; R (Arg) arginine; S (Ser) serine; T (Thr) threonine; V (Val) valine; W (Trp) tryptophan; Y (Tyr) tyrosine.
- The term "percentage (%) of identity", or like term, used in respect of the comparison of a reference sequence and another sequence (i.e. a "candidate" sequence), means that in an optimal alignment between the two sequences, the candidate sequence is identical to the reference sequence in a number of subunit positions equivalent to the indicated percentage, the subunits being nucleotides for polynucleotide comparisons or amino acids for polypeptide comparisons. As used herein, an "optimal alignment" of sequences being compared is one that maximizes matches between subunits and minimizes the number of gaps employed in constructing an alignment. Percent identities may be determined with commercially available implementations of algorithms described by Needleman and Wunsch, J. Mol. Biol. 48: 443-453 (1970)("GAP" program of Wisconsin Sequence Analysis Package, Genetics Computer Group, Madison, WI). Other software packages in the art for constructing alignments and calculating percentage identity or other measures of similarity include the "BestFit" program, based on the algorithm of Smith and Waterman, Advances in Applied Mathematics 2: 482-489 (1981) (Wisconsin Sequence Analysis Package, Genetics Computer Group, Madison, WI). The percentage of identity may also be generated by WU-BLAST-2 (Altschul et al., Methods in Enzymology 266: 460-480 (1996)). WU-BLAST-2 used several search parameters, most of which are set to the default values. The adjustable parameters are set with the following values: overlap span = 1, overlap fraction = 0.125, word threshold (T) = 11. A % amino acid sequence identity value is determined by the number of matching identical residues divided by the total number of residues in the aligned region. For example, to obtain a polypeptide having an amino acid sequence at least 95% identical to a reference amino acid sequence, up to five percent of the amino acid residues in the reference sequence may be deleted or substituted with another amino acid, or a number of amino acids up to five percent of the total amino acid residues in the reference sequence may be inserted into the reference sequence. These alterations of the reference sequence may occur at the amino or carboxy terminal positions of the reference amino acid sequence or anywhere between those terminal positions, interspersed either individually among residues in the reference sequence of in one or more contiguous groups with in the references sequence. It is understood that in making comparisons with reference sequences of the invention that candidate sequence may be a component or segment of a larger polypeptide or polynucleotide and that such comparisons for the purpose computing percentage identity is to be carried out with respect to the relevant component or segment.
- A polypeptide of the invention also includes a polypeptide fragment of a polypeptide of the invention. Such polypeptide fragment is meant to be a polypeptide having an amino acid sequence that entirely is the same in part, but not in all, of the amino acid sequence of a polypeptide of the invention. Such polypeptide fragment may be "freestanding," or may be part of a larger polypeptide of which such polypeptide fragment forms a part or region, most preferably as a single continuous region. Preferably such polypeptide or polypeptide fragment retains the biological activity of the corresponding polypeptide of the invention.
- The invention also includes functionally preserved variants of the polypeptides or polypeptide fragments described herein. Such variants may be made using methods standard in the art, for example, by conservative amino acid substitutions. Typically such substitutions are among Ala, Val, Leu and Ile; among Ser and Thr; among the acidic residues Asp and Glu; among Asn and Gln; and among the basic residues Lys and Arg; or aromatic residues Phe and Tyr. Particularly preferred are variants in which several, 5 to 10, 1 to 5, or 2 amino acids are substituted, deleted or added, in any combination.
- In various other embodiments, the polypeptide (fragment) or polypeptide variant may be linear or branched, it may comprise modified amino acids, it may be interrupted by non-amino acids, and/or it may be assembled into a complex of more than one polypeptide chain. As is well understood in the art, a polypeptide may be modified naturally or by intervention; for example, disulfide bond formation, glycosylation, lipidation, acetylation phosphorylation, or any other manipulation or modification, such as conjugation with a labeling component. In some embodiments polypeptides or polypeptide fragments contain one or more analogs of an amino acid (including; for example, unnatural amino acids, etc.), as well as other modifications known in the art.
- A polypeptide or a polypeptide fragment of the invention includes isolated naturally occurring polypeptides. Preferably, such a naturally occurring polypeptide has a frequency in a selected population of at least five percent, and most preferably, of at least ten percent. The selected population may be any recognized population of study in the field of population genetics. Preferably, the selected population is Caucasian, Negroid, or Asian. More preferably, the selected population is French, German, English, Spanish, Swiss, Japanese, Chinese, Korean, Singaporean of Chinese ancestry, Icelandic, North American, Israeli, Arab, Turkish, Greek, Italian, Polish, Pacific Islander, or Indian.
- A polypeptide (fragment) of the invention may also include recombinantly produced polypeptides, synthetically produced polypeptides and a combination of such polypeptides of the invention, and fragments thereof. Means for preparing such polypeptides are well understood in the art. For instance, a polynucleotide fragment or a polypeptide of the invention can be isolated from body fluids including, but not limited to, serum, urine, and ascites, or synthesized by chemical or biological methods (for example, cell culture, recombinant gene expression). "Isolated", if not otherwise specified herein includes the meaning "separated from coexisting material".
- Recombinant polypeptides of the present invention may be prepared by processes well known in the art from genetically engineered host cells comprising expression systems. Accordingly, in a further aspect, the present invention relates to the production of polypeptides by recombinant techniques, to expression system which comprises a nucleic acid or nucleic acids encoding the polypeptides of the present invention, to host cells which are genetically engineered with such expression systems, and to methods to isolate the polypeptides.
- Another embodiment provides that a polypeptide of the invention is encoded by a nucleic acid which hybridizes under stringent conditions to SEQ. ID No: 3 or to SEQ. ID No:4. In some embodiments, the nucleic acid comprises at least 50, at least 75, at least 100, at least 125, or at least 150 nucleotides. Preferably the nucleic acid comprises at least 175 or ar least 200 nucleotides. In particular it comprises 225 or 228 nucleotides. The nucleic acid may also comprise at least 300, or at least 400 or 500 nucleotides. Preferably it may comprise at least 600 or at least 700 nucleotides. Most preferably it comprises at least 750 nucleotides. Such nucleic acids may comprise contiguous nucleotides of SEQ ID No: 3 or 4 or contiguous nucleotides able to hybridize to SEQ ID NO: 3 or 4 under stringent conditions.


- The term "nucleic acid" means natural or semi-synthetic or synthetic or modified nucleic acid molecules. It refers to nucleotide sequences, oligonucleotides or polynucleotides including deoxyribonucleic acid (DNA) and/or ribonucleic acid (RNA) and/or modified nucleotides. These terms are intended to be used interchangeably. RNA may be in the form of an tRNA (transfer RNA), snRNA (small nuclear RNA), rRNA (ribosomal RNA), mRNA (messenger RNA), anti-sense RNA, and ribozymes. DNA may be in form of plasmid DNA, viral DNA, linear DNA, chromosomal or genomic DNA, cDNA, or derivatives of these groups. In addition these DNAs and RNAs may be single, double, triple, or quadruple stranded. The term also includes PNAs (peptide nucleic acids), phosphorothioates, and other variants of the phosphate backbone of native nucleic acids.
- "Stringent conditions" of hybridization reactions is readily determinable by one of ordinary skill in the art, and generally is an empirical calculation dependent upon probe length, washing temperature, and salt concentration. In general, longer probes require higher temperatures for proper annealing, while shorter probes need lower temperatures. Hybridization generally depends upon the ability of a denatured nucleic acid to reanneal when complementary strands are present in an environment near but below their melting temperature. The higher the degree of homology between the probe and the hybridizable sequence such as SEQ. ID No: 3 or 4, the higher the relative temperature which can be used. As a result, it follows that higher relative temperatures would tend to make the reaction conditions more stringent, while lower temperatures less so. Moreover, stringency is also inversely proportional to salt concentrations. "Stringent conditions" are exemplified by reaction conditions characterized by: (1) low ionic strength and high temperature for washing, for example 0.015 M sodium Chloride/0.0015 M sodium citrate/0.1 % sodium dodecyl sulfate at 50°C; (2) the use of a denaturing agent, such as formamide, for example, 50% (vol/vol) formamide with 0.1% bovine serum albumin/0.1 % Ficoll/0.1% polyvinylpyrrolidone/50 mM sodium phosphate buffer at pH 6.5 with 750 mM sodium chloride, 75 mM sodium citrate at 42°C. Alternatively, stringent conditions can be: 50% formamide, 5x SSC (0.75 M NaCl, 0.075 M sodium citrate), 50 mM sodium phosphate (pH 6.8), 0.1% sodium pyrophosphate, 5x Denhardt's solution, sonicated salmon sperm DNA (50 µg/ml), 0.1% SDS, and 10% dextran sulfate at 42°C, with washes at 42°C in 0.2x SSC (sodium chloride/sodium citrate) and 50% formamide at 55°C, followed by a high-stringency wash consisting of 0.1x SSC containing EDTA at 55°C. For additional details and explanation of stringency of hybridization reactions, see Ausubel et al., Protocols in Molecular Biology (1995).
- Recombinant Manufacture of FGF-23 C-terminal polypeptides. The nucleic acids described herein such as SEQ. ID No: 3 or 4 may be used in recombinant DNA molecules to direct the expression of the corresponding polypeptides in appropriate host cells. Because of the degeneracy in the genetic code, other DNA sequences may encode the equivalent amino acid sequence, and maybe used to clone and express FGF-23 or fragments thereof. Codons preferred by a particular host cell may be selected and substitued into the naturally occuring nucleotide sequences, to increase the rate and/or efficiency of expression. The nucleic acid (e.g., cDNA or genomic DNA) encoding the desired FGF-23 or FGF-23 fragments such as FGF23CTP may be inserted into a replicable vector for cloning (amplification of the DNA), and/or for expression.
- Expression Systems. The polypeptide can be expressed recombinantly in any of a number of expression systems according to methods known in the art (Ausubel, et al., editors, Current Protocols in Molecular Biology, John Wiley Sons, New York, 1990). Such expression systems include chromosomal, episomal and virus-derived systems, e.g., vectors derived from bacterial plasmids, from bacteriophage, from transposons, from yeast episomes, from insertion elements, from yeast chromosomal elements, from viruses such as baculoviruses, papova viruses, such as SV40, vaccinia viruses, adenoviruses, fowl pox viruses, pseudorabies viruses and retroviruses, and vectors derived from combinations thereof, such as those derived from plasmid and bacteriophage genetic elements, such as cosmids and phagemids.
- The expression systems may contain control regions that regulate as well as engender expression. Generally, any system or vector which is able to maintain, propagate or express a nucleic acid to produce a polypeptide in a host may be used. The appropriate nucleotide sequence may be inserted into an expression system by any of a variety of well-known and routine techniques, such as, for example, those set forth in Sambrook et al., Molecular Cloning: A Laboratory Manual, 2nd Ed., Cold Spring Harbor Laboratory Press, Cold Spring Harbor, N.Y. (1989). In general, DNA is inserted into an appropriate restriction endonuclease site using techniques known in the art.
- Vector components generally include, but are not limited to, one or more of an origin of replication, one or more marker genes, an enhancer element, a promoter, a signal or secretion sequence, and a transcription termination sequence:
- The expression vector may have two replication systems, thus allowing it to be maintained in two organisms, for example in mammalian or insect cells for expression and in a prokaryotic host for cloning and amplification. Such sequences are well known for a variety of bacteria, yeast strains, and viruses.
- Preferably, the expression vector contains a marker gene to allow the selection of transformed host cells. Selection genes are well known in the art and will vary with the host cell used_Expression and cloning vectors will typically contain a selection gene, also termed a selectable marker. Typical selection genes encode proteins that (a) confer resistance to antibiotics or other toxins, e.g., ampicillin, neomycin, methotrexate, or tetracycline, (b) complement auxotrophic deficiencies, or (c) supply critical nutrients e.g., the D-alanine racemase gene.
- Promoter sequences encode either constitutive or inducible promoters. The promoters may be either naturally occurring promoters or hybrid promoters. Hybrid promoters, which combine elements of more than one promoter, are also known in the art, and are useful in the present invention. Further, for integrating expression vectors, the expression vector contains at least one sequence homologous to the host cell genome, and preferably, two homologous sequences which flank the expression construct. The integrating vector may be directed to a specific locus in the host cell by insertion of the appropriate homologous sequence in the vector. Constructs for integrating vectors are well known in the art.
- An appropriate secretion signal may be incorporated into the desired polypeptide to allow secretion of the polypeptide into the lumen of the endoplasmic reticulum, the periplasmic space or the extracellular environment. These signals may be endogenous to the polypeptide or they may be heterologous signals. The signal sequence may be a prokaryotic signal sequence selected, for example, from the group of the alkaline phosphatase, penicillinase, lpp, or heat-stable enterotoxin II leaders. For yeast secretion the signal sequence may be, e.g., the yeast invertase leader, the alpha factor leader (including Saccharomyces and Kluyveromyces α-factor leaders). In mammalian cell expression systems, mammalian signal sequences from secreted polypeptides of the same or related species, as well as viral secretory leaders may be used to direct secretion of FGF-23 or fragments thereof such as FGF23CTP.
- Appropriate host cells include yeast, bacteria, archebacteria, fungi, and insect and animal cells, including mammalian cells, for example primary cells, including but not limited to stem cells. Representative examples of appropriate hosts include bacterial cells, such as E. coli. Streptococci, Staphylococci, Streptomyces, and Bacillus subtilis, fungal cells, such as Saccharomyces cerevisiae, other yeast cells orAspergillus; insect cells such as Drosophila S2 and Spodoptera Sf9 cells; animal cells such as CHO, COS, HeLa, C127, 3T3, BHK, HEK 293 and Bowes melanoma cells, and plant cells.
- A host cell strain may be chosen for its ability to modulate the expression of the inserted sequences or to process the expressed polypeptide in the desired fashion. Such modifications of the polypeptide include, but are not limited to, acetylation, carboxylation, glycosylation, phosphorylation, lipidation and acylation. Post-translational processing, which cleaves a "prepro" form of the polypeptide, may also be important for correct insertion, folding and/or function.
- FGF-23 or fragments thereof such as FGF23CTP may be produced by culturing a host cell transformed with an expression vector containing a nucleic acid encoding an FGF-23 or fragments thereof under the appropriate conditions to induce or cause expression of the protein or polypeptide. In a preferred embodiment of the invention a host cell is provided which is stably or transiently transfected with a nucleic acid of SEQ. ID No: 3 or 4 or transfected with a nucleic acid which hybridizes under stringent conditions to SEQ. ID No: 3 or 4. According to another embodiment of the invention said host cell is cultured to allow expression of FGF-23 or of an FGF-23 fragment, and the polypeptide is isolated from the cell culture.
- Transformed host cells include, but are not limited to, microorganisms such as bacteria transformed with recombinant bacteriophage, plasmid or cosmic DNA expression vectors, yeast transformed with yeast expression vectors, and insect cells infected with a recombinant insect virus (such as baculovirus), and mammalian expression systems.
- The appropriate conditions for expression of FGF-23 or fragments thereof such as FGF23CTP will vary with the choice of the expression vector and the host cell, and will be easily ascertained by one skilled in the art through routine experimentation. For example, the use of constitutive promoters in the expression vector will require optimizing the growth and proliferation of the host cell, while the use of an inducible promoter requires the appropriate growth conditions for induction. In addition, in some embodiments, the timing of the harvest is important. For example, the baculoviral systems used together with insect cells are lytic viruses, and thus harvest time selection can be crucial for product yield,
- The desired FGF-23 or FGF-23 fragment may be produced recombinantly not only directly, but also as a fusion polypeptide with a heterologous polypeptide. Such heterologous polypeptide is generally placed at the amino- or carboxyl-terminus of FGF-23 or of an FGF-23 fragment and may provide for an epitope tag to which an anti-tag antibody can selectively bind. Accordingly, such epitope tag enables FGF-23 or a fragment thereof to be readily purified by using an anti-tag antibody or another type of affinity matrix that binds to the epitope tag. Examples of epitope tags are 6xHis or c-myc tag. Alternatively FGF-23 or a fragment thereof may be expressed in the form of e.g. an GST-fusion protein. Appropriate constructs are generally known in the art and are available from commercial suppliers such as Invitrogen (San Diego, Calif.), Stratagene (La Jolla, Calif.), Gibco BRL (Rockville, Md.) or Clontech (Palo Alto, Calif.).
- Evaluation of Gene Expression. Gene expression may be evaluated in a sample directly, for example, by standard techniques known to those of skill in the art, e.g., Southern blotting for DNA detection, Northern blotting to determine the transcription of mRNA, dot blotting (DNA or RNA), or in situ hybridization, using an appropriately labeled probe, based on the sequences provided herein. Alternatively, antibodies may be used in assays for detection of nucleic acids, such as specific duplexes, including DNA duplexes, RNA duplexes, and DNA-RNA hybrid duplexes or DNA-protein duplexes. Such antibodies may be labeled and the assay carried out where the duplex is bound to a surface, so that upon the formation of duplex on the surface, the presence of antibody bound to the duplex can be detected. Gene expression, alternatively, may be measured by immunohistochemical staining of cells or tissue sections and assay of cell culture or body fluids, to directly evaluate the expression of FGF-23 or of an FGF-23 fragment. Antibodies useful for such immunological assays may be either monoclonal or polyclonal, and may be prepared against a native sequence FGF-23 or FGF-23 fragments based on the DNA sequences provided herein.
- Purification of Expressed Protein. Expressed FGF-23 or an FGF-23 fragment such as FGF23CTP may be purified or isolated after expression, using any of a variety of methods known to those skilled in the art. The appropriate technique will vary depending upon the way of expression of FGF-23 or an FGF-23 fragment. The polypeptide may for example be recovered from culture medium in the form of a secreted potein or from host cell lysates. Cells can be disrupted by various physical or chemical means, such as freeze thaw cycling, sonication, mechanical disruption, or by use of cell lysing agents, whereas membrane-bound polypeptides may be released from the membrane using a suitable detergent solution (e.g. Triton-X100) or by enzymatic cleavage. The appropriate technique for polypeptide purification or isolation will also vary depending upon what other components are present in the sample. The degree of purification necessary will also vary depending on the use of FGF-23 or a fragment thereof. Contaminant components that are removed by isolation or purification are materials that would typically interfere with diagnostic or therapeutic uses for the polypeptide, and may include enzymes, hormones, and other solutes. The purification step(s) selected will depend, for example, on the nature of the production process used and the particular FGF-23 or FGF-23 fragment produced.
- Ordinarily, isolated FGF-23 or a fragment thereof will be prepared by at least one purification step. Well-known methods for purification include ammonium sulfate or ethanol precipitation, acid extraction, anion or cation exchange chromatography, phosphocellulose chromatography, hydrophobic interaction chromatography, high performance liquid chromatography, hydroxylapatite chromatography and lectin chromatography. Most preferably, affinity chromatography is employed for purification. For example, the FGF-23 or a fragment thereof such as FGF23CTP may be purified using a standard anti-FGF-23 C-terminal polypeptide antibody column. Ultrafiltration and dialysis techniques, in conjunction with protein concentration, are also useful (see, for example, Scopes, R., Protein Purification, Springer-Verlag, New York, N.Y., 1982). Well-known techniques for refolding proteins may be employed to regenerate active conformation when the polypeptide is denatured during isolation and or purification
- Labeling of Expressed Polypeptide. The nucleic acids, proteins and antibodies of the invention may be labeled. By labeled herein is meant that a compound has at least one element, isotope or chemical compound attached to enable the detection of the compound. In general, labels fall into three classes: a) isotopic labels, which may be radioactive or heavy isotopes; b) immune labels, which may be antibodies or antigens; and c) colored or fluorescent dyes. The labels may be incorporated into the compound at any position that does not interfere with the biological activity or characteristic of the compound which is being detected.
- Chemical Manufacture of FGF-23 and FGF-23 fragments. Polypeptides or fragments thereof may be produced not only by recombinant methods, but also by using chemical methods well known in the art. Solid phase peptide synthesis may be carried out in a batchwise or continuous flow process which sequentially adds alpha-amino and side chain-protected amino acid residues to an insoluble polymeric support via a linker group. A linker group such as methylamine-derivatized polyethylene glycol is attached to poly(styrene-co-divinylbenzene) to form the support resin. The amino acid residues are Nalpha-protected by acid labile Boc (t-butyloxycarbonyl) or base-labile Fmoc (9-fluorenylmethoxycarbonyl). The carboxyl group of the protected amino acid is coupled to the amine of the linker group to anchor the residue to the solid phase support resin. Trifluoroacetic acid or piperidine are used to remove the protecting group in the case of Boc or Fmoc, respectively. Each additional amino acid is added to the anchored residue using a coupling agent or pre-activated amino acid derivative, and the resin is washed. The full length peptide is synthesized by sequential deprotection, coupling of derivatized amino acids, and washing with dichloromethane and/or N, N-dimethylformamide. The peptide is cleaved between the peptide carboxy terminus and the linker group to yield a peptide acid or amide. (Novabiochem 1997/98 Catalog and Peptide Synthesis Handbook, San Diego Calif. pp. S1-S20). Automated synthesis may also be carried out on machines such as the ABI 431 A peptide synthesizer (Applied Biosystems). A polypeptide or a fragment thereof may be purified by preparative high performance liquid chromatography and its composition confirmed by amino acid analysis or by sequencing (Creighton T.E. (1984) Proteins, Structures and Molecular Properties, W H Freeman, New York N.Y.).
- Variants. Variants of the natural polypeptide may be desirable in a variety of circumstances. For example, undesirable side effects might be reduced by certain variants, particularly if the side effect activity is associated with a different part of the polypeptide from that of the desired activity. In some expression systems, the native polypeptide may be susceptible to degradation by proteases. In such cases, selected substitutions and/or deletions of amino acids which change the susceptible sequences can significantly enhance yields. Variants may also increase yields in purification procedures and/or increase shelf lives of proteins by eliminating amino acids susceptible to oxidation, acylation, alkylation, or other chemical modifications. Preferably, such variants include alterations that are conformationally neutral, i.e. they are designed to produce minimal changes in the tertiary structure of the variant polypeptides as compared to the native polypeptide, and (ii) antigenically neutral i.e. they are designed to produce minimal changes in the antigenic determinants of the variant polypeptides as compared to the native polypeptide.
- Manufacture of a medicamen for use in the treatment of a disease. The aforementioned polypeptides may according to the invention be used for the manufacture of a medicament for use in the treatment of a disease associated with deregulated angiogenesis or a cell proliferative disorder.
- The term "treatment" refers to both therapeutic treatment and prophylactic or preventative measures. Those in need of treatment include those already with the disorder as well as those in which the disorder is to be prevented.
- A "disorder" or a "disease" is any condition that would benefit from treatment with FGF-23 or a fragment of FGF-23 as defined above and further below. This includes both chronic and acute disorders, as well as those pathological conditions which predispose to the disorder or disease in question. Non-limiting examples of disorders or diseases to be treated herein include any condition which results from deregulated angiogenesis or from deregulated cell proliferation. Examples of diseases associated with deregulated angiogenesis include: ocular neovascularisation, such as retinopathies (including diabetic retinopathy), age-related macular degeneration, psoriasis, haemangioblastoma, haemangioma, arteriosclerosis, inflammatory diseases, such as rheumatoid or rheumatic inflammatory diseases, especially arthritis, such as rheumatoid arthritis, or other chronic inflammatory disorders, such as chronic asthma, arterial or post-transplantational atherosclerosis, endometriosis, and especially neoplastic diseases, for example so-called solid tumors and liquid tumors (such as leukemias).
- A preferred example of a diseases associated with deregulated angiogenesis is selected from the group of retinopathies, age-related macular degeneration, haemangioblastoma, haemangioma, and tumors. A particularly preferred example of a diseases associated with deregulated angiogenesis is retinopathy.
- Examples of cell proliferative disorders include: chronic or acute renal diseases, e.g. diabetic nephropathy, malignant nephrosclerosis, thrombic microangiopathy syndromes or transplant rejection, or especially inflammatory renal disease, such as glomemloncephritis, especially mesangioproliferative glomerulonephritis, haemolyticuraemic syndrome, diabetic nephropathy, hypertensive nephrosclerosis, atheroma, arterial restinosis, actinic keratosis, arteriosclerosis, atherosclerosis, bursitis, hepatitis, mixed connective tissue disease (MCTD), myelofibrosis, paroxysmal nocturnal hemoglobinuria, polycythemia vera, psoriasis, primary thrombocythemia, and autoimmune diseases, acute inflammation, fibric disorders (e.g. hepatic cirrhosis), diabetes, endometriosis, chronic asthma, neurodegenerative disorders and especially neoplastic diseases such as adenocarcinoma, gliomas, leukemia, lymphoma, melanoma, myeloma, sarcoma, Kaposi's sarcoma, teratocarcinoma, and, in particular, cancers of the adrenal gland, bladder, bone, bone marrow, brain, breast, cervix, colon, gall bladder, ganglia, gastrointestinal tract, heart, kidney, liver, lung (especially small-cell lung cancer), muscle, ovary, pancreas, parathyroid, penis, prostate, salivary glands, skin, spleen, testis, thymus, thyroid, and uterus.
- A preferred example of a cell proliferative disorder is selected from the group of chronic or acute renal diseases, arteriosclerosis, atherosclerosis, psoriasis, endometriosis, diabetes, chronic asthma and cancer. A particularly preferred example of a cell proliferative disorder is cancer.
- Another aspect of the invention relates to a method for the treatment of a disease associated with deregulated angiogenesis which comprises administering an effective amount of a polypeptide to a mammal including a human suffering from the disease, wherein the polypeptide is selected from the groups consisting of (a) FGF-23 (SEQ. ID No: 1) or a fragment of FGF-23; (b) a bioactive polypeptide having a percentage of identity of at least 50% with the amino acid sequence of any one of the polypeptides of (a); or (c) a bioactive variant of any one of the polypeptides of (a) or (b). Accordingly, a polypeptide as described above may be administered.
- Another aspect of the invention relates to a method for the treatment of a cell proliferative disorder comprising administering an effective amount of FGF-23 or an FGF-23 fragment such as FGF23CTP as described above to a mammal including a human suffering from the disorder.
- "Mammal" for purposes of treatment refers to any animal classified as a mammal, including humans, domestic and from animals, and zoo, sports, or pet animals, such as dogs, horses, cats, sheep, pigs, cattle, etc. Preferably, the mammal is human.
- Pharmaceutical composition. Another aspect of the invention provides a pharmaceutical composition for use in a disease associated with deregulated angiogenesis or a proliferative disorder comprising FGF-23 or a fragment thereof according to the invention as described above and a pharmaceutically-acceptable carrier. The composition of the invention is administered in effective amounts.
- The pharmaceutical composition may be used in the foregoing methods of treatment. Such compositions are preferably sterile and contain an effective amount of FGF-23 or an FGF-23 fragment such as FGF23CTP or a nucleic acid encoding the polypeptide for inducing the desired response in a unit of weight or volume suitable for administration to a patient.
- An "effective amount" of FGF-23 or fragment thereof, compound, or pharmaceutical composition is an amount sufficient to effect beneficial or desired results including clinical results such as inhibiting premature or diabetic retinopathy, inhibiting angiogenesis, shrinking the size of the tumor, retardation of cancerous cell growth, decreasing one or more symptoms resulting from the disease or disorder, increasing the quality of life of those suffering from the disease or disorder, decreasing the dose of other medications required to treat the disease or disorder, enhancing effect of another medication, delaying the progression of the disease or disorder, and/or prolonging survival of patients, either directly or indirectly.
- Such amounts will also depend on the particular condition being treated, the severity of the condition, the individual patient parameters including age, physical condition, size and weight, the duration of the treatment, the nature of concurrent therapy (if any), the specific route of administration and like factors within the knowledge and expertise of the health practitioner. These factors are well known to those of ordinary skill in the art and can be addressed with no more than routine experimentation.
- An effective amount can be administered in one or more administrations and may or may not be achieved in conjunction with another drug, compound, or pharmaceutical composition. Thus, an "effective amount" may be considered in the context of administering one or more therapeutic agents, and a single agent may be considered to be given in an effective amount if, in conjunction with one or more other agents, a desirable result may be or is achieved.
- An effective amount of FGF-23 or an FGF-23 fragment or the pharmaceutical composition comprising the polypeptide of the invention, alone or in conjunction with another drug, compound, or pharmaceutical composition can be administered by any conventional route, including injection or by gradual infusion over time. The administration may, for example, be oral, intravenous, intraperitoneal, intramuscular, intracavity, subcutaneous, topical or transdermal.
- When administered, the pharmaceutical composition of the present invention is administered in pharmaceutically acceptable preparations. The term "pharmaceutically-acceptable carrier" as used herein means one or more compatible solid or liquid fillers, diluents or encapsulating substances which are suitable for administration into mammals including humans. The term "carrier" denotes an organic or inorganic ingredient, natural or synthetic, with which the active ingredient is combined to facilitate the application.
- The term "pharmaceutically acceptable" means a non-toxic material that does not interfere with the effectiveness of the biological activity of the active ingredients. Such preparations may routinely contain pharmaceutically acceptable concentrations of salts, buffering agents, preservatives, compatible carriers, supplementary immune potentiating agents such as adjuvants and cytokines and optionally other therapeutic agents, such as chemotherapeutic agents.
- When used in medicine, the salts should be pharmaceutically acceptable, but non-pharmaceutically acceptable salts may conveniently be used to prepare pharmaceutically-acceptable salts thereof and are not excluded from the scope of the invention.
- The pharmaceutical compositions may contain suitable buffering agents, including: acetic acid in a salt; citric acid in a salt; boric acid in a salt; and phosphoric acid in a salt.
- The pharmaceutical compositions also may contain, optionally, suitable preservatives, such as: benzalkonium chloride; chlorobutanol; parabens and thimerosal.
- The doses of polypeptide or nucleic acid encoding said polypeptide administered to a subject can be chosen in accordance with different parameters, in particular in accordance with the mode of administration used and the state of the subject Other factors include the desired period of treatment. In the event that a response subject is insufficient at the initial doses applied, higher doses (or effectively higher doses by a different, more localized delivery route) may be employed to the extent that patient tolerance permits.
- The pharmaceutical compositions may conveniently be presented in unit dosage form and may be prepared by any of the methods well-known in the art of pharmacy. All methods include the step of bringing the active agent into association with a carrier which constitutes one or more accessory ingredients. In general, the compositions are prepared by uniformly and intimately bringing the active compound into association with a liquid carrier, a finely divided solid carrier, or both, and then, if necessary, shaping the product.
- Compositions suitable for oral administration may be presented as discrete units, such as capsules, tablets, lozenges, each containing a predetermined amount of the active compound. Other compositions include suspensions in aqueous liquids or non-aqueous liquids such as a syrup, elixir or an emulsion.
- Compositions suitable for parenteral administration conveniently comprise a sterile aqueous or non-aqueous preparation of a polypeptide or nucleic acid encoding the polypeptide, which is preferably isotonic with the blood of the recipient. This preparation may be formulated according to known methods using suitable dispersing or wetting agents and suspending agents. The sterile injectable preparation also may be a sterile injectable solution or suspension in a non-toxic parenterally-acceptable diluent or solvent, for example, as a solution in 1,3-butane diol. Among the acceptable vehicles and solvents that may be employed are water, Ringer's solution, and isotonic sodium chloride solution. In addition, sterile, fixed oils are conventionally employed as a solvent or suspending medium. For this purpose any bland fixed oil may be employed including synthetic mono- or diglycerides. In addition, fatty acids such as oleic acid may be used in the preparation of injectables.
- Carrier formulation suitable for oral, subcutaneous, intravenous, intramuscular, etc. administrations can be found in Remington's Pharmaceutical Sciences, Mack Publishing Co., Easton, PA.
- The following EXAMPLES are presented in order to more fully illustrate the preferred embodiments of the invention. These EXAMPLES should in no way be construed as limiting the scope of the invention, as defined by the appended claims.
- In this EXAMPLE, 100 unknown chemically synthesized peptides are functionalized using the discovery method of the invention. Most of these peptides are present in human plasma.
- As a control, twenty reference drugs are concurrently investigated with the discovery method of the invention. For this screening, one control and four treated groups of six males are treated for two weeks by daily administration by the subcutaneous route of the proteins. The reference drugs can be active for treating conditions in the areas of glaucoma, neuroprotection, neovascularisation, antiangiogenesis, acne, asthma and allergy, cardiovascular diseases, neurological disorder, pain, diabetes, hypercholesterolemia, osteoporosis and oncology.
- The expectations from those selected active peptides are that (a) several potential therapeutic drugs could be identified; (b) target peptides for therapeutic antibodies could be identified; (c) new targets for research, deduced from the reconstructed biochemical pathways, could be identified; and (d) biomarkers, to be used to develop diagnostic tests could be identified. Bioinformatic investigations of gene expression in mice suggest therapeutic indications and insight through the analysis of molecular pathways and functions, which allow prioritizing for the verification of selected proteins/peptides in monkeys. The protein/peptide selection rate is approximately 20%. The selection/prioritization criteria are the type of activity, the therapeutic interest and the suspected toxicity.
- In an initial analysis, following administration of a peptide (FGF23CTP, see below, EXAMPLE III) to mice, transcript level changes were observed in several organs which indicate that the compound is active and impacts on pathways involved in cell differentiation.
- Introduction and summary. Five peptides with unidentified function were tested in mice to obtain biochemical and pharmacogenomic data that would allow a specification of their activity. Outbred CD-1 mice were treated with peptides GPA018, GPA019, GPA020, GPA022, and GPA023 for seven days, observed for clinical signs of treatment effects (mortality, clinical signs, body weight, food consumption, haematology, clinical biochemistry) and, after sacrifice, a selected set of tissues were used for gene expression profiling. A snap freezing sampling of the tissues was performed at necropsy at the end of the treatment period. These tissues were used for mRNA expression profiling and for histopathological analysis (formalin fixation). In addition, parameters investigated in a standard exploratory study were recorded. None of the peptides had any influence on clinical or pharmacogenomic parameters. Gene expression profiling revealed no significant changes between control and treated animals. It was concluded that the peptides were inactive and decided that no further investigations on these peptides would follow.
- Treatment. Peptides GPA018, GPA019, GPA020, GPA022, and GPA023 (GeneProt, Geneva, Switzerland; see,
FIG. 1 ) were administered subcutaneously to CD-1 mice for seven days at a dose of 300 mcg/day. The choice of CD-1 mice (an outbred strain from Charles River Laboratories, l'Arberesle, France) was made to increase the mouse organ weight and, hence, yield of RNA for microarray analysis. Four animals per treatment arm and gender were used. At the beginning of the treatment period, the animals were 12 to 14 weeks old. Body weight averaged 42.2g (38 to 45.6 g). Animals were kept under standard conditions for animal welfare. - Dosage forms were prepared once before the beginning of the treatment period. Each test item was dissolved in the vehicle (PBS) in order to achieve the required concentration. The dosage forms obtained were divided into aliquots and stored at -20°C pending use. Two aliquots were prepared for each group and day. The aliquots for treatment were delivered twice on each day of treatment to the animal room.
TABLE 1 Animal Allocation and Test Item Dosages Treatment Number of animals Dose-level (µg/kg/day) Concentration (µg/mL) Control 4 male and 4 female 0 0 GPA018 4 male and 4 female 150 x 2 15 GPA019 4 male and 4 female 150 x 2 15 GPA020 4 male and 4 female 150 x 2 15 GPA022 4 male and 4 female 150 x 2 15 GPA023 4 male and 4 female 150 x 2 15 - In vivo examinations. Animals were examined at least twice daily for mortality, food consumption and clinical observations. Body weight was recorded once per week.
- Blood samples were collected from each animal. The serum samples were deep frozen (approximately -80°C) until analyses for hormone determination.
- For tissue sampling, animals were asphyxiated by carbon dioxide approximately 12 to 16 hours after the last injection. A gross macroscopic post-mortem examination was performed in order to specify the possible reduced size of main organs (with particular attention to lymphoid tissues). No treatment-related morphological changes were noticed.
- Snap freezing of many organs was performed at necropsy at the end of the treatment period. Within 15 to 20 after the sacrifice, all sampling for snap freezing was performed.
- Twenty-eight tissues were sampled, including brain, duodenum (caecum), liver, kidney, muscle and spleen (blood). For this EXAMPLE, male and female animals were used in the kidney and in the liver assays. All other tissue samples were derived from males only.
- Samples for histopathology were fixed in phosphate-buffered 10% formalin. Bone demineralization was performed with 10% formic acid.
- Samples for gene expression profiling were quick-frozen in liquid nitrogen immediately after excision, stored on dry ice and subsequently in a deep-freezer at approximately -80°C until further use.
- RNA extraction and purification. Briefly, total RNA was obtained by acid guanidinium thiocyanate phenol chloroform extraction (Trizol®, Invitrogen Life Technologies, Carlsbad, Calif. USA) from each frozen tissue section and the total RNA was then purified on an affinity resin (Rneasy®, Qiagen) according to the manufacturer's instructions, and quantified. Total RNA was quantified by the absorbance at λ = 260 nm (A260nm) and the purity was estimated by the ratio A260nm/A280nm. Integrity of the RNA molecules was confirmed by non-denaturing agarose gel electrophoresis. RNA was stored at approximately -80°C until analysis. One part of each individual RNA sample was kept for the analysis of critical genes by means of Real-Time PCR.
- GeneChip® assays. All GeneChip® assays were conducted as recommended by the manufacturer of the GeneChip system (Affymetrix, Expression Analysis Technical Manual, (Affymetrix, Santa Clara, Calif. USA, 2003). Genome MG-U74Av2 expression probe array set (Affymetrix, Inc., San Diego, Calif. USA) were used.
- Double stranded cDNA was synthesized with a starting amount of approximately 5 µg full-length total RNA using the Superscript Choice System (Invitrogen Life Technologies) in the presence of a T7-(dT)24 DNA oligonucleotide primer. Following synthesis, the cDNA was purified by phenovchloroformlisoamylalcohol extraction and ethanol precipitation. The purified cDNA was then transcribed in vitro using the BioArray® High Yield RNA Transcript Labeling Kit (ENZO, Farmingdale, New York, USA) in the presence of biotinylated ribonucleotides form biotin labelled cRNA. The labelled cRNA was then purified on an affinity resin (Rneasy®, Qiagen), quantified and fragmented. An amount of approximately 10 µg labelled cRNA was hybridized for approximately 16 hours at 45°C to an expression probe array. The array was then washed and stained twice with streptavidin-phycoerythrin (Molecular Probes, Eugene, Oregon, USA) using the GeneChip® Fluidics Workstation 400 (Affymetrix).
- The array was then scanned twice using a confocal laser scanner (GeneArray® Scanner, Agilent, Palo Alto, Calif. USA) resulting in one scanned image. This resulting ".dat-file" was processed using the MAS4 program (Affymetrix) into a "cel-life". The ".cel file" was captured and loaded into the Affymetrix GeneChip Laboratory Information Management System (LIMS). The LIMS database is connected to a UNIX Sun Solaris server through a network filing system that allows for the average intensities for all probes cells (CEL file) to be downloaded into an Oracle database. Raw data was converted to expression levels using a "target intensity" of 150. The data were checked for quality and loaded into the GeneSpring® software 5.0.3 (Silicon Genetics, Redwood City, Calif. USA) for analysis.
- As a quality control, hybridizations were performed using GAPDH or β-action probes.
- Data analysis. RNA samples were studied by using the human Affymetrix MG-U74Av2 GeneChip®. On such chip platform, probe-sets for individual genes contain 20 oligonucleotide pairs, each composed of a "perfect match" 25-mer and a "mismatch" 25-mer differing from the "perfect" match oligonucleotide at a single base. After probe labelling, hybridization, and laser scanning, the expression level is estimated by averaging the differences in signal intensity measured by oligonucleotide pairs of a given probe (AvgDiff value). The image acquisition and numerical translation software used for this study was the Affymetrix Microarray Suite version 4 (MAS5). The numerical values were stored and transferred for the analysis into the Silicon Genetics GeneSpring® 5.0.3 software toolkit.
- Various filtering and clustering tools in these programs were used to explore the datasets and identify transcript level changes that inform on altered cellular and tissue functions and that can be used to establish working hypotheses on the modes of action of the compound. All datasets were normalized to the median. To identify pleiotropic or unique effects, scripts provided by Silicon Genetics, were applied. Pleiotropic effects were also investigated manually by analyzing genes with an expression level of more than 60 in at least three of eight conditions (i.e. organs) and hereafter applying statistical analysis (parametric, assume variances not equal, p<0.1) to identify genes with significant changes in their expression between control and treated animals.
- To identify significant changes in gene expression in individual organs, an expression restriction filter was applied (ADV >60 in 50% of the samples), and a statistical filter as described above was added.
- In some instances, a fold change filter (provided by Silicon Genetics) was used after the expression restriction to find genes with a change in gene expression above a certain level, and then a statistical filter applied.
- The decision to considers a specific gene relevant is based on a conjunction of numerical changes identified by exploratory filtering and statistical algorithms as described above and the relationship to other modulated genes that point to a common biological theme. The weight of that relationship is assessed by the analyst through a review of the relevant scientific literature.
- Gene expression profiling. Despite a multitude of statistical approaches, no significant changes in the gene expression patterns of the treatment groups were observed. In every analysis the number of changed genes was always smaller than the number of genes that would have been found by chance. The range of fold change was usually very small, seldom exceeding 2-fold.
- Interestingly, the strongest changes were gender-specific. Comparison of control males and control females, as well as treated males versus treated females, showed about 3 times as many genes changed than did control males or females versus treated males or females. In addition, the genelists of treatment specific effects in females and males showed little overlap.
- In the GPA018 treated kidneys of males and females combined (eight samples per group), some possible influence on genes affected by or affecting TGFβ signalling were observed (TABLE 2A and TABLE2B). GPA018 shows some sequence similarity to the N-terminal region of mLTBP-2 (murine latent transforming growth factor binding protein-2). LTBP proteins aid the LAP (latency associated protein)-TGFβ complex to become secreted and binds it to the ECM (extracellular matrix)-structural protein fibrillin (Annes JP et al., J. Cell Sci. 116(Pt2):217-24 (2003); Chen S et al., Nucl. Acids Res. 31(4):1302-10 (2003); Vehivilainen P et al., J. Biol. Chem. 278(27):24705-13 (2003)). However, the extent of the changes after treatment was very small, usually below 1.5-fold, and similar patterns were not observed when female or male groups were investigated separately.
TABLE 2A GPA018 in Kidney Expressed Gene Comments and Literature all-spectrin Cleaved during TGF induced apoptosis (Brown TL et al., J. Biol. Chem. 274(33):23256-23262 (1999)) β-spectrin Disruption of β-spectrin ELF leads to disruption of TGFβ signalling in mice (Tang Y et al., Science 299(5606):574-7 (2003)) β5-Integrin TGFβ induces integrin (Ludbrook SB et al., Biochem. J. 369(Pt2):311-8 (2003)) Integrin α(v)β3 Gene is a receptor for the LAP of TGFβ 1 and 3 (Ludbrook SB et al., Biochem. J. 369(Pt2):311-8 (2003))TGFβ type I-receptor (ALK-5) Overexpression downregulates integrin β5 and LTBP1 expression (Ota T et al., J. Cell Physiol. 193(3):299-318 (2002)) LEF TGFβ induces expression of LEF1 target genes; crosstalk between wnt and TGFβ pathway (Hu MC et al., Development 130(12):2753-2766 (2002); Letamendia A et al., J. Bone Joint Surg. Am. 83-A Suppl 1(Pt1):S31-9 (2001)) Fas Death Domain-Associated Protein (DAXX) TGFβ-induced apoptosis is mediated by DAXX that facilitates JNK activation (Perlman R et al., Nature Cell Biology 3(8):708-14 (2001)) Forkheadbox D2 Identification of FOXC 1 as a TGFβ1 responsive gene and its involvement in negative regulation of cell growth (Zhou Y et al., Genomics 80(5):465-72 (2002))Biglycan Smad4-dependent regulation of biglycan gene expression by TGFbeta in pancreatic tumour cells (Chen WB et al., J. Biol. Chem. 277(39):36118-28 (2002)) Amyloid β precursor protein TGFβ1 potentates amyloid-β generation in astrocytes and in transgenic mice; induces overexpression of APP (Lesne S et al., J. Biol. Chem. 278(20):18408-18 (2003)) Transgelin (SM22α) TGFβ type I-receptor (ALK-5) overexpression leads to upregulation of SM22α (Chen S et al., Nucl. Acids Res. 31(4):1302-10 (2003); Ota T et al., J. Cell Physiol. 193(3):299-318 (2002)) Vitamin D receptor Vitamin D3 induces expression of TGFβ2; Smad3 binds and activates VDR (Yang L et al., J. Cell Physiol. 188(3):383-93 (2001); Aschenbrenner JK et al., T. Surg. Res. 100(2):171-5 (2001)) Ephrin B2 Ephrin A1 expression is decreased by ALK-5 overexpression (Ota T et al., J. Cell Physiol. 193(3):299-318 (2002)) Description p-value FC Treatment: GPA018 Treatment: control Probe set ID vitamin D receptor 0.019 2.30 226.194 (128.4 to 298.52) 120.65 (32.02 to 278.91) 99965_at bone morphogenic protein receptor, type II 0.036 2.00 87.798 (42.42 to 168.21) 47.956 (14.39 to 106.76) 99865 at cadherin 5 0.005 -1.32 78.321 (59.21 to 109.76) 102.412 (86.02 to 120.66) 104083_at lymphoid enhancer binding factor 1 0.010 1.56 145.94 (108.53 to 171.06) 97.804 (57.08 to 155.06) 103628_at catenin src 0.049 1.30 124.611 (109.53 to 147.6) 98.962 (48.99 to 128.24) 98151_s_at calcium/calmodulin-dependentserine protein kinase 0.049 -1.31 88.542 (50.23 to 119.39) 113.935 (90.22 to 167.09) 102248_f_at MAP kinase-interacting serine/threonine kinase 2 0.048 1.29 205.875 (181.61 to 249.07) 164.699 (99.8 to 208.85) 92473_at mitogen-activated protein kinase 12 0.039 -1.19 72.744 (52.6 to 87.22) 86.312 (69.76 to 108.47) 92323_at mesoderm development candiate 2 0.041 1.22 238.53 (178.42 to 283.5) 196.015 (143.39 to 269.01) 95405_at forkhead box D2 0.037 1.20 118.66 (96.56 to 152.03) 98.895 (75.88 to 129.5) 94621_at Fas death domain-associated protein 0.050 -1.21 77.96 (56.46 to 100.72) 94.31 (73.12 to 115.51) 96125_at ephrin β2 0.021 -1.28 75.761 (54.43 to 102.77) 95.971 (69.63 to 113.05) 160857_at tyroslne kinase receptor 1 0.009 -1.32 74.769 (58.19 to 98.31) 99.618 (74.5 to 131.81) 161184_at biglycan 0.015 -1.36 152.224 (112.82 to 207.61) 208-264 (155.91 to 280.86) 162346f_at Tnf receptor-associated factor 5 0.008 -1.39 93.96 (68.53 to 144.09) 129.381 (94.61 to 154.04) 103255_at 0.005 1.13 5345.84 (4783.18 to 6115) 4793,84 (4472.95 to 4995.46) 93063_at actin, beta, cytoplasmic 0.002 1.57 861.716 (470.94 to 1102.93) 539.534 (368 to 641.11) 95705s_at integrin beta 5 0.023 -1.14 192.941 (167.13 to 215.24) 219.201 (191.49 to 252.53) 161786_f_at integrin beta 5 0.048 -1.20 348.915 (309.8 to 427.48) 422.901 (311.02 to 527.04) 100601_a_t procollagen, type IV, alpha 4 0.045 1.42 149.262 (124.51 to 175.51) 111.732 (54.42 to 160.81) 101774_at spectrin beta 2 0.004 1.12 829.471 (759.59 to 928.53) 741.779 (642.34 to 791.98) 93571_at talin 0.032 1.12 542.186 (490.64 to 593.16) 486.978 (420.91 to 561.39) 99448_at myosin VIIa 0.042 -1.13 132.021 (116 to 166.57) 148.674 (126.49 to 166.78) 94713_at transgelin 0.045 -1.26 158.629 (138.26 to 177.61) 205.163 (132.68 to 308.45) 93541_at - Introduction and summary. The aim of this EXAMPLE was to identify for the peptide FGF23CTP modes of action with possible therapeutic applications by multi-organ microarray profiling in monkey. The peptide FGF23CTP (GPA006, GeneProt, Geneva, Switzerland) is derived from a unique COOH-terminal domain of the FGF-23. It is a unique 75-mer COOH-terminal peptide of FGF-23 with no homology to regions of other FGF family members. See, PCT patent application
WO 02/088,358 - FGF23CTP is given two weeks subcutaneously to cynomolgus monkeys and is found to affect critical pathways of cell differentiation in a multi-organ gene expression profiling analysis with high density human microarray assays. Comparison of the expression changes in sixteen different organs indicated common transcript level changes for genes involved in cell to cell signalling of growth and lineage determination, in cell cycling and in amino acid and ion transport. Although the FGF23CTP domain is unique and not found in other FGF family members, transcript levels for components of the FGF signalling pathway are affected in several organs. Serum protein levels of circulating IGF2-binding protein are.decreased in the treated animals.
- Genes involved in angiogenesis/vasculogenesis are found in to be impacted in several organs. The effect of FGF23CTP on angiogenesis is confirmed in a hypoxic vascular retinopathy mouse model (see EXAMPLE VIII).
- Methods. FGF23CTP is administered subcutaneously to cynomolgus monkeys for two weeks at a dose of 100 µg/day. At the end of the treatment period samples from all organs are subjected to snap freezing at necropsy and are analyzed with GeneChip® expression profiling.
- Total RNA is extracted from these frozen tissues using TRIzol® reagent (Life Technologies) according to the manufacturer's instructions. Total RNA is quantified by the absorbance at λ = 260 nm (A260nm) and the purity is estimated by the ratio A260nm/A280nm. Integrity is checked by denaturing gel electrophoresis. RNA is stored at -80°C until analysis.
- Good quality total RNA is used to synthesize double-stranded cDNA using the Superscript® Choice System (Technologies, Gaithersburg, Maryland USA). The cDNA is then in vitro transcribed (MEGAscript™ T7 Kit, Ambion) to form biotin labelled cRNA. Next, 12 to 15 µg of labelled cRNA is hybridized to the Affymetrix
Human U95A Version 2 expression probe arrays for 16 hours at 45°C. Arrays are then washed according to the EukGE-WS2 protocol (Affymetrix), and stained with 10 µg/ml of streptavidin-phycoerythrin conjugate (Molecular Probes). The signal is antibody-amplified with 2 mg/ml acetylated BSA (Life Technologies, Gaithersburg, Maryland USA), 100 mM MES, 1 M [Na+], 0.05% Tween 20, 0.005 % Antiofoam (Sigma), 0.1 mg/ml goat IgG and 0.5 mg/ml biotinylated antibody and re-stained with the streptavidin solution. After washing, the arrays are scanned twice with the Gene Array® scanner (Affymetrix). - The expression level is estimated by averaging the differences in signal intensity measured by oligonucleotide pairs of a given probe (AvgDiff value). The image acquisition and numerical translation software used was the Affymetrix Microaray Suite version 4 (MAS4).
- To identify genes that are impacted by treatment, the dataset is initially filtered to exclude in a first wave of analysis genes whose values are systematically in the lower expression ranges where the experimental noise is high (at least an AvgDiff value of 80 in a number of assays corresponding to the smallest number of replicas of any assay point). In a second round of selection a threshold t-test p-value (0.05) identifies genes with different values between treated and non-treated based on a two component error model (Global Error Model) and, where possible, with a stepdown correction for multi-hypothesis testing (Benjamini and Hochberg false discovery rate).
- The selected genelists are then compared with established genelists for pathways and cellular components using Fisher's exact test. Venn diagrams are used to identify the gene changes that are in common between the different organs. Expression profiles of highly relevant genes are used to find genes with correlated changes at individual assay points, using several distance metrics (standard, Pearson).
- The decision to consider a specific gene relevant is based on a conjunction of numerical changes identified by exploratory filtering and statistical algorithms as described above and the relationship to other modulated genes that point to a common biological theme.
- A filter is applied on the FGF23CTP rostral hypothalamus expression raw data from a raw value of at least 80.0 in at least four out of eight conditions.
- A selection is made on treatment conditions for FGF23CTP rostral hypothalamus based on statistically significant differences with a p-value cutoff 0.05 and a multiple testing correction based on the Benjamini and Hochberg False Discovery Rate. This restriction tested 5134 genes. About 5.0% of the identified genes would be expected to pass the restriction by chance.
- Results. At the RNA level, it is clear that the compound affects key genes controlling cellular differentiation and proliferation, especially growth factors and growth factor receptors. Genes critically involved in angiogenesis are found in several organs. There is also a multi-organ effect on transcripts for components of the retinoblastoma cycling control checkpoint. The rostral hypothalamus shows the most pronounced changes especially for transport proteins and cytoarchitecture.
- A cross comparison of organs analysed reveals that FGF23CTP affects the same or closely related pathways and provokes similar cellular effects. No routine clinical or biochemical changes are observed in the treated animals. Surprisingly, no effect on phosphate metabolism is observed.
- TABLES 3 to 6 show that at the RNA level FGF23CTP affects key genes controlling cellular differentiation and proliferation, especially growth factors and growth factor receptors (TABLE 3). Genes critically involved in angiogenesis are found to be altered in several organs upon treatment with FGF23CTP (TABLE 4). There is also a multi-organ effect on transcripts for components of the retinoblastoma cycling control checkpoint (TABLE 5). The rostral hypothalamus shows the most pronounced changes especially on transcripts corresponding to proteins involved in transport and cytoarchitecture (TABLE 6).
- In particular, FGF23CTP affects several molecules that have been described to play a role in the pathogenesis of malignant proliferation of glial cells and precursors: Epidermal growth factor (EGF) (Hoi Sang U et al., J. Neurosurg. 82: 841-846 (1995); Wu CJ et al., Oncogene 19: 3999-4010 (2000)), Bax (Streffer JR et al., J. Neurooncol. 56: 43-49 (2002); Martin S et al., J. Neurooncol. 52: 129-139 (2001)), connexin 43 (Huang R et al., Cancer Res. 62: 2806-2812 (2002); Soroceanu L et al., Glia 33: 107-117 (2001)), PKR (Shir A & Levitzki A, Nature Biotechnology 20: 895-900 (2002)), neurofibromin (NF1) (Cichowski K & Jacks T, Cell 104: 593-604 (2001); Gutmann, DH et al., Hum. Mol. Genet. 10:3009-3016 (2001)).
- Growth factors and growth factor receptors. Several families of growth factors and related growth factor receptors including fibroblast growth factor (FGF)-receptors and other important extracellular signalling molecules for cell differentiation and maintenance, like members of the bone morphogenetic proteins (BMP), transforming growth factor (TGF), insulin-like growth factor (IGF), tumour necrosis factor (TNF) families are found to be impacted in more than one organ by treatment with FGF23CTP (TABLE 3).
TABLE 3 Genes for Growth Factors and Receptors Treatment group of 2 males and 2 females Control FGF23CTP Gene name Organ Gene expression level after 2 weeks (mean and range) Activin A receptor type II ROHY 24.8 (20 to 32.6) 54.9 (37.2 to 78.7) Adrenal 20.6 (7.8 to 34.1) 58.5 (34.3 to 72.8) Retina 57.4 (48.2 to 70.6) 34.1 (27.7 to 38) Bone morphogenetic protein 10Kidney
Liver74.6 (68.9 to 79.7)
96.4 (92.3 to 103.3)138.6 (114.9 to 172.3)
134.1 (108.8 to 152.6)Bone morphogenetic protein 1 Adrenal 131.1 (81.5 to 150.6) 210.6 (147.5 to 361.8) Growth differentiation factor 1 ROHY 866 (753.5 to 911.2) 1,410.2 (1,333.2 to 1,542.9) Bone morphogenetic protein 2A Duodenum 121.3 (100.4 to 146.9) 55.3 (37.9 to 80.1) Bone morphogenetic protein Adrenal 64.6 (57.9 to 69.8) 101.25 (71.2 to 156.5) receptor, type II Colony-stimulating factor-1 ROHY 535.7 (470 to 598.2) 802.5 (667.6 to 884.5) Kidney 424.3 (316.1 to 576.8) 659.75 (574.5 to 870.1) B marrow 1,269.2 (934.5 to 1,493.8) 981.3 (782.2 to 1,091.5) Epidermal growth factor receptor ROHY 156.5 (138.4 to 167) 103.1 (88.4 to 112.1) EGF-response factor 1 AV node 1,141.3 (1,044.4 to 1,317.9) 1,819.7(1,641.5 to 2,170.2) EPHB2v protein-tyrosine kinase ROHY 173.5 (119.8 to 204.5) 119.1 (113.2 to 121.8) Liver 52.85 (35.2 to 64.7) 82.6 (61.6 to 95.6) FGF receptor-1 ROHY 669.9 (637 to 699.9) 932.4 (782.6 to 1,125.6) Thymus 224.5 (209.1 to 248.5) 153.2 (133.2 to 169.6) Adrenal 521.3(482.8 to 599) 624.2 (559.4 to 721.9) Farnesol receptor HRR-1 Liver 267.7 (259.6 to 276.4) 383.3 (342.5 to 460.8) Duodenum 28.3 (21.3 to 36.4) 53.1 (44.6 to 67.1) Insulin-like growth factor AV node 1,371.2 (1,134 to 1,523.8) 880.75 (707.4 to 1,226.9) binding protein 2 Liver 5'840.5 (4'269.2 to 6'849.6) 3,858.6 (3,160.1 to 5'301.8) Retina 1,396.8 (723.4 to 2,068.7) 807.9 (506.4 to 1,143.3) Insulin-like growth factor I Muscle 157.4 (115.9 to 179.9) 107.65 (83.5 to 140.1) Liver 649.675 (429.7 to 879.7) 1,055.4 (838.1 to 1,331.6) Insulin-like growth factor Liver 3,238.1 (2,346.3 to 3,807.7) 1,517 (105.7 to 2,449.4) binding protein 1 Insulin-like growth factor II AV node 401.275 (359.7 to 462.2) 565275 (524.7 to 619.9) Liver 426.5 (401.1 to 482.9) 606.9 (554 to 687.6) B Marrow 295.4 (251.2 to 339.8) 209.5 (183.5 to 236.8) Neuregulin 1 Kidney 66.3 (42.7 to 105.8) 150.725 (119.4 to 193.9) Hippocampus 125.4 (105.1 to 133.3) 86.075 (70.7 to 97.8) Retinoid X receptor-beta ROHY 136.7 (120.7 to 154.4) 106.925 (84.4 to 139.5) Retinoid X receptor-gamma Muscle 253.925 (193.1 to 285.1) 580.9 (391.3 to 704-5) Transforming growth factor β2 Muscle 20.85 (20 to 23.4) 58.3 (39.3 to 66.9) Transforming growth factor β 3 ROHY 37.9 (20 to 65.6) 88.4 (77 to 104.1) Tumine necrosis factor receptor-2 ROHY 70.3 (43.2 to 92.2) 126.4 (117.8 to 136.4) TNFR-related death receptor-6 Re atrium 100.6 (93.7 to 109.3) 144.65 (123.9 to 175.5) ROHY 155.1 (128.2 to 181.7) 98.8 (69.1 to 137.3) TNFR-related death receptor-3 Muscle 119.5 (92.9 to 133.6) 82.4 (43.2 to 104.5) ROHY: rostral hypothalamus; B Marrow: bone marrow; AV node: heart atrioventricular (AV) node - Angiogenesis/vasculogenesis. Transcript level changes for genes specifically involved in angiogenesis/vasculogenesis are found in several organs of animals treated with FGF23CTP (TABLE 4).
TABLE 4 Genes for Angiogenesis Treatment group of 2 males and 2 females Control FGF23CTP Gene name Organ Gene expression level after 2 weeks(mean and range) Vascular endothelial growth ROHY 491 (431.1 to 570.1) 326.175 (309.6 to 366.3) factor-A (VEGFA) AV node 170.3 (106.6 to 234.9) 363.7 (302.7 to 506.7) VEGFB ROHY 484 (421.6 to 535.3) 626.2 (527.4 to 776.7) Placental growth factor Muscle 45.6 (20 to 78.4) 91.4 (60.8 to 112.6) FLT receptor tyrosine kinase 1 Duodenum 30.1 (20 to 60.5) 70.7 (52.3 to 80.6) AV node 56.5 (22.7 to 76.1) 120.1 (77 to 156.4) FLK1 receptor tyrosine kinase Adrenal 57.1 (49 to 62.5) 42.7 (32.1 to 51) Endothelial differentiation Muscle 258.6 (215.2 to 328) 181.9 (167.9 to 199.7) receptor 6 AV node 161.1 (111.6 to 188) 306.9 (251.2 to 365.4) Endothelial differentiation Bone Marrow 261.3 (214.2 to 356.9) 494.8 (355.9 to 700.9) receptor 4 Liver 279 (227.2 to 361) 391.7 (347.7 to 453) Brain-specific angiogenesis Retina 27.1 (20 to 38.2) 153.2 (82.2 to 201) inhibitor 2 Brain-specific angiogenesis ROHY 97.8 (82.8 to 118.8) 225.1 (169.2 to 283.8) inhibitor 1 (MASS) VE-cadherin Adrenal 63.8 (46.7 to 86.3) 110.2 (108 to 113.8) Angiopoietin-1 Bone Marrow 198.6 (175.4 to 221.8) 123.2 (106.3 to 151.1) ROHY 235.7 (204.7 to 306.9) 162.5 (154.4 to 179.6) TEK tyrosine kinase, Bone Marrow 91.8 (67.1 to 106.3) 52.7 (33.3 to 63.7) angiopoietin receptor ROHY: rostral hypothalamus; AV node: heart atrioventricular (AV) node. - Cycling: Retinoblastoma checkpoint. Transcript levels of genes involved in cell cycle control, especially those genes involved in the transition from the G1 to S-phase, are affected in several organs by treatment with FGF23CTP (TABLE 5). In particular, expression of those genes upstream or downstream of the retinoblastoma gene product (Rb) phosphorylation step, a major downstream control step for growth factor-induced proliferation, is altered. FGF23CTP also affects transcript levels for cyclin-dependent kinase 4 and cyclins D2, D3 and E2 involved in Rb phosphorylation. A second control level is also mobilized with cyclin kinase inhibitors like p19INK4D, p21CIP1 and p27Kip1. Also affected is the inhibitor of p53 and Rb, Mdm2. The targets of the retinoblastoma protein are also involved: E2F1, E2F2, E2F5 and their binding partner Dp-2.
TABLE 5 Cell Cycling Treatment group of 2 males and 2 females Control FGF23CTP Gene name Organ Gene expression level after 2 weeks (mean and range) Cyclin-dependent kinase 4 ROHY 266 (240.1 to 283.7) 197.6 (167.6 to 231.7) Cdk-inhibitor p57KIP2 (KIP2) Duodenum
Thymus233.7 (212.1 to 251.9)
312.7 (292 to 341.1)138.6 (114.9 to 172.3)
247.9 (227.3 to 284.2)Cyclin A/CDK2-associated p19 ROHY 1349.8 (1,306.6 to 1,420.1) 1069.6 (902.3 to 1,278) (Skp1) Cyclin D2 Retina 210.2 (172.2 to 233.2) 132 (96.2 to 171.5) ROHY 231.8 (201.1 to 248.6) 197.1 (182.7 to 203.9) Cyclin D3 Muscle 182.4 (157.2 to 198.2) 149.2 (135 to 162) Cyclin-dependent kinase 5 Hippocampus 213.9 (172.3 to 254.7) 118.7 (96.6 to 162.3) Cyclin E2 Bone Marrow 407 (367.4 to 491.4) 257 (175.2 to 294.8) Cyclin I Duodenum 1109.9 (1035.5 to 1157.2) 900.6 (758.7 to 1054.7) E2F-1 Kidney 94 (51.9 to 150.9) 198.5 (135.8 to 263) E2F-4 Muscle 888 (765.7 to 981.2) 643.8 (471.5 to 765.7) Hippocampus 208.7 (185.7 to 221.5) 153.4 (116.7 to 228.6) ROHY 812 (748.4 to 859.5) 245.9 (63.2 to 581.9) Kidney 505.6 (432.1 to 574.8) 741.6 (652.5 to 802.8) E2F-5 Adrenal 53.9 (49.2 to 57.6) 39.6 (33.5 to 45) E2F dimerization partner 2 (DP2) Bone Marrow 2091 (1617.9 to 2735.1) 1222 (1021.1 to 1387.7) Mdm2 Bone Marrow 40.925 (33.4 to 44.3) 20 Cdk-inhibitor p 19 ROHY 163.6 (148.6 to 194.9) 267.8 (243.2 to 314.2) Cdk-inhibitor 1A p21 (Cip1) Adrenal 106.9 (85 to 125.1) 51.75 (20 to 96.8) p53 binding protein Muscle 269.35 (173 to 374.7) 138.7 (97.7 to 172) ROHY 217.5 (210.1 to 226.3) 154.7 (143.7 to 159.9) Retinoblastoma 1 ROHY 255.9 (248.3 to 266.1) 467.9 (361.1 to 570) Retinoblastoma binding protein 4 ROHY 361.1 (283.4 to 398.7) 164 (131.5 to 225.4) S-phase response ROHY 231.5 (199.8 to 270.3) 176 (159.8 to 205.6) (cyclin-related) Re atrium 126.75 (100.7 to 146.9) 159.1 (153.4 to 168.9) RalGDS/AF-6 ROHY 414.9 (390.1 to 439.7) 300.5 (284 to 313.9) (inhibitor of Cyclin D1) 438.1 (392.6 to 520.8) 354.5 (335.8 to 369.9) ROHY: rostral hypothalamus - Rostral hypothalamus. The rostral hypothalamus is the organ with the most pronounced changes in transcript levels in animals treated with FGF23CTP. TABLE6 reflects genes of defined pathways and cellular actions with the most significant changes in this organ. In particular, effects on cytoarchitecture genes are especially pronounced in brain tissues.
TABLE 6 Rostral Hypothalamus Genes Treatment group of 2 males and 2 females Control FGF23CTP Gene name Gene expression level after 2 weeks (mean and range) Receptors Retinoic acid receptor 31.2 (26.8 to 41) 110 (100.9 to 122.8) Cholecystokinin A receptor 87.1 (66.6 to 119.4) 196 (172.3 to 218.3) Jagged 1 417.2 (402.1 to 437.7) 70.3 (20 to 161.9) Protein kinases c-ab1 214.4 (187.3 to 252.5) 119.4 (103.4 to 127) c-yes 116.65 (107.9 to 127.8) 64.7 (50.8 to 77.4) c-raf 404.7 (370.8 to 458.7) 327.5 (281.6 to 356.9) Pim1 487.7 (432.9 to 557.6) 327.5 (281.6 to 356.9) FYN 1,086.1 (1,018.4 to 1,172.4) 958.1 (891.3 to 1,007.6) PKR Interferon-inducible 179.475 (162 to 192.7) 128.25 (112.1 to 140.9) TYRO3 90.45 (78.7 to 106.8) 163.1 (134.7 to 179.5) Axl 122.8 (112.4 to 140) 60.3 (34.7 to 89.4) TrkB 108.6 (87.5 to 127.9) 40.8 (23.6 to 59.4) Erk3 588.5 (551.5 to 679.4) 409.5 (370.5 to 482.7) Phosphoinositide 3-kinase 90.3 (78.2 to 111.9) 241.5 (215.7 to 289.2) Glycogen synthase kinase 3 70.4 (66.3 to 75.3) 155.5 (127.9 to 180.1) JNK2 137.225 (122.2 to 159.8) 79.9 (64 to 95.2) Ribosomal protein kinase B (RSK-B) 49.8 (35.4 to 74.5) 120 (90.4 to 141.8) Janus kinase 1 106.7 (88.9 to 136.3) 43.3 (20 to 64.7) SFRS protein kinase 2 396.1 (369.5 to 420.3) 205.8 (180.3 to 249.6) Mnb (Minibrain) 567.4 (561.4 to 571.6) 446 (410.2 to 477.2) Other signalling molecules Phosphoinositide-3-kinase, catalytic, 90.3 (78.2 to 111.9) 241.5 (215.7 to 289.2) delta polypeptide RAS p21 protein activator 243.9 (211.5 to 270) 163 (139.4 to 198.5) STAT1 182 (171.2 to 188.5) 119.3 (110.6 to 134.5) Calcineurin A1 410.5 (367.6 to 486.4) 173.975 (114.5 to 239.7) 14-3-3 protein tau 2,110 (1,964.8 to 2,211.2) 1,748.5 (1,649.5 to 1,852) Neurofibromin 78.6 (74.5 to 88.1) 144 (126.4 to 155.8) Phosphodiesterase 4B 123 (110.1 to 133.3) 60.6 (46.7 to 72.3) Phospholipase C 125.9 (107.4 to 136.2) 72.1 (56.8 to 81) Transcription factors Hypoxia-inducible factor 1 alpha 611.5 (515.7 to 745.1) 286.5 (223 to 339.5).1) CREB binding protein 165.4 (160 to 176.9) 93 (82.4 to 100) Jun D 4'882.5 (4'592.6 to 5'361.6) 6'499.1 (6'353.9 to 6'745.1) Inhibitor of DNA binding 4 140.3 (113.3 to 157.9) 67.6 (55.9 to 72.7) Bmi-1 homeobox gene repressor 553.7 (513.6 to 599.8) 374.7 (352.6 to 410.4) Solute transport Ca2+-ATPase 325.1 (274.6 to 401) 174.4 (130.8 to 247.5) Sodium/hydrogen exchanger 1,062.4 (1,039.5 to 1,095.9) 785.5 (743.4 to 851.2) Anion exchanger 627.1 (555.6 to 676.3) 844.5 (760.8 to 916.2) Na,K-ATPase 2,032.2 (1,743.5 to 2,239.6) 1,453.2 (1,246.3 to 1,736.8) CMP-sialic acid transporter 265.8 (241 to 329.6) 135.075 (112.8 to 159.1) Vesicle transport RAB1 293.5 (246.9 to 320.3) 143.9 (93.8 to 214.9) RAB5 1,266.2 (1,146.6 to 1,349) 809.8 (745.3 to 894) RAB11A 554.8 (544.8 to 565.4) 344.9 (284.1 to 395.4) RAB11B 182.3 (153.2 to 207.4) 71.2 (41.8 to 110.9) RNP24 867.4 (809.5 to 903.7) 558.2 (486.3 to 642.9) SNARE 140 (127.2 to 158.5) 55.4 (41.2 to 69.7) GDP dissociation inhibitor beta 166.6 (156.5 to 173.4) 125.8 (104.1 to 142.6) NIPSNAP2 (glioblastoma co-amplified) 212.9 (188.1 to 226.2) 118.7 to (88.9 172) Apoptosis Bcl-2-binding protein Nip3 1,099 (1,056.1 to 1,135.1) 794.8 (709.9 to 841.2) BAX 30.95 (20 to 57.2) 134.4 (75.2 to 171) Cytoarchitecture Tropomyosin 2 (beta) 20 131.6 (112.4 to 150.2) Myosin regulatory light chain 328.5 (298.3 to 374) 177.2 (153.5 to 214) Tropomyosin 4 72 (54.7 to 86.6) 140.6 (126.5 to 166.8) Pinin, 181.7 (164 to 203.2) 119.7 (108 to 131.5) Desmosome associated protein Connexin 43 410.4 (321.4 to 446.4) 184.5 (132.2 to 265.8) Delta 2 catenin 239.6 (178.9 to 281.2) 118 (103.9 to 146.9) Reticulon 4 2,343,7 (2,019.1 to 2,516.7) 1,309.2 (1,126.2 to 1,645.4) Neural cell adhesion molecule 1 428 (297.1 to 524.2) 988.6 (841.6 to 1,196) Amyloid beta precursor protein 400 (351.1 to 435) 191.3 (161.2 to 218.8) (cytoplasmic tail)-binding protein 2 Myelinization Oligodendrocyte myelin glycoprotein OMGP 1,144 (1,037.9 to 1,260.2) 773.5 (619.7 to 986) oligodendrocyte glycoprotein Myelin NPD 176.8 (139.9 to 209.4) 62.7 (25.9 to 80.7) Sphingomyelinase 585.5 (544.2 to 637.7) 259.5 (229.5 to 281.4) - As can be seen in the TABLE 7 (genelists per organ), there are genes representing these pathways with less pronounced changes in other organs. Effects on genes coding for transport molecules and intracellular signalling molecules are found in most organs. The effects on cytoarchitecture genes are especially pronounced in brain tissues. Shown in TABLE 7 are the Affymetrix chip probeset ID, p-value, and gene description of the 602 selected genes.
TABLE 7 Gene Expression Changes at 4 Weeks in the Rostral Hypothalamus 1 37316_r_at 0.001189 3' Source: oy31e07.x1 Soares_parathyroid_tumour_NbHPA Homo sapiens cDNA clone IMAGE:1667460 similar to WP:F48E8.2 CE01954; mRNA sequence. 2 32841_at 0.001189 Source: Human nucleic acid binding protein gene, complete cds. 3 32290_at 0.005998 Source: Homo sapiens mRNA; cDNA DKFZp564L1916 (from clone DKFZp564L1916). 4 38035_at 0.005998 hMTMR6 5 38568_at 0.005998 Source: Homo sapiens p53 binding protein mRNA, complete cds. 6 33683_at 0.005998 Source: Human mRNA for TI-227H. 7 37995_s_at 0.005998 Source: Human Fragile X mental retardation 1 FMR-1 gene, 3' end, clones BC72 and BC22.8 821_s_at 0.005998 Source: Human folate receptor alpha (hFR) mRNA, partial cds. 9 41562_at 0.005998 putative 10 AFFX- 0.005998 Source: Homo sapiens transcription factor ISGF-3 mRNA, complete cds. HUMISGF3 A/M97935_3_at 11 1132_s_at 0.005998 Source: Homo sapiens retinoic acid receptor (gamma-7) mRNA. 12 38363_at 0.005998 Source: zd27g05.s1 Soares_fetal_heart_NbHH19W Homo sapiens cDNA clone IMAGE:341912 3' similar to PIR:S47066 S47066 zinc finger protein - human ;, mRNA sequence. 13 32037_r_at 0.005998 Source: Homo sapiens ribonuclease P protein subunit p14 (Rpp14) mRNA, complete cds. 14 31879_at 0.005998 Source: Human FUSE binding protein 3 (FBP3) mRNA, partial cds. 15 38102_at 0.005998 Source: 51f12 Human retina cDNA randomly primed sublibrary Homo sapiens cDNA, mRNA sequence. 16 193_at 0.005998 Source: Human transcriptional activation factor TAF1132 mRNA, complete cds. 17 40246_at 0.005998 sequences encoding: d1g homology repeats (DHR): DHR1 855..1118, DHR2 1143..1403, DHR3 1563..1826; SH3 domain 1935..2132; guanylate kinase-related domain 2331..2858 18 40453_s_at 0.005998 member of the family of SR protein pre-mRNA splicing factors 19 35247_at 0.005998 Source: PT2,1_13_A09.r tumour2 Homo sapiens cDNA 3', mRNA sequence. 20 39280_at 0.005998 polyleucine rich 21 36971_at 0.005998 Similar to a C. elegans protein encoded in cosmid C27F2 (U40419) 22 39628_at 0.005998 Source: wb33e07.x1 NCl_CGAP_GC6 Homo sapiens cDNA clone IMAGE:2307492 3' similar to SW:RAB9_HUMAN P51151 RAS-RELATED PROTEIN RAB-9. ;, mRNA sequence. 23 41437_at 0.005998 Source: Homo sapiens mRNA; cDNA DKFZp564F1123 (from clone DKFZp564F1123); partial cds. 24 39167_r_at 0.005998 Source: Human mRNA for collagen binding protein 2, complete cds.25 40467_at 0.005998 cytochrome b small subumit of complex II (succinate-ubiquinone oxidoneductase) 26 33831_at 0.005998 transcriptional adaptor 27 38694_at 0.005998 Source: Homo sapiens mRNA for KIAA0738 protein, complete cds. 28 34644_at 0.005998 Source: Homo sapiens mRNA for beta 2-microglobulin, complete cds. 29 34763_at 0.005998 SMC family 30 40128_at 0.005998 similar to hypothetical protein L8167.6 of Saccharomyces cerevisiae. 31 33109_f_at 0.00617 putative 32 36972_at 0.007286 microsomal fraction 33 36576_at 0.007579 Source: Homo sapiens histors macroH2A1.2 mRNA, complete cds. 34 36868_at 0.007579 Source: Homo sapiens clone 23741 mRNA sequence. 35 33359_at 0.007579 Source: Homo sapiens mRNA for K1AA0768 protein, partial cds. 36 35094_f_at 0.007579 Source: Homo sapiens leukocyte immumoglobulin-like receptor-4 (LIR-4) mRNA, complete cds. 37 40354_at 0.007579 member of 110-kDa heat shock protein (hsp110) family 38 38318_at 0.00765 Source: Homo sapiens mRNA; cDNA DKFZp586G051 (from clone DKFZp586G051). 39 36864_at 0.007879 Source: Homo sapiens mRNA for Pex3 protein. 4032171_at 0.008176 HUMAN EUKARYOTIC TRANSLATION INITIATION FACTOR 5 41 34393_r_at 0.008176 Rab1, splice variant 42 1117_at 0.008176 Source: Homo sapiens cytidine deaminase (CDA) mRNA, complete cds. 43 1191_s_at 0.008176 Source: Homo sapiens mRNA for 26S proteasome subunit p44.5, complete cds. 44 33705_at 0.008176 putative 45 37409_at 0.008458 similar to human serine kinase SRPK1, encoded by GenBank Accession Number U09564; specific for serine/arginine-rich splicing factors 46 949_s_at 0.008458 proteasome (prosome, macropain) 26S subunit, ATPase, 6 47 35642_at 0.008458 mitochondrial outer membrane protein; binds to metaxin 1, a related protein that participates in protein import into mitochondria 48 35784_at 0.008458 SNARE protein 49 34383_at 0.008458 Source: Homo sapiens hUBP mRNA for ubiquitin specific protease, complete cds. 50 36691_at 0.008458 Source: H. sapiens mRNA for glutamine transaminase K. 51 36542_at 0.008458 Source: Homo sapiens sodium-hydrogen exchanger 6 (NHE-6) mRNA, nuclear gene encoding mitochondrial protein, complete cds. 52 40631_at 0.008458 Source: Human mRNA for Tob, complete cds. 53 40605_at 0.008458 sorting nexin 4 54 37350_at 0.008704 match: proteins Q99795 Q91665 Q91664 009052 P78310 P97792 Q91667 060939 P54900 Q61148 Q62861 000426 P06907 P25189 Q92677 P20938 P27573 P10522 P37301 match: patented sequence I80040 supported by GENSCAN and FGENES 55 38687_at 0.009005 Source: Homo sapiens mRNA; cDNA DKFZp566D193 (from clone DKFZp566D193); partial cds. 56 36546_r_at 0.009584 Start codon is not identified. hg04325 cDNA clone for KIAA0542 has a 933-bp insertion between 3296-3297, and a 187-bp insertion between 3368-3369 of the sequence of KIAA0542 57 39767_at 0.009584 Source: Human mRNA for KIAA0002 gene, complete cds. 58 36110_at 0.009584 Source: Homo sapiens GTP-binding protein (RAB5) mRNA, complete cds. 59 38093_at 0.009584 Source: Human clone 23722 mRNA sequence. 60 37826_at 0.009584 Source: Homo sapiens unknown mRNA, sequence. 61 32232_at 0.009584 Source: Homo sapiens NADH-ubiquinone oxidoreductase subunit CI-SGDH mRNA, complete cds. 62 39544_at 0.009584 Source: Human mRNA for KIAA0353 gene, partial cds. 63 33399_at 0.009602 Source: zl43c04.s1 Soares_pregnant_uterus_NbHPU Homo sapiens cDNA clone IMAGE:504678 3', mRNA sequence. 64 1085_s_at 0.009679 phospholipase C 65 34931_at 0.009679 Source: Homo sapiens mRNA for KIAA0940 protein, complete cds. 66 39099_at 0.009679 COPII component; isoform A 67 AFFX- 0.009806 ***ALU WARNING: Human Alu-Sq subfamily consensus sequence. hum_alu_at 68 35734_at 0.009806 Source: wo97g09.x1 NCl_CGAP_Kid11 Homo sapiens cDNA clone IMAGE:2463328 3', mRNA sequence. 69 995_g_at 0.009839 Source: H. sapiens hR-PTPu gene for protein tyrosine phosphatase. 7038040_at 0.01011 SF 71_37705_at 0.01011 Source: Human (ard-1) mRNA, complete cds. 72 40893_at 0.010187 Source: Homo sapiens ATP-specific succinyl-CoA synthetase beta subumit (SCS) mRNA, partial cds. 73 36980_at 0.010256 Source: Human B4-2 protein mRNA, complete cds. 74 1674_art 0.010419 cellular yes-I protein 75 39989_at 0.010453 Source: H. sapiens mRNA for ragB protein. 76 34905_at 0.010453 Source: oq24f02.s1 NCl_CGAP_GC4 Homo sapiens cDNA clone IMAGE:1587291 3' similar to TR:Q62643 Q62643 GLUTAMATE RECEPTOR KA2 SUBUNIT. [1];, mRNA sequence. 77 31503_at 0.010453 Source: 50h7 Human retina cDNA randomly primed sublibrary Homo sapiens cDNA, mRNA sequence. 78 38808_at 0.010453 Source: Human mRNA for Mr 110,000 antigen, complete cds. 79 39923_at 0.010453 Source: wo84c08.x1 NCI_CGAP_Kid11 Homo sapiens cDNA clone IMAGE:2462030 3', mRNA sequence. 80 32695_at 0.010685 isoform 2 match: protein Q9999181 36224_g_at 0.011036 Source: wf12b02.x1 Soares_NFL_T_GBC_S1 Homo sapiens cDNA clone IMAGE:2350347 3', mRNA sequence. 82 36171_at 0.011036 Source: th60h07.x1 NCl_CGAP_Ov23 Homo sapiens cDNA clone IMAGE:2122717 3' similar to SW:P15_HUMAN P53999 ACTIVATED RNA POLYMERASE II TRANSCRIPTIONAL COACTIVATOR P15 ;, mRNA sequence. 83 39598_at 0.011036 gap junction protein (aa 1-283) 84 33543_s_at 0.011036 desmosome associated protein; phosphoprotein 85 429_f_at 0.011036 Source: Human beta-tubulin gene (5-beta) with ten Alu family members. 86 36326_at 0.011036 Source: Human NSCL-2 gene sequence. 87 35767_at 0.011436 Source: tn20b01.x1 NCI_CGAP_Brn25 Homo sapiens cDNA clone IMAGE:2168137 3' similar to TR:O08765 008765 GEF-2. ;, mRNA sequence. 88 34819_at 0.011497 Source: Human mRNA for MGC-24, complete cds. 89 40861_at 0.011497 Source: Human mRNA for KIAA0026 gene, complete cds. 90 34302_at 0.011497 Source: Human translation initiation factor eIF3 p44 subunit mRNA, complete cds. 91 34677_f_at 0.011497 Source: Homo sapiens mRNA for TL132. 92 32744_at 0.011881 Source: DU3.2-7.G08.r DU-145 Homo sapiens cDNA 5', mRNA sequence. 93 38010_at 0.012279 pro-apoptotic mitochondrial protein 94 41651_at 0.012367 Source: Homo sapiens mRNA for KIAA1033 protein, partial cds. 95 36991_at 0.012367 SR protein family member; SR domain: (bp. 583..1529); RNA binding domains: RNP-2 (bp. 57..80) and RNP-1 (bp. 150..173) 96 33107_at 0.012863 Source: Homo sapiens mRNA for KIAA0898 protein, partial cds. 97 35297_at 0.012932 Transcriptional coactivator P15 like 98 35999_r_at 0.012932 Source: Homo sapiens mRNA for KIAA0781 protein, partial cds. 99 40864_at 0.013006 Source: Homo sapiens mRNA, clone:P02ST9. 100 41178_at 0.013006 Source: H. sapiens mRNA for ribosomal protein L11. 101 1030_s_at 0.013006 found in the camptothecin resistant clone CEM/C2 102 40854_at 0.013006 core protein II precursor 103 39382_at 0.013006 Source: Homo sapiens mRNA for KIAA0517 protein, partial cds. 104 32823_at 0.013006 Source: 51a1 Human retina cDNA randomly primed sublibrary Homo sapiens cDNA, mRNA sequence. 105 39748_at 0.013006 Source: Homo sapiens mRNA; cDNA DKFZp564D016 (from clone DKFZp564D016). 106 35005_at 0.013006 Source: Homo sapiens type 6 nucleoside diphosphate kinase NM23-H6 (NM23-H6) mRNA, complete cds. 107 32781_f_at 0.013006 Source: zk65d06.r1 Soares_pregnant_uterus_NhHPU Homo sapiens cDNA clone IMAGE:487691 5', mRNA sequence. 108 38705_at 0.013006 Source: qo77c11.x1 NCI_CGAP_Kid5 Homo sapiens cDNA clone IMAGE:1914548 3' similar to ENDOTHELIN B RECEPTOR PRECURSOR (HUMAN);, mRNA sequence 109 35838_at 0.013006 gb:S57283 similar to human zinc finger protein encoded by Gen Bank Accession Number M91592 110 185_at 0.013006 paraneoplastic Ri antigen 111 38738_at 0.013006 ubiquitin-like protein 112 36588_at 0.13006 hk05647 cDNA clone for KIAA0810 has a142-bp insertion at position 1029 of the sequence of KIAA0810. 113 36596_r_at 0.013006 This sequence comes from Fig. 4 114 1537_at 0.013006 Source: Human mRNA for precursor of epidermal growth factor receptor. 115 31881_at 0.013154 Source: Homo sapiens mRNA for Hmob33 protein, 3' untranslated region. 116 33440_at 0.013327 Source: Human two-handed zinc finger protein ZEB mRMA, partial cds. 117 37359_at 0.013357 Source: Human mRNA for KIAA0102 gene, complete cds. 118 35681_r_at 0.013357 Source: Homo sapiens mRNA for KIAA0569 protein, complete cds. 119 34381_at 0.013357 Source: as86g01.x1 Barstead colon HPLRB7 Homo sapiens cDNA clone IMAGE:2335632 3' similar to gb:X16S60 CYTOCHROME C OXIDASE POLYPEPTIDE VIIC PRECURSOR (HUMAN);, mRNA sequence. 120 192_at 0.013357 Source: Human TFIID subunit TAFII55 (TAFII55) mRNA, complete cds. 121 41547_at 0.013381 amino terminus similar to protein encoded by GenBank Accession Number AF047473; structurally similar to Homo sapiens Rael protein encoded by GenBank Accession Number U84720; similar to Mus musculus protein encoded by GenBank Accession Number U67327; contains WD40 repeat motif, also termed trp-asp, G-beta repeat; binds C-terminal domain of BUB1 I kinase in vitro 122 31850_at 0.013494 Source: Human gamma-glutamylcysteine synthetase (GCS) mRNA, complete cds. 123 36660_at 0.013702 GTPase 124 40588_r_at 0.013889 Source: Homo sapiens p18 protein mRNA, complete cds. 125 36585_at 0.014379 Source: Human ADP-ribosylation factor 4 (ARF4) mRNA, complete cds. 126 39388_at 0.014587 Source: ok71f11.s1 NCI_CGAP_GC4 Homo sapiens cDNA clone IMAGE:1519437 3', mRNA sequence. 127 38971_r_at 0.014994 HIV-1, Nef-associated factor 1 beta128 32335_r_at 0.015192 Source: Homo sapiens mRNA for polyubiquitin UbC, complete cds. 129 725_i_at 0.015192 130 40122_at 0.015227 NS1- associatedprotein 1131 38908_s_at 0.015746 DNA polymerase zeta unspliced 3' region 132 35709_at 0.015746 Source: Homo sapiens clone 23923 mRNA sequence. 133 31936_s_at 0.015746 Start codon is not identified. hh01734 cDNA clone for KIAA0430 has a 61-bp deletion at the region from 3167 to 3227 of the sequence of KIAA0430 134 40146_at 0.016164 Human mRNA for Rap1B protein 135 34231_at 0.016164 binds the large subunit (ORC I L) of the origin recognition complex (ORC) 136 38375_at 0.016327 Source: Homo sapiens esterase D mRNA, complete cds. 137 35727_at 0.016387 Source: qj64d06.x1 NCI_CGAP_Kid3 Homo sapiens cDNA clone IMAGE:1864235 3' similar to WP:F19B6.1 CE05666 URIDINE KINASE ;, mRNA sequence. 138 34532_at 0.016387 Source: Homo sapiens clone 23705 mRNA sequence. 139 35969_at 0.016529 Source: yx67h12.s1 Soares melanocyte 2NbHM Homo sapiens cDNA clone IMAGE:266855 3', mRNA sequence. 140 41635_at 0.017145 Source: Human mRNA for KIAA0105 gene, complete cds. 141 35221_at 0.017213 Source: H. sapiens mRNA for pur alpha extended 3'untranslated region. 142 33456_at 0.017213 Source: Homo sapiens EB1 mRNA, complete cds. 143 41866_s_at 0.017213 member of the dystrophin gene family 144 39733_at 0.017293 similar to Homo sapiens KIA0025 product encoded by GenBank Accession Number D14695 145 35826_at 0.017369 Source: Homo sapiens transcription factor Tat-CT1 mRNA, complete cds. 14633178_at 0.017509 similar to R. norvegicus Jagged1 protein 147 35329_at 0.017509 similar to Saccharomyces cerevisiae ORF YIL043C/CBR1/CBR5/CBR 148 35271_at 0.017509 one of seven subunits of the Arp2/3 protein complex; actin-related protein 14939722_at 0.011509 Source: Homo sapiens nuclear receptor co-repressor N-Cor mRNA, complete cds. 150 39740_g_at 0.017509 Source: Homo sapiens alpha NAC mRNA, complete cds. 151 38086_at 0.017509 Source: Homo sapiens mRNA for KIAA0466 protein, partial cds. 152 940_g_at 0.017509 neurofibromic 1 (neurofibromatosis, von Recklinghansen disease, Watson disease) 153 37928_at 0.017509 Source: af53a04.s1 Soares_total_fetus_Nh2HF8_9w Homo sapiens cDNA clone IMAGE:1035342 3' similar to gb:X59710 CCAAT-BINDING TRANSCRIPTION FACTOR SUBUNIT A (HUMAN);, mRNA sequence. 154 40852_at 0.017509 similar to Drosophila tudor 155 35786_at 0.017509 Source: Homo sapiens mRNA for KIAA0476 protein, complete cds. 156 1039_s_at 0.017509 basic helix-loop-helix transcription factor 157 37010_at 0.017509 Source: qf76b12.x1 Soares_fetal_lung_NbHL19W Homo sapiens cDNA clone IMAGE:1755935 3' similar to SW:T2AG_HUMAN P52657 TRANSCRIPTION INITIATION FACTOR IIA GAMMA CHAIN ;, mRNA sequence. 158 1772_s_at 0.017509 Source: Human farnesyl-protein transferase alpha-subunit mRNA, complete cds. 159 38485_at 0.017509 Source: nz14h07.s1 NCl_CGAP_GCB1 Homo sapiens cDNA clone IMAGE:1287805 3', mRNA sequence. 160 32752_at 0.017509 Source: zd65e10.s1 Soares_fetal_heart_NbHH19W Homo sapiens cDNA clone IMAGE:345546 3' similar to SW:N4AM_BOVIN Q05752 NADH-UBIQUINONE OXIDOREDUCTASE SUBUNIT B14.5A ;, mRNA sequence. 161 37900_at 0.017509 membrane protein 162 38648_at 0.017682 contains leucine repeat 163 33438_at 0.0178 Source: Homo sapiens mRNA; cDNA DKFZp564D012 (from clone DKFZp564D012). 164 38277_at 0.0178 calcineurin A1 165 39601_at 0.0178 RDA32; similar to norel 166 36641_at 0.0178 similar to chicken alpha2 isoform 167 33873_at 0.017874 Nuclear protein with DNA-binding ability 168 37740_r_at 0.018039 ADP/ATP carrier protein 169 32210_at 0.018039 Source: Human phosphoglucomutase 1 (PGM1) mRNA, complete cds. 170 32998_at 0.019081 Source: Human cholecystokinin A receptor mRNA, complete cds. 171 38470_i_at 0.019104 Source: Human mRNA for KIAA0228 gene, partial cds. 172 36627_at 0.019304 Source: H. sapiens mRNA for hevin like protein. 173 32183_at 0.019304 Gene product is 54 kDa but migrates aberrantly on SDS gels as a 70 kDa protein.; In mammalian cells, the protein colocalizes with many components of the pre-mRNA splicing machinery in the nucleus. 174 32597_at 0.019304 Source: H. sapiens p130 mRNA for 130K protein. 175 33912_at 0.019346 Source: Homo sapiens mRNA for famesylated- proteins converting enzyme 1.176 36112_r_at 0.019346 Source: H. sapiens PR264 gene. 177 40125_at 0.019346 Source: Homo sapiens integral membrane protein, calnexin, (IP90) mRNA, complete cds. 178 1446_at 0.019389 proteasome subunit C3 179 38702_at 0.019389 Source: Homo sapiens clone 24781 mRNA sequence. 180 39762_at 0.019389 Source: Homo sapiens KIAA0425 mRNA, complete cds. 181 36860_at 0.01939 Source: Homo sapiens mRNA for KIAA1064 protein, partial cds. 182 409_at 0.01939 Source: Human mRNA for 14.3.3 protein, a protein kinase regulator. 183 731_f_at 0.019479 184 31526_f_at 0.019479 Source: H. sapiens mRNA for tre oncogene (clone 213). 185 36975 _at 0.019479 Source: 34d2 Human retina cDNA randomly primed sublibrary Homo sapiens cDNA, mRNA sequence. 186 41418_at 0.019479 Source: Homo sapiens mRNA for KIAA0821 protein, complete cds. 187 38542_at 0.019479 Source: Homo sapiens nucleophosmin phosphoprotein (NPM) gene, 3' flanking sequence. 188 37994_at 0.019479 unnamed protein product 189 32574_at 0.019479 Source H. sapiens mRNA for sphingomyelinase. 190 33094_s_at 0.019479 Source:wq32a03x1 NCI_GCAP_GC6 Homo sapiens IMAGE:2472940 3' similar to TR:Q1515 QI3515 BEADED FILAMENT PROTEIN CP49. mRNA sequence. 191 36408_at 0.019479 Source: Homo sapiens ORCTL4 mRNA for organic cation transporter like 4, complete cds. 192 33740_at 0.019673 Source: Homo sapiens clk2 kinase (CLK2), propin1, cote1, glucocerebrosidase (GBA), and metaxin genes, complete cds; metaxin pseudogene and glucocerebrosidase pseudogene; and thrombospondin3 (THBS3) gene, partial cds. 193 40074_at 0.020159 precursor polypeptide (AA -29 to 315) 194 34829_at 0.020183 nucleolar protein; similar to yeast Cbf5p 195 41474_at 0.020183 Source: H. sapiens mRNA for kinesin-2. 196 35355_at 0.020183 Source: Homo sapiens mRNA for KIAA0890 protein, complete cds. 197 39677_at 0.020183 Source: Human mRNA for KIAA0186 gene, complete cds. 198 39346_at 0.020223 Source: Human p62 mRNA, complete cds. 199 1448_at 0.020223 proteasome subunit C8 200 32710_at 0.020223 Source: H. sapiens mRNA for voltage gated potassium channels, beta subunit. 201 887_at 0.020223 ORF 202 33847_s_at 0.020223 Source: qo19f03.x1 NCI_CGAP_Lu5 Homo sapiens cDNA clone IMAGE:1908989 3', mRNA sequence. 203 38431_at 0.020243 Source: Human protein kinase (JNK2) mRNA, complete cds. 204 37785_at 0.020243 Source: U69563 Soares infant brain INIB Homo sapiens cDNA clone 25050, mRNA sequence. 205 39856_at 0.020243 Source: at02f03.x1 Barstead aorta HPLRB6 Homo sapiens cDNA clone IMAGE:2353949 3' similar to gb:M15661 60S RIBOSOMAL PROTEIN LA4 (HUMAN);, mRNA sequence. 206 766_at 0.020243 Source: Homo sapiens mRNA for galectin-9 isoform, complete cds. 207 37569_at 0.020243 Source: Homo sapiens calcium binding protein (ALG-2) mRNA, complete cds. 208 34312_at 0.020243 Source: oy33a12.x1 Soares_parathyroid_tumour_NbHPA Homo sapiens cDNA clone IMAGE:1667614 3',mRNA sequence. 209 40083_at 0.020243 Source: Homo sapiens mRNA for KIAA0625 protein, partial cds. 210 40832_s_at 0.020283 strong similarity to rat lamina associated polypeptide 1C 211 1696_at 0.020317 Source: Human mRNA for DNA polymerase beta, complete cds. 212 39136_at 0.020317 Source: Homo sapiens mRNA for oxidative-stress responsive 1, complete cds. 213 34808_at 0.020317 Source: Homo sapiens mRNA for KIAA0999 protein, partial cds. 214 33433_at 0.020449 Source: Homo sapiens mRNA; cDNA DKFZp564F0522 (from clone DKFZp564F0522). 215 1663_at 0.020494 216 32803_at 0.020494 expression elevated in dividing 786-0 cells compared with confluent 786-0 cells 217 34454_r_at 0.020507 apolipoprotein 218 33247_at 0.020554 human homolog of fission yeast pad1 219 41606_at 0.020554 developmentally regulated 220 34478_at 0.020641 Source: H. sapiens YPT3 mRNA. 221 34306_at 0.020641 Source: Homo sapiens KIAA0428 mRNA, complete cds. 222 36295_at 0.020641 Source: Human zinc finger protein ZNF134 mRNA, complete cds. 223 35656_at 0.020641 Source: Homo sapiens mRNA for RING-H2 protein RNF6, alternative exon 1a. 224 36935_at 0.020832 ras p21 GTP-ase-activating protein (GAP) 225 37620_at 0.020832 TAF1120; contains homology to histone H2B; TFIID subunit 226 1848_at 0.020832 Source: Human ras-related protein (Krev-1) mRNA, complete cds. 227 35818_at 0.021007 Source: Homo sapiens mRNA for cytochrome c, partial cds. 228 39180_at 0.021107 translocated in liposarcoma 229 39792_at 0.021292 hnRNP R 230 34063_at 0.021292 Source: Homo sapiens RecQ5 mRNA for DNA helicase, complete cds. 231 1998_i_at 0.021292 this sequence is a new splice variant called BAX delta in which exon 3 is deleted and exons 2 and 4 are spliced to each other 232 33614_at 0.021292 unnamed protein product 233 36456_at 0.021292 similarity to A. thaliana PRTI 234 36926_at 0.021292 Source: H. sapiens ERK3 mRNA. 235 33849_at 0.021292 Source: Human pre-B cell enhancing factor(PBEF) mRNA, complete cds. 236 32624_at 0.021292 strong similarity to rat tulip 1/2 237 38974_at 0.021292 Source: Homo sapiens RNA-binding protein regulatory subunit mRNA, complete cds. 238 36754_at 0.021292 Source: H. sapiens gene PACAP for pituitary adenylate cyclase activating polypeptide. 239 40637_at 0.021292 Source: Human hsc70 gene for 71 kd heat shock cognate protein. 240 32565_at 0.021292 Unlike BAF60a and BAF60b this gene is highly expressed in muscle cells; similar to human BAF60a, BAF60b, BAF60c and yeast SWP73 and SWP73b 241 36822_at 0.021292 putative RNA binding protein; similar to human FUS/TLS and EWS 242 38099_r_at 0.021356 Source: Homo sapiens acyl-CoA synthetase 4 (ACS4) mRNA, complete cds. 243 31536_at 0.021356 Source: Homo sapiens mRNA for KIAA0886 protein, complete cds. 244 36196_at 0.021356 Source: Human phosphofructokinase (PFKM) mRNA, complete cds. 245 36459_at 0.021356 Source: Homo sapiens mRNA for KIAA0879 protein, complete cds. 246 40423_at 0.021356 Source: Homo sapiens mRNA for KIAA0903 protein, partial cds. 247 32879_at 0.021356 Source: Homo sapiens mRNA; cDNA DKFZp586L111 (from clone DKFZp586L111). 248 39389_at 0.021356 Source: Human CD9 antigen mRNA, complete cds. 249 33368_at 0.021356 Source: H. sapiens mRNA for Lon protease-like protein. 250 41127_at 0.021356 2 potential N-linked glycosylation sites at residues 201 and 206; in-frame stop codon 24 bp upstream of initiator methionine 251 38443_at 0.021356 Source: Human clone 23721 mRNA sequence. 252 297_g_at 0.021356 253 37392_at 0.021356 beta subunit 254 32205_at 0.021356 PKR interacting protein 255 32665_at 0.02145 Source: Homo sapiens mRNA for protein phosphatase 2C (beta). 256 39018_at 0.02145 GSH-transferase; GSH-peroxidase 257 35839_at 0.021826 Source: Homo sapiens mRNA for squalene epoxidase, complete cds. 258 32215_i_at 0.021876 Source: Homo sapiens mRNA for KIAA0878 protein, complete cds. 259 329_s_at 0.022103 260 33027_at 0.022103 Source: 39d11 Human retina cDNA randomly primed sublibrary Homo sapiens cDNA, mRNA sequence. 261 381_s_at 0.022103 Source: H. sapiens mRNA for phosphoinositide 3-kinase. 262 38972_at 0.022103 Source: Homo sapiens clone 24775 mRNA sequence. 263 37668_at 0.022175 Source: Human pre-mRNA splicing factor SF2p32, complete sequence. 264 37868_s_at 0.022178 MOG-25.6kD 265 38809_s_at 0.022233 Source: Homo sapiens mRNA for KIAA0519 protein, complete cds. 266 810_at 0.022455 similar to Dbl exchange factor and to pleckstrin 267 1612_s_at 0.022455 Source: Human junD mRNA. 268 36981_at 0.022455 Source: Homo sapiens clone 24452 mRNA sequence. 269 40570_at 0.022455 Source: Homo sapiens forkhead protein (FKHR) mRNA, complete cds. 270 36536_at 0.022475 Source: Homo sapiens clone 24732 unknown mRNA, partial cds. 271 38801_at 0.022475 Source: wg46h09.x1 Soares_NSF_F8_9W_OT_PA_P_SI Homo sapiens cDNA clone IMAGE:2368193 3' similar to TR:O75453 075453 VAMP-ASSOCIATED PROTEIN OF 33 KDA. mRNA sequence 272 35777_at 0.027475 Source: Homo sapiens mRNA for zinc finger protein, complete cds, clone: RES4-26 273 38254_at 0.022475 Source: Homo sapiens mRNA for KIAA0882 protein, partial cds. 274 38075_at 0.022475 Source: H. sapiens tr-SpI mRNA. 275 34192_at 0.022475 Source: Homo sapiens mRNA for KIAA0532 protein, partial cds. 276 41212_r_at 0.022485 Source: Human mRNA for KIAA0038 gene, partial cds. 277 31510_s_at 0.023142 Source: H. sapiens hH3.3B gene for histone H3.3. 278 32667_at 0.023142 Source: Human alpha-5 collagen type IV (COL4A5) mRNA, 3' end. 279 41536_at 0.023264 match: proteins P47928 P41139 Q13005 280 34387_at 0.023264 similar to putative product coded in C. elegans cosmid C01C10. 281 36042_at 0.023264 Source: H. sapiens trkB mRNA for protein-tyrosine kinase. 282 38357_at 0.023264 Source: Homo sapiens mRNA; cDNA DKFZp564D156 (from clone DKFZp564D156). 283 36118_at 0.023264 Source: Homo sapiens mRNA for steroid receptor coactivator 1e. 284 34680_s_at 0.023336 Source: Human mRNA for KIAA0107 gene, complete cds. 285 31962_at 0.023449 Source: Homo sapiens ribosomal protein L37a (RPL37A) mRNA, complete cds. 286 33158_at 0.023449 Source: Homo sapiens Kallmann syndrome (KAL) mRNA, complete cds. 287 35184_at 0.023449 Source: Homo sapiens mRNA for KIAA0546 protein, partial cds. 288 35083_at 0.023449 similar to SW:GOLI_DROME Q06003 GOLIATH PROTEIN 289 32531_at 0.023449 gap junction protein (AA 1-382) 290 37038_at 0.023449 Source: H. sapiens PXMP1 gene, exon I (and joined CDS). 291 35750_at 0.023449 Source: Homo sapiens mRNA; cDNA DKFZp564K0222 (from clone DKFZp564K0222). 292 41823_at 0.023581 Source: Homo sapiens mRNA for staufen protein, partial. 293 1970_s_at 0.023697 Source: H. sapiens FGFR2 mRNA. 294 36488_at 0.023982 Source: Homo sapiens mRNA for MEGF9, partial cds. 295 33666_at 0.024001 C protein 296 39150_at 0.024001 Source: U69559 Soares infant brain 1NIB Homo sapiens cDNA clone 26077, mRNA sequence. 297 471_f_at 0.024001 class III isotype; beta-3 298 33118_at 0.024016 match to U03056 (PID:g532974); H_LUCA14.3 299 36988_at 0.024016 Source: Human B12 protein mRNA, complete cds. 300 32039_at 0.024096 similar to cerebellar degeneration antigen beta-NAP and to the beta-1-adaptin and beta-2-adaptin subunits of clathrin-associated complexes 301 37040_at 0.024109 The ha1225 gene product is related to human alpha-glucosidase. 302 36845_at 0.024145 The KIAA0136 gene product is novel. 303 1636_g_at 0.024172 ABL is the cellular homolog proto-oncogene of Abelson's murine leukemia virus and is associated with the t9:22 chromosomal translocation with the BCR gene in chronic myelogenous and acute lymphoblastic leukemia; alternative splicing using exon 1a 304 38710_at 0.024734 Source: Homo sapiens mRNA; cDNA DKFZp564E242 (from clone DKFZp564E242). 305 37914_at 0.024734 Source: Human mRNA for KIAA0305 gene, complete cds. 306 34355_at 0.024895 Source: Homo sapiens mRNA for methyl-CpG-binding protein 2.307 1311_art 0.024965 Source: Human mRNA for proteasome subunit HsN3, complete cds. 308 35294_at 0.024965 ribonucleoprotein autoantigen 60 kd subunit 309 32313_at 0.025167 fibroblast tropomyosin 310 33082_at 0.025167 Source: Homo sapiens integrin subunit alpha 10 precursor, mRNA, complete cds.311 33821_at 0.025167 match: proteins: Tr:Q9Y3M0 Tr:Q9WU14 Sw:P39540 Tr.Q9Y396 312 35232_f_at 0.025167 Source: oz26h05.x1 Soares_total_fetus_Nb2HF8_9w Homo sapiens cDNA clone IMAGE:1676505 3' similar to SW:CATR_GIALA Q24956 CALTRACTIN; mRNA sequence. 313 37663_at 0.025167 Source: Homo sapiens DDX1 gene, complete CDS. 314 612_s_at 0.025167 2',3'-cyclic-nucleotide 3'-phosphodiesterase (EC 3.1.4.37) 315 36164 _at 0.025167 similar to the Ratins norvegiens dihydroliponamide acetyltransferase component (E2) of pyruvate dehydrogenase complex: Swiss Prot Accession Number P08461 316 38805_at 0.025167 Source: H. sapiens mRNA for TGIF protein. 317 07710_f_at 0.025182 heterogeneous nuclear-ribonucleoprotein D-like 318 34304_s_at 0.025556 Source: Homo sapiens mRNA; cDNA DKFZp586G1923 (from clone DKFZp586G1923). 319 34783_s_at 0.025678 amino terminus similar to protein encoded by GenBank Accession Number AF047472; structurally similar to Homo sapiens Rael protein encoded by GenBank Accession Number U84720; similar to Mus musculus protein encoded by GenBank Accession Number U67327; contains WD40 repeat motif, also termed trp-asp, G-beta repeat; binds BUB1 kinase 320 37575_at 0.025678 Source: Homo sapiens mRNA; cDNA DKFZp586C1723 (from clone DKFZp586C1723). 321 39755_at 0.025678 match: proteins: Sw:P17861 Tr:O35426 322 37307_at 0.025678 G protein alpha-subunit (AA 1-355) 323 36946_at 0.025684 human homolog of Drosophila mnb (minibrain) gene 324 34425_at 0.025684 does not contain alpha 3 domain 325 40347_at 0.025788 Source: o139a08.s1 Soares_NFL_T_GBC_S1 Homo sapiens cDNA clone IMAGE:1525814 3' similar to contains element L1 repetitive element ;, mRNA sequence. 326 32402_s_at 0.025992 Source: H. sapiens mRNA for symplekin. 327 32235_at 0.026262 Source: Homo sapiens mRNA for KIAA0544 protein, partial cds. 328 41063_g_at 0.02649 Source: zc52c04.r1 Soares_senescent_fibroblasts_NbHSF Homo sapiens cDNA clone IMAGE:325926 5' similar to SW:BMI1_MOUSE P25916 DNA-BINDING PROTEIN BMI-1. [1] ;, mRNA sequence. 329 33373_at 0.026577 Source: Homo sapiens mRNA; cDNA DKFZp564O0122 (from clone DKFZp56400122). 330 34647_at 0.026577 p68 protein (AA 1-614) 331 32240_at 0.026673 Source: Human mRNA for KIAA0072 gene, partial cds. 332 37324_at 0.026673 put. transferrin receptor (aa 1-760) 333 36337_at 0.02682 Source: wi67f11.x1 NCI_CGAP_Kid12 Homo sapiens cDNA clone IMAGE:2398413 3' similar to TR:O75257 075257 R31180_1. ;contains TAR1 .t1 TAR1 repetitive element;, mRNA sequence. 334 33447_at 0.02682 myosin regulatory light chain 335 39373_at 0.026839 Source: Homo sapiens clone 23716 mRNA sequence. 336 32844_at 0.026839 elF4GI 337 31509_at 0.026839 Source: H. sapiens BBCI mRNA. 338 35246_at 0.026839 Source: Human receptor tyrosine kinase (DTK) mRNA, complete cds. 339 31853_at 0.026839 polycomb-group protein; homolog of Drosophila esc (extra sex combs); EED 340 37619 _at 0.026839 KIAA0094 gene product is related to S.cerevisiae methionine aminopeptidase. 341 35790_at 0.026839 Source: Homo sapiens H beta 58 homolog mRNA, complete cds. 342 32730_at 0.027032 Source: Homo sapiens mRNA; cDNA DKFZp564H142 (from clone DKFZp564H142). 343 226_at 0.027032 Source: Human cAMP-dependent protein kinase type I-alpha subunit (PRKAR1A) mRNA, complete cds. 344 37424_at 0.027032 a-helix coiled-coil rod homologue 345 38982_at 0.027032 Source: 53g9 Human retina cDNA randomly primed sublibrary Homo sapiens cDNA, mRNA sequence. 346 32504_at 0.027032 Source:wu69c05.x1 NCI_CGAP_Kid3 Homo sapiens cDNA clone IMAGE:2525288 3', mRNA sequence. 347 41463_at 0.027032 Source: DKFZp434B0222_s1 434 (synonym: htes3) Homo sapiens cDNA clone DKFZp434B0222 3', mRNA sequence. 348 35759_at 0.027088 similar to mouse chaperonin-containing TCP-1 beta subunit 349 168_at 0.027139 Source: Human adenosine kinase mRNA, complete cds. 350:35140_at 0.027139 Source: yh11b03.s1 Soares infant brain 1NIB Homo sapiens cDNA clone IMAGE:42880 3', mRNA sequence. 351 36580_at 0.027139 Source: Homo sapiens mRNA; cDNA DKFZp586M141 (from clone DKFZp586M141). 352 40387_at 0.027139 similar to mouse vzg-1 353 38657_s_at 0.027139 clathrin light chain a 354 33110_at 0.027139 Source: qy22a10.x1 NCI_CGAP_Brn23 Homo sapiens cDNA clone IMAGE:201 2730 3' similar to gb:X71136 SOX-10 PROTEIN (HUMAN);, mRNA sequence. 355 36948_at 0.027261 Source: Homo sapiens mRNA full length insert cDNA clone EUROIMAGE 45620. 356 34354_at 0.027592 putative 357 40779_at 0.027592 Smg GDS-associated protein having arm repeats and phosphorylated by Src tyrosine kinase 358 39072_at 0.027634 Source: Human MXI1 mRNA, complete cds. 359 1179_at 0.027634 360 35768_at 0.027634 Source: Homo sapiens mRNA for KIAA0661 protein, complete cds. 361 37373_at 0.027634 similar to uridine diphosphoglucose pyrophosphorylase in human liver, Swiss-Prot Accession Number Q07131; the 5'UTR and 3'UTR of this clone are completely different from those of the liver form 362 41338_at 0.027634 Source: wx39f10.x1 NCI_CGAP_Pit1 Homo sapiens cDNA clone IMAGE:2546059 3', mRNA sequence. 363 35837_at 0.027634 Source: Homo sapiens mRNA for scrapie responsive protein 1.364 1675_at 0.027634 ras p21 GTP-ase-activating protein (GAP) 365 37395_at 0.027634 Source: Homo sapiens mRNA for vacuolar ATPase, complete cds. 366 41759_at 0.027634 Source: H. sapiens mRNA for RNA polymerase II elongation factor-like protein. 367 36046_at 0.027634 similarity to SPAC2F3.16 368 35468_at 0.027854 Source: Homo sapiens mRNA; cDNA DKFZp586B2023 (from clone DKFZp586B2023). 369 35403_at 0.028018 Source: Homo sapiens mRNA for KIAA1094 protein, complete cds. 370 38676_at 0.028018 Source: z196e07.r1 Stratagene corneal stroma (#937222) Homo sapiens cDNA clone IMAGE:512484 5', mRNA sequence. 371 1318_at 0.028018 Source: H. sapiens RbAp48 mRNA encoding retinoblastoma binding protein. 372 33170_at 0.028018 Source: Homo sapiens mRNA for KIAA0962 protein, partial cds. 373 38190_r_at 0.028018 Source: Homo sapiens mRNA for KIAA0645 protein, complete cds. 374 35218_at 0.028018 apoptosis-related protein 375 41528_at 0.02862 Source: zd62h08.s1 Soares_fetal_heart_NbHH19W Homo sapiens cDNA clone IMAGE:345279 3', mRNA sequence. 376 37666_at 0.02862 Source: Human mRNA for proteasome subunit X, complete cds. 377 37229_at 0.02862 similar to FRAP, Mec1p, Tor1p, Tor2p, and ATM 378 38943_at 0.028882 putative 379 1074_at 0.028882 Source: Homo sapiens GTP-binding protein (RAB1) mRNA, complete cds. 380 1942_s_at 0.028882 Cyclin-dependent kinase 4 381 411_i_at 0.029002 Source: Human 1-8D gene from interferon-inducible gene family. 382 32669_at 0.029424 Source: Homo sapiens mRNA for KIAA0671 protein, complete cds. 383 37543_art 0.029842 this sequence overlaps D13631, it covers 954..4359 of this sequence. 384 34845_at 0.029842 remainder of gene in clone 549K18 (AL023654) 385 38817 _at 0.029842 Source: Homo sapiens sperm acrosomal protein mRNA, complete cds. 386 41825_at 0.029966 Source: 34c6 Human retina cDNA randomly primed sublibrary Homo sapiens cDNA, mRNA sequence. 387 41850_s_at 0.030352 isolated in a two hybrid screen to identity cellular proteins that interact with hepatitis delta antigen; similar to hepatitis delta antigen, and has two regions predicted to form coiled-coil protein interaction domains 388 40480_s_at 0.0309 c-syn protooncogene; belongs to the protein-tyrosine kinase family of retroviral oncogenes 389 1463_at 0.0309 Source: Human protein tyrosine phosphatase (PTP-PEST) mRNA, complete cds. 390 AFFX-HUMISGF3 A/M97905_MB_at 0.0309 Source: Homo sapiens transcription factor ISGF-3 mRNA, complete cds. 39L 37774_at 0.0309 Source: wj88e02.x1 NCI_CGAP_Lym12 Homo sapiens cDNA clone IMAGE:2409914 3' similar to SW:GBB5_HUMANG014775GUANINE NUCLEOTIDE-BINDING PROTEIN BETA SUBUNIT 5 mRNA sequence.392 38832_r_at 0.0309 M11319; Homo sapiens chromosome 7q22, sequence, complete sequence. 393 33722_at 0,031224 Source: Homo sapiens mRNA for KlAA0548 protein, partial cds. 394 36107_at 0.031626 Source: ak04e09.s1 Soares_parathyroid_tumour_NbHPA Homo sapiens cDNA clone IMAGE:1405000 3' similar to gb:M37104 ATP SYNTHASE COUPLING FACTOR 6, MITOCHONDRIAL PRECURSOR (HUMAN);, mRNA sequence. 395 39736_at 0.031702 GTP-binding protein G25K 396 38069_at 0.032016 Source: H. sapiens mRNA for CLC-7 chloride channel protein. 397 556_s_at 0.032345 Source: Human glutathione transferase class mu number 4 (GSTM4) gene, complete cds. 398 38336_at 0.032745 hj06791 cDNA clone for KIAA1013 has a 4-bp deletion at position between 1855 and 1860 of the sequence of KIAA1013. 399 33913_at 0.032745 HLA-B-associated transcript 2 (BAT2) 400 33358_at 0.03283 Source: 56b8 Human retina cDNA randomly primed sublibrary Homo sapiens cDNA, mRNA sequence. 401 767_at 0.032913 Source: Human Chromosome 16 BAC clone CIT987SK-A-815A9, complete sequence. 402 35163_at 0.033005 Source: Homo sapiens mRNA for KIAA1041 protein, complete cds. 403 1278_at 0.033089 404 1695_at 0.033089 Source: Homo sapiens mRNA for ubiquitin-like protein, complete cds. 405 34648_at 0.033089 Source: H. sapiens mRNA for SSR alpha subunit. 406 40211_at 0.033171 Source: Human gene for heterogeneous nuclear ribonucleoprotein (hnRNP) core protein A1. 407 34085_at 0.033329 Source: H. sapiens gene for ribosomal protein L38. 408 1635_at 0.033329 ABL is the cellular homolog proto-oncogene of Abelson's murine leukemia virus and is associated with the t9:22 chromosomal translocation with the BCR gene in chronic myelogenous and acute lymphoblastic leukemia; alternative splicing using exon 1a 409 37675_at 0.033565 Source: H. sapiens mRNA for mitochondrial phosphate carrier protein. 410 38110_at 0.033587 mda-9; pbp-1 411 40771_at 0.033587 match: proteins: Sw:P26038 Tr:O35763 Sw:P26041 Sw:P26042 Sw:P26044 Sw:P35241 Sw:P26043 Sw:P15311 Sw:P31976 Sw:P26040 Tr:Q26520 Tr:Q24788 Tr:Q24796 Tr:Q94815 412 869_at 0.033639 general transcription factor IIA, 2 (12kD subunit) 41341203_at 0.033639 putative 414 40426_at 0.033639 Source: H. sapiens mRNA for BCL7B protein. 415 36032_at 0.033639 partially supported by FGENES and GENSCAN 416 39376_at 0.033662 Source: Homo sapiens mRNA for KIAA0630 protein, partial cds. 417 39380_at 0.033775 Source: Homo sapiens mRNA for KIAA0697 protein, partial cds. 418 40091_at 0.033775 6 C2H2 zinc finger zinger repeats from 520 to 691 in protein sequence 419 33866_at 0.03399 tropomyosin (AA 1-248) 420 34809_at 0.03399 Source: yq87g03.r1 Soares fetal liver spleen INFLS Homo sapiens cDNA clone IMAGE:202804 5', mRNA sequence. 421 39778_at 0.03402 Source: Human N-acetylglucosaminyltransferase I (GlcNAc-TI) mRNA, complete cds. 422 36121_at 0.034483 Source: Homo sapiens mRNA for KIAA1065 protein, complete cds. 423 41116_art 0.034861 Source: wc43d09.x1 NCI_CGAP_Pr28 Homo sapiens cDNA clone IMAGE:2321393 3' similar to SW:YD84 SCHPO Q10409 HYPOTHETICAL 32.6 KD PROTEIN C1F3.04C IN CHROMOSOME 1. mRNA sequence.424 34781_at 0.034861 Source: Human WS-3 mRNA, complete cds. 425 34812_at 0.034907 Source: 22f11 Human retina cDNA randomly primed sublibrary Homo sapiens cDNA, mRNA sequence 426 32276_at 0.035041 rpI.32 (aa I-135) 427 36636_at 0.035115 Source: Human ornithine aminotransferase mRNA, complete cds. 428 37674_at 0.035221 5-aminolevulinate synthase precursor 429 41814_at 0.033359 alpha-L-fucosidase precursor (EC 3215) 430 37907_at 0.035531 CpG island protein 431 35195_at 0.03601 Source: H. sapiens mRNA for phosphate cyclase. 432 35720_at 0.036032 Source: Homo sapiens mRNA for KIAA0893 protein, complete cds. 433 34600_s_at 0.036032 Source: Human tub homolog mRNA, complete cds. 434 32526_at 0.036255 hypothetical protein FLJ14529 435 33295_at 0.036255 Source: H. sapiens DARC gene. 436 41404_at 0.036255 Source: Homo sapiens mRNA for Ribosomal protein kinase B (RSK-B). 437 41170_at 0.036255 Source: Homo sapiens mRNA for KIAA0663 protein, complete cds. 438 34774_at 0.036255 Source: Human palmitoyl protein thioesterase mRNA, complete cds. 439 35670_at 0.036255 Source: Human Na+,K+ -ATPase catalytic subunit alpha-III isoform gene, exon 23, clone lambda-NK-alpha-R3-2.440 33835_at 0.036255 Source: Homo sapiens mRNA for KIAA0721 protein, partial cds. 441 35756_at 0.036255 Source: Homo sapiens RGS-GAIP interacting protein GIPC mRNA, complete cds. 442 38679_g_at 0.036255 Source: zg79b05.s1 Soares_fetal_heart_NbHH19W Homo sapiens cDNA clone IMAGE:399537 3' similar to gb:M65125_ma1 U1 AND U2 SMALL NUCLEAR RIBONUCLEOPROTEIN E (HUMAN);, mRNA sequence. 443 1081_at 0.036261 ornithine decarboxylase 444 41559_at 0.036261 Source: zw24f03.r1 Soares ovary tumour NbHOT Homo sapiens cDNA clone IMAGE:770237 5', mRNA sequence. 445 40587_s_at 0.03647 Source: Homo sapiens p18 protein mRNA, complete cds. 446 1884_s_at 0.03647 cyclin 447 37348_s_at 0.036478 Source: ak01go01.s1 Soares_parathyroid_tumour_NbHPA Homo sapiens cDNA clone IMAGE:1404720 3' similar to SW:TRI7_HUMAN Q15651 THYROID RECEPTOR INTERACTING PROTEIN 7 ;, mRNA sequence. 448 37759_at 0.036478 Source: Human lysosomal-associated multitransmembrane protein (LAPTm5) mRNA, complete cds. 449 40182_s_at 0.036776 Source: Homo sapiens clone 24658 mRNA sequence. 450 32543_at 0.036921 Source: Human autoantigen calreticulin mRNA, complete cds. 451 32750_r_at 0.036934 actin-binding protein 452 117_at 0.036934 heat-shock protein HSP70B 453 32548_at 0.036934 Source: Human (p23) mRNA, complete cds. 454 41594_at 0.036934 Source: Human protein-tyrosine kinase (JAK1) mRNA, complete cds. 455 37732_at 0.036934 Source: Homo sapiens mRNA; cDNA DKFZp564E1922 (from clone DKFZp564E1922). 456 41128_at 0.03697 Source: Homo sapiens clone 24606 mRNA sequence. 457 35903_at 0.037598 Source: Human oligodendrocyte-myelin glycoprotein (OMGP) mRNA, complete cds. 458 33809_at 0.037604 GTP-binding regulatory protein Gi alpha-1 chain 459 33466_at 0.037604 Source: Homo sapiens clone 23860 mRNA sequence. 460 39897_at 0.037937 Source: yy39g07.s1 Soares melanocyte 2NbHM Homo sapiens cDNA clone IMAGE:273660 3'; mRNA sequence. 461 34950_at 0.037937 Source: Homo sapiens mRNA for KIAA0760 protein, partial cds. 462 41530_at 0.037937 Source: Human mRNA for mitochondrial 3-oxoacyl-CoA thiolase, complete cds. 463 34753_at 0.037937 Source: H. sapiens mRNA for novel gene in Xq28 region. 464 36160_s_at 0.037937 Source: Human protein tyrosine phosphatase receptor pi (PTPRP) mRNA, complete cds. 465 34592_g_at 0.037937 ribosomal protein S 17 466 34752_at 0.038065 Source: Homo sapiens; mRNA; cDNA DKFZp586G2222 (from clone DKFZp586G2222). 467 34213_at 0-038065 Source Homo sapiens mRNA for KIAA0869 protein, partial cds. 468 33893_r_at 0.038065 Source: Homo sapiens mRNA for KIAA0470 protein; complete cds. 469 34392_s_at 0.038065 Rab1, splice variant 470 38045_at 0.038065 a novel member of the Armadillo family interacting with presenilin 1 (PS1); presenilin associated protein 471 38062_at 0.038065 Similar to a C.elegans guanine nucleotide releasing factor homolog (S4 2368) 472 38573_at 0.038065 zinc finger protein 473 32119_at 0.038065 Source: Homo sapiens mRNA; cDNA DKFZp586B211 (from clone DKFZp586B211). 474 31955_at 0.038065 Source: H. sapiens fau mRNA. 475 31899_at 0.038065 Source: Human mRNA for KIAA0103 gene, complete cds. 476 38991_at 0.038065 Source: HSU55980 Human brain ARSanders Homo sapiens cDNA clone 25453 3', mRNA sequence. 477 39809_at 0.038065 HBP1 478 41375_at 0.038065 Source: Homo sapiens mRNA for G7b protein (G7b gene, located in the class III region of the major histocompatibility complex. 479 1356_at 0.038065 Source: Human ionizing radiation resistance conferring protein mRNA, complete cds. 480 39009_at 0.038065 Source: yy66d08.r1 Soares_multiple_sclerosis_2NbHMSP Homo sapiens cDNA clone IMAGE:278511 5', mRNA sequence. 481 39327_at 0.038065 similar to D.melanogaster peroxidasin(U11052) 482 41449_at 0.038065 Source: Homo sapiens mRNA for epsilon-sarcoglycan. 483 40775_at 0.038065 5' end of gene beyond this clone; match: protein Q61500 484 36511_at 0.038065 Source: Homo sapiens mRNA for KIAA0851 protein, complete cds. 485 35833_at 0.038065 Source: Homo sapiens mRNA; cDNA DKFZp4340071 (from clone DKFZp434O071). 486 35845_at 0.038065 Source: Homo sapiens mRNA for Sec24 protein (Sec24B isoform). 487 36271_at 0.038065 Source: Homo sapiens mRNA for KIAA1024 protein, partial cds. 488 41715_at 0.038065 Source: H. sapiens mRNA for phosphoinositide 3-kinase. 489 41665_at 0.038065 Source: Homo sapiens mRNA for KIAA0824 protein, partial cds. 490 35342_at 0.038065 Source: Homo sapiens clone 24416 mRNA sequence. 491 41799_at 0.038065 Source: 48h8 Human retina cDNA randomly primed sublibrary Homo sapiens cDNA, mRNA sequence. 492 36603_at 0.038065 similar to Yeast translation activator GCN1 (P1:A48126) 493 39766_r_at 0.038229 Source: tr08h04.x1 NCI_CGAP_Ov23 Homo sapiens cDNA clone IMAGE:2217751 3' similar to SW:RPCX_HUMAN P53803 DNA-DIRECTED RNA POLYMERASES I, II, AND III 7.0 KD POLYPEPTIDE ;, mRNA sequence. 494 38100_at 0.038407 Source: Homo sapiens mRNA for translocation protein-1, complete cds. 495 39441_at 0.038506 Source: Homo sapiens mRNA for lanthionine synthetase C-like protein 1 (LANCL1 gene). 496 38398_at 0.038994 Source: Human mRNA for KIAA0358 gene, complete cds. 497 33108_i_at 0.039132 putative 498 35102_at 0.039332 Source: Homo sapiens zinc finger protein mRNA, 3' end. 499 2065_s_at 0.039432 Source: Human Bax alpha mRNA, complete cds. 500 34814_at 0.039631 Source: DKFZp434D0717_s1 434 (synonym: htes3) Homo sapiens cDNA clone DKFZp434D0717 3', mRNA sequence. 501 41436_at 0.039781 Source: Homo sapiens mRNA for ZNF198 protein. 502 33451_s_at 0.039781 Source: DU3.2-7.G09 DU-145 Homo sapiens cDNA 3', mRNA sequence. 503 37489_s_at 0,039781 Source: Human anion exchanger 3 brain isoform (bAE3) mRNA, complete cds. 504 36650_at 0.040102 Source: Human mRNA for KIAK0002 gene, complete cds. 505 34849_at 0.040102 Source: H. sapiens mRNA for seryl-tRNA synthase. 506 743_at 0.040122 putative 507 1072_g_at 0.040122 source: Human transcription factor GATA-2 (GATA-2) mRNA, complete cds. 508 1660_at 0.040122 Source: Human epidermoid carcinum mRNA for ubiquitin-conjugating enzyme EZ similar to Drosophila bendless gene product, complete cds. 509 428_s_at 0.040122 Source: Human messenger RNA fragment for the beta-2 microglobulin. 510 837_s_at 0.040122 Source: Human breast cancer cytosolic NADP(+)-dependent malic enzyme mRNA, partial cds. 511 38652_at 0.040388 Source: Homo sapiens clone 24742 mRNA sequence. 512 33301_g_at 0.040401 513 35307_at 0.040403 Source: Homo sapiens mRNA for GDP dissociation inhibitor beta. 514 40537_at 0.040659 Source: Homo sapiens mRNA for KIAA0741 protein, complete cds. 515 40018_at 0.040659 Source: Homo sapiens KIAA0410 mRNA, complete cds. 516 38993_r_at 0.040683 Source: 32a12 Human retina cDNA randomly primed sublibrary Homo sapiens cDNA, mRNA sequence. 517 33369_at 0.040683 Source: P9-C4.T3.P9.D4 conorm Homo sapiens cDNA 3', mRNA sequence. 518 38065_at 0.040683 Source: H. sapiens HMG-2 mRNA. 519 630_at 0.040702 Source: Homo sapiens deoxycytidylate deaminase gene, complete cds. 520 39026_r_at 0.040775 Source: Homo sapiens clone 23887 mRNA sequence. 521 37298_at 0.040775 Source: Homo sapiens MM46 mRNA, complete cds. 522 566_at 0.040775 145 kda neural cell adhesion molecule; This sequence comes from Fig. 4 523 1226_at 0.041055 transmembrane metalloproteinase/disintegrin; adamalysin; TACEA 524 36165_at 0.041055 Source: zc48b04.r1 Soares_senescent_fibroblasts_NbHSF Homo sapiens cDNA clone IMAGE:325519 5' similar to gb:X13238 CYTOCHROME C OXIDASE POLYPEPTIDE VIC PRECURSOR (HUMAN);, mRNA sequence. 525 32510_at 0.041215 2-carboxybenzaldehyde reductase; member of aldo-keto reductase AKR7 family 526 39791_at 0.041257 Source: Homo sapiens calcium-ATPase (HK1) mRNA, complete cds. 527 31809 _at 0.041257 Source: H. sapiens contactin mRNA,. 528 36100_at 0.041257 Source: Homo sapiens vascular endothetial growth factor mRNA, complete cds. 529 33924_at 0.041338 Source: Homo sapiens mRNA for KIAA1091 protein, partial cds. 530 40846_g_at 0.041338 Source: Human nuclear factor NF90 mRNA, complete cds. 531 38664 at 0.041338 Source: Homo sapiens BCNT mRNA, complete cds. 532 41283_at 0.041494 Source: Homo sapiens clone 23930 mRNA sequence. 533 38042_at 0.041843 G6PD(AA 1-515) 534 1627_at 0.041843 535 35152_at 0.041927 Source: Homo sapiens mRNA encoding RAMP3. 536 33864_at 0.041927 binds directly to adenovirus type 5 E1A protein537 32254_at 0.041979 Source: Homo sapiens mRNA; cDNA DKFZp586L1323 (from clone DKFZp586L1323). 538 40435_at 0.041983 ADP.ATP translocase 539 37616_at 0.041993 Source: H. sapiens AUH mRNA. 540 1213_at 0.042177 similar to human serine kinase SRPK1, encoded by GenBank Accession Number U09564; specific for serine/arginine-rich splicing factors 541 818_s_at 0.042207 XH2; XNP; alternatively spliced product 1; contains all exons; translation starts in exon 9; ATRX gene deposited in GenBank Accession Numbers U72900-U72935 542 37181_at 0.042334 Source: H. sapiens Mpv17 mRNA. 543 35776_at 0.042686 Source: Homo sapiens intersectin short form mRNA, complete cds. 544 31820_at 0.042778 haematopoietic lineage cell protein (AA 1-486) 545 41344_s_at 0.042778 Source: H. sapiens Pur(pur-alpha) mRNA, complete cds. 546 1468_at 0.042778 TNF type I receptor associated protein 547 38306_at 0.043327 Source: zu44b03.r1 Soares ovary tumour NbHOT Homo sapiens cDNA clone IMAGE:740813 5', mRNA ' sequence 548 34326_at 0.043502 Source: H. sapiens mRNA for beta-COP. 549 39442_at 0.043534 une-50 related protein homolog 550 35619_at 0.043649 Source: Homo sapiens mRNA for KlAA0634 protein, partial cds. 551 1953_at 0.043649 Vascular endothelial growth factor 552 37580_at 0.043649 predicted; contains SH3 domain; member of the EEN gene family 553 33351_at 0.04411 similar to SUII 554 33752_at 0.044234 Source: Homo sapiens mRNA for K1AA0850 protein, complete cds. 555 41542_at 0.044234 Source: Homo sapiens zinc finger protein 216 splice variant 1(ZNF216) mRNA, complete cds. 556 32853_at 0.044234 Source: Homo sapiens mRNA for KIAA0719 protein, complete cds. 557 34876_at 0.044268 duck gp180 homolog 558 35722_at 0.044288 similarity to S.cerevisiae Nmd2p 559 40636_at 0.044411 Source: wf49b01.xl Soares_NFL_T_GBC_S1 Homo sapiens cDNA clone IMAGE:2358889 3' similar to TR:O75955 O75955 FLOTILLIN-1. ;, mRNA sequence. 560 33443_at 0.044411 match: proteins P38533 Q03933 P38530 P41154 Q00613 P38529 P38531 Q63717 P38532 Q99472 561 555_at 0.044411 small GTP binding protein, homologous to Saccharomyces cerevisiae SEC4, Swiss-Prot Accession Number P07560 562 38120_at 0.044659 autosomal dominant polycystic kidney disease type II 563 40263_at 0.045291 Source: Homo sapiens clone lambda MENI region unknown protein mRNA, complete cds. 564 31797 _at 0.046069 Source: Human DNA sequence from clone 73H22 on chromosome 6q23, complete sequence. 56541194_at 0.046069 Source: PT1.3_04_C04.r tumour1 Homo sapiens cDNA 5', mRNA sequence. 566 37532_at 0.0468 Source: Human medium-chain acyl-CoA dehydrogenase (MCAD) gene, exon 12. 567 883_s_at 0.0468 Source: Human h-pim-1 protein (h-pim-1) mRNA, complete cds. 568 AFFX-HUMRGE/M 10098_5_at 0.0468 Source: Human 18S rRNA gene, complete. 569 39033_at 0.047068 Source: HSZ78368 Human fetal brain S. Meier-Ewert Homo sapiens cDNA clone 3.142 (CEPH), mRNA sequence. 570 33249_at 0.047068 mineralocorticoid receptor 571 36480_at 0.047068 alpha subunit 572 36563_at 0.047068 Source: Homo sapiens clone 23582 mRNA sequence. 573 35746_r_at 0.047095 Source: H. sapiens hnRNP-E2 mRNA. 574 38743_f_at 0.047214 Source: Human mRNA fragment for activated c-raf-1 (exons 8-17). 575 41110_at 0.047214 Source: H. sapiens mRNA for vasopressin activated calcium mobilizing receptor-like protein. 576 35187_at 0.048079 Source: Homo sapiens mRNA; cDNA DKFZp586K1123 (from clone DKFZp586K1123). 577 41296_s_at 0.048079 Source: 37c5 Human retina cDNA randomly primed sublibrary Homo sapiens cDNA, mRNA sequence. 578 781_at 0.048079 subunit of modification enzyme; beta subunit 579 32228_at 0.048079 Source: Homo sapiens mRNA for KIAA0899 protein, partial cds. 580 35090_g_at 0.048079 Source: Homo sapiens mRNA for NTAK, complete cds. 581 457_s_at 0.048079 conjugated post-transiationally to RanGAP1; ubiquitin-related protein; similar to UBL1 encoded by GenBank Accession Number U38784, PIC1 encoded by GenBank Accession Number U61397 and GMP1 encoded by GenBank Accession Number U72722 582 37333_at 0.048079 Source: H. sapiens mRNA for DNA (cytosin-5)-methyltransferase. 583 35683_at 0.048079 Source: Homo sapiens mRNA for KIAA0852 protein, complete cds. 584 1253_at 0.048079 Source: Human protein kinase mRNA, complete cds. 585 31807_at 6.04809 Source: U69190 Soares infant brain 1N1B Homo sapiens cDNA 27655, mRNA sequence 586 430_at 0.048334 PNP 587 1280_i_at 0.048396 588 37274_at 0.048396 biotin-amide amidohydrolase 589 34940_at 0.048884 Source: we38g03.x1 NCI_CGAP_Lu24 Homo sapiens cDNA clone IMAGE:2343412 3', mRNA sequence. 590 40308_at 0.049324 Source: wh51h03.x1 NCl_CGAP_Kid11 Homo sapiens cDNA clone IMAGE:2384309 3', mRNA sequence. 591 41573_at 0.049324 Source: H. sapiens SPR-2 mRNA for GT box binding protein. 592 34739_at 0.049324 Source: 18c3 Human retina cDNA randomly primed sublibrary Homo sapiens cDNA, mRNA sequence. 593 40517_at 0.049343 Source: Human mRNA for KIAA0372 gene, complete cds. 594 35983_at 0.049343 Hypothetical human protein (partial CDS); CDS constructed from combination of BLASTX, EST matches and Xgrail predictions. N-terminus of protein likely encoded in flanking cosmid R29942. Predicted protein exhibits weak similarity to hypothetical protein PID|e1226191 (AL021106) from Drosophila melanogaster 595 37895_at 0.049343 Source: Homo sapiens mRNA for CMP-sialic acid transporter, complete cds. 596 33877_s_at 0.049343 Source: Homo sapiens mRNA for KIAA1067 protein, partial cds. 597 34368_at 0.049343 similar to yeast RPD3, encoded by GenBank Accession Number X78454 598 41266_at 0.049343 Source: Human mRNA for integrin alpha 6. 599 32589_at 0.049516 Source: Human chromatin assembly factor-I p150 subunit mRNA, complete cds. 600 36907_at 0.049516 Source: Homo sapiens mevalonate kinase mRNA, complete cds. 601 35703_at 0.049564 PDGF-A (AA 1 - 196) 602 31932_f_at 0.04966 Source: Human basic transcription factor 3a (BTF3a) gene, complete cds. - Serum levels were determined for IGFB2 and found to be decreased, in agreement with the decreased transcript levels in several organs, including the liver.
TABLE 8 Serum Determination of Insulin-Like Growth Factor Binding Protein 2Treatment conc (ng/mL) mean (ng/mL) 1467 1742 control 922 1583 2201 1239.8 FGF23CTP100 µg/day 987.6 893 596.7 749.5 - Analysis. Angiogenesis is further shown to be inhibited by FGF23CTP in a hyperoxia-induced angioproliferative retinopathy model (Aiello FP et al., Proc. Natl. Acad. Sci. USA, 92: 10457-61(1995), Ozaki H et al., Am. J. Pathol. 156: 697-707 (2000)) in C57/B6 mice (see EXAMPLE VIII).The proliferative components of the retinal angiopathy induced through a relative ischemia by transition of postnatal mice from hyperoxic to normoxic conditions is significantly inhibited (p=0.018) by the intravitreal injection of the FGF23CTP (GPA006) peptide.
- In the rostral hypothalamus, besides its effects on angiogenesis and cycling genes, FGF23CTP affects several molecules that have been described to play a role in the pathogenesis of malignant proliferation of glial cells and precursors (malignant brain tumours): epithelial growth factor (EGF; Hoi Sang U et al., J. Neurosurg. 82: 841-6 (1995), Wu CJ et al., Oncogene 19: 3999-4010 (2000)), Bax (Streffer JR et al., J. Neurooncol. 56: 43-9 (2002); Martin et al., (2001)), connexin 43 (Huang R et al., Cancer Res. 62: 2806-12 (2002), Soroceanu L et al., Glia 33: 107-17 (2001)), PKR (Shir A & Levitzki A, Nature Biotechnology 20: 895-900 (2002)), NF1 (Cichowski K & Jacks T, Cell 104: 593-604 (2001), Gutmann DH et al., Hum. Mol. Genet. 10: 3009-16 (2001)).
- The discovery method of the invention has been validated through a "blind" monkey trial using three peptides of well known pharmacological activity: (1) the somatostatin analogue SOM230, (2) gonadotrophin releasing hormone (GnRH), (3) and leukemia inhibitory factor (LIF). In each case, a "blind" test with 3 "unknown" polypeptides was performed. The results demonstrated the capacity of the gene expression analyst teams to identify, within four months, the pharmacological activities, most of the therapeutic indications and side effects, and even the identity of the proteins. These first results demonstrate that the discovery method of the invention usefully provide the art with advantage in the understanding of drug pharmacological mechanisms and the potential side effects, the selection of biomarkers and potential new indications.
- For the verification of the selected human proteins or peptides in cynomolgus monkeys, one control and four treated groups (i.e., each of three peptides and placebo) of two males and two females are treated for two weeks by daily administration of the proteins dissolved in autologous serum (e.g., in each animal's own serum) through the subcutaneous route. The administration of the peptides was blinded. The amount of peptide administrated was 100 µg/animal /day (5-6 mg of peptide total).
- Drug profiling in these non-human primates was analyzed using gene expression profiling of more than 100 organs on Affymetrix U95 chips (each containing 1/3 of the human genome). In addition, extensive biochemistry and clinical chemistry screening (> 60 parameters) and histopathology (ca. 60 organs) were performed.
- Data mining procedures were then used. The data were probed to answer four questions: (1) Is the polypeptide worth further investigations? (2) What are the physiological pathways impacted? (3)What are the potential indications? (4) What is the likelihood of the identity of the polypeptide?
Peptide 1.Peptide 1 was SOM230. SOM230 (pasireotide) has a chemical structure cyclo[4-(NH2-C2H4-NH-CO-O)Pro-Phg-DTrp-Lys-Tyr(4-Bzl)-Phe] as follows:
- Here, Phg means -HN-CH(C6H5)-CO- and Bzl means benzyl. See,
PCT patent application WO 02/10192 S O M 2 3 0 has been developed for several indications, including those disclosed above for other somatostatin analogues. See, Lewis I et al., J. Med. Chem. 46(12):2334-44 (June 5, 2003); Weckbecker G et al., Endocrinology 143(10): 4123-4130 (2002); Kneissel M et al., Bone 28:237-250 (2001); and Thomsen JS et al., Bone 25:561-569 (1999), the contents of which are incorporated herein by reference. - SOM230 was developed for the approved Sandostatin® indications, but as a more potent somatostatin analogue with a longer plasma half-life in vivo. Lewis I et al., J Med Chem 46(12): 2334-44 (June 5, 2003); Weckbecker G et al., Endocrinology 143(10): 4123-30 (October 2002). In contrast with other analogues, SOM230 binds to all somatostatin receptors except SSTR4. The binding affinity for the different somatostatin receptors was a basis for defining the scope of possible new clinical indications for SOM230. Bruns C et al., Eur J Endocrinol 143 (Suppl 1) : S3 7 (2000); Bruns C et al., Eur J Endocrinol. 146(5):707-16 (May 2002). In addition, other possible new indications were suggested due to the improved activity of SOM230 for growth hormone and IGF-1 regulation and its different inhibitory effects on insulin and glucagon secretions.
- Following the blinded administration of peptide 1 (SOM230), the following results were obtained:
TABLE 9 Findings by the Data Mining Team Analysis Results Biochemistry/ Thymus and spleen atrophy, aldosterone-, glucagon-, vitamin D-, PTH+, Histopathology RBC hemoglobin-, urinary calcium-, NAG+, TSH+ in male, Pituitary IGFR1-, GH1/2-, CSH(L)-, TSH-, CHRH2-, Prostaglandin D2 synthase++, Immunoglobulin-- Adrenals IGF2-, somatostatin-, insulin receptor+, urocortin+ Pancreas Metallothionein 1A,1E++, trypsin, chymotrypsin, carboxypeptidases, phospholipaseA2/1B ++, 18S--, Stomach Gastrin+, hypocretin+, glutamate receptor+, GABAB-, IGFBP1+, Thymus MHC classII-, Ig-, FKBP12-, CD4-, defensin alphal+, Bone marrow VIP-, peptide YY-, cyclin-, GAPDH- Spleen IGF2- , IGBP6-, insulin receptor-, urocortin+, Ig-, ribosomal protein --, Nk cells+ Thyroid NPY-, cyclins--, ATPase calcium channel+, somatostatin receptor 4-, Liver IGF2-, NMDA receptor+, glutamate dehydrogenase+, VIP, insulin-induced protein1, STR5 Kidney Solute carrier protein 9++, urocortin+, IGF2-, arrestin beta 2-, THRα+, - The underlined results in the TABLE above were identified for further investigation.
TABLE 10 Peptide 1: Conclusions of the in vivo Profiling by the Data Mining Team Function/Pathway Potential Indications Anti-growth activity Cytostolic; cancer GI tract/pancreatic function Obesity, food intake regulation, diabetes, pancreatic function regulation Immunosuppression Suppression of specific immunity, maintenance of innate immunity - Based upon these results, the Data Mining Team made predictions as to the identity of the administered
Peptide 1.TABLE 11 Predicted Identity of Peptide 1 (Somatostatin Analogue SOM230) Data miner Prediction 1 Somatostatin, NPY, 2 IGF-1, Somatostatin, IGF-2 3 Somatostatin, IGF-1, IGF-2 4 Somatostatin, IGF-1, IGF-2 5 Secretin, IGF-1, Renin Summary Prediction Somatostatin, IGF-1, IGF-2 - Based upon these results, SOM230 was selected for further development as a somatostatin analogue to treat the somatostatin-approved neuroendocrine indications (e.g., acromegaly, gastroenteropancreatic tumours) and also has potential for further indications with a pancreatic endocrine eetiology such as diabetic angiopathy and morbid obesity associated with hyperinsulinemia. IGF-1 serum level was proposed as surrogate marker. Other potential indications for SOM230 are therefore inflammation (e.g., psoriasis), pain and immunosuppression (e.g., chronic rejection).
-
Peptide 2. Following the blinded administration of peptide 2 (gonadotrophin releasing hormone), the following results were obtained:TABLE 12 Findings by the Data Mining Team Analysis Results Biochemistry Slight increase in aldosterone Kidney Thiol protease inhibitor (aldosterone + in biochemistry), metabolism: +GAPDH, +STAT, +JAK, +TEGT Pituitary Gland GH-, GNRH receptor-, Somatostatin+, FSH+, LH-, TSH-, CSH(L)-, IGF/IGFBP-/+, tubulin+, Ovary Nuclear receptors-, aromatase and estrogen synthase+, activinA-, inhibin beta B+, Testis CREM+ Thyroid Ocludin+, thyroid hormone binding protein+, THR alpha- Adrenals Follistatin+, IGF2+, catecholamines synthesis+, activin A-/inhibin+ Hypothalamus Transthyretin+, oxytocin Bone marrow Macrophages+, eosinophils+, activin A-, inhibin betaB+, Thymus Integrin alpha6+, VAP1+, lipid metabolism, selenium binding protein+, Mammary Inconclusive; Sampling heterogenous gland Liver Activin A-, inhibin betaB+, lipid metabolism+, glycolysis+, follistatin+, IDO1+, VEGF- - The underlined results in the TABLE above were identified for further investigation.
TABLE 13 Peptide 2: Conclusions of the in vivo Profiling by the Data Mining Team Function/Pathway Potential Indications Ovarian and testicular Fertility, stimulation of reproductive function, functions stimulation of steroidogenesis - Based upon these results, the Data Mining Team made predictions as to the identity of the administered
Peptide 2.TABLE 14 Predicted Identity of Peptide 2 (GnRH) Data miner Prediction 1 GnRH, FSH, HCG 2 FSH, IGF1, GnRH 3 FSH, Somatotropin, LH 4 GnRH, FSH, IGF1 5 FSH, LHRH, IGF-1 Summary Prediction FSH, GnRH, LH-(RH) - Based upon these results, the predicted indications for the administered Peptide 2 (gonadotropin releasing hormone) were be for gonadotrophin releasing hormone-related indications or for lutenizing hormone releasing hormone-related indications, such as antiproliferative disorders (cancer), ovarian and testicular functions (hypothalamic gonadotropc hypogonadism, fertility control and delayed or arrested puberty/ precocious puberty), and growth hormone deficiencies.
- Peptide 3. Following the blinded administration of peptide 3 (leukemia inhibitory factor), the following results were obtained:
TABLE 15 Findings by the Data Mining Team Analysis Results Biochemistry/ Calcitonin++++, osteocalcin+, PTH-, bone alkaline phosphatase-, Haematology IC terminal polypeptide-, T4+, TSH+, alpha globin1+, platelet count +, WBC- Liver C/EBP delta+, JunB+, NFIL3+, CREM, quiescin Q6+, BTG2+, TCR-, BCL6+, antileukoproteinase+, selectinP+, VCAM+, ephrin A1+, Ostepontin+, calcitonin+, TIMP-1,, plasminogen inhibitor+, IL1R1, cholesterol hydrolase+, LDL receptor, phospholipase AII type II + Kidney C/EBP delta+, JunB+, NFIL3+, CREM, immunoglobulin-, MCP1+, mannose receptor+, BCR+, VCAM+, ephrinA2+, osteopontin+, stanniocalcin+, TIMP-1+, +, urokinase+, ILR1+, LDL receptor, phospholipase AII type II + Thyroid C/EBP delta+, JunB+, NFIL3+, CREM, STAT3+, CXCR4+, myeloid leukemia sequence+, Ig -, ephrinA1+, osteopontin+, TIMP-1+, haptoglobin, fibronectin+, phospholipase A2 typeIIA+, PDGF+ Skeletal muscle JunB, haptoglobin, phospholipase A2 typeIIA+ Spleen JunB+, STAT inhibitor 3, calgranulinB+, CD5+, BCR+, ephrin A1 exostoses+, TIMP-1 +, fibronectin+, ILR1+, LDL receptor+ Adrenals C/EBP delta+, JunB+, NFIL3+, CREM, BCR+, TIMP-1+, urokinase+, IL1R1+, LDL receptor Pituitary C/EBP delta+, JunB+, NFIL3+, TCR-, BCL6+" antileukoproeinase+, ephrin A1+, osteopontin+, chitinase 3-like1+, TIMP-1, plasminogen activator inhibitor, metallothionein+, haptoglobin+, IL1R1+ - The underlined results were identified for further investigation.
TABLE 16 Peptide 3: Conclusions of the in vivo Profiling by the Data Mining Team Function/Pathway Potential Indications Ca++ bone metabolism Osteoarthritis, Osteoporosis Inflammation Immunosuppression Transplantation Vascular differentiation Angiogenesis growth factors - Based upon these results, the Data Mining Team made predictions as to the identity of the administered
Peptide 2TABLE 17 Predicted Identity of Peptide 3 (LIF) Data miner Prediction 1 TGFβ2, IL-6, IFN gamma 2 TGFβ2, IL-6, Calcitonin 3 VIP 4 PDGF, GMCSF, Sertonin 5 LIF, IL3, TGFβ2 6 Oncostatin M, TGFβ2, IL3 Summary Prediction IL-6, IL-3, TGFβ2, LIF/Onccostatin - Based upon these results, the predicted actions for the administered Peptide 3 would be to increase platelets, myeloid cells and megakaryocytes; to increase acute phase proteins (such as C-Reactive Protein (CRP)and haptoglobin); to decrease lipogenicity (with therapeutic indications for treating obesity and cardiovascular risk); to decrease transaminase, albumin and lactate dehydrogenase (LDH); and to decrease alkaline phosphatase, bone sialoprotein (BSP) and osteocalcin (with therapeutic indications for treating osteoarthritis and osteoporosis).
- In summary, the three questions that were posed to the data miners could be answered almost fully by the data miners. All three polypeptides were identified as being worth further investigation. All of the physiological pathways known to be impacted by these three administered polypeptides were discovered (e.g. bone fractures for LIF, gastrointestinal tract for SOM230). Eighty % of their known potential indications were discovered and some new ones were identified.
- Introduction and summary. Microarray gene expression assays were performed using tissues of monkeys treated with SOM230 at sub-therapeutic dose for 14 days. The assays were analyzed to identify the modes of actions of SOM230 with possible relationships to therapeutic applications. For a description of SOM230, see the EXAMPLE above.
- All monkey tissues examined (thyroid, brown fat, pituitary, pancreas, liver, kidney, spleen) demonstrated changes in the genes regulated by the binding of the natural somatostatin 14 (SST-14) and somatostatin 28 (SST-28) to somatostatin receptors (SSTRs). The transcript profiles reflected the known somatostatin actions on the growth hormone/insulin-like growth factor 1 (GH/IGF-1), glucagon/insulin axes and on cell proliferation. However, the compound affected significantly the transcript levels of other related genes like insulin-like growth factor 2 (IGF-2) in the pituitary and kidneys. This could be a candidate biological marker (biomarker) of drug efficacy provided that the change in protein biosynthesis would be reflected in an easily accessible tissue like the blood. Other known effects of somatostatin and agonists on growth factors, cells of the immune system and the cardio-vascular and renal functions were also reflected by the changes in the profiles of these classes of genes after SOM230.
- Origin of tissue and processing. Male and female cynomolgus monkeys received subcutaneously SOM230 (100 µg/animal/day) or the vehicle for 14 days. On
day 15, all animals were sacrificed and tissues for RNA extraction were immediately snap frozen and kept at -80° C until processing.TABLE 18 Origin of Tissues Used for Analysis Tissue Sample Animal or sample no. Sex Tissue/ organ Compound Dose(µg/animal/day) x547e W62405 Male Brown fat SOM230 100 x548e W62406 Male Brown fat SOM230 100 x549e W62425 Female Brown fat SOM230 100 x550e W62426 Female Brown fat SOM230 100 x673e W62401 Male Brown fat Control 0 x675e W62421 Female Brown fat Control 0 x676e W62422 Female Brown fat Control 0 x857e W62501* Male Brown fat Control 0 x858e W62502* Male Brown fat Control 0 x859e W62551* Female Brown fat Control 0 x860e W62552* Female Brown fat Control 0 d32e W62551 Female Kidney Control 0 d35e W62502 Male Kidney Control 0 d37e W62552 Female Kidney Control 0 d45e W62501 Male Kidney Control 0 x407e W62401 Male Kidney Control 0 x408e W62402 Male Kidney Control 0 x409e W62421 Female Kidney Control 0 x410e W62422 Female Kidney Control 0 x521e W62405 Male Kidney SOM230 100 x522e W62406 Male Kidney SOM230 100 x523e W62425 Female Kidney SOM230 100 x524e W62426 Female Kidney SOM230 100 x401e W62401 Male Liver left lateral lobe Control 0 x402e W62402 Male Liver left lateral lobe Control 0 x403e W62421 Female Liver left lateral lobe Control 0 x404e W62422 Female Liver left lateral lobe Control 0 x517e W62405 Male Liver left lateral lobe SOM230 100 x518e W62406 Male Liver left lateral lobe SOM230 100 x519e W62425 Female Liver left lateral lobe SOM230 100 x520e W62426 Female Liver left lateral lobe SOM230 100 x529e W62405 Male Pancreas SOM230 100 x530e W62406 Male Pancreas SOM230 100 x531e W62425 Female Pancreas SOM230 100 x532-2e W62426 Female Pancreas SOM230 100 x641e W62401 Male Pancreas Control 0 x642e W62402 Male Pancreas Control 0 x645e W62421 Female Pancreas Control 0 x646e W62422 Female Pancreas Control 0 x413e W62401 Male Pituitary gland Control 0 x414e W62402 Male Pituitary gland Control 0 x415e W62421 Female Pituitary gland Control 0 x513-2e W62405 Male Pituitary gland SOM230 100 x514e W62406 Male Pituitary gland SOM230 100 x515e W62425 Female Pituitary gland SOM230 100 x516e W62426 Female Pituitary gland SOM230 100 x425e W62401 Male Spleen Control 0 x426e W62402 Male Spleen Control 0 x427e W62421 Female Spleen Control 0 x428e W62422 Female Spleen Control 0 x525e W62405 Male Spleen SOM230 100 x526e W62406 Male Spleen SOM230 100 x527e W62425 Female Spleen SOM230 100 x528e W62426 Female Spleen SOM230 100 d33e W62501 Male Thyroid Control 0 d40e W62551 Female Thyroid Control 0 d43e W62502 Male Thyroid Control 0 d48e W62552 Female Thyroid Control 0 x443e W62401 Male Thyroid Control 0 x445e W62421 Female Thyroid Control 0 x446e W62422 Female Thyroid Control 0 x505e W62425 Female Thyroid SOM230 100 x506e W62426 Female Thyroid SOM230 100 x507e W62405 Male Thyroid SOM230 100 x508e W62406 Male Thyroid SOM230 100 - RNA expression profiling was conducted by means of the HG-U95A gene expression probe array (Affymetrix; Santa Clara, Calif., USA), containing more than 12,600 probe sets interrogating primarily full-length human genes and also some control probe sets. The assays were conducted according to the recommendations of the manufacturer. Briefly, total RNA was obtained by acid guanidinium thiocyanate-phenol-chloroform extraction (TRIzol®, Invitrogen Life Technologies, San Diego, Calif., USA) from each frozen tissue section. The total RNA was then purified on an affinity resin (Rneasy®, Qiagen) and quantified. Double stranded cDNA was synthesized with a starting amount of
appproximately 5 µg full-length total RNa using the Superscript® Choice System (Invitrogen Life Technologies, Carlsbad, Calif. USA) in the presence of a T7-(dT)24 DNA oligonucleotide primer. Following synthesis, the cDNA was purified by phenol/chloroform/isoamylalcohol extraction and ethanol precipitation. The purified cDNA was then transcribed in vitro using the BioArray® High Yield RNA Transcript Labelling Kit (ENZO, Farmingdale, New York USA) in the presence of biotinylated ribonucleotides form biotin labelled cRNA. The labelled cRNA was then purified on an affinity resin (Rneasy®, Qiagen), quantified and fragmented. An amount of approximately 10 µg labelled cRNA was hybridized for 16 hours at 45°C to an expression probe array. The array was then washed and stained twice with streptavidin-phycoerythrin (Molecular Probes, ) using the GeneChip® Fluidics Workstation 400 (Affymetrix, Santa Clara, Calif. USA). The array was then scanned twice using a confocal laser scanner (GeneArray® Scanner, Agilent, Palo Alto, Calif. USA) resulting in one scanned image. This resulting ".dat-file" was processed using the MAS4 program (Affymetrix) into a ".cel-file". The ".cel file" was captured and loaded into the Affymetrix GeneChip® Laboratory Information Management System (LIMS). The LIMS database is connected to a UNIX Sun Solaris server through a network filing system that allows for the average intensities for all probes cells (CEL file) to be downloaded into an Oracle database (NPGN). Raw data was converted to expression levels using a "target intensity" of 150. The data were evaluated for quality control and loaded in the GeneSpring® software 4.2.4 (Silicon Genetics, Calif. USA) for analysis. - On the human Affymetrix HGU95Av2 chip, probe sets for individual genes contain 20 oligonucleotide pairs, each composed of a "perfect match" 25-mer and a "mismatch" 25-mer differing from the "perfect" match oligonucleotide at a single base. After probe labelling, hybridization, and laser scanning, the expression level was estimated by averaging the differences in signal intensity measured by oligonucleotide pairs of a given probe (AvgDiff value). The fold changes and directions were calculated for selected genes, from the differences of the AvgDiff values between control and treated.
- To identify genes that were impacted by SOM230, the dataset was initially filtered to exclude in a first wave of analysis, genes whose values were systematically in the lower expression ranges where the experimental noise is high (at least 80 in a number of assays corresponding to the smallest number of replicas of any assay point). In a second round of selection a threshold p-value of 0.05 (based on a t-test) identified differences between treated and control based on a two component error model (Global Error Model) and, whenever possible, with a stepdown correction for multi-hypothesis testing (Benjamini and Hochberg false discovery rate). The decision to keep or reject a specific gene was based on the conjunction of numerical changes identified by comparative and statistical algorithms and the relationship to other modulated genes that point to a common biological theme. The weight of this relationship was assessed by the analyst through a review of the relevant scientific literature.
- For the assay analysis described herein: (1) The increase and decrease in expression referred to the RNA expression level unless specifically stated. (2) If there were multiple probe sets representing the same gene, the probe set designed for sense target was favored. (3) The changes in gene expression indicated that a pathway, a cellular activity or component represented by an individual gene might be impacted. Understanding the functional implication is dependent on the information available on the biological context of the transcript level change (gene function, physiological variation, other gene changes, tissue, compound). RT-PCR is used to identify the extent of absolute change in mRNA levels, but this method in general does not add more information on the relevance of the transcript level changes.
- Among the 12,600 genes per chip, about 100 genes were found to reflect the compound signature in a particular tissue. For clarity, they were divided in different classes and subdivided, with many overlaps, into functional categories in the following TABLE.
TABLE 19 SOM230 Gene Expression Profiling CLASS PITUITARY BROWN FAT PANCREAS SIGNAL TRANSDUCTION 1) Phophatidyl inositol and related pathways/PKC, phospho- lipases •IP-4-phosphatase, type • PI-3-kinase regulatory •IP-1- phosphatase 1, isoform b ↓x2 subunit, polypeptide 2↑x2.5 • PI-3-kinase,catalytic, α (p85 β) ↓x3.5 • PI-4-kinase, polypeptide ↓x3 • PI glycan, class F ↓x2 catalytic, •PI-3-kinase, catalytic, δ •PLCβ4 ↑ x2 αpolypeptide ↑x1.5 polypeptide • PI glycan, class L ↑x3.5 •PL A2, group IVC ↓x2 (cytosolic, calcium- • 1-PI-4-phospahate 5- independent) ↑ x1.5 kinase isoform C ↓x1.5 -PI transfer protein, β ↓ x 2.5 • PLCγ1 ↓1.5 • PKC inhibitor ↑x2 •IP3 receptor, type 1 ↑ x1.5 2) Other calcium/ calcineurin/ calmodulin dependent pathways and associated proteins • Calcium/calmodulin- dependent protein kinase I ↑x2.5 • Calcium/calmodulin- dependent protein kinase I ↓ x3.5 • Receptor (calcitonin) activity modifying protein 2 precursor ↑x3.53) Ras/MAPK kinase/ERK kinase related pathways and adaptor proteins • Rab • Ras homolog gene • SH3 domain geranylgeranyltransferase, family, member G (rho G) binding glutamic α subunit ↓x1.5 • MAPKAPK 3 acid-rich protein • Rab3 GTPase-activating • MAPKK1 • MAPKAPK 3 protein, non catalytic • MAPK 8• Ras like GTPase subunit ↓x2 • RAB6, member RAS • RaP2 interacting • SHB adaptor protein (a oncogene family protein 8 Src homology 2 protein)• Adaptor-related protein ↓ x2.5 complex 3, σ1 subunit • MAPKKK5 ↑x2 • Ras-related nuclear • Rab geranyltransferase, protein βsubunit ↑ x2 • Rab acceptor 1• RAB 5C, member RAS (prenylated) oncogene family ↑ x3 • RAB 2, member RASoncogene family • IQ motif containing GTPase activating protein 2 4) JAK/STAT pathway and related kinases • STAT 1, 91kδ ↓ x2•JAK 3 • STAT 5B • JAK 1 ↑x2• STAT 1, 91kδ5) Protein tyrosine phosphatases/other phosphatases • Dual specificity • PP 2, regulatory subunit• STAT 2 PTP δphosphatase 8 ↓ x3 x3B (B56), γ isoform ↑ x1.5 • PP 1, regulatory• Phosphatase and tensin • PP 5, catalytic subunit(inhibitor) subunit 8homolog (mutated in ↑ x2.5 • PP 2A, catalytic multiple advanced cancers • Dual specificity PP subunit B' 1) ↓x3.5 MAP-5 ↑ x2.5 • PP 1A (formerly • PTP, receptor type, T 2C), magnesium- ↑ x2 dependent, α isoform • PP 1, regulatory• PP 2A, regulatory (inhibitor) subunit 5subunit B' ↑x3.5 • Dual specificity phosphatase 8 6) Other protein kinases and associated binding proteins • Arg PTK-binding • PTK 9-like (A6-related • Protein kinase protein ↓ x2.5 protein) (c AMP-dependent, •PTK A kinase (PRKA) catalytic), inhibitor γ anchor protein 1• Serine/threonine • cAMP-dependent protein kinase protein kinase R1-β • Receptor PTK regulatory subunit • Serine/threonine • Ribosomal protein S6 kinase 11 (Peutz- kinase, 90kD, polypeptide Jeghers syndrome) • Tyrosine kinase • Ribosomal protein S6 kinase, 90kδ, polypeptide 3 7) Adenylate/guanylate cyclases and related pathways • Soluble adenylyl cyclase ↓ x2 CELL SURFACE RECEPTORS 1) G-protein coupled receptors and related binding proteins/ G proteins • GTP-binding protein (G • G α inhibiting activity • G protein-coupled protein), q polypeptide polypeptide 3 interacting receptor 39 ↓x1.5 protein ↓x5 • G protein-coupled • GTP-binding protein • G protein-coupled receptor 49like-1 ↓ x3 receptor 1↓x2.5 • G protein-coupled • G-protein coupled • Guanine nucleotide receptor 3 receptor 49 ↓ x2binding protein (G • Regulator of G- • G protein-coupled protein), β polypeptide 3 protein signalling 10 receptor, family C, group ↑x2.5 • GTP-binding 5, member B ↑ x2 • SSTR3↑x6.5 protein • GTP-binding protein 11 • Endothelial • SSTR2 ↓x1.5 ↑ x2.5 differentiation, • Receptor tyrosine sphingolipid G-protein- kinase-like orphan coupled receptor, 5 ↑x2.5 receptor 2 ↑x2• ATP(GTP)-binding protein ↑x1.5 • G-protein coupled receptor 9 ↑x2.5 • Regulator of G-protein signalling 9 ↑x2 -SSTR3 ↑x3 2) Growth factors, their receptors and related binding proteins • FGFR 2 ↓ x2• Fms-related tyrosine •Smad 3 ↓ x1.5 • EGFRBP 2 ↓ x1.5kinase 1 (VEGF/ vascular • G-CSF protein ↓ x2 • Fms-related tyrosine permeability factor • PDGFR α ↑ x2.5 kinase 1 (VEGF/vascular receptor) ↓ x4.5 • PDGFR, permeability factor • EGF receptor pathway α polypeptide ↑ x1.5 receptor) ↓ x1.5 substrate 15 ↓ x2• Catenin (cadherin- • CSF 1 (macrophage) associated protein), ↓ x2 α 1 (102kD) ↓ x1.5 • Cadherin 13, H-cadherin • PDGFβ ↓ x2 (heart) ↓ x2 • GFR bound protein 10• Cadherin F1B ↓ x4 ↑ x 1.5 • Endothelial cell GF 1• Butyrate response factor (platelet derived) ↓ x2 2 (EGF-response factor 2) • TGF β -activated kinase- ↑ x3 binding protein 1 ↑ x2.5 • VEGF B ↑ x1.5 • CSF 3 receptor (granulocyte) ↑ x3 • TGF β 3 ↑ x2.5 • Cadherin 5, VE-cadherin (vascular epithelium) ↑ x3 • VGF nerve growth factor inducible ↑ x2 • IL 3 (CSF, multiple) ↑ x2 • IL 7R precursor ↑ x2 3) Glutamate receptor and related binding proteins • GLUR 2, precursor ↑ x1.5• GLUR, metabotropic 1 ↑ x2 • GLUR precursor, flip isoform ↑ x3 ATP-DEPENDENT TRANSPORT PROTEINS Ion channels and related pathways • K+ channel, subfamily • Ca++ channel, voltage • K+ voltage-gated K, member 3 (TASK) dependent, α 1H subunit channel, KQT-like ↓ x4 ↑ x3 subfamily, member3 • K + voltage-gated • G protein-activated ↓ x2.5 channel, Shab-related inwardly rectifying K+ • Ca++ channel, subfamily, member 1 ↓ x2channel ↑ x3.5 voltage dependent, α • ATPase, H+/K+ 1F subunit exchanging, α polypeptide ↓ x4.5 ↓ x5 • Na+ channel, • ATPase, Na+/K+ voltage-gated, type I, transporting, α 2 (+) β polypeptide ↑ x2 polypeptide ↑ x2.5 • ATPase, Na+/K+ transporting, β 3 polypeptide ↑ x2.5 • ATPase, Ca++ transporting cardiac muscle, slow twitch 2↑ x1.5 • Putative Ca++ transporting ATPase ↑ x2 CELL BIOLOGY/ SPECIALIZED FUNCTIONS 1) Neuromediators/ neuromodulators and related pathways • Cholinergic • Dopamine receptor D3 ↑ receptor,nicotinic, x2.5 β polypeptide 4 ↓ x2 • Adrenergic, β-3-, • Cholinergic receptor, receptor ↑ x2.5 muscarinic 3 ↓ x3 • Brain cannabinoid receptor 1 ↑ x2 • GABA- B R 1, isoform aprecursor ↑ x1.5 2)Pancreatic/ gastro- intestinal secretions and related pathways • Cholecystokinin Chymotrypsin-like receptor ↓ x4.5 ↑ x3.5 • Gastrin receptor ↓ x2 • Gastrin-releasing peptide receptor ↓ x5 3) Hormones and related pathways • IGF-2 ↓ x1.5 • THR interactor 10 ↓ x3• CRHR 1 ↓ x2• Thyroid transcription • THR interactor 12 • THR binding factor 1 ↑ x2.5 ↓ x1.5 protein • Glucagon receptor ↑ x7 • IGF-1 ↓ x1.5 ↓ x2 • IGFBP, acid labile • IGF-binding protein 4 • THR interactor 10subunit ↑ x3.5 ↓ x2 ↑ x2.5 • Adrenomedullin ↑ x2.5 • IRS (insulin receptor • IGF-1 ↑ x4.5 • ANP (atrial natriuretic substrate) 2 ↑ x2.5 • Prostacyclin peptide precursor B) ↑ x2 • T3 receptor ↑ x2 synthase • SSTR3 ↑ x3 • SSTR3 ↑ x6.5 ↑ x2 • Oxytocin, prepro- • SSTR2 ↓ x1.5 (neurophysin I) ↑ x2.5 • FSHR ↑ x2.5 4) Cytoskeletton and associated proteins • Thrombospondin-p50 • Capping protein (actin • Integrin α 2b ↓ x2 filament), gelsolin-like precursor ↑ x1.5 • CD36 antigen ↓ x2 ↓ x2.5 • Actin related protein 2/3complex, subunit 1A (41kD) ↓ x2.5 5) Enzymes • Coagulation factor • Thrombospondin 2XIIIAI subunit precursor ↑ x3.5 ↓ x5 IMMUNITY • TNFR-associated factor • IFN γ-inducible protein • IL 1receptor 2 ↓ x4 30 (IP30) ↓ x3.5 antagonist ↓ x2 • TNFR subfamily, • Pentaxin-related gene, • LT b4 receptor member 14; herpesvirus rapidly induced by IL-1 (chemokine receptor entry mediator ↓ x2.5 ↓ x7.5 like-1) ↓ x1.5 • IFNR2 (α, β and ω) • IFN induced • Phosphotyrosine ↓ x2.5 transmembrane protein 1independent ligand • CC chemokines STCP-1 ↑ x2.5 p62B for the Lck SH2 ↑ x1.5 • TNF type 1 receptordomain B-cell • IFN stimulated gene associated protein ↓ x2 isoform ↓ x2 ↑ x3.5 • IL 5R, α↑ x2.5 • IFN regulatory • IFNγ-inducible protein • CD2 antigen factor 3 ↑ x5 30 (IP30) ↑ x1.5 (cytoplasmic tail)-binding protein 2 ↑ x2.5CELL CYCLE • Forkhead box O3A • G1 to S phase transition • Cyclin T2 ↓x2 ↓ x1.5 ↓ x1.5 • Cyclin D1 ↑ x2 • Cyclin F ↓ x2 • Extra spindle poles, • Cdki 1C ↑ x2 • Core-binding factor, runt S. cerevisiae, homolog of domain, α subunit 2;↓ x2.5 translocated to, 1; cyclin • PCNA ↓ x2.5 D-related ↑ x3 • Follistatin-like 3 • S-phase response glycoprotein ↑ x3 (cyclin-related) ↑ x2 • Cyclin T2 ↑ x2.5 • Cell division cycle 25B ↑ x5 • Cyclin D3 ↑ x2.5 • Cdki2C (p18, inhibits CDK4) ↑ x2 • Cdki2D (p19, inhibits CDK4) ↑ x1.5 • Forkhead box H1 ↑ x2 APOPTOSIS • BCL2-associated • Neuroblastoma ↓ x2.5 • BCL2/adenovirus athanogene ↑ x2 • Neuroblastoma E1B 19kD-intracting • BCL2-antagonist of cell apoptosis-related RNA protein 1, isoform death ↑ x2 bindingprotein ↓ x3 BNIP1-a ↓ x1.5 • Bax γ ↑ x1.5 • Apotosis-associated • Neuroblastoma • BCL2/adenovirus E1B tyrosine kinase ↑ x3.5 apoptosis-related 19kD-interacting protein 3 RNA binding protein ↑ x1.5 ↓ x3 • Programmed cell death 6 ↑ x1.5 • Neuroblastoma- amplified protein ↑ x1.5 TABLE 20 SOM230 Gene Expression Profiling (Continued) CLASS KIDNEY LIVER SPLEEN THYROID SIGNAL TRANSDUCTION 1) Phophatidyl inositol and related pathways/PKC, phospholipases • PI-3- kinase, • PI transfer protein, • PI-3-kinase, • IP3 receptor catalytic, α β ↓ x1.5 catalytic, α type 3 ↓ x1.5 polypeptide ↓ x3 • 1- PI-4-phosphate polypeptide ↓ x2.5 • PLC, γ 1 5-kinase isoform C • PI-3- kinase, class (formerly ↓ x2 3 ↑ x2 subtype 148) • PLA2 ↑ x2 ↓ x2 Glycosylphosphatid • PKC, binding • PIP 5- ylinositol specific α T x2 phosphatase phospholipase D1 protein • IP-4-phosphatase, type IV ↓ x3 ↓ x1.5 type 1, isoform b• DAG 1• PKC, τ ↓ x1.5 ↑ x2 kinase, α • PLC, γ 1 (formerly • PI-3-kinase, class (80kD) ↓ x4 subtype 148) ↑ x2 2, β polypeptide • PKC substrate ↑ x1.5 80K-H ↑ x1.5 • Phosphatidyl • PLA2, group IIA inositol glycan, class (platelets, synovial B ↑ x1.5 fluid) ↑ x5.5 • PI transfer protein ↑ x3.5 • Nck, Ash and PLC γ binding protein NAP4 ↑ x3.5 • DAG kinase, α (80kD) ↑ x3 • DAG kinase, δ (130kD) ↑ x1.5 • IP 5-phosphatase ↑ x2 2) Other calcium/ calcineurin/ calmodulin dependent pathways and associated proteins • PP 3 (formerly • Calcium/ • Nuclear factor of • FKBP- 2B), catalytic calmodulin- activated T-cells, associated subunit, β isoform dependent protein cytoplasmic, protein ↓ x2.5 (calcineurin A β) kinase kinase 2, βcalcineurin- • Calmodulin- ↓ x2 ↑ x3 dependent 1 ↓ x5 dependent PK • Calmodulin 3 • Calmodulin 2• Calmodulin I IV (CaM-kinase (phosphorylase (phosphorylase (phosphorylase IV) ↓ x7.5 kinase, δ) ↓ x1.5 kinase, δ) ↑ x2 kinase, δ) ↑ x2 • Calcium/ • Calcium/ • Receptor • Calmodulin 2calmod-ulin- calmodulin- (calcitonin) activity (phosphorylase dependent PK dependent protein modifying protein 1 kinase, δ) ↑ x1.5 IV ↓ x7.5 kinase kinase 2 βprecursor ↑ x1.5 • Calcium/ • c-AMP ↑ x1.5 calmodulin- responsive dependent protein element binding kinase (CaM kinase) protein 1 ↓ x2II β ↑ x2 • Calcium/ calmodulin dependent protein kinase 1 ↓ x2 3) Ras/MAPK kinase/ERK kinase related pathways and adaptor proteins • Ras suppressor • Ras association • Rho/rac guanine • Ras homolog protein I (RaIGDS/AF-6) nucleotide exchange gene family, • Rho GTPase domain family I factor (GEF) 2 member B activating protein 4 • Rho GDP • Rab • Ras-GTPase • MAPKK 5dissociation geranylgeranyl- activating protein • Rho GTPase inhibitor (GDI) γ transferase • SH3 domain- activating protein 5• Rab • Human rho GDP- binding protein 2• RAB4, member geranylgeranyl- dissociation • Rho-associated, RAS oncogene transferase, α inhibitor 2 (IEF coiled-coil family subunit 8120) containing • RAB interacting • MAPK 10• SHP2 interacting protein kinase 1factor • RAB13, member transmembrane • RAD54 • Realted RAS viral RAS oncogene adaptor (S.cerevisiae)- family • RAS p21 protein like (r-ras) oncogene homolog • Ras homolog gene activator (GTPase • RAB6, member • RAP2A, member family, member G activating protein) 1 RAS oncogene of RAS oncogene (rho G) • SH3 domain family family • RAB2, member binding glutamic • RAB5A, • Human rho GDP- RAS oncogene acid-rich protein like member RAS dissociation family • Neuronal shc oncogene family inhibitor • MAPK 1• MAPKK 1• MAPKK 4 • MAPKK 1• MAKKK 5• SH3 domain • C-src tyrosine kinase • RAB11B, member binding glutamic • MAPK 14 of RAS oncogene acid-rich protein • Rho GTPase- family • MAPK 8activating protein 1• GTPase • Adaptor protein • MAPKK 1• RAB5B, member with pleckstrin • ATP(GTP)- RAS oncogene homology and src binding protein family homology 2 • RAB interacting • MAPKAPK 2domains factor • MAPK 6 • SHP2 • MAPK 6 • Ras-related C3 interacting • KAPKK 5botulinum toxin transmembrane • RAB 30, membersubstrate I isoform adapter RAS Rac 1b • Ras homolog oncogene family • RAB1, member gene family, • RAB 4, member ras oncogene family member H RAS oncogene • RAP1A, member • RaP2 of ras interacting family oncogene family protein 8 • MAPKK 13 • MAPKKKK • RAB5C, • MAP/ERK kinase • RAS guanyl member RAS kinase 4, isoform a relasing protein 2oncogene family (calcium and DAG- • Grb2- regulated) associated binder • Grb2-associated 2 binder 24) JAK/STAT pathway and related kinases • STAT 2, 113kD• STAT 1, 91kδ• JAK 3 • JAK 1• STAT 5B • STAT 6, IL-4 induced • Protein inhibitor of STATX • STAT 1, 91kδ• STAT 3 (acute-phase response factor) 5) Protein tyrosine phosphatases/other phosphatases • PP 1, regulatory• PTP • Dual specificity • PTP σ subunit 7 • PP 2 (formerly phosphatase 8• Phosphatase • PP 1A (formerly 2A), regulatory • Myosin and tensin 2C), Mg-dependent, subunit A (PR 65), phosphatase target homolog 2 α isoform α Isoform subunit 1 • PP 5, catalytic• PTP •PP2A subunit- α • Dual specificity subunit • PP 2A, regulatory • PTP, non receptor phosphatase 9 • PTP, non- subunit B' (PR 53) type 1• PTP, non- receptor receptor type 6 • PP •PTP, type 1• PP 1A 2A, regulatory subunit -β non receptor type • PP 1, regulatory(formerly 2C), • PTP, non- receptor substrate 1 (inhibitor) subunit 8Mg- dependent, type 1• PP 6, catalytic • PTP, receptor α isoform • PTP type IVA, subunit type, N • PTP, receptor member 3 • PTP, receptor • PTP type IVA, type, C • PP5, catalytic type, C member 3 • PTP, receptor subunit • PP 1, regulatory• PP 5, catalytictype, N (inhibitor) subunit 5subunit • Phosphatidid • • PTP σ acid PTP, receptor type, f polypeptide phosphatase (PTPRF), interacting type 2A protein (liprin), α 1• PTP, receptor type, A 6) Other protein kinases and associated binding proteins • Receptor tyrosine • Protein kinase, • Serine/threonine • Serine kinase kinase cAMP-dependent, kinase 14 α • Serine/ • Protein kinase catalytic, inhibitor α • Serine/threonine threonine • Serine/threonine • Tyrosine kinase 2kinase kinase 25 kinase 3 • Protein kinase • Protein kinase, • Serine/ • SNF1-like protein •PTK2 protein AMP-activated, γ 1threonine kinase tyrosine kinase 2 non-catalytic protein kinase • Serine/threonine • Ribosomal protein subunit • Ste-20 related kinase 9 S6 kinase, 90kδ, • Protein kinase, kinase • Membrane- polypeptide 3 cAMP-dependent, • Ribosomal associated kinase • Protein kinase, catalytic inhibitor α protein S6 • Ser-Thr protein cAMP-dependent, • Dual-specificity kinase, 90kδ, kinase related to the catalytic, γ tyrosine-(Y)- polypeptide 3 myotonic dystrophy • Serine threonine phosphorylation • Serine/ protein kinase protein kinase regulated kinase 1A threonine kinase • cAMP-dependent • Dual-specificity 13 (aurora/ protein kinase tyrosine-(Y)- IPL1-like) • RI-β regulatory phosphorylation • Protein- subunit regulated kinase 2tyrosine kinase • Ribosomal protein isoform I • Membrane- S6 kinase, 90kδ, • Serine/threonine associated polypeptide 4 kinase 19 kinase • Serine/threonine • Dual- kinase 25specificity • Fms-related tyrosine-(Y)- tyrosine kinase 3 phosphorylation regulated kinase 2isoform 17) Adenylate/guany- late cyclases and related pathways • Natriuretic peptide • Natriuretic peptide • Adenylate receptor receptor A/ cyclase A/guanylate cyclase guanylate cyclase A activating A (atrionatriuretic (atrionatriuretic polypeptide peptide receptor A) peptide receptor A) precursor ↓ ↑ x2 ↑ x6 x1.5 • Adenylyl cyclase- associated protein ↑ x1.5 CELL SURFACE RECEPTORS 1) G-protein coupled receptors and related binding proteins/G proteins • Guanine • G protein- • Guanine • Guanine nucleotide coupled nucleotide nucleotide binding binding protein receptor 12 binding protein (G protein), (G protein), • G protein- protein 11 α 15 (Gq class) β polypeptide 1coupled receptor • Guanine • G α inhibiting • G protein- kinase nucleotide activity coupled • G protein- binding protein polypeptide 3 receptor 20receptor (G protein), interacting protein • G protein- coupled 35 β polypeptide 3 • Regulator of G coupled • G protein- • G protein- protein signalling receptor 9 coupled coupled • Guanine • G protein- receptor 3 receptor 56nucleotide binding coupled • G protein- • Regulator of protein 11 receptor 39 receptor G-protein • G protein - • G protein- coupled 39 signalling 9 coupled receptor 3 coupled receptor • Regulator of • Guanine • G protein - kinase G-protein nucleotide coupled receptor • G protein- signalling 6 binding protein kinase 1 coupled • Coagulation (G protein), α • Ca++-sensing receptor 15factor II 11 (Gq class) receptor • Guanine (thrombin) • G protein- (hypocalciuric nucleotide receptor-like 1 coupled hypercalcemia 1,binding protein precursor receptor 35 severe neonatal (G protein), β • Angiotensin hyperparathyroid polypeptide 2 receptor- ism) • G protein- like 1 ↑ x1.5 • G protein- coupled • SSTR2 ↑ x2 coupled receptor, receptor 35• GDP family C, group 5,• SSTR 3↑ x3 dissociation member B • SSTR 2↑ x2inhibitor • Guanine nucleotide binding protein 11 • 5-hydroxy- tryptamine 7 receptor isoform b • Develop- mentally regulated • GTP-binding protein 2• Endothelial differentiation related factor I ↑ 2) Growth factors, their receptors and related binding proteins • GFR- bound • Fms-related • EGF (β- • COL1A1 and protein 7 ↑ x2 tyrosine kinase urogastrone) ↓ x2 PDGFB fusion • GFR-bound 1 (VEGF /vascular • TGF induced transcript ↓x6 protein 14 ↑ x2 permeability factor protein ↑ x1.5 • Egf-like • CSF-1 receptor, receptor) ↓ x1.5 • VEGF ↑ x1.5 module formerly Mc • GFR- bound • PDGF α containing, Donough feline protein 2 ↓ x2.5 polypeptide ↑ x2.5 mucin-like, sarcoma viral (v- • Bone-derived GF • PDGFR, α hormone fms) oncogene ↑ x3 polypeptide ↑ x1.5 receptor-like homolog T x2.5 • Growth • TGFβ receptor III sequence 1 ↓ x5 • IL-7 R precursor differentiation factor (betaglycan, 300kD) • PDGFR α ↑ x2 1 ↑ x3 ↓ x1.5 ↓ x3 • PDGFF, α • TGF, β1 ↓ x1.5 HGF activator • Fms-related polypeptide ↑ x1.5 • TGFβR III • inhibitor precursor ↑ tyrosine kinase • TGF, β 1 ↑ x1.5(betaglycan, 300kδ) x1.5 1 (VEGF/ ↓ x2 vascular • EGF (β- permeability factor urogastrone) ↓ x2.5 receptor) ↓ x2 • EGFR (avian erythroblastic • PDGF- leukemia viral (v- associated T erb-b) oncogene Protein x2 homolog) ↑ x2 • PDGFR β • Butyrate response ↑x2 factor 2 (EGF- • Cadherin 13, response factor 2) ↑ H-cadherin x2 (heart) • FGFR 2 (bacteria- ↑ x2 expressed kinase, keratinocyte growth factor receptor, craniofacial dysplasia) ↑ x2 • TGFβ activated kinase-binding protein 1 ↑ x2.5• GCSF ↑ x3.5 • EGF-like repeats and discoidin I-like domains 3 ↓ x15 • PDGFR, α polypeptide ↑ x2 • PDGF, α polypeptide ↑ x1.5 3) Glutamate receptor and related binding proteins • Glutamate • Glutamate • Glutamate receptor receptor, receptor, metabotropic 2metabotropic 4 metabotropic 2precursor ↓ x3 ↑ x1.5 precursor ↓3.5 ATP-DEPENDENT TRANSPORT PROTEINS Ion channels and related pathways • Solute carrier • Ca++ channel, • K + voltage-gated • K+ voltage- family 6 voltage-dependent, channel, shaker- gated channel, (neurotransmitter P/Q type, alpha 1A related subfamily, shaker-related transporter, creatin), subunit ↓ x2.5 member 3 ↓ x3 subfamily, member 8 ↓ x3• ATPase, H+/K+ • Solute carrier member 3 • Na+ channel, exchanging, beta family 9 (Na+/H+ ↓ x4.5 nonvoltage-gated 1, polypeptide ↓ x2 exchanger) isoform • ATPase, β (Liddle syndrome) • Solute carrier 3 regulatory factor 1Ca++ ↓x2 family 9 (sodium/ ↑ x10.5 transporting, • Ca++ channel, hydrogen • ATPase, Na+/K+ cardiac muscle, voltage-dependent, exchanger), isoform transporting, β1 fast twitch 1α IH subunit ↑ x2 3 regulatory factor 1polypeptide ↑ x2.5 ↓ x4.5 • K+ voltage-gated ↑ x11.5 • K+ large channel, Shaw- • Solute carrier conductance related subfamily, family 11 Ca++-activated member 3 ↑ x2.5 (Na+/phosphate channel, subfamily • Solute carrier symporters), M, β member 1family 9 (Na+/ H+ member 1 ↑ x2.5 ↑ x2.5 exchanger) isoform • Ca++ channel, 3 regulatory factor 1voltage-dependent, ↑ x2 α 2/ δ subunit 2↑ x1.5 • Ca++ channel, dependent, voltage- α 2/δ subunit 1 ↑ x2CELL BIOLOGY/ SPECIALIZED FUNCTIONS 1) Neuromediatorsl neuromodulators and related pathways • δ sleep inducing • GABA (A) • Dopamine • GABA (A) peptide, receptor, γ2 receptor D4 ↓ x2 receptor, immunoreactor ↑ precursor ↑ x4 • Adrenergic α-2C- γ 2 precursorx2.5 • Dopamine receptor ↓ x1.5 • Opioid receptor, receptor D2 ↑ x3.5 ↓ x2 • Brain δ1 ↑ x2.5 • GABA(A) • β adrenergic cannabinoid • GABA (A) receptor-associated receptor receptor 1 receptor, γ2 protein ↑ x1.5 kinase 1 ↑ x3↓ x2 precursor ↑ x2 • Dopamine • GABA (B) • Acetylserotonin receptor D3 ↑ x2 receptor 1, O-methyl • δ sleep inducing isoform a transferase-like ↓ x3 peptide, precursor • LIF (cholinergic immunoreactor ↑x2.5 differentiation ↑ x2.5 • Cannabinoid factor) ↑ x2 •5- hydroxytrypt receptor 2 • Dopamine amine (serotonine) (macrophage) receptor D2 ↑ x4.5 receptor 6 ↑ x2.5 ↑ x3 • Phosphatidyl ethanolamine N-methy- ltransferase ↑ x2 • Adrenergic, α -2C-, receptor ↓ x2.5 2) Pancreatic/ gastro-intestinal secretions and related pathways • Gastric inhibitory •Chole- polypeptide receptor cystokinin B ↑x2 receptor ↓ x3 • Gastric inhibitory polypeptide 1 receptor ↓ x2 3) Hormones and related pathways • Angiotensin • Insulin promoter • PTHR 1 ↓ x2.5• TSHR ↓ x2 receptor factor 1, • Arginine • IGF-1 ↓ x 1.5 1B ↓ x1.5 homeodomain vasopressine • Solute carrier • Glucocorticoid transcription factor receptor 1B ↑ x2 family 21 (PG receptor DNA ↓ x1.5 • IGFBP6 ↑ x2.5 transporter), binding factor I • IGF-2 ↓ x2.5 • IGF-1 ↑ x1.5 member 2 ↑ x2↓ x4.5 • Corticosteroid • Insulin receptor binding globulin ↓ x3 precursor ↑ x2 • THR, a (avian • THR interacting erythroblastic protein 15 ↑ x1.5 leukemia viral (v- - IGFBP2 ↑ x2 erb-a) oncogene • Arginine homolog) ↑x1.5 vasopressine • Arginine receptor 2 ↑ x2.5 vasopressin • THR sulfo (neurophysin II, transferase ↑ x2.5 antidiuretic • Glucacon receptor hormone, diabete ↑ x5 insipidus, neurohypophyseal) ↑ x2 • Vasopressin- activated calcium- mobilizing receptor- 1 ↓ x2 • Corticotropin releasing hormone receptor type 2 beta isoform ↑ x1.5 • IGF-2 ↓ x2 • IGF-1 ↑ x2.5 • IGFBP2 ↑ x1.5 • THR-associated protein, 240kδ subunit ↓ x1.5 • THR binding protein ↑x1.5 • PG-endoperoxide synthase 1 (prostaglandin G/H synthase and cyclooxygenase) ↓ x3.5 • Adrenomedullin ↑ x1.5 • SSTR 3↑ x3 • SSTR 2↑ x24) Cytoskeletton and associated proteins • VWF precursor ↑ x2 • Vasodilatator- stimulated phosphoprotein ↑ x2 • VWF precursor ↑ x2 5) Enzymes • Thrombo- spondin 2 ↑ x2 • Pro-platelet basic protein (includes platelet basic protein, β- thromboglobuli n, connective tissue-activating peptide III, neu) 2 ↑ x3.5 IMMUNITY • TNF, α-induced • TNF-α converting • IFN-inducible • LTB4 protein 3 enzyme ↓ x2 RNA-dependent receptor ↓ x1.5 • IFN-stimulated protein kinase (chemokine • IRF5 ↑ x2 protein, 15kDa ↓ x2 ↑ x2.5 receptor-like 1) • Putative • IFN-related • TNF (cachectin) ↓ x1.5 chemokine receptor; developmental ↑ x2 • IL2-inducible GTP-binding protein regulator 2 ↓ x1.5 (ligand) • TNF (ligand) T-cell kinase ↑ x2 • IFN-inducible superfamily, ↓ x12 • TNFR RNA-dependent member 13 ↑ x2.5 • P56lck ↓ x18 superfamily, protein kinase ↑ x4 • IL 1 receptor- like• RAG1 ↓ x18 member 12 ↑ x2 • IL2 R, γ chain, 1 ↑ x2 • IFNγ precursor ↑ x2.5 • IFNγ responsive responsive • IFN regulatory transcript transcript factor 5 ↑ x2.5 ↑ x2 ↓ x1.5 • Bruton • LTb4 (chemokine • SH2 domain agammaglobulinemi rceptor-like 1) ↑ x3 protein 1A, a tyrosine kinase • Putative Duncan's ↑ x1.5 chemokine receptor; disease • B lymphoid GTP-binding protein (lymphoprolifer ative syndrome) tyrosine kinase ↑ x2.5 ↓ x7.5 ↑ x3.5 • IFNγ receptor 2 ↑receptor 2 ↑• CD2 • IFN γ responsive x1.5 antigen • CD2 antigen transcript ↑ x1.5 (IFNγ transducer 1) (p50), sheep red • INF (ligand) • TNFR blood cell superfamily, superfamily, superfamily, receptor member 10↑ x1.5 member 12 ↑ x.15 ↓ x7.5 -TCR ζ chain • IFN-induced • IL-8 receptor type - TCR ζ chain precursor leucine zipper B ↑ x1.5 ↓ protein ↑x15 • IFN regulatory factor 2 ↑ x3.5x5.5 • RAG2 ↓ x5 IMMUNITY • Signalling lymphocytic (Continued) activation molecule ↓ x4.5 • Flt3 ligand ↓ x4.5 • Lymphocyte specific protein tyrosine kinase ↓ x4 • Chemokine (C-X-C motif), receptor 4 (fusin) ↓x3 • Transcription factor 7 (T-cell specific, HMG- box) ↓ x 16.5 • IL9 receptor ↓ x2 • RANTES ↑ x10.5 • CD2 antigen (cytoplasmic tail)- binding protein 2↑ x3.5 • IFNγ - inducible protein 30 ↑ x3.5 • IFNα-inducible protein 27 ↑ x3 • TNF (ligand) superfamily member 10↑ x2 CELL CYCLE • Cdk (CDC2- • Cdki 2D (p19, • Cyclin I ↓ x1.5 • Cdc-like 5 like) ↓ x2 inhibits CDK4) • S-phase kinase- (cholinesterase-related • Growth arrest- ↓ x2.5 associated protein cell division controller) ↓ specific 6 ↑ x1.5 • Cdk like-2 ↓ 1A (p19A) ↑ x2 x2 • Cdk 5,x2 • Cdk 6 ↑ x3 • Cdk (CDC2-like) ↓ x9 regulatory subunit • Cdk5, • Cdk5, • Cdk 5, regulatory2 (p39) regulatory regulatory subunit subunit I (p35) ↓ x5 ↑ x1.5 subunit 1 ↑ x2.51 (p35) ↑ x2 • Growth arrest-specific • CDC37 (cell • CdkilA • Cyclin D2 ↑ 1 ↓ x2.5 division cycle 37,(p21/Cip1) ↑ x6 x1.5 • Cyclin B2 ↓ x2.5 S. cerevisiae, • Cdk like-2 ↓ • S-phase kinase- homolog) ↑ x1.5 x2 associated protein • Cdki 1A (p21, = 1A ↑ x2 Cip 1) ↑ x5 • Cdk 2 ↑ x1.5• Follistatin-like 1 ↑ x1.5 APOPTOSIS • Death effector • BCL2-like 1 • Rb binding protein • Bcl-2 binding domain-containing ↓ x3.5 ↑ x2 component 3 ↓ x3.5 • Rb I (including Caspase 8,• Fas/Apo-1/CD95 osteosarcoma) apoptosis-related ↑ x1.5 ↓ x2 cysteine protease • Death-associated ↑ x2.5 protein 6 • TNF (cachectin) ↓ x2.5 ↑ x2 • Rb binding protein • TNF (ligand) ↑ x2.5 superfamily, • Rb-like 2 (p130) ↑ member 13 ↑ x2.5 x3 • Bcl-2 binding • Fas-activated component 3 serine/threonine ↑ x2.5 kinase ↑ x1.5 • Death-associated protein ↑ x1.5 • Tumour protein p53-binding protein ↑ x1.5 • Rb-binding protein 8 ↑ x1.5 • Programmed cell death 10 ↑ x1.5 - These results show that several signal transduction pathways were affected. They included the phosphatidyl inositol/PKC/phospholipases/calcium-calcineurin-calmodulin pathway, the Ras/MAPK kinase/ERK kinase dependent pathway, the JAK/STAT pathway, and adenylate/guanylate cyclases with their dependent pathways. The changes for the cell surfaces receptors included numerous G-protein coupled receptors, receptors for growth factors and glutamate receptors. The changes in ATP-dependent transport proteins involved ion channels and associated proteins. The compound also affected neuromediators/neuromodulators, pancreatic and gastrointestinal secretions, hormones, cytoskeletal proteins and enzymes/catalysts.
- Examples of genes reflecting several SSTR signalling pathways in the pituitary are shown in TABLE 21. Selected genes from the primary gene lists were produced by a succession of filtering and statistical algorithms (t-test: p value: 0.05). The numerical values correspond to the AvgDiff (see above) of the relevant probe set for each assay with the range of observed values between brackets. Of particular interest in this analysis were the transcript level changes for molecules known to be closely associated with the binding of the natural peptides, SST-14 and SST-28, to the SSTRs.
TABLE 21 Examples of Genes Reflecting Several SSTR Signalling Pathways in the Pituitary GENES CONTROL SOM230
(0.1 mg/animal/14 day)SIGNAL TRANSDUCTION 1) Phophatidyl inositol and related pathways/PKC, phospholipases • IP-4-phosphatase, type 1, isoform b296 (241 to 342) 177 (107 to 232) • PI-3-kinase, catalytic, δ polypeptide 91 (45 to 146) 34 (20 to 67) • PI-3-kinase,catalytic, α polypeptide 72 (26 to 135) 21 (20 to 24) • PI transfer protein, β 125 (93 to 187) 42 (34 to 50) • PKC inhibitor 2,351 (2,135 to 2,755) 3,333 (2,339 to 3,878) • PLC, γ 1 (formerly subtype 148) 111 (100 to 131) 40 (20 to 63) • PKC inhibitor 2,351 (2,1345 to 2,755) 3,332 (2,339 to 3,878) 2) Ras/MAPK kinase/ERK kinase related pathways and adaptor proteins • MAPKKK5 171 (148 to 207) 278 (221 to 351) • Rab geranylgeranyltransferase, α subunit 164 (152 to 173) 104 (70 to 172) • Rab geranygeranyltransferase, βsubunit 230 (187 to 250) 284 (246 to 374) • SHB adaptor protein (a Src homology 2 protein)112 (43 to 190) 38 (20 to 55) • RAB 5C, member RAS oncogene family 72 (20 to 138) 162 (109 to 212) 3) Protein tyrosine phosphatases/other phosphatases • Dual specificity phosphatase 8493 (344 to 625) 170 (67 to 238) • Phosphatase and tensin homolog (mutated in 129 (58 to 228) 36 (20 to 63) multiple advanced cancers 1) • PTP, receptor type, T 58 (41 to 78) 101 (48 to 129) • PP 1, regulatory (inhibitor)subunit 520 75 (60 to 90) 4) Adenylate/guanylate cyclases and related pathways • Soluble adenylyl cyclase 54 (51 to 57) 22 (20 to 27) CELL SURFACE RECEPTORS 1) G-protein coupled receptors • SSTR3 22 (20 to 24) 22 (20 to 24) 57 (20 to 90) 57 (20 2) Glutamate receptor and related binding proteins • GLUR 2 precursor 42 (20 to 86) 59 (20 to 177) ATP-DEPENDENT TRANSPORT PROTEINS Ion channels and related pathways ATPase, Na+/K+ transporting, β 3 polypeptide 292 (246 to 353) 610 (335 to 949) ATPase, Na+/K+ transporting, α 2 (+) polypeptide 86 (52 to 130) 184 (69 to 325) ATPase, H+/K+ exchanging, α polypeptide 128 (50 to 245) 20 K+ channel, subfamily K, member 3 (TASK) 132 (69 to 188) 26 (20 to 43) K+ voltage-gated channel, Shab-related subfamily, 66 (20 to 112) 22 (20 to 31) member 1 Putative Ca++ transporting ATPase 61 (38 to 98) 101 (84 to 112) CELL CYCLE Core-binding factor, runt domain, α subunit 2; 225 (113 to 343) 491 (251 to 677) translocated to, 1; cyclin D-related Forkhead box O3A 497 (447 to 553) 257 (186 to 324) Forkhead box H1 225 (113 to 343) 117 (251 to 677) Cyclin F 198 (171 to 229) 74 (48 to 132) Cyclin D3 187 (173 to 201) 338 (202 to 446) S-phase response (cyclin-related) 91 (88 to 97) 129 (111 to 148) Cell division cycle 25B 40 (20 to 67) 162 (134 to 187) Cdk inhibitor 2C (p18, inhibits CDK4) 81 (58 to 99) 184 (140 to 229) Cdk inhibitor 2D (p19, inhibits CDK4) 198 (171 to 229) 99 (83 to 118) APOPTOSIS BCL2-associated athanogene 216 (207 to 231) 318 (235 to 409) BCL2-antagonist of cell death 44 (33 to 47) 69 (42 to 89) Bax gamma 258 (207 to 297) 326 (221 to 448) BCL2/adenovirus E1B 19kD-interacting protein 3 342 (288 to 401) 458 (388 to 526) Programmed cell death 6 504 (443 to 547) 635 (513 to 747) Neuroblastoma-amplified protein 178 (149 to 210) 237 (201 to 258) - The effects on the growth hormone/ insulin-like growth factor-1 (GH/IGF-1) and glucagon/insulin axes (Macaulay VM, Br J Cancer 65: 311-20 (1992); Pollak MN & Schally AV, Proc Soc Exp Biol Med 217: 143-52 (1998)were reflected in transcript level changes in several organs. The results are shown in TABLE 22. Beside the expected change in IGF-1 transcript level, there was an effect on insulin-like growth factor-2 (IGF-2) as well (in the pituitary and kidneys) that might be useful as a biological marker of SOM230 activity if reflected in the blood. The genes were selected as above in TABLE 21.
TABLE 22 Genes Reflecting the Effects of SOM230 on the GH/IGF and Glucagon/Insulin Axes in Different Tissues ORGANS/GENES CONTROL SOM230 (0.1 mg/animal/14day) PITUITARY IGF-2 126 (40 to 179) 70 (20 to 150) GR 20 109 (51 to 215) IGFBP, acid labile subunit 30 (20 to 49) 83 (20 to 110) SSTR3 22 (20 to 24) 57 (20 to 90) BROWN FAT IGF-1 548 (279 to 810) 389 (315 to 449) IGFBP 4 1410 (916 to 2173) 763 (429 to 1058) IRS 2 48 (20 to 84) 146 (80 to 222) SSTR3 25 (20 to 52) 194 (87 to 248) PANCREAS IGF-1 20 89 (20 to 298) SSTR2 258 (205 to 366) 156 (120 to 210) KIDNEY IR 654 (187 to 1,187) 196 (163 to 265) IGF-2 117 (47 to 176) 49 (20 to 39) IGF-1 65 (24 to 103) 25 (20 to 39) IGFBP2 375 (211 to 625) 563 (457 to 655) SSTR 3 31 (20 to 69) 82 (33 to 120) SSTR 2 74 (20 to 153) 126 (93 to 158) LIVER Insulin promoter factor 1, homeodomain 89 (58 to 160) 42 (23 to 52) transcription factor IGF-2 701 (403 to 961) 269 (224 to 291) IGFBP2 2,722 (1,321 to 3,363) 4,476 (3,191 to 5,422) GR 44 (20 to 82) 80 (70 to 360) SPLEEN IGFBP6 495 (130 to 982) 1,043 (853 to 1,155) IGF-1 72 (42 to 103) 85 (52 to 125) SSTR2 56 (20 to 83) 93 (87 to 95) THYROID IGF-1 91 (20 to 179) 58 (20 to 114) - Other genes of interest affected by SOM230 were the transcript levels of growth factors (PDGF, FGF, EGF, TGFβ), their receptors and factors of angiogenesis (PDGF, VEGF, thrombospondin) involved in tumour growth and spreading (Woltering EA et al., New Drugs 1.5:77-86 (1997)). Also reported for somatostatin and and analogures genes involved in immunity were changed, i.e. cytokines (IL-1, TNF, IFN), regulators of T and B cell genesis and function (CD2 antigen, IL-2 receptor, B-lymphoid tyrosine kinase, IL-2 inducible T cell kinase, p561ck, RAG1, TCRζ chain precursor, RAG2, FLT 3 ligand) (van Hagen PM et al. Eur J Clin Invest 24: 91-9 (1994)), as well as genes involved in blood pressure control and diuresis, i.e. atrial natriuretic peptide and its receptor guanylyl cyclase A, arginine vasopressin and its receptor (Aguilera G et al., Nature 292: 262-3 (1981); Aguilera G et al., Endocrinology 111: 1376-84 (1982); Ray C et al., Clin Sci (Lond) 84: 455-60 (1993); Cheng H et al., Biochem J 364: 33-9 (2002)). A specific gene involved in the control of fat storage is the adrenergic β3 receptor in brown fat (Bachman E et al., Science 297: 843- 45 (2002)).
- Protein products of the above genes are useful as surrogate markers of the biological activity of SOM230, especially the findings for IGF-2 in the pituitary and kidneys.
- To conclude, the gene profiling of monkey tissues treated with SOM230 at sub-therapeutic is a sensitive approach to identify signalling and effector pathways known for somatostatin. The finding of clear transcriptional signatures for this agonist argues for a comparison with gene expression changes induced by Sandostatin®.
- Calcitonins are endogenous regulator of calcium homeostasis and can be used as anti resorptive agents for the treatment of hypercalcaemia-associated disorders. Various calcitonins, including e.g. salmon and eel calcitonin, are commercially available and are commonly employed in the treatment of e.g. Paget's disease and osteoporosis. See,
U.S. Pat. Nos. 5,733,569 and5,759,565 , the contents of which are incorporated by reference. See also,U.S. Pat. Nos. 5,719,122 ,5,175,146 , and5,698,6721 U.S. Pat. Appln. 003015815 . A version of calcitonin (Miacalcin®) is available as a nasal spray. Information regarding the administration of Miacalcin® (calcitonin-salmon) nasal spray is available in the Miacalcin® Prescribing Information (Novartis, November 2002). - Parathyroid hormone (PTH) is a polypeptide of 84 amino acids. Parathyroid hormone regulates borne remodeling and Ca2+ homeostasis. Parathyroid hormone is also a known paracrine activator of ostaoclast differentiation and activity. PTS893 is an analogue of the endogenous parathyroid hormone, in which certain sites of chemical instability are eliminated within N-terminal parathyroid hormone fragments by making appropriate amino acid substitutions at particular residues which results in stable and biologically active human parathyroid hormone fragments. PTS893 [SDZ PTS 893; Leu8, Asp10, Lys11, Ala16, Gln18, Thr33, Ala34 human PTH 1-34 [hPTH(1-34)]] is a 34 amino acid parathyroid analogue that enhances bone mass and biomechanical properties. Kneissel M et al., Bone 28: 237-50 (March 2001); Stewart AF et al., J. Bone. Miner. Res. 15(8): 1517-25 (August 2000); Thomsen JS et al., Bone 25(5):561-9 (November 1999). N-terminal fragments of human parathyroid hormones include hPTH(1-34)OH muteins and hPTH(1-38)OH muteins. PTS893 comprises at least the first 27 N-terminal amino acid units of parathyroid hormone. Preferred parathyroid hormone derivatives are those comprising at least one amino acid unit replaced in one or more of the following positions of the parathyroid hormone sequence: 8-11, 13, 16-19, 21, 22, 29 to 34, particularly 8-11, 16-19, 33 and/or 34. These compounds exhibit desirable bone-forming properties both in vivo and in vitro which are equal to or above the level of natural PTH and its N-terminal fragments. See,
European patent EP 0 672 057published PCT patent application WO 94/02510 - Introduction and summary. The purpose of this EXAMPLE was to evaluate the gene expression changes in cynomolgus monkeys following a two-week subcutaneous treatment with salmon calcitonin (sCT) at 50 µg/animal/day and PTS893 at 5 µg/animal/day to elucidate the mechanisms of action mediating their effects as well as the identification of biomarkers of therapeutic indications. This EXAMPLE is believed to be the first analysis that globally describes the molecular mechanisms of action of salmon calcitonin and a parathyroid hormone analogue by multiorgan-gene-profiling analysis in primates. This is also believed to be the first gene profiling analysis which describes the molecular mechanisms of action of hormonal-mediated bone remodeling by salmon calcitonin and PTS893.
- In this EXAMPLE, salmon calcitonin and PTS993 were both found to have modulating effects on genes affecting the direct, antocrine, paracrine and endocrine regulation of the mesenchymal cell functions such as transforming growth factor betas (TGF-βs), insulin-like growth factors (IGFs), bone morphogenetic proteins (BMPs) and vascular endothelial growth factor (VEGF). Both compounds also regulate the synthesis and degradation of extracellular matrix components. Salmon calcitonin also regulates estrogen receptor and steroidogenic factor, whereas PTS893 produced a strong up-regulation on nuclear receptors of the steroid/thyroid receptor family. These data therefore support the role of calcitonin as an anabolic agent.
- In addition, salmon calcitonin and PTS893 also influenced some aspects of the mineralization of the extracellular matrix, since changes in amelogenin, dentin and ectonucleotide pyrophosphatases were observed.
- In addition, PTS893 showed an effect on mediating the paracrine activation of osteoclast differentiation and activity, through cytokine and RANK ligand.
- No significant differences in gene expression profiling were attributable to the fact of administering salmon calcitonin and PTS893 in combination, with respect to the single therapy.
- Thus, gene profiling analysis in this EXAMPLE allowed the reconstruction of the pathways involved in calcitonin and parathyroid hormone signal transduction, triggered by protein-G-linked-receptor stimulation and their influence on cell cycle, as indicated by the changes observed in cyclins.
- Animals. A two-week subcutaneous treatment was carried out with salmon calcitonin (sCT), PTS893 or a combination of the two, each of which were dissolved in phosphate buffered saline (PBS) containing 9% autologous serum. Solvent was used as vehicle for the control group.
- The animals used in this analysis were cynomolgus monkeys (Macaca fascicularis), supplied by Centre de Recherches Primatologiques, Port Louis, Mauritius. Two animals were used per group and sex. At the beginning of the treatment period, the animals were at least 24 months old, with a body weight of approximately 3 kg. Animals were kept under standard conditions for animal welfare. Animals were examined daily for mortality, food consumption and clinical observations. Body weight was recorded once per week. The dosages were 0 µg/animal/day (as the control), 50 µg/animal/day of salmon calcitonin and 5 µg/animal/day of PTS893.
- In vivo examinations. No significant histopathological changes were observed. No relevant changes were observed other than a body weight decrease ranging from 8 to 12% in the salmon calcitonin group. A decrease in food consumption was also observed, although not always consistent with the decrease in body weight.
TABLE 23 Food Consumption - Males Control Day -6 -5 -4 -3 -2 -1 1 2 3 4 5 Animal no. W62S01 50 100 100 100 100 100 100 100 100 100 100 Animal no. W62S02 50 100 100 100 100 100 100 100 100 100 25 Day 6 7 8 9 10 11 12 13 14 Avg. Animal no. W62S01 75 100 100 100 100 100 100 25 91.7 Animal no. W62S02 100 75 75 100 100 100 75 100 50 91.7 Both animals 91.7 Salmon Calcitonin Day -6 -5 -4 -3 -2 -1 1 2 3 4 5 Animal no. W62503 50 75 50 75 100 75 75 25 50 100 100 Animal no. W62504 50 75 75 75 100 75 50 25 100 75 100 Day 6 7 8 9 10 11 12 13 14 Avg. Animal no.W62503 75 100 100 100 100 75 75 25 70.8 Animal no.W62504 75 75 75 100 100 75 75 25 75 75.0 Both animals 72.9 PTS893 Day -6 -5 -4 -3 -2 -1 1 2 3 4 5 Animal no. W62505 50 100 100 100 75 100 100 100 100 100 100 Animal no. W62S06 50 100 100 100 100 100 100 100 100 100 100 Day 6 7 8 9 10 11 12 13 14 Avg. Animal no. W62505 100 100 100 100 100 100 100 50 75 875 Animal no. W62506 100 100 100 100 100 100 100 100 100 91.7 Both animals 89.6 - The animals to whom salmon calcitonin was administered presented with a decrease in body weight ranging between 8 to 12%, which can be attributed to a decrease in food consumption. An anorectic effect had previously been described for salmon calcitonin acting through amylin receptors Eiden S et al., J. Physiol. 541(pt3): 1041-1048 (2002); Lutz TA et al., Peptides 21 (2): 233-8 (2000). However, no signs of toxicity were observed here. Hormonal and lipid changes observed in this EXAMPLE are most probably related to a consequent metabolic adaptation.
- No relevant changes in electrocardiograms (ECG) or blood pressure were observed.
TABLE 24 Blood Pressure Animal Sex Compound Week -1 Week 2Difference number administered (mm Hg) (mm Hg) (mm Hg) W62501 Male Control 121 98 -23 W62501 Male Control 90 29 -61 W62502 Male Control 86 107 21 W62502 Male Control 26 34 8 W62503 Male Salmon Calcitonin 135 99 -36 W62503 Male Salmon Calcitonin 61 40 -21 W62504 Male Salmon Calcitonin 102 79 -23 W62504 Male Salmon Calcitonin 56 35 -21 W62505 Male PTS893 76 87 11 W62505 Male PTS893 18 22 4 W62506 Male PTS893 106 101 -5 W62506 Male PTS893 53 33 -20 W62551 Female Control 96 76 -20 W62551 Female Control 27 26 -1 W62552 Female Control 102 93 -9 W62552 Female Control 26 36 10 W62553 Female Salmon Calcitonin 98 82 -16 W62553 Female Salmon Calcitonin 50 25 -25 W62554 Female Salmon Calcitonin 92 44 -48 W62554 Female Salmon Calcitonin 26 30 4 W62555 Female PTS893 92 70 -22 W62555 Female PTS893 43 42 -1 W62556 Female PTS893 78 87 9 W62556 Female PTS893 24 28 4 - Blood sampling. Animals were fasted overnight before blood collection but had free access to water. Blood samples were taken from a peripheral vein. Standard haematology and clinical chemistry analysis were performed once during pretest and at the end of the treatment period. Blood samples were collected from each animal at the same intervals as described for the clinical chemistry investigations. The serum samples were deep-frozen (approximately -80°C) until analyses for hormone determination.
- Clinical chemistry and hormone determinations. A slight anaemia was observed in all animals of the study, including the controls. This was attributed to the repeated blood sampling and not considered to be relevant.
TABLE 25 Haematology - Males Control Animal no. W62501 W62502 Test Units d-6 d7 d13 d-6 d7 d13 WBC G/l 10.0 11.1 12.9 6.1 11.2 6.3 RBC T/l 7.3 6.5 6.4 6.8 6.5 6.2 HB g/dl 12.9 11.9 11.7 13.1 12.3 11.9 PCV l/l 0.44 0.40 0.44 0.42 0.41 0.41 MCV fl 60 61 68 61 63 66 MCH pg 17.8 18.2 18.1 19.3 19.0 19.0 MCHC g/dl 29.8 29.6 26.8 31.5 30.1 28.9 PLAT G/l 316 371 266 458 500 547 N G/l 6.46 4.93 3.65 2.09 6.77 1.24 E G/l 0.01 0.14 0.20 0.10 0.10 0.10 B G/l 0.02 0.03 0.06 0.02 0.02 0.00 L G/l 3.05 5.45 8.44 3.60 3.65 4.51 M G/l 0.46 0.51 0.54 0.33 0.64 0.46 Salmon Calcitonin Animal no. W62503 W62504 Test Units d-6 d7 d13 d-6 d7 d13 WBC G/l 7.7 11.8 8.0 11.5 9.5 8.8 RBC T/l 6.3 5.9 5.6 6.9 6.0 5.4 HB g/dl 12.6 11.7 11.2 13.6 11.5 10.3 PCV l/l 0.40 0.39 0.39 0.43 0.37 0.36 MCV fl 64 66 70 62 62 67 MCH pg 20.2 19.9 20.2 19.7 19.2 19.2 MCHC g/dl 31.4 30.3 29.0 32.0 31.3 28.7 PLAT G/l 351 396 302 247 330 389 N G/l 3.36 4.11 1.90 3.93 3.31 3.04 E G/l 0.02 0.10 0.13 0.16 0.09 0.01 B G/l 0.02 0.04 0.03 0.08 0.04 0.03 L G/l 4.00 6.79 5.38 6.55 5.57 4.92 M G/l 0.30 0.73 0.57 0.76 0.45 0.76 Haematology - Males PTS893 Animal no. W62505 W62506 Test Units d-6 d7 d13 d-6 d7 d13 WBC G/l 10.4 8.4 8.8 9.1 15.0 11.9 RBC T/l 7.6 6.4 6.8 6.5 5.9 5.8 HB g/dl 13.6 11.3 11.7 13.2 11.9 11.8 PCV 1/l 0.43 0.38 0.43 0.40 0.40 0.41 MCV fl 57 60 63 62 67 70 MCH pg 18.0 17.7 17.3 20.4 20.2 20.3 MCHC g/dl 31.5 29.3 27.5 33.1 30.2 29.2 PLAT G/l 325 456 330 459 589 452 N G/l 4.45 1.77 2.88 4.80 8.73 6.51 E G/l 0.21 0.30 0.19 0.03 0.08 0.07 B G/l 0.00 0.02 0.04 0.02 0.03 0.03 L G/l 5.07 5.91 5.37 3.99 5.30 4.86 M G/l 0.62 0.39 0.27 0.27 0.83 0.46 d-6, d7 and d13 indicate day -6, day 7 and day 13 relative to the starting day of dosing
d-6, d7 and d13 indicate day -6, day 7 and day 13 relative to the starting day of dosingTABLE 26 Haematology - Females Control Animal no. W62551 W62552 Test Units d-8 d7 d13 d-8 d7 d13 WBC pg/ml 8.2 13.7 10.0 10.1 9.1 10.4 RBC nmol/l 6.5 6.2 5.8 6.7 6.2 5.8 HB pg/ml 12.8 11.8 11.3 13.1 11.7 11.4 PCV mU/l 0.42 0.43 0.41 0.42 0.42 0.41 MCV pg/ml 64 69 71 63 68 70 MCH ng/ml 19.7 19.1 19.4 19.5 18.9 19.5 MCHC pg/ml 30.6 27.7 27.4 30.9 27.7 27.9 PLAT nmol/l 463 445 468 286 292 275 N nmol/l 4.45 5.86 3.53 6.69 3.13 4.23 E mUI/l 0.03 0.13 0.12 0.01 0.15 0.19 B pg/ml 0.03 0.07 0.04 0.02 0.03 0.03 L pg/ml 3.40 7.09 5.91 3.14 5.39 5.34 M nmol/l 0.27 0.51 0.39 0.25 0.39 0.59 d-8, d7 and d13 indicate day -8, day 7 and day 13 relative to the starting day of dosing TABLE 27 Haematology - Females Salmon Calcitonin Animal no. W62553 W62554 Test Units d-8 d7 d13 d-8 d7 d13 WBC pg/ml 7.0 9.5 12.0 8.3 17.0 13.3 RBC nmol/l 6.5 6.2 5.2 7.0 6.6 5.7 HB pg/ml 12.3 11.5 10.1 13.8 12.7 11.0 PCV mU/l 0.40 0.40 0.33 0.45 0.44 0.37 MCV pg/ml 61 64 64 65 68 65 MCH ng/ml 19.1 18.6 19.5 19.8 19.4 19.5 MCHC pg/ml 31.2 29.0 30.3 30.6 28.7 29.9 PLAT nmol/l 549 594 451 304 356 229 N nmol/l 3.45 3.83 5.41 3.13 9.82 6.16 E mUl/l 0.03 0.36 0.73 0.03 0.04 0.06 B pg/ml 0.02 0.03 0.03 0.01 0.07 0.05 L pg/ml 3.26 4.61 5.18 4.79 6.21 6.58 M nmol/l 0.25 0.63 0.69 0.30 0.82 0.39 PTS893 Animal no. W62555 W62556 Test Units d-8 d7 d13 d-8 d7 d13 WBC pg/ml 10.1 18.4 13.2 14.3 12.3 10.1 RBC nmol/l 6.9 6.2 5.9 6.7 6.4 5.9 HB pg/ml 13.4 11.7 11.3 12.9 12.1 11.3 PCV mU/l 0.44 0.41 0.40 0.43 0.43 0.39 MCV pg/ ml 63 67 67 64 68 66 MCH ng/ml 19.3 18.9 19.3 19.3 19.0 19.2 MCHC pg/ml 30.6 28.2 28.6 30.2 28.1 29.2 PLAT nmol/l 501 525 496 213 382 309 N nmol/l 5.34 10.8 6.36 9.05 5.49 4.18 E mUI/l 0.00 0.12 0.21 0.26 0.49 0.29 B pg/ml 0.00 0.06 0.03 0.03 0.04 0.04 L pg/ml 3.92 6.29 5.81 4.40 5.87 5.21 M umol/l 0.80 1.12 0.82 0.54 0.44 0.37 d-8, d7 and d1 3 indicate day -8, day 7 and day 13 relative to the starting day of dosing - Among the standard clinical chemistry tests performed, slight to moderate decreases in phosphorus and/or magnesium and a moderate to marked decrease in triglycerides were seen in the groups administered salmon calcitonin and PTS893.
TABLE 28 Clinical Chemistry - Males Control Animal no. W62501 W62502 Test Units d-6 d7 d13 d-6 d7 d13 Na+ mmol/l 154 151 153 152 153 148 K+ mmol/l 4.05 5.31 4.26 4.09 4.05 4.51 Cl- mmol/l 109 113 108 107 110 111 Ca++ nunol/l 2.57 2.47 2.69 2.72 2.52 2.75 LPHOS mmol/l 2.21 1.93 2.76 1.88 1.69 1.99 Mg++ mmol/l 1.09 0.91 0.95 0.88 0.79 1.14 GLUC mmol/l 3.85 4.51 4.68 3.44 5.30 6.13 UREA mmol/l 9.7 4.9 5.0 7.6 6.1 5.2 CREAT µmol/l 85 60 75 65 55 57 TOT.BIL. µmol/l 6.0 2.0 2.0 7.0 3.0 4.0 PROT g/l 89 80 88 90 83 85 A/G 1.89 1.57 1.45 1.62 1.53 1.50 CHOL mmol/l 3.30 3.20 3.50 3.30 3.40 3.10 HDL-CHOL mmol/l 1.49 1.45 1.70 1.54 1.45 1.49 LDL-CHOL mmol/l 1.63 1.62 1.84 1.56 1.93 1.49 TRIG mmol/l 0.94 0.36 0.43 0.65 0.36 0.45 ALP IU/l 1559 1241 1313 1463 1423 1493 BAP-E IU/l 543 439 457 452 476 464 ASAT IU/l 22 22 25 30 26 26 ALAT IU/l 22 32 30 29 41 37 CK IU/l 150 45 127 74 67 102 LDH IU/l 392 585 549 421 518 592 GGT IU/l 128 92 111 89 71 75 ALB % 65 61 59 62 61 60 A1-GLOB % 1.90 2.70 2.50 1.90 2.10 2.30 A2-GLOB % 7.60 8.30 7.90 8.20 8.90 8.50 B-GLOB % 16 18 19 18 19 19 G-GLOB % 9.2 9.9 10.9 9.6 9.3 10.2 ALB g/l 58 49 52 56 50 51 A1-GLOB g/l 1.70 2.20 2.20 1.70 1.70 2.00 A2-GLOB g/l 6.80 6.60 7.00 7.40 7.40 7.20 B-GLOB g/l 14 14 17 17 16 16 G-GLOB g/l 8.2 7.9 9.6 8.6 7.7 8.7 Salmon Calcitonin Animal no. W62503 W62504 Test Units d-6 d7 d13 d-6 d7 d13 Na+ mmol/l 151 145 148 154 142 144 K+ mmol/l 4.24 4.90 4.34 4.85 5.15 4.48 Cl- mmol/l 107 104 104 113 106 101 Ca++ mmol/l 2.66 2.68 2.91 2.71 2.54 2.73 I.PHOS mmol/l 2.05 1.67 2.06 2.10 1.73 1.94 Mg++ mmol/l 0.97 0.68 0.73 0.99 0.71 0.72 GLUC mmol/l 3.57 3.58 4.29 3.70 4.98 6.19 UREA mmol/l 7.9 1.3 2.9 6.6 3.3 2.9 CREAT µmol/l 78 57 62 64 50 56 TOT.BIL. µmol/l 5.0 2.0 1.0 3.0 2.0 2.0 PROT g/l 87 82 87 91 83 89 A/G 1.76 1.68 1.42 1.42 1.26 1.05 CHOL mmol/l 3.30 3.60 3.70 3.80 3.90 3.40 HDL-CHOL mmol/l 1.49 2.09 2.44 1.46 1.48 1.39 LDL-CHOL mmol/l 1.21 1.28 1.26 1.87 2.51 1.83 TRIG mmol/l 0.96 0.24 0.27 0.92 0.22 0.68 ALP IU/l 1488 1023 1226 857 587 626 BAP-E IU/l 508 363 302 311 188 180 ASAT IU/l 28 31 28 24 17 24 ALAT IU/l 38 39 43 48 24 31 CK IU/l 124 56 119 75 45 173 LDH IU/l 439 400 427 356 384 519 GGT IU/l 105 80 75 121 75 69 ALB % 64 63 59 59 56 51 A1-GLOB % 1.60 2.00 2.40 1.90 2.80 3.60 A2-GLOB % 8.00 8.80 8.80 8.70 8.70 7.80 B-GLOB % 18 18 20 19 21 24 G-GLOB % 8.3 8.5 9.7 12.0 12.1 13.6 ALB g/l 56 51 51 54 46 46 A1-GLOB g/l 1.40 1.60 2.10 1.70 2.30 3.20 A2-GLOB g/l 7.00 7.20 7.70 7.90 7.20 6.90 B-GLOB g/l 16 15 18 17 17 21 G-GLOB g/l 7.2 7.0 8.4 10.9 10.0 12.1 PTS893 Animal no. W62505 W62506 Test Units d-6 d7 d13 d-6 d7 d13 Na+ mmol/l 151 151 152 151 149 149 K+ mmol/l 5.13 4.00 4.27 4.72 4.76 4.12 Cl- mmol/l 110 107 110 112 106 106 Ca++ mmol/l 2.81 2.39 2.59 2.64 2.45 2.51 I.PHOS mmol/l 2.59 1.68 2.22 2.12 1.12 1.77 Mg++ mmol/l 1.04 0.71 0.77 0.97 0.70 0.76 GLUC mmol/l 5.09 4.76 5.42 3.88 5.26 4.96 UREA mmol/l 11.6 3.7 6.4 15.0 4.9 5.8 CREAT µmol/l 86 66 79 77 63 70 TOT.BIL. µmol/l 5.0 2.0 1.0 7.0 2.0 1.0 PROT g/l 81 74 81 88 86 89 A/G 1.89 1.70 1.76 1.58 1.28 1.40 CHOL mmol/l 3.20 3.30 3.10 2.50 2.50 2.60 HDL-CHOL mmol/l 1.49 1.49 1.61 1.24 1.25 1.38 LDL-CHOL mmol/l 1.39 1.73 1.51 1.27 1.22 1.38 TRIG mmol/l 0.96 0.30 0.63 0.49 0.39 0.35 ALP IU/l 1703 1494 1768 1414 1363 1486 BAP-E IU/l 523 532 564 445 423 497 ASAT IU/l 24 18 24 25 27 29 ALAT IU/l 32 30 27 23 19 20 CK IU/l 111 82 148 86 73 125 LDH IU/l 367 400 528 354 432 464 GGT IU/l 133 99 105 112 85 91 ALB % 66 63 64 61 56 59 A1-GLOB % 2.20 2.80 2.60 2.40 3.60 2.80 A2-GLOB % 8.80 8.90 8.70 7.30 8.30 7.50 B-GLOB % 17 18 19 19 22 20 G-GLOB % 6.9 6.9 6.3 9.8 10.5 10.9 ALB g/l 53 47 52 54 48 52 A1-GLOB g/l 1.80 2.10 2.10 2.10 3.10 2.50 A2-GLOB g/l 7.10 6.60 7.10 6.40 7.10 6.70 B-GLOB g/l 14 14 15 17 19 18 G-GLOB g/l 5.6 5.1 5.1 8.6 9.0 9.7 d-6, d7 and d13 indicate day -6, day 7 and day 13 relative to the starting day dosing.
d-6, d7 and d13 indicate day -6, day 7 and day 13 relative to the starting day of dosing
d-6, d7 and d13 indicate day -6, day 7 and day 13 relative to the starting day of dosingTABLE 29 Clinical Chemistry - Females Control Animal no. W62551 W62552 Test Units d-8 d7 d13 d-8 d7 d13 Na+ mmol/l 152 148 155 148 150 148 K+ mmol/l 4.16 4.23 4.92 3.82 4.11 5.27 Cl- mmol/l 110 105 111 109 106 108 Ca++ mmol/l 2.64 2.61 2.61 2.48 2.44 1.80 I.PHOS mmol/l 1.98 2.61 2.28 1.84 1.98 1.84 Mg++ mmol/l 1.00 0.97 1.03 0.88 0.84 0.31 GLUC mmol/l 3.65 8.39 3.86 2.79 3.86 3.60 UREA mmol/l 11.0 8.3 8.2 11.3 6.9 6.3 CREAT µmol/ l 73 77 62 67 60 50 TOT.BIL. µmol/l 4.00 2.00 3.00 5.00 1.00 2.00 PROT g/l 85 80 80 83 83 77 A/G 1.77 1.67 1.55 1.68 1.39 1.27 CHOL mmol/l 3.20 2.80 3.00 3.70 3.40 3.50 HDL-CHOL mmol/l 1.63 1.44 1.49 1.75 1.82 1.80 LDL-CHOL mmol/l 1.55 1.25 1.90 1.57 1.28 1.66 TRIG mmol/l 0.64 0.54 0.57 0.83 0.48 0.50 ALP IU/l 1037 1088 1187 1332 1298 1182 BAP-E IU/l 310 369 346 432 419 379 ASAT IU/l 27 33 31 21 22 23 ALAT IU/l 44 52 46 16 19 20 CK IU/l 69 169 81 83 68 87 LDH IU/l 420 520 481 474 471 516 GGT IU/l 104 95 102 84 67 66 ALB % 64 63 61 63 58 56 A1-GLOB % 1.90 2.60 3.40 2.00 2.60 3.50 A2-GLOB % 8.00 7.60 7.70 7.00 8.10 7.70 B-GLOB % 17 18 18 15 18 18 G-GLOB % 9.4 9.2 9.9 12.9 13.2 14.8 ALB g/l 54 50 49 52 48 43 A1-GLOB g/l 1.60 2.10 2.70 1.70 2.20 2.70 A2-GLOB g/l 6.80 6.10 6.20 5.80 6.70 5.90 B-GLOB g/l 14 14 15 13 15 14 G-GLOB g/l 8.0 7.4 7.9 10.7 11.0 11.4 Salmon Calcitonin Animal no. W62553 W62554 Test Units d-8 d7 d13 d-8 d7 d13 Na+ mmol/l 145 147 147 145 143 147 K+ mmol/l 3.51 3.73 4.62 3.89 4.07 4.95 Cl- mmol/ l 106 104 107 100 96 107 Ca++ mmol/l 2.62 2.77 2.57 2.73 2.91 2.68 I.PHOS mmol/l 1.62 1.48 1.81 1.97 1.75 1.83 Mg++ mmol/l 0.87 0.63 0.76 0.91 0.77 0.80 GLUC mmol/l 3.84 4.88 4.98 4.11 5.31 4.04 UREA mmol/l 10.3 6.6 5.0 10.0 6.3 5.9 CREAT µmol/l 81 71 61 88 77 65 TOT.BIL. µmol/l 3.00 2.00 2.00 6.00 5.00 2.00 PROT g/l 88 90 80 91 95 83 A/G 1.46 1.45 1.30 1.48 1.42 1.26 CHOL mmol/l 2.70 2.80 2.20 3.30 4.00 3.00 HDL-CHOL mmol/l 1.04 1.11 0.96 1.46 1.99 1.66 LDL-CHOL mmol/l 1.61 1.51 1.46 1.13 1.93 1.42 TRIG mmol/l 0.79 0.25 0.39 0.88 0.30 0.38 ALP IU/l 1197 965 842 1132 877 890 BAP-E IU/l 416 326 304 344 325 294 ASAT IU/l 24 21 25 20 18 20 ALAT IU/l 21 24 19 19 14 19 CK IU/ l 99 72 107 76 64 77 LDH IU/l 286 423 429 319 372 363 GGT IU/l 88 63 54 82 72 62 ALB % 59 59 57 60 59 56 A1-GLOB % 2.70 2.70 3.10 2.20 2.20 3.10 A2-GLOB % 6.50 6.10 6.80 8.00 7.70 7.80 B-GLOB % 21 23 21 15 17 17 G-GLOB % 10.8 8.6 12.4 14.9 14.6 16.3 ALB g/l 52 54 45 54 56 46 A1-GLOB g/l 2.40 2.40 2.50 2.00 2.10 2.60 A2-GLOB g/l 5.70 5.50 5.40 7.30 7.30 6.50 B-GLOB g/l 18 21 17 14 16 14 G-GLOB g/l 9.5 7.7 9.9 13.6 13.9 13.5 d-8, d7 and d13 indicate day -8, day 7 and day 13 relative to the starting day of dosing PTS893 Animal no. W62555 W62556 Test Units d-8 d7 d13 d-8 d7 d13 Na+ mmol/l 153 151 152 150 148 149 K+ mmol/l 4.82 4.54 4.63 3.85 3.81 4.31 Cl- mmol/l 107 109 111 108 107 114 Ca++ mmol/l 2.77 2.61 2.20 2.64 2.62 2.35 I.PHOS mmol/l 2.11 1.31 1.51 2.10 1.60 1.50 Mg++ mmol/l 0.96 0.65 0.59 0.90 0.74 0.66 GLUC mmol/l 3.57 4.18 3.59 3.22 4.45 3.52 UREA mmol/l 8.2 8.7 6.3 8.4 6.6 6.8 CREAT µmol/l 77 62 58 68 63 58 TOT.BIL. µmol/l 5.00 1.00 2.00 5.00 2.00 2.00 PROT g/l 89 87 78 84 83 76 A/G 1.64 1.62 1.65 1.84 1.78 1.50 CHOL mmol/l 2.90 2.70 2.80 2.70 2.40 2.70 HDL-CHOL mmol/l 1.31 1.48 1.51 1.12 0.99 1.25 LDL-CHOL mmol/l 1.69 1.12 1.71 1.62 1.28 1.58 TRIG mmol/l 0.59 0.27 0.25 0.67 0.34 0.47 ALP IU/l 1535 1223 1332 1638 1307 1313 BAP-E IU/l 457 350 426 456 390 400 ASAT IU/ l 23 18 25 24 20 25 ALAT IU/ l 35 25 32 33 19 21 CK IU/l 84 65 175 63 144 172 LDH IU/l 468 465 557 309 313 358 GGT IU/l 85 71 70 103 85 83 ALB % 62 62 62 65 64 60 A1-GLOB % 2.30 2.50 2.50 1.90 2.10 2.70 A2-GLOB % 7.50 8.00 8.30 7.50 7.50 8.10 B-GLOB % 18 19 18 17 17 20 G-GLOB % 9.7 8.4 8.7 8.8 9.1 8.7 ALB g/l 55 54 49 55 53 46 A1-GLOB g/l 2.10 2.20 2.00 1.60 1.70 2.10 A2-GLOB g/l 6.70 7.00 6.50 6.30 6.20 6.20 B-GLOB g/l 16 17 14 14 14 16 G-GLOB g/l 8.6 7.3 6.8 7.4 7.6 6.6 d-8, d7 and d13 indicate day -8, day 7 and day 13 relative to the starting day of dosing d-8, d7 and d13 indicate day -8, day 7 and day 13 relative to the starting day of dosing - No relevant changes were observed in the standard urinalysis tests performed.
TABLE 30 Urinary Analysis - Males Control Animal no. W62501 W62502 Test Units -6 -5 13 -6 -5 13 VOLUME ml 15 10 77 22 130 30 CREAT µmol/l 18000 17000 5460 7920 2480 5160 NTx nM BCE - 9954 3425 - 11979 3167 CTx µg/l - 21592 6810 - 27169 5323 D-PYR nmol/l - 2345 1110 - 2904 1461 LDH IU/L 6.0 nd 8.0 8.0 NAG IU/l 3.5 1.5 3.2 1.6 Na+ mmol/l 163 43 87 77 K+ mmol/l 258 67 125 75 Cl- mmol/l 132 43 52 59 Ca2+ mmol/l 5.15 16.80 15.95 15.50 I.PHOS mmol/l 11.10 1.05 11.30 8.90 Mg2+ mmol/l 2.75 7.50 7.85 6.25 Na/Crea mM/mM 9.10 7.90 11.00 14.90 K/Crea mM/mM 14.30 12.20 15.80 14.50 Cl/Crea mM/mM 7.40 7.90 6.50 11.40 Ca/Crea mM/mM 0.29 3.08 2.01 3.00 Pho/Crea mM/mM 0.62 0.19 1.43 1.73 Mg/Crea mM/mM 0.20 1.40 1.00 1.20 LDH/crea IU/mM 0.33 nd 1.01 1.55 NAG/crea IU/mM 0.19 0.28 0.40 0.31 NTx/Crea nME/mM 586 627 4830 614 CTx/Crea µg/µm 1270 1247 10955 1032 Pyr/Crea nM/mM 138 203 1171 283 d-6, d-5 and d13 indicate day -6, day -5 and day 13 relative to the starting day of dosing Salmon Calcitonin Animal no. W62503 W62504 Test Units -6 -5 13 -6 -5 13 VOLUME ml 62 38 68 37 10 54 CREAT µmol/l 4300 7840 4620 13600 17360 4400 NTx nM BCE - 6023 5186 - 16067 3790 CTx µg/l - 11618 10088 - 26370 6130 D-PYR nmol/l - 1733 1083 - 5113 1476 LDH IU/L 9.0 7.0 13.0 17.0 NAG IU/l 2.7 1.4 4.2 7.2 Na+ mmol/l 22 14 119 15 K+ mmol/l 65 78 134 76 Cl- mmol/ l 10 55 64 68 Ca2+ mmol/l 0.90 18.25 3.70 23.40 I.PHOS mmol/l 4.35 2.50 5.33 3.00 Mg2+ mmol/l 1.40 7.05 7.55 9.80 Na/Crea mM/mM 5.20 3.10 8.70 3.40 K/Crea mM/mM 15.10 16.90 9.90 17.20 Cl/Crea mM/mM 2.20 11.80 4.70 15.30 Ca/Crea mM/mM 0.21 3.95 0.27 5.32 Pho/Crea mM/mM 1.01 0.54 0.39 0.68 Mg/Crea mM/mM 0.30 1.50 0.60 2.20 LDH/crea IU/mM 2.09 1.52 0.96 3.86 NAG/crea IU/mM 0.63 0.30 0.31 1.64 NTx/Crea nME/mM 768 1123 926 861 CTx/Crea µg/µm. 1482 2184 1519 1393 Pyr/Crea nM/mM 221 234 295 336 PTS893 Animal no. W62505 W62506 Test Units -6 -5 13 -6 -5 13 VOLUME ml 14 14 48 58 34 130 CREAT µmol/l 16160 16160 7840 9940 16120 3840 NTx nM BCE - 5403 4871 - 8757 2102 CTx µg/l - 11865 9365 - 20108 3705 D-PYR nmol/l - 1660 1676 - 2278 782 LDH IU/L 7.0 14.0 9.0 19.0 NAG IU/l 23.4 2.9 7.1 2.6 Na+ mmol/l 174 111 59 35 K+ mmol/l 86 107 125 69 Cl- mmol/l 22 117 50 48 Ca2+ mmol/l 5.10 7.55 3.50 13.10 I.PHOS mmol/l 74.40 0.10 3.86 0.17 Mg2+ mmol/l 11.25 8.70 2.95 5.25 Na/Crea mM/mM 10.80 14.10 6.00 9.10 K/Crea mM/mM 5.30 13.60 12.60 17.90 Cl/Crea mM/mM 1.40 15.00 5.00 12.60 Ca/Crea mM/mM 0.32 0.96 0.35 3.41 Pho/Crea mM/mM 4.60 0.01 0.39 0.04 Mg/Crea mM/mM 0.70 1.10 0.30 1.40 LDH/crea IU/mM 0.43 1.79 0.91 4.95 NAG/crea IU/mM 1.45 0.37 0.71 0.68 NTx/Crea nME/mM 334 621 543 547 CTx/Crea µg/µm. 734 1195 1247 965 Pyr/Crea nM/mM 103 214 141 204 d-6, d-5 and d13 indicate day -6, day -5 and day 13 relative to the starting day of dosing
d-6, d-5 and d13 indicate day -6, day -5 and day 13 relative to the starting day of dosingTABLE 31 Urinary Analysis - Females Control Animal no. W62551 W62552 Test Units -8 -7 13 -8 -7 13 VOLUME ml 21 21 43 18 53 53 CREAT µmol/l 16420 16420 9560 14300 6700 5380 NTx nM BCE - 9248 7824 - 5053 4695 CTx µg/l - 19280 17916 - 12014 10557 D-PYR nmol/l - 2500 2748 - 1397 2159 LDH IU/L 10.0 15.0 9.0 25.0 NAG IU/l 19.2 4.2 10.3 3.5 Na+ mmol/l 110 44 140 64 K+ mmol/l 82 122 124 87 Cl- mmol/l 24 73 72 56 Ca2+ mmol/l 2.90 16.10 11.90 19.50 I.PHOS mmol/l 88.2 7.7 20.3 3.5 Mg2+ mmol/l 2.35 7.20 9.00 5.45 Na/Crea mM/mM 6.70 4.60 9.80 11.90 K/Crea mM/mM 5.00 12.80 8.70 16.20 Cl/Crea mM/mM 1.50 7.60 5.10 10.50 Ca/Crea mM/mM 0.18 1.68 0.83 3.63 Pho/Crea mM/mM 5.37 0.81 1.42 0.64 Mg/Crea mM/mM 0.10 0.80 0.60 1.00 LDH/crea IU/mM 0.61 1.57 0.63 4.65 NAG/crea IU/mM 1.17 0.44 0.72 0.65 NTx/Crea nME/mM 563 818 754 873 CTx/Crea µg/µm. 1174 1874 1793 1962 Pyr/Crea nM/mM 152 288 209 401 Salmon Calcitonin Animal no. W62553 W62554 Test Units -8 -7 13 -8 -7 13 VOLUME ml 11 58 67 32 -14 49 CREAT µmol/l 10780 6920 4800 11260 13380 4200 NTx nM BCE - 4624 3465 - 7393 2812 CTx µg/l - 6983 5392 - 13411 5631 D-PYR nmol/l - 2762 1644 - 2016 1110 LDH IU/L 14.0 6.0 6.0 36.0 NAG IU/l 10.2 2.8 1.2 2.7 Na+ mmol/l 98 40 156 32 K+ mmol/l 104 53 172 57 Cl- mmol/l 31 63 156 65 Ca2+ mmol/l 3.00 17.55 3.50 12.70 I.PHOS mmol/l 25.4 5.1 10.8 5.8 Mg2+ mmol/l 3.35 5.40 3.80 4.85 Na/Crea mM/mM 9.10 8.30 13.90 7.60 K/Crea mM/mM 9.60 11.10 15.20 13.50 Cl/Crea mM/mM 2.90 13.20 13.80 15.40 Ca/Crea mM/mM 0.28 3.66 0.31 3.02 Pho/Crea mM/mM 2.35 1.05 0.96 1.38 Mg/Crea mM/mM 0.30 1.10 0.30 1.20 LDH/crea IU/mM 1.30 1.25 0.53 8.57 NAG/crea IU/mM 0.95 0.58 0.11 0.64 NTx/Crea nME/mM 668 722 553 670 CTx/Crea µg/µm. 1009 1123 1002 1341 Pyr/Crea nM/mM 399 343 151 264 PTS893 Animal no. W62555 W62556 Test Units -8 -7 13 -8 -7 1x3 VOLUME ml 14 15 52 39 69 42 CREAT µmol/l 19160 18240 5620 14060 7600 8060 NTx nM BCE - 10499 2514 - 4818 5679 CTx µg/l - 21919 3813 - 8877 11236 D-PYR nmol/l - 2963 1356 - 1377 2036 LDH IU/L 11.0 10.0 18.0 9.0 NAG IU/l 0.5 1.2 5.9 5.1 Na+ mmol/l 145 71 118 146 K+ mmol/l 302 150 164 70 Cl- mmol/l 119 101 53 133 Ca2+ mmol/l 11.50 20.05 6.60 12.35 I.PHOS mmol/l 0.2 0.1 7.6 2.9 Mg2+ mmol/l 7.35 6.90 4.00 5.90 Na/Crea mM/mM 7.60 12.60 8.40 18.10 K/Crea mM/mM 15.80 26.80 11.70 8.60 Cl/Crea mM/mM 6.20 18.00 3.70 16.50 Ca/Crea mM/mM 0.60 3.57 0.47 1.53 Pho/Crea mM/mM 0.01 0.02 0.54 0.36 Mg/Crea mM/mM 0.40 1.20 0.30 0.70 LDH/crea IU/mM 0.57 1.78 1.28 1.12 NAG/crea IU/mM 0.03 0.21 0.42 0.63 NTx/Crea nME/mM 576 447 634 705 CTx/Crea µg/µm. 1202 679 1168 1394 Pyr/Crea nM/mM 163 241 181 253 d-8, d-7 and d13 indicate day -8, day -7 and day 13 relative to the starting day of dosing
d-8, d-7 and d13 indicate day -8, day -7 and day 13 relative to the starting day of dosing
d-8, d-7 and d13 indicate day -8, day -7 and day 13 relative to the starting day of dosing - The salmon calcitonin group presented with moderate decreases in serum somatomedin (S.MED, see TABLES 32 and 42).
TABLE 32 Hormones - Males Control Animal no. W62501 W62502 Test Units d-6 d7 d13 d-6 d7 d13 ACTH pg/ml 91 63 87 117 136 150 CORTISOL nmol/l 2183 1415 1328 1378 1020 1348 ALDOST pg/ml 316 433 484 501 644 622 INSULIN mU/l 26.0 33.0 37.0 12.0 30.0 9.0 GLUCAG pg/ml 791 486 704 577 353 585 C-PEPTI ng/ml n/a 5.20 5.50 n/a 3.60 1.60 GASTRIN pg/ml n/ a 105 93 n/a 147 148 T3 nmol/l 1.34 2.61 2.94 2.19 2.73 2.50 T4 mnol/ l 56 61 44 57 68 48 TSH mUI/l 0.17 0.18 0.42 0.00 0.05 0.04 IPH pg/ml 103 75 108 174 173 155 CT pg/ml 5.9 4.6 4.8 16.4 15.0 13.1 VD25-H nmol/ l 49 47 54 76 71 58 VD1-25dh pmol/l n/a - - n/a - - OSTEO ng/ml n/a 26 34 n/a 41 40 CTx nmol/ l 10 15 20 17 19 20 ICTP ng/ml 18 13 19 26 16 15 PICP ng/ml n/a 311 395 n/a 610 495 G.H. ng/ml 13.8 7.0 16.2 15.2 3.6 17.2 S.STA pg/ml n/a - - n/a - - S.MED ng/ml n/a 888 1185 n/a 793 689 PROLACT ng/ml 0.0 3.3 3.6 21.6 22.5 22.5 TESTO nmol/l 10.5 8.4 n. s. 7.9 4.7 n. s. ESTR nmol/l n/a n/a n/a n/a n/a n/a PROG pmol/l n/a n/a n/a n/a n/a n/a d-6, d7 and d13 indicate day -6, day 7 and day 13 relative to the starting day of dosing Salmon Calcitonin Animal no. W62503 W62504 Test Units d-6 d7 d13 d-6 d7 d13 ACTH pg/ml 98 87 87 115 78 73 CORTISOL nmol/l 2316 979 1611 1578 1523 1709 ALDOST pg/ml 983 1058 819 465 987 977 INSULIN mU/l 13.0 14.0 17.0 4.0 10.0 22.0 GLUCAG pg/ml 905 247 428 869 218 503 C-PEPTI ng/ml n/a 1.70 1.80 n/a 1.20 2.30 GASTRIN pg/ml n/a 83 88 n/a 128 136 T3 nmol/l 1.06 2.35 2.51 1.48 1.65 1.90 T4 nmol/l 53 64 47 62 79 65 TSH mUI/l 0.99 1.12 1.03 0.14 0.41 0.40 IPH pg/ml 213 75 78 99 62 71 CT pg/ml 6.7 4.0 2.4 5.1 2.5 4.9 VD25-H nmol/ l 63 50 49 62 44 45. VD1-25dh pmol/l n/a - - n/a - - OSTEO ng/ml n/a 33 41 n/a 27 30 CTx nmol/l 12 26 38 18 22 24 ICTP ng/ml 21 15 15 22 21 20 PICP ng/ml n/a 284 363 n/a 361 439 G.H. ng/ml 11.5 1.7 16.2 14.6 13.6 15.7 S.STA pg/ml n/a - - n/a - - S.MED ng/ml n/a 268 332 n/a 307 384 PROLACT ng/ml 8.1 8.6 4.6 0.0 0.0 6.6 TESTO nmol/l 8.5 3.6 n. s. 9.5 7.3 n. s. ESTR nmol/l n/a n/a n/a n/a n/a n/a PROG pmol/l n/a n/a n/a n/a n/a n/a d-6, d7 and d13 indicate day -6, day 7 and day 13 relative to the starting day of dosing PTS893 Animal no. W62505 W62506 Test Units d-6 d7 d13 d-6 d7 d13 ACTH pg/ml 96 101 83 115 88 91 CORTISOL nmol/l 1662 1156 1299 1506 1432 1212 ALDOST pg/ml 265 380 592 141 471 651 INSULIN mU/l 16.0 22.0 14.0 12.0 38.0 10.0 GLUCAG pg/ml 858 656 786 694 497 739 C-PEPTI ng/ml n/a 2.90 2.10 n/a 4.40 2.40 GASTRIN pg/ml n/a 84 78 n/a 98 94 T3 nmol/l 2.48 3.47 3.55 1.38 2.76 2.43 T4 nmol/l 84 90 68 59 80 56 TSH mUI/l 0.22 0.40 0.15 0.00 0.07 0.03 IPH pg/ml 123 96 78 71 62 55 CT pg/ml 6.1 4.0 4.6 10.4 7.8 7.6 VD25-H nmol/l 77 62 50 88 62 50 VD1-25dh pmol/l n/a - - n/a - - OSTEO ng/ml n/a 43 55 n/a 32 42 CTx nmol/l 19 20 31 12 12 16 ICTP ng/ml 28 23 22 18 16 18 PICP ng/ml n/a 420 500 n/a 774 706 G.H. ng/ml 13.4 15.8 12.1 8.5 11.6 14.0 S.STA pg/ml n/a - - n/a - - S.MED ng/ml n/a 749 914 n/a 828 867 PROLACT ng/ml 7.1 15.7 7.5 7.5 5.5 2.2 TESTO nmol/l 11.8 10.5 n. s. 5.3 3.7 n. s. ESTR nmol/l n/a n/a n/a n/a n/a n/a PROG pmol/l n/a n/a n/a n/a n/a n/a d-6, d7 and d13 indicate day -6, day 7 and day 13 relative to the starting day of dosing TABLE 33 Hormones - Females Control Animal no. W62551 W62552 Test Units d-8 d7 d13 d-8 d7 d13 ACTH pg/ml 146 276 121 58 60 101 CORTISOL nmol/l 1983 1546 827 1894 837 818 ALDOST pg/ml 244 953 312 149 90 199 INSULIN mU/l 8.0 12.0 7.0 2.0 29.0 21.0 GLUCAG pg/ml 729 779 583 818 507 514 C-PEPTI ng/ml n/a 2.40 1.40 n/a 3.30 2.30 GASTRIN pg/ml n/a 84 102 n/a 90 92 T3 nmol/l 2.22 2.95 3.40 2.04 3.09 3.23 T4 nmol/l 78 67 59 51 50 49 TSH mUI/l 0.14 0.27 0.49 0.15 0.54 0.50 IPH pg/ml 155 149 129 145 129 112 CT pg/ml 4.70 3.90 4.10 11.50 11.60 11.20 VD25-H nmol/l 64 59 51 80 78 70 VD1-25dh pmol/l n/a - - n/a - - OSTEO ng/ml n/ a 37 39 n/a 34 39 CTx nmol/l 11 26 28 12 16 20 ICTP ng/ml 21 23 22 19 16 15 PICP ng/ml n/a 864 503 n/a 339 298 G.H. ng/ml 8.5 13.4 1.7 7.0 12.0 4.5 S.STA pg/ml n/a - - n/a - - S.MED ng/ml n/a 696 839 n/a 1173 1527 PROLACT ng/ml 4.30 8.30 5.90 2.90 0.00 0.00 TESTO nmol/l ESTR nmol/l 58 64 61 48 45 60 PROG pmol/l 3.40 3.50 1.70 2.70 1.10 1.40 d-8, d7 and d13 indicate day -8, day 7 and day 13 relative to the starting day of dosing Salmon Calcitonin Animal no. W62553 W62554 Test Units d-8 d7 d13 d-8 d7 d13 ACTH pg/ ml 72 129 97 157 233 141 CORTISOL nmol/l 1536 1220 1202 1222 1705 1128 ALDOST pg/ml 185 948 523 155 1073 457 INSULIN mU/l 12.0 8.0 9.0 20.0 18.0 24.0 GLUCAG pg/ml 585 295 258 619 594 303 C-PEPTI ng/ml n/a 1.60 1.00 n/a 1.50 2.20 GASTRIN pg/ml n/a 83 84 n/a 91 84 T3 nmol/l 1.17 1.68 1.51 1.43 1.51 2.00 T4 nmol/l 58 76 60 61 87 60 TSH mUI/l 0.81 1.31 1.16 0.08 0.34 0.41 IPH pg/ml 59 47 58 145 82 53 CT pg/ml 3.10 6.40 4.90 7.00 3.60 2.30 VD25-H nmol/l 61 43 40 72 56 60 VD1-25dh pmol/l n/a - - n/a - - OSTEO ng/ml n/a 21 25 n/ a 35 35 CTx nmol/l 12 21 25 17 34 28 ICTP ng/ml 28 28 24 29 30 24 PICP ng/ml n/a 115 142 n/a 240 287 G.H. ng/ml 6.3 15.2 8.6 5.1 17.9 13.1 S.STA pg/ml n/a - - n/a - - S.MED ng/ml n/a 374 297 n/a 204 488 PROLACT ng/ml 0.00 2.30 4.30 19.30 20.20 24.40 TESTO nmol/l ESTR nmol/l 47 63 59 141 82 170 PROG pmol/l 1.80 1.90 1.50 2.60 4.00 1.60 d-8, d7 and d13 indicate day -8, day 7 and day 13 relative to the starting day of dosing PTS893 Animal no. W62555 W62556 Test Units d-8 d7 d13 d-8 d7 d13 ACTH pg/ml 109 104 110 95 132 126 CORTISOL nmol/l 1482 1331 917 1532 1253 1375 ALDOST pg/ml 314 217 330 210 228 226 INSULIN mU/l 1.0 22.0 19.0 15.0 30.0 22.0 GLUCAG pg/ml 711 591 657 696 437 380 C-PEPTI ng/ml n/a 3.00 2.40 n/a 3.80 3.50 GASTRIN pg/ml n/a 83 82 n/a 96 91 T3 nmol/l 2.08 2.74 2.63 1.98 2.69 2.05 T4 nmol/ l 72 56 55 59 61 45 TSH mUI/l 0.34 0.14 0.25 0.88 0.89 0.69 IPH pg/ml 95 45 64 111 67 58 CT pg/ml 2.50 1.90 2.70 1.80 2.90 2.80 VD25-H nmol/ l 72 53 47 55 44 43 VD1-25dh pmol/l n/a - - n/a - - OSTEO ng/ml n/a 38 43 n/a 32 36 CTx nmol/l 13 11 15 17 14 14 ICTP ng/ml 22 16 16 20 15 15 PICP ng/ml n/a 612 436 n/a 478 393 G.H. ng/ml 3.5 1.5 0.0 1.1 8.2 11.8 S.STA pg/ml n/a - - n/a - - S.MED ng/ml n/a 533 502 n/a 432 589 PROLACT ng/ml 0.00 0.20 3.20 9.90 5.70 3.60 TESTO nmol/l ESTR nmol/l 67 68 60 59 66 57 PROG pmol/l 2.80 1.70 1.50 2.40 2.20 2.40 d-8, d7 and d13 indicate day -8, day 7 and day 13 relative to the starting day of dosing - Tissue sampling. Animals were killed by deep anaesthesia induced by intravenous injection of Pentothal®, followed by exsanguinations. All relevant tissues were sampled for histopathology and gene expression profiling. The following tissue samples were processed for analysis: liver, kidney, pituitary, muscle, bone, duodenum, spleen and trachea. Samples for histopathology were fixed in phosphate-buffered 10% formalin. Bone demineralization was performed with 10% formic acid. Tissue samples were embedded in Paraplast® and sectioned at 4 microns, for staining with haematoxylin and eosin. Samples for gene expression profiling were quickly frozen in liquid nitrogen immediately after excision, stored on dry ice and subsequently in a deep-freezer at approximately -80°C until. further use. All selected tissues for gene expression profiling were examined histopathologically.
- Histopathology. Histopathological examination of the tissues selected for gene profiling analysis exhibited a normal spectrum of incidental lesions which were in terms of severity and distribution of lesions not different to the controls in all groups of treatment.
- A slightly higher incidence of inflammatory and regenerative changes in the kidneys of females administered salmon calcitonin was observed. These changes were not considered to be relevant, since no records of kidney toxicity exist after 40 years of calcitonin therapeutic use.
- Bone sections were stained for osteonectin, osteopontin and osteocalcin and were evaluated histopathologically. Histomorphometry of the bone tissue was performed regarding parameters for bone resorption and synthesis (osteoid formation).
- The osteonectin, osteopontin, and osteocalcin staining of the tibia showed no difference between the groups one (control) and two (salmon calcitonin). Osteonectin exhibited a major enlargement and deterioration of the epiphysial growth plate of animal no 2553 due to a severe non-treatment related pathological status (severe, subacute epiphysiolysis).
- Histomorphometry of bone tissue was performed to determine parameters related to bone resorption and bone synthesis (osteoid formation).
- The results (see, TABLES 34 and 35) showed that salmon calcitonin increased trabecular volume and thickness in about a 17% in tibia, but not in vertebra. PTS893 reduced the cortical thickness (18%) and increased the cortical porosity (54%) in tibia (T), but not in vertebra (V). In contrast, PTS893 induced an increase in osteoid volume (37%T, 213%V) and surface (49%T, 37%V), as well as an increase in the osteoblast surface (40%T, 24%V), in both tibia and vertebra, respectively.
TABLE 34 Histomorphometry Tibia (Average Males and Females) BT/TV Tb Th Tb N 10 Sp Ct Por Ct Th OS/BS OV/BV ES/BS Obs/BS % µm mm-1 µm % µm % % % % Control 20.70 106.32 1.95 407.20 2.53 1583.13 40.00 8.76 5.73 17.53 17.72 97.99 1.81 454.90 2.59 976.66 33.37 8.51 4.70 12.77 28.74 109.18 2.63 270.69 1.21 1036.24 29.45 5.79 10.19 11.70 20.15 103.59 1.94 410.62 1.19 1031.89 29.19 5.29 5.71 15.80 mean 21.83 104.27 2.08 385.85 1.88 1156.98 33.00 7.09 6.58 14.45 SD 4.79 4.77 0.37 79.79 0.78 285.39 5.04 1.80 2.45 2.69 sCT 32.28 140.64 2.30 295.01 2.10 895.98 42.71 11.72 5.02 18.32 25.00 122.19 2.05 366.51 1.98 1022.55 31.58 5.86 2.31 6.37 29.96 129.05 2.32 301.75 1.61 939.32 35.21 5.03 6.89 18.58 16.08 115.65 1.39 603.45 2.40 1178.70 30.37 4.01 5.61 19.36 mean 25.83 126.88 2.01 391.68 2.02 1009.14 34.97 6.65 4.95 15.66 SD 7.17 10.68 0.43 144.81 0.33 124.65 5.56 3.46 1.93 6.21 PTS893 19.69 129.22 1.52 526.99 2.76 1022.62 54.84 11.24 4.62 16.16 16.65 93.20 1.79 466.69 2.94 893.43 43.57 9.61 4.76 21.25 25.74 120.52 2.13 347.63 2.94 950.33 43.63 8.14 4.21 18.46 24.78 126.07 1.97 382.61 2.95 939.53 54.97 9.95 2.85 25.25 mean 21.72 117.25 1.85 430.98 2.90 951.48 49.25 9.74 4.11 20.28 SD 4.30 16.43 0.26 81.20 0.09 53.46 6.53 1.28 0.87 3.91 sCT: salmon Calcitonin; SD: Standard deviation
BV/TV trabecular bone volume; Tb. Th. Trabecular thickness; Tb. N. Trabecular number; Tb. Sp. Trabecular Separation; Ct. Por. Cortical porosity; Ct, Th. Cortical thickness; OS/BS osteoid surface; OV/BV osteoid volume; ES/BS eroded surface; Obs/BS osteoblast surface.TABLE 35 Histomorphometry Vertebra (Average Males and Females) BT/TV Tb Th Tb N Tb Sp Ct Por Ct Th OS/BS OV/BV ES/BS Obs/BS % µm mm-1 µm % µm % % % % Control 2-1.67 179.80 1.21 649.79 0.88 887.91 23.61 1.22 8.94 16.14 15.85 144.89 1.09 769.35 0.26 639.93 20.77 2.02 8.81 5.96 19.54 122.91 1.59 506.23 0.87 416.48 17.91 1.58 5.85 4.07 21.95 131.30 1.67 466.91 0.85 604.45 11.58 0.97 1.82 4.79 mean 19.75 144.72 1.39 598.07 0.71 637.20 18.47 1.45 6.36 7.74 SD 2.82 25.07 0.28 138.62 0.30 193.78 5.15 0.45 3.34 5.65 sCT 17.32 113.29 1.53 540.84 1.70 705.10 3.95 0.46 11.60 3.21 19.33 144.31 1.34 602.15 1.18 810.09 5.82 0.86 2.55 3.97 20.11 118.49 1.70 470.71 1.18 576.42 11.48 1.43 4.93 6.81 19.46 123.71 1.57 511.96 0.12 907.16 4.91 0.32 3.47 1.23 mean 19.06 124.95 1.53 531.42 1.05 749.69 6.54 0.77 5.64 3.80 SD 1.21 13.59 0.15 55.24 0.66 141.96 3.38 0.50 4.09 2.31 PTS893 15.15 105.46 1.44 590.67 1.49 707.43 18.84 3.24 9.31 10.36 20.23 118.79 1.70 468.39 1.45 629.35 41.28 8.42 2.30 9.07 23.56 134.66 1.75 436.79 0.41 740.87 23.65 3.49 2.55 10.47 24.86 134.82 1.84 407.56 0.92 624.35 17.66 2.66 3.96 8.33 mean 20.95 123.43 1.68 475.85 1.07 675.50 25.36 4.45 4.53 9.56 SD 4.33 14.15 0.17 80.47 0.51 57.85 10.93 2.67 3.27 1.04 sCT: salmon Calcitonin; SD: Standard deviation
BV/TV trabecular bone volume; Tb. Th. Trabecular thickness; Tb. N. Trabecular number; Tb. Sp.
Trabecular Separation; Ct. Por. Cortical porosity; Ct, Th. Cortical thickness; OS/BS osteoid surface;
OV/BV osteoid volume; ES/BS eroded surface; Obs/BS osteoblast surface. - Histomorphometry showed inconsistent results between tibial and vertebral bone, except for an increase in osteoid synthesis induced by PTS893. This effect is well documented for parathyroid hormone, when administered in a discontinuous way.
- RNA extraction and purification. A set of tissues was selected for gene expression profiling. These set included samples from kidney, bone, muscle, duodenum, pituitary and liver. Briefly, total RNA was obtained by acid guanidinium thiocyanate-phenol-chloroform extraction (Trizol®, Invitrogen Life Technologies, Carlsbad, Calif. USA) from each frozen tissue section and the total RNA was then purified on an affinity resin (RNeasy®, Qiagen) according to the manufacturer's instructions. Total RNA was quantified by the absorbance at λ = 260 nm (A260nm), and the purity was estimated by the ratio A260nm/A280nm. Integrity of the RNA molecules was confirmed by non-denaturing agarose gel electrophoresis RNA was stored at approximately -80°C until analysis. One part of each individual RNA sample was kept for the analysis of critical genes by means of Real-time PCR.
- Hybridization assay. Transcript profiling by means of GeneChip® expression probe arrays was done as recommended by the manufacturer of the GeneChip® system (GeneChip Expression Analysis Technical Manual, Affymetrix Inc., Santa Clara, Calif. USA). HG-U95Av2 GeneChip® expression probe arrays (Affymetrix, Santa Clara Calif. USA) were used. Double stranded cDNA was synthesized with a starting amount of approximately 5 µg full-length total RNA using the Superscript Choice System (Invitrogen Life Technologies) in the presence of a T7-(dT) 24 DNA oligonucleotide primer. Following synthesis, the cDNA was purified by phenol/chlorofom/isoamylalcohol extraction and ethanol precipitation. The purified cDNA was then transcribed in vitro using the BioArray® High Yield RNA Transcript Labeling Kit (ENZO) in the presence of biotinylated ribonucleotides form biotin labeled cRNA. The labeled cRNA was then purified on an affinity resin (Rneasy®, Qiagen), quantified and fragmented. An amount of approximately 10 µg labeled cRNA was hybridized for approximately 16 hours at 45°C to an expression probe array. The array was then washed and stained twice with streptavidin-phycoerythrin (Molecular Probes) using the GeneChip Fluidics. Workstation 400 (Affymetrix). The array was then scanned twice using a confocal laser scanner (GeneArray® Scanner, Agilent) resulting in one scanned image.
- This resulting ".data-file" was processed using the Micro Array Analysis Suite version 4 (MAS4) program (Affymetrix) into a ".cel-file". The ".cel file" was captured and loaded into the Affymetrix GeneChip Laboratory Information Management System (LIMS). The LIMS database is connected to a UNIX Sun Solaris server through a network filing system that allows for the average intensities for all probes cells (CEL file) to be downloaded into an Oracle database. Raw data was converted to expression levels using a "target intensity" of 150. The numerical values displayed are weighted averages of the signal intensities of the probe-pairs comprised in a probe-set for a given transcript sequence (AvgDiff value). The data were checked for quality and loaded into the GeneSpring® software versions 4.Z.4 and 5 (Silicon Genetics, Calif. USA) for analysis.
- - Data analysis. Data analysis was performed with the Silicon Genetics software package GeneSpring version 4.2.1 and 5. Average difference values below 20 were set to 20. Various filtering and clustering tools in these programs were used to explore the data sets and identify transcript level changes that informer or altered cellular and tissue functions and that can be used to establish working hypotheses on the modes of action of the compound.
- The threshold range for considering as up or down regulation was determined within the context of the biological interpretation of the study.
- The information content of these data sets is a conjunction of numerical changes and biological information. The decision to consider a specific gene relevant was based on a conjunction of numerical changes identified by comparative and statistical algorithms and the relationship to other modulated genes that point to a common biological theme. The weight of that relationship was assessed by the analyst through a review of the relevant scientific literature.
- Increase and decrease reported here refer to transcript abundance, unless specifically stated.
- Gene expression profiling. Multiorgan comparative gene profiling analysis was performed in the group administered salmon calcitonin at 50 µg/animal/day. The organs chosen for analysis were liver, kidney, pituitary, skeletal muscle, bone, duodenum, spleen and trachea.


- In addition, the effect of PTS893 was assessed in bone.
TABLE 37 Gene-Profiling Analysis of Salmon Calcitonin and PTS893 in Bone GeneChip® Coding Gene Fold Increase Fold Increase Expression Probe Salmon PTS893 Set Identifier Calcitonin 38909 at 25-hydroxyvitamin D3 1-alpha-hydroxylase -1.14 32714_s_at activin A receptor type II-like 1 -1.62 35915 at activin beta-C chain. -1.21 39279_at activin type II receptor 1.24 39383_at adenylate cyclase 6, isoform a -1.22 38965_at aggrecan 1 2.03 39206_s_at aggrecan 1 1.41 36621_at alpha-2-HS-glycoprotein 1.33 34589_f_at Amelogenin 1.10 -3.10 39326_at ATPase H(+) vacuolar -1.57 -1.19 38814_at ATPase H(+) vacuolar 1.22 33741_at ATPase, H+ transport, lysosomal 1.23 33033_at ATPase, H+ transporting, lysosomal -1.29 -1.17 40328_at bHLH transcription factor 2.57 39407_at bone morphogenetic protein 11.16 31399_at bone morphogenetic protein 101.44 1.20 1113_at bone morphogenetic protein 2A -1.12 -1.13 40367_at bone morphogenetic protein 2A -1.18 1114_at bone morphogenetic protein 2B or BMP4 -1.70 1831_at bone morphogenetic protein 5 -1.43 -1.60 1733_at bone morphogenetic protein 6 precursor 1.27 40333_at bone morphogenetic protein-4 (hBMP-4) -1.42 34847_s_at calcium/calmodulin-dependent protein kinase (CaM kinase)II 1.13 beta 33935_at calcyclin binding protein 1.41 1751_g_at Calreticulin -4.03 32067_at cAMP responsive element modulator (CREM) 1.39 2.75 39241_at carbonic anhydrase I -2.68 40095_at carbonic anhydrase II -1.69 40163_r_at cartilage oligomeric matrix protein precursor 2.36 128_at cathepsin k 1.18 129_g_at cathepsin k 1.20 38466_at cathepsin k 1.27 40718_at cathepsin w -1.31 32833_at CDC- like kinase 11.63 646_s_at_ CDC- like kinase 2 isoform helk2/139.1.19 34163_at chondroitin sulfate proteoglycan 6 -1.18 598_at collagen type II alpha-1 -1.38 -1.19 32488_at collagen type III alpha 1 -1.41 38952_s at collagen type IV alpha-2 1.23 1.44 35379_at collagen type IX alpha 1 -2.22 34802_at collagen type VI alpha-2 (AA 570-998) -1.37 38566_at collagen type X alpha-1 1.67 37892_at collagen type XI alpha-1 1.24 1.18 Expression Probe Salmon PTS893 Set Identifier Calcitonin 1026_s_at collagen type XI alpha2 -1.20 1027_at collagen type XI alpha2 1.11 39632_at collagenase 3 (matrix metalloproteinase 13) 1.20 36638_at connective tissue growth factor. -1.32 1943_at cyclin A -1.74 40697_at cyclin A2 -1.60 -1.39 34736_at cyclin B1 -2.83 39251_at cyclin C -2.03 1983_at cyclin D2 -1.28 36650_at cyclin D2 1.21 35249_at cyclin E2 -2.95 1649_at cyclin G 1 interacting protein 1.31 1913_at cyclin G2 -1.29 160024_at cyclin-dependent kinase (CDC2-like) 10 PISSLRE 1.53 1942_s_at cyclin-dependent kinase 4 -1.22 1206_at cyclin- dependent kinase 51.56 40549_at cyclin-dependent kinase 5 -1.40 799_at cyclin- dependent kinase 5, regulatory subunit 1 (p35)1.32 41546_at cyclin-dependent kinase 6 1.15 2031_s_at cyclin-dependent kinase inhibitor 1A (p21, Cip1) 1.95 1787_at cyclin-dependent kinase inhibitor 1C 1.18 38673_s_at cyclin-dependent kinase inhibitor 1C 1.13 39545_at cyclin-dependent kinase inhibitor 1C 1.24 1797_at cyclin-dependent kinase inhibitor 2D (p19, inhibits CDK4) -1.21 35816_at cystatin B (stefin B) 1.57 806_at cytokine-inducible kinase 1.20 40049_at death-associated protein kinase 1 -1.30 33903_at death-associated protein kinase 3 -1.22 -7.73 34029_at dentin matrix acidic phosphoprotein 1 (DMP1) 1.65 38059_g_at dermatopontin 1.72 343_s_at ectonucleotide pyrophosphatase/ phosphodiesterase 1.11 342_at ectonucleotide Pyrophosphatase/ Phosphodiesterase 1.45 1442_at estrogen receptor 1.47 33670_at estrogen receptor 1.30 1487_at estrogen receptor-related protein 1.11 38882_r_at estrogen-responsive B box protein (EBBP) 1.22 38902_r_at estrogen-responsive B box protein (EBBP) 1.23 39945_at fibroblast activation protein -127 424_s_at fibroblast growth factor receptor. -I.I7 466_at general_transciption factor II, 1.34 1102_s_at glucocorticoid receptor alpha 1.43 33510_s_at glutamate receptor, metabotropic 11.26 1.23 33269_at GPI1 N-acetylglucosaminyl transferase component Gpi1 1.24 1.21 41476_at G-protein alpha subunit 11 1.24 1401_g at granulocyte-macrophage colony-stimulating factor (CSF1) -3.07 -2.57 1911_s_at growth arrest and DNA-damage-inductible protein (gadd45) 2.87 Expression Probe Salmon PTS893 Set Identifier Calcitonin 888_s_at growth differentiation factor 1 -1.43 37615_at growth factor receptor-bound protein 101.21 33929_at heparan sulfate proteoglycan (glypican). 2.00 39757_at heparan sulfate proteoglycan core protein 1.10 755_at inositol 1,4,5-trisphosphate receptor type 1 1.27 33506_at inositol polyphosphate 4-phosphatase type I-beta 1.12 -1.24 33290_at inositol polyphosphate 5-phosphatase (5ptase) -1.20 32697_at inositol(myo)-1(or 4)-monophosphatase 1 -1.36 1975_s_at insulin-like growth factor 1 -1.41 1501_at insulin-like growth factor 1 (somatomedin C) -1.12 1232_s_at insulin-like growth factor binding protein -1.31 40422_at insulin-like growth factor binding protein 2 -1.27 1586_at insulin-like growth factor binding protein 3 1.45 37319_at insulin-like growth factor binding protein 3 2.17 1737_s_at insulin-like growth factor binding protein 4 1.13 41420_at insulin-like growth factor binding protein 5 1.18 1396_at insulin-like growth factor binding protein 5 1.62 1678_g_at insulin-like growth factor binding protein 5 1.44 38650_at insulin-like growth factor binding protein 5 1.53 1741_s_at insulin-like growth factor binding protein-2 -2.49 -2.11 1464_at insulin-like growth factor II precursor 1.18 1591_s_at insulin-like growth factor II precursor 1.41 1.31 39781_at insulin-like growth factor-binding protein 4 1.16 33082_at integrin alpha 10 subunit 1.33 35131_at integrin-binding sialoprotein (bone sialoprotein, bone sialoprotein II) 1.15 40060_r_at LIM protein (similar to rat protein kinase C-binding enigma) 1.44 1.32 36184_at lysyl hydroxylase (PLOD) procollagen-lysine, 2-oxoglutarate 5 dioxygenase -1.40 34795_at lysyl hydroxylase isoform 2 (PLOD2) 1.49 36811_at lysyl oxidase-like protein -1.44 1433_g_at MAD, mothers against decapentaplegic homolog 3 1.14 1.73 34655_at MAGUKs (membrane-associated guanylate kinase homologues 1.23 36179_at MAP kinase activated protein kinase 2 1.18 35652_g_at MAP kinase kinase kinase (MTK1) 1.14 41279_f_at MAPK8IP1 Mitogen-activated protein kinase 8 interacting protein 1 1.25 41280_r_at MAPK8IP1: mitogen-activated protein kinase 8 interacting protein 1 -131 -1.31 1509_at Metalloproteinase -1.42 976_s_at mitogen-activated protein kinase1 -1.61 1.12 34006_s_at mitogen-activated protein kinase 8 1.32 1439_s_at mitogen-activated protein kinase-activated protein kinase 2 1.78 37565_at MMD: monocyte to macrophage differentiation-associated 1.28 1.30 38369_at myeloid differentiation primary response gene (88) -1.10 1052_s_at NF-IL6-beta protein 1.30 36472_at N-myc and STAT interacter- -1.35 38354_at nuclear factor NF-IL6 (AA 1-345) 1.92 33106_at nuclear orphan receptor LXR-alpha nuclear receptor subfamily 3.29 1, group H, member 3 33381_at nuclear receptor co-activator 1.11 279_at nuclear receptor subfamily 4, group A, member 1 2.30 280_g_at nuclear receptor subfamily 4, group A, member 1 3.08 37623_at nuclear receptor subfamily 4, group A, member 2 Member of the steroid/thyroid hormone receptor family 27.72 547_s_at nuclear receptor subfamily 4, group A, member 2 Member of the steroid/thyroid hormone receptor family 26.77 190_at nuclear receptor subfamily 4, group A, member 3 Member of steroid/thyroid receptor family of nuclear hormone receptors 5.45 41202_s_at OS-4 protein (OS-4) 1.24 1451_s_at OSF-2os osteoblast specific factor-2 (periostin) -1.65 38822_at O-sialoglycoprotein endopeptidase 2.43 467_at osteoclast stimulating factor (OSF -1.23 35107_at osteoprotegerin ligand 3.33 33814_at PAK4 protein 1.16 38757_at PDGF associated protein. -1.89 40253_at phosphatidylinositol 4-kinase (NPIK-C). 1.77 37412_at phosphatidylinositol-4-phosphate 5-kinase isoform C (-1) -1.87 751_at phosphatidylinositol-glycan-class C (PIG-C) 1.14 -1.25 666_at phosphodiesterase 4A, cAMP-specific 1.33 1.30 38526_at phosphodiesterase 4D, cAMP-specific 1.30 3.53 38921_at phosphodiesterase IB, calmodulin-dependent 1.52 38944_at phosphodiesterase IB, calmodulin-dependent 1.17 32029_at phosphoinositide dependent protein kinase-1 (3) 1.16 31699_at phosphoinositide-3-kinase 1.56 1.16 1085_s_at phospholipase C -1.14 364_s_at phospholipase C b3 1.22 901_g_at phospholipase C, beta 4 -1.20 1293_s_at phospholipase D -1.26 32306_g_at preprocollagen type I alpha-2 1.19 35473_at preprocollagen type I alpha1. -2.72 38951_at PRKCQ Protein kinase C, theta 1.43 32307_s_at procollagen 1.13 34494_at procollagen I-N proteinase. 1.92 37605_at procollagen type II alpha1 1.91. 36109_at prolidase (imidodipeptidase) PEPD -2.55 1884_s_at proliferating cell nuclear antigen -1.85 34390_at prolyl 4-hydroxylase alpha (II) subunit 1.19 37037_at prolyl 4-hydroxylase alpha subunit 1.20 36666_at prolyl 4-hydroxylase beta 1.95 36533_at prostacyclin synthase 1.20 718_at protease, serine, 11 (IGF binding) -1.30 719_g_at protease, serine, 11 (IGF binding) -1.43 385_at proteasome (prosome, macropain) subunit, beta type, 10 1.36 39183_at protein kinase 1 PCTAIRE -1.17 37698_at protein kinase A (PRKA) anchor protein 1 1.29 397711_at protein kinase C substrate 80K-H 1.13 39161_at protein kinase Njmu-R1 1.21 35348_at protein kinase, AMP-activated, beta 1 non-catalytic subunit 2.10 36359_at protein kinase, cAMP-dependent, catalytic, gamma 1.39 546_at protein kinase, cAMP-dependent, catalytic, inhibitor alpha 1.14 227_g_at protein kinase, cAMP-dependent, regulatory, type I, alpha 1.18 41768_at protein kinase, cAMP-dependent, regulatory, type I, alpha 1.15 1091_at protein kinase, cAMP-dependent, regulatory, type I, beta 1.65 116_at protein kinase, cAMP-dependent, regulatory, type II, alpha 1.28 33633_at purinergic receptor P2Y, G-protein coupled, 11 1.90 32737_at RAC2 Ras-related C3 botulinum toxin substrate 2 (rho family, small GTP binding protein Rac2) 1.16 40299_at RE2 G-protein coupled receptor 1.24 35668_at receptor (calcitonin) activity modifying protein 1 RAMP 1 1.34 40696_at receptor (TNFRSF)-interacting serine-threonine kinase 1 1.12 1007_s_at receptor tyrosine kinase DDR 1.21 37701_at regulator of G-protein signalling 2, 24kD 2.06 1048_at retinoid X receptor-gamma 1.47 1.34 36217_at serine/threonine kinase 38 1.54 41544_at serum-inducible kinase 1.16 32447_at SF-1; Steroidogenic factor-1 8.76 36487_at short stature homeobox 2, -1.46 41222_at signal transducer and activator of transcription 6 (STAT6) 1.44 1955_s_at SMAD6 (inhibits BMP/Smad1 (MADH1) signalling) 1.19 37718_at SNF-1 related kinase 1.49 1.19 35883_at Spi-B -2.80 1244_at Stat2 -1.12 506_s_at Stat5A 1.16 38994_at STAT-induced STAT inhibitor-2 1.25 38669_at Ste20-related serine/threonine kinase 1.24 1.65 37152_at steroid hormone receptor superfamily 1.19 35844_at syndecan 4 1.37 38374_at TEIG; TGFB inducible early growth response 1.18 38427_at TEIG; TGFB inducible early growth response 1.38 32080_at tetracycline transporter-like protein 1.41 224_at TGFB inducible early growth response; TIEG 1.26 36940_at TGFBI-induced anti-apoptotic factor 1 1.22 1.60 32217_at TGF-beta induced apotosis protein 12 1.40 41445_at TGF-beta precursor 1.14 1890_at TGF-beta superfamily protein 1.74 40631_at Tob -1.14 1.59 39358_at transcriptional co-repressor nuclear receptor co-repressor 2 1.42 1385_at transforming growth factor induced protein 1.36 1830_s_at transforming growth factor-beta 1.17 1767_s_at transforming growth factor-beta 3 (TGF-beta 3) -1.71 -1.63 40581_at TRIO: triple functional domain (PTPRF interacting) 1.65 1.56 32272_at tubulin alpha -1.20 685_f_at tubulin alpha isotype H2-alpha -4.36 -1.79 330_s_at tubulin alpha, 1, -1.80 -1.15 151_s_at tubulin beta -1.40 39399_at tubulin beta cofactor D -1.85 471_f_at tubulin beta, 4 -1.38 40567_at tubulin, alpha 3 -1.39 709_at tubulin, beta 3 -1.18 33678_i_at tubulin, beta, 2 -1.15 33679_f_at tubulin, beta, 2 -1.31 1651_at ubiquitin carrier protein E2-C -3.74 -1.22 32548_at unactive progesterone receptor -1.33 1953_at vascular endothelial growth factor 1.40 1.20 36101_s_at vascular endothelial growth factor 1.45 1.44 36140_at Y box binding protein-1 2.30 5.49 - numbers = fold down-regulated + numbers = fold up-regulated - Real-time PCR. Based on the DNA microarray data a set of transcripts was chosen for quantitative analysis by real time-PCR (RT-PCR).
- Briefly, the method exploits the SyBr Green dye which intercalates into double stranded DNA. Accumulation of PCR products is detected directly by monitoring the increase in fluorescence of the SyBr Green dye. Reactions are characterised by the point in time during cycling when amplification of a PCR product is first detected rather than the amount of PCR product accumulated after a fixed number of cycles. The higher the starting copy number of nucleic acid target, the sooner a significant increase in fluorescence is observed.
- From each RNA sample, cDNA was made using an Applied Biosystem kit (Applied Biosystems # N808-0234) following the recommendation of the manufacturer. The PCR mixture was prepared using the SyBr Green Universal PCR Master Mix (Applied Biosystems # 4309155) as follows: 5 µl cDNA template, 400 nM of each primer, 0.2 mM deoxynucleotide triphosphates, 1 mM MgCl2 and 0.5 U Taq DNA polymerase, 5 µl SyBr. Green PCR buffer and RNase free water up to a final volume of 50 µl. The PCR was performed using the ABI Prism 7700 Sequence Detection System, after a step at 95°C for 10 min, the step-cycle program was performed for a total of 40 cycles as follows: 95°C for 30 s, 60°C for 1 min. A negative control was included: PCR reaction mixture with water in place of the cDNA sample.
- The initial template concentration was determined based on the threshold cycle. The threshold cycle is the PCR cycle at which fluorescence is first detected above background and has been shown to be inversely proportional to the number of target copies present in the sample. Quantification was performed by calculating the unknown target concentration relative to an absolute standard and by normalizing to a validated endogenous control such as a housekeeping gene (β-action). Results are presented as percentage of control, once the ratio between the numbers of molecule for the gene of interest divided by the number of molecule for beta-actin has been calculated.
- Based on the DNA microarray data the following set of transcripts was chosen for quantitative analysis by RT-PCR: adhesion receptor CD44, angiopoietin, bone
morphogenetic protein 5, carbonic anhydrase II, cartilage oligomeric matrix protein, cathepsin K, osteopontin, pre-pro-alpha-2 type I collagen, Spi-B and Y-box binding protein.TABLE 38 Real Time PCR Results GeneChip® Expression Coding Gene Treatment Effect Salmon Treatment Effect Probe Set Identifier Calcitonin (% respect to control) PTS893 (% respect to control) 1372_at adhesion receptor CD44 No change No change 1929_at angiopoietin-1 No change No change 1831_at bone morphogenetic protein 5+16 +18 40095_at carbonic anhydrase II - 60 No change 40161_at cartilage oligomeric matrix protein +34.23 No change 128_at cathepsin K +67.2 No change 2092_s_at osteopontin No change No change 32306_g_at pre-pro-alpha-2 type I collagen +38 +62 35883_at Spi-B -44 -18 36140_at Y-box binding protein (bone) +14 +26 36140_at Y-box binding protein (kidney) +15 n.a. 36140_at Y-box binding protein (muscle) -26 n.a. n.a.: not applicable - RT-PCR confirmed in most of the cases the changes observed in the gene profiling analysis, as it was the case for bone
morphogenetic protein 5, carbonic anhydrase II, cathepsin K, cartilage oligomeric matrix protein, pre-pro-alpha-2 type I collagen, Spi-B and Y-Box binding protein. No changes were however detected in the level of expression of adhesion receptor CD44, angiopoietin-1 and osteopontin. - Analysis. Calcitonin is known to exert an effect on the differentiation, survival and resorptive activity of osteoclasts, resulting in a decreased osteoclastic activity. Pondel M, Intl. J. Exp. Pathol. 81 (6): 405-22 (2000). These effects could be reconstructed by multiorgan gene profiling (TABLE 39).
TABLE 39 Effects on Osteoclasts Function Coding genes Salmon Calcitonin PTS893 Osteoclast PU.1 (SPI1) B, K, P, T B determination, survival and differentiation Granulocyte to macrophage B, K B colony-stimulating factor (CSF1) Monocyte to macrophage differentiation B, K, T B associate (MMD) Osteoclast stimulating factor 1 (Autocrine B, K, L, P stimulation of osteoclast resorptive activity) Bone resorption by H+ ATP-ases ALL B osteoclast Carbonic anhydrase I, II. B, L, P Cathepsin K ALL ODF/OPGL: osteoprotegerin ligand B Osteoclast motility Tubulins ALL PAK4 protein B, M, P Multiorgan gene expression profiling in salmon calcitonin treated animals. Organs where changes in expression were seen are displayed. B= bone; K= kidney; M= muscle; P= pituitary; L= liver; T= trachea. - PU.1 is involved in the initial stages of osteoclastogenesis. Tondravi MM et al., Nature 386(6620): 81-4 (1997). CSF-1 is imperative for macrophage maturation; it binds to its receptor c-fms on early osteoclast precursors, providing signals required for their survival and proliferation. Teitelbaum SL, Science 289(5484):1504-1508 (2000).
- Interestingly, PTS893 also regulates the genes implicated in osteoclast differentiation and survival, SPI1, CSF-1 and MMD. This osteoclast regulation has not been previously described.
- Salmon calcitonin was shown to regulate the expression of the gene coding for osteoclast stimulating factor (OSF), which is an intracellular protein produced by osteoclasts that indirectly induces osteoclast formation and bone resorption. Reddy S et al., J. Cell Physiol. 177 (4): 636-45 (1998). This would imply an autocrine effect of salmon calcitonin in the regulation of the osteoclast function, which is described here for the first time.
- In addition salmon calcitonin seems to exert a paracrine regulation of the osteoclast resorptive activity, through the regulation of cystatin expression in the osteoblast. Carbonic anhydrase I, II, H+-ATPases and cathepsin K are the main effectors for dissolving bone mineral and matrix degradation. Blair HC et al., Biochem. (2002). Regulation of tubulins and PAK4 genes can be related to the effect of calcitonin on osteoclast motility PAK 4. Zaidi M et al., Bone 30(5): 655-63 (2002); Jaffer ZM & Chernoff J, Intl. J. Biochem. Cell Biol. 34(7): 713-7 (2002).
- These results show modulating effects of calcitonin on genes affecting the direct, autocrine, paracrine and endocrine regulation of the osteoblast function (TABLE 40). These data support the hypothesis that attributes a bone anabolic effect to calcitonin.
TABLE 40 Effects on Osteoblasts Function Coding Gene Salmon Calcitonin PTS893 Antagonists of cathepsins; Cystatins B antiresorptive activity Autocrine/paracrine Alpha-2-HS-Glycoprotein B, K, T regulation of osteoblast function Bone Morphogenetic Proteins ALL B Fibroblast Growth Factors B, K, M, P, T B IL6/LIF B Insulin-like Growth Factors ALL B TGFs B, K, M, P B Tob B, M, P B Vascular Endothelial Growth Factor B, M X Endocrine regulation of Activin B, L, M, P B osteoblast function Estrogen receptor ALL Retinoic receptor X B, P B Steroidogenic factor B, L, P, T nuclear receptors (steroid/thyroid family) B Transcription factor that Y-box binding protein B, K, M, P B regulates collagen type 1synthesis Multiorgan gene expression profiling in salmon calcitonin treated animals. Organs where changes in expression were seen are displayed. B= bone; K= kidney; M= muscle; P= pituitary; L= liver; T= trachea. - Three families of growth factors, the transforming growth factor betas (TGF-βs), insulin-like growth factors (IGFs), and bone morphogenetic proteins (BMPs), are considered to be principal local regulators of osteogenesis. Bone morphogenetic proteins are thought to have their major effects on early precursor bone cell replication and osteoblast commitment. In contrast, TGB-βs are thought to be the most potent inducers of committed bone cell replication and osteoblast matrix production, while IGFs appear to integrate and extend the effect of both factors. McCarthy TL et al., Crit. Rev. Oral Biol. Med. 11(4): 409-22 (2000). These results support the fact that both salmon calcitonin and PTS893 are able to regulate these local and systemic factors implicated in bone metabolism. The fact that salmon calcitonin regulates α2-HS glycoprotein (AHSG), which blocks TGF-β-dependent signalling in osteoblastic cells, also supports this role. Mice lacking AHSG display growth plate defects, increased bone formation with age, and enhanced cytokine-dependent osteogenesis. Szweras M et al., J. Biol. Chem., 277(22): 19991-19997 (2002).
- Salmon calcitonin and PTS893 were also shown to modulate the expression of the genes coding for vascular endothelial growth factor (VEGF). VEGF is known for playing a key role in normal and pathological angiogenesis. The critical role of angiogenesis for successful osteogenesis during the endochondral ossification is well documented. VEGF indirectly induces proliferation and differentiation of osteoblasts by stimulating endothelial cells to produce osteoanabolic growth factors. Wang DS et al., Endocrinology 138(7): 2953-62 (1997). In addition, VEGF stimulates chemotactic migration of primary human osteoblasts, suggesting a functional role in bone formation and remodeling. Mayr-Wohlfahrt U et al., Bone 30 (3): 472-7 (2002).
- The effects of parathyroid hormone on osteoblast for mediating both bone resorption and formation have been widely described. Swarthout JT et al., Gene 282(1-2):1-17 (2002). It was here possible to confirm the effect of PTS893 on cytokines like interleukin 6 (IL-6), which mediates the paracrine activation of osteoclast differentiation and activity. Greenfield EM et al., Life Sci. 65:1087-102 (1999). PTS893 also produced a strong up-regulation on nuclear receptors (steroid/thyroid family).
- Both calcitonin and parathyroid hormone receptors belong to the G-protein receptor superfamily. After receptor stimulation, signal transduction is mediated by adenylate cyclase/cAMP/protein kinase, phospholipase C, phospholipase D, and MAPK (as a late effecter) pathways in the case of calcitonin, and by adenylate cyclase and phospholipase C in the case of parathyroid hormone. Gene profiling analysis allowed the reconstruction of these pathways, showing genes that were modulated by the treatment and that are localised at different levels of the signal transduction pathway.
TABLE 41 Effects on Signal Transduction and Cell Cycle Function Coding Gene Salmon Calcitonin PTS893 Signal transduction. Adenylate cyclase B Calcyclin binding protein B Calreticulin B, K, M CREM B, L, P B CDC Kinase B, M MAPK ALL B Protein kinases ALL Phosphatidylinositol pathway ALL B Phosphodiesterase (IB, 4A, 4B) ALL B Phospholipase (C, D) ALL B PCNA B SMAD pathway ALL B STAT pathway ALL B Cell cycle Cyclins (A, A2, B1, C, D2, E2, G1, G2) B B Cyclin- dependent kinases 5, 6, 10B, K, P, T B Cyclin-dependent kinases inhibitor 1A, 1C, 2D) B B Multiorgan gene expression profiling in salmon calcitonin treated animals. Organs where changes in expression were seen are displayed. B= bone; K= kidney; M= muscle; P= pituitary; L= liver; T= trachea. - Bone morphogenetic protein (BMP) controls osteoblast proliferation and differentiation through Smad proteins. Tob, a member of the emerging family of antiproliferative proteins, is a negative regulator of BMP/Smad signalling in osteoblasts. Smad pathway as well as Tob as one of their regulators were also identified as genes modulated by the sCT and PTS893 treatment, in agreement with the hypothesised effect of both compounds on BMP regulation of bone remodelling. Within this context, both compounds seem to exert a direct influence on cell cycle, since changes in cyclins and cyclin-related proteins could be also observed.
- Both compounds regulate also synthesis and degradation of extracellular matrix components (TABLE 42).
TABLE 42 Effects on Extracellular Matrix Function Coding Gene Salmon Calcitonin PTS893 Cell attachment. Signal Integrins B, M, P B transduction. Collagen digestion Collagenase B Matrix metalloproteinases I, II B, L, P, T Collagen synthesis Procollagen endopeptidase/proteinase B Lysyl hydroxylase B Extracellular matrix Aggrecan B component Cartilage Oligomeric Matrix Protein Precursor B, K, Collagen type I, type II, type III, type IV, type V, ALL B type VI, type IX, type X, type XI, type XIII, type XIV, type XV, and/or type XVI) Chondroitin sulphate proteoglycan K, M, T B Dermatopontin B Heparan sulphate proteoglycan L,T B Syndecan B Multiorgan gene expression profiling in salmon calcitonin-treated animals. Organs where changes in expression were seen are displayed. B= bone; K= kidney; M= muscle; P= pituitary; L= liver; T= trachea. - Of particular interest is the regulation of the Y-Box binding protein (YB-1), which appears to be modulated by both treatments and in four out of six organs analysed in the salmon calcitonin group. YB-1 is a protein that interacts with a TGF-β response element in the distal region of the collagen alpha 1(I) gene. YB-1 protein activates the collagen promoter and translocates into the nucleus during TGF-β addition to fibroblasts, suggesting a role for this protein in TGF- β signalling. Sun W et al., Matrix Biol. 20(8): 527-41 (2001).
- In addition, salmon calcitonin and PTS893 regulated some aspects of the mineralization of the bone extracellular matrix, since changes in amelogenin, dentin and ectonucleotide pyrophosphatases were observed.
TABLE 43 Effects on Mineralization and Visualisation Function Coding Gene Salmon Calcitonin PTS893 Cement component Amelogenin B, L B Mineral matrix protein Dentin B B Enzyme for synthesis of Ectonucleotide pyrophosphatases B, M inorganic Pi Growth factor VEGF B, M B vascularization Multiorgan gene expression profiling in salmon calcitonin treated animals. Organs where changes in expression were seen are displayed. B= bone; K= kidney; M= muscle; P= pituitary; L= liver; T= trachea. - The compound of formula (II), 7-hydroxy-4-[4-(2-pyrrolidin-1-yl-ethoxy)-benzyl]-3-(2,4-dichloro-phenyl)-chromen-2-one, as shown:

- The compound of formula (II) was developed for the treatment of bone-resorbing diseases generally, including osteoporosis, metastatic bone cancer, osteolytic lesions with orthopedic implants, Paget's disease, and bone loss associated with hyperthyroidism. The compound of formula (II) can also be used to treat other conditions associated with IL-6 including various cancers (e.g. breast cancer, prostate cancer, colon cancer, endometrial cancer, multiple myeloma, renal cell carcinoma, and cervical carcinoma) and arthritis (e.g. adjuvant-, collagen- and antigen-induced arthritis, particularly rhenmatoid arthritis). See,
published PCT patent applications WO 96/31206 WO 00/39120 WO 01/49673 - The purpose of this EXAMPLE is to identify the "compound signature" of the compound of formula (II), to define a strategy for further development. The main concerns are the potential stimulation of the uterus and the induction of deep venous thrombosis (DVT). In addition, a goal of the EXAMPLE is to identify biomarkers for efficacy or risk assessment of the compound of formula (II).
- Selective Estrogen Receptor Modulators (SERMs) are selective estrogen receptor modulators that act as agonists or antagonists depending on the target tissue. To increase our understanding of the direct tissue-specific effects of different SERMs and to elucidate the underlying molecular mechanisms, a study was started to perform a comprehensive in vivo gene expression profiling using DNA microarrays.
- Gene expression microarray technology allows for the simultaneous detection and measurement of the expression of thousands of genes in a given cell or tissue sample in a single experiment. van de Rijn M & Gilks CB. Histopathology 44:97-108 (2004). This technique has significant advantages over previous methods for measuring gene expression, such as the reverse transcriptase-polymerase chain reaction and Northern blot analysis, which are limited to evaluation of small numbers of genes per experiment.
- Because microarray technology enables rapid global gene expression profiling (GEP), it provides a powerful tool for analysis of a wide range of diseases, pharmacogenomic research, high throughput screening in drug discovery, and diagnostic screening for various diseases. Heller MJ. Annual Review of Biomedical Engineering. 4:129-153 (2002). Gene expression profiling can be used to identify the genes whose altered expression may be directly related to causing a particular disease. By systematically evaluating the genes identified by such screens, researchers increase the likelihood of uncovering suitable targets for therapeutic intervention. In addition, the use of gene expression profiling in pharmacogenomics can be useful to identify potential undesirable effects of drug treatment by identifying changes in gene expression. Similarly, gene expression profiling may be useful in identifying patients that have a greater likelihood of achieving a meaningful outcome from a given therapeutic treatment. While methods for detecting changes in gene expression in response to therapy have been used, a method for scoring (or ranking) treatment agents based on their respective gene expression profilings has not been described.
- Tamoxifen, a selective estrogen receptor modulator (SERM), is a nonsteroidal hormonally active agent that has agonistic and antagonistic effects in different target tissues; it is an antagonist in breast tissue and an agonist in the uterus. Kiang DT & Kennedy BJ, Ann Intern Med. 87:687-690 (1997); Jordan VC & Allen KE, Eur. J. Cancer 16:239-251 (1980); Jordan VC et al., Breast Cancer Res Treat. 10:31-35 (1987); Gottardis MM et al., Cancer Res. 48:812-815 (1998); Fornander T et al., Lancet 1:117-120 (1989). Tamoxifen is an effective antitumour agent that is used in the treatment of estrogen-mediated breast cancer and as a chemopreventative agent; it decreases the risk of both invasive and noninvasive breast cancer. However, tamoxifen increases the risk for uterine hyperplasia and cancer through its proestrogenic effects on the endometrium. These undesired effects led to a search for SERMs with better safety profiles. Raloxifene, a second generation SERM that has a more favorable therapeutic and safety profile than tamoxifen, was subsequently developed. Cohen FJ et al., Obstet. Gynecol. 95:104-110 (2000); Ring J et al. (The Desloratadine Study Group) Int J Dermatol. 40:1-5 (2001); Fugere P et al., Am J Obstet Gynecol. 182:568-574 (2000). Raloxifene has a reduced antagonistic effect on the endometrium compared with tamoxifen is not associated with endometrial cancer risk.
- Because various SERMs exhibit differential estrogenic effects on the uterus, we used this treatment effect as a model system to test and validate a new, unique method of scoring the relative pharmacological and toxicological activity of different therapeutic agents according to their gene expression profilings. Gene expression profiling has been used for dissecting the molecular mechanisms of physiology and disease in the uterus using tissue cultures, transgenic mice, and normal rats. However, few studies have been performed in primates and little is known of the gene expression profiling in monkey uterine tissue. Ace CI & Okulicz WC, Reprod Biol Endocrinol. 2:54(2004); Marvanova M et al., FASEB J. 17:929-931 (2003); Zou J et al., Genome Biol. 3:research0020.1-research0020.13 (2002). Furthermore, no studies have incorporated a method for scoring (or ranking) therapeutic agents based on their respective gene expression profilings. If such a ranking system where available, it could have broad utility for a wide spectrum of therapeutic areas, and represent a significant advance for the discovery and development of new pharmacological entities. In the current EXAMPLE, changes in uterine gene expression profilings were explored in normal and OVX cynomolgus monkeys following tamoxifen and raloxifene treatment; results are compared with those obtained after treatment with estradiol. The estrogenic potency of each agent was then attributed a score based in its effect on uterine gene expression.
- Animals. Female sexually mature cynomolgus monkeys (Macaca fascicularis obtained from R.C. Hartelust BV, Tilburg, the Netherlands) approximately 48 months old were subjected to surgery (ovarectomy [OVX] or sham) 10 weeks prior to treatment and were treated for parasitic arthropods and helminthes, subjected to a tuberculin testing, and acclimated to the treatment facility for at least 14 days before beginning treatment.
- All animals received tap water, filtered with a 0.22 µm filter, ad libitum. Approximately 180 g of OWM pelleted diet (Dietex France, SDS, Saint Gratien, France) was administered daily to each animal at least one hour after dosing except on the last day of treatment where the animals were fasted. Each animal received two fruits or vegetables daily.
- Surgical Procedures. The ovariectomized cynomolgus monkey (Macaca fascicularis), which has been validated as a useful model predictive of outcomes in human clinical trials of estrogen and SERMs (Cline JM et al., Toxicol Pathol. 29:84-90 (2001)), was used as a model of estrogen deficiency. Animals were ovariectomized approximately 10 weeks before the first day of treatment. The ovaries were removed following anesthesia with a combined intramuscular injection of xylazine (Rompun®: 0.4 mL/animal, Bayer Pharma Division Santé Animale, Puteaux, France) and ketamine hydrochloride (Imalgène®: 0.6 mL/kg, Mérial, Lyon, France). Sham-operated animals were subjected to the same surgical procedure, except for the removal of ovaries.
- Estradiol Assay. Estradiol serum levels were determined in each animal approximately 2 weeks after surgery in order to verify the effect of ovarectomy. Venous blood samples (approximately 1.5 mL) of unfasted animals were collected in tubes without anticoagulant and analyzed using radioimmunoassay (Sorin, Ecole Nationale Vétérinaire de Lyon, France).
- Treatment Protocol. Ovariectomized and sham-operated animals were divided into groups of 4 and treated as outlined below.
TABLE 44 Surgery Drug Dose (mg/kg/day PO) Sham Vehicle control -- OVX Vehicle control1 -- OVX Estradiol2 0.4 OVX Tamoxifen3 10.0 OVX Raloxifene3 10.0 1An aqueous solution of 0.5% carboxymethylcellulose was used as a vehicle.
2Ethinyl estradiol was prepared in corn oil.
3Tamoxifen and raloxifene were prepared in an aqueous solution of 0.5%
carboxymethylcellulose. - Tissue Preparation. Gene expression was determined in the pituitary and uterus at the end of drug therapy. Tissues to be analyzed (pituitary glands and uterus) were excised, snap frozen in liquid nitrogen, and stored at -80°C until RNA extraction was performed.
- DNA Microarray Analysis. Total RNA was obtained by acid guanidinium isothiocyanate-phenol-chloroform extraction (Trizol; Invitrogen Life Technologies, San Diego, CA, USA) and purified on an affinity resin column (RNeasy; Qiagen, Hilden, Germany) according to manufacturer instructions. Chomczynski P & Sacchi N. Anal Biochem. 1987;162:156-159. DNA microarray experiments were conducted as recommended by the manufacturer of the GeneChip system (Affymetrix, Inc. 2002) and as previously described. Lockhart DJ, Dong H, Byrne MC, et al. Nat Biotechnol. 1996;14:1675-1680.
- Previous studies have proven the validity of cross-species DNA chip analysis (Hacia JG et al. Nat Genet 18:155-158 (1998)), therefore, the human gene expression probe arrays HGU133A (Affymetrix, Santa Clara, CA, USA) containing 22,283 probe sets interrogating primarily annotated human genes were used. One GeneChip was used per tissue, per animal. The resulting image files (dat files) were processed using the Microarray Analysis Suite 5 (MAS5) software (Affymetrix, Inc.). Tab-delimited files were obtained containing data regarding signal intensity (Signal) and categorical expression level measurement (Absolute Call).
- Quantification of Drug Potency Relative to Specific Drug Action; GEP Scoring Axis. To define a reference axis representing the desired pharmacological/toxicological action, we used a priori knowledge of 2 groups representing or approximating the extremes of the condition under study. These consisted of the OVX group (OVX untreated animals representing the one extreme) and OVX + estradiol (OVX animals treated with estradiol, an agent know to exercise a well-defined action, representing the other extreme). These two groups were used to quantitatively scale the axis. Other compounds were then positioned on this axis whereby the drugs could be ranked with regard to specific aspects of a pharmacological/toxicological action.
- Selection of Features. Generally, the data derived from an individual microarray, proteomic, or metabolite profiling experiment can be considered as a fingerprint. However, in practical terms, many of the features (e.g. genes) do not represent relevant information and only confound the analysis of the outcomes of such experiments. Thus, selection and elimination of the appropriate features is an important aspect of this methodology and the quantitative nature of this approach depends on the features used to define the axis of drug action.
- In the case of a well-defined condition, it is possible to invoke a priori knowledge on the selection of features. If the molecular biology of the specific drug action is known, the features (e.g. genes, metabolites) to be used for the definition of the axis can be defined a priori. In the case of a less-well-defined condition, it is possible to use univariate filters (in this case, gene intensity >50, ≥1.5-fold change in expression vs. controls [OVX], and statistical significance and statistical methods to identify and exclude non-informative features.
- Data Pretreatment. Issues of transformation, centering (variable-wise), and scaling of the data were considered. In the case of microarrays, the data were log10-transformed and probe set-wise centered. Generally, no scaling was applied. When using only a small number of biologically identified features, these were scaled to unit variance.
- Principal Component Analysis. To calculate the axis of drug action, a principal component axis (PCA) was performed using only the 2 treatment groups that were at the extremes (the untreated OVX animals vs. the estrodiol-treated OVX animals). Massart DL et al., Handbook for Chemometrics and Qualimetrics, Part a. (Elsevier; 1997); Jolliffe IT. Principal Component Analysis. 2nd Edition (Springer; New York, NY, 2002). Only 1 principal component (PC) was calculated, which was a weighted linear combination of all features in the input data pointing in the direction of maximum variance. The weights of the probe sets in this linear combination were called "loadings" and their absolute value is a measure of their importance in explaining the difference between the 2 groups. Every measurement in the experiment (e.g. microarray) could then be represented by its coordinate (score) on the PC. Alternatively, to obtain an even better separation between the groups, the PLS-DA (Partial-Least-Squares Discriminate Analysis) method with a 0/1 dummy variable as response vector was used. Barker M & Rayens W. Journal of Chemometrics 17:166-173 (2004). Massart DL et al., Handbook of Chemometrics and Qualimetrics, Part b. (Elsevier; 1997). The next step was identification of the features that were important for the definition of the axis. This was based on the magnitude of their loadings and their statistical significance using error estimates based on cross-validation and/or normal probability plots of the loadings. Hunter WG & Hunter JS. Statistics for Experimenters: an Introduction to Design, Data Analysis, and Model Building. 1st Edition (Wiley; 1978). This enabled calculation of a new PCA model using only the important features.
- If a pharmacological or toxicological action affected multiple biochemical pathways that were represented by grossly different numbers of features in the measurement, block scaling was used. Eriksson L et al., Multi- and Megavariate Data Analysis - Principles and Applications. (Umetrics Academy; 2001). This attributed the same influence to all pathways (groups of features) in the calculation of the PCA model. Hierarchical PCA could be applied to identify the most important pathways of drug action. Eriksson L et al., J Comput Aided Mol Des. 16:711-726 (2002).
- Applying the PCA Model. Using the loadings of the final PCA model the scores of all measurements in the other treatment groups (tamoxifen and raloxifene) were calculated. The medians (or means) of the scores of the two extreme groups were used to scale the axis of drug action (0 - 100%). The score (estrogenic potency) of a treatment (drug/dose) was expressed on this scale for individuals or group averages (median or mean).
- Statistical Analyses. Score variances were used to estimate confidence intervals (Sachs L. Angewandte Statistik, 10. (Springer; Berlin, Germany, 2002)), and significant differences between groups were assessed with various statistical tests (e.g. t-test, u-test). Zar JH. Biostatistical Analysis. 4th Edition (Prentice Hall; 1998).
- Comparative GEPs Following Estradiol, Tamoxifen, and Raloxifene Treatment. Pituitary Gland. Ovariectomy induced the expected significant up-regulation of the genes encoding luteinising hormone (LH) and follicle-stimulating hormone (FSH) in the pituitary gland (TABLE 45).
TABLE 45 Affect of Ovariectomy on Luteinising Hormone and Follicle-Stimulating Hormone in the Pituitary Gland Fold change relative to OVX OVX (average) SD Sham EE Tamoxifen Raloxifene Luteinising hormone 1385 420 0.1 0.1 0.4 1.3 Follicle stimulating hormone 4964 971 0.2 <0.1 0.4 0.8 Fold expression change to SHAM control Sham Control (average) SD OVX EE Tamoxifen Raloxifene Luteinising hormone 184 141 7.5 0.5 3.2 9.8 Follicle stimulating hormone 807 290 6.1 0.1 2.3 5.2 OVX, ovariectomized; EE, ethinyl estradiol
Data derived from 4 animals/group (1 DNA chip/animal). - Compared with sham surgery, the transcript levels were 7.6- and 6.2-fold greater (LH and FSH, respectively) in untreated OVX animals. Administration of estradiol reversed the effects of ovariectomy, and decreased the expression of LH and FSH transcripts 16.4- and 73.4-fold, respectively, well below normal physiological values. Tamoxifen had a weak estrogenic effect, downregulating pituitary LH and FSH gene expression by 2.4- and 2.7-fold in OVX monkeys. Raloxifene had a minimal effect on gonadotropin expression, reducing LH and FSH transcripts by 1.2- to 1.3-fold.
- Uterus. The effect on uterine gene expression was subdivided by grouping genes in different logical categories; signal transduction, growth factors, extracellular matrix, and as a group, genes involved in cell-cycle, transport, and redox.
- Signal transduction inducers. Overall, an increased expression of genes encoding signal transduction proteins was observed following estradiol treatment in OVX monkeys (TABLE 46).
TABLE 46 Comparative GEP for Signal Transduction Inducers in the Uterus Following Treatment with Estradiol, Tamoxifen, and Raloxifene in Ovariectomized Monkeys Fold change relative to OVX OVX (average) SD Sham EE Tamoxifen Raloxifene Progesterone receptor 101 54 3.0 9.7 4.5 1.9 LIM and senescent cell antigen-like domains 1 196 50 2.6 3.7 2.9 2.2 Wingless-type MMTV integration site family, member 2B 34 19 1.8 2.6 1.9 1.4 Secreted frizzled-related protein 1 222 61 2.0 7.1 2.2 1.6 Integrin, beta 5 68 49 1.7 1.7 1.5 1.5 Secreted frizzled-related protein 4 931 251 2.2 4.2 2.9 0.8 Phospholipid transfer protein 716 383 1.6 2.0 1.4 1.2 Cadherin 11, type 2, OB-cadherin (osteoblast) 486 104 1.6 3.4 3.2 1.3 Wingless-type MMTV integration site family, member 16 58 61 1.1 1.1 1.1 0.9 Phosphatase and tensin homolog (mutated in multiple advanced cancers 1) 173 50 1.6 1.8 1.6 1.1 Protein tyrosine kinase 9 84 6 1.6 2.1 1.7 1.2 Four and a half LIM domains 2 175 68 1.5 3.0 1.7 0.9 Dishevelled associated activator of morphogenesis 1 351 39 1.6 3.1 1.2 0.9 Calcium channel, voltage-dependent, beta 2 subunit 158 36 0.5 0.6 0.5 0.8 Catenin (cadherin-associated protein), alpha-like 1 158 62 0.5 0.5 0.7 0.8 LDL receptor adaptor protein 81 25 0.7 0.6 1.2 1.0 Insulin receptor 520 90 0.6 0.8 0.7 0.9 Mitogen-activated protein kinase kinase kinase 4 670 146 0.6 0.6 0.6 0.8 Tamoxifen, and Raloxifene in Ovariectomized Monkevs Fold change relative to SHAM control Sham Control (average) SD OVX EE Tamoxifen Ralolxifene Progesterone receptor 308 258 0.3 3.2 1.5 0.6 LIM and senescent cell antigen-like domains 1 508 269 0.4 1.4 1.1 0.8 Wingless-type MMTV integration site family, member 2B 59 11 0.6 1.5 1.1 0.8 Secreted frizzled-related protein I 441 78 0.5 3.6 1.1 0.8 Integrin, beta 5 117 45 0.6 1.0 0.9 0.9 Secreted frizzled-related protein 4 2018 995 0.5 1.9 1.4 0.4 Phospholipid transfer protein 1140 473 0.6 1.3 0.9 0.7 Cadherin 11, type 2, OB-cadherin (osteoblast) 795 204 0.6 2.1 1.9 0.8 Wingless-type MMTV integration site family, member 16 67 18 0.9 0.9 1.0 0.8 Phosphatase and tensin homolog (mutated in multiple advanced cancers 1) 269 30 0.6 1.2 1.0 0.7 Protein tyrosine kinase 9 133 14 0.6 1.3 1.1 0.8 Four and a half LIM domains 2 268 90 0.7 1.9 1.1 0.6 Dishevelled associated activator of morphogenesis 1 ·550 136 0.6 2.0 0.8 0.6 Calcium channel, voltage-dependent, beta 2subunit 82 24 1.9 1.1 0.9 1.5 Catenin (cadherin-associated protein), alpha-like 1 81 15 1.9 1.0 1.5 1.5 LDL receptor adaptor protein 58 36 1.4 0.8 1.6 1.4 Insulin receptor 333 66 1.6 1.2 1.2 1.4 Mitogen-activated protein kinase kinase kinase 4 431 53 1.6 0.9 1.0 1.2 OVX, ovariectomized; EE, ethinyl estradiol
Data derived from 4 animals/group (1 DNA chip/animal). - Progesterone receptor, secreted frizzled-related
protein 1, secreted frizzled-related protein 4, Dishevelled associated activator ofmorphogenesis 1, wingless-type MMTV integration site (family, member 2B; wnt2B), and integrin (beta 5) were increased 9.8-, 7.1-, 4.2-, 3.1-, and 2.6, and 1.7 fold, respectively, compared with untreated OVX controls. These same genes were up regulated by 1.2- to 4.5-fold following tamoxifen therapy. In contrast raloxifene therapy was associated with more modest changes in gene expression for these same signal transduction proteins (0.9- to 1.9-fold). The remaining genes examined were all downregulated by estradiol, tamoxifen (except for LDL receptor adaptor protein), and raloxifine. - Growth factors. Estradiol increased the expression of several genes encoding growth factors (GFs) as outlined in TABLE 47.
TABLE 47 Comparative GEP for Cell Cycle Genes in the Uterus Following Treatment with Estradiol, Tamoxifen, and Raloxifene in Ovariectomized Monkeys Fold change relative to OVX OVX (average) SD Sham EE Tamoxifen Raloxifene CDC28 protein kinase regulatory subunit 2 58 15 1.7 3.8 3.1 0.8 G1 to S phase transition 1 227 45 1.2 1.6 1.6 0.9 Testis Enhanced Gene Transcript (Bax Inhibitor 1) 1516 492 1.0 1.8 1.5 1.1 H2A histone family, member Y 482 94 1.2 1.4 1.7 1.0 H3 histone, family 3A 9692 447 1.1 1.4 1.4 1.0 H3 histone, family 3A 9495 1003 1.0 1.5 1.4 0.9 Histone H2A.F/Z variant 890 89 1.0 1.4 1.5 1.0 Cyclin D1 (PRAD1: parathyroid adenomatosis 1) 54 17 0.9 2.4 1.8 1.2 Cyclin-dependent kinase inhibitor 1C (p57, Kip2) 224 69 0.9 0.5 0.7 0.9 Cyclin-dependent kinase inhibitor 1C (p57, Kip2) 762 194 0.9 0.5 0.5 1.1 Cyclin-dependent kinase inhibitor 1C (p57, Kip2) 527 142 0.9 0.4 0.5 1.2 Fold change relative to SHAM control SHAM Control (average) SD OVX EE Tamoxifen Raloxifene CDC28 protein kinase regulatory subunit 2 96 66 0.6 2.3 1.9 0.5 G1 to S phase transition 1 277 87 0.8 1.3 1.3 0.7 Testis Enhanced Gene Transcript (Bax Inhibitor 1) 1579 341 1.0 1.8 1.5 1.1 H2A histone family, member Y 598 96 0.8 1.2 1.4 0.8 H3 histone, family 3A 10239 888 0.9 1.4 1.3 1.0 H3 histone, family 3A 9408 555 1.0 1.5 1.4 0.9 Histone H2A.F/Z variant 925 67 1.0 1.4 1.4 1.0 Cyclin D1 (PRAD1: parathyroid adenomatosis 1) 49 22 1.1 2.7 2.0 1.3 Cyclin-dependent kinase inhibitor 1C (p57, Kip2) 201 57 1.1 0.6 0.8 1.0 Cyclin-dependent kinase inhibitor 1C (p57, Kip2) 660 213 1.2 0.5 0.6 1.3 Cyclin-dependent kinase inhibitor 1C (p57, Kip2) 459 119 1.1 0.5 0.6 1.4 OVX, ovariectomized; EE, ethinyl estradiol
Data derived from 4 animals/group (1 DNA chip/animal). - The most prominent effects were observed for insulin-like GF binding protein 2 (36kDa) (7.1-fold increase), and insulin-like GF 1 (somatomedin C) (5.3- to 6.9-fold increase), compared with OVX controls. Genes encoding these growth factors were also upregulated by 2.7- and 3.7- to 4.8-fold following tamoxifen therapy. Raloxifene caused minor increases of (approximately 2-fold, similar to the sham group.
- Estradiol also upregulated insulin-like growth
factor binding protein 5, latent transforming growth factorbeta binding protein 1, and cysteine-rich angiogenic inducer 61 by 5.2-, 3.6-, and 3.5-fold, respectively, compared with OVX controls. In contrast tamoxifen and raloxifene were associated with only modest changes in genes encoding these growth factors, similar to the levels observed in the sham group (TABLE 46). - Extracellular matrix. A number of diverse extracellular matrix proteins were upregulated by estradiol as outlined in TABLE 47. Collagen
type I alpha 2, collagentype III alpha 1, collagen type I alphal, and collagen type IV alpha.1 were upregulated by estradiol treatment 13.2-, 6.8-, 6.6-, and 4.3-fold, respectively compared with OVX controls. Tamoxifen therapy also upregulated genes encoding these matrix proteins by 6.1-, 3.4-, 3.5-, and 3.2-fold, respectively. For the majority of the rest of the genes in this category, after treatment with tamoxifen or raloxifene, overall expression was brought back up to levels not that dissimilar to sham controls. - Transport, redox, and cell cycle. Estradiol increased expression of a variety of transport genes (solute carrier family 2 [facilitated glucose/fructose transporter];
member 5 ATPase; Na+/K+ transporting, beta 3 polypeptide; solute carrier family 2 [facilitated glucose/fructose transporter],member 5; solute carrier family 25 [mitochondrial carrier; adenine nucleotide translocator],member 5; ATPase, H+ transporting, lysosomal 38kDa, V0subunit d isoform 1; ATP synthase, H+ transporting, mitochondrial F0 complex, subunit c [subunit 9] isoform 3; solute carrier family 22 [organic cation transporter], member 1-like ATP synthase, H+ transporting, mitochondrial F0 complex, subunit c [subunit 9] isoform 3; chloride intracellular channel 4) by 2- to 7-fold; genes encoding redox proteins (SET domain bifurcated 1,peroxiredoxin 1, and cytochrome c oxidase subunits VIa and VIIa) by approximately 2- to 3-fold; and genes encoding cell cycle proteins (CDC28 protein kinase regulatory subunit 2) by up to 4-fold in estradiol treated animals compared with OVX controls. Estrodial treatment downregulated expression of the gene for the redox protein, thioredoxin interacting protein, 3-fold and the gene for the cell cycle protein, cyclin-dependent kinase inhibitor 1C (p57, Kip2), by 2- to 4-fold compared with OVX control. Although slightly less potent, tamoxifen exerted similar effects whereas raloxifene had little or no effect on any of the transporter, redox, and cell cycle genes studied. - Estrogen-induced genes. Several estrogen-induced genes (brain creatine kinase; cytoplasmic dynein; hippocalcin-like 1;
light polypeptide 1; brain prostaglandin D2 synthase 21kDa; hexokinase 1; and osteoblast cadherin 11, type 2) were upregulated by estradiol by 3- to 10-fold compared to OVX control However, the significance of these changes to uterine physiology and pathology has yet to be defined. - Ranking of Drug Activity According to Uterine GEP. To determine the relative estrogenic potency and score for a given estrogenic treatment, a potency axis was constructed by assigning a median GEP score of "0" for OVX controls (no estrogen) and a median GEP score of "100" for estradiol treated animals (maximum estradiol effect). The respective GEP scores for tamoxifen and raloxifene were plotted to determine their relative estrogenic potencies.
- Application of different filtering parameters-gene intensity >50, statistically different change from OVX controls, and genes showing >1.5-fold changes from OVX control values-permitted ranking of the relative treatment potencies according to defined gene expression profiling (GEP) criteria. These approaches yielded more useful information than unsupervised GEP data analysis.
- Of the 22,283 probes assayed per chip 225 individual genes showed statistically significant greater than 1.5-fold changes in expression level compared with OVX controls. Considering only this group of genes, tamoxifen showed a strong estrogenic response with a score of 59 and raloxifene had a weak estrogenic score of 23. In contrast, sham animals exhibit a baseline estrogenic score of 48.
- When considering fold changes alone and disregarding statistical significance, 673 genes showed greater than 1.5-fold change in expression level compared with OVX controls. Tamoxifen exhibited a strong estradiol effect, with a score of 71, raloxifene still had a weak estrogenic score of 34, and baseline for sham animals was 66.
- A further subanalysis was done using 123 genes that showed statistically significant greater than 1.5-fold changes in expression and are thought to have a role in uterine function. According to this analysis, tamoxifen retained a high estrogenic score of 69, raloxifene still had a weak estrogenic score of 20, and the sham baseline was 44. Using this approach, further subanalysis of specific gene groups showed that the estrogenic effects of tamoxifen (scores of 61 to 87) were consistently greater than those of raloxifene (scores of -11 to 32) in each category.
TABLE 48 Comparative GEP for Transport Proteins in the Uterus Following Treatment with Estradiol, Tamoxifen, and Raloxifene in Ovariectomized Monkeys Fold change relative to OVX OVX (average) SD Sham EE Tamoxifen Raloxifene Solute carrier family 2 (facilitated glucose/fructose transporter), member 5 171 101 1.9 4.4 2.2 1.2 ATPase, Na+/K+ transporting, beta 3 polypeptide 1147 1058 1.8 2.2 2.1 0.9 Solute carrier family 2 (facilitated glucose/fructose transporter), member 5 176 103 1.7 3.5 2.1 1.0 Solute carrier family 25 (mitochondrial carrier; adenine nucleotide translocator), member 5 923 463 1.5 2.5 2.2 1.1 ATPase, H+ transporting, lysosomal 38kda, V0 subunit d isoform 1 465 50 1.2 1.9 1.2 1.1 ATP synthase, H+ transporting, mitochondrial F0 complex, subunit c (subunit 9) isoform 3 811 121 1.3 2.0 2.0 1.2 Solute carrier family 22 (organic cation transporter), member 1-like 92 49 1.2 1.9 1.8 1.0 ATP synthase, H+ transporting, mitochondrial F0 complex, subunit c (subunit 9) isoform 3 1007 188 1.3 2.0 1.9 1.2 Chloride intracellular channel 4 287 185 1.8 1.7 1.9 1.4 Fold change relative to SHAM control SHAM Control (average) SD OVX EE Tamoxifen Raloxifene Solute carrier family 2 (facilitated glucose/fructose transporter), member 5 317 105 0.5 2.4 1.2 0.7 ATPase, Na+/K+ transporting, beta 3 polypeptide 2028 2519 0.6 1.2 1.2 0.5 Solute carrier family 2 (facilitated glucose/fructose transporter), member 5 291 134 0.6 2.1 1.3 0.6 Solute carrier family 25 (mitochondrial carrier; adenine nucleotide translocator), member 5 1351 518 0.7 1.7 1.5 0.8 ATPase, H+ transporting, lysosomal 38kda, V0 subunit d isoform 1 545 80 0.9 1.6 1.0 1.0 ATP synthase, H+ transporting, mitochondrial F0 complex, subunit c (subunit 9) isoform 3 1045 276 0.8 1.6 1.6 0.9 Solute carrier family 22 (organic cation transporter), member 1-like 112 41 0.8 1.6 1.5 0.8 ATP synthase, H+ transporting, mitochondrial F0 complex, subunit c (subunit 9) isoform 3 1355 184 0.7 1.5 1.4 0.9 Chloride intracellular channel 4 522 50 0.6 0.9 1.1 0.7 OVX, ovariectomized; EE, ethinyl estradiol Data derived from 4 animals/group (1 DNA chip/animal). TABLE 49 Comparative GEP for Redox Proteins in the Uterus Following Treatment with Estradiol, Tamoxifen, and Raloxifene in Ovariectomized Monkeys Fold change relative to OVX OVX (average) SD Sham EE Tamoxifen Raloxifene SET domain, bifurcated 1 928 171 1.3 3.0 1.9 1.1 Peroxiredoxin 12,575 923 1.2 1.9 1.7 1.0 Cytochrome c oxidase subunit via polypeptide 1912 199 1.1 1.5 1.3 1.0 Cytochrome c oxidase subunit viia polypeptide 2 (liver) 266 18 1.0 1.8 1.6 1.1 Ubiquinol-cytochrome c reductase, Rieske iron- sulfur polypeptide 1708 54 1.2 1.4 1.4 1.0 Thioredoxin interacting protein 5,300 644 0.6 0.3 0.6 1.0 Fold change relative to SHAM control Sham Control (average) SD OVX EE Tamoxifen Raloxifene SET domain, bifurcated 1 1209 238 0.8 2.3 1.4 0.8 Peroxiredoxin 13041 787 0.8 1.6 1.4 0.8 Cytochrome c oxidase subunit via polypeptide 11043 240 0.9 1.3 1.2 0.8 Cytochrome c oxidase subunit viia polypeptide 2 (liver) 255 94 1.0 1.8 1.7 1.1 Ubiquinol-cytochrome c reductase, Rieske iron- sulfur polypeptide 1881 80 0.8 1.1 1.1 0.8 Thioredoxin interacting protein 3327 778 1.6 0.5 0.9 1.7 OVX, ovariectomized; EE, ethinyl estradiol
Data derived from 4 animals/group (1 DNA chip/animal).TABLE 50 Comparative GEP for Extracellular Matrix Factors in the Uterus Following Treatment with Estradiol, Tamoxifen, and Raloxifene in Ovariectomized Monkeys Fold change relative to OVX OVX (average) SD Sham EE Tamoxifen Raloxifene Matrix metalloproteinase 19 11 5 5.1 6.3 1.6 0.9 Biglycan 23 28 2.7 1.9 2.0 2.4 Fibronectin 1 39 26 2.5 1.6 2.3 2.3 Collagen, type III, alpha 1 (Ehlers-Danlos syndrome type IV, autosomal dominant) 1084 471 2.8 6.8 3.4 1.9 Collagen, type I, alpha 2 2757 929 2.8 5.1 3.7 2.2 Collagen, type I, alpha 1 3056 697 2.8 6.6 3.5 1.8 Collagen, type IV, alpha 1 182 87 2.4 4.3 3.2 1.8 Heparan sulfate proteoglycan 2 (perlecan) 17 12 2.2 3.5 2.2 1.2 Procollagen C-endopeptidase enhancer 215 97 2.1 3.2 2.3 1.7 Collagen, type III, alpha 1 (Ehlers-Danlos syndrome type IV, autosomal dominant) 3445 859 2.1 4.1 2.9 2.0 Collagen, type V, alpha 1 189 82 2.1 4.0 1.3 1.2 Secreted protein, acidic, cysteine-rich (osteonectin) 561 172 2.1 2.9 2.2 1.7 Fibronectin 1 419 99 2.2 2.4 2.0 2.2 Fibrillin I (Marfan syndrome) 124 57 1.9 2.2 1.9 2.1 Serine (or cysteine) proteinase inhibitor, clade H (heat shock protein 47), member 1, (collagen binding protein 1) 501 15 2.0 3.3 2.2 1.4 Osteoglycin (osteoinductive factor, mimecan) 54 13 2.2 2.2 1.7 1.6 Fibulin 1 583 413 1.8 1.6 1.9 1.4 Fibronectin 1 648 126 2.0 1.9 1.9 1.7 Collagen, type VIII, alpha 2 39 19 1.7 2.1 1.8 1.9 Fibronectin 1 586 121 1.9 2.1 1.9 2.2 Collagen, type VI, alpha 3 3428 408 1.8 3.7 2.0 1.2 Collagen, type IV, alpha 2 929 335 1.7 3.3 2.2 1.4 Fibrillin 1 (Marfan syndrome) 874 453 1.6 3.5 2.1 1.5 Collagen, type IV, alpha 1 690 203 1.7 3.7 2.7 1.2 Fibronectin 1 757 89 1.7 1.8 1.6 1.9 SPARC-like 1 (mast9, hevin) 4971 1787 1.6 2.4 1.3 1.7 Nidogen (enactin) 24 16 1.4 3.6 1.9 2.4 Laminin, beta 1 215 102 1.4 1.4 1.4 1.1 - Procollagen-proline, 2-oxoglurate 4- dioxygenase(proline 4-hydroxylase), alpha polypeptide II 120 49 1.5 2.6 1.6 1.2 Chondroitin sulfate proteoglycan 2 (versican) 248 85 1.4 3.6 2.9 1.4 Tenascin C (hexabrachion) 74 36 1.3 1.2 3.8 1.0 Collagen, type I, alpha 2 154 34 3.2 13.2 6.1 3.2 Chitinase 3-like 1 (cartilage glycoprotein- 39) 100 25 1.4 3.9 1.7 1.1 Dermatopontin 132 92 1.8 1.9 1.8 1.5 Fold change relative to SHAM control SHAM Control (average) SD OVX EE Tamoxifen Raloxifene Matrix metalloproteinase 19 59 27 0.2 1.2 0.3 0.2 Biglycan 61 11 0.4 0.7 0.7 0.9 Fibronectin 1 100 31 0.4 0.6 0.9 0.9 Collagen, type III, alpha 1 (Ehlers-Danlos syndrome type IV, autosomal dominant) 2992 860 0.4 2.5 1.2 0.7 Collagen, type I, alpha 2 7758 3072 0.4 1.8 1.3 0.8 Collagen, type I, alpha 1 8502 5403 0.4 2.4 1.3 0.7 Collagen, type IV, alpha 1 436 183 0.4 1.8 1.3 0.7 Heparan sulfate proteoglycan 2 (perlecan) 38 14 0.5 1.6 1.0 0.6 Procollagen C-endopeptidase enhancer 449 97 0.5 1.5 1.1 0.8 Collagen, type III, alpha 1 (Ehlers-Danlos syndrome type IV, autosomal dominant) 7354 1454 0.5 1.9 1.4 1.0 Collagen, type V, alpha 1 394 137 0.5 1.9 0.6 0.6 Secreted protein, acidic, cysteine-rich (osteonectin) 1187 361 0.5 1.4 1.0 0.8 Fibronectin 1 920 427 0.5 1.1 0.9 1.0 Fibrillin 1 (Marfan syndrome) 236 71 0.5 1.2 1.0 1.1 Serine (or cysteine) proteinase inhibitor, clade H (heat shock protein 47), member 1, (collagen binding protein 1) 1011 306 0.5 1.6 1.1 0.7 Osteoglycin (osteoinductive factor, mimecan) 120 76 0.4 1.0 0.8 0.7 Fibulin 1 1026 469 0.6 0.9 1.1 0.8 Fibronectin 1 1288 483 0.5 0.9 0.9 0.9 Collagen, type VIII, alpha 2 68 18 0.6 1.2 1.1 1.1 Fibronectin 1 1089 456 0.5 1.1 1.0 1.2 Collagen, type VI, alpha 3 6008 1342 0.6 2.1 1.1 0.7 Collagen, type IV, alpha 2 1594 548 0.6 1.9 1.3 0.8 Fibrillin 1 (Marfan syndrome) 1388 424 0.6 22 1.3 1.0 Collagen, type IV, alpha 1 1143 276 0.6 2.2 1.6 0.7 Comparative GEP for Extracellular Matrix Factors in the Uterus Following Treatment with Estradiol, Tamoxifen, and Raloxifene in Ovariectomized Monkeys Fibronectin 1 1301 425 0.6 1.1 0.9 1.1 SPARC-like 1 (mast9, hevin) 8078 2034 0.6 1.5 0.8 1.1 Nidogen (enactin) 34 15 0.7 2.6 1.4 1.7 Laminin, beta 1 302 48 0.7 1.0 1.0 0.8 Procollagen-proline, 2-oxoglutarate 4- dioxygenase (proline 4-hydroxylase), alpha polypeptide II 184 92 0.7 1.7 1.0 0.8 Chondroitin sulfate proteoglycan 2 (versican) 340 127 0.7 2.6 2.1 1.0 Tenascin C (hexabrachion) 96 34 0.8 0.9 2.9 0.8 Collagen, type I, alpha 2 493 255 0.3 4.1 1.9 1.0 Chitinase 3-like 1 (cartilage glycoprotein- 39) 141 59 0.7 2.8 1.2 0.8 Dermatopontin 233 43 0.6 1.1 1.0 0.8 OVX, ovariectomized; EE, ethinyl estradiol
Data derived from 4 animals/group (1 DNA chip/animal).TABLE 51 Comparative GEP for Growth Factors in the Uterus Following Treatment with Estradiol, Tamoxifen, and Raloxifene in Ovariectomized Monkeys Fold change relative to OVX OVX (average) SD Sham EE Tamoxifen Raloxifene Bone morphogenetic protein 1 93 24 2.2 2.9 2.2 1.4 Bone morphogenetic protein 1 79 24 1.8 2.6 1.9 1.2 Cysteine-rich, angiogenic inducer, 61 172 80 1.8 3.5 1.6 1.7 Fibroblast growth factor 2 (basic) 34 22 2.0 2.1 2.0 2.0 Growth associated protein 43 37 8 2.4 2.0 1.9 1.7 Insulin receptor 520 90 0.6 0.8 0.7 0.9 Insulin-like growth factor 1 (somatomedin C) 156 48 2.7 6.9 4.6 2.2 Insulin-like growth factor 1 (somatomedin C) 102 40 2.2 5.3 3.7 1.5 Insulin-like growth factor 1 (somatomedin C) 310 79 1.9 6.3 4.8 2.3 Insulin-like growth factor binding protein 2, 36kda 596 77 1.6 7.1 2.7 1.1 Insulin-like growth factor binding protein 5 299 56 1.9 5.2 2.0 2.0 Latent transforming growth factor beta binding protein 1 181 80 2.1 3.6 2.6 1.8 Pituitary tumour-transforming 1 interacting protein 59 25 2.1 1.8 1.9 1.5 Stem cell growth factor; lymphocyte secreted C-type lectin 92 12 1.6 2.2 1.4 1.2 Transforming growth factor, beta-induced, 68kda 376 97 2.2 1.7 2.2 1.7 Intercrine-alpha, mrna sequence 859 76 1.6 1.5 1.5 1.3 Fold change relative to SHAM control SHAM Control (average) SD OVX EE Tamoxifen Raloxifene Bone morphogenetic protein 1 205 57 0.5 1.3 1.0 0.6 Bone morphogenetic protein 1 143 44 0.5 1.4 1.0 0.7 Cysteine-rich, angiogenic inducer, 61 303 200 0.6 2.0 0.9 0.9 Fibroblast growth factor 2 (basic) 67 40 0.5 1.1 1.0 1.0 Growth associated protein 43 88 27 0.4 0.8 0.8 0.7 Insulin receptor 333 66 1.6 1.2 1.2 1.4 Insulin-like growth factor 1 (somatomedin C) 417 68 0.4 2.6 1.7 0.8 Insulin-like growth factor 1 (somatomedin C) 226 69 0.5 2.4 1.7 0.7 Insulin-like growth factor 1 (somatomedin C) 581 185 0.5 3.4 2.6 1.2 Insulin-like growth factor binding protein 2, 36kda 957 104 0.6 4.4 1.7 0.7 Insulin-like growth factor binding protein 5 562 260 0.5 2.8 1.0 1.1 Latent transforming growth factor beta binding protein 1 389 322 0.5 1.7 1.2 0.8 Pituitary tumour-transforming 1 interacting protein 126 17 0.5 0.9 0.9 0.7 Stem cell growth factor; lymphocyte secreted C-type lectin 148 36 0.6 1.4 0.9 0.7 Transforming growth factor, beta-induced, 68kda 843 212 0.4 0.8 1.0 0.8 Intercrine-alpha, mrna sequence 1383 258 0.6 0.9 0.9 0.8 OVX, ovariectomized; EE, ethinyl estradiol
Data derived from 4 animals/group (1 DNA chip/animal). - Discussion. Previous studies have established that the OVX cynomolgus monkey model of estrogen deficiency is relevant to humans with respect to hormonal effects on the uterus. Cline JM et al., Toxicol Pathol.29:84-90 (2001). Data from these studies showed increased endometrial hyperplasia following treatment with estradiol or tamoxifen, and were confirmed in the present EXAMPLE. Moreover, we showed that in this model, estradiol reversed the effects of OVX on gonadotropin gene upregulation in the pituitary (TABLE 45), providing further evidence that the OVX monkey represents a valid model for evaluating the gene expression profiling (GEP) of estradiol and SERMs.
- Overall, the gene expression data reported in the present EXAMPLE correlated with the histopathological effects of estradiol and SERMs on the uterus. Experimental and clinical studies have demonstrated the unequivocal proliferative effects of estrogen and tamoxifen on the uterus and uterine tumour cells. Gottardis MM et al., Cancer Res.48:812-815 (1988). Tamoxifen induced an estrogen-like gene expression profiling in the uterus of OVX monkeys that was consistent with uterine cystic hyperplasia, stromal fibrosis, and increased progesterone receptor expression observed in ovariectomized macaques. Cline JM et al., Toxicol Pathol.29:84-90 (2001). The minor changes in uterine GEPs of OVX monkeys following raloxifene therapy were in accord with studies showing its lack of pathological effects on the human uterus. Cohen FJ et al., Obstet Gynecol.95:104-110 (2000).
- In the uterus, the proliferative effects of tamoxifen are mediated in part by GFs. Increased expression of IGF-1 and related binding proteins following estrogen therapy is well documented and may be important for local paracrine stimulation of uterine tissue growth. Norstedt G et al., Acta Endocrinologica (Copenh).120:466-472 (1989); Stygar D et al., Reproductive Biology and Endocrinology.1:40 (2003). Induction of cysteine-rich angiogenic inducer "61" and transforming growth factor beta genes has also been described in response to estrogen, and both growth factors appear to mediate endometrial growth and hyperplasia. Sampath D et al., Endocrinology. 142:2540-2548 (2001); Takahashi T et al., Cell Growth Differ. 5:919-935 (1994); Sartor BM et al., Reprod Toxicol.9:225-231 (1995). These observations support data from the present EXAMPLE in which estradiol increased the expression of these growth factors in the uterus (TABLE 46).
- Recent studies using gene expression profiling in human endometrium have identified an array of genes and gene families associated with the implantation process, which involves a complex interaction between the embryo and the maternal endometrium. Locally secreted wnt proteins initiate a cell signaling pathway that involves activation of membrane-associated frizzle receptors (FzRs), which in turn activate Dishevelled (Dvl) and regulation of nuclear gene transcription required for implantation. Frizzle-related proteins (FRPs) modulate wnt signaling at the wnt-FzR-ligand binding site, and secreted FRP4 (also know as FrpHE) inhibits wnt signaling. Although wnt genes are controlled by sex steroids, including estrogen, the relevance of these findings to estrogen-induced uterine growth is not known. Tulac S et al., J Clin Endocrinol Metab. 88:3860-3866 (2003). According to studies in cancer cell lines, wnt2B signaling appears to play a role in tumourigenesis. Katoh M, Int J Mol Med. 8:657-660 (2001); Ricken A et al., Endocrinology. 143:2741-2749 (2002). Moreover, increased expression of secreted FRP1 and secreted FRP4 was observed in human uterine leiomyomas, the uterus of OVX rats administered estradiol, and human proliferative endometrium. Fujita M et al., J Mol Endocrinol. 28:213-223 (2002); Fukuhara K et al., J Clin Endocrinol Metab. 87:1729-1736 (2002). Whereas stromal FRP4, which is upregulated by estrogen, was involved in endometrial proliferation, secreted FRP1 was associated with antiapoptotic and antitumour effects. These studies are relevant to data reported in the present EXAMPLE, which showed that increased uterine expression of genes encoding wnt2B, Dvl, and secreted FRP1 and FRP4 following estradiol therapy (TABLE 46). The data suggest estrogenic effects on the uterus may involve the wnt signaling pathway and its regulation by secreted FRP4. Tulac S et al., J Clin Endocrinol Metab. 88:3860-3866 (2003).
- Long-term treatment with conjugated equine estrogens upregulates progesterone receptors in the endometrial stromal tissue of OVX cynomolgus macaques. Wang H et al., Reprod Biol Endocrinol. 1:7 (2003). Estradiol increased progesterone receptor gene expression in the present EXAMPLE (TABLE 46), further validating the OVX monkey model for gene expression profiling.
- Estradiol also increased uterine expression of other functional classes of genes, including extracellular matrix proteins (TABLE 47) and genes generally associated with cell proliferation (e.g., cell cycle, redox, and transport; TABLE 48). These effects are likely related to estrogen-induced uterine hyperplasia, which is characterized by increased cell proliferation and tissue growth. Cline JM et al., Toxicol Pathol. 29:84-90 (2001).
- Analysis of the gene expression profiling (GEP) profiles associated with estradiol and SERMs revealed important differences in the molecular mechanisms through which these agents affect the uterus. Thus, tamoxifen's gene expression profiling suggests, that it acts primarily via estrogenic stimulation of growth factors, signal transduction mechanisms, extracellular matrix protein synthesis, and genes related to cell proliferation in the uterus. In contrast, raloxifene exhibited weak estrogenic activity with little or no effect on these molecular pathways as indicated by its gene expression profiling.
- Further analysis of the gene expression profiling (GEP) data involved the development of a novel scoring system for ranking the relative estrogenic effects of tamoxifen and raloxifene. Across each of the seven different classes of genes expressed, tamoxifen ranked as the most estrogenic agent, with scores ranging from 69 to 87, compared with 100 for estradiol. Raloxifene was much less estrogenic by these criteria as shown by its low scores ranging from -11 to 32, compared with 100 for estradiol.
- In conclusion, gene expression profiling (GEP) using DNA microarray combined with the novel method of ranking therapeutic agents described here is a powerful technique for defining and predicting the relative pharmacological and toxicological actions of new chemical entities, and represents a new paradigm for drug development in the pharmaceutical industry. Moreover, this procedure has enormous potential for identifying efficacy and safety biomarkers that can be used to refine the drug screening process, reducing the time and costs required for taking a drug from discovery to clinic.
- Introduction and summary. The aim of this EXAMPLE is to further evaluate the effect of FGF23CTP on angiogenesis as shown in EXAMPLE III by using a hypoxic vascular retinopathy mouse model.
- Methods. Seven days old C57/B16J mice are put together with their nursing parent in a sealed container ventilated by a mixture of oxygen and compressed air to a final oxygen concentration of 75% ± 2% until day 12. Returned at room air, the animals develop a relative ischemia of the retina with neovascularization starting as early as day 14.
- On day 12, when animals returned from the oxygen incubation, a volume of 2.0 µl is injected in the eye using a glass pipette with a diameter of about 150 µm at its tip. The right eye is injected with 6 microgram (µg) FGF23CTP (3 µg / µl) and the left eye of the animal with PBS as individual control.
- For the intravitreal injection of a substance at day 12, mice are anesthetized by inhalation of isoflurane. Five days later the animals are sacrificed after perfusion with dextran-florescein and retinal flatmounts are prepared. The coded whole mounts allow to evaluate the vascular changes of the retinal brindly. The proliferation score includes quantification of the proliferation including the papilla, vascular development, vasoconstriction, retinal bleeding and tortuosity of the vessels, features also seen in human retinal disease.
- Animals. In total, 44 animals are used for injection with FGF23CTP and PBS. Of those, 8 animals died during hyperoxia or after injection, 2 animals are not perfused, 5 animals are paraffin embedded for evaluation of neurons, of which only three could be examined, and from 29 of these animals retinal flatmounts are prepared.
- Evaluation of the angioproliferative changes. Evaluation of the angioproliferative changes in the retinal preparations is performed in a masked way on coded preparations. Retinopathy scoring system is adapted from Higgins, R. D., et al. (J. AAPOS 3: 114-116 (1999)) that was developed after modification of a scoring system used clinically in the neonatal intensive care unit. The following features are taken into consideration: neovascularisation of the optic disc, blood vessel tufts formation, large clusters of blood vessel tufts, central vasoconstriction and tortuosity of the vessels. Retinal haemorrhages are not taken into account as they may also result from the intraocular injection.
- For each criteria, a defined number of points (P) is assigned, which are summed up to a total proliferation score. The higher the score, the worse the hypoxia induced retinopathy. In detail:
- Neovascularisation of the optic disc: either 1 or 0 points are assigned in case optic disc proliferation is measured (1 P) or absence (0 P).
- Blood vessel tufts formation: the score for blood vessel tufts is determined by dividing every clock hour of the preparation surface in 4 zones: Zone 1 (optic disc zone) is evaluated in addition; Zone 2: one point for every wing (maximal 4 P); Zone 3: one point for every clock hour (maximal 12 P); and Zone 4: one point for every clock hour (maximal 12 P). Thus, a maximum of 28 points is measured provided that no vascular areas exist, and a maximum of 12 points is calculated in case of complete avascularization.
- Large clusters of blood vessel tufts: every large cluster of blood vessel tufts covering more than 3 sectors is counted as one point. Thus, maximal 8 points can be measured provided that no avascular areas exist, and maximal 4 points are assignable for complete avascularization.
- Central vasoconstriction: 1 point is assigned to a vasoconstriction of
zone 1 of greater than 50%; I point is allocated if the vasoconstriction is greater than 50% of every wing ofzone 2 and 3. Thus, maximal 1 point can be assigned tozone 1, and maximal 4 points each forzones 2, 3 and 4. Since so far no vasoconstriction is ever observed for zone 4, a maximum of total 9 points (without zone 4) can be allotted. - Tortuosity of the vessels: 2 points are assigned if less than one-third of the vessels are tortuous; if the amount of tortuous blood vessels is between one-third and two-thirds, 4 points are allocated, and in case more than two-thirds of the vessels are tortuous, than 6 points are given.
- The theoretical maximum of points is never reached, e.g. Zone 4 never shows avascular zones. Proliferation in avascular zones is never observed. This is in principle a mutual exclusion of criteria; the existence of vascular proliferations has a higher impact on the retinopathy score than large avascular areas. Therefore, the maximum score ever counted with this system is 38 points using a substance which is considered to enhance vascular proliferation.
- The proliferation score relating to vascular changes on retinal flatmounts for individual animals treated with FGF23CTP (right eye) and PBS control (left eye) are measured as described above. The severity of retinopathy varies from animal to animal.
TABLE 52 summarizes the determined proliferation score.TABLE 52 Proliferation score right eye left eye right eye left eye Animal No. FGF23CTP PBS Animal No. FGF23CTP PBS 146.1 4 4 150.1 14 16 146.2 13 8 150.2 8 26 146.3 8 9 150.3 17 24 146.4 3 5 150.4 30 29 146.5 6 8 160.2 10 7 146.6 1 9 160.3 10 7 146.7 2 4 160.4 16 20 146.8 5 6 160.5 28 28 147.1 9 8 161.1 30 15 147.2 8 9 161.2 21 33 147.3 2 8 161.3 17 22 147.4 11 12 147.5 1 11 149.1 5 26 149.2 14 36 149.3 8 10 149.4 17 12 149.5 10 8 - The proliferation scores of all animals are further displayed as box plot in
Figure 2 . Comparing the individual treated (right eye, FGF23CTP) with control eye (left, PBS)) the effect of FGF23CTP injection reaches statistical significance in a paired t-test with p= 0.04 (TABLE 53).TABLE 53 Paired t-test Mean Difference DF t-Value P-Value -3,172 28 -2,183 0,0375 - The proliferation scores for the separate factors are presented in TABLE 54, and the respective paired t-tests in TABLE 55 to 57.
TABLE 54 Proliferation scores proliferation sum blood vessel tufts large clusters of prolif. avascular zone tortuosity of vessels right eye left eye right eye left eye right eye left eye right eye left eye right eye left eye FGF23CTP PBS FGF23CTP PBS FGF23CTP PBS FGF23CTP PBS FGF23CTP PBS 2 2 2 2 0 0 1 2 1 0 10 8 10 8 0 0 3 0 0 0 7 9 6 9 0 0 1 0 0 0 2 4 2 4 0 0 1 1 0 0 4 8 4 8 0 0 2 0 0 0 1 9 1 9 0 0 0 0 0 0 1 2 1 2 1 1 1 1 0 1 4 6 3 5 1 0 1 0 0 0 6 4 6 4 0 0 1 1 2 3 5 6 5 6 0 0 0 0 3 3 0 4 0 4 1 1 1 1 1 3 7 7 7 7 2 2 2 2 2 3 0 7 0 7 0 0 0 0 1 4 2 17 2 14 0 2 3 4 0 5 8 25 7 20 1 5 4 6 2 5 4 6 4 5 0 1 3 3 1 1 10 6 10 6 0 0 2 2 5 4 6 4 6 3 0 0 3 3 1 1 8 9 7 7 1 2 4 5 2 2 4 21 4 17 0 4 3 4 1 4 11 14 10 13 0 1 4 6 2 4 17 18 14 15 3 3 7 5 6 6 6 3 5 3 1 0 3 3 1 1 6 5 6 5 0 0 2 2 2 0 12 14 7 11 4 3 3 4 1 2 18 20 14 16 3 4 6 6 4 2 18 9 13 7 4 2 6 4 6 2 14 21 11 15 5 3 5 7 2 5 12 16 9 11 2 5 4 5 1 1 TABLE 55 Paired t-test proliferation sum Mean Difference DF t-Value P-Value -2,724 28 -2,514 0,0180 TABLE 56 Paired t-test avascular-zone Mean Difference DE t-Value P-Value -0,034 28 -0,154 0,8791 TABLE 57 Paired t-test tortuosity of the vessels Mean Difference DF t-Value P-Value -0,517 28 -1,543 0,1341 - Evaluation of the toxicity. From the five mice originally planed for evaluation of neuronal damage after injection of FGF23CTP in the right eye and PBS in the left eye, only three are studied due to damage to the lens in one eye and fixation problems in another animal.
- The total thickness of the outer nuclear layer, the inner nuclear layer and the ganglion cell layer is measured using a standardized magnification after paraffin embedding and hematoxylin and eosin (HE)-staining. Three sections of each eye are measured at three locations each. TABLE 58 shows the result of the measurements in mm using a x200 magnification. Sections are encoded for evaluation.
TABLE 58 Neuronal Damage Animal No. Outer nuclear layer Inner nuclear layer Ganglion cell layer right left right left right left 150-5 10,5 11 6 6,5 2,5 2 11 9 7 5 3 2 10,5 10 5 5,5 2 3 10 10 5,5 5 2 1,5 10 10,5 7 6 2,5 3,5 11 10 6 7 2 2 11 9 6,5 5 2,5 1,5 11,5 11 6,5 7 2,5 2,5 10 10 6,5 6 2 2 150-7 10,5 10,5 6 6 1,5 2 12 12 7 7 2 2 10 9 6 5,5 2,5 3 10 11 6 7 2 2 10 11 6 6 2 2,5 11,5 11 7 7 2,5 3 10 11 6 6,5 2 2 10 12,5 5,5 6 2 2 10 7 2,5 150-9 10,5 10 5 6 2 2 11 10 6 6 2 2,5 10,5 11 6 5,5 2 1,5 11 9 5 6 2 2,5 11 11 5 5 2,5 2 12 11 6 5,5 2,5 2,5 10 12 5,5 6 3 2 11 9 5,5 6 3 2,5 10 11 6,5 5 2 1,5 variance 0,64121279 0,9600273 0,63245553 0,69337525 0,38078866 0,50636968 average 10,6346154 10,462963 6 6 2,25 2,22222222 - Based on the measurements performed on the three animals, FGF23CTP is found not to induce any neuronal damage in the eye. In detail, there is no marked difference in the thickness of the neuronal layers of the inner nuclear layer, the outer nuclear layer or the ganglion cell layer five days after the injection of either FGF23CTP or PBS.
-
- <110> Novartis AG
- <120> Use of fibroblast growth factor fragments
- <130> 4-33264A
- <160> 4
- <170> PatentIn version 3.1
- <210> 1
<211> 251
<212> PRT
<213> Homo sapiens - <400> 1


- <210> 2
<211> 75
<212> PRT
<213> Homo sapiens - <400> 2

- <210> 3
<211> 756
<212> DNA
<213> Homo sapiens - <400> 3

- <210> 4
<211> 228
<212> DNA
<213> Homo sapiens - <400> 4

Claims (8)
- A fragment of FGF23, wherein said fragmenta) consists of the sequence of SEQ ID NO 2, orb) is a functional variant of the polypeptide of SEQ ID NO. 2, having at least 90% sequence-identity with SEQ ID NO 2, derived by conservative amino acid substitution of the amino acid sequence of SEQ ID NO 2.
- A polypeptide according to claim 1 for use as a medicament.
- A polypeptide according to claim 1 for the treatment of a disease associated with increased angiogenesis.
- A polypeptide according to claim 3, wherein the disease associated with increased angiogenesis is selected from the group consisting of retinopathies, age-related macular degeneration, haemangioblastoma, haemangioma, tumors and cancer.
- A polypeptide according to claim 4, wherein the disease associated with increased angiogenesis is retinopathy.
- A polypeptide according to claim 5, wherein the disease associated with enhanced angiogenesis is cancer.
- Use of a polypeptide according to claim 1 for the manufacture of a medicament for treatment of a disease selected from the group consisting of retinopathies, age-related macular degeneration, haemangioblastoma, haemangioma, tumors and cancer.
- A pharmaceutical composition comprising a polypeptide according to claim 1 and a pharmaceutically-acceptable carrier.
Applications Claiming Priority (3)
| Application Number | Priority Date | Filing Date | Title |
|---|---|---|---|
| US51807303P | 2003-11-07 | 2003-11-07 | |
| US57224704P | 2004-05-18 | 2004-05-18 | |
| PCT/EP2004/012572 WO2005045044A2 (en) | 2003-11-07 | 2004-11-05 | Use of fibroblast growth factor fragments |
Publications (2)
| Publication Number | Publication Date |
|---|---|
| EP1682665A2 EP1682665A2 (en) | 2006-07-26 |
| EP1682665B1 true EP1682665B1 (en) | 2011-04-27 |
Family
ID=34576820
Family Applications (1)
| Application Number | Title | Priority Date | Filing Date |
|---|---|---|---|
| EP04797676A Expired - Lifetime EP1682665B1 (en) | 2003-11-07 | 2004-11-05 | Use of fibroblast growth factor fragments |
Country Status (7)
| Country | Link |
|---|---|
| US (3) | US20090093398A1 (en) |
| EP (1) | EP1682665B1 (en) |
| JP (1) | JP5118851B2 (en) |
| AT (1) | ATE507296T1 (en) |
| DE (1) | DE602004032457D1 (en) |
| ES (1) | ES2365852T3 (en) |
| WO (1) | WO2005045044A2 (en) |
Families Citing this family (13)
| Publication number | Priority date | Publication date | Assignee | Title |
|---|---|---|---|---|
| US20030220258A1 (en) * | 2001-12-21 | 2003-11-27 | Robbert Benner | Treatment of ischemic events |
| US7358330B2 (en) * | 2001-03-29 | 2008-04-15 | Biotempt B.V. | Immunoregulatory compositions |
| US7294704B2 (en) | 2003-08-15 | 2007-11-13 | Diadexus, Inc. | Pro108 antibody compositions and methods of use and use of Pro108 to assess cancer risk |
| US20090227505A1 (en) * | 2004-01-07 | 2009-09-10 | Biotempt B.V. | Methods and uses for protein breakdown products |
| JP2006347979A (en) * | 2005-06-17 | 2006-12-28 | National Institute Of Advanced Industrial & Technology | Drug for wound treatment and / or promotion of wound healing |
| EP1864692A1 (en) * | 2006-06-07 | 2007-12-12 | Biotempt B.V. | Use of peptides for the control of radiation injury |
| US11308462B2 (en) | 2014-05-13 | 2022-04-19 | Clear Token Inc | Secure electronic payment |
| EP3316159A4 (en) | 2015-06-25 | 2019-08-14 | Advanced Telecommunications Research Institute International | PREDICTION DEVICE BASED ON MULTI-BODY ASSOCIATED SYSTEM AND PREDICTION PROGRAM |
| EP3438282A4 (en) | 2016-03-29 | 2020-05-06 | Advanced Telecommunications Research Institute International | SCREENING PROCEDURE FOR SUITABLE SUBSTANCES FOR AN ACTIVE COMPONENT FOR PREVENTING OR TREATING AT LEAST ONE DISEASE SELECTED FROM THE GROUP OF RENAL UNDER FUNCTION, CHRONIC KIDNEY DISEASE, AND KIDNEY FAILURE |
| EP3466446B1 (en) | 2016-03-29 | 2023-12-27 | Karydo Therapeutix, Inc. | Pharmaceutical composition or food composition, and method for assessing effect of active ingredient in vivo |
| JPWO2021075535A1 (en) * | 2019-10-18 | 2021-04-22 | ||
| US20230382966A1 (en) * | 2020-10-27 | 2023-11-30 | Indiana University Research And Technology Corporation | Novel klotho interaction site in the c-terminus of fgf23 |
| CN114940990B (en) * | 2022-06-20 | 2023-03-14 | 北京市神经外科研究所 | Gene mutation site related to intracranial aneurysm and application thereof |
Family Cites Families (8)
| Publication number | Priority date | Publication date | Assignee | Title |
|---|---|---|---|---|
| EP1261638A2 (en) * | 2000-03-08 | 2002-12-04 | Chiron Corporation | Human fgf-23 gene and gene expression products |
| US20030105302A1 (en) * | 2000-03-08 | 2003-06-05 | Nobuyuki Itoh | Human FGF-23 gene and gene expression products |
| CA2418215A1 (en) * | 2000-07-19 | 2002-01-31 | Advanced Research & Technology Institute | Novel fibroblast growth factor (fgf23) and methods for use |
| CA2431655A1 (en) * | 2000-11-15 | 2002-05-23 | Akiko Itai | Method of profiling protein |
| JP2002223753A (en) * | 2001-01-30 | 2002-08-13 | Hitachi Ltd | Oligonucleotide arrays for drug response analysis |
| AU2002302581A1 (en) * | 2001-04-26 | 2002-11-11 | Geneprot, Inc. | Human fibroblast growth factor-related compositions |
| EP1491628A4 (en) * | 2002-03-29 | 2006-10-18 | Nat Inst Of Advanced Ind Scien | NOVEL GALACTOSE TRANSFERASES AND THEIR PEPTIDES, AND NUCLEIC ACID ENCODING THE SAME TRANSFERASES |
| AU2003231402A1 (en) * | 2002-04-24 | 2003-11-10 | Kansai Technology Licensing Organization Co., Ltd. | Kidney disease-associated genes expressed in proximal tubule |
-
2004
- 2004-11-05 US US10/578,470 patent/US20090093398A1/en not_active Abandoned
- 2004-11-05 JP JP2006538755A patent/JP5118851B2/en not_active Expired - Fee Related
- 2004-11-05 WO PCT/EP2004/012572 patent/WO2005045044A2/en active Application Filing
- 2004-11-05 EP EP04797676A patent/EP1682665B1/en not_active Expired - Lifetime
- 2004-11-05 AT AT04797676T patent/ATE507296T1/en not_active IP Right Cessation
- 2004-11-05 ES ES04797676T patent/ES2365852T3/en not_active Expired - Lifetime
- 2004-11-05 DE DE602004032457T patent/DE602004032457D1/en not_active Expired - Lifetime
-
2011
- 2011-06-03 US US13/152,750 patent/US20120028896A1/en not_active Abandoned
-
2012
- 2012-10-19 US US13/656,084 patent/US20130040882A1/en not_active Abandoned
Also Published As
| Publication number | Publication date |
|---|---|
| ES2365852T3 (en) | 2011-10-11 |
| DE602004032457D1 (en) | 2011-06-09 |
| EP1682665A2 (en) | 2006-07-26 |
| JP5118851B2 (en) | 2013-01-16 |
| US20130040882A1 (en) | 2013-02-14 |
| ATE507296T1 (en) | 2011-05-15 |
| HK1095160A1 (en) | 2007-04-27 |
| WO2005045044A2 (en) | 2005-05-19 |
| US20090093398A1 (en) | 2009-04-09 |
| JP2007521799A (en) | 2007-08-09 |
| US20120028896A1 (en) | 2012-02-02 |
| WO2005045044A3 (en) | 2005-11-10 |
Similar Documents
| Publication | Publication Date | Title |
|---|---|---|
| US20120028896A1 (en) | Use of fibroblast growth factor fragments | |
| Yang et al. | Microarray profiling of skeletal muscle tissues from equally obese, non-diabetic insulin-sensitive and insulin-resistant Pima Indians | |
| Andreelli et al. | Defective regulation of phosphatidylinositol-3-kinase gene expression in skeletal muscle and adipose tissue of non-insulin-dependent diabetes mellitus patients | |
| US7879544B2 (en) | Methods of identifying adipocyte specific genes, the genes identified, and their uses | |
| Casarini et al. | Acromegaly: correlation between expression of somatostatin receptor subtypes and response to octreotide-lar treatment | |
| Trošt et al. | A microarray based identification of osteoporosis-related genes in primary culture of human osteoblasts | |
| EP3963099A1 (en) | Frataxin-sensitive markers for determining effectiveness of frataxin replacement therapy | |
| MXPA03009510A (en) | Repeat sequences of the ca125 gene and their use for diagnostic and therapeutic interventions. | |
| Zhang et al. | Genetic risk factors for post-transplantation diabetes mellitus in Chinese Han renal allograft recipients treated with tacrolimus | |
| US9518298B2 (en) | DACH1 as a biomarker for diabetes | |
| HK1095160B (en) | Use of fibroblast growth factor fragments | |
| JP2008503212A (en) | Methods for diagnosis and treatment of obesity, diabetes and insulin resistance | |
| CN101328502B (en) | A method and kit for predicting the antihypertensive efficacy of hydrochlorothiazide | |
| US20070099828A1 (en) | Biomarkers for the efficacy of calcitonin and parathyroid hormone treatment | |
| DK2220256T3 (en) | An in vitro method for the diagnosis of skin cancer | |
| CN101113466A (en) | Susceptibility genes of hyperthyroidism and their application | |
| US20070275382A1 (en) | Biomarkers for the Efficacy of Somatostatin Analogue Treatment | |
| Moin et al. | Effectiveness of analog of Humanin in ameliorating streptozotocin-induced diabetic nephropathy in Sprague Dawley rats | |
| Williams et al. | Coexisting prolactinoma and primary aldosteronism: Is there a pathophysiological link? | |
| Chen et al. | Lysosome-related genes are regulated in the orbital fat of patients with graves’ ophthalmopathy | |
| TW200540184A (en) | CD7 as biomarker and therapeutic target for psoriasis | |
| CN106834496B (en) | PNLIPRP3 gene and application of expression product thereof in diagnosis and treatment of tongue squamous cell carcinoma | |
| Xiong et al. | Effect of growth hormone on cell proliferation and biological behavior of adamantinomatous craniopharyngioma cells | |
| WO2003072779A1 (en) | Method of using pituitary-specific genes | |
| VIGUERIE et al. | Pangenomic cDNA Microarray Profiling of Human Skeletal Muscle Gene Expression during Epinephrine Infusion |
Legal Events
| Date | Code | Title | Description |
|---|---|---|---|
| PUAI | Public reference made under article 153(3) epc to a published international application that has entered the european phase |
Free format text: ORIGINAL CODE: 0009012 |
|
| 17P | Request for examination filed |
Effective date: 20060607 |
|
| AK | Designated contracting states |
Kind code of ref document: A2 Designated state(s): AT BE BG CH CY CZ DE DK EE ES FI FR GB GR HU IE IS IT LI LU MC NL PL PT RO SE SI SK TR |
|
| DAX | Request for extension of the european patent (deleted) | ||
| REG | Reference to a national code |
Ref country code: HK Ref legal event code: DE Ref document number: 1095160 Country of ref document: HK |
|
| 17Q | First examination report despatched |
Effective date: 20070531 |
|
| GRAP | Despatch of communication of intention to grant a patent |
Free format text: ORIGINAL CODE: EPIDOSNIGR1 |
|
| RAP1 | Party data changed (applicant data changed or rights of an application transferred) |
Owner name: NOVARTIS PHARMA GMBH Owner name: NOVARTIS AG |
|
| GRAS | Grant fee paid |
Free format text: ORIGINAL CODE: EPIDOSNIGR3 |
|
| GRAA | (expected) grant |
Free format text: ORIGINAL CODE: 0009210 |
|
| RAP1 | Party data changed (applicant data changed or rights of an application transferred) |
Owner name: NOVARTIS AG |
|
| AK | Designated contracting states |
Kind code of ref document: B1 Designated state(s): AT BE BG CH CY CZ DE DK EE ES FI FR GB GR HU IE IS IT LI LU MC NL PL PT RO SE SI SK TR |
|
| REG | Reference to a national code |
Ref country code: GB Ref legal event code: FG4D |
|
| REG | Reference to a national code |
Ref country code: CH Ref legal event code: EP |
|
| REG | Reference to a national code |
Ref country code: IE Ref legal event code: FG4D |
|
| REF | Corresponds to: |
Ref document number: 602004032457 Country of ref document: DE Date of ref document: 20110609 Kind code of ref document: P |
|
| REG | Reference to a national code |
Ref country code: DE Ref legal event code: R096 Ref document number: 602004032457 Country of ref document: DE Effective date: 20110609 |
|
| REG | Reference to a national code |
Ref country code: NL Ref legal event code: VDEP Effective date: 20110427 |
|
| REG | Reference to a national code |
Ref country code: ES Ref legal event code: FG2A Ref document number: 2365852 Country of ref document: ES Kind code of ref document: T3 Effective date: 20111011 |
|
| PG25 | Lapsed in a contracting state [announced via postgrant information from national office to epo] |
Ref country code: SE Free format text: LAPSE BECAUSE OF FAILURE TO SUBMIT A TRANSLATION OF THE DESCRIPTION OR TO PAY THE FEE WITHIN THE PRESCRIBED TIME-LIMIT Effective date: 20110427 Ref country code: PT Free format text: LAPSE BECAUSE OF FAILURE TO SUBMIT A TRANSLATION OF THE DESCRIPTION OR TO PAY THE FEE WITHIN THE PRESCRIBED TIME-LIMIT Effective date: 20110829 |
|
| REG | Reference to a national code |
Ref country code: HK Ref legal event code: GR Ref document number: 1095160 Country of ref document: HK |
|
| PG25 | Lapsed in a contracting state [announced via postgrant information from national office to epo] |
Ref country code: SI Free format text: LAPSE BECAUSE OF FAILURE TO SUBMIT A TRANSLATION OF THE DESCRIPTION OR TO PAY THE FEE WITHIN THE PRESCRIBED TIME-LIMIT Effective date: 20110427 Ref country code: CY Free format text: LAPSE BECAUSE OF FAILURE TO SUBMIT A TRANSLATION OF THE DESCRIPTION OR TO PAY THE FEE WITHIN THE PRESCRIBED TIME-LIMIT Effective date: 20110427 Ref country code: GR Free format text: LAPSE BECAUSE OF FAILURE TO SUBMIT A TRANSLATION OF THE DESCRIPTION OR TO PAY THE FEE WITHIN THE PRESCRIBED TIME-LIMIT Effective date: 20110728 Ref country code: BE Free format text: LAPSE BECAUSE OF FAILURE TO SUBMIT A TRANSLATION OF THE DESCRIPTION OR TO PAY THE FEE WITHIN THE PRESCRIBED TIME-LIMIT Effective date: 20110427 Ref country code: FI Free format text: LAPSE BECAUSE OF FAILURE TO SUBMIT A TRANSLATION OF THE DESCRIPTION OR TO PAY THE FEE WITHIN THE PRESCRIBED TIME-LIMIT Effective date: 20110427 Ref country code: AT Free format text: LAPSE BECAUSE OF FAILURE TO SUBMIT A TRANSLATION OF THE DESCRIPTION OR TO PAY THE FEE WITHIN THE PRESCRIBED TIME-LIMIT Effective date: 20110427 Ref country code: IS Free format text: LAPSE BECAUSE OF FAILURE TO SUBMIT A TRANSLATION OF THE DESCRIPTION OR TO PAY THE FEE WITHIN THE PRESCRIBED TIME-LIMIT Effective date: 20110827 |
|
| PG25 | Lapsed in a contracting state [announced via postgrant information from national office to epo] |
Ref country code: NL Free format text: LAPSE BECAUSE OF FAILURE TO SUBMIT A TRANSLATION OF THE DESCRIPTION OR TO PAY THE FEE WITHIN THE PRESCRIBED TIME-LIMIT Effective date: 20110427 |
|
| PG25 | Lapsed in a contracting state [announced via postgrant information from national office to epo] |
Ref country code: EE Free format text: LAPSE BECAUSE OF FAILURE TO SUBMIT A TRANSLATION OF THE DESCRIPTION OR TO PAY THE FEE WITHIN THE PRESCRIBED TIME-LIMIT Effective date: 20110427 Ref country code: CZ Free format text: LAPSE BECAUSE OF FAILURE TO SUBMIT A TRANSLATION OF THE DESCRIPTION OR TO PAY THE FEE WITHIN THE PRESCRIBED TIME-LIMIT Effective date: 20110427 |
|
| PG25 | Lapsed in a contracting state [announced via postgrant information from national office to epo] |
Ref country code: PL Free format text: LAPSE BECAUSE OF FAILURE TO SUBMIT A TRANSLATION OF THE DESCRIPTION OR TO PAY THE FEE WITHIN THE PRESCRIBED TIME-LIMIT Effective date: 20110427 Ref country code: DK Free format text: LAPSE BECAUSE OF FAILURE TO SUBMIT A TRANSLATION OF THE DESCRIPTION OR TO PAY THE FEE WITHIN THE PRESCRIBED TIME-LIMIT Effective date: 20110427 Ref country code: SK Free format text: LAPSE BECAUSE OF FAILURE TO SUBMIT A TRANSLATION OF THE DESCRIPTION OR TO PAY THE FEE WITHIN THE PRESCRIBED TIME-LIMIT Effective date: 20110427 Ref country code: RO Free format text: LAPSE BECAUSE OF FAILURE TO SUBMIT A TRANSLATION OF THE DESCRIPTION OR TO PAY THE FEE WITHIN THE PRESCRIBED TIME-LIMIT Effective date: 20110427 |
|
| PLBE | No opposition filed within time limit |
Free format text: ORIGINAL CODE: 0009261 |
|
| STAA | Information on the status of an ep patent application or granted ep patent |
Free format text: STATUS: NO OPPOSITION FILED WITHIN TIME LIMIT |
|
| 26N | No opposition filed |
Effective date: 20120130 |
|
| REG | Reference to a national code |
Ref country code: DE Ref legal event code: R097 Ref document number: 602004032457 Country of ref document: DE Effective date: 20120130 |
|
| PG25 | Lapsed in a contracting state [announced via postgrant information from national office to epo] |
Ref country code: MC Free format text: LAPSE BECAUSE OF NON-PAYMENT OF DUE FEES Effective date: 20111130 |
|
| REG | Reference to a national code |
Ref country code: CH Ref legal event code: PL |
|
| PG25 | Lapsed in a contracting state [announced via postgrant information from national office to epo] |
Ref country code: CH Free format text: LAPSE BECAUSE OF NON-PAYMENT OF DUE FEES Effective date: 20111130 Ref country code: LI Free format text: LAPSE BECAUSE OF NON-PAYMENT OF DUE FEES Effective date: 20111130 |
|
| REG | Reference to a national code |
Ref country code: IE Ref legal event code: MM4A |
|
| PG25 | Lapsed in a contracting state [announced via postgrant information from national office to epo] |
Ref country code: IE Free format text: LAPSE BECAUSE OF NON-PAYMENT OF DUE FEES Effective date: 20111105 |
|
| PG25 | Lapsed in a contracting state [announced via postgrant information from national office to epo] |
Ref country code: LU Free format text: LAPSE BECAUSE OF NON-PAYMENT OF DUE FEES Effective date: 20111105 |
|
| PG25 | Lapsed in a contracting state [announced via postgrant information from national office to epo] |
Ref country code: BG Free format text: LAPSE BECAUSE OF FAILURE TO SUBMIT A TRANSLATION OF THE DESCRIPTION OR TO PAY THE FEE WITHIN THE PRESCRIBED TIME-LIMIT Effective date: 20110727 |
|
| PG25 | Lapsed in a contracting state [announced via postgrant information from national office to epo] |
Ref country code: TR Free format text: LAPSE BECAUSE OF FAILURE TO SUBMIT A TRANSLATION OF THE DESCRIPTION OR TO PAY THE FEE WITHIN THE PRESCRIBED TIME-LIMIT Effective date: 20110427 |
|
| PG25 | Lapsed in a contracting state [announced via postgrant information from national office to epo] |
Ref country code: HU Free format text: LAPSE BECAUSE OF FAILURE TO SUBMIT A TRANSLATION OF THE DESCRIPTION OR TO PAY THE FEE WITHIN THE PRESCRIBED TIME-LIMIT Effective date: 20110427 |
|
| REG | Reference to a national code |
Ref country code: DE Ref legal event code: R082 Ref document number: 602004032457 Country of ref document: DE |
|
| PGFP | Annual fee paid to national office [announced via postgrant information from national office to epo] |
Ref country code: GB Payment date: 20141105 Year of fee payment: 11 Ref country code: DE Payment date: 20141029 Year of fee payment: 11 Ref country code: FR Payment date: 20141110 Year of fee payment: 11 Ref country code: ES Payment date: 20141013 Year of fee payment: 11 |
|
| PGFP | Annual fee paid to national office [announced via postgrant information from national office to epo] |
Ref country code: IT Payment date: 20141117 Year of fee payment: 11 |
|
| REG | Reference to a national code |
Ref country code: DE Ref legal event code: R119 Ref document number: 602004032457 Country of ref document: DE |
|
| GBPC | Gb: european patent ceased through non-payment of renewal fee |
Effective date: 20151105 |
|
| PG25 | Lapsed in a contracting state [announced via postgrant information from national office to epo] |
Ref country code: IT Free format text: LAPSE BECAUSE OF NON-PAYMENT OF DUE FEES Effective date: 20151105 |
|
| REG | Reference to a national code |
Ref country code: FR Ref legal event code: ST Effective date: 20160729 |
|
| PG25 | Lapsed in a contracting state [announced via postgrant information from national office to epo] |
Ref country code: DE Free format text: LAPSE BECAUSE OF NON-PAYMENT OF DUE FEES Effective date: 20160601 Ref country code: GB Free format text: LAPSE BECAUSE OF NON-PAYMENT OF DUE FEES Effective date: 20151105 |
|
| PG25 | Lapsed in a contracting state [announced via postgrant information from national office to epo] |
Ref country code: FR Free format text: LAPSE BECAUSE OF NON-PAYMENT OF DUE FEES Effective date: 20151130 |
|
| REG | Reference to a national code |
Ref country code: ES Ref legal event code: FD2A Effective date: 20161229 |
|
| PG25 | Lapsed in a contracting state [announced via postgrant information from national office to epo] |
Ref country code: ES Free format text: LAPSE BECAUSE OF NON-PAYMENT OF DUE FEES Effective date: 20151106 |