EP1652477A1 - Ultrasonograph, ultrasonic image processing device, and ultrasonic image processing method - Google Patents
Ultrasonograph, ultrasonic image processing device, and ultrasonic image processing method Download PDFInfo
- Publication number
- EP1652477A1 EP1652477A1 EP05745493A EP05745493A EP1652477A1 EP 1652477 A1 EP1652477 A1 EP 1652477A1 EP 05745493 A EP05745493 A EP 05745493A EP 05745493 A EP05745493 A EP 05745493A EP 1652477 A1 EP1652477 A1 EP 1652477A1
- Authority
- EP
- European Patent Office
- Prior art keywords
- phase
- time
- moving region
- velocity
- ultrasonic
- Prior art date
- Legal status (The legal status is an assumption and is not a legal conclusion. Google has not performed a legal analysis and makes no representation as to the accuracy of the status listed.)
- Granted
Links
Images


Classifications
-
- G—PHYSICS
- G01—MEASURING; TESTING
- G01S—RADIO DIRECTION-FINDING; RADIO NAVIGATION; DETERMINING DISTANCE OR VELOCITY BY USE OF RADIO WAVES; LOCATING OR PRESENCE-DETECTING BY USE OF THE REFLECTION OR RERADIATION OF RADIO WAVES; ANALOGOUS ARRANGEMENTS USING OTHER WAVES
- G01S7/00—Details of systems according to groups G01S13/00, G01S15/00, G01S17/00
- G01S7/52—Details of systems according to groups G01S13/00, G01S15/00, G01S17/00 of systems according to group G01S15/00
- G01S7/52017—Details of systems according to groups G01S13/00, G01S15/00, G01S17/00 of systems according to group G01S15/00 particularly adapted to short-range imaging
- G01S7/52053—Display arrangements
- G01S7/52057—Cathode ray tube displays
- G01S7/52071—Multicolour displays; using colour coding; Optimising colour or information content in displays, e.g. parametric imaging
-
- A—HUMAN NECESSITIES
- A61—MEDICAL OR VETERINARY SCIENCE; HYGIENE
- A61B—DIAGNOSIS; SURGERY; IDENTIFICATION
- A61B8/00—Diagnosis using ultrasonic, sonic or infrasonic waves
- A61B8/08—Detecting organic movements or changes, e.g. tumours, cysts, swellings
- A61B8/0883—Detecting organic movements or changes, e.g. tumours, cysts, swellings for diagnosis of the heart
-
- A—HUMAN NECESSITIES
- A61—MEDICAL OR VETERINARY SCIENCE; HYGIENE
- A61B—DIAGNOSIS; SURGERY; IDENTIFICATION
- A61B8/00—Diagnosis using ultrasonic, sonic or infrasonic waves
- A61B8/48—Diagnostic techniques
- A61B8/488—Diagnostic techniques involving Doppler signals
-
- G—PHYSICS
- G06—COMPUTING; CALCULATING OR COUNTING
- G06T—IMAGE DATA PROCESSING OR GENERATION, IN GENERAL
- G06T7/00—Image analysis
- G06T7/20—Analysis of motion
-
- A—HUMAN NECESSITIES
- A61—MEDICAL OR VETERINARY SCIENCE; HYGIENE
- A61B—DIAGNOSIS; SURGERY; IDENTIFICATION
- A61B8/00—Diagnosis using ultrasonic, sonic or infrasonic waves
- A61B8/02—Measuring pulse or heart rate
-
- A—HUMAN NECESSITIES
- A61—MEDICAL OR VETERINARY SCIENCE; HYGIENE
- A61B—DIAGNOSIS; SURGERY; IDENTIFICATION
- A61B8/00—Diagnosis using ultrasonic, sonic or infrasonic waves
- A61B8/48—Diagnostic techniques
- A61B8/485—Diagnostic techniques involving measuring strain or elastic properties
-
- G—PHYSICS
- G01—MEASURING; TESTING
- G01S—RADIO DIRECTION-FINDING; RADIO NAVIGATION; DETERMINING DISTANCE OR VELOCITY BY USE OF RADIO WAVES; LOCATING OR PRESENCE-DETECTING BY USE OF THE REFLECTION OR RERADIATION OF RADIO WAVES; ANALOGOUS ARRANGEMENTS USING OTHER WAVES
- G01S15/00—Systems using the reflection or reradiation of acoustic waves, e.g. sonar systems
- G01S15/88—Sonar systems specially adapted for specific applications
- G01S15/89—Sonar systems specially adapted for specific applications for mapping or imaging
- G01S15/8906—Short-range imaging systems; Acoustic microscope systems using pulse-echo techniques
- G01S15/8979—Combined Doppler and pulse-echo imaging systems
-
- G—PHYSICS
- G06—COMPUTING; CALCULATING OR COUNTING
- G06T—IMAGE DATA PROCESSING OR GENERATION, IN GENERAL
- G06T2207/00—Indexing scheme for image analysis or image enhancement
- G06T2207/30—Subject of image; Context of image processing
- G06T2207/30004—Biomedical image processing
- G06T2207/30048—Heart; Cardiac
Definitions
- the present invention relates to an ultrasonic diagnostic system and a system and a method for ultrasonic imaging wherein the velocity of biological tissue such as cardiac muscle is estimated, and the estimated velocity information is processed to output local motion information of the tissue, thereby providing information useful in medical diagnosis, and in particular, it relates to a method for reducing the time and labor for operation by automatically detecting an end systole phase.
- TTI tissue tracking imaging
- time quadrature is required, as described in Patent Document 1. Since the result of time quadrature depends on an integration interval (time), the importance of the setting of the interval will easily be understood.
- a start phase When integration start phase is, for example, in an end diastole phase, systolic distortion and displacement can be analyzed. Paying attention to distortion, normal cardiac muscle is thickened in the wall thickness direction (the minor axis), and shortened along the major axis during systole. In contrast, when the integration start phase is in end systole phase, diastolic distortion and displacement can be analyzed. Also paying attention to distortion, normal cardiac muscle is thinned in the wall thickness direction (the minor axis), and stretched along the major axis during systole.
- integration end time is important second to the start time phase as a time phase that reflects the final state of distortion and displacement in specified intervals such as systole and diastole.
- the most common way will be that the state of the whole motion by time quadrature for systole is analyzed in an end systole phase, and the state of the whole motion by time quadrature for diastole is analyzed in an end diastole phase.
- the end diastole phase and the end systole phase must be provided as accurately as possible.
- a technique of monopolar display of distortion is disclosed in JP-A-2003-175041, for example, as another unique application setting other than the setting of an integration interval in each phase interval of systole and diastole. To realize accurate and simple time phase setting is also very useful for the distortion monopolar display.
- the end diastole phase and the end systole phase can be detected automatically as an R-wave phase in an electrocardiogram.
- the end systole phase cannot easily be detected from an electrocardiogram; however, the following automatic setting technique is known.
- DT delay time
- HR heart rates
- DTs decrease generally as HRs increase. Accordingly, DTs can often be set by users as a table for each HR.
- the technique by the ACT method discloses "finding an end systole phase as a time phase in which the area or volume of a cardiac cavity is minimized" by estimating the area or volume of a cardiac cavity from positional information on endocardium that is automatically detected.
- the ACT method cannot be applied to cross sections such as a longitudinal image of a left ventricle in which a cardiac cavity is not clearly drawn.
- cross sections such as a longitudinal image of a left ventricle in which a cardiac cavity is not clearly drawn.
- To increase the accuracy of time for finding an end systole phase it is preferable to obtain a cardiac-cavity volume with high accuracy.
- only one cross section allows definition of only an area, so that it is difficult to ensure an accurate volume.
- Multiple reference cross sections are generally required to obtain a high-accuracy volume. This is complicated technically, thus decreasing simplicity. Consequently, the ACT method cannot increase the accuracy and lacks in operability in setting cross sections because of its limitation to available cross sections.
- the invention has been made in view of the above-described circumstances. Accordingly, it is an object of the invention to provide an ultrasonic diagnostic system and a system and a method for ultrasonic imaging capable of simple and high-accuracy automatic detection of end systole phases for all cross section images used in general cardiac ultrasonography.
- an ultrasonic diagnostic system or an ultrasonic imaging system which includes: a storage unit that stores time-series velocity information on a moving region that repeats contraction and relaxation cyclically; and an estimation unit that estimates any desired time phase for one cycle including the contraction and relaxation of the moving region based on the time-series velocity information.
- a method for ultrasonic imaging includes: obtaining time-series velocity information on a moving region that repeats contraction and relaxation cyclically; and estimating any desired time phase for one cycle including the contraction and relaxation of the moving region based on the time-series velocity information.
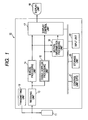
- FIG. 1 is a block diagram of an ultrasonic diagnostic system 10 according to a first embodiment.
- the ultrasonic diagnostic system 10 includes an ultrasonic probe 11, a transmitting unit 12, a receiving unit 13, a B-mode processing unit 14, a tissue Doppler processing unit 15, a motion-information processing unit 16, a display control unit 17, a display unit 18, an input unit 19, a storage unit 20, a control unit 21, and an input unit 22.
- the ultrasonic probe 11 includes a plurality of piezoelectric vibrators that generates ultrasonic waves in response to a drive signal from the transmitting unit 12, and converts reflected waves from a subject to electric signals; a matching layer provided to the piezoelectric vibrators; and a backing material for preventing propagation of the ultrasonic waves from the piezoelectric vibrators to the back.
- various harmonic components are generated with the propagation of the ultrasonic waves owing to the nonlinearity of biological tissue.
- the fundamental waves and harmonic components that constitute transmission ultrasonic waves are scattered backward by the boundary of acoustic impedance of in vivo tissue, microscattering etc., and are received by the ultrasonic probe 11 as reflected waves (echo). Since this embodiment and the following-described embodiments explain a case of a heart being an imaged object as an example, a sector probe is used as the ultrasonic probe 1.
- the transmitting unit 12 includes a delay circuit and a pulser circuit (not shown).
- the pulser circuit repeatedly generates a rate pulse for forming transmission ultrasonic waves at a predetermined rate frequency fr Hz (cycle: 1/fr sec).
- the delay circuit provides each rate pulse with a delay time necessary for converging ultrasonic waves into a beam for each channel and determining transmission directivity.
- the transmitting unit 12 applies driving pulses to each vibrator at timing based on the rate pulses so that the ultrasonic beams are formed in the direction of a specified scan line.
- the receiving unit 13 includes an amplifier circuit, an A/D converter, an adder and the like (not shown).
- the amplifier circuit amplifies the echo signal taken via the probe 11 channel by channel.
- the A/D converter provides a delay time necessary for determining reception directivity to the amplified echo signal, and thereafter, the adder performs adding process.
- the addition generates an ultrasonic echo signal corresponding to a specified scan line.
- the B-mode processing unit 14 applies an envelope detection process to the ultrasonic echo signal received from the receiving unit 13 to thereby generate a B-mode signal corresponding to the amplitude intensity of the ultrasonic echo signal.
- the tissue Doppler processing unit 15 applies an orthogonal detection process, an autocorrelation process, and so on to the echo signal received from the receiving unit 13 to obtain a tissue Doppler signal corresponding to the velocity, dispersion, and power of the tissue moving in the subject on the basis of the Doppler displacement component of the ultrasonic echo signal subjected to the delay and addition process.
- the motion-information processing unit 16 executes various processes for obtaining a motion-information image on the basis of the B-mode signal output from the B-mode processing unit 14 and the Doppler signal output from the tissue Doppler processing unit 16.
- the motion-information processing unit 16 also executes the process of estimating a desired time phase and the process of automatically setting an integration interval by TTI method, which will be described later, using velocity-distribution images stored in the storage unit 20.
- the display control unit 17 generates a B-mode ultrasonic image indicative of the dimensional distribution of a B-mode signal on a specified cross section.
- the display control unit 17 also generates a tissue Doppler ultrasonic image indicative of a two-dimensional distribution of the velocity, dispersion, and power values on a specified cross section on the basis on the tissue Doppler signal.
- the display control unit 17 also generates a superimposed image of a B-mode ultrasonic image and a tissue Doppler ultrasonic image, a superimposed image of a B-mode ultrasonic image and a two-dimensional distribution image of displacement or distortion, and so on as needed.
- the display unit 18 displays in-vivo morphological information and blood-flow information according to a video signal from the display control unit 17 as an image.
- the motion-information processing unit 16 displays a luminance image or a color image according to quantitative information on the spatial distribution of the contrast medium, that is, the area of blood flow or blood.
- the input unit 19 is connected to the system main body, and includes a mouse, a track ball, a mode switch, a keyboard, and so on for bringing various instructions from the operator, such as an instruction to set a region of interest (ROI) and an instruction to set various image-quality conditions to the system main body.
- various instructions from the operator such as an instruction to set a region of interest (ROI) and an instruction to set various image-quality conditions to the system main body.
- ROI region of interest
- the storage unit 20 stores ultrasonic image data (ultrasonic reception data) corresponding to each phase, a velocity-distribution image corresponding to time phases generated by the motion-information processing unit 16, and so on.
- the ultrasonic image data assumes tissue-image data taken in a tissue Doppler mode and tissue-image data taken in other than the tissue Doppler mode.
- the tissue image data may be so-called raw image data before scan conversion.
- the control unit 21 has the function of an information processor (computer), and controls the operation of the ultrasonic diagnostic system body statically or dynamically.
- the input unit 22 is connected to the system 10, and includes various switch buttons, a track ball, a mouse, a keyboard, and so on for bringing in various instructions from the operator, such as an instruction to set and change various parameters and conditions and an instruction to set a region of interest (ROI) to the system main body.
- various switch buttons such as an instruction to set and change various parameters and conditions and an instruction to set a region of interest (ROI) to the system main body.
- ROI region of interest
- Tissue tracking imaging method that is the prerequisite technique of the embodiment will be briefly described.
- the tissue tracking imaging images the parameters of local displacement and distortion obtained by integrating a signal based on velocity information, as tissue-motion information, while tracking the position of tissue which changes with motion.
- the technique allows the image of the distortion and displacement of local cardiac muscle to be produced and displayed using, e.g., a minor-axis image, thus supporting the analysis of temporal changes in image output values for a local region.
- the minor-axis image the main object function of cardiac analysis is thickening (change in thickness).
- the tissue tracking imaging method adopts the concept of a contraction motion field directed to a contraction center and setting therefor to detect a component relating to the thickening by angular compensation and to image it.
- the tissue tracking imaging method is also applicable to a temporally variable motion field by temporally shifting the contraction center position in consideration of the effects of the translational motion (also referred to as "translation") of the entire heart. This consequently allows tracking to the variations of the contract center position due to translational motion. Further details of the tissue tracking imaging method is described in JP-A-2003-175041, for example. The contents of the reference will be added to the description of the embodiment.
- the tissue tracking imaging method requires a space-time distribution image of tissue velocities for multiple phases (an image indicative of the velocities of the positions of tissue to be diagnosed.
- the space-time distribution image of the tissue velocities (hereinafter, simply referred to as "a velocity-distribution image”) can be generated from two-dimensional or three-dimensional ultrasonic image data on multiple time phases collected by tissue Doppler imaging, or alternatively, can be obtained by giving pattern-matching to multiple two-dimensional or three-dimensional tissue images on multiple time phases collected by the B-mode processing unit or the like.
- the embodiment uses a two-dimensional velocity distribution image produced by the tissue Doppler imaging (TDI) to provide a concrete description.
- tissue Doppler imaging TDI
- the invention is not limited to that, but may use a three-dimensional velocity distribution image produced by tissue Doppler imaging, for example, or a two-dimensional or three-dimensional velocity distribution image produced by pattern matching.
- the embodiment uses a heart as an diagnostic object by way of example. Accordingly, most of tissue velocities obtained by tissue tracking imaging can be regarded as myocardial velocity.
- the time-phase estimating function of the ultrasonic diagnostic system 10 will be described.
- the time-phase estimation is for analytically estimating, for example, various time phases, which are clinically important, using phase-to-phase velocity distribution images stored in the storage unit 20.
- estimation of an end systole phase will be described below to simplify the description as an example, in addition to that, the ultrasonic diagnostic system 10 can estimate an S-wave generation phase, an E-wave generation phase, a time phase in which the velocity reaches a specified velocity on the rising edge from E-wave, an A-wave generation phase, and any other phases specified by clinical characteristics.
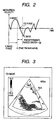
- FIG. 2 is an explanatory diagram of the function of estimating end systole phase ES, showing a graph indicating the temporal changes of a myocardial velocity.
- the end systole phase ES be estimated by specifying a time phase in which
- the myocardial velocity for example the sum of the velocities at the positions of the cardiac muscle in the ROI set in the ultrasonic image (TDI image), as shown in FIG. 3, or the sum of the absolute values of the velocities at the positions of the cardiac muscle in the ROI (that is,
- the myocardial velocity is defined as the sum of the velocities at the positions of the cardiac muscle in the ROI
- the tissue velocity of the components toward beams can be found by the tissue Doppler imaging, so that the motion of tissue may be not always small if the sum is small.
- the velocity in this estimation is high, a time phase in which the motion of cardiac tissue stands still can be detected approximately.
- the myocardial velocity is defined as the sum of the
- the component of motion is added as the absolute value in all cases, so that, although complicated, a time phase in which the motion of cardiac tissue stands still can be detected more accurately.
- the estimation object period be controlled depending on the heart rate HR because the time per one heartbeat varies among individuals.
- an estimation-object-period start phase (start phase) and the width of the estimation object period from the start phase be stored in the storage unit 20 in advance as a table for heart rates, as shown in FIG. 4, and the motion-information processing unit 16 automatically determine the estimation object period on the basis of the heart rate obtained from an electrocardiogram (ECG) or input from the input unit 19 and the table.
- ECG electrocardiogram
- an integration-interval start phase by the TTI and the width of the estimation object period may be set by a predetermined function using a heart rate as a variable.
- the end systole phase ES thus estimated is displayed in a specified form.
- FIG. 5 is a graph of an example of the relationship between the end systole phase ES, indicated by ES-phase line L, and an electrocardiographic complex. This allows the user to easily grasp the position of the end systole phase ES throughout the heartbeat.
- the automatic setting is for automatically setting a cardiac phase interval, which can be an integration interval when a systole, a diastole, a cardiac cycle, and other motion information are calculated by the TTI method, based on the estimated end systole phase ES and an R-wave phase found by an ECG. This allows the motion information defined by time quadrature in TTI method to be analyzed and acquired easily.
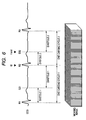
- FIG. 6 is a diagram of an example in which the latest systole 2 is automatically set as an integration interval by TTI method.
- the motion-information processing unit 16 first regards the R-wave phase in each heartbeat detected by an ECG as an end diastole, and estimates the R-ES phase interval as a systole using the end diastole and the end systole phase ES obtained by the estimation, estimates the ES-R phase interval as a diastole, and estimates the R-R phase interval as one heart cycle.
- the motion-information processing unit 16 automatically sets the R2-wave phase that is the start phase of the latest systole 2 among the estimated phase intervals as the lower limit t0 of the integration interval, and sets the end systole phase ES2 that is the end time of the latest systole 2 as the upper limit tend of the integration interval.
- FIG. 7 is a diagram of an example in which the latest diastole 2 is automatically set as an integration interval by TTI method.
- the motion-information processing unit 16 automatically sets the end systole phase ES2 that is the start phase of the latest diastole 2 among the estimated phase intervals as the lower limit t0 of the integration interval, and sets the R3-wave phase that is the end time of the latest diastole 2 as the upper limit tend of the integration interval.
- FIG. 8 is a diagram of an example in which the latest cardiac cycle is automatically set as an integration interval by TTI method.
- the motion-information processing unit 16 automatically sets the R2-wave phase that is the start phase of the latest cardiac cycle 2 among the estimated phase intervals as the lower limit t0 of the integration interval, and sets the R3-wave phase that is the end time of the latest cardiac cycle 2 as the upper limit tend of the integration interval.
- the one cardiac cycle may not necessarily use the R-wave generating phase as the reference, and may use the end systole phase ES or the like, for example.
- the selection of the integration interval among the systole, the diastole, and the one cardiac cycle described above is executed in such a manner that the user checks one of the items "one cardiac cycle (R-R)", “systole”, and "diastole”, as shown in FIG. 5.
- Another unique application setting other than the setting of an integration interval in each selected phase interval is then automatic switching of distortion monopolar display, for example. This allows automatic optimization of not only the setting of the object interval but also other accompanying settings, depending on the object cardiac phase interval, saving the user from controlling various settings manually to increase the simplicity of the operation.
- the various object cardiac phase intervals estimated by the object cardiac-phase-interval estimation process agree with actual end systole phases with high accuracy. However, if the estimated end systole phase ES has an error, the integration interval may be fine-tuned manually, e.g., with reference to the ES-phase line L on the graph shown in FIG. 5, or may be set manually to applications.
- FIG. 9 is a flowchart for the procedure of a series of processes of the TTI including automatic time-phase estimation. As shown in FIG. 9, imaging by tissue Doppler echo cardiography is executed to generate a velocity distribution image for each time phase according to obtained echo signals (step S1).
- the motion-information processing unit 16 next sets an estimation object period on the basis of a heart rate HR obtained from, e.g., an electrocardiogram. Also, a region of interest for finding a myocardial velocity is set on an TDI image by the manual operation of an operator. (step S2).
- the motion-information processing unit 16 calculates the absolute value of the myocardial velocity (
- the motion-information processing unit 16 estimates a systole, a diastole, and one cardiac cycle from an R-wave generation phase obtained from an electrocardiogram and the estimated end systole phase (step S5), and automatically sets an integration interval on the basis of the obtained estimation result (step S6).
- the motion-information processing unit 16 then executes time quadrature in the automatically set integration interval to thereby calculate cardiac motion information including a distortion, a distortion factor, and a displacement (step S7), and for example generates a distortion image in each time phase based on the result and displays it on the display unit 18 (step S8).
- the ultrasonic diagnostic system allows automatic estimation of, e.g., a desired time phase, which is important clinically, using phase-to-phase velocity-distribution images.
- the automatic estimation can be executed in an appropriate manner using velocity information.
- the operator can therefore set a desired time phase necessary for examination with high accuracy and easily.
- This system can also achieve highly objective phase setting without variation in information due to the difference of the operator as compared with the conventional manual phase setting, thus improving the quality of diagnostic information.
- the ultrasonic diagnostic system determines the integration interval of motion information defined by time quadrature in TTI method using an automatically set desired time phase. This can provide highly objective motion information in TTI method, and reduce the work of the operator in setting integration intervals. Particularly, the ultrasonic diagnostic system can automatically separate a systole and a diastole from each other using an automatically detected end systole phase and an end diastole phase that is automatically detected from an electrocardiogram. Accordingly, highly objective quantitative evaluation method by local-wall-motion indices such as distortion and displacement using a tissue velocity can be quickly achieved by a simpler operation.
- the invention is not limited to the foregoing embodiment and can be embodied in an actual step by modification of the components without deviating from the gist.
- an ultrasonic diagnostic system and a system and a method for ultrasonic imaging capable of simple and high-accuracy automatic detection of end systole phases for all cross-section images used in general cardiac ultrasonic examinations as described above.
Abstract
Description
- The present invention relates to an ultrasonic diagnostic system and a system and a method for ultrasonic imaging wherein the velocity of biological tissue such as cardiac muscle is estimated, and the estimated velocity information is processed to output local motion information of the tissue, thereby providing information useful in medical diagnosis, and in particular, it relates to a method for reducing the time and labor for operation by automatically detecting an end systole phase.
- Objective and quantitative evaluation of functions of biological tissue is generally very important for diagnosis of biological tissue such as cardiac muscle. Diagnostic imaging using an ultrasonic imaging system also tries various quantitative evaluations principally for hearts as an example. A typical example is tissue tracking imaging (TTI) method (e.g., refer to Patent Document 1). The TTI method allows quantitative evaluation by local-wall-motion indices such as distortion and displacement using tissue velocity.
- To find distortion or displacement using tissue velocity, time quadrature is required, as described in
Patent Document 1. Since the result of time quadrature depends on an integration interval (time), the importance of the setting of the interval will easily be understood. - Of particular importance is a start phase. When integration start phase is, for example, in an end diastole phase, systolic distortion and displacement can be analyzed. Paying attention to distortion, normal cardiac muscle is thickened in the wall thickness direction (the minor axis), and shortened along the major axis during systole. In contrast, when the integration start phase is in end systole phase, diastolic distortion and displacement can be analyzed. Also paying attention to distortion, normal cardiac muscle is thinned in the wall thickness direction (the minor axis), and stretched along the major axis during systole.
- Furthermore, integration end time is important second to the start time phase as a time phase that reflects the final state of distortion and displacement in specified intervals such as systole and diastole. Specifically, the most common way will be that the state of the whole motion by time quadrature for systole is analyzed in an end systole phase, and the state of the whole motion by time quadrature for diastole is analyzed in an end diastole phase.
- To determine the integration interval for systole or diastole for a variety of applications, the end diastole phase and the end systole phase must be provided as accurately as possible. To enhance simplicity of the analyzing process, it is desirable that the two time phases of end diastole phase and end systole phase be set automatically. Furthermore, a technique of monopolar display of distortion is disclosed in JP-A-2003-175041, for example, as another unique application setting other than the setting of an integration interval in each phase interval of systole and diastole. To realize accurate and simple time phase setting is also very useful for the distortion monopolar display.
- Of the end diastole phase and the end systole phase, the end diastole phase can be detected automatically as an R-wave phase in an electrocardiogram. On the other hand, the end systole phase cannot easily be detected from an electrocardiogram; however, the following automatic setting technique is known.
- With stress echo packages, which are recently becoming widespread, only systoles are often cut out from a series of moving images, and are analyzed. In this case, a specified interval (duration time DT[sec]) from R wave can be set. Specifically speaking, a DT phase corresponds to an end systole phase. It is known that DTs vary depending on heart rates (HR)[bpm] (DTs decrease generally as HRs increase). Accordingly, DTs can often be set by users as a table for each HR.
- Despite such devised stress echo packages, the accuracy required for an end systole phase being set is so low to be determined uniquely by a predetermined time in advance. Thus, since it has not a structure determined to the motion of a signal source, e.g., it is not necessarily a high-accuracy setting method for an end systole phase. Accordingly, this has the disadvantage of low time accuracy in view of automatically setting intervals of time quadrature for finding distortion or displacement.
- Furthermore, a technique of automatically recognizing an end systole phase using a cardiac-cavity volume/area or cardiac sound graph by automated contour tracking (ACT) method is recently disclosed (e.g., refer to Patent Document 2). As shown in the document, it is generally known that "an end systole phase in clinical term is the time when the second sound on a phonocardiogram is generated". However, it is difficult to stably detect only the second sound from a phonocardiogram waveform having many abrupt changes, and there can be also some cases in which a phonocardiogram cannot always be provided at examinations (because many cardiac ultrasonic examinations use only phonocardiograms as reference signals). The technique by the ACT method discloses "finding an end systole phase as a time phase in which the area or volume of a cardiac cavity is minimized" by estimating the area or volume of a cardiac cavity from positional information on endocardium that is automatically detected.
- However, the ACT method cannot be applied to cross sections such as a longitudinal image of a left ventricle in which a cardiac cavity is not clearly drawn. To increase the accuracy of time for finding an end systole phase, it is preferable to obtain a cardiac-cavity volume with high accuracy. However, only one cross section allows definition of only an area, so that it is difficult to ensure an accurate volume. Multiple reference cross sections are generally required to obtain a high-accuracy volume. This is complicated technically, thus decreasing simplicity. Consequently, the ACT method cannot increase the accuracy and lacks in operability in setting cross sections because of its limitation to available cross sections.
- The invention has been made in view of the above-described circumstances. Accordingly, it is an object of the invention to provide an ultrasonic diagnostic system and a system and a method for ultrasonic imaging capable of simple and high-accuracy automatic detection of end systole phases for all cross section images used in general cardiac ultrasonography.
- According to a first aspect of the invention, an ultrasonic diagnostic system or an ultrasonic imaging system is provided which includes: a storage unit that stores time-series velocity information on a moving region that repeats contraction and relaxation cyclically; and an estimation unit that estimates any desired time phase for one cycle including the contraction and relaxation of the moving region based on the time-series velocity information.
- According to a second aspect of the invention, a method for ultrasonic imaging is provided which includes: obtaining time-series velocity information on a moving region that repeats contraction and relaxation cyclically; and estimating any desired time phase for one cycle including the contraction and relaxation of the moving region based on the time-series velocity information.
-
- FIG. 1 is a block diagram of an ultrasonic
diagnostic system 10 according to a first embodiment. - FIG. 2 is an explanatory diagram of the function of estimating end systole phase ES, showing a graph indicating the temporal changes of a myocardial velocity.
- FIG. 3 is a diagram of an example of an ROI set in an ultrasonic image used for calculating a myocardial velocity.
- FIG. 4 is an example of a table showing the relationship among heart rates, estimation-object-period start phases (start phases), and the widths of the estimation object period from the start phase.
- FIG. 5 is a graph of an example of the relationship between the end systole phase ES, indicated by ES-phase line, and an electrocardiographic complex.
- FIG. 6 is a diagram of an example in which the
latest systole 2 is automatically set as an integration interval by TTI method. - FIG. 7 is a diagram of an example in which the
latest diastole 2 is automatically set as an integration interval by TTI method. - FIG. 8 is a diagram of an example in which the latest cardiac cycle is automatically set as an integration interval by TTI method.
- FIG. 9 is a flowchart for the procedure of a series of processes of TTI including automatic time-phase estimation.
- Embodiments of the invention will be described wither reference to the drawings. In the following description, components having the same function and structure will be given the same reference numerals and a duplicated description will be given as required.
- FIG. 1 is a block diagram of an ultrasonic
diagnostic system 10 according to a first embodiment. The ultrasonicdiagnostic system 10 includes anultrasonic probe 11, a transmittingunit 12, areceiving unit 13, a B-mode processing unit 14, a tissueDoppler processing unit 15, a motion-information processing unit 16, adisplay control unit 17, adisplay unit 18, an input unit 19, astorage unit 20, acontrol unit 21, and aninput unit 22. - The
ultrasonic probe 11 includes a plurality of piezoelectric vibrators that generates ultrasonic waves in response to a drive signal from the transmittingunit 12, and converts reflected waves from a subject to electric signals; a matching layer provided to the piezoelectric vibrators; and a backing material for preventing propagation of the ultrasonic waves from the piezoelectric vibrators to the back. When ultrasonic waves are transmitted from theultrasonic probe 11 to the subject, various harmonic components are generated with the propagation of the ultrasonic waves owing to the nonlinearity of biological tissue. The fundamental waves and harmonic components that constitute transmission ultrasonic waves are scattered backward by the boundary of acoustic impedance of in vivo tissue, microscattering etc., and are received by theultrasonic probe 11 as reflected waves (echo). Since this embodiment and the following-described embodiments explain a case of a heart being an imaged object as an example, a sector probe is used as theultrasonic probe 1. - The transmitting
unit 12 includes a delay circuit and a pulser circuit (not shown). The pulser circuit repeatedly generates a rate pulse for forming transmission ultrasonic waves at a predetermined rate frequency fr Hz (cycle: 1/fr sec). The delay circuit provides each rate pulse with a delay time necessary for converging ultrasonic waves into a beam for each channel and determining transmission directivity. The transmittingunit 12 applies driving pulses to each vibrator at timing based on the rate pulses so that the ultrasonic beams are formed in the direction of a specified scan line. - The receiving
unit 13 includes an amplifier circuit, an A/D converter, an adder and the like (not shown). The amplifier circuit amplifies the echo signal taken via theprobe 11 channel by channel. The A/D converter provides a delay time necessary for determining reception directivity to the amplified echo signal, and thereafter, the adder performs adding process. The addition generates an ultrasonic echo signal corresponding to a specified scan line. - The B-
mode processing unit 14 applies an envelope detection process to the ultrasonic echo signal received from the receivingunit 13 to thereby generate a B-mode signal corresponding to the amplitude intensity of the ultrasonic echo signal. - The tissue
Doppler processing unit 15 applies an orthogonal detection process, an autocorrelation process, and so on to the echo signal received from the receivingunit 13 to obtain a tissue Doppler signal corresponding to the velocity, dispersion, and power of the tissue moving in the subject on the basis of the Doppler displacement component of the ultrasonic echo signal subjected to the delay and addition process. - The motion-
information processing unit 16 executes various processes for obtaining a motion-information image on the basis of the B-mode signal output from the B-mode processing unit 14 and the Doppler signal output from the tissueDoppler processing unit 16. - The motion-
information processing unit 16 also executes the process of estimating a desired time phase and the process of automatically setting an integration interval by TTI method, which will be described later, using velocity-distribution images stored in thestorage unit 20. - The
display control unit 17 generates a B-mode ultrasonic image indicative of the dimensional distribution of a B-mode signal on a specified cross section. Thedisplay control unit 17 also generates a tissue Doppler ultrasonic image indicative of a two-dimensional distribution of the velocity, dispersion, and power values on a specified cross section on the basis on the tissue Doppler signal. Thedisplay control unit 17 also generates a superimposed image of a B-mode ultrasonic image and a tissue Doppler ultrasonic image, a superimposed image of a B-mode ultrasonic image and a two-dimensional distribution image of displacement or distortion, and so on as needed. - The
display unit 18 displays in-vivo morphological information and blood-flow information according to a video signal from thedisplay control unit 17 as an image. When a contrast medium is used, the motion-information processing unit 16 displays a luminance image or a color image according to quantitative information on the spatial distribution of the contrast medium, that is, the area of blood flow or blood. - The input unit 19 is connected to the system main body, and includes a mouse, a track ball, a mode switch, a keyboard, and so on for bringing various instructions from the operator, such as an instruction to set a region of interest (ROI) and an instruction to set various image-quality conditions to the system main body.
- The
storage unit 20 stores ultrasonic image data (ultrasonic reception data) corresponding to each phase, a velocity-distribution image corresponding to time phases generated by the motion-information processing unit 16, and so on. The ultrasonic image data assumes tissue-image data taken in a tissue Doppler mode and tissue-image data taken in other than the tissue Doppler mode. The tissue image data may be so-called raw image data before scan conversion. - The
control unit 21 has the function of an information processor (computer), and controls the operation of the ultrasonic diagnostic system body statically or dynamically. - The
input unit 22 is connected to thesystem 10, and includes various switch buttons, a track ball, a mouse, a keyboard, and so on for bringing in various instructions from the operator, such as an instruction to set and change various parameters and conditions and an instruction to set a region of interest (ROI) to the system main body. - Tissue tracking imaging method (TTI) that is the prerequisite technique of the embodiment will be briefly described. The tissue tracking imaging images the parameters of local displacement and distortion obtained by integrating a signal based on velocity information, as tissue-motion information, while tracking the position of tissue which changes with motion. The technique allows the image of the distortion and displacement of local cardiac muscle to be produced and displayed using, e.g., a minor-axis image, thus supporting the analysis of temporal changes in image output values for a local region. In the case of using the minor-axis image, the main object function of cardiac analysis is thickening (change in thickness). The tissue tracking imaging method adopts the concept of a contraction motion field directed to a contraction center and setting therefor to detect a component relating to the thickening by angular compensation and to image it. The tissue tracking imaging method is also applicable to a temporally variable motion field by temporally shifting the contraction center position in consideration of the effects of the translational motion (also referred to as "translation") of the entire heart. This consequently allows tracking to the variations of the contract center position due to translational motion. Further details of the tissue tracking imaging method is described in JP-A-2003-175041, for example. The contents of the reference will be added to the description of the embodiment.
- The tissue tracking imaging method requires a space-time distribution image of tissue velocities for multiple phases (an image indicative of the velocities of the positions of tissue to be diagnosed. The space-time distribution image of the tissue velocities (hereinafter, simply referred to as "a velocity-distribution image") can be generated from two-dimensional or three-dimensional ultrasonic image data on multiple time phases collected by tissue Doppler imaging, or alternatively, can be obtained by giving pattern-matching to multiple two-dimensional or three-dimensional tissue images on multiple time phases collected by the B-mode processing unit or the like.
- The embodiment uses a two-dimensional velocity distribution image produced by the tissue Doppler imaging (TDI) to provide a concrete description. However, the invention is not limited to that, but may use a three-dimensional velocity distribution image produced by tissue Doppler imaging, for example, or a two-dimensional or three-dimensional velocity distribution image produced by pattern matching. The embodiment uses a heart as an diagnostic object by way of example. Accordingly, most of tissue velocities obtained by tissue tracking imaging can be regarded as myocardial velocity.
- The time-phase estimating function of the ultrasonic
diagnostic system 10 will be described. The time-phase estimation is for analytically estimating, for example, various time phases, which are clinically important, using phase-to-phase velocity distribution images stored in thestorage unit 20. Although estimation of an end systole phase will be described below to simplify the description as an example, in addition to that, the ultrasonicdiagnostic system 10 can estimate an S-wave generation phase, an E-wave generation phase, a time phase in which the velocity reaches a specified velocity on the rising edge from E-wave, an A-wave generation phase, and any other phases specified by clinical characteristics. - The embodiment defines the end systole phase as the boundary phase between an S wave during a systole and an E wave during a diastole, and automatically estimates end systole phase ES from the idea of "end systole phase ES = time phase in which the motion of the heart stops = time phase in which myocardial velocity comes to zero or closest to zero".
- FIG. 2 is an explanatory diagram of the function of estimating end systole phase ES, showing a graph indicating the temporal changes of a myocardial velocity. As shown in FIG. 2, it is preferable that the end systole phase ES be estimated by specifying a time phase in which |myocardial velocity| comes to the minimum in a predetermined period t0 to t0+tg that is set between an S-wave phase and an E-wave phase (hereinafter, referred to as "an estimation object period").
- Here, as the myocardial velocity, for example the sum of the velocities at the positions of the cardiac muscle in the ROI set in the ultrasonic image (TDI image), as shown in FIG. 3, or the sum of the absolute values of the velocities at the positions of the cardiac muscle in the ROI (that is, |velocity|) is used.
- When the myocardial velocity is defined as the sum of the velocities at the positions of the cardiac muscle in the ROI, the tissue velocity of the components toward beams can be found by the tissue Doppler imaging, so that the motion of tissue may be not always small if the sum is small. However, since the velocity in this estimation is high, a time phase in which the motion of cardiac tissue stands still can be detected approximately.
- On the other hand, when the myocardial velocity is defined as the sum of the |velocities| at the positions of the cardiac muscle in the ROI, the component of motion is added as the absolute value in all cases, so that, although complicated, a time phase in which the motion of cardiac tissue stands still can be detected more accurately.
- It is preferable that the estimation object period be controlled depending on the heart rate HR because the time per one heartbeat varies among individuals. As a specific method of controlling, it is preferable that an estimation-object-period start phase (start phase) and the width of the estimation object period from the start phase be stored in the
storage unit 20 in advance as a table for heart rates, as shown in FIG. 4, and the motion-information processing unit 16 automatically determine the estimation object period on the basis of the heart rate obtained from an electrocardiogram (ECG) or input from the input unit 19 and the table. Alternatively, an integration-interval start phase by the TTI and the width of the estimation object period may be set by a predetermined function using a heart rate as a variable. - The end systole phase ES thus estimated is displayed in a specified form.
- FIG. 5 is a graph of an example of the relationship between the end systole phase ES, indicated by ES-phase line L, and an electrocardiographic complex. This allows the user to easily grasp the position of the end systole phase ES throughout the heartbeat.
- Automatic setting of a cardiac phase interval as an integration interval of the ultrasonic
diagnostic system 10 will next be described. The automatic setting is for automatically setting a cardiac phase interval, which can be an integration interval when a systole, a diastole, a cardiac cycle, and other motion information are calculated by the TTI method, based on the estimated end systole phase ES and an R-wave phase found by an ECG. This allows the motion information defined by time quadrature in TTI method to be analyzed and acquired easily. - FIG. 6 is a diagram of an example in which the
latest systole 2 is automatically set as an integration interval by TTI method. As shown in FIG. 6, the motion-information processing unit 16 first regards the R-wave phase in each heartbeat detected by an ECG as an end diastole, and estimates the R-ES phase interval as a systole using the end diastole and the end systole phase ES obtained by the estimation, estimates the ES-R phase interval as a diastole, and estimates the R-R phase interval as one heart cycle. The motion-information processing unit 16 automatically sets the R2-wave phase that is the start phase of thelatest systole 2 among the estimated phase intervals as the lower limit t0 of the integration interval, and sets the end systole phase ES2 that is the end time of thelatest systole 2 as the upper limit tend of the integration interval. - FIG. 7 is a diagram of an example in which the
latest diastole 2 is automatically set as an integration interval by TTI method. As in FIG. 6, the motion-information processing unit 16 automatically sets the end systole phase ES2 that is the start phase of thelatest diastole 2 among the estimated phase intervals as the lower limit t0 of the integration interval, and sets the R3-wave phase that is the end time of thelatest diastole 2 as the upper limit tend of the integration interval. - FIG. 8 is a diagram of an example in which the latest cardiac cycle is automatically set as an integration interval by TTI method. As in FIG. 6, the motion-
information processing unit 16 automatically sets the R2-wave phase that is the start phase of the latestcardiac cycle 2 among the estimated phase intervals as the lower limit t0 of the integration interval, and sets the R3-wave phase that is the end time of the latestcardiac cycle 2 as the upper limit tend of the integration interval. The one cardiac cycle may not necessarily use the R-wave generating phase as the reference, and may use the end systole phase ES or the like, for example. - The selection of the integration interval among the systole, the diastole, and the one cardiac cycle described above is executed in such a manner that the user checks one of the items "one cardiac cycle (R-R)", "systole", and "diastole", as shown in FIG. 5. Another unique application setting other than the setting of an integration interval in each selected phase interval is then automatic switching of distortion monopolar display, for example. This allows automatic optimization of not only the setting of the object interval but also other accompanying settings, depending on the object cardiac phase interval, saving the user from controlling various settings manually to increase the simplicity of the operation.
- The various object cardiac phase intervals estimated by the object cardiac-phase-interval estimation process agree with actual end systole phases with high accuracy. However, if the estimated end systole phase ES has an error, the integration interval may be fine-tuned manually, e.g., with reference to the ES-phase line L on the graph shown in FIG. 5, or may be set manually to applications.
- A series of the processes of TTI including the automatic phase estimation and the automatic integration-interval setting will be described hereinbelow.
- FIG. 9 is a flowchart for the procedure of a series of processes of the TTI including automatic time-phase estimation. As shown in FIG. 9, imaging by tissue Doppler echo cardiography is executed to generate a velocity distribution image for each time phase according to obtained echo signals (step S1).
- The motion-
information processing unit 16 next sets an estimation object period on the basis of a heart rate HR obtained from, e.g., an electrocardiogram. Also, a region of interest for finding a myocardial velocity is set on an TDI image by the manual operation of an operator. (step S2). - The motion-
information processing unit 16 then calculates the absolute value of the myocardial velocity (|myocardial velocity| for each time phase in the set estimation object period (step S3), and estimates an end systole phase (step S4). - The motion-
information processing unit 16 then estimates a systole, a diastole, and one cardiac cycle from an R-wave generation phase obtained from an electrocardiogram and the estimated end systole phase (step S5), and automatically sets an integration interval on the basis of the obtained estimation result (step S6). - The motion-
information processing unit 16 then executes time quadrature in the automatically set integration interval to thereby calculate cardiac motion information including a distortion, a distortion factor, and a displacement (step S7), and for example generates a distortion image in each time phase based on the result and displays it on the display unit 18 (step S8). - The foregoing structure offers the following advantages.
- The ultrasonic diagnostic system allows automatic estimation of, e.g., a desired time phase, which is important clinically, using phase-to-phase velocity-distribution images. The automatic estimation can be executed in an appropriate manner using velocity information. The operator can therefore set a desired time phase necessary for examination with high accuracy and easily. This system can also achieve highly objective phase setting without variation in information due to the difference of the operator as compared with the conventional manual phase setting, thus improving the quality of diagnostic information.
- The ultrasonic diagnostic system determines the integration interval of motion information defined by time quadrature in TTI method using an automatically set desired time phase. This can provide highly objective motion information in TTI method, and reduce the work of the operator in setting integration intervals. Particularly, the ultrasonic diagnostic system can automatically separate a systole and a diastole from each other using an automatically detected end systole phase and an end diastole phase that is automatically detected from an electrocardiogram. Accordingly, highly objective quantitative evaluation method by local-wall-motion indices such as distortion and displacement using a tissue velocity can be quickly achieved by a simpler operation.
- The invention is not limited to the foregoing embodiment and can be embodied in an actual step by modification of the components without deviating from the gist.
- (1) For example, the desired-phase estimation process and the automatic integration-interval setting process which are aforementioned can also be achieved in such a manner that programs for executing each of the processes are installed in computers (including those built in workstations, image processors, or ultrasonic diagnostic systems), and are expanded on a memory. The programs for computers to execute the technique may be distributed in the form of recording media such as magnetic disks (floppy(TM) disks, hard disks, and so on), optical disks (CD-ROMs, DVDs, and so on), and semiconductor memories.
- (2) In the foregoing embodiment, the time phases including a systole are estimated in response to the values on the basis of myocardial velocities and velocity changes. However, the indices for phase estimation are not limited to the myocardial velocities and velocity changes, for example a structure may be adopted in which the timing at which the velocity reaches a specified velocity during a specified period in one cardiac cycle, and the rate of velocity change (the differential coefficient of velocity waveform) are used.
- (3) The foregoing embodiment has been described using a heart as an diagnostic object by way of example. However, it is to be understood that the invention is not limited to that, the desired-phase estimation function of the ultrasonic diagnostic system can be applied to the diagnosis of moving regions that cyclically repeat contraction and relaxation of carotid artery, etc.
- In addition, other various inventions may be made in appropriate combination of the components disclosed in the embodiment. For example, some of the components of the embodiment may be eliminated, or some of the components of different embodiments may be combined as appropriate.
- According to the embodiment, an ultrasonic diagnostic system and a system and a method for ultrasonic imaging capable of simple and high-accuracy automatic detection of end systole phases for all cross-section images used in general cardiac ultrasonic examinations as described above.
Claims (16)
- An ultrasonic diagnostic system or an ultrasonic imaging system, comprising:a storage unit that stores time-series velocity information on a moving region that repeats contraction and relaxation cyclically; andan estimation unit that estimates any desired time phase for one cycle including the contraction and relaxation of the moving region on the basis of the time-series velocity information.
- The ultrasonic diagnostic system or the ultrasonic imaging system according to claim 1, wherein
the storage unit stores the time-series velocity information on a plurality of positions of the moving region; and
the estimation unit
calculates the velocity of the moving region or the velocity change rate of the moving region from the sum of the velocities of the plurality of positions present in a region of interest set in the moving region, the mean value, and other statistic calculated values; and
estimates any desired time phase for one cycle including the contraction and relaxation of the moving region from the velocity of the moving region or the velocity change rate of the moving region. - The ultrasonic diagnostic system or the ultrasonic imaging system according to claim 1, further comprising a calculation unit that calculates a physical quantity for the motion of the moving region concerning any one of a distortion, a distortion factor, or a displacement, defined by time quadrature using the velocity information on at least two time phases, and determines an integration interval for the time quadrature using the desired time phase estimated by the estimation unit.
- The ultrasonic diagnostic system or the ultrasonic imaging system according to claim 1, wherein
the estimated desired time phase is an end systole phase; and
the estimation unit estimates a time phase in which the motion of the moving region stands still as the end systole phase on the basis of at least the moving velocity of the tissue during a predetermined period set in the vicinity of the end systole phase. - The ultrasonic diagnostic system or the ultrasonic imaging system according to claim 4, wherein
the estimation unit
obtains the sum of the moving velocities of the tissue obtained from a predetermined space or the sum of the moving velocities;
detects a time phase in which the absolute value of the sum comes to the minimum in the predetermined period set in the vicinity of the end systole phase; and
estimates the time phase in which the detected absolute value of the sum comes to the minimum as the time phase in which the motion of the moving region stands still. - The ultrasonic diagnostic system or the ultrasonic imaging system according to claim 5, further comprising:an information obtaining unit that obtains information on the heart rate of the subject; anda setting unit capable of setting the predetermined period set in the vicinity of the end systole phase according to the obtained heart rate as appropriate.
- The ultrasonic diagnostic system or the ultrasonic imaging system according to claim 1, further comprising a display unit that displays the desired time phase estimated by the estimation unit in a specified form.
- The ultrasonic diagnostic system or the ultrasonic imaging system according to claim 1, wherein the time-series velocity information is generated on the basis of ultrasonic image data on a plurality of time phases obtained by tissue Doppler imaging or by applying pattern matching to tissue images for a plurality of time phases obtained by B-mode imaging.
- A method for ultrasonic imaging, comprising:obtaining time-series velocity information on a moving region that repeats contraction and relaxation cyclically; andestimating any desired time phase for one cycle including the contraction and relaxation of the moving region on the basis of the time-series velocity information.
- The method for ultrasonic imaging according to claim 9, comprising:obtaining the time-series velocity information on a plurality of positions of the moving region; andfor the estimation,calculating the velocity of the moving region or the velocity change rate of the moving region from the sum of the velocities of the plurality of positions present in a region of interest set in the moving region, the mean value, and other statistic calculated values; andestimating any desired time phase for one cycle including the contraction and relaxation of the moving region from the velocity of the moving region or the velocity change rate of the moving region.
- The method for ultrasonic imaging according to claim 9, further comprising: calculating a physical quantity for the motion of the moving region concerning any one of a distortion, a distortion factor, or a displacement, defined by time quadrature using the velocity information on at least two time phases, and calculating to determine an integration interval for the time quadrature using the desired time phase estimated by the estimation unit.
- The method for ultrasonic imaging according to claim 9, wherein
the estimated prescribed time phase is an end systole phase; and
for the estimation, a time phase in which the motion of the moving region stands still is estimated as the end systole phase on the basis of at least the moving velocity of the tissue during a predetermined period set in the vicinity of the end systole phase. - The method for ultrasonic imaging according to claim 12, comprising:for the estimation,the sum of the moving velocities of the tissue obtained from a predetermined space or the sum of the moving velocities is obtained;a time phase in which the absolute value of the sum comes to the minimum in the predetermined period set in the vicinity of the end systole phase is detected; andthe time phase in which the detected absolute value of the sum comes to the minimum is estimated as the time phase in which the motion of the moving region stands still.
- The method for ultrasonic imaging according to claim 13, further comprising:obtaining information on the heart rate of the subject; andsetting the predetermined period set in the vicinity of the end systole phase according to the obtained heart rate as appropriate.
- The method for ultrasonic imaging according to claim 9, further comprising displaying the estimated desired time phase in a specified form.
- The method for ultrasonic imaging according to claim 9, wherein the time-series velocity information is generated on the basis of ultrasonic image data on a plurality of time phases obtained by tissue Doppler imaging or by applying pattern matching to tissue images for a plurality of time phases obtained by B-mode imaging.
Applications Claiming Priority (2)
| Application Number | Priority Date | Filing Date | Title |
|---|---|---|---|
| JP2004161794A JP2005342006A (en) | 2004-05-31 | 2004-05-31 | Ultrasonic diagnosing device, ultrasonic image processing device, and ultrasonic signal processing program |
| PCT/JP2005/009966 WO2005115249A1 (en) | 2004-05-31 | 2005-05-31 | Ultrasonograph, ultrasonic image processing device, and ultrasonic image processing method |
Publications (3)
| Publication Number | Publication Date |
|---|---|
| EP1652477A1 true EP1652477A1 (en) | 2006-05-03 |
| EP1652477A4 EP1652477A4 (en) | 2007-08-08 |
| EP1652477B1 EP1652477B1 (en) | 2013-03-27 |
Family
ID=35450620
Family Applications (1)
| Application Number | Title | Priority Date | Filing Date |
|---|---|---|---|
| EP05745493A Active EP1652477B1 (en) | 2004-05-31 | 2005-05-31 | Ultrasonograph, ultrasonic image processing device, and ultrasonic image processing method |
Country Status (5)
| Country | Link |
|---|---|
| US (1) | US9797997B2 (en) |
| EP (1) | EP1652477B1 (en) |
| JP (1) | JP2005342006A (en) |
| CN (2) | CN102488533A (en) |
| WO (1) | WO2005115249A1 (en) |
Cited By (4)
| Publication number | Priority date | Publication date | Assignee | Title |
|---|---|---|---|---|
| WO2009013686A2 (en) * | 2007-07-26 | 2009-01-29 | Koninklijke Philips Electronics, N.V. | Systems and methods for automated image selection in doppler ultrasound imaging systems |
| EP2138103A1 (en) * | 2008-02-25 | 2009-12-30 | Kabushiki Kaisha Toshiba | Ultrasonic diagnostic device, ultrasonic imaging device, and recording medium for recording ultrasonic imaging program |
| EP2266464A1 (en) * | 2009-06-26 | 2010-12-29 | Kabushiki Kaisha Toshiba | Ultrasonic diagnosis apparatus and ultrasonic diagnosis support information providing method |
| EP3571999A1 (en) * | 2018-05-14 | 2019-11-27 | Canon Medical Systems Corporation | Ultrasound diagnosis apparatus and storage medium |
Families Citing this family (27)
| Publication number | Priority date | Publication date | Assignee | Title |
|---|---|---|---|---|
| US7695439B2 (en) * | 2005-08-22 | 2010-04-13 | Siemens Medical Solutions Usa, Inc. | Automated identification of cardiac events with medical ultrasound |
| JP4805669B2 (en) * | 2005-12-27 | 2011-11-02 | 株式会社東芝 | Ultrasonic image processing apparatus and control program for ultrasonic image processing apparatus |
| JP2010502239A (en) * | 2006-05-25 | 2010-01-28 | コーニンクレッカ フィリップス エレクトロニクス エヌ ヴィ | 3D echocardiographic shape analysis |
| JP4690361B2 (en) * | 2007-05-28 | 2011-06-01 | 富士フイルム株式会社 | Cardiac function analysis apparatus, method and program thereof |
| CA2697456A1 (en) * | 2007-08-30 | 2009-03-05 | Erik Fosse | Automated monitoring of myocardial function by ultrasonic transducers positioned on the heart |
| JP5619347B2 (en) * | 2007-12-20 | 2014-11-05 | 東芝メディカルシステムズ株式会社 | Ultrasonic diagnostic apparatus, ultrasonic image analysis apparatus, and ultrasonic image analysis program |
| US8167807B2 (en) * | 2007-12-20 | 2012-05-01 | Toshiba Medical Systems Corporation | Ultrasonic diagnosis device, ultrasonic image analysis device, and ultrasonic image analysis method |
| JP5430861B2 (en) * | 2008-02-18 | 2014-03-05 | 株式会社東芝 | Ultrasonic diagnostic apparatus and image display apparatus |
| JP5240994B2 (en) * | 2008-04-25 | 2013-07-17 | 東芝メディカルシステムズ株式会社 | Ultrasonic diagnostic apparatus, ultrasonic image processing apparatus, and ultrasonic image processing program |
| CN101601593B (en) * | 2008-06-10 | 2013-01-16 | 株式会社东芝 | Ultrasonic diagnostic apparatus |
| JP5259267B2 (en) * | 2008-06-19 | 2013-08-07 | 株式会社東芝 | Ultrasonic diagnostic apparatus, ultrasonic image processing apparatus, and ultrasonic image processing program |
| JP5299961B2 (en) * | 2009-01-14 | 2013-09-25 | 東芝メディカルシステムズ株式会社 | Ultrasonic diagnostic apparatus, image processing apparatus, and control program for ultrasonic diagnostic apparatus |
| US8478012B2 (en) * | 2009-09-14 | 2013-07-02 | General Electric Company | Methods, apparatus and articles of manufacture to process cardiac images to detect heart motion abnormalities |
| WO2012023399A1 (en) * | 2010-08-19 | 2012-02-23 | 株式会社 日立メディコ | Medical image diagnosis device and method for displaying cardiometry values |
| WO2013147262A1 (en) * | 2012-03-30 | 2013-10-03 | 東芝メディカルシステムズ株式会社 | Ultrasonic diagnostic device, image processing device, and image processing method |
| GB2507987A (en) * | 2012-11-15 | 2014-05-21 | Imp Innovations Ltd | Method of automatically processing an ultrasound image |
| CN103908279B (en) * | 2013-01-07 | 2017-07-28 | 上海联影医疗科技有限公司 | A kind of recognition methods of heart state time phase |
| EP2945544B1 (en) * | 2013-01-17 | 2018-11-07 | Koninklijke Philips N.V. | Eliminating motion effects in medical images caused by physiological function |
| JP5851549B2 (en) * | 2014-04-21 | 2016-02-03 | 日立アロカメディカル株式会社 | Ultrasonic diagnostic equipment |
| JP6614910B2 (en) * | 2014-11-28 | 2019-12-04 | キヤノン株式会社 | Photoacoustic device |
| JP6687336B2 (en) * | 2015-06-17 | 2020-04-22 | キヤノンメディカルシステムズ株式会社 | Ultrasonic diagnostic device and control program |
| CN112043259A (en) * | 2015-07-10 | 2020-12-08 | 深圳迈瑞生物医疗电子股份有限公司 | Monitoring system, method and device |
| WO2018194093A1 (en) * | 2017-04-19 | 2018-10-25 | 学校法人関西大学 | Biological information estimation device |
| CN108961319B (en) * | 2018-07-10 | 2021-11-19 | 中国科学院长春光学精密机械与物理研究所 | Method for analyzing dynamic airplane motion characteristics by double-linear-array TDI space camera |
| JP6988001B2 (en) * | 2018-08-30 | 2022-01-05 | オリンパス株式会社 | Recording device, image observation device, observation system, observation system control method, and observation system operation program |
| CN110742653B (en) * | 2019-10-31 | 2020-10-30 | 无锡祥生医疗科技股份有限公司 | Cardiac cycle determination method and ultrasonic equipment |
| CN114515169B (en) * | 2021-12-31 | 2023-06-30 | 西安交通大学 | Multi-parameter imaging method and system for ultrasonic myocardial tissue |
Citations (2)
| Publication number | Priority date | Publication date | Assignee | Title |
|---|---|---|---|---|
| US20010024516A1 (en) * | 1996-09-25 | 2001-09-27 | Hideki Yoshioka | Ultrasonic picture processing method and ultrasonic picture processing apparatus |
| US20030171668A1 (en) * | 2002-03-05 | 2003-09-11 | Kabushiki Kaisha Toshiba | Image processing apparatus and ultrasonic diagnosis apparatus |
Family Cites Families (15)
| Publication number | Priority date | Publication date | Assignee | Title |
|---|---|---|---|---|
| JPS5752446A (en) * | 1980-09-16 | 1982-03-27 | Aloka Co Ltd | Ultrasonic diagnostic apparatus |
| JP2791255B2 (en) | 1992-10-02 | 1998-08-27 | 株式会社東芝 | Ultrasound color Doppler tomography |
| US5622174A (en) * | 1992-10-02 | 1997-04-22 | Kabushiki Kaisha Toshiba | Ultrasonic diagnosis apparatus and image displaying system |
| JP3625305B2 (en) | 1994-12-28 | 2005-03-02 | 株式会社東芝 | Ultrasonic diagnostic equipment |
| JP3707882B2 (en) * | 1995-11-21 | 2005-10-19 | 株式会社東芝 | Ultrasonic diagnostic equipment |
| JPH09140711A (en) | 1995-11-21 | 1997-06-03 | Ge Yokogawa Medical Syst Ltd | Automatic time phase discriminating method and ultrasonic diagnostic device |
| JPH1099328A (en) * | 1996-09-26 | 1998-04-21 | Toshiba Corp | Image processor and image processing method |
| CN1106825C (en) * | 1997-02-13 | 2003-04-30 | 通用电器横河医疗系统株式会社 | Method of identifying time phase of state of organ to be observed, and ultrasonic diagnostic apparatus based on same |
| JP3187008B2 (en) * | 1998-03-16 | 2001-07-11 | 株式会社東芝 | Ultrasound color Doppler tomography |
| US6352507B1 (en) * | 1999-08-23 | 2002-03-05 | G.E. Vingmed Ultrasound As | Method and apparatus for providing real-time calculation and display of tissue deformation in ultrasound imaging |
| JP4223775B2 (en) * | 2001-09-21 | 2009-02-12 | 株式会社東芝 | Ultrasonic diagnostic equipment |
| US6638221B2 (en) * | 2001-09-21 | 2003-10-28 | Kabushiki Kaisha Toshiba | Ultrasound diagnostic apparatus, and image processing method |
| JP4443863B2 (en) | 2002-06-18 | 2010-03-31 | 東芝医用システムエンジニアリング株式会社 | Medical image apparatus, ultrasonic diagnostic apparatus, medical image data processing method, and software recording medium |
| US20040116810A1 (en) * | 2002-12-17 | 2004-06-17 | Bjorn Olstad | Ultrasound location of anatomical landmarks |
| JP4594610B2 (en) * | 2003-10-21 | 2010-12-08 | 株式会社東芝 | Ultrasonic image processing apparatus and ultrasonic diagnostic apparatus |
-
2004
- 2004-05-31 JP JP2004161794A patent/JP2005342006A/en not_active Withdrawn
-
2005
- 2005-05-31 WO PCT/JP2005/009966 patent/WO2005115249A1/en not_active Application Discontinuation
- 2005-05-31 EP EP05745493A patent/EP1652477B1/en active Active
- 2005-05-31 CN CN2011103058208A patent/CN102488533A/en active Pending
- 2005-05-31 CN CNA2005800006153A patent/CN1819798A/en active Pending
-
2006
- 2006-01-23 US US11/336,958 patent/US9797997B2/en active Active
Patent Citations (2)
| Publication number | Priority date | Publication date | Assignee | Title |
|---|---|---|---|---|
| US20010024516A1 (en) * | 1996-09-25 | 2001-09-27 | Hideki Yoshioka | Ultrasonic picture processing method and ultrasonic picture processing apparatus |
| US20030171668A1 (en) * | 2002-03-05 | 2003-09-11 | Kabushiki Kaisha Toshiba | Image processing apparatus and ultrasonic diagnosis apparatus |
Non-Patent Citations (1)
| Title |
|---|
| See also references of WO2005115249A1 * |
Cited By (7)
| Publication number | Priority date | Publication date | Assignee | Title |
|---|---|---|---|---|
| WO2009013686A2 (en) * | 2007-07-26 | 2009-01-29 | Koninklijke Philips Electronics, N.V. | Systems and methods for automated image selection in doppler ultrasound imaging systems |
| WO2009013686A3 (en) * | 2007-07-26 | 2009-04-02 | Koninkl Philips Electronics Nv | Systems and methods for automated image selection in doppler ultrasound imaging systems |
| EP2138103A1 (en) * | 2008-02-25 | 2009-12-30 | Kabushiki Kaisha Toshiba | Ultrasonic diagnostic device, ultrasonic imaging device, and recording medium for recording ultrasonic imaging program |
| EP2138103A4 (en) * | 2008-02-25 | 2012-02-22 | Toshiba Kk | Ultrasonic diagnostic device, ultrasonic imaging device, and recording medium for recording ultrasonic imaging program |
| US9451930B2 (en) | 2008-02-25 | 2016-09-27 | Kabushiki Kaisha Toshiba | Ultrasonic diagnosis apparatus, ultrasonic image processing apparatus, and recording medium on which ultrasonic image processing program is recorded |
| EP2266464A1 (en) * | 2009-06-26 | 2010-12-29 | Kabushiki Kaisha Toshiba | Ultrasonic diagnosis apparatus and ultrasonic diagnosis support information providing method |
| EP3571999A1 (en) * | 2018-05-14 | 2019-11-27 | Canon Medical Systems Corporation | Ultrasound diagnosis apparatus and storage medium |
Also Published As
| Publication number | Publication date |
|---|---|
| US20060122512A1 (en) | 2006-06-08 |
| JP2005342006A (en) | 2005-12-15 |
| WO2005115249A1 (en) | 2005-12-08 |
| US9797997B2 (en) | 2017-10-24 |
| EP1652477A4 (en) | 2007-08-08 |
| EP1652477B1 (en) | 2013-03-27 |
| CN1819798A (en) | 2006-08-16 |
| CN102488533A (en) | 2012-06-13 |
Similar Documents
| Publication | Publication Date | Title |
|---|---|---|
| EP1652477B1 (en) | Ultrasonograph, ultrasonic image processing device, and ultrasonic image processing method | |
| US20230200785A1 (en) | Ultrasound diagnosis apparatus, image processing apparatus, and image processing method | |
| JP3707882B2 (en) | Ultrasonic diagnostic equipment | |
| Beulen et al. | Toward noninvasive blood pressure assessment in arteries by using ultrasound | |
| JP5566673B2 (en) | Ultrasonic diagnostic apparatus, Doppler measurement apparatus, and Doppler measurement method | |
| US6099471A (en) | Method and apparatus for real-time calculation and display of strain in ultrasound imaging | |
| US20130245441A1 (en) | Pressure-Volume with Medical Diagnostic Ultrasound Imaging | |
| US20050288589A1 (en) | Surface model parametric ultrasound imaging | |
| CN111225617B (en) | Ultrasound imaging system and method | |
| WO2004103185A1 (en) | Ultrasonograph | |
| EP1021129B1 (en) | Ultrasound imaging for displaying strain | |
| JPH0866399A (en) | Ultrasonic diagnostic device | |
| JP4870449B2 (en) | Ultrasonic diagnostic apparatus and ultrasonic image processing method | |
| JP3355140B2 (en) | Ultrasound imaging device | |
| JP2009039277A (en) | Ultrasonic diagnostic apparatus | |
| US11304681B2 (en) | Ultrasonic diagnostic apparatus and image processing method | |
| JP4745455B2 (en) | Ultrasonic diagnostic apparatus, ultrasonic image processing apparatus, and ultrasonic signal processing program | |
| JP7449773B2 (en) | Ultrasonic diagnostic equipment and transmission method | |
| JP2006523485A (en) | Heart wall strain imaging | |
| JP2017189192A (en) | Ultrasonic diagnostic apparatus | |
| JP4679141B2 (en) | Ultrasonic diagnostic apparatus and method for displaying ultrasonic diagnostic image | |
| US20210386406A1 (en) | Ultrasound diagnostic apparatus, medical image processing apparatus, and medical image processing method | |
| JP2005095675A (en) | Ultrasonic diagnostic equipment | |
| Mori et al. | Lateral M-Mode: Ultrasound Visualization of Displacement Along Longitudinal Direction at Intima–Media Complex | |
| JPWO2006126485A1 (en) | Ultrasonic diagnostic equipment |
Legal Events
| Date | Code | Title | Description |
|---|---|---|---|
| PUAI | Public reference made under article 153(3) epc to a published international application that has entered the european phase |
Free format text: ORIGINAL CODE: 0009012 |
|
| 17P | Request for examination filed |
Effective date: 20060120 |
|
| AK | Designated contracting states |
Kind code of ref document: A1 Designated state(s): AT BE BG CH CY CZ DE DK EE ES FI FR GB GR HU IE IS IT LI LT LU MC NL PL PT RO SE SI SK TR |
|
| AX | Request for extension of the european patent |
Extension state: AL BA HR LV MK YU |
|
| A4 | Supplementary search report drawn up and despatched |
Effective date: 20070710 |
|
| RIC1 | Information provided on ipc code assigned before grant |
Ipc: A61B 8/02 20060101ALN20070704BHEP Ipc: G06T 7/20 20060101ALI20070704BHEP Ipc: A61B 8/08 20060101AFI20051216BHEP |
|
| DAX | Request for extension of the european patent (deleted) | ||
| RBV | Designated contracting states (corrected) |
Designated state(s): DE |
|
| RBV | Designated contracting states (corrected) |
Designated state(s): DE |
|
| 17Q | First examination report despatched |
Effective date: 20080922 |
|
| GRAP | Despatch of communication of intention to grant a patent |
Free format text: ORIGINAL CODE: EPIDOSNIGR1 |
|
| GRAS | Grant fee paid |
Free format text: ORIGINAL CODE: EPIDOSNIGR3 |
|
| GRAA | (expected) grant |
Free format text: ORIGINAL CODE: 0009210 |
|
| AK | Designated contracting states |
Kind code of ref document: B1 Designated state(s): DE |
|
| REG | Reference to a national code |
Ref country code: DE Ref legal event code: R081 Ref document number: 602005038766 Country of ref document: DE Owner name: TOSHIBA MEDICAL SYSTEMS CORPORATION, OTAWARA-S, JP Free format text: FORMER OWNERS: KABUSHIKI KAISHA TOSHIBA, TOKYO, JP; TOSHIBA MEDICAL SYSTEMS CORPORATION, OTAWARA-SHI, TOCHIGI-KEN, JP |
|
| REG | Reference to a national code |
Ref country code: DE Ref legal event code: R082 Ref document number: 602005038766 Country of ref document: DE Representative=s name: KRAMER - BARSKE - SCHMIDTCHEN, DE Ref country code: DE Ref legal event code: R081 Ref document number: 602005038766 Country of ref document: DE Owner name: TOSHIBA MEDICAL SYSTEMS CORPORATION, OTAWARA-S, JP Free format text: FORMER OWNER: TOSHIBA MEDICAL SYSTEMS CORPORATION, OTAWARA-SHI, TOCHIGI-KEN, JP Ref country code: DE Ref legal event code: R082 Ref document number: 602005038766 Country of ref document: DE Representative=s name: KRAMER BARSKE SCHMIDTCHEN PATENTANWAELTE PARTG, DE |
|
| REG | Reference to a national code |
Ref country code: DE Ref legal event code: R096 Ref document number: 602005038766 Country of ref document: DE Effective date: 20130529 |
|
| PLBE | No opposition filed within time limit |
Free format text: ORIGINAL CODE: 0009261 |
|
| STAA | Information on the status of an ep patent application or granted ep patent |
Free format text: STATUS: NO OPPOSITION FILED WITHIN TIME LIMIT |
|
| 26N | No opposition filed |
Effective date: 20140103 |
|
| REG | Reference to a national code |
Ref country code: DE Ref legal event code: R097 Ref document number: 602005038766 Country of ref document: DE Effective date: 20140103 |
|
| REG | Reference to a national code |
Ref country code: DE Ref legal event code: R081 Ref document number: 602005038766 Country of ref document: DE Owner name: TOSHIBA MEDICAL SYSTEMS CORPORATION, OTAWARA-S, JP Free format text: FORMER OWNERS: KABUSHIKI KAISHA TOSHIBA, TOKIO/TOKYO, JP; TOSHIBA MEDICAL SYSTEMS CORPORATION, OTAWARA-SHI, TOCHIGI-KEN, JP Ref country code: DE Ref legal event code: R082 Ref document number: 602005038766 Country of ref document: DE Representative=s name: KRAMER BARSKE SCHMIDTCHEN PATENTANWAELTE PARTG, DE |
|
| PGFP | Annual fee paid to national office [announced via postgrant information from national office to epo] |
Ref country code: DE Payment date: 20230404 Year of fee payment: 19 |