EP1605326A2 - Verfahren und Vorrichtung zur statistischen Steuerung industrieller Prozesse - Google Patents
Verfahren und Vorrichtung zur statistischen Steuerung industrieller Prozesse Download PDFInfo
- Publication number
- EP1605326A2 EP1605326A2 EP05104957A EP05104957A EP1605326A2 EP 1605326 A2 EP1605326 A2 EP 1605326A2 EP 05104957 A EP05104957 A EP 05104957A EP 05104957 A EP05104957 A EP 05104957A EP 1605326 A2 EP1605326 A2 EP 1605326A2
- Authority
- EP
- European Patent Office
- Prior art keywords
- sample
- power
- distribution
- test
- size
- Prior art date
- Legal status (The legal status is an assumption and is not a legal conclusion. Google has not performed a legal analysis and makes no representation as to the accuracy of the status listed.)
- Withdrawn
Links
Images


Classifications
-
- G—PHYSICS
- G05—CONTROLLING; REGULATING
- G05B—CONTROL OR REGULATING SYSTEMS IN GENERAL; FUNCTIONAL ELEMENTS OF SUCH SYSTEMS; MONITORING OR TESTING ARRANGEMENTS FOR SUCH SYSTEMS OR ELEMENTS
- G05B19/00—Program-control systems
- G05B19/02—Program-control systems electric
- G05B19/418—Total factory control, i.e. centrally controlling a plurality of machines, e.g. direct or distributed numerical control [DNC], flexible manufacturing systems [FMS], integrated manufacturing systems [IMS] or computer integrated manufacturing [CIM]
- G05B19/41875—Total factory control, i.e. centrally controlling a plurality of machines, e.g. direct or distributed numerical control [DNC], flexible manufacturing systems [FMS], integrated manufacturing systems [IMS] or computer integrated manufacturing [CIM] characterised by quality surveillance of production
-
- Y—GENERAL TAGGING OF NEW TECHNOLOGICAL DEVELOPMENTS; GENERAL TAGGING OF CROSS-SECTIONAL TECHNOLOGIES SPANNING OVER SEVERAL SECTIONS OF THE IPC; TECHNICAL SUBJECTS COVERED BY FORMER USPC CROSS-REFERENCE ART COLLECTIONS [XRACs] AND DIGESTS
- Y02—TECHNOLOGIES OR APPLICATIONS FOR MITIGATION OR ADAPTATION AGAINST CLIMATE CHANGE
- Y02P—CLIMATE CHANGE MITIGATION TECHNOLOGIES IN THE PRODUCTION OR PROCESSING OF GOODS
- Y02P90/00—Enabling technologies with a potential contribution to greenhouse gas [GHG] emissions mitigation
- Y02P90/02—Total factory control, e.g. smart factories, flexible manufacturing systems [FMS] or integrated manufacturing systems [IMS]
Definitions
- This invention relates to the control of industrial processes, and in particular a method and a system for the control of an industrial process based on an examination of observed variables obtained from a sample of products which are indicative of the properties of the product generated by the process and correlated with the set process parameters. More specifically it relates to a method and system for statistical control in which the sample size needed to obtain reliable and stable information about the properties of the product is calculated through observing one or more selected variables on the basis of data obtained from a pilot sample.
- Statistical tests that is the verification of statistical hypotheses, are the method normally used to check that batches generated by a production process conform to particular specifications or, in the medical field, to check the efficacy of drugs under investigation, and also their tolerance.
- All processes for the production of new products or for the validation of new pharmacological treatments comprise among other things the gathering of data defined by an experimental protocol.
- This information identified through a procedure specified in the experimental protocol and originating from a sample of products or, in the case of the production of drugs, individuals (in the preclinical stages these may be laboratory guinea pigs), is used to perform statistical tests which test hypotheses that the product complies with the requisite specifications, or, in the case of drugs, for example, the efficacy characteristics versus the non-efficacy characteristics of a new drug, or the efficacy of a drug already available on the market or which is in any event known, in the case of a new therapeutic indication, or again tolerance to a new drug in comparison with a preset threshold or another drug.
- sampling is carried out at predetermined time intervals t.
- a statistical test is performed to check whether it is necessary to rule out that the characteristic under test, for example an average dimensional characteristic of the batch, actually lies within predetermined tolerances.
- the tool used to check the production process is known as a "control chart".
- the distribution F belongs to a space divided into two parts, , or the set of all those distributions which are considered to be non-significant (and therefore for which "the production process produces batches of predetermined quality” or “the drug is ineffective") and , the complementary set (that is the set of all distributions in respect of which it is judged that "the process does not produce batches of predetermined quality” or “the drug is effective”).
- the "Null Hypothesis” is defined as H 0 : F ⁇ .
- the “alternative hypothesis”, known as H 1 is therefore F ⁇ .
- rejection region is defined in such a way that if the null hypothesis were true there would be a probability of less than ⁇ of observing the sample information in that region.
- the decisionmaking process is as follows: it is first assumed that the null hypothesis is true (that is, for example, that the process produces batches of predetermined quality or that the drug is not effective); then if a sample with low probability is observed the alternative hypothesis H 1 is decided upon (continuing the above example: "the process does not produce batches of predetermined quality” or "the drug is effective"), because the data are a true fact, and the null hypothesis is considered to be untrue.
- the statistical test ⁇ ⁇ is defined as follows:
- the test can therefore be seen as a decisionmaking process with a yes/no (1/0) outcome, parameterised by a predetermined parameter ⁇ : for example the process produces batches of products which do/do not conform to the specifications being checked, or the drug is/is not effective; or again, drug A interacts/does not interact with drug B.
- ⁇ the distribution of observations in or
- test statistic can therefore be defined on the basis of the test statistic:
- the statistical test is used to demonstrate a predetermined hypothesis (for example that a production process is out of control or that a drug X is more effective than drug Y). This however is a tool of much wider scope, and is also used to obtain information on the accuracy of the estimate of a parameter which can take any value, whose value it is useful to estimate, checking that this estimate complies with a predetermined accuracy criterion.
- the reproducibility ⁇ provides information about the stability of the decision, given by the variance of the test: ⁇ (1- ⁇ ) .
- the distribution of the random variables measuring the conformance of a batch or a pharmacological effect can be parameterised using a parameter ⁇ ⁇ R P .
- ⁇ 2 may not be known or the pair ( ⁇ , ⁇ 2 ) may not be known; alternatively the assumption that the distribution is a normal distribution (or another predetermined distribution) may be considered to be excessive, suggesting a "free" distribution F , that is one without any predetermined analytical shape.
- This calculation procedure having m n as its outcome, being based on ⁇ n , a pointwise estimate of ⁇ , it is therefore based on a pointwise estimate of the power and cannot be very reliable. In fact it is known that on average it provides an m which is too low, with the possibility of not satisfying the constraint of a power greater than 1- ⁇ .
- the estimated ⁇ namely ⁇ n
- the estimated ⁇ is affected by an intrinsic variability which should be checked in order to establish an approximate power giving rise to the calculation of an m such as to ensure an acceptable actual power for a new experiment, in line with the predetermined power 1- ⁇ .
- This article describes the concept of using the estimator based on a plug-in to approximate the power of the test. This is based on the knowledge that, assuming F is known, it is possible to provide a pointwise estimate of the power curve, that is the power when F is varied towards distributions which are increasingly distant from . Replacing the unknown F with an estimate of it, F n , the authors obtain a simplified formula, but one which has nothing to do with the correct theoretical result.
- the sample data X* m (X* 1 , ..., X* m ) are assumed to be taken from F n , that is from the empirical distribution provided by the pilot sample, instead of F.
- tumour size observed variable
- This type of therapy is very expensive, and therefore it is desirable to reduce the doses of the drug which have to be synthesised to a minimum in order to observe its effects.
- n 10 of individuals, and the pairs of values 22-19, 18-11, 17-14, 19-17, 22-23, 12-11, 14-15, 11-19, 19-11, 7-8 are observed.
- null hypothesis is that the differences for the paired data have a mean of zero, and the alternative hypothesis of a mean which is greater than zero.
- ⁇ and F 10 (40) must be calculated.
- B 1000 samples of size 40 are extracted from F 10 .
- the object of the invention is to provide a process and system for the control of an industrial process which overcomes the disadvantages of the known art, that is which makes it possible, on the basis of measurements of observed variables which are indicative of the product properties in a pilot sample of size n , to calculate a sample size m which is sufficient to make it possible to obtain the results assumed in advance in a future statistical control test, with the minimum predetermined stability, but at the same time limited so as not to waste resources and minimise research and production costs.
- Another object of the invention is to provide a process and a system for the control of an industrial process which can be used to determine an admissible range of values for the indicator of the stability of the outcome of a statistical test with which control of the production process is associated, as accurately as possible.
- the subject matter of the invention comprises a method for the control of an industrial process having the characteristics specified in claim 1.
- a further object of the invention is a system for the control of an industrial process according to claim 17.
- the invention below is derived from the methods based on plug-in of the empirical distribution function into the test power, but further provides the possibility of also calculating a lower bound for the estimated power, for any statistical test.
- the rationalisation involves recognising the plug-in power as a V-statistic, the kernel of which is the statistical test, and provides pointwise consistency of the estimators of the power based on the plug-in, and above all provides consistent confidence intervals for the unknown power of any test which satisfies the abovementioned mathematical hypotheses.
- This invention comprises a new method for the control of production processes which comprises determining an appropriate sample size on the basis of approximation of the power of a statistical test based on information originating from a pilot experiment, without going through estimation of the non-centrality parameter ⁇ , but using a plug-in method for the unknown distribution F.
- the method to which the invention relates is based on the determination of an admissible interval of values for the power (technically a Confidence Interval) having a confidence level or degree of reliability 1- ⁇ 1 (where ⁇ 1 ⁇ (0.1)), for statistical tests having one or more ( k ) groups, on experimental data which may have one or more ( d ) dimensions.
- this method of estimating the power comprises a mono- or multi-dimensional statistical test, with one or more samples.
- This method is of an absolutely general nature, in that it can be applied to a very great variety of problems: to tests on the mean effects of a drug, to tests on the influence of an operating parameter on a production process, to tests on the quality of a production process, to tests on the yield of a process, to tests on the capacity indicators of a process, etc., in practice to all decisionmaking procedures based on random sampling, that is statistical tests, which have an outcome of the yes/no type.
- a system for the control of an industrial process includes a processing system associated with the production line, such as for example an electronic processor or work station arranged for receiving a series of sample data, that is the values of one or more selected observed variables which are indicative of the properties of the product, relating to a sample (which is in the limit exhaustive) of the products obtained from the process, and for generating data for control of the process parameters.
- a processing system associated with the production line such as for example an electronic processor or work station arranged for receiving a series of sample data, that is the values of one or more selected observed variables which are indicative of the properties of the product, relating to a sample (which is in the limit exhaustive) of the products obtained from the process, and for generating data for control of the process parameters.
- the sample data may be provided to the processing system by an operator through a user interface, or automatically through transmission via a dedicated communications network from an associated control equipment.
- This equipment may for example be an equipment measuring physical and/or geometrical quantities of a product drawn from a batch, or an equipment for control of the process of synthesizing a drug.
- the data received are processed through a calculation algorithm illustrated in detail in the remainder of this description.
- This algorithm can be used to determine at least a lower bound (and possibly an upper bound) for the power of a statistical test for a given sample size, and consequently the minimum sample size necessary for that lower bound to be at least equal to or greater than a predetermined value.
- the results of the processing are then provided to the operator through the user interface and/or are used automatically by the system to act on the process parameters which it controls, to vary or adjust them.
- Industrial processes including in particular processes for the synthesis and production of drugs, require a product development stage in which the process parameters and/or characteristics of the finished product are determined and adjusted in relation to design specifications and predetermined objectives.
- this stage analysis of the properties of the products obtained is of particular importance, because it is possible to identify modifications which have to be made to the process stage to adjust it in order to obtain an output which satisfies the desired specifications.
- the distribution F is not known, but a pilot sample is available, an approximation to the power may be made and the sample size m may be calculated on the basis of a predetermined desired power (1- ⁇ ) using methods similar to what has been described in relation to the known art. These methods however give rise to the risk of examining an excessively limited number of sample elements.
- the ⁇ ⁇ statistical test be now regarded as the kernel, of size m , of a V-statistic (defined in "Approximation Theorems of Mathematical Statistics", R.J. Serfling, Wiley, New York, 1980). It is possible to verify that the regularity hypotheses E F [
- the power obtained with the plug-in through pilot sample X 1 , X 2 , ... X n is a V-statistic, that is where X * 1 , ..., X* m are to be regarded as m random data drawn with replacement from the sample data X 1 , ..., X n , and therefore drawn from an F n distribution approximating F.
- F n * now be a generic element in the family of empirical distribution functions which would be obtained by randomly drawing n data X * 1 , ..., X * n , with replacement, from the n observations originating from the pilot sample X 1 , ..., X n .
- the bootstrap version of the plug-in power that is of the V-statistic having the statistical test as its kernel, is therefore defined as: where X ** / 1,..., X ** / m represent m random data drawn with replacement from the data X * / 1,..., X * / n , and that can therefore be drawn from F n * . It is then possible to approximate the distribution of statistic (I) with the distribution of the following statistic (II):
- t q is the q -th quantile of i.e. is such that the relative frequency (that is the percentage) of the points in less than or equal to t q is equal to q, that is it is possible to calculate t ⁇ 1/2 and t 1- ⁇ 1/2 such that
- Errors in the Monte Carlo approximation to the pointwise estimates of the power can be controlled through the choice of B .
- the asymptotic variance of the power estimator based on the Monte Carlo Method (that is MC ⁇ and F n ( m )) is ⁇ 1, m m 2 / B , where the parameter ⁇ 1, m can be calculated when F n is known.
- the interval [ MC ⁇ F n ( m )-z 1- ⁇ /2 ⁇ 1, m m / B, MC ⁇ F n ( m ) + z 1- ⁇ /2 ⁇ 1, m m / B ] includes ⁇ and F n ( m ) with an approximate probability 1- ⁇ .
- ⁇ 0.05
- m 200
- the distribution of the pivot statistics based on the V-statistic can be approximated through J Monte Carlo replications, in order to calculate its percentile of interest t ⁇ 1 .
- the estimator for the percentile of interest which is obtained using the Monte Carlo method that is MC t ⁇ 1 , can be approximated asymptotically to a normal distribution having as mean the percentile of interest t ⁇ 1 and as variance ⁇ 1(1- ⁇ 1)/ J ( f ( t ⁇ 1 )) 2 , where f ( t ⁇ 1 ) represents the density of the distribution of interest calculated in f ( t ⁇ 1 ).
- the interval [ MC t ⁇ 1 -z 1- ⁇ /2 ⁇ 1(1- ⁇ 1)/ J / f ( t ⁇ 1 ), MC t ⁇ 1 + z 1- ⁇ /2 ⁇ 1(1- ⁇ 1)/ J / f ( t ⁇ 1 )] includes t ⁇ 1 with a probability of approximately 1- ⁇ .
- the "Bootstrap Percentile” is based on the fact that the statistic (I), but with the opposite sign, that is has the same asymptotic distribution as statistic (I), and therefore as statistic (II). Thus the percentiles of statistic (II) can also be used in this case.
- bootstrap BCa Bias-Corrected and Accelerated
- This method is more refined and operates more satisfactorily, especially for statistics having an asymmetrical distribution such as those of type I. It consists of a suitable adjustment to ⁇ 1, based on some of the shape parameters of statistic (II), and therefore calculatable when the sample is known.
- the acceleration parameter comprises using the so-called "jack-knife” algorithm described in the work "An Introduction to the Bootstrap" by B. Efron and R.J. Tibshirani, ed. Chapman & Hall, 1993.
- the parameter ⁇ 1 selected to define the confidence level or degree of reliability of the confidence interval will be closer to the true value of that confidence the larger the size of the pilot sample. It may therefore be useful to calibrate the confidence intervals for the power, because of the merely asymptotic correctness of the bootstrap confidence intervals.
- the parameter ⁇ 1 will first be estimated on the basis of the measurement data acquired ( X 1 ,... X n ), and then the estimate found will be used to calculate the lower bound for the power as indicated above.
- An algorithm which is currently preferred for estimating ⁇ 1 is the following:
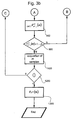
- n doses of the drug to be administered will be synthesised in step 200 for as many patients that are under observation, for which data for the predetermined observation variable(s) will be acquired in step 300.
- the first of these is -8,8, -1,23, 1,5, 2,0, 3,14, 7,2, 8,8; and from this sample a non-significant test will be obtained (step 600).
- Another re-resample will be -8,5, -1,17, 1,8, 2,0, 3,15, 7,4, 8,11, and a significant test will be obtained from this sample (step 600).
- step 900 the system establishes, from a comparison with the preset lower bound (set, for example, by an operator as a specific for the production process), that it is necessary to increase m still further (step 1000) in order to obtain a lower bound for the power which is greater than 80%.
- the preset lower bound set, for example, by an operator as a specific for the production process
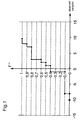
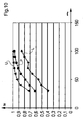
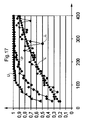
- Figure 10 shows the evolution in the pointwise estimate P of the power, the lower bound L and the upper bound U in relation to sample size, with two-directional CI with a confidence level of 20% with m increasing from 30 to 100, in steps of 10.
- the evolution in the lower bound of 40% (curve L) and the upper bound of 60% (curve U) with increasing m will therefore be noted.
- This analysis can be carried out using any of the methods known in the art to determine the minimum m such that the constraint on the lower bound is satisfied.
- the system will acquire m data for the observed variable (that is, in the case in point, for the synthesis of m doses of drug and the acquisition of data from m patients to whom the drug is administered).
- the condition that the batch is conforming will merely result in a return to step 200 and the repetition of steps 200 - 1200 in the process according to the invention.
- Narrower confidence intervals will be obtained for the power and as a consequence the estimated sample size in this second stage will be less than 90.
- the method can be applied sequentially so as to arrive at convergence between the number of pilot size data and the estimated sample size. This being the case, a stable statistical decision is obtained with n pilot sample data and at the same time the sample size estimate will conclude that precisely n observations will be needed in order to obtain the predetermined stability.
- the process of producing information can therefore be stopped, that is no further data will be sampled and the data initially considered to be the pilot sample will be regarded as the data for the observed variable and the statistical test will be carried out on these.
- the algorithm described has a firm theoretical basis because of the fact that the estimator ⁇ and F n for the power, obtained by plugging in the empirical distribution function F n , is a V-statistic.
- the F distribution has as indices a parameter ⁇ ⁇ R , for example the mean or the variance, (relating, for example, to the diameter of a product in a production batch), or in a two-dimensional context the correlation coefficient ⁇ (relating for example to the link between the efficiency of a process and a particular process parameter).
- F ⁇ is known there are no problems, apart from computational ones, in calculating and displaying ⁇ F ⁇ ( m ).
- F ⁇ is not known, either wholly or in part, will be necessary an estimate of it, which in any event keeps the characteristic of interest unchanged, that is keeps ⁇ fixed.
- F n will be constructed from a sample estimate based on a sample X 1 , ..., X n .
- Application of the process according to the invention comprises calculating a confidence interval for ⁇ F n ⁇ ( m ). Following what is described in part B of the algorithm (calculation of the bootstrap distribution), replacing F n / ⁇ for F n , the desired result is obtained as ⁇ is varied and lower and upper bounds are obtained for the power curve for any test with one sample for which the following relationship is respected:
- F n,s smoothed empirical distribution function
- Another possibility consists of using semi-parametric models, through which some characteristics of a specific model are imposed on the empirical distribution function. For example, it may be desired that the distribution is symmetrical with respect to a predetermined value ⁇ .
- the two approaches mentioned can be applied simultaneously, obtaining a smoothed and symmetrical empirical distribution function.
- the smoothing technique to calculate the empirical distribution function is applied to the data in the preceding examples, with reference to a model having a symmetrical distribution.
- rendering the guide sample data symmetrical with respect to the Hodges-Lehmann estimate which is the following data are obtained -8,1, -6,1, -5,1, -1,5, 0,1, 1,2, 2,1, 3,5, 7,1, 8,1, 10,1, to which the minimum -10 and the maximum 12 are added.
- the repeated data can be distributed symmetrically about the original datum, adding or subtracting an infinitesimal value, in this case equal to 0.01.
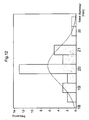
- the following data -10, -8, -6, -5, -1.02, -1.01, -1, -0.99, -0.98, 0, 0.99, 1.01, 2, 2.98, 2.99, 3, 3.01, 3.02, 7, 8, 10, 12, that is 22 items of data, are therefore obtained, and these ultimately give rise to the smoothed empirical distribution function shown in Figure 15, assigning uniform probabilities of 1/21 to the intervals between the items of data.
- step 1300 The estimate of the power of a test which has just been carried out is indicated by the definition "post-hoc power" and this is performed in step 1300.
- the supporting theory is based on the fact that the size of the kernel for the V-statistic has been fixed to be n .
- the confidence interval comprises a pair of random bounds, for which: is obtained.
- each observed variable X ki may be a multivariate datum, that is in R p .
- a pointwise estimate of the power is obtained using the plug-in: where the generic X * / k i is a random item of data extracted from F n k / k .
- This formulation is equal to and proves to be a generalised V statistic.
- the bootstrap can then be applied to the generalised V-statistics to obtain a general solution which provides the lower bound for the power for any test with K samples.
- the bootstrap confidence intervals for the power are calculated on the basis of the pointwise estimate ⁇ and F n ( m ) and the distribution ⁇ and F n * ( m ), which may be approximated using a Monte Carlo method.
- the algorithm is as follows:
- the bootstrap CI for the power of the test can be calculated in the same way. Without any loss of generality we will assume that the samples of the first H populations F 1 , ..., F H . are known.
- F ⁇ is not known, at least in part, it can be estimated. Going back to the first example, having a sample X 11 ,... X 1 n 1 from F 1 and X 21 , ..., X 2 n 2 from F 2 , F n / 1 is obtained in a standard way from X 11 ,..., X 1 n 1 , and by defining X i as the empirical means for the two pilot samples, F n / 2 is obtained from X 21 - X 2 + X 1 + ⁇ ,..., X 2 n 2 - X 2 + X 1 + ⁇ .
- F n / ⁇ ( F n / 1, F n / 2), which consists of two estimated distributions whose means differ in location by precisely a value ⁇ , is obtained; in fact F n / 1 has a mean X 1 while F n / 2 has a mean X 1 + ⁇ .
- the method according to the invention may be applied to the control of a production process through statistical tests with one or more samples to determine the minimum number of products which have to be manufactured or selected from a batch of larger size in order to guarantee preestablished stability/sensitivity in the results of the statistical test.
Landscapes
- Engineering & Computer Science (AREA)
- General Engineering & Computer Science (AREA)
- Manufacturing & Machinery (AREA)
- Quality & Reliability (AREA)
- Physics & Mathematics (AREA)
- General Physics & Mathematics (AREA)
- Automation & Control Theory (AREA)
- Complex Calculations (AREA)
- General Factory Administration (AREA)
- Testing Or Measuring Of Semiconductors Or The Like (AREA)
Applications Claiming Priority (2)
| Application Number | Priority Date | Filing Date | Title |
|---|---|---|---|
| ITTO20040377 | 2004-06-07 | ||
| IT000377A ITTO20040377A1 (it) | 2004-06-07 | 2004-06-07 | Procedimento e sistema per il controllo statistico di processi industriali. |
Publications (2)
| Publication Number | Publication Date |
|---|---|
| EP1605326A2 true EP1605326A2 (de) | 2005-12-14 |
| EP1605326A3 EP1605326A3 (de) | 2006-05-10 |
Family
ID=34981396
Family Applications (1)
| Application Number | Title | Priority Date | Filing Date |
|---|---|---|---|
| EP05104957A Withdrawn EP1605326A3 (de) | 2004-06-07 | 2005-06-07 | Verfahren und Vorrichtung zur statistischen Steuerung industrieller Prozesse |
Country Status (3)
| Country | Link |
|---|---|
| US (1) | US7248998B2 (de) |
| EP (1) | EP1605326A3 (de) |
| IT (1) | ITTO20040377A1 (de) |
Cited By (2)
| Publication number | Priority date | Publication date | Assignee | Title |
|---|---|---|---|---|
| CN101689050B (zh) * | 2007-03-12 | 2014-03-12 | 艾默生过程管理电力和水力解决方案有限公司 | 发电厂性能监测中统计分析的使用 |
| CN113110321A (zh) * | 2021-04-08 | 2021-07-13 | 杭州电子科技大学 | 基于事件触发的网络化工业控制系统的分布式估计方法 |
Families Citing this family (16)
| Publication number | Priority date | Publication date | Assignee | Title |
|---|---|---|---|---|
| US10417700B2 (en) * | 2005-03-03 | 2019-09-17 | Refinitiv Us Organization Llc | System and method for graphical display of multivariate data |
| US20070180411A1 (en) * | 2006-01-27 | 2007-08-02 | Wolfgang Swegat | Method and apparatus for comparing semiconductor-related technical systems characterized by statistical data |
| US8583695B2 (en) * | 2006-06-28 | 2013-11-12 | Bank Of America Corporation | Method and apparatus for evaluating statistical significance over time |
| US7738984B2 (en) * | 2006-09-12 | 2010-06-15 | International Business Machines Corporation | System for and method of interpolation for supply chain planning |
| US7793292B2 (en) * | 2006-09-13 | 2010-09-07 | Fisher-Rosemount Systems, Inc. | Compact batch viewing techniques for use in batch processes |
| US9014827B2 (en) * | 2010-01-14 | 2015-04-21 | International Business Machines Corporation | Dynamically generating a manufacturing production work flow with selectable sampling strategies |
| FR3029620B1 (fr) * | 2014-12-05 | 2019-06-14 | Safran Aircraft Engines | Procede de suivi de la fabrication de pieces base sur l'analyse simultanee d'indicateurs statistiques |
| US10394973B2 (en) | 2015-12-18 | 2019-08-27 | Fisher-Rosemount Systems, Inc. | Methods and apparatus for using analytical/statistical modeling for continued process verification (CPV) |
| EP3264165B1 (de) * | 2016-06-30 | 2019-03-06 | Essilor International | Verfahren zur erkennung eines wahrscheinlichen fehlers in einem datensatz bezüglich eines trägers und/oder eines vom träger ausgewählten rahmens |
| CN109494716B (zh) * | 2018-11-15 | 2022-04-26 | 沈阳工业大学 | 基于Bootstrap的风电输出功率置信区间预测方法 |
| US12386320B2 (en) * | 2019-03-15 | 2025-08-12 | 3M Innovative Properties Company | Controlling a manufacturing process using causal models |
| CN113762981B (zh) * | 2021-03-30 | 2023-11-28 | 中国人民解放军国防科技大学 | 一种基于指数分布的产品可信度计算方法 |
| CN113284567B (zh) * | 2021-05-21 | 2024-01-19 | 苏州西热节能环保技术有限公司 | 一种催化剂模块内破损及可再生单体量的统计方法 |
| CN115544750B (zh) * | 2022-09-26 | 2026-01-09 | 北京化工大学 | 基于Bootstrap的均值标准差阈值预警方法 |
| DE102022128703A1 (de) * | 2022-10-28 | 2024-05-08 | Sick Ag | Verfahren zum Betreiben einer Positionsmessvorrichtung |
| US12399465B2 (en) * | 2023-02-10 | 2025-08-26 | Mitsubishi Electric Research Laboratories, Inc. | System and method for controlling an operation of a system subject to an uncertainty |
Citations (1)
| Publication number | Priority date | Publication date | Assignee | Title |
|---|---|---|---|---|
| EP0508386A2 (de) | 1991-04-08 | 1992-10-14 | Praxair Technology, Inc. | Statistische Prozesssteuerung für Lufttrennung |
Family Cites Families (1)
| Publication number | Priority date | Publication date | Assignee | Title |
|---|---|---|---|---|
| US6550700B1 (en) * | 2000-11-27 | 2003-04-22 | The Quaker Oats Company | Granular material test milling processes |
-
2004
- 2004-06-07 IT IT000377A patent/ITTO20040377A1/it unknown
-
2005
- 2005-06-07 EP EP05104957A patent/EP1605326A3/de not_active Withdrawn
- 2005-06-07 US US11/146,132 patent/US7248998B2/en not_active Expired - Fee Related
Patent Citations (1)
| Publication number | Priority date | Publication date | Assignee | Title |
|---|---|---|---|---|
| EP0508386A2 (de) | 1991-04-08 | 1992-10-14 | Praxair Technology, Inc. | Statistische Prozesssteuerung für Lufttrennung |
Cited By (3)
| Publication number | Priority date | Publication date | Assignee | Title |
|---|---|---|---|---|
| CN101689050B (zh) * | 2007-03-12 | 2014-03-12 | 艾默生过程管理电力和水力解决方案有限公司 | 发电厂性能监测中统计分析的使用 |
| CN113110321A (zh) * | 2021-04-08 | 2021-07-13 | 杭州电子科技大学 | 基于事件触发的网络化工业控制系统的分布式估计方法 |
| CN113110321B (zh) * | 2021-04-08 | 2022-03-18 | 杭州电子科技大学 | 基于事件触发的网络化工业控制系统的分布式估计方法 |
Also Published As
| Publication number | Publication date |
|---|---|
| ITTO20040377A1 (it) | 2004-09-07 |
| US7248998B2 (en) | 2007-07-24 |
| EP1605326A3 (de) | 2006-05-10 |
| US20050288892A1 (en) | 2005-12-29 |
Similar Documents
| Publication | Publication Date | Title |
|---|---|---|
| EP1605326A2 (de) | Verfahren und Vorrichtung zur statistischen Steuerung industrieller Prozesse | |
| JP6285494B2 (ja) | サンプリングレート決定機構付きの測定サンプル抽出方法及びそのコンピュータプログラム製品 | |
| CN102117731A (zh) | 半导体工艺生产流程中的测量数据的监测方法和装置 | |
| US11599889B2 (en) | Qualification of second-source raw materials in the presence of multiple batch effects | |
| Chen et al. | A procedure for generating batch-means confidence intervals for simulation: Checking independence and normality | |
| Metcalfe et al. | The importance of varying the event generation process in simulation studies of statistical methods for recurrent events | |
| CN107209502A (zh) | 在减少控制的情况下基于对统计指标的分析来制造部件的方法 | |
| CN111199493A (zh) | 一种基于客户缴费信息及征信信息的欠费风险识别方法 | |
| CN116701130A (zh) | 基于指标画像的动态基线优化方法、装置及电子设备 | |
| CN119090832A (zh) | 基于图像处理的塑胶制品缺陷检测方法及系统 | |
| US20090299497A1 (en) | Tolerance interval determination method | |
| CN107861082B (zh) | 一种电子测量设备的校准间隔确定方法及装置 | |
| CN114415594B (zh) | 刀具寿命管理系统及方法 | |
| Castro-Kuriss | On a goodness-of-fit test for censored data from a location-scale distribution with applications | |
| Bader et al. | Automated threshold selection for extreme value analysis via Goodness-of-Fit tests with application to batched return level mapping | |
| Anis et al. | Difference of power test and type ii error (β) on Mardia mvn test, Henze zikler's mvn test, and Royston's mvn test using multivariate data analysis | |
| Wang et al. | Constructing tolerance intervals for the number of defectives using both high-and low-resolution data | |
| CN120336903B (zh) | 一种径向锻造机的道次类别监测方法 | |
| Hade et al. | Sample size re-estimation in a breast cancer trial | |
| CN110913033A (zh) | 基于cnn卷积神经网络学习的idcip地址分配方法 | |
| Kok et al. | Short-run univariate quality control approaches | |
| CN113065252B (zh) | 一种切削稳定性实验数据关于模型参数的似然函数的建立方法 | |
| US12265382B2 (en) | B vs W two pack confirmation test | |
| UNGUREANU et al. | ABOUT MANUFACTURING PROCESSES CAPABILITY ANALYSIS | |
| Greipel et al. | Concept for clustering of similar quality features for optimization of processes in low volume manufacturing |
Legal Events
| Date | Code | Title | Description |
|---|---|---|---|
| PUAI | Public reference made under article 153(3) epc to a published international application that has entered the european phase |
Free format text: ORIGINAL CODE: 0009012 |
|
| AK | Designated contracting states |
Kind code of ref document: A2 Designated state(s): AT BE BG CH CY CZ DE DK EE ES FI FR GB GR HU IE IS IT LI LT LU MC NL PL PT RO SE SI SK TR |
|
| AX | Request for extension of the european patent |
Extension state: AL BA HR LV MK YU |
|
| PUAL | Search report despatched |
Free format text: ORIGINAL CODE: 0009013 |
|
| AK | Designated contracting states |
Kind code of ref document: A3 Designated state(s): AT BE BG CH CY CZ DE DK EE ES FI FR GB GR HU IE IS IT LI LT LU MC NL PL PT RO SE SI SK TR |
|
| AX | Request for extension of the european patent |
Extension state: AL BA HR LV MK YU |
|
| 17P | Request for examination filed |
Effective date: 20061103 |
|
| AKX | Designation fees paid |
Designated state(s): AT BE BG CH CY CZ DE DK EE ES FI FR GB GR HU IE IS IT LI LT LU MC NL PL PT RO SE SI SK TR |
|
| RAP1 | Party data changed (applicant data changed or rights of an application transferred) |
Owner name: DE MARTINI, DANIELE |
|
| RIN1 | Information on inventor provided before grant (corrected) |
Inventor name: DE MARTINI, DANIELE |
|
| 17Q | First examination report despatched |
Effective date: 20080912 |
|
| GRAP | Despatch of communication of intention to grant a patent |
Free format text: ORIGINAL CODE: EPIDOSNIGR1 |
|
| STAA | Information on the status of an ep patent application or granted ep patent |
Free format text: STATUS: THE APPLICATION IS DEEMED TO BE WITHDRAWN |
|
| 18D | Application deemed to be withdrawn |
Effective date: 20100915 |