EP1577783A1 - Operation managing method and operation managing server - Google Patents
Operation managing method and operation managing server Download PDFInfo
- Publication number
- EP1577783A1 EP1577783A1 EP02793425A EP02793425A EP1577783A1 EP 1577783 A1 EP1577783 A1 EP 1577783A1 EP 02793425 A EP02793425 A EP 02793425A EP 02793425 A EP02793425 A EP 02793425A EP 1577783 A1 EP1577783 A1 EP 1577783A1
- Authority
- EP
- European Patent Office
- Prior art keywords
- event
- pattern
- records
- group
- patterns
- Prior art date
- Legal status (The legal status is an assumption and is not a legal conclusion. Google has not performed a legal analysis and makes no representation as to the accuracy of the status listed.)
- Withdrawn
Links
Images














Classifications
-
- G—PHYSICS
- G06—COMPUTING OR CALCULATING; COUNTING
- G06F—ELECTRIC DIGITAL DATA PROCESSING
- G06F11/00—Error detection; Error correction; Monitoring
- G06F11/07—Responding to the occurrence of a fault, e.g. fault tolerance
- G06F11/0703—Error or fault processing not based on redundancy, i.e. by taking additional measures to deal with the error or fault not making use of redundancy in operation, in hardware, or in data representation
- G06F11/0706—Error or fault processing not based on redundancy, i.e. by taking additional measures to deal with the error or fault not making use of redundancy in operation, in hardware, or in data representation the processing taking place on a specific hardware platform or in a specific software environment
- G06F11/0709—Error or fault processing not based on redundancy, i.e. by taking additional measures to deal with the error or fault not making use of redundancy in operation, in hardware, or in data representation the processing taking place on a specific hardware platform or in a specific software environment in a distributed system consisting of a plurality of standalone computer nodes, e.g. clusters, client-server systems
-
- G—PHYSICS
- G06—COMPUTING OR CALCULATING; COUNTING
- G06F—ELECTRIC DIGITAL DATA PROCESSING
- G06F11/00—Error detection; Error correction; Monitoring
- G06F11/07—Responding to the occurrence of a fault, e.g. fault tolerance
- G06F11/0703—Error or fault processing not based on redundancy, i.e. by taking additional measures to deal with the error or fault not making use of redundancy in operation, in hardware, or in data representation
- G06F11/079—Root cause analysis, i.e. error or fault diagnosis
-
- G—PHYSICS
- G06—COMPUTING OR CALCULATING; COUNTING
- G06F—ELECTRIC DIGITAL DATA PROCESSING
- G06F11/00—Error detection; Error correction; Monitoring
- G06F11/07—Responding to the occurrence of a fault, e.g. fault tolerance
- G06F11/0703—Error or fault processing not based on redundancy, i.e. by taking additional measures to deal with the error or fault not making use of redundancy in operation, in hardware, or in data representation
- G06F11/0793—Remedial or corrective actions
-
- H—ELECTRICITY
- H04—ELECTRIC COMMUNICATION TECHNIQUE
- H04L—TRANSMISSION OF DIGITAL INFORMATION, e.g. TELEGRAPHIC COMMUNICATION
- H04L41/00—Arrangements for maintenance, administration or management of data switching networks, e.g. of packet switching networks
- H04L41/06—Management of faults, events, alarms or notifications
- H04L41/0631—Management of faults, events, alarms or notifications using root cause analysis; using analysis of correlation between notifications, alarms or events based on decision criteria, e.g. hierarchy, tree or time analysis
-
- H—ELECTRICITY
- H04—ELECTRIC COMMUNICATION TECHNIQUE
- H04L—TRANSMISSION OF DIGITAL INFORMATION, e.g. TELEGRAPHIC COMMUNICATION
- H04L43/00—Arrangements for monitoring or testing data switching networks
- H04L43/08—Monitoring or testing based on specific metrics, e.g. QoS, energy consumption or environmental parameters
- H04L43/0805—Monitoring or testing based on specific metrics, e.g. QoS, energy consumption or environmental parameters by checking availability
- H04L43/0817—Monitoring or testing based on specific metrics, e.g. QoS, energy consumption or environmental parameters by checking availability by checking functioning
-
- G—PHYSICS
- G06—COMPUTING OR CALCULATING; COUNTING
- G06F—ELECTRIC DIGITAL DATA PROCESSING
- G06F11/00—Error detection; Error correction; Monitoring
- G06F11/30—Monitoring
- G06F11/34—Recording or statistical evaluation of computer activity, e.g. of down time, of input/output operation ; Recording or statistical evaluation of user activity, e.g. usability assessment
- G06F11/3447—Performance evaluation by modeling
-
- G—PHYSICS
- G06—COMPUTING OR CALCULATING; COUNTING
- G06F—ELECTRIC DIGITAL DATA PROCESSING
- G06F11/00—Error detection; Error correction; Monitoring
- G06F11/30—Monitoring
- G06F11/34—Recording or statistical evaluation of computer activity, e.g. of down time, of input/output operation ; Recording or statistical evaluation of user activity, e.g. usability assessment
- G06F11/3466—Performance evaluation by tracing or monitoring
- G06F11/3476—Data logging
-
- G—PHYSICS
- G06—COMPUTING OR CALCULATING; COUNTING
- G06F—ELECTRIC DIGITAL DATA PROCESSING
- G06F2201/00—Indexing scheme relating to error detection, to error correction, and to monitoring
- G06F2201/86—Event-based monitoring
-
- H—ELECTRICITY
- H04—ELECTRIC COMMUNICATION TECHNIQUE
- H04L—TRANSMISSION OF DIGITAL INFORMATION, e.g. TELEGRAPHIC COMMUNICATION
- H04L41/00—Arrangements for maintenance, administration or management of data switching networks, e.g. of packet switching networks
- H04L41/16—Arrangements for maintenance, administration or management of data switching networks, e.g. of packet switching networks using machine learning or artificial intelligence
-
- Y—GENERAL TAGGING OF NEW TECHNOLOGICAL DEVELOPMENTS; GENERAL TAGGING OF CROSS-SECTIONAL TECHNOLOGIES SPANNING OVER SEVERAL SECTIONS OF THE IPC; TECHNICAL SUBJECTS COVERED BY FORMER USPC CROSS-REFERENCE ART COLLECTIONS [XRACs] AND DIGESTS
- Y10—TECHNICAL SUBJECTS COVERED BY FORMER USPC
- Y10S—TECHNICAL SUBJECTS COVERED BY FORMER USPC CROSS-REFERENCE ART COLLECTIONS [XRACs] AND DIGESTS
- Y10S707/00—Data processing: database and file management or data structures
- Y10S707/99951—File or database maintenance
- Y10S707/99952—Coherency, e.g. same view to multiple users
- Y10S707/99953—Recoverability
Definitions
- the present invention relates to an operation management method, operation management server, and operation management program for managing the operation of target devices, as well as to a computer-readable storage medium storing that operation management program. More particularly, the present invention relates to an operation management method, operation management server, and operation management program which effectively work in troubleshooting a problem with target devices being managed, as well as to a computer-readable storage medium storing that operation management program.
- a failure or other problem event occurred in a server is reported to some other device (e.g., operation management server) in the form of messages.
- some other device e.g., operation management server
- a problem in one function propagates to other related functions, thus causing more error messages to be transmitted. That is, when a server encounters a problem, that server is not necessarily the only server that produces an error message. Actually, other related servers would send error messages as well.
- One proposed solution is to have a database that stores records of each network failure, together with a time-series of failure notification messages that are produced consequently.
- a failure can be located by examining messages actually sent from the network in comparison with the database records.
- the proposed device automatically finds the location of a failure and thus enables quick recovery of a network system. See, for example, Japanese Patent Application Publication No. 2001-257677 ( Figure 1).
- the device disclosed in Japanese Patent Application Publication No. 2001-257677 ( Figure 1) is, however, directed to communication failure on a network. It discusses nothing about how to deal with problems that an application or other programs running on a server may encounter.
- the proposed device does not provide functions of investigating a problem from error messages produced from applications, middleware, or operating system (OS) on a server.
- OS operating system
- the existing techniques do not allow us to identify the real location of a server problem when it generates a plurality of messages.
- an application on a server has stopped for some reason.
- some other programs including middleware and OS modules may also issue error messages.
- some application on another server would produce an error message as well.
- the present invention provides an operation management method shown in FIG. 1.
- This method is designed to perform operation management tasks in the following way.
- event records are collected from a plurality of target objects being monitored (step ST1), where the target objects are a plurality of functions executed on the server.
- An event group is then produced by grouping the collected event records (step ST2).
- the event group is compared with a plurality of pattern definition groups in terms of occurrence patterns of event records (step ST3), where each pattern definition group defines a pattern of event records that would be produced upon occurrence of a particular problem.
- a troubleshooting record is extracted (step ST4).
- the troubleshooting record has previously been associated with a pattern definition group resembling the event group in terms of occurrence patterns of event records, and it indicates which target object is considered a source of a problem.
- event records produced by target objects are collected and combined into an event group. That event group is then compared with a plurality of pattern definition groups.
- a pattern definition group resembling the event group in terms of occurrence patterns is found, a troubleshooting record that has previously been associated with the found pattern definition group is extracted. This troubleshooting record indicates which target object is considered a source of a problem.
- an operation management method for managing a server comprises the steps of: collecting records of commands entered to the server; producing an operation log by grouping the collected command records; comparing the operation log with a plurality of operation patterns in terms of input patterns of commands, the operation patterns each defining a command input pattern that could lead to a problem; and extracting a troubleshooting record that has previously been associated with the operation pattern resembling the operation log in terms of input patterns of commands, the troubleshooting record indicating which target object is considered a source of a problem.
- FIG. 1 is a conceptual view of the present invention.
- an operation management server 1 executes an operation management method according to the present invention.
- This operation management server 1 is connected to a plurality of servers 2 to 4.
- Software programs running on the server 2 include application programs 2a, middleware programs 2b, and operating system (OS) programs 2c, which are among the target objects that the operation management server 1 are monitoring. Similar software programs are running on other servers 3 and 4.
- OS operating system
- the operation management server 1 has a pattern definition group database 1a and a troubleshooting database 1b, which have been prepared beforehand.
- the pattern definition group database 1a stores a plurality of pattern definition groups each defining a pattern of event records that could be produced from a plurality of target objects when a particular problem occurs.
- the troubleshooting database 1b stores troubleshooting records containing information about target objects that could be a source of a problem. Those troubleshooting records are associated beforehand with corresponding pattern definition groups.
- a troubleshooting record contains the following data items: problem location, problem cause, and countermeasure to a problem.
- the operation management server 1 performs the following tasks.
- the operation management server 1 collects event records from a plurality of target objects being monitored (step ST1).
- target objects refers to various functions executed on servers.
- the operation management server 1 then produce an event group by grouping the collected event records (step ST2).
- the operation management server 1 compares the produced event group with each pattern definition group in the pattern definition group database 1a, in terms of occurrence patterns of event records (step ST3).
- the operation management server 1 finds a particular pattern definition group resembles the given event group in terms of occurrence patterns of event records.
- the operation management server 1 then consults the troubleshooting database 1b to extract a relevant troubleshooting record associated with the matching pattern definition group that is found (step ST4).
- the resemblance between two groups in occurrence patterns of event records refers to the fact that they share at least one common event record.
- event records collected from target objects are sorted into groups.
- One resulting event group is compared with a plurality of pattern definition groups in terms of occurrence patterns of event records.
- a pattern definition group with a similar occurrence pattern is then found, and its associated troubleshooting record is extracted.
- the proposed method permits an administrator taking care of the operation management server to identify the location and cause of a problem, as well as receiving a suggestion of possible countermeasures to that problem, based on the retrieved troubleshooting record.
- a new pattern definition group for that event group is created and stored in the pattern definition group database 1a when the problem is solved.
- a new troubleshooting record is entered to the troubleshooting database 1b. Countermeasures and other actions that some service engineers took against problems in the past can thus be reused by other service engineers as necessary.
- the operation management method described above reduces the time required for troubleshooting regardless of the ability of an individual operator. It uses accumulated knowledge about past problems and countermeasures in the pattern definition groups and troubleshooting records, thus making it possible to cope with a similar problem quickly and adequately.
- the record of that trouble will be registered as a pattern definition group and a troubleshooting record, which eliminates the need for him/her to let others know it in person. This feature prevents a problem from being unsolved for a long time due to irrelevant measures taken.
- FIG. 2 shows an example of how a trouble is solved with a regression-based troubleshooting method using problem records.
- a plurality of servers 11 and 12 are connected to an operation management server 20 via a network 13.
- One server 11 has built-in supervisory functions including: hardware monitoring, software monitoring, performance monitoring, security monitoring, and configuration monitoring.
- Another server 12 also has such supervisory functions.
- the hardware monitoring function tracks the behavior of hardware modules (e.g., watching the write error rate of a hard disk drive) used in the server 11.
- the software monitoring function is a collection of modules each monitoring a particular piece of software, such as an OS program, middleware program, or application program.
- the performance monitoring function supervises the operation condition (e.g., free memory space) of the server 11.
- the security monitoring function watches illegal access attempts to the server 11.
- the configuration monitoring function finds a change in the configuration of the server 11.
- each supervisory function Upon occurrence of a particular event such as an error, each supervisory function generates an error event.
- An event record describing details of this error event is produced and delivered to the operation management server 20 via the network 13 in the form of a message.
- Such messages 31 and 32 carry, for example, log records and configuration change notice that the servers 11 and 12 produce.
- the operation management server 20 comprises an event extraction table 21, pattern definition groups 22, a countermeasure table 23, a message normalizer 24, a grouping unit 25, a matching unit 26, and a troubleshooting advisor 27.
- the event extraction table 21 is a data table containing the definition of rules for extracting necessary event records from received messages.
- the pattern definition groups 22 are a collection of datasets each defining a combination of events which are expected to be generated when a particular problem occurs.
- the countermeasure table 23 is a data table containing information about countermeasures corresponding to various event patterns that would be encountered when a failure occurs.
- the message normalizer 24 normalizes messages received from the servers 11 and 12 to make them comply with a predetermined data structure. More specifically, when messages are received, the message normalizer 24 consults the event extraction table 21 to obtain an event record extracting rule that is relevant to each received message. The message normalizer 24 then scans each message according to the obtained rule to extract information as an event record.
- the grouping unit 25 sorts the extracted event records into groups, each consisting of interrelated event records. Association between particular target objects (e.g., device, OS, middleware, application) is previously defined. Event records that those associated target objects have produced in a predetermined short period are regarded as being interrelated. The grouping unit 25 performs such a grouping task with given event records, thus producing an event group 33 consisting of interrelated event records.
- target objects e.g., device, OS, middleware, application
- the matching unit 26 compares the produced event group 33 with the pattern definition groups 22 so as to find an exact match or a best match in the pattern definition groups 22.
- the troubleshooting advisor 27 obtains a countermeasure record relevant to that pattern definition group, with reference to the countermeasure table 23.
- the troubleshooting advisor 27 outputs the obtained countermeasure record for display on a terminal console or a similar device linked to the operation management server 20.
- messages 31 and 32 sent from the servers 11 and 12 to the operation management server 20 are processed in the following way.
- the message normalizer 24 turns those messages 31 and 32 into event records with a unified format.
- FIG. 3 shows this message normalization process.
- the messages 31 and 32 carry the following data items: "Serial No.,” “Time,” “Host Name,” and “Event Details.”
- the serial No. field of a message contains an identification code that permits the message to be uniquely distinguished from others.
- the time field indicates when the event occurred.
- the host name field contains the host name of a server that produced the message. Host names are used to designate each particular device on the network 13.
- the event details field shows what the originating supervisory function in that server produced as an event.
- the message normalizer 24 Upon reception of those messages 31 and 32, the message normalizer 24 consults the event extraction table 21.
- the event extraction table 21 has the following data fields: "Hardware/Software (HW/SW) Name,” "Keyword,” and "Extraction Rule.”
- HW/SW Hardware/Software
- Keyword Keyword
- Extraction Rule An extraction rule of message information is formed from a plurality of data items associated in the same row.
- the HW/SW name field gives the name of an element that causes an event.
- the keyword field contains a string that is used to determine which object caused the event in question.
- the extraction rule field describes how to extract a necessary error code from a given message.
- the message normalizer 24 can produce event records 31a and 32a from given messages 31 and 32 by consulting the event extraction table 21 described above. More specifically, the reception of messages 31 and 32 causes the message normalizer 24 to look into the keyword field of the event extraction table 21. It then scans the body of each message to find a keyword. When a keyword is found, the message normalizer 24 refers to the extraction rule field corresponding to that keyword. According to this extraction rule, the message normalizer 24 extracts an error code out of the event details field of the message.
- the message normalizer 24 Upon receipt of this message 31, the message normalizer 24 first fetches a keyword "Kernel" from the event extraction table 21. Since this keyword exists in the message 31, the message normalizer 24 then refers to the corresponding extraction rule field, which reads as follows: "Find a space after ']' and then extract text until ':' is reached.” According to this instruction, the message normalizer 24 extracts a text string "WARNING 999.”
- the message normalizer 24 now produces event records 31a and 32a containing an error code.
- Each event record 31a and 32a has the following data fields: "Serial No.,” “Time,” “Host Name,” “HW/SW Name,” and “Error Code.”
- the serial No. field, time field, and host name field contain what are found in the corresponding fields of the messages 31 and 32.
- the HW/SW name field and error code field are fetched from corresponding fields of the event extraction table 21 that are associated with a keyword that is found.
- the grouping unit 25 After normalization, the grouping unit 25 combines interrelated event records into a group. Specifically, the grouping unit 25 has configuration management data, a collection of predetermined definitions of relationships between target objects being monitored.
- FIG. 4 shows an example structure of this configuration management data, which represents target objects in a hierarchical fashion. Placed in the topmost layer are systems 51 and 52, which are followed by routers 53 and 54, servers 55 to 59 and a storage device 60, middleware programs 61 to 63, and application programs 64 to 66 in that order.
- the systems 51 and 52 are, for example, network systems of different customers. Associated with those systems 51 and 52 are routers 53 and 54, which receive and forward packets to enable access to the systems 51 and 52. Servers 55 to 59 deployed in the systems 51 and 52 are associated with the routers 53 and 54. Also associated with the router 54 is a storage device 60 in the system 52. Middleware programs 61 to 63 installed in the server 55 is associated with that server 55. Application programs 64 to 66, associated with the middleware program 61, are software applications managed by that program 61.
- the grouping unit 25 is given a dataset that defines associations between different target objects being monitored. This dataset permits the grouping unit 25 to identify interrelated event records. More specifically, the target objects are organized with their parent-child relationships defined in a tree structure. Based on this tree structure, the grouping unit 25 recognizes a particular set of produced event records as being interrelated.
- the configuration management data shown in FIG. 4 can also be used for suppressing events during a maintenance task. That is, when a target object is subjected to a maintenance task, it is necessary to control the occurrence of events related to that object under maintenance. It is further desirable that objects located below the target object of interest in the hierarchy should be controlled to prevent new events from being generated during that time.
- an upper-layer target object e.g., middleware
- its subordinate lower-layer object e.g., application
- the router 53 shown in FIG. 4 is under maintenance.
- Objects located below the router 53 include servers 55 to 57, middleware programs 61 to 63, and application programs 64 to 66, which may generate events during maintenance of the router 53. Event suppression thus takes place on those lower-layer structural components.
- the grouping unit 25 is designed to specify such components by consulting its local configuration management data, when a particular target object is subjected to maintenance actions. The grouping unit 25 also determines a suppression period and sends an event suppression request to the relevant target objects.
- the grouping unit 25 sorts event records into groups by using configuration management data to identify their relationships.
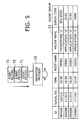
- FIG. 5 shows the concept of a process of grouping event records.
- the message normalizer 24 supplies the grouping unit 25 with a series of normalized event records 71 to 73 as FIG. 5 shows.
- the grouping unit 25 finds interrelated ones among the received event records, and then forms them into an event group 33.
- the event group 33 is assigned an identifier (ID) to uniquely identify each event group.
- the event group 33 contains detailed data items other than this ID, which are the same as its original event records.
- the produced event group 33 is passed to the matching unit 26.
- the matching unit 26 compares this event group 33 with pattern definition groups 22.
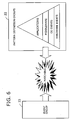
- FIG. 6 schematically shows a matching process.
- the pattern definition groups 22 include various combinations of hardware events, software events, and other events that would be produced by middleware programs and application programs. By comparing a given event group 33 with those pattern definition groups 22, the matching unit 26 identifies what problem has caused the event group 33.
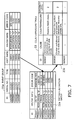
- FIG. 7 shows an example of event group matching and countermeasure record retrieval.
- the HW/SW name field and error code field of the event group 33a coincide with the counterparts of one pattern definition group 22a.
- This pattern definition group 22a has an ID of "PT0008.”
- the troubleshooting advisor 27 searches the countermeasure table 23 for a countermeasure record corresponding to this ID "PT0008.”
- the countermeasure table 23 has the following data fields: "ID,” “Cause,” “Countermeasure,” and "Urgency Level.” A plurality of data fields associated in the same row, forming a single data record.
- the ID field of this countermeasure record stores a unique identifier assigned to the record for identification purposes.
- the countermeasure record IDs and their corresponding pattern definition group IDs share the same value at their lower four digits. For example, pattern definition group "PT0008" is associated with countermeasure record "000008.”
- the cause field indicates the cause of a problem, which includes information about some target objects that could be involved in the problem (e.g., disks).
- the countermeasure field suggests what to do to solve the problem.
- the urgency level field indicates the importance of the problem. A problem having a larger value in this field requires more immediate action.
- the troubleshooting advisor 27 extracts a countermeasure record corresponding to the pattern definition group 22a.
- the current problem is caused by "Performance degradation due to aging of disk drives.”
- the suggested countermeasure is: "Replace RAID disks.” Also indicated is an urgency level of "2.”
- the matching unit 26 not only finds a pattern definition group that exactly coincides with a given event group, but may also extract similar pattern definition groups. If this is the case, the matching unit 26 puts some additional information to the extracted pattern definition table to record how many matches and mismatches are found. Specifically, the additional information includes a match count and a mismatch count.
- the term "match count” refers to the number of matching event records found.
- the terms “mismatch count” refers to the number of mismatched event records. The mismatch count will have a negative value in the case that some event records are missing in the pattern definition group being compared. The mismatch count will have a positive value in the case that there are some excessive event records in the pattern definition group.
- the troubleshooting advisor 27 sorts those records in an appropriate order according to their match count and mismatch count.
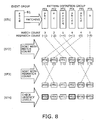
- FIG. 8 shows a procedure of sorting matching results, in which one event group 81 is compared with six different pattern definition groups. Their IDs are: PT1, PT2, PT3, PT4, PT5, and PT6.
- the matching unit 26 first compares the given event group 81 with each pattern definition group.
- the event group 81 includes event records “a,” “b,” “c,” and “d.”
- Pattern definition group “PT1” includes event records “a,” “b,” and “c.”
- Pattern definition group “PT2” includes event records “a” and “c.”
- Pattern definition group “PT3” includes five event record “a,” “x,” “y,” “x,” and “q.”
- Pattern definition group “PT4" includes event records “a,” “b,” “c,” “d,” and “y.”
- Pattern definition group “PT5" includes event records “a,” “b,” “c,” and “d.”
- Pattern definition group “PT6” includes one event record “b.”
- the troubleshooting advisor 27 first sorts the pattern definition groups in the descending order of match count.
- the sorted groups are in the following order: "PT4,” “PT5,” “PT1,” "PT2,” “PT3,” “PT6.”
- the troubleshooting advisor 27 retrieves a countermeasure record corresponding to each pattern definition group. It then looks into the urgency level field of the retrieved countermeasure records and marks those records having high urgency levels that exceed a predetermined threshold. The troubleshooting advisor 27 gives an emphasis to those marked countermeasure records when outputting them on a monitor screen. Suppose, for example, that pattern definition groups "PT2" and "PT5" are associated with countermeasures with high urgency levels. Then their corresponding countermeasure records will be highlighted.
- the troubleshooting advisor 27 displays the sorted countermeasure records, emphasizing some specified records. Emphasis can be achieved by using a special color that is distinguishable from others.
- FIG. 9 is a flowchart showing a process executed by a matching unit. This process includes the following steps:
- the operation management server 100 collects information about the events occurred in the system and uses them as event groups to identify the cause of a problem and provide countermeasures in an automated way.
- the accumulated pattern definition groups enable the operation management server to quickly discover a problem that is similar to what occurred in the past.
- the pattern database also provides the information about cause and countermeasure in association with each particular event pattern. This feature reduces the time required for troubleshooting.
- the operation management server centrally manages pattern definition groups and other data of many customers, thus helping the administrator to update them as necessary. With the pattern definition groups, a customer can locate their own problem by using other customers' similar experiences.
- the pattern definition groups may reflect policies of the operating organization, or include product support information supplied from software developers. The administrator registers those pattern definition groups with the operation management server to provide better server supervisory services.
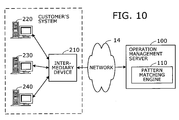
- FIG. 10 shows an example system configuration where problem detecting functions are provided.
- an operation management server 100 is linked to an intermediary device 210 via a network 14.
- Other devices linked to the intermediary device 210 are a plurality of servers 220, 230, and 240. Those servers 220, 230, and 240 and the intermediary device 210 belong to a customer's system.
- the operation management server 100 has a pattern matching engine 110. It is this pattern matching engine 110 that actually undertakes the tasks of collecting messages from the servers 220, 230, and 240, comparing them with pattern definition groups, and offering relevant countermeasure records.
- FIG. 11 shows an example hardware configuration of an operation management server used in an embodiment of the present invention.
- the illustrated operation management server 100 has a central processing unit (CPU) 101, which controls the entire server system, interacting with other elements via a common bus. Connected to this CPU 101 are: a random access memory (RAM) 102, a hard disk drive (HDD) 103, a graphics processor 104, an input device interface 105, and a communication interface 106.
- RAM random access memory
- HDD hard disk drive
- the RAM 102 serves as temporary storage for the whole or part of operating system (OS) programs and application programs that the CPU 101 executes, in addition to other various data objects manipulated at runtime.
- the HDD 103 stores program and data files of the operating system and various applications.
- the graphics processor 104 is coupled to a monitor 111.
- the graphics processor 104 produces video images in accordance with drawing commands from the CPU 101 and displays them on the screen of the monitor 111.
- the input device interface 105 is used to receive signals from external input devices, such as a keyboard 112 and a mouse 113. The input signals are supplied to the CPU 101 via the bus 107.
- the communication interface 106 is connected to the network 14 so as to exchange data with other computers on the network 14.
- FIG. 11 only shows an operation management server 100 for illustrative purposes, the same hardware configuration may also be applied to the intermediary device 210 and servers 220, 230, and 240.
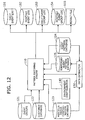
- FIG. 12 is a block diagram showing an internal structure of the operation management server.
- the operation management server 100 has the following components: a pattern matching engine 110, event groups 121, a customer database 122, a miscellaneous configuration database 123, an event pattern database 124, a temporary event pattern database 125, a data extractor 130, an environment configurator 140, a daily event log 151, a monthly event log 152, a daily event group log 153, a monthly event group log 154, and a result file 155.
- the pattern matching engine 110 controls the entire pattern matching process in cooperation with other functions.
- the event groups 121 are formed from messages sent from servers 220, 230, and 240.
- the customer database 122 stores information about customers.
- the miscellaneous configuration database 123 stores information about each customer's system configuration (in both hardware and software).
- the event pattern database 124 is a database of event patterns concerning various problems that could happen in a supported system. Event patterns include pattern definition groups and countermeasure records.
- the temporary event pattern database 125 stores event patterns extracted from the event pattern database 124 according to each customer's system configuration.
- the data extractor 130 builds this temporary event pattern database 125 based on the event pattern database 124 by extracting event patterns relating to the system of a particular customer being served.
- the daily event log 151 is a storage space used to keep a record of event pattern identifiers, matching results, and other data objects concerning problems that happened within a day.
- the monthly event log 152 is a storage space used to keep a record of event pattern identifiers, matching results, and other data objects concerning problems that happened within a month.
- the daily event group log 153 is storage space used to store event groups produced within a day.
- the monthly event group log 154 is storage space used to store event groups produced within a month.
- the result file 155 contains a list of countermeasure records retrieved with respect to a particular event group.
- the miscellaneous configuration database 123 contains hardware configuration data, software configuration data, network configuration data, and system configuration data. Each configuration data has a key data field that enables linking with other data.
- FIG. 13 shows an example data structure of hardware configuration data.
- the hardware configuration data 123a has the following data fields: "Equipment ID,” “System Name,” “Host Name,” “Product Name,” “Number of CPUs,” “Memory Capacity,” “Disk Capacity,” and “Number of LANs.”
- the equipment ID field shows the identifier of a computer operating as a server. This equipment ID is a code assigned in such a way that it will not be influenced by the length of the host name within the system.
- the system name field indicates the name of a system (or the type of a service) for which the server is working.
- the host name field shows a name assigned to the server for use in the network, or for management purposes.
- the product name field contains the product name of a computer platform of the server.
- the number-of-CPUs field indicates the number of CPUs mounted on the server.
- the memory capacity field shows the capacity of main memory on the server.
- the disk capacity field shows the storage capacity of hard disk units connected to the server.
- the number-of-LANs field indicates the number of network interface cards mounted on the server.
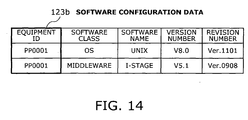
- FIG. 14 shows an example data structure, of software configuration data.
- This software configuration data 123b has the following data fields: "Equipment ID,” "Software Class,” “Software Name,” “Version Number,” and "Revision Number.”
- the equipment ID field exists also in the foregoing hardware configuration data 123a, which serves as a key field that establish associations between other data items in various configuration datasets.
- the software class field shows the category (e.g., OS, middleware, application, etc.) of a software program of interest.
- the software name field contains the name of that program.
- the version number field contains the version of the program.
- the revision number field shows the version of bug corrections (software patch) applied to the program.
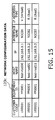
- FIG. 15 shows an example data structure of network configuration data.
- This network configuration data 123c has the following data fields: "Customer Code,” “Equipment ID,” “Host Name,” “IP,” “Interface Name,” and "IP Address Type.”
- the customer code field gives an identifier indicating which customer is operating the system.
- the equipment ID field exists also in the hardware configuration data 123a and software configuration data 123b, which serves as a key field that establishes associations between other data items in those datasets.
- the host name field contains the same item as that in the hardware configuration data 123a.
- the IP field shows the IP address assigned to the system.
- the interface name field shows an identification code that is assigned to each network interface card in a device.
- the IP address type field shows the type of IP address, which is either "V” or "R.”
- V is a short form of “virtual,” standing for a virtual IP address.
- “R” is “Real,” standing for a real IP address.
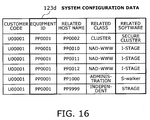
- FIG. 16 shows an example data structure of system configuration data.
- This system configuration data 123d has the following data fields: "Customer Code,” “Equipment ID,” “Related Host Name,” “Related Class,” and “Related Software.”
- the customer code field contains the same value as what the network configuration data 123c has in its customer code field.
- the equipment ID field contains the same value as what the hardware configuration data 123a, software configuration data 123b, and network configuration data 123c have in their respective equipment ID fields.
- the related host name field contains the equipment ID of a relating computer. When this field has a value of "PP9999,” it means that that there is no relation to other equipment.
- the operation management server 100 performs various tasks described below.
- FIG. 17 is a flowchart of a message grouping process. This process includes the following steps:
- FIG. 18 shows an example process of grouping events.
- a message of "Event#11” is entered. This leads to the creation of a new event group 411 containing that event record. Afterwards, a message “Event#21” comes, and another event group 421 including that event record is produced accordingly. In a similar way, a subsequent message "Event#31” causes yet another event group 431 containing that event record to be produced.
- Event#12 relating to "Event#11”
- This new event record is added to the event group 411, which makes it grow to an event group 412 consisting of two event records.
- a message “Event#13” then arrives.
- the event record of this "Event#13” is added to the event group 412, which makes it grow to an event group 413 consisting of three event records.
- the operation management server 100 builds some other databases for internal use, based on the event records sorted into groups in the way described above.
- FIG. 19 shows an example data structure of event groups.
- the illustrated event groups 121 have the following data fields: "Event Group ID,” “Group Member Serial Number,” “Event ID,” “Customer ID,” “Equipment ID,” “Interface Name,” “Occurrence Time,” “Source Class,” “Source Short Name,” “Filtering,” and “Message.”
- the event group ID field contains an identifier that is assigned to each event group.
- the group member serial number field shows a serial number that is given to each member of the same event group. Note that one event record constitutes one entry of an event group.
- the event ID field shows an identifier that is assigned to each event.
- the customer ID field shows the identifier of a customer who operates the system that has generated the event.
- the equipment ID field shows the identifier of a server that has generated the event.
- the interface name field shows the identifier of a network interface that sent the message carrying the present event record.
- the occurrence time field shows when the message arrived at the operation management server 100.
- the source class field shows which target object produced the event.
- the source short name field shows an abbreviated name of the source target object.
- the filtering field indicates whether to apply filtering.
- the message field shows the content of the event record message.
- FIG. 19 has illustrated a data structure of an event group 121, the same or similar data structure is also applied to the daily event group log 153 and monthly event group log 154.
- FIG. 20 shows an example data structure of a customer database.
- the illustrated customer database 122 has the following data fields: "Customer ID,” “Customer Name,” “Contact Person,” and "Contact Information.”
- the customer ID field shows the identifier of a customer.
- the customer name field shows the name of that customer.
- the contact person field shows the name of a person through whom the customer can be reached.
- the contact information field shows the customer's contact information such as phone numbers.
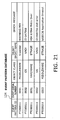
- FIG. 21 shows an example data structure of an event pattern database.
- the illustrated event pattern database 124 has the following data fields: "Event Pattern ID,” “Event Serial Number,” “Object Class,” “Object Short Name,” and “Error Message.”
- the event pattern ID field contains a unique identification code managed by this event pattern database.
- the event serial number field shows a reference number that is assigned to each member event record belonging to the same event pattern.
- the object class field shows the category to which the target object belongs.
- the error message field provides the content of the produced event.
- FIG. 21 illustrates an example data structure of the event pattern database 124
- the same or similar data structure is also applied to the temporary event pattern database 125.
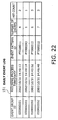
- FIG. 22 shows an example data structure of a daily event log.
- the illustrated daily event log 151 has the following data fields: "Event Group ID,” “Matching Process Timestamp,” “Event Pattern ID,” “Number of Events,” and “Hit Count.”
- the event group ID field contains the identification code of an event group.
- the matching process timestamp field indicates when the pattern matching engine 110 executed a pattern matching process.
- the event pattern ID field shows the identifier of an event pattern extracted in the pattern matching process.
- the number-of-events field shows the number of event records in the event pattern specified by the event pattern ID field.
- the hit count field stores the number of event records, of all those records having the same event pattern ID, that can also be found in the event group compared.
- the weight of an event pattern can be calculated from the number of events and hit count shown in this daily event log 151. For example, a greater weight (meaning a greater importance) is given to an event pattern with a larger hit count. Such weights may be calculated previously and registered with the daily event log 151.
- FIG. 23 shows an example data structure of a daily event group log.
- the illustrated daily event group log 153 has the following data fields: "Event Group ID,” “Event Serial Number,” “Event ID,” “Customer ID,” “Equipment ID,” “Occurrence Time,” “Event Type,” “Error Number/Message,” “Event Pattern ID,” “Number of Duplicate Event IDs”, and “Matching Result.”
- the event group ID field contains the identifier of an event group.
- the event serial number field shows a serial number that is assigned to each event produced.
- the event ID field contains the identifier of each event record.
- the customer ID field shows the identifier of a customer who operates the system that generated the event.
- the equipment ID field shows the identifier of a server that generated the event.
- the time field indicates when the event occurred, and the event type field shows what kind of event it was (e.g., error, warning).
- the error number/message field gives an identifier representing the content of the event.
- the event pattern ID field contains the identifier of an event pattern that is chosen as being relevant to the event group.
- the "number of duplicate event IDs" field gives the number of event patterns that are detected.
- the matching result field shows the specifics of a countermeasure record corresponding to the detected event pattern.
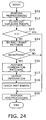
- FIG. 24 is a flowchart of a pattern matching process. This process includes the following steps:
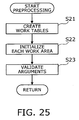
- FIG. 25 is a flowchart showing the details of preprocessing. This process includes the following steps:
- the duplicate event filtering process includes the following steps:
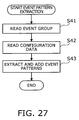
- the event pattern extraction process includes the following steps:
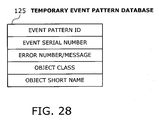
- FIG. 28 shows an example data structure of a temporary event pattern database.
- the temporary event pattern database 125 has, among others, the following data fields: "Event Pattern ID,” “Event Serial Number,” “Number of Messages in Pattern,” “Object Type,” and “Object Short Name.”
- the event pattern ID field shows the identification code of an event pattern.
- the event serial number field gives a serial number assigned to that event pattern.
- the error number/message field gives identifier that represents the content of the problem.
- the object type field shows the category to which the target object belongs.
- the object short name field shows an abbreviated name of the target object.
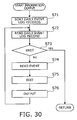
- the combination matching process includes the following steps:
- the process of outputting information includes the following steps:
- the process of checking past events includes the following steps:
- the postprocessing sequence includes the following steps:
- FIG. 33 shows a flow of information.
- a given event group 121 includes four event records with IDs of "a,” “b,” “c,” and "d.
- the temporary event pattern database 125 stores a plurality of event patterns. Those event patterns are referred to by their event pattern IDs of "A,” “B,” “C,” “D,” and so on. Event pattern “A” consists of event records “a,” “b,” “c,” and others. Event pattern “B” consists of event records “a,” “c,” and others. Event pattern “C” consists of event records “a,” “e,” and others. Event pattern “D” consists of event records “b,” “c,” and others.
- a pattern matching process takes place with the above event group 121 and event patterns stored in the temporary event pattern database 125, thus yielding a combination match result 91 shown in FIG. 33.
- FIG. 33 only shows matching results for combinations of two event records.
- event pattern "A” is extracted as a matching event pattern for a combination of event records "a” and “b.”
- Event patterns "A” and “B” are extracted as matching event patterns for a combination of event records “a” and “c.”
- Event pattern “C” is extracted as a matching event pattern for a combination of event records “a” and “d.”
- Event pattern “D” is extracted as a matching event pattern for a combination of event records "b” and “c.” No event pattern is extracted, however, for a combination of event records "b” and “d,” nor for a combination of event records "c” and “d.”
- a daily event log 151 is produced. Associated with event record “a” are event pattern IDs “A,” “A,” “B,” and “C”. Likewise, event record “b” is associated with event pattern IDs “A” and “D”. Event record “c” is associated with event pattern IDs “A,” “B,” and “D”. Event record “d” is associated only with an event pattern ID “C.”
- the daily event log 151 is used to produce a result file 155.
- the result file 155 in the example of FIG. 33 gives a list of event patterns arranged together with their respective hit counts in the descending order of likeliness of being a cause of the problem.
- event pattern "A” has a hit count of "4.”
- Event pattern “B” has a hit count of "2,” and so do the remaining event patterns "C” and "D.”
- hit counts it may also be configured to show match ratios.
- the operation management server 100 extracts one or more highly probable causes of an event by combining interrelated event records into an event group 121 and comparing them with event patterns.
- Its pattern matching engine 110 provides the administrator with a result file for tips about possible causes of a problem and their countermeasures.
- the operation management server 100 collects event messages directly from the system and automatically sorts event records into groups for analysis.
- the operation management server 100 it is also possible for the operation management server 100 to analyze a specified set of event records. In this case, one can specify an event group by selecting desired records through, for example, an event group search screen.
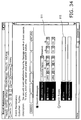
- FIG. 34 shows an example of an event group search screen.
- This event group search screen 510 permits the user to create a desired event group for the purpose of matching, by retrieving past log records from a database that contains past event group log records collected within a predetermined period.
- the illustrated event group search screen 510 has a message search condition entry section 511 and an event search condition entry section 512.
- the message search condition entry section 511 accepts entry of a customer name and a period as search conditions. Specifying a customer name means specifying a particular system that produced messages containing event records. The operation management server 100 retrieves event groups matching with what is entered to the message search condition entry section 511.
- the event search condition entry section 512 includes input boxes for specifying a cause and a countermeasure. Each input box has a check box. The entered text is enabled as a search keyword when the corresponding check box is selected.
- the operation management server 100 searches event group log records, based on what is entered to the event search condition entry section 512.
- the event group search screen 510 enables an event group to be retrieved and presented on a display screen. For pattern matching, the user is allowed choose a particular event record from among those belonging to the retrieved event group. The selected event record is subjected to an analysis to find the cause of a problem and its countermeasure.
- FIG. 35 shows an example of an event selection screen.
- the event selection screen 520 shows a list of event records belonging to an event group log record extracted through a search or the like. The user chooses a part 521 of the event record list.
- the selected event records can be treated as a single event group to analyze the cause of a problem.
- the event group specified in this way is analyzed through a series of processes, the outcome of which is output as a result file 155 and displayed on an analysis result screen.
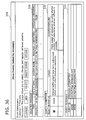
- FIG. 36 shows an example of an analysis result screen.
- This analysis result screen 530 has a selected message section 531, a search condition section 532, and an event message section 533.
- the selected message section 531 shows the specifics of event records of the selected event group.
- the search condition section 532 gives a list of causes and countermeasures suggested by the relevant event patterns.
- the event message section 533 shows the content of event records defined in an event pattern.
- problems are investigated on the basis of error events that servers would produce.
- operator commands can also be a source of information for analyzing a problem.
- the alternative approach is to locate a problem from inputs which could cause that problem, whereas the foregoing embodiments try to locate a problem from events resulting from the problem source.
- some users experience a conflict between two programs depending on their computer environments; that is, some active application process can hamper another process, which can normally be executed independently. In such cases, a history of commands issued for those processes would enable the operation management server to automatically isolate the problem.
- a database denies access from outside when it is in the process of data backup.
- conventional systems produce a database access error.
- the user is unable to know the reason for their inability to make access to the database.
- the system can be designed to collect pattern definition groups of command sets for later pattern matching. Each group contains a plurality of commands that cannot be executed concurrently, and when such a command set is entered by a user, the system will search the collected command set patterns and provide the user with the information about the problem, including its cause and countermeasure. For example, the system may suggest him/her stopping an application that causes a problem.
- the above-described processing mechanism can be implemented on a platform similar to what has been described in FIG. 11. Servers or other terminal stations, however, have to be configured to send messages to the operation management server 100 to show what instructions users have entered.
- the operation management server 100 stores, those messages in a history table.
- the operation management server 100 has an operation pattern database to store various operation patterns that would lead to a problem.
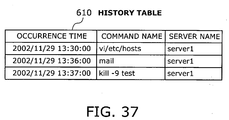
- FIG. 37 shows an example data structure of a history table.
- This history table 610 has the following data fields: "Occurrence Time,” "Command Name,” and "Server Name.”
- the occurrence time field shows when the operation management server 100 received a message delivering a record of operator input.
- the command name field shows a command that was actually issued.
- the server name field shows the name of a server that transmitted the message. What are entered to the history table 610 are records of operator input during a predetermined time period (e.g., ten minutes from 1:30 p.m.).
- FIG. 38 shows an example data structure of an operation pattern database.
- This operation pattern database 620 has the following data fields: "Operation Pattern Code,” “Operation Pattern,” “Symptom,” “Cause,” and “Countermeasure.”
- the operation pattern code field gives an identification code assigned to each operation pattern.
- the operation pattern field shows a set of commands that could cause a problem.
- the symptom field shows how the problem would appear, and the cause field shows the cause of that problem.
- the countermeasure field tells what action to be taken to circumvent the problem.
- the records indicate that a user invoked an editor program with a "vi” command, edited a "hosts” file, and then started a mailer program with a "mail" command. Suppose that this sequence of operator commands has brought an error. The user then receives an analysis report from the operation management server 100 concerning the error.
- the above sequence of operator commands matches with the operation pattern with a code of "s00000002" stored in the operation pattern database 620. Accordingly, the operation management server 100 retrieves this operation pattern record and sends a message to the user's terminal station, so that the information in the "Symptom,” “Cause,” and “Countermeasure” fields will be displayed. The user then checks what is actually happening, and if it is exactly what the message says, then he/she understands that the current situation is known as the operation pattern code "s00000002." The suggested cause and countermeasure will help the user to solve his/her problem.
- the above-described processing functions are implemented on a computer system. Instructions describing the functions of an operation management server are encoded and provided in the form of computer programs. The computer system executes those programs to provide the intended processing functions.
- the programs can be stored in a computer-readable storage medium.
- Such storage media include magnetic storage devices, optical discs, magneto-optical storage media, and solid state memory devices.
- Magnetic storage devices include hard disk drives (HDD), flexible disks (FD), and magnetic tapes.
- Optical discs include digital versatile discs (DVD), DVD-Random access memory (DVD-RAM), compact disc read-only memory (CD-ROM), CD-Recordable (CD-R), and CD-Rewritable (CD-RW).
- Magneto-optical storage media include magneto-optical discs (MO).
- Portable storage media such as DVD and CD-ROM, are suitable for distribution of program products.
- Network-based distribution of software programs is also possible, in which master program files are made available in a server computer for downloading to other computers via a network.
- a user computer stores necessary programs in its local storage unit, which have previously been installed from a portable storage media or downloaded from a server computer.
- the computer executes the programs read out of the local storage unit, thereby performing the programmed functions.
- the computer may execute programs, reading out program codes directly from a portable storage medium.
- Another alternative method is that the user computer dynamically downloads programs from a server computer when they are demanded and executes them upon delivery.
- the operation management server is designed to collect event records from target objects in other servers being monitored, and sorts them into groups.
- the resulting event group is compared with pattern definition groups to find a matching pattern definition group, and a countermeasure record corresponding to that group is extracted.
- the proposed feature of the invention makes it easy to identify a target object that is causing a problem.
Landscapes
- Engineering & Computer Science (AREA)
- Theoretical Computer Science (AREA)
- General Engineering & Computer Science (AREA)
- Quality & Reliability (AREA)
- Physics & Mathematics (AREA)
- General Physics & Mathematics (AREA)
- Computer Networks & Wireless Communication (AREA)
- Signal Processing (AREA)
- Computer Hardware Design (AREA)
- Health & Medical Sciences (AREA)
- Biomedical Technology (AREA)
- Environmental & Geological Engineering (AREA)
- Debugging And Monitoring (AREA)
- Test And Diagnosis Of Digital Computers (AREA)
- Computer And Data Communications (AREA)
Abstract
Description
Claims (17)
- An operation management method for managing a server, comprising the steps of:collecting event records from a plurality of target objects being monitored, the target objects being a plurality of functions executed on the server;producing an event group by grouping the collected event records;comparing the event group with a plurality of pattern definition groups in terms of occurrence patterns of event records, the pattern definition groups each defining a pattern of event records that would be produced by the target objects upon occurrence, of a particular problem; andextracting a troubleshooting record that has previously been associated with the pattern definition group resembling the event group in terms of occurrence patterns of event records, the troubleshooting record indicating which target object is considered a source of a problem.
- The operation management method according to claim 1, wherein the event records are collected from a plurality of servers.
- The operation management method according to claim 1, wherein the collected event records have different formats depending of the target objects, and said record collecting step further converts the different formats of the collected event records into a unified data format.
- The operation management method according to claim 1, wherein said event group producing step combines event records produced from interrelated target objects by consulting a database that defines relationships between the plurality of target objects.
- The operation management method according to claim 1, wherein said event group producing step combines event records collected in a predetermined period.
- The operation management method according to claim 1, wherein said comparing step finds event records that are common to the event group and one of the pattern definition groups.
- The operation management method according to claim 1, wherein said extracting step further sorts two or more of the troubleshooting records according to similarity of the corresponding pattern definition groups to the event group in terms of occurrence patterns of event records.
- The operation management method according to claim 7, wherein the pattern definition group is considered to have a higher similarity when the pattern definition group has a larger number of event records that are common to those in the event group.
- The operation management method according to claim 7, wherein the pattern definition group is considered to have a higher similarity when the number of event records that belong only to either the event group or the pattern definition group is smaller.
- The operation management method according to claim 1, wherein the troubleshooting record includes information about the cause of the problem, as well as countermeasure information that suggests how to solve the problem.
- An operation management method for managing a server, comprising the steps of:collecting records of commands entered to the server;producing an operation log by grouping the collected command records;comparing the operation log with a plurality of operation patterns in terms of input patterns of commands, the operation patterns each defining a command input pattern that could lead to a problem; andextracting a troubleshooting record that has previously been associated with the operation pattern resembling the operation log in terms of input patterns of commands, the troubleshooting record indicating which target object is considered a source of a problem.
- An operation management device for managing a server, comprising:collecting means for collecting event records from a plurality of target objects being monitored, the target objects being a plurality of functions executed on the server;producing means for producing an event group by grouping the collected event records;comparing means for comparing the event group with a plurality of pattern definition groups in terms of occurrence patterns of event records, the pattern definition groups each defining a pattern of event records that would be produced by the target objects upon occurrence of a particular problem; andextracting means for extracting a troubleshooting record that has previously been associated with the pattern definition group resembling the event group in terms of occurrence patterns of event records, the troubleshooting record indicating which target object is considered a source of a problem.
- An operation management device for managing a server, comprising:collecting means for collecting records of commands entered to the server;producing means for producing an operation log by grouping the collected command records;comparing means for comparing the operation log with a plurality of operation patterns in terms of input patterns of commands, the operation patterns each defining a command input pattern that could lead to a problem; andextracting means for extracting a troubleshooting record that has previously been associated with the operation pattern resembling the operation log in terms of input patterns of commands, the troubleshooting record indicating which target object is considered a source of a problem.
- An operation management program for managing a server, the program causing a computer to perform the steps of:collecting event records from a plurality of target objects being monitored, the target objects being a plurality of functions executed on the server;producing an event group by grouping the collected event records;comparing the event group with a plurality of pattern definition groups in terms of occurrence patterns of event records, the pattern definition groups each defining a pattern of event records that would be produced by the target objects upon occurrence of a particular problem; andextracting a troubleshooting record that has previously been associated with the pattern definition group resembling the event group in terms of occurrence patterns of event records, the troubleshooting record indicating which target object is considered a source of a problem.
- An operation management program for managing a server, the program causing a computer to perform the steps of:collecting records of commands entered to the server;producing an operation log by grouping the collected command records;comparing the operation log with a plurality of operation patterns in terms of input patterns of commands, the operation patterns each defining a command input pattern that could lead to a problem; andextracting a troubleshooting record that has previously been associated with the operation pattern resembling the operation log in terms of input patterns of commands, the troubleshooting record indicating which target object is considered a source of a problem.
- A computer-readable storage medium storing an operation management program for managing a server, the program causing a computer to perform the steps of:collecting event records from a plurality of target objects being monitored, the target objects being a plurality of functions executed on the server;producing an event group by grouping the collected event records;comparing the event group with a plurality of pattern definition groups in terms of occurrence patterns of event records, the pattern definition groups each defining a pattern of event records that would be produced by the target objects upon occurrence of a particular problem; andextracting a troubleshooting record that has previously been associated with the pattern definition group resembling the event group in terms of occurrence patterns of event records, the troubleshooting record indicating which target object is considered a source of a problem.
- A computer-readable storage medium storing an operation management program for managing a server, the program causing a computer to perform the steps of:collecting records of commands entered to the server;producing an operation log by grouping the collected command records;comparing the operation log with a plurality of operation patterns in terms of input patterns of commands, the operation patterns each defining a command input pattern that could lead to a problem; andextracting a troubleshooting record that has previously been associated with the operation pattern resembling the operation log in terms of input patterns of commands, the troubleshooting record indicating which target object is considered a source of a problem.
Applications Claiming Priority (1)
| Application Number | Priority Date | Filing Date | Title |
|---|---|---|---|
| PCT/JP2002/013719 WO2004061681A1 (en) | 2002-12-26 | 2002-12-26 | Operation managing method and operation managing server |
Publications (2)
| Publication Number | Publication Date |
|---|---|
| EP1577783A1 true EP1577783A1 (en) | 2005-09-21 |
| EP1577783A4 EP1577783A4 (en) | 2008-04-16 |
Family
ID=32697322
Family Applications (1)
| Application Number | Title | Priority Date | Filing Date |
|---|---|---|---|
| EP02793425A Withdrawn EP1577783A4 (en) | 2002-12-26 | 2002-12-26 | OPERATING MANAGEMENT METHOD AND OPERATING MANAGEMENT SERVER |
Country Status (6)
| Country | Link |
|---|---|
| US (1) | US7506195B2 (en) |
| EP (1) | EP1577783A4 (en) |
| JP (1) | JP4318643B2 (en) |
| CN (1) | CN1650274A (en) |
| AU (1) | AU2002359925B2 (en) |
| WO (1) | WO2004061681A1 (en) |
Cited By (7)
| Publication number | Priority date | Publication date | Assignee | Title |
|---|---|---|---|---|
| US7373552B2 (en) | 2004-09-30 | 2008-05-13 | Siemens Aktiengesellschaft | Model based diagnosis and repair for event logs |
| EP2933726A1 (en) * | 2014-04-15 | 2015-10-21 | LSIS Co., Ltd. | Apparatus, system and method for application log data processing |
| RU2574205C2 (en) * | 2009-07-20 | 2016-02-10 | Моторола Мобилити, Инк. | Multi-environment operating system |
| US9342325B2 (en) | 2012-05-17 | 2016-05-17 | Google Technology Holdings LLC | Synchronizing launch-configuration information between first and second application environments that are operable on a multi-modal device |
| US9389877B2 (en) | 2009-07-20 | 2016-07-12 | Google Technology Holdings LLC | Multi-environment operating system |
| WO2018137765A1 (en) * | 2017-01-26 | 2018-08-02 | Telefonaktiebolaget Lm Ericsson (Publ) | System and method for analyzing network performance data |
| US11087638B2 (en) | 2017-01-26 | 2021-08-10 | Telefonaktiebolaget Lm Ericsson (Publ) | System and method for analysing sports performance data |
Families Citing this family (180)
| Publication number | Priority date | Publication date | Assignee | Title |
|---|---|---|---|---|
| US7162036B2 (en) * | 2001-08-06 | 2007-01-09 | Igt | Digital identification of unique game characteristics |
| US20060036874A1 (en) * | 2001-08-08 | 2006-02-16 | Igt | Data pattern verification in a gaming machine environment |
| DE10156156B4 (en) | 2001-11-15 | 2005-04-21 | 3M Espe Ag | Process for the production of dentures |
| US7743420B2 (en) * | 2003-12-02 | 2010-06-22 | Imperva, Inc. | Dynamic learning method and adaptive normal behavior profile (NBP) architecture for providing fast protection of enterprise applications |
| US7673037B2 (en) * | 2004-02-13 | 2010-03-02 | Net2Phone | Cable telephony monitoring system |
| US7343529B1 (en) | 2004-04-30 | 2008-03-11 | Network Appliance, Inc. | Automatic error and corrective action reporting system for a network storage appliance |
| US9489645B2 (en) * | 2004-05-13 | 2016-11-08 | International Business Machines Corporation | Workflow decision management with derived scenarios and workflow tolerances |
| JP4746850B2 (en) * | 2004-06-21 | 2011-08-10 | 富士通株式会社 | Pattern generation program |
| JP2006040222A (en) | 2004-07-30 | 2006-02-09 | Fujitsu Ltd | Message display method and message display device |
| CN100349158C (en) * | 2004-08-12 | 2007-11-14 | 华为技术有限公司 | Method and system for extracting failure mode from doubtful data |
| JP4643204B2 (en) * | 2004-08-25 | 2011-03-02 | 株式会社エヌ・ティ・ティ・ドコモ | Server device |
| US20060085690A1 (en) * | 2004-10-15 | 2006-04-20 | Dell Products L.P. | Method to chain events in a system event log |
| US20060123108A1 (en) * | 2004-12-08 | 2006-06-08 | Parthasarathy Sarangam | Embedding a unique identifier in asset information to identify the source of an event |
| JP4613598B2 (en) * | 2004-12-10 | 2011-01-19 | 株式会社日立製作所 | Disk system |
| US20060155848A1 (en) * | 2005-01-10 | 2006-07-13 | Brown William A | Workflow decision management including identifying user reaction to workflows |
| US20060156276A1 (en) * | 2005-01-10 | 2006-07-13 | Brown William A | Workflow decision management with heuristics |
| JP4652090B2 (en) * | 2005-03-15 | 2011-03-16 | 富士通株式会社 | Event notification management program, event notification management apparatus, and event notification management method |
| CN100433642C (en) * | 2005-03-15 | 2008-11-12 | 华为技术有限公司 | A method and system for fault location and troubleshooting |
| JP4506520B2 (en) * | 2005-03-16 | 2010-07-21 | 日本電気株式会社 | Management server, message extraction method, and program |
| US20060235655A1 (en) * | 2005-04-18 | 2006-10-19 | Qing Richard X | Method for monitoring function execution |
| JP2006350654A (en) * | 2005-06-15 | 2006-12-28 | Yaskawa Information Systems Co Ltd | Server computer |
| CN100479575C (en) * | 2005-06-30 | 2009-04-15 | 华为技术有限公司 | Method and apparatus for realizing scheduled operation in equipment management |
| US7937344B2 (en) | 2005-07-25 | 2011-05-03 | Splunk Inc. | Machine data web |
| US7865461B1 (en) * | 2005-08-30 | 2011-01-04 | At&T Intellectual Property Ii, L.P. | System and method for cleansing enterprise data |
| US7934116B2 (en) * | 2005-09-30 | 2011-04-26 | Lockheed Martin Corporation | Disaster recover/continuity of business adaptive solution framework |
| US20070100884A1 (en) * | 2005-11-01 | 2007-05-03 | Brown William A | Workflow decision management with message logging |
| US20070100990A1 (en) * | 2005-11-01 | 2007-05-03 | Brown William A | Workflow decision management with workflow administration capacities |
| US8010700B2 (en) * | 2005-11-01 | 2011-08-30 | International Business Machines Corporation | Workflow decision management with workflow modification in dependence upon user reactions |
| US8155119B2 (en) * | 2005-11-01 | 2012-04-10 | International Business Machines Corporation | Intermediate message invalidation |
| JP4774929B2 (en) * | 2005-11-07 | 2011-09-21 | 富士通株式会社 | Monitoring device, monitoring system |
| CN100407656C (en) * | 2005-12-09 | 2008-07-30 | 华为技术有限公司 | Method and system for managing terminal equipment |
| JP2007172131A (en) * | 2005-12-20 | 2007-07-05 | Nec Fielding Ltd | Failure prediction system, failure prediction method and failure prediction program |
| US7698597B2 (en) * | 2006-02-28 | 2010-04-13 | International Business Machines Corporation | Method of isolating erroneous software program components |
| US7437359B2 (en) * | 2006-04-05 | 2008-10-14 | Arcsight, Inc. | Merging multiple log entries in accordance with merge properties and mapping properties |
| US8635596B2 (en) * | 2006-04-21 | 2014-01-21 | Microsoft Corporation | Model-based event processing |
| US20070294590A1 (en) * | 2006-05-16 | 2007-12-20 | Texas Instruments Incorporated | Compression scheme to reduce the bandwidth requirements for continuous trace stream encoding of system performance |
| CN100454272C (en) * | 2006-05-30 | 2009-01-21 | 上海科泰世纪科技有限公司 | Method for processing error information with software component |
| CN101131747B (en) * | 2006-08-22 | 2012-02-01 | 国际商业机器公司 | Method, device and system for catching and/or analyzing Web page events at client terminal |
| JP2008060713A (en) * | 2006-08-29 | 2008-03-13 | Fuji Xerox Co Ltd | Information processing apparatus and program |
| US8117461B2 (en) | 2006-09-13 | 2012-02-14 | Igt | Method of randomly and dynamically checking configuration integrity of a gaming system |
| KR101380936B1 (en) | 2006-10-05 | 2014-04-10 | 스플렁크 인코퍼레이티드 | Time series search engine |
| JP4585534B2 (en) * | 2007-03-01 | 2010-11-24 | 富士通株式会社 | System monitoring program, system monitoring method, and system monitoring apparatus |
| JP5299272B2 (en) * | 2007-04-12 | 2013-09-25 | 富士通株式会社 | Analysis program and analyzer |
| US8205215B2 (en) * | 2007-05-04 | 2012-06-19 | Microsoft Corporation | Automated event correlation |
| US8095819B2 (en) | 2007-06-06 | 2012-01-10 | Nec Corporation | Communication network failure cause analysis system, failure cause analysis method, and failure cause analysis program |
| JP4367962B2 (en) * | 2007-06-19 | 2009-11-18 | インターナショナル・ビジネス・マシーンズ・コーポレーション | Technology for detecting patterns of events that occur in information systems |
| JP4400834B2 (en) * | 2007-06-20 | 2010-01-20 | インターナショナル・ビジネス・マシーンズ・コーポレーション | Technology for detecting patterns of events that occur in information systems |
| US8316380B2 (en) * | 2007-09-21 | 2012-11-20 | Sap Ag | Process log supporting multiple flavors of processes |
| CN102067518A (en) * | 2007-11-21 | 2011-05-18 | 阿尔卡特朗讯 | System and method for invoking functions of services in response to events and service management system using same |
| JP2009217455A (en) * | 2008-03-10 | 2009-09-24 | Fujitsu Ltd | Information processor, information processing program, and method |
| US8219582B2 (en) | 2008-04-25 | 2012-07-10 | International Business Machines Corporation | System, method, and computer readable media for identifying a user-initiated log file record in a log file |
| US8090994B2 (en) * | 2008-05-21 | 2012-01-03 | International Business Machines Corporation | System, method, and computer readable media for identifying a log file record in a log file |
| JP5198159B2 (en) * | 2008-06-13 | 2013-05-15 | 株式会社日立製作所 | Client terminal management system |
| US8112378B2 (en) * | 2008-06-17 | 2012-02-07 | Hitachi, Ltd. | Methods and systems for performing root cause analysis |
| JP4753193B2 (en) * | 2008-07-31 | 2011-08-24 | 九州日本電気ソフトウェア株式会社 | Flow line management system and program |
| JP2010049551A (en) * | 2008-08-22 | 2010-03-04 | Toshiba Corp | Failure monitoring apparatus and failure monitoring method |
| JP5258040B2 (en) * | 2008-10-30 | 2013-08-07 | インターナショナル・ビジネス・マシーンズ・コーポレーション | Apparatus for supporting detection of failure event, method for supporting detection of failure event, and computer program |
| JP5220556B2 (en) * | 2008-10-30 | 2013-06-26 | インターナショナル・ビジネス・マシーンズ・コーポレーション | Apparatus for supporting detection of failure event, method for supporting detection of failure event, and computer program |
| JP5220555B2 (en) * | 2008-10-30 | 2013-06-26 | インターナショナル・ビジネス・マシーンズ・コーポレーション | Apparatus for supporting detection of failure event, method for supporting detection of failure event, and computer program |
| US7992055B1 (en) * | 2008-11-07 | 2011-08-02 | Netapp, Inc. | System and method for providing autosupport for a security system |
| WO2010061735A1 (en) * | 2008-11-27 | 2010-06-03 | インターナショナル・ビジネス・マシーンズ・コーポレーション | System for assisting with execution of actions in response to detected events, method for assisting with execution of actions in response to detected events, assisting device, and computer program |
| JP5527503B2 (en) * | 2009-02-13 | 2014-06-18 | 富士ゼロックス株式会社 | Monitoring device, information processing system, and program |
| JP5434155B2 (en) * | 2009-03-10 | 2014-03-05 | 日本電気株式会社 | Information processing system, message management method, and message management program |
| US8429453B2 (en) | 2009-07-16 | 2013-04-23 | Hitachi, Ltd. | Management system for outputting information denoting recovery method corresponding to root cause of failure |
| US20110047181A1 (en) * | 2009-08-18 | 2011-02-24 | Malnati James R | Method and system for identifying commonality among pattern definitions |
| US20110047173A1 (en) * | 2009-08-18 | 2011-02-24 | Malnati James R | Method and system for filtering matching content |
| US8255525B2 (en) * | 2009-08-19 | 2012-08-28 | International Business Machines Corporation | System and method for circuit and path based event correlation |
| KR101277274B1 (en) | 2009-11-27 | 2013-06-20 | 한국전자통신연구원 | Method and Apparatus for Mapping a Physical Resource Model to a Logical Resource Model |
| US8627138B1 (en) * | 2010-03-26 | 2014-01-07 | Emc Corporation | Data protection system and method |
| US20110289117A1 (en) * | 2010-05-19 | 2011-11-24 | International Business Machines Corporation | Systems and methods for user controllable, automated recording and searching of computer activity |
| US8595553B2 (en) * | 2010-06-03 | 2013-11-26 | Siemens Aktiengesellschaft | Error pattern identification in an installed base of systems |
| CN101854263B (en) * | 2010-06-13 | 2013-03-13 | 北京星网锐捷网络技术有限公司 | Method, system and management server for analysis processing of network topology |
| EP2590102A4 (en) * | 2010-06-30 | 2013-11-27 | Fujitsu Ltd | SYSTEM, PROGRAM AND METHOD FOR HISTORICAL LOG ANALYSIS |
| JP4993005B2 (en) * | 2010-07-12 | 2012-08-08 | 株式会社日立製作所 | Disk system |
| JP5041044B2 (en) * | 2010-07-21 | 2012-10-03 | 富士通株式会社 | System monitoring program, system monitoring method, and system monitoring apparatus |
| US20120066694A1 (en) | 2010-09-10 | 2012-03-15 | International Business Machines Corporation | Event overflow handling by coalescing and updating previously-queued event notification |
| CN102346756B (en) * | 2010-12-24 | 2013-04-03 | 镇江诺尼基智能技术有限公司 | Device failure solution knowledge management and search system and method |
| JP5609637B2 (en) * | 2010-12-28 | 2014-10-22 | 富士通株式会社 | Program, information processing apparatus, and information processing method |
| US20120239681A1 (en) | 2011-03-14 | 2012-09-20 | Splunk Inc. | Scalable interactive display of distributed data |
| US20140025372A1 (en) * | 2011-03-28 | 2014-01-23 | Nec Corporation | Text analyzing device, problematic behavior extraction method, and problematic behavior extraction program |
| JP5803246B2 (en) * | 2011-05-02 | 2015-11-04 | 日本電気株式会社 | Network operation management system, network monitoring server, network monitoring method and program |
| US8719232B2 (en) * | 2011-06-30 | 2014-05-06 | Verisign, Inc. | Systems and methods for data integrity checking |
| JP5707263B2 (en) * | 2011-07-14 | 2015-04-22 | Kddi株式会社 | Fault location diagnostic system and fault location diagnostic method |
| JP6031224B2 (en) * | 2011-09-27 | 2016-11-24 | Kddi株式会社 | Fault location diagnosis system |
| WO2013057790A1 (en) * | 2011-10-18 | 2013-04-25 | 富士通株式会社 | Information processing device, time correction value determination method, and program |
| WO2013088565A1 (en) * | 2011-12-15 | 2013-06-20 | 富士通株式会社 | Detector, detection program, and detection method |
| JP5741418B2 (en) * | 2011-12-19 | 2015-07-01 | 富士通株式会社 | Fault detection method and fault detection system |
| JP5658417B2 (en) * | 2012-02-27 | 2015-01-28 | 株式会社日立製作所 | Monitoring system and monitoring program |
| JP5936260B2 (en) * | 2012-03-28 | 2016-06-22 | 東日本電信電話株式会社 | Operation site switching system, operation site switching device, operation site switching method, and operation site switching program |
| JP5924073B2 (en) * | 2012-03-30 | 2016-05-25 | 富士通株式会社 | Control program, control method, and control apparatus |
| US9213590B2 (en) | 2012-06-27 | 2015-12-15 | Brocade Communications Systems, Inc. | Network monitoring and diagnostics |
| JP5978804B2 (en) | 2012-07-02 | 2016-08-24 | 富士通株式会社 | Program, method and information processing apparatus for managing system |
| US9917800B2 (en) | 2012-08-24 | 2018-03-13 | Cisco Technology, Inc. | System and method for centralized virtual interface card driver logging in a network environment |
| US20140208217A1 (en) | 2013-01-22 | 2014-07-24 | Splunk Inc. | Interface for managing splittable timestamps across event records |
| US9753909B2 (en) | 2012-09-07 | 2017-09-05 | Splunk, Inc. | Advanced field extractor with multiple positive examples |
| US8751963B1 (en) | 2013-01-23 | 2014-06-10 | Splunk Inc. | Real time indication of previously extracted data fields for regular expressions |
| US10394946B2 (en) | 2012-09-07 | 2019-08-27 | Splunk Inc. | Refining extraction rules based on selected text within events |
| US9594814B2 (en) | 2012-09-07 | 2017-03-14 | Splunk Inc. | Advanced field extractor with modification of an extracted field |
| US8682906B1 (en) | 2013-01-23 | 2014-03-25 | Splunk Inc. | Real time display of data field values based on manual editing of regular expressions |
| WO2014043623A1 (en) * | 2012-09-17 | 2014-03-20 | Siemens Corporation | Log-based predictive maintenance |
| US9071510B2 (en) * | 2012-10-25 | 2015-06-30 | Hewlett-Packard Development Company, L.P. | Determining root causes of network issues |
| US9152929B2 (en) | 2013-01-23 | 2015-10-06 | Splunk Inc. | Real time display of statistics and values for selected regular expressions |
| CN103207820B (en) * | 2013-02-05 | 2016-06-29 | 北京百度网讯科技有限公司 | The Fault Locating Method of hard disk and device based on raid card log |
| US9715282B2 (en) * | 2013-03-29 | 2017-07-25 | Microsoft Technology Licensing, Llc | Closing, starting, and restarting applications |
| CN104102657B (en) * | 2013-04-09 | 2017-08-25 | 富士通株式会社 | Information processor and information processing method |
| JP6030996B2 (en) * | 2013-05-24 | 2016-11-24 | 株式会社日立製作所 | Information management apparatus and information management method |
| US9612898B2 (en) * | 2013-06-03 | 2017-04-04 | Nec Corporation | Fault analysis apparatus, fault analysis method, and recording medium |
| US10523728B1 (en) * | 2013-06-28 | 2019-12-31 | EMC IP Holding Company LLC | Ingesting data from managed elements into a data analytics platform |
| CN104685830B (en) * | 2013-09-30 | 2018-03-06 | 华为技术有限公司 | Method, entity and system for fault management |
| US9246935B2 (en) | 2013-10-14 | 2016-01-26 | Intuit Inc. | Method and system for dynamic and comprehensive vulnerability management |
| EP2866144B1 (en) * | 2013-10-28 | 2020-03-25 | Software AG | Self-correcting complex event processing system and corresponding method for error correction |
| US9313281B1 (en) | 2013-11-13 | 2016-04-12 | Intuit Inc. | Method and system for creating and dynamically deploying resource specific discovery agents for determining the state of a cloud computing environment |
| US9501345B1 (en) * | 2013-12-23 | 2016-11-22 | Intuit Inc. | Method and system for creating enriched log data |
| US9323926B2 (en) | 2013-12-30 | 2016-04-26 | Intuit Inc. | Method and system for intrusion and extrusion detection |
| CN103701926B (en) * | 2013-12-31 | 2017-06-16 | 小米科技有限责任公司 | A kind of methods, devices and systems for obtaining fault reason information |
| US9325726B2 (en) | 2014-02-03 | 2016-04-26 | Intuit Inc. | Method and system for virtual asset assisted extrusion and intrusion detection in a cloud computing environment |
| US20150304343A1 (en) | 2014-04-18 | 2015-10-22 | Intuit Inc. | Method and system for providing self-monitoring, self-reporting, and self-repairing virtual assets in a cloud computing environment |
| US10757133B2 (en) | 2014-02-21 | 2020-08-25 | Intuit Inc. | Method and system for creating and deploying virtual assets |
| US9866581B2 (en) | 2014-06-30 | 2018-01-09 | Intuit Inc. | Method and system for secure delivery of information to computing environments |
| US9276945B2 (en) | 2014-04-07 | 2016-03-01 | Intuit Inc. | Method and system for providing security aware applications |
| JP6008404B2 (en) * | 2014-03-14 | 2016-10-19 | Necフィールディング株式会社 | Information management apparatus, information management method, and program |
| US9838346B2 (en) | 2014-03-17 | 2017-12-05 | Splunk Inc. | Alerting on dual-queue systems |
| US9660930B2 (en) | 2014-03-17 | 2017-05-23 | Splunk Inc. | Dynamic data server nodes |
| US9753818B2 (en) | 2014-09-19 | 2017-09-05 | Splunk Inc. | Data forwarding using multiple data pipelines |
| US9245117B2 (en) | 2014-03-31 | 2016-01-26 | Intuit Inc. | Method and system for comparing different versions of a cloud based application in a production environment using segregated backend systems |
| US9626414B2 (en) * | 2014-04-14 | 2017-04-18 | International Business Machines Corporation | Automatic log record segmentation |
| US11294700B2 (en) | 2014-04-18 | 2022-04-05 | Intuit Inc. | Method and system for enabling self-monitoring virtual assets to correlate external events with characteristic patterns associated with the virtual assets |
| US9374389B2 (en) | 2014-04-25 | 2016-06-21 | Intuit Inc. | Method and system for ensuring an application conforms with security and regulatory controls prior to deployment |
| US9900322B2 (en) | 2014-04-30 | 2018-02-20 | Intuit Inc. | Method and system for providing permissions management |
| US9319415B2 (en) | 2014-04-30 | 2016-04-19 | Intuit Inc. | Method and system for providing reference architecture pattern-based permissions management |
| US9330263B2 (en) | 2014-05-27 | 2016-05-03 | Intuit Inc. | Method and apparatus for automating the building of threat models for the public cloud |
| CN103995762A (en) * | 2014-06-06 | 2014-08-20 | 山东超越数控电子有限公司 | Method for diagnosing board card fault |
| JP6295857B2 (en) | 2014-06-27 | 2018-03-20 | 富士通株式会社 | Extraction method, apparatus, and program |
| US10102082B2 (en) | 2014-07-31 | 2018-10-16 | Intuit Inc. | Method and system for providing automated self-healing virtual assets |
| US9473481B2 (en) | 2014-07-31 | 2016-10-18 | Intuit Inc. | Method and system for providing a virtual asset perimeter |
| US9612897B1 (en) * | 2014-12-12 | 2017-04-04 | State Farm Mutual Automobile Insurance Company | Method and system for detecting system outages using application event logs |
| US9922037B2 (en) | 2015-01-30 | 2018-03-20 | Splunk Inc. | Index time, delimiter based extractions and previewing for use in indexing |
| US10592308B2 (en) * | 2015-04-30 | 2020-03-17 | Micro Focus Llc | Aggregation based event identification |
| US10909018B2 (en) | 2015-09-04 | 2021-02-02 | International Business Machines Corporation | System and method for end-to-end application root cause recommendation |
| US10318366B2 (en) * | 2015-09-04 | 2019-06-11 | International Business Machines Corporation | System and method for relationship based root cause recommendation |
| JP6631908B2 (en) * | 2015-09-07 | 2020-01-15 | パナソニックIpマネジメント株式会社 | Information processing apparatus, failure cause identification method, and program |
| US10474519B2 (en) * | 2015-09-17 | 2019-11-12 | Netapp, Inc. | Server fault analysis system using event logs |
| JP6597231B2 (en) * | 2015-11-27 | 2019-10-30 | 富士通株式会社 | Arithmetic device, program, information processing method |
| WO2017109821A1 (en) * | 2015-12-21 | 2017-06-29 | 株式会社日立製作所 | Management system and management method for computer system |
| US10528427B1 (en) * | 2016-06-09 | 2020-01-07 | Intuit, Inc. | Self-healing system for distributed services and applications |
| CN107544780B (en) * | 2016-06-23 | 2021-11-30 | 北京忆恒创源科技股份有限公司 | Installation method and installation device of operating system |
| CN106201757B (en) * | 2016-07-12 | 2020-05-26 | 网易(杭州)网络有限公司 | Exception handling method and device |
| US10331693B1 (en) * | 2016-09-12 | 2019-06-25 | Amazon Technologies, Inc. | Filters and event schema for categorizing and processing streaming event data |
| US10379929B2 (en) * | 2016-12-19 | 2019-08-13 | Microsoft Technology Licensing, Llc | Enhanced diagnostic and remediation system |
| US10496467B1 (en) | 2017-01-18 | 2019-12-03 | Amazon Technologies, Inc. | Monitoring software computations of arbitrary length and duration |
| JP6859831B2 (en) * | 2017-04-25 | 2021-04-14 | 富士通株式会社 | Generation program, generation device and generation method |
| US10467084B2 (en) * | 2017-06-15 | 2019-11-05 | Oracle International Corporation | Knowledge-based system for diagnosing errors in the execution of an operation |
| US10409685B2 (en) * | 2017-07-24 | 2019-09-10 | Uber Technologies, Inc. | Recovery of application functions via analysis of application operational requests |
| JP6919438B2 (en) * | 2017-09-08 | 2021-08-18 | 日本電気株式会社 | Fault analysis support device, incident management system, fault analysis support method and program |
| US11126494B2 (en) * | 2017-10-31 | 2021-09-21 | Paypal, Inc. | Automated, adaptive, and auto-remediating system for production environment |
| US11113138B2 (en) * | 2018-01-02 | 2021-09-07 | Carrier Corporation | System and method for analyzing and responding to errors within a log file |
| US10764149B2 (en) * | 2018-09-12 | 2020-09-01 | The Mitre Corporation | Cyber-physical system evaluation |
| US11354320B2 (en) * | 2018-10-11 | 2022-06-07 | International Business Machines Corporation | Determining causes of events in data |
| CN109714214B (en) * | 2018-12-29 | 2021-08-27 | 网宿科技股份有限公司 | Server exception handling method and management equipment |
| US10733213B2 (en) * | 2018-12-31 | 2020-08-04 | Iguazio Systems Ltd. | Structuring unstructured machine-generated content |
| US10691728B1 (en) * | 2019-08-13 | 2020-06-23 | Datadog, Inc. | Transforming a data stream into structured data |
| US10985970B1 (en) * | 2019-10-18 | 2021-04-20 | Splunk Inc. | Automatic actionable event responder for operational clusters |
| JP6948470B1 (en) * | 2020-03-19 | 2021-10-13 | 株式会社日立製作所 | Repair support system and repair support method |
| JP2022006603A (en) * | 2020-06-24 | 2022-01-13 | オムロン株式会社 | Log processing device and control program |
| EP3933589A1 (en) * | 2020-06-30 | 2022-01-05 | Roche Diagnostics GmbH | An event chain reaction system |
| US11314510B2 (en) | 2020-08-14 | 2022-04-26 | International Business Machines Corporation | Tracking load and store instructions and addresses in an out-of-order processor |
| CN114077525A (en) * | 2020-08-17 | 2022-02-22 | 鸿富锦精密电子(天津)有限公司 | Abnormal log processing method and device, terminal equipment, cloud server and system |
| US11243835B1 (en) | 2020-12-03 | 2022-02-08 | International Business Machines Corporation | Message-based problem diagnosis and root cause analysis |
| US11797538B2 (en) | 2020-12-03 | 2023-10-24 | International Business Machines Corporation | Message correlation extraction for mainframe operation |
| US11403326B2 (en) | 2020-12-03 | 2022-08-02 | International Business Machines Corporation | Message-based event grouping for a computing operation |
| US11995562B2 (en) | 2020-12-03 | 2024-05-28 | International Business Machines Corporation | Integrating documentation knowledge with log mining for system diagnosis |
| US11474892B2 (en) | 2020-12-03 | 2022-10-18 | International Business Machines Corporation | Graph-based log sequence anomaly detection and problem diagnosis |
| US11513930B2 (en) | 2020-12-03 | 2022-11-29 | International Business Machines Corporation | Log-based status modeling and problem diagnosis for distributed applications |
| US11599404B2 (en) | 2020-12-03 | 2023-03-07 | International Business Machines Corporation | Correlation-based multi-source problem diagnosis |
| JP7047054B2 (en) * | 2020-12-28 | 2022-04-04 | エヌ・ティ・ティ・コミュニケーションズ株式会社 | Test automation equipment, test methods, and programs |
| JP7504816B2 (en) * | 2021-01-28 | 2024-06-24 | 株式会社日立製作所 | Log search support device and log search support method |
| DE102021104735A1 (en) * | 2021-02-26 | 2022-09-01 | Bundesdruckerei Gmbh | Log data analysis |
| US12028271B2 (en) | 2022-12-06 | 2024-07-02 | Bank Of America Corporation | Prioritizing messages for server processing based on monitoring and predicting server resource utilization |
| US12425243B2 (en) * | 2023-03-09 | 2025-09-23 | Bank Of America Corporation | Resolving failed data interactions performed by an internet of things (IoT) device |
| WO2025243419A1 (en) * | 2024-05-22 | 2025-11-27 | Ntt株式会社 | Measure execution device, measure execution method, and program |
Family Cites Families (14)
| Publication number | Priority date | Publication date | Assignee | Title |
|---|---|---|---|---|
| JPH0824291B2 (en) * | 1993-03-25 | 1996-03-06 | 日本電気株式会社 | Network management system |
| JP4156663B2 (en) * | 1994-04-05 | 2008-09-24 | インテル・コーポレーション | Method and apparatus for monitoring and controlling a program in a network |
| US5768501A (en) * | 1996-05-28 | 1998-06-16 | Cabletron Systems | Method and apparatus for inter-domain alarm correlation |
| JPH10105440A (en) * | 1996-09-25 | 1998-04-24 | Hitachi Ltd | System fault monitoring device and recording medium |
| JPH11232145A (en) | 1998-02-13 | 1999-08-27 | Sharp Corp | Log information recording device |
| JPH11308222A (en) * | 1998-04-22 | 1999-11-05 | Sumitomo Electric Ind Ltd | Network management system |
| FR2802663B1 (en) * | 1999-12-21 | 2002-01-25 | Bull Sa | METHOD FOR CORRELATION OF ALARMS IN A HIERARCHIZED ADMINISTRATION SYSTEM |
| JP2001256032A (en) * | 2000-03-14 | 2001-09-21 | Mitsubishi Electric Corp | Fault message display device |
| JP3760078B2 (en) * | 2000-03-14 | 2006-03-29 | 富士通株式会社 | Network management apparatus and program recording medium |
| US6604208B1 (en) * | 2000-04-07 | 2003-08-05 | Telefonaktiebolaget Lm Ericsson (Publ) | Incremental alarm correlation method and apparatus |
| US7043661B2 (en) * | 2000-10-19 | 2006-05-09 | Tti-Team Telecom International Ltd. | Topology-based reasoning apparatus for root-cause analysis of network faults |
| JP2002342180A (en) * | 2001-05-15 | 2002-11-29 | Nec Corp | System for automatically monitoring and restoring fault |
| JP2002342182A (en) | 2001-05-21 | 2002-11-29 | Hitachi Ltd | Operation management support system for network systems |
| US7051244B2 (en) * | 2002-10-31 | 2006-05-23 | Hewlett-Packard Development Company, L.P. | Method and apparatus for managing incident reports |
-
2002
- 2002-12-26 EP EP02793425A patent/EP1577783A4/en not_active Withdrawn
- 2002-12-26 JP JP2004564435A patent/JP4318643B2/en not_active Expired - Fee Related
- 2002-12-26 WO PCT/JP2002/013719 patent/WO2004061681A1/en not_active Ceased
- 2002-12-26 CN CNA028295080A patent/CN1650274A/en active Pending
- 2002-12-26 AU AU2002359925A patent/AU2002359925B2/en not_active Ceased
-
2005
- 2005-01-28 US US11/044,227 patent/US7506195B2/en not_active Expired - Fee Related
Cited By (10)
| Publication number | Priority date | Publication date | Assignee | Title |
|---|---|---|---|---|
| US7373552B2 (en) | 2004-09-30 | 2008-05-13 | Siemens Aktiengesellschaft | Model based diagnosis and repair for event logs |
| RU2574205C2 (en) * | 2009-07-20 | 2016-02-10 | Моторола Мобилити, Инк. | Multi-environment operating system |
| US9389877B2 (en) | 2009-07-20 | 2016-07-12 | Google Technology Holdings LLC | Multi-environment operating system |
| US9342325B2 (en) | 2012-05-17 | 2016-05-17 | Google Technology Holdings LLC | Synchronizing launch-configuration information between first and second application environments that are operable on a multi-modal device |
| EP2933726A1 (en) * | 2014-04-15 | 2015-10-21 | LSIS Co., Ltd. | Apparatus, system and method for application log data processing |
| US9519537B2 (en) | 2014-04-15 | 2016-12-13 | Lsis Co., Ltd. | Apparatus, system and method for application log data processing |
| WO2018137765A1 (en) * | 2017-01-26 | 2018-08-02 | Telefonaktiebolaget Lm Ericsson (Publ) | System and method for analyzing network performance data |
| US20190320329A1 (en) * | 2017-01-26 | 2019-10-17 | Telefonaktiebolaget Lm Ericsson (Publ) | System and Method for Analyzing Network Performance Data |
| US10952082B2 (en) * | 2017-01-26 | 2021-03-16 | Telefonaktiebolaget Lm Ericsson (Publ) | System and method for analyzing network performance data |
| US11087638B2 (en) | 2017-01-26 | 2021-08-10 | Telefonaktiebolaget Lm Ericsson (Publ) | System and method for analysing sports performance data |
Also Published As
| Publication number | Publication date |
|---|---|
| EP1577783A4 (en) | 2008-04-16 |
| US7506195B2 (en) | 2009-03-17 |
| CN1650274A (en) | 2005-08-03 |
| AU2002359925B2 (en) | 2008-10-23 |
| JP4318643B2 (en) | 2009-08-26 |
| WO2004061681A1 (en) | 2004-07-22 |
| JPWO2004061681A1 (en) | 2006-05-18 |
| US20050172162A1 (en) | 2005-08-04 |
| AU2002359925A1 (en) | 2004-07-29 |
Similar Documents
| Publication | Publication Date | Title |
|---|---|---|
| AU2002359925B2 (en) | Operation managing method and operation managing server | |
| US11971898B2 (en) | Method and system for implementing machine learning classifications | |
| US11727025B2 (en) | Method and system for implementing a log parser in a log analytics system | |
| US9003230B2 (en) | Method and apparatus for cause analysis involving configuration changes | |
| US8103664B2 (en) | System for automated computer support | |
| US8881131B2 (en) | Method and apparatus for populating a software catalogue with software knowledge gathering | |
| US6697791B2 (en) | System and method for systematic construction of correlation rules for event management | |
| US9767171B2 (en) | Method and system for implementing an operating system hook in a log analytics system | |
| US6792456B1 (en) | Systems and methods for authoring and executing operational policies that use event rates | |
| US6393387B1 (en) | System and method for model mining complex information technology systems | |
| US20110314138A1 (en) | Method and apparatus for cause analysis configuration change | |
| JP2007502467A (en) | System and method for automated computer support | |
| CN101086777A (en) | Method and system for capturing and reusing intellectual capital in it management | |
| CN114553596B (en) | Multi-dimensional security condition real-time display method and system suitable for network security | |
| Mickens et al. | Snitch: Interactive decision trees for troubleshooting misconfigurations | |
| US20080189150A1 (en) | Supply chain multi-dimensional serial containment process | |
| CN120872668A (en) | Automatic fault positioning and repairing method, system and medium based on log analysis | |
| US20040153748A1 (en) | Method for configuring a data processing system for fault tolerance | |
| CN116089243B (en) | Map production abnormality positioning and processing method, system, medium and equipment | |
| EP1746501A1 (en) | Method and apparatus for populating a software catalogue with software knowledge gathering | |
| CN119850112A (en) | System change processing method and device, electronic equipment and readable medium | |
| CN120524240A (en) | Data comparison method, device, equipment and storage medium | |
| CN121530817A (en) | A method, apparatus, electronic device, and storage medium for removing resources from the internet. |
Legal Events
| Date | Code | Title | Description |
|---|---|---|---|
| PUAI | Public reference made under article 153(3) epc to a published international application that has entered the european phase |
Free format text: ORIGINAL CODE: 0009012 |
|
| 17P | Request for examination filed |
Effective date: 20050221 |
|
| AK | Designated contracting states |
Kind code of ref document: A1 Designated state(s): AT BE BG CH CY CZ DE DK EE ES FI FR GB GR IE IT LI LU MC NL PT SE SI SK TR |
|
| AX | Request for extension of the european patent |
Extension state: AL LT LV MK RO |
|
| DAX | Request for extension of the european patent (deleted) | ||
| RBV | Designated contracting states (corrected) |
Designated state(s): DE GB |
|
| A4 | Supplementary search report drawn up and despatched |
Effective date: 20080317 |
|
| RIC1 | Information provided on ipc code assigned before grant |
Ipc: G06F 11/07 20060101ALI20080311BHEP Ipc: G06F 11/30 20060101AFI20080311BHEP |
|
| STAA | Information on the status of an ep patent application or granted ep patent |
Free format text: STATUS: THE APPLICATION HAS BEEN WITHDRAWN |
|
| 18W | Application withdrawn |
Effective date: 20080512 |