US10909018B2 - System and method for end-to-end application root cause recommendation - Google Patents
System and method for end-to-end application root cause recommendation Download PDFInfo
- Publication number
- US10909018B2 US10909018B2 US14/845,729 US201514845729A US10909018B2 US 10909018 B2 US10909018 B2 US 10909018B2 US 201514845729 A US201514845729 A US 201514845729A US 10909018 B2 US10909018 B2 US 10909018B2
- Authority
- US
- United States
- Prior art keywords
- nodes
- application components
- relationship data
- abnormal
- application
- Prior art date
- Legal status (The legal status is an assumption and is not a legal conclusion. Google has not performed a legal analysis and makes no representation as to the accuracy of the status listed.)
- Active, expires
Links
- 238000000034 method Methods 0.000 title claims abstract description 35
- 230000002159 abnormal effect Effects 0.000 claims abstract description 54
- 230000008439 repair process Effects 0.000 claims abstract description 7
- 230000004044 response Effects 0.000 claims description 44
- 238000004590 computer program Methods 0.000 claims description 7
- 230000000875 corresponding effect Effects 0.000 description 20
- 238000010586 diagram Methods 0.000 description 12
- 238000004891 communication Methods 0.000 description 10
- 230000005856 abnormality Effects 0.000 description 9
- 238000004458 analytical method Methods 0.000 description 9
- 238000010219 correlation analysis Methods 0.000 description 9
- 238000012544 monitoring process Methods 0.000 description 9
- 230000006870 function Effects 0.000 description 6
- 230000015556 catabolic process Effects 0.000 description 4
- 238000006731 degradation reaction Methods 0.000 description 4
- 230000002457 bidirectional effect Effects 0.000 description 3
- 238000012423 maintenance Methods 0.000 description 3
- 238000007726 management method Methods 0.000 description 3
- 238000012986 modification Methods 0.000 description 3
- 230000004048 modification Effects 0.000 description 3
- 230000008569 process Effects 0.000 description 3
- 238000012545 processing Methods 0.000 description 3
- 230000003993 interaction Effects 0.000 description 2
- 206010000117 Abnormal behaviour Diseases 0.000 description 1
- 230000006399 behavior Effects 0.000 description 1
- 230000005540 biological transmission Effects 0.000 description 1
- 230000002596 correlated effect Effects 0.000 description 1
- 238000013500 data storage Methods 0.000 description 1
- 238000001514 detection method Methods 0.000 description 1
- 230000007246 mechanism Effects 0.000 description 1
- 229920001690 polydopamine Polymers 0.000 description 1
- 238000011176 pooling Methods 0.000 description 1
Images


Classifications
-
- G—PHYSICS
- G06—COMPUTING; CALCULATING OR COUNTING
- G06F—ELECTRIC DIGITAL DATA PROCESSING
- G06F11/00—Error detection; Error correction; Monitoring
- G06F11/30—Monitoring
- G06F11/34—Recording or statistical evaluation of computer activity, e.g. of down time, of input/output operation ; Recording or statistical evaluation of user activity, e.g. usability assessment
- G06F11/3452—Performance evaluation by statistical analysis
-
- G—PHYSICS
- G06—COMPUTING; CALCULATING OR COUNTING
- G06F—ELECTRIC DIGITAL DATA PROCESSING
- G06F11/00—Error detection; Error correction; Monitoring
- G06F11/30—Monitoring
- G06F11/3003—Monitoring arrangements specially adapted to the computing system or computing system component being monitored
- G06F11/3006—Monitoring arrangements specially adapted to the computing system or computing system component being monitored where the computing system is distributed, e.g. networked systems, clusters, multiprocessor systems
-
- G—PHYSICS
- G06—COMPUTING; CALCULATING OR COUNTING
- G06F—ELECTRIC DIGITAL DATA PROCESSING
- G06F2201/00—Indexing scheme relating to error detection, to error correction, and to monitoring
- G06F2201/87—Monitoring of transactions
Definitions
- Exemplary embodiments of the present invention relate to root cause recommendation. More particularly, exemplary embodiments of the present invention relate to a system and method for relationship based root cause recommendation.
- Computer systems such as cloud applications, may include a distributed computing environment.
- Cloud applications may include a distributed dynamic environment with linked computers and servers existing in a number of geographic locations.
- Application problems or errors may occur at any number of the linked computers and servers.
- monitoring cloud applications for desired functioning may include identifying one or more root causes of problems or errors.
- a single server in a particular geographic location may have a problem or error which may impact other servers linked to the server having the problem or error.
- a relatively large number of errors or problems may be detected.
- identifying the root cause of a problem in a large-scale distributed dynamic environment will reduce the time elapsed between an occurrence of a problem or error and the resolution of the problem or error.
- Exemplary embodiments of the present invention provide a method of identifying a root cause in a distributed computing environment including collecting metric data generated by each of a plurality of application components, collecting metric correlation relationship data that indicates a relationship between the metric data generated by the application components, collecting topology relationship data that indicates a spatial relationship between the application components, and collecting transaction tracking relationship data that indicates a group of the application components used to execute a requested transaction.
- a graph is generated including a plurality of nodes corresponding to the application components by merging the metric correlation relationship data, the topology relationship data, and the transaction tracking relationship data.
- Target nodes are identified among the plurality of nodes that correspond to application components having a response time that is above a predefined threshold.
- a plurality of paths along the graph that include the target nodes are traversed to identify at least one node corresponding to an abnormal application component.
- a recommendation list is generated including the at least one abnormal application component.
- the at least one node corresponding to the abnormal application component may be present in each of the traversed plurality of paths.
- the metric data may include at least one of a response time, a throughput, a latency, and an error count.
- the application components may be services executed by a plurality of computers in the distributed computing environment.
- the topology relationship data may further indicate a traversed path along the group of the application components taken to execute the requested transaction.
- the group of the application components used to execute the requested transaction may include some of the application components.
- the group of the application components used to execute the requested transaction may include all of the application components.
- the at least one abnormal application component may function as a system bottleneck.
- Exemplary embodiments of the present invention provide a method of identifying a root cause in a distributed computing environment including collecting metric data generated by each of a plurality of application components, collecting metric correlation relationship data that indicates a relationship between the metric data generated by the application components, collecting topology relationship data that indicates a spatial relationship between the application components, and collecting transaction tracking relationship data that indicates a group of the application components used to execute a requested transaction.
- a graph is generated including a plurality of nodes corresponding to the application components by merging the metric correlation relationship data, the topology relationship data, and the transaction tracking relationship data.
- Target nodes are identified among the plurality of nodes that correspond to application components having a throughput that is below a predefined threshold.
- a plurality of paths along the graph that include the target nodes are traversed to identify at least one node corresponding to an abnormal application component.
- a recommendation list is generated including the at least one abnormal application component.
- Exemplary embodiments of the present invention provide a computer system configured to identify a root cause in a distributed computing environment.
- the system includes a memory storing a computer program, and a processor configured to execute the computer program.
- the computer program performs the following steps.
- Collect metric correlation relationship data that indicates a relationship between the metric data generated by the application components.
- Collect topology relationship data that indicates a spatial relationship between the application components.
- Collect transaction tracking relationship data that indicates a group of the application components used to execute a requested transaction.
- Generate a graph including a plurality of nodes corresponding to the application components by merging the metric correlation relationship data, the topology relationship data, and the transaction tracking relationship data.
- FIG. 1 is a flow chart of a method of relationship based root cause recommendation according to exemplary embodiments of the present invention.
- FIG. 2 illustrates a distributed computing environment according to an exemplary embodiment of the present invention.
- FIG. 3 is a schematic diagram illustrating a method of relationship based root cause recommendation according to exemplary embodiments of the present invention.
- FIG. 4 is a schematic diagram illustrating a path builder according to an exemplary embodiment of the present invention.
- FIG. 5A illustrates topology relationship data according to an exemplary embodiment of the present invention.
- FIG. 5B illustrates transaction tracking relationship data according to an exemplary embodiment of the present invention.
- FIG. 5C illustrates metric correlation relationship data according to an exemplary embodiment of the present invention.
- FIG. 6 illustrates an exemplary graph including a plurality of nodes corresponding to application components and node response times according to an exemplary embodiment of the present invention.
- FIG. 7 is a schematic diagram illustrating root cause recommendation system architecture according to an exemplary embodiment of the present invention.
- FIG. 8 is a schematic diagram illustrating system architecture including an analytic monitoring system according to an exemplary embodiment of the present invention.
- FIGS. 9A-9D are graphs of exemplary response time data according to exemplary embodiments of the present invention.
- FIG. 10 is a flow chart of a method of relationship based root cause recommendation according to exemplary embodiments of the present invention.
- FIG. 11 illustrates exemplary confidence scores for a plurality of identified target nodes and an exemplary recommendation list corresponding to the plurality of identified target nodes according to exemplary embodiments of the present invention.
- FIG. 12 illustrates an example of a computer system capable of implementing the method according to exemplary embodiments of the present invention.
- FIG. 13 illustrates exemplary root cause scores for exemplary nodes in a distributed computing environment and exemplary weights for exemplary edges in the distributed computing environment according to an exemplary embodiment of the present invention.
- Exemplary embodiments of the present invention described herein generally include identifying a root cause in a distributed computing environment. Accordingly, while the exemplary embodiments of the present invention may be susceptible to various modifications and alternative forms, specific exemplary embodiments are shown by way of example in the drawings and will herein be described in more detail. It should be understood, however, that there is no intent to limit the disclosure to the particular forms disclosed, but on the contrary, the disclosure is to cover all modifications, equivalents, and alternatives falling within the spirit and scope of the present invention.
- FIG. 1 is a flow chart of a method of relationship based root cause recommendation according to exemplary embodiments of the present invention.
- Exemplary embodiments of the present invention provide a method of identifying a root cause in a distributed computing environment.
- the method of identifying a root cause in a distributed computing environment may include collecting metric data generated by each of a plurality of application components 101 , collecting metric correlation relationship data that indicates a relationship between the metric data generated by the application components 102 , collecting topology relationship data that indicates a spatial relationship between the application components 103 , and collecting transaction tracking relationship data that indicates a group of the application components used to execute a requested transaction 104 .
- Metric data may include at least one of response time, throughput, latency, and an error count. The terms latency and response time may be used interchangeably herein.
- the error count may refer to the relative number of times that a communication between connected application components fails or has an error.
- the metric correlation relationship data, topology relationship data, and transaction tracking relationship data are described in further detail below.
- a graph (see, e.g., the graphs illustrated in FIG. 6 and FIG. 13 ) may be generated including a plurality of nodes corresponding to the application components by merging the metric correlation relationship data, the topology relationship data, and the transaction tracking relationship data 105 .
- Target nodes may be identified among the plurality of nodes that correspond to application components having a response time that is above a predefined threshold 106 .
- a plurality of paths along the graph that include the target nodes may be traversed to identify at least one node corresponding to an abnormal application component 107 .
- a recommendation list may be generated including the at least one abnormal application component 108 .
- the generated graph may include two data sets.
- a first data set may include a list of each of the edges of the distributed computing environment.
- a second data set may include a list of each of the servers in the distributed computing environment.
- Duplicate nodes included in the list of nodes may be removed.
- a single node may be used to identify each of the servers in the distributed computing environment.
- a duplicate node may be a node that shares an identical name with another identified node. That is, the same server may be identified twice and only a single node may be included in the generated graph to represent the single server.
- the generated graph may include both outgoing edges (e.g., an outgoing vertex) and incoming edges (e.g., an incoming vertex) between each individual server in the distributed computing environment (see, e.g., FIG. 13 ). After removing any duplicate nodes, the outgoing and incoming edges may be plotted onto the graph (e.g., the graph illustrated in FIG. 13 ) with respect to each of the nodes representing each of the identified servers in the distributed computing environment. Thus, graphing of duplicative nodes may be prevented or eliminated and graphing of duplicative edges may be prevented or eliminated.
- the generated graph may include one node for each server in the distributed computing environment.
- the generated graph may include topology relationship data for each of the nodes, transaction relationship data for each of the nodes and metric correlation relationship data for each of the nodes, as described below in more detail.
- FIG. 2 illustrates a distributed computing environment according to an exemplary embodiment of the present invention.
- a distributed computing environment 200 may include a plurality of servers or computers (e.g., servers 201 , 202 , 203 , 204 , 205 , 206 , 207 and 208 ).
- the terms server and computer may be used interchangeably herein.
- Each server or computer in the distributed computing environment may be used to execute an application, such as a cloud application, and thus, each server or computer may be referred to as an application component.
- Each component of the application may be referred to as a node.
- a graph of the plurality of servers may include a plurality of nodes, and each of the plurality of nodes may represent a server.
- each of the plurality of servers may be linked with or may communicate with at least one other server.
- server 201 may be linked with servers 202 , 203 , 204 , 205 and 206
- servers 202 , 203 and 204 are linked with server 207
- servers 205 and 206 are linked with server 208 .
- Communication between each of the servers may be unidirectional or bidirectional, as desired.
- Each of the servers (e.g., servers 201 , 202 , 203 , 204 , 205 , 206 , 207 and 208 ) of the distributed computing environment may be disposed in a different geographic location.
- each of the servers (e.g., servers 201 , 202 , 203 , 204 , 205 , 206 , 207 and 208 ) of the distributed computing environment may be disposed in different countries or regions from each other.
- Distances between each of the servers (e.g., servers 201 , 202 , 203 , 204 , 205 , 206 , 207 and 208 ) may vary.
- some or all of the servers (e.g., servers 201 , 202 , 203 , 204 , 205 , 206 , 207 and 208 ) may be disposed in a same geographic location.
- FIG. 3 is a schematic diagram illustrating a method of relationship based root cause recommendation according to exemplary embodiments of the present invention.
- a method of relationship based root cause recommendation may include collecting application level and/or transaction level throughput and response time 301 .
- Application level response time may refer to the elapsed time for a signal to traverse through all application components.
- Transaction level response time may refer to the elapsed time for a signal to traverse through a predetermined number of application components that are needed to execute a transaction.
- a user may request a particular service or task from the distributed computing environment, which may be referred to as a transaction.
- the application components may be services executed by a plurality of computers in the distributed computing environment.
- the group of the application components used to execute the requested transaction may include some of the application components.
- the group of the application components used to execute the requested transaction may include all of the application components.
- the transaction may include communication between a predetermined number of servers of the distributed computing environment to deliver the user a response or result.
- Application level throughput may refer to the amount of data transmitted through the servers in the distributed computing environment.
- Transaction level throughput may refer to the amount of data transmitted through the servers needed to execute a particular transaction.
- the collected application level or transaction level throughput and response time 301 may be evaluated by an application abnormal detector 302 .
- the application abnormal detector 302 may determine if an application is functioning normally. For example, the application abnormal detector 302 may determine whether one or more components of the application are functioning normally or abnormally 303 . If the application is found to be functioning normally then a new collection of application level or transaction level throughput and response time 301 may be determined.
- This process may be repeatedly performed, as desired. For example the process may be performed according to predetermined time intervals or a predetermined number (e.g., 2,500) of processes may be performed to detect application abnormalities, as desired.
- the presence of at least one abnormal application component may function as a system bottleneck. If an abnormality is detected, the collected throughput and/or response times may be evaluated by a recommendation analyzer 304 , which may recommend a next step 311 to a user.
- the application abnormal detector 302 may be a threshold abnormality detector.
- the application abnormal detector 302 may detect an abnormality when a throughput is below a predetermined threshold or when a response time is above a predetermined threshold. If an abnormality is detected, the collected throughput and response times may be evaluated by the recommendation analyzer 304 , which may recommend a next step 311 to a user.
- the recommendation analyzer 304 may receive a graph 310 from a path builder 309 .
- the path builder 309 may build a graphical representation (e.g., the graph 310 ) of each of the components of the application.
- the path builder 309 may receive transaction data 306 , topology data 307 and correlation analysis (causality) data 308 from a raw data collector 305 that monitors each of these types of data.
- the path builder may combine the transaction data 306 , the topology data 307 and the correlation analysis (causality) data 308 from the raw data collector 305 to form the graph 310 and may provide the graph to the recommendation analyzer 304 .
- the path builder 309 will be described in more detail below with reference to FIG. 4 .
- the graph generated by the path builder 309 will be described in more detail below with reference to FIGS. 5A, 5B, 5C and 6 .
- FIG. 4 is a schematic diagram illustrating a path builder according to an exemplary embodiment of the present invention.
- the path builder 409 may generate a graph based on dependency relationships between the components of the application (see, e.g., FIG. 6 illustrating an exemplary graph including the plurality of nodes representing the plurality of components).
- the graph generated by the path builder 409 may include topology data and transaction tracking data between the components. That is, the generated graph may be representative of the spatial relationship between individual application components (e.g., based on the topology data), the communications/interconnectivity between individual application components when executing a transaction (e.g., based on the transaction tracking data), and the distances between individual application components (e.g., based on the topology data).
- the generated graph may be traversed at least one time to generate throughput and/or response time data between individual application components.
- the graph may be repeatedly traversed, as desired.
- the graph may be repeatedly traversed according to predetermined time intervals, or a predetermined number (e.g., 2,500) of traversals may be performed to detect and/or determine a location of application abnormalities.
- the generated graph may include two data sets.
- a first data set may include a list of each of the edges of the distributed computing environment.
- a second data set may include a list of each of the servers in the distributed computing environment.
- Duplicate nodes included in the list of nodes may be removed.
- a single node may be used to identify each of the servers in the distributed computing environment.
- a duplicate node may be a node that shares an identical name with another identified node. That is, the same server may be identified twice and only a single node may be included in the generated graph to represent the single server.
- the generated graph may include both outgoing edges (e.g., an outgoing vertex) and incoming edges (e.g., an incoming vertex) between each individual server in the distributed computing environment (see, e.g., FIG. 13 ). After removing any duplicate nodes, the outgoing and incoming edges may be plotted onto the graph (e.g., the graph illustrated in FIG. 13 ) with respect to each of the nodes representing each of the identified servers in the distributed computing environment. Thus, graphing of duplicative nodes may be prevented or eliminated and graphing of duplicative edges may be prevented or eliminated.
- the generated graph may include one node for each server in the distributed computing environment.
- the generated graph may include topology relationship data for each of the nodes, transaction relationship data for each of the nodes and metric correlation relationship data for each of the nodes, as described below in more detail.
- the path builder may receive topology relationship data 407 (T(k) 402 ), transaction tracking relationship data 406 (TT(k) 403 ) and metric correlation relationship data 408 (PI(k) 401 ).
- the path builder 409 may provide combined topology and transaction tracking data (T(k)+TT(k) 404 for multivariate correlation analysis 408 .
- the topology relationship data 407 (T(k) 402 ), the transaction tracking relationship data 406 (TT(k) 403 ) and the metric correlation relationship data 408 (PI(k) 401 ) may be combined 405 by the path builder 409 to generate the graph.
- the topology relationship data 407 (T(k) 402 ), the transaction tracking relationship data 406 (TT(k) 403 ) and the metric correlation relationship data 408 (PI(k) 401 ) will be described in more detail below.
- the transaction tracking relationship data 406 may indicate a traversed path along the group of the application components taken to execute the requested transaction.
- the topology relationship data 407 may indicate the spatial relationship between application components (e.g., the physical distance between geographic components).
- FIG. 5A illustrates topology relationship data according to an exemplary embodiment of the present invention.
- FIG. 5B illustrates transaction tracking relationship data according to an exemplary embodiment of the present invention.
- FIG. 5C illustrates metric correlation relationship data according to an exemplary embodiment of the present invention.
- the topology relationship data may be representative of the spatial relationship between individual application components or nodes.
- the individual application components may be represented by nodes 501 and 502 , as well as the additional nodes shown in FIG. 5A .
- the topology relationship data may be representative of the relative distances between individual application components (e.g., the distances between application components located at a same and/or at different geographic locations).
- the transaction tracking relationship data may be representative of the communications/interconnectivity between individual application components (e.g., nodes 501 through 506 , as well as the additional nodes shown in FIG. 5B ) that are needed to execute a transaction.
- individual application components e.g., nodes 501 through 506 , as well as the additional nodes shown in FIG. 5B
- some of the nodes may communicate with each other, while other nodes might not communicate with each other. That is, different transactions may need different groups of nodes to be executed. For example, a first transaction may need communication to occur between nodes 501 , 502 and 503 , while a second transaction may need communication to occur between nodes 501 , 502 , 504 , 505 and 506 .
- the topology relationship data and the transaction tracking relationship data may be combined to generate metric correlation relationship data.
- the combined metric correlation relationship data will be described below in more detail with reference to FIG. 6 .
- FIG. 6 illustrates an exemplary graph including a plurality of nodes corresponding to application components and node response times according to an exemplary embodiment of the present invention.
- the graph illustrated in FIG. 6 may be an example of the graph generated by the path builder described above.
- the graph generated may represent the combined metric correlation relationship data, and the graph may include metric data such as response time between each of the connected nodes corresponding to application components.
- the graph may be generated including a plurality of nodes corresponding to the application components by merging the metric correlation relationship data, the topology relationship data, and the transaction tracking relationship data.
- the metric data may include response time, throughput, latency and/or error count and may be represented on the graph generated by the path builder.
- the generated graph may include nodes 601 , 602 , 603 , 604 , 605 , 606 , 607 , 608 , 609 , 610 and response times between each of the connected nodes may be included in the graph.
- Target nodes may be identified among the plurality of nodes that correspond to application components having a response time that is above a predefined threshold.
- a plurality of paths along the graph that include the target nodes may be traversed to identify at least one node corresponding to an abnormal application component.
- a recommendation list may be generated including the at least one abnormal application component.
- the at least one node corresponding to the abnormal application component may be present in each of the traversed plurality of paths.
- nodes 604 and 609 may each be identified as having a relatively long response time. Thus, nodes 604 and 609 may be identified as corresponding to an abnormal application component and may be included in the recommendation list for service or repair.
- FIG. 7 is a schematic diagram illustrating root cause recommendation system architecture according to an exemplary embodiment of the present invention.
- a root cause recommendation system 700 may include an information cube 701 , a path builder 702 , a recommendation analyzer 703 , a system under management 705 , an abnormal pattern detector 706 , a deep root cause analysis unit 707 , a topology and transaction tracking unit 708 , and a multivariate correlation analysis unit 709 .
- the abnormal pattern detector 706 , the topology and transaction tracking unit 708 , and the multivariate correlation analysis unit 709 may perform abnormal pattern detection, topology and transaction data processing, and correlation analysis, respectively, as described above.
- the system under management 705 may be the distributed computing environment system illustrated, for example, in FIG. 2 .
- Data from the abnormal pattern detector 706 , the topology and transaction tracking unit 708 , and the multivariate correlation analysis unit 709 may be combined 710 , and may be provided to the path builder 702 .
- the recommendation analyzer 703 may output a recommendation list to an operator 704 .
- the path builder 702 may communicate with the information cube 701 .
- the information cube 701 may store analytic and monitoring solutions.
- the information cube 701 may store executable software for analysis and monitoring of the distributed computing environment, and the executable software may be utilized by the path builder 702 .
- the monitoring and analysis solutions in the information cube 701 may capture workload and bottleneck dynamics of the components of the application including the distributed computing environment. Workload variations and an occurrence of bottlenecks in the application components may occur dynamically, and solutions for analyzing and monitoring the workload and bottlenecks may be learned and stored in the information cube 701 .
- predictive insight (PI) of the multivariate correlation analysis unit 709 may be increased by learning relationships between the application components and the timing of communication between the application components.
- the recommendation analyzer 703 may generate a recommendation list (see, e.g., FIG. 11 ) based on data generated by traversing the graph built by the path builder 702 and may provide the recommendation list to an operator 704 .
- the recommendation analyzer 703 may further analyze the recommendation list and present a prioritized recommendation list the user 704 . For example, nodes which are identified as most likely abnormal may be presented to the user first by the recommendation analyzer 703 . Abnormal or potentially abnormal nodes appearing on the recommendation list may be identified and/or prioritized based on confidence scores (see, e.g., FIG. 11 ).
- the deep root cause analysis unit 707 may identify the root cause of performance degradation in the distributed computing environment.
- the root cause of performance degradation may include a database deadlock, running out of JVM memory or running out of a database connection pool.
- an individual server may be identified as not functioning as desired.
- the root cause identified by the deep root cause analysis unit 707 may be correlated with the degradation of throughput and/or response time to determine causality in the edges between individual servers.
- the deep root cause analysis unit 707 may perform dynamic code path analytics.
- the deep root cause analysis unit 707 may determine a particular line of code which is causing degradation in a CPU or IO consumer.
- exemplary embodiments of the present invention are not limited thereto and any desired root cause analysis tools may be utilized, as desired.
- real system behavior may refer to the average throughput and average response time that are measured for a particular application or system.
- FIG. 8 is a schematic diagram illustrating system architecture including an analytic monitoring system according to an exemplary embodiment of the present invention.
- an analytic monitoring system 811 may include the multivariate correlation analysis unit 709 , the topology and transaction tracking unit 708 and the deep root analysis unit 707 .
- the presence of at least one abnormal application component may be detected by the analytic monitoring system 811 .
- the at least one abnormal application component may function as a system bottleneck.
- FIGS. 9A-9D are graphs of exemplary response time data according to exemplary embodiments of the present invention.
- response times for exemplary nodes are illustrated.
- the response times are illustrated at a number of time stamps.
- a number of data points may be presented, and each data point may illustrate a response time determined for a particular node at each time point.
- a number of relatively long response times may be determined for a particular node.
- the relatively long response times may indicate an abnormality in the observed node.
- response times for a particular node may consistently be relatively short. The relatively short response times may indicate that there is not an abnormality in the observed node.
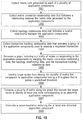
- FIG. 10 is a flow chart of a method of relationship based root cause recommendation according to exemplary embodiments of the present invention.
- Exemplary embodiments of the present invention provide a method of identifying a root cause in a distributed computing environment.
- the method of identifying a root cause in a distributed computing environment may include collecting metric data generated by each of a plurality of application components 1001 , collecting metric correlation relationship data that indicates a relationship between the metric data generated by the application components 1002 , collecting topology relationship data that indicates a spatial relationship between the application components 1003 , and collecting transaction tracking relationship data that indicates a group of the application components used to execute a requested transaction 1004 .
- a graph may be generated including a plurality of nodes corresponding to the application components by merging the metric correlation relationship data, the topology relationship data, and the transaction tracking relationship data 1005 .
- Target nodes may be identified among the plurality of nodes that correspond to application components having a throughput that is below a predefined threshold 1006 .
- a plurality of paths along the graph that include the target nodes may be traversed to identify at least one node corresponding to an abnormal application component 1007 .
- a recommendation list may be generated including the at least one abnormal application component 1008 .
- FIG. 11 illustrates exemplary confidence scores for a plurality of identified target nodes and an exemplary recommendation list corresponding to the plurality of identified target nodes according to exemplary embodiments of the present invention.
- the graph described in more detail above may be generated for the plurality of target nodes (e.g., nodes 1101 , 1102 , 1103 , 1104 and 1105 ).
- Each of the target nodes may be traversed to identify response times, latency, throughput and/or error counts and confidence scores may be determined for each of the nodes.
- a higher confidence score may indicate a higher likelihood that a particular node includes an error.
- the confidence scores may be used to identify a potentially abnormal node and the recommendation list may be generated.
- node 1104 may have a relatively high confidence score and node 1104 may be included in the recommendation list.
- node 1104 may be targeted for repair or maintenance.
- FIG. 12 illustrates an example of a computer system capable of implementing the methods according to exemplary embodiments of the present invention.
- the system and method of the present disclosure may be implemented in the form of a software application running on a computer system, for example, a mainframe, personal computer (PC), handheld computer, server, etc.
- the software application may be stored on a recording media locally accessible by the computer system and accessible via a hard wired or wireless connection to a network, for example, a local area network, or the Internet.
- the computer system referred to generally as system 1200 may include, for example, a central processing unit (CPU) 1201 , random access memory (RAM) 1204 , a printer interface 1210 , a display unit 1211 , a local area network (LAN) data transmission controller 1205 , a LAN interface 1206 , a network controller 1203 , an internal bus 1202 , and one or more input devices 1209 , for example, a keyboard, mouse etc.
- the system 1200 may be connected to a data storage device, for example, a hard disk, 1208 via a link 1207 .
- FIG. 13 illustrates an exemplary root cause scores for exemplary nodes in a distributed computing environment and exemplary weights for exemplary edges in the distributed computing environment according to an exemplary embodiment of the present invention.
- a distributed computing environment may include a plurality of servers or computers (e.g., servers 1301 , 1302 , 1303 , 1304 , 1305 and 1306 ).
- each of the plurality of servers e.g., servers 1301 , 1302 , 1303 , 1304 , 1305 and 1306
- the links or connections between servers may be referred to as edges.
- a confidence score or weight may be calculated for each edge.
- Communication between servers may be bidirectional, and weights may be determined in either direction of communication (e.g., between serve 1301 and downstream server 1302 , or between server 1302 and downstream server 1301 ).
- the weight may be determined according to the response time, latency or a rate of occurrence of abnormal events detected in a particular edge compared with the end user response time or the response time for the entire application.
- the response time, latency or rate of occurrence of abnormal events for each of the servers may be an indication of how likely a particular server contains an abnormality or is not functioning as desired.
- Root cause scores may be determined for each of the nodes.
- a higher root cause score may indicate a higher likelihood that a particular node includes an error.
- the root cause scores may be used to identify a potentially abnormal node and the recommendation list may be generated.
- node 1304 may have a relatively high root cause score and node 1304 may be included in the recommendation list.
- node 1304 may be targeted for repair or maintenance.
- bidirectional weights may be determined for each edge between each pair of neighboring serves, and the relative weights of each edge may be used to determine a root cause score for each server, node or component.
- each block in the flowchart or block diagrams may represent a module, segment, or portion of instructions, which comprises one or more executable instructions for implementing the specified logical function(s).
- the functions noted in the block may occur out of the order noted in the figures.
- two blocks shown in succession may, in fact, be executed substantially concurrently, or the blocks may sometimes be executed in the reverse order, depending upon the functionality involved.
- Cloud computing is a model of service delivery for enabling convenient, on-demand network access to a shared pool of configurable computing resources (e.g. networks, network bandwidth, servers, processing, memory, storage, applications, virtual machines, and services) that can be rapidly provisioned and released with minimal management effort or interaction with a provider of the service.
- This cloud model may include at least five characteristics, at least three service models, and at least four deployment models.
- On-demand self-service a cloud consumer can unilaterally provision computing capabilities, such as server time and network storage, as needed automatically without requiring human interaction with the service's provider.
- Resource pooling the provider's computing resources are pooled to serve multiple consumers using a multi-tenant model, with different physical and virtual resources dynamically assigned and reassigned according to demand. There is a sense of location independence in that the consumer generally has no control or knowledge over the exact location of the provided resources but may be able to specify location at a higher level of abstraction (e.g., country, state, or datacenter).
- Rapid elasticity capabilities can be rapidly and elastically provisioned, in some cases automatically, to quickly scale out and rapidly released to quickly scale in. To the consumer, the capabilities available for provisioning often appear to be unlimited and can be purchased in any quantity at any time.
Landscapes
- Engineering & Computer Science (AREA)
- Physics & Mathematics (AREA)
- Theoretical Computer Science (AREA)
- General Engineering & Computer Science (AREA)
- Computing Systems (AREA)
- General Physics & Mathematics (AREA)
- Quality & Reliability (AREA)
- Bioinformatics & Cheminformatics (AREA)
- Computer Hardware Design (AREA)
- Probability & Statistics with Applications (AREA)
- Evolutionary Biology (AREA)
- Bioinformatics & Computational Biology (AREA)
- Life Sciences & Earth Sciences (AREA)
- Mathematical Physics (AREA)
- Debugging And Monitoring (AREA)
Abstract
Description
Claims (15)
Priority Applications (1)
| Application Number | Priority Date | Filing Date | Title |
|---|---|---|---|
| US14/845,729 US10909018B2 (en) | 2015-09-04 | 2015-09-04 | System and method for end-to-end application root cause recommendation |
Applications Claiming Priority (1)
| Application Number | Priority Date | Filing Date | Title |
|---|---|---|---|
| US14/845,729 US10909018B2 (en) | 2015-09-04 | 2015-09-04 | System and method for end-to-end application root cause recommendation |
Publications (2)
| Publication Number | Publication Date |
|---|---|
| US20170068747A1 US20170068747A1 (en) | 2017-03-09 |
| US10909018B2 true US10909018B2 (en) | 2021-02-02 |
Family
ID=58189503
Family Applications (1)
| Application Number | Title | Priority Date | Filing Date |
|---|---|---|---|
| US14/845,729 Active 2036-12-28 US10909018B2 (en) | 2015-09-04 | 2015-09-04 | System and method for end-to-end application root cause recommendation |
Country Status (1)
| Country | Link |
|---|---|
| US (1) | US10909018B2 (en) |
Families Citing this family (14)
| Publication number | Priority date | Publication date | Assignee | Title |
|---|---|---|---|---|
| US9916229B2 (en) | 2015-10-14 | 2018-03-13 | International Business Machines Corporation | Decomposing application topology data into transaction tracking data |
| US10255128B2 (en) * | 2016-08-17 | 2019-04-09 | Red Hat, Inc. | Root cause candidate determination in multiple process systems |
| CN107729210B (en) * | 2017-09-29 | 2020-09-25 | 百度在线网络技术(北京)有限公司 | Distributed service cluster abnormity diagnosis method and device |
| CN110347544A (en) * | 2018-04-08 | 2019-10-18 | 微软技术许可有限责任公司 | Abnormal intellectual monitoring processing technique |
| WO2020082702A1 (en) * | 2018-10-24 | 2020-04-30 | Huawei Technologies Co., Ltd. | Objective driven dynamic object placement optimization |
| US10708221B1 (en) * | 2018-12-28 | 2020-07-07 | Juniper Networks, Inc. | Generating a natural name data structure to prevent duplicate network data associated with an asynchronous distributed network operating system |
| US11032396B2 (en) | 2019-05-17 | 2021-06-08 | Citrix Systems, Inc. | Systems and methods for managing client requests to access services provided by a data center |
| US11144435B1 (en) * | 2020-03-30 | 2021-10-12 | Bank Of America Corporation | Test case generation for software development using machine learning |
| US11036613B1 (en) * | 2020-03-30 | 2021-06-15 | Bank Of America Corporation | Regression analysis for software development and management using machine learning |
| CN112100201B (en) * | 2020-09-30 | 2024-02-06 | 东莞盟大集团有限公司 | Data monitoring method, device, equipment and storage medium based on big data technology |
| CN112860508B (en) * | 2021-01-13 | 2023-02-28 | 支付宝(杭州)信息技术有限公司 | Abnormal positioning method, device and equipment based on knowledge graph |
| US20220229903A1 (en) * | 2021-01-21 | 2022-07-21 | Intuit Inc. | Feature extraction and time series anomaly detection over dynamic graphs |
| US11586491B2 (en) | 2021-05-27 | 2023-02-21 | International Business Machines Corporation | Service issue source identification in an interconnected environment |
| CN113656270B (en) * | 2021-07-30 | 2024-03-08 | 招商银行股份有限公司 | Method, device, medium and computer program product for testing application performance |
Citations (61)
| Publication number | Priority date | Publication date | Assignee | Title |
|---|---|---|---|---|
| US20010052016A1 (en) | 1999-12-13 | 2001-12-13 | Skene Bryan D. | Method and system for balancing load distrubution on a wide area network |
| US6363477B1 (en) | 1998-08-28 | 2002-03-26 | 3Com Corporation | Method for analyzing network application flows in an encrypted environment |
| US20020111755A1 (en) | 2000-10-19 | 2002-08-15 | Tti-Team Telecom International Ltd. | Topology-based reasoning apparatus for root-cause analysis of network faults |
| US6442615B1 (en) | 1997-10-23 | 2002-08-27 | Telefonaktiebolaget Lm Ericsson (Publ) | System for traffic data evaluation of real network with dynamic routing utilizing virtual network modelling |
| US20030046390A1 (en) | 2000-05-05 | 2003-03-06 | Scott Ball | Systems and methods for construction multi-layer topological models of computer networks |
| US6707795B1 (en) | 1999-04-26 | 2004-03-16 | Nortel Networks Limited | Alarm correlation method and system |
| US20040073844A1 (en) | 1999-10-28 | 2004-04-15 | Unkle C. Richard | Method and apparatus for diagnosing difficult diagnose faults in a complex system |
| US20040218698A1 (en) | 2003-04-29 | 2004-11-04 | Telefonaktiebolaget Lm Ericsson | Method and apparatus for soft symbol scaling |
| US20050144314A1 (en) | 2003-11-21 | 2005-06-30 | Alcatel | Dynamic system for communicating network monitoring system data to destinations outside of the management system |
| US20050206513A1 (en) | 2004-03-17 | 2005-09-22 | Fallon Kenneth T | Voice remote command and control of a mapping security system |
| US20060007863A1 (en) | 2002-09-05 | 2006-01-12 | Siamak Naghian | Signal propagation delay routing |
| US7206972B2 (en) | 2003-01-09 | 2007-04-17 | Alcatel | Path commissioning analysis and diagnostic tool |
| US20080037562A1 (en) | 2000-12-30 | 2008-02-14 | Saleh Ali N | Method for routing information over a network employing centralized control |
| US20080114581A1 (en) | 2006-11-15 | 2008-05-15 | Gil Meir | Root cause analysis approach with candidate elimination using network virtualization |
| US20080222068A1 (en) * | 2007-03-06 | 2008-09-11 | Microsoft Corporation | Inferring Candidates that are Potentially Responsible for User-Perceptible Network Problems |
| US20080279101A1 (en) | 2007-05-07 | 2008-11-13 | Microsoft Corporation | Context-Based Routing in Multi-hop Networks |
| US20090018983A1 (en) * | 2007-07-13 | 2009-01-15 | El-Rafei Sherif M | Method and system for detecting anomalous process behavior |
| US7506195B2 (en) | 2002-12-26 | 2009-03-17 | Fujitsu Limited | Operation management method and operation management server |
| US20090086741A1 (en) | 2007-10-02 | 2009-04-02 | Microsoft Corporation | Uncovering the differences in backbone networks |
| US7580998B2 (en) | 2002-08-14 | 2009-08-25 | Alcatel-Lucent Canada Inc. | Method for describing problems in a telecommunications network |
| US7593936B2 (en) | 2003-08-11 | 2009-09-22 | Triumfant, Inc. | Systems and methods for automated computer support |
| US20100138694A1 (en) | 2008-11-25 | 2010-06-03 | Lockheed Martin Corporation | Root-Cause Analysis System And Associated Methods |
| US7818418B2 (en) | 2007-03-20 | 2010-10-19 | Computer Associates Think, Inc. | Automatic root cause analysis of performance problems using auto-baselining on aggregated performance metrics |
| US20100306305A1 (en) | 2009-05-28 | 2010-12-02 | Dehaan Michael Paul | Systems and methods for providing a complete view of large computing networks |
| US20110047262A1 (en) | 2009-08-19 | 2011-02-24 | Daniel Joseph Martin | System And Method For Circuit And Path Based Event Correlation |
| US7940716B2 (en) | 2005-07-01 | 2011-05-10 | Terahop Networks, Inc. | Maintaining information facilitating deterministic network routing |
| US8001527B1 (en) | 2004-12-21 | 2011-08-16 | Zenprise, Inc. | Automated root cause analysis of problems associated with software application deployments |
| US8023867B2 (en) | 2007-03-01 | 2011-09-20 | Ricoh Company, Ltd. | Magnet roller and method for the same, magnetic particle-support member, development device, process cartridge, and image forming apparatus |
| US8032867B2 (en) | 2007-06-05 | 2011-10-04 | Computer Associates Think, Inc. | Programmatic root cause analysis for application performance management |
| US20120086855A1 (en) * | 2010-10-07 | 2012-04-12 | Jianfeng Xu | Video content generation system, video content generation device, and storage media |
| US20120158933A1 (en) | 2010-12-17 | 2012-06-21 | Cisco Technology Inc. | Data Reporting Using Reporting Groups in a Computer Network |
| WO2012092256A1 (en) | 2010-12-30 | 2012-07-05 | American Power Conversion Corporation | System and method for root cause analysis |
| US8225291B2 (en) | 2008-01-04 | 2012-07-17 | International Business Machines Corporation | Automated detection of application performance bottlenecks |
| US20120185735A1 (en) | 2011-01-19 | 2012-07-19 | Oracle International Corporation | System and method for determining causes of performance problems within middleware systems |
| US20120300774A1 (en) | 2006-12-14 | 2012-11-29 | Rockstar Bidco, LP | Method and apparatus for exchanging routing information and establishing connectivity across multiple network areas |
| US20120331551A1 (en) | 2011-06-24 | 2012-12-27 | Koninklijke Kpn N.V. | Detecting Phishing Attempt from Packets Marked by Network Nodes |
| US8375370B2 (en) | 2008-07-23 | 2013-02-12 | International Business Machines Corporation | Application/service event root cause traceability causal and impact analyzer |
| US8423827B2 (en) | 2009-12-28 | 2013-04-16 | International Business Machines Corporation | Topology based correlation of threshold crossing alarms |
| US20130097463A1 (en) * | 2011-10-12 | 2013-04-18 | Vmware, Inc. | Method and apparatus for root cause and critical pattern prediction using virtual directed graphs |
| US20130117748A1 (en) | 2011-06-20 | 2013-05-09 | International Business Machines Corporation | Scalable group synthesis |
| US8463899B2 (en) | 2005-07-29 | 2013-06-11 | Bmc Software, Inc. | System, method and computer program product for optimized root cause analysis |
| US20130212440A1 (en) | 2012-02-13 | 2013-08-15 | Li-Raz Rom | System and method for virtual system management |
| US8553561B1 (en) | 2007-08-22 | 2013-10-08 | Marvell International Ltd. | Quality of service for mesh networks |
| WO2014088559A1 (en) | 2012-12-04 | 2014-06-12 | Hewlett-Packard Development Company, L.P. | Determining suspected root causes of anomalous network behavior |
| US9065743B2 (en) | 2009-12-24 | 2015-06-23 | At&T Intellectual Property I, L.P. | Determining connectivity in a failed network |
| US20150188783A1 (en) | 2013-12-30 | 2015-07-02 | Telefonaktiebolaget L M Ericsson (Publ) | Method and apparatus for detecting communities in a network |
| US9160628B2 (en) | 2008-03-17 | 2015-10-13 | Comcast Cable Communications, Llc | Representing and searching network multicast trees |
| US9160609B2 (en) | 2010-05-28 | 2015-10-13 | Futurewei Technologies, Inc. | Virtual Layer 2 and mechanism to make it scalable |
| US20160036725A1 (en) | 2014-07-31 | 2016-02-04 | Corent Technology, Inc. | Multi-Dimension Topology Mapper for SaaS Applications |
| US20160149771A1 (en) | 2014-11-21 | 2016-05-26 | Oracle International Corporation | Transparent orchestration and management of composite network functions |
| US20160162346A1 (en) | 2014-12-08 | 2016-06-09 | Alcatel-Lucent Usa, Inc. | Root cause analysis for service degradation in computer networks |
| US20160180093A1 (en) | 2014-12-23 | 2016-06-23 | Nathaniel J. Goss | Provisioning location-based security policy |
| US20160224400A1 (en) | 2015-01-29 | 2016-08-04 | AppDynamics Inc. | Automatic root cause analysis for distributed business transaction |
| US9418088B1 (en) | 2015-12-02 | 2016-08-16 | International Business Machines Corporation | Identification of storage system elements causing performance degradation |
| US20170075744A1 (en) | 2015-09-11 | 2017-03-16 | International Business Machines Corporation | Identifying root causes of failures in a deployed distributed application using historical fine grained machine state data |
| US20170093645A1 (en) | 2015-09-21 | 2017-03-30 | Splunk Inc. | Displaying Interactive Topology Maps Of Cloud Computing Resources |
| US20170155570A1 (en) | 2015-12-01 | 2017-06-01 | Linkedin Corporation | Analysis of site speed performance anomalies caused by server-side issues |
| US20170284839A1 (en) | 2014-09-04 | 2017-10-05 | Pcms Holdings, Inc. | System and method for sensor network organization based on contextual event detection |
| US9882782B2 (en) | 2015-03-26 | 2018-01-30 | Utopus Insights, Inc. | Network management using hierarchical and multi-scenario graphs |
| US9954765B2 (en) | 2016-01-08 | 2018-04-24 | Telefonaktiebolaget Lm Ericsson (Publ) | Graph construction for computed spring multicast |
| US20180197327A1 (en) | 2017-01-11 | 2018-07-12 | Adobe Systems Incorporated | Light Path Correlation in Digital Image Rendering of a Digital scene |
-
2015
- 2015-09-04 US US14/845,729 patent/US10909018B2/en active Active
Patent Citations (64)
| Publication number | Priority date | Publication date | Assignee | Title |
|---|---|---|---|---|
| US6442615B1 (en) | 1997-10-23 | 2002-08-27 | Telefonaktiebolaget Lm Ericsson (Publ) | System for traffic data evaluation of real network with dynamic routing utilizing virtual network modelling |
| US6363477B1 (en) | 1998-08-28 | 2002-03-26 | 3Com Corporation | Method for analyzing network application flows in an encrypted environment |
| US6707795B1 (en) | 1999-04-26 | 2004-03-16 | Nortel Networks Limited | Alarm correlation method and system |
| US20040073844A1 (en) | 1999-10-28 | 2004-04-15 | Unkle C. Richard | Method and apparatus for diagnosing difficult diagnose faults in a complex system |
| US20010052016A1 (en) | 1999-12-13 | 2001-12-13 | Skene Bryan D. | Method and system for balancing load distrubution on a wide area network |
| US20030046390A1 (en) | 2000-05-05 | 2003-03-06 | Scott Ball | Systems and methods for construction multi-layer topological models of computer networks |
| US20020111755A1 (en) | 2000-10-19 | 2002-08-15 | Tti-Team Telecom International Ltd. | Topology-based reasoning apparatus for root-cause analysis of network faults |
| US20080037562A1 (en) | 2000-12-30 | 2008-02-14 | Saleh Ali N | Method for routing information over a network employing centralized control |
| US7580998B2 (en) | 2002-08-14 | 2009-08-25 | Alcatel-Lucent Canada Inc. | Method for describing problems in a telecommunications network |
| US20060007863A1 (en) | 2002-09-05 | 2006-01-12 | Siamak Naghian | Signal propagation delay routing |
| US7506195B2 (en) | 2002-12-26 | 2009-03-17 | Fujitsu Limited | Operation management method and operation management server |
| US7206972B2 (en) | 2003-01-09 | 2007-04-17 | Alcatel | Path commissioning analysis and diagnostic tool |
| US7239677B2 (en) | 2003-04-29 | 2007-07-03 | Telefonaktiebolaget L M Ericsson (Publ) | Method and apparatus for soft symbol scaling |
| US20040218698A1 (en) | 2003-04-29 | 2004-11-04 | Telefonaktiebolaget Lm Ericsson | Method and apparatus for soft symbol scaling |
| US7593936B2 (en) | 2003-08-11 | 2009-09-22 | Triumfant, Inc. | Systems and methods for automated computer support |
| US20050144314A1 (en) | 2003-11-21 | 2005-06-30 | Alcatel | Dynamic system for communicating network monitoring system data to destinations outside of the management system |
| US20050206513A1 (en) | 2004-03-17 | 2005-09-22 | Fallon Kenneth T | Voice remote command and control of a mapping security system |
| US8001527B1 (en) | 2004-12-21 | 2011-08-16 | Zenprise, Inc. | Automated root cause analysis of problems associated with software application deployments |
| US7940716B2 (en) | 2005-07-01 | 2011-05-10 | Terahop Networks, Inc. | Maintaining information facilitating deterministic network routing |
| US8463899B2 (en) | 2005-07-29 | 2013-06-11 | Bmc Software, Inc. | System, method and computer program product for optimized root cause analysis |
| US20080114581A1 (en) | 2006-11-15 | 2008-05-15 | Gil Meir | Root cause analysis approach with candidate elimination using network virtualization |
| US20120300774A1 (en) | 2006-12-14 | 2012-11-29 | Rockstar Bidco, LP | Method and apparatus for exchanging routing information and establishing connectivity across multiple network areas |
| US8023867B2 (en) | 2007-03-01 | 2011-09-20 | Ricoh Company, Ltd. | Magnet roller and method for the same, magnetic particle-support member, development device, process cartridge, and image forming apparatus |
| US20080222068A1 (en) * | 2007-03-06 | 2008-09-11 | Microsoft Corporation | Inferring Candidates that are Potentially Responsible for User-Perceptible Network Problems |
| US7818418B2 (en) | 2007-03-20 | 2010-10-19 | Computer Associates Think, Inc. | Automatic root cause analysis of performance problems using auto-baselining on aggregated performance metrics |
| US20080279101A1 (en) | 2007-05-07 | 2008-11-13 | Microsoft Corporation | Context-Based Routing in Multi-hop Networks |
| US8032867B2 (en) | 2007-06-05 | 2011-10-04 | Computer Associates Think, Inc. | Programmatic root cause analysis for application performance management |
| US20090018983A1 (en) * | 2007-07-13 | 2009-01-15 | El-Rafei Sherif M | Method and system for detecting anomalous process behavior |
| US8553561B1 (en) | 2007-08-22 | 2013-10-08 | Marvell International Ltd. | Quality of service for mesh networks |
| US20090086741A1 (en) | 2007-10-02 | 2009-04-02 | Microsoft Corporation | Uncovering the differences in backbone networks |
| US8225291B2 (en) | 2008-01-04 | 2012-07-17 | International Business Machines Corporation | Automated detection of application performance bottlenecks |
| US9160628B2 (en) | 2008-03-17 | 2015-10-13 | Comcast Cable Communications, Llc | Representing and searching network multicast trees |
| US8375370B2 (en) | 2008-07-23 | 2013-02-12 | International Business Machines Corporation | Application/service event root cause traceability causal and impact analyzer |
| US20100138694A1 (en) | 2008-11-25 | 2010-06-03 | Lockheed Martin Corporation | Root-Cause Analysis System And Associated Methods |
| US20100306305A1 (en) | 2009-05-28 | 2010-12-02 | Dehaan Michael Paul | Systems and methods for providing a complete view of large computing networks |
| US20110047262A1 (en) | 2009-08-19 | 2011-02-24 | Daniel Joseph Martin | System And Method For Circuit And Path Based Event Correlation |
| US9065743B2 (en) | 2009-12-24 | 2015-06-23 | At&T Intellectual Property I, L.P. | Determining connectivity in a failed network |
| US8423827B2 (en) | 2009-12-28 | 2013-04-16 | International Business Machines Corporation | Topology based correlation of threshold crossing alarms |
| US9160609B2 (en) | 2010-05-28 | 2015-10-13 | Futurewei Technologies, Inc. | Virtual Layer 2 and mechanism to make it scalable |
| US20120086855A1 (en) * | 2010-10-07 | 2012-04-12 | Jianfeng Xu | Video content generation system, video content generation device, and storage media |
| US20120158933A1 (en) | 2010-12-17 | 2012-06-21 | Cisco Technology Inc. | Data Reporting Using Reporting Groups in a Computer Network |
| WO2012092256A1 (en) | 2010-12-30 | 2012-07-05 | American Power Conversion Corporation | System and method for root cause analysis |
| US20120185735A1 (en) | 2011-01-19 | 2012-07-19 | Oracle International Corporation | System and method for determining causes of performance problems within middleware systems |
| US20130117748A1 (en) | 2011-06-20 | 2013-05-09 | International Business Machines Corporation | Scalable group synthesis |
| US20120331551A1 (en) | 2011-06-24 | 2012-12-27 | Koninklijke Kpn N.V. | Detecting Phishing Attempt from Packets Marked by Network Nodes |
| US20130097463A1 (en) * | 2011-10-12 | 2013-04-18 | Vmware, Inc. | Method and apparatus for root cause and critical pattern prediction using virtual directed graphs |
| US8751867B2 (en) | 2011-10-12 | 2014-06-10 | Vmware, Inc. | Method and apparatus for root cause and critical pattern prediction using virtual directed graphs |
| US20130212440A1 (en) | 2012-02-13 | 2013-08-15 | Li-Raz Rom | System and method for virtual system management |
| WO2014088559A1 (en) | 2012-12-04 | 2014-06-12 | Hewlett-Packard Development Company, L.P. | Determining suspected root causes of anomalous network behavior |
| US20150188783A1 (en) | 2013-12-30 | 2015-07-02 | Telefonaktiebolaget L M Ericsson (Publ) | Method and apparatus for detecting communities in a network |
| US20160036725A1 (en) | 2014-07-31 | 2016-02-04 | Corent Technology, Inc. | Multi-Dimension Topology Mapper for SaaS Applications |
| US20170284839A1 (en) | 2014-09-04 | 2017-10-05 | Pcms Holdings, Inc. | System and method for sensor network organization based on contextual event detection |
| US20160149771A1 (en) | 2014-11-21 | 2016-05-26 | Oracle International Corporation | Transparent orchestration and management of composite network functions |
| US20160162346A1 (en) | 2014-12-08 | 2016-06-09 | Alcatel-Lucent Usa, Inc. | Root cause analysis for service degradation in computer networks |
| US20160180093A1 (en) | 2014-12-23 | 2016-06-23 | Nathaniel J. Goss | Provisioning location-based security policy |
| US20160224400A1 (en) | 2015-01-29 | 2016-08-04 | AppDynamics Inc. | Automatic root cause analysis for distributed business transaction |
| US9882782B2 (en) | 2015-03-26 | 2018-01-30 | Utopus Insights, Inc. | Network management using hierarchical and multi-scenario graphs |
| US20170075744A1 (en) | 2015-09-11 | 2017-03-16 | International Business Machines Corporation | Identifying root causes of failures in a deployed distributed application using historical fine grained machine state data |
| US20170093645A1 (en) | 2015-09-21 | 2017-03-30 | Splunk Inc. | Displaying Interactive Topology Maps Of Cloud Computing Resources |
| US20170155570A1 (en) | 2015-12-01 | 2017-06-01 | Linkedin Corporation | Analysis of site speed performance anomalies caused by server-side issues |
| US9418088B1 (en) | 2015-12-02 | 2016-08-16 | International Business Machines Corporation | Identification of storage system elements causing performance degradation |
| US20170161131A1 (en) | 2015-12-02 | 2017-06-08 | International Business Machines Corporation | Identification of storage system elements causing performance degradation |
| US9954765B2 (en) | 2016-01-08 | 2018-04-24 | Telefonaktiebolaget Lm Ericsson (Publ) | Graph construction for computed spring multicast |
| US20180197327A1 (en) | 2017-01-11 | 2018-07-12 | Adobe Systems Incorporated | Light Path Correlation in Digital Image Rendering of a Digital scene |
Non-Patent Citations (8)
| Title |
|---|
| Kim et al. "Root Cause Detection in a Service-Oriented Architecture" SIMETRICS' 13, Jun. 17-21, 2013 Pittsburgh, PA USA ACM. * |
| Kim et al. "Root Cause Detection in a Service-Oriented Architecture" SIMETRICS' 13, Jun. 17-21, 2013 Pittsburgh, PA USA. * |
| Mazda A. Marvasti, et al., "An Anomaly Event Correlation Engine: Identifying Root Causes, Bottlenecks, and Black Swans in it Environements", VMware Technical Journal, 2013, pp. 1-34. |
| Myunghwan Kim et al., "Root Cause Detection in a Service-Oriented Architecture", SIGMETRICS' 13, Jun. 17-21, Pittsburgh, PA, USA. |
| Notice of Allowance dated Jan. 28, 2019 in co-related U.S. Appl. No. 14/845,667. |
| Office Action dated Jun. 28, 2018 in co-related U.S. Appl. No. 14/845,667 (19 pages). |
| Office Action dated Mar. 22, 2018 in co-related U.S. Appl. No. 14/845,667. |
| Office Action dated Oct. 5. 2017, in U.S. Appl. No. 14/845,667. |
Also Published As
| Publication number | Publication date |
|---|---|
| US20170068747A1 (en) | 2017-03-09 |
Similar Documents
| Publication | Publication Date | Title |
|---|---|---|
| US10909018B2 (en) | System and method for end-to-end application root cause recommendation | |
| US10318366B2 (en) | System and method for relationship based root cause recommendation | |
| US9672085B2 (en) | Adaptive fault diagnosis | |
| CN112988398B (en) | Micro-service dynamic scaling and migration method and device | |
| US11537940B2 (en) | Systems and methods for unsupervised anomaly detection using non-parametric tolerance intervals over a sliding window of t-digests | |
| US11138058B2 (en) | Hierarchical fault determination in an application performance management system | |
| US10783002B1 (en) | Cost determination of a service call | |
| US20180123922A1 (en) | Correlating performance outliers and network performance impacting event metric | |
| US10411969B2 (en) | Backend resource costs for online service offerings | |
| US11265231B2 (en) | Real-time ranking of monitored entities | |
| US10942801B2 (en) | Application performance management system with collective learning | |
| US10713591B2 (en) | Adaptive metric pruning | |
| Barve et al. | Fecbench: A holistic interference-aware approach for application performance modeling | |
| US11153183B2 (en) | Compacted messaging for application performance management system | |
| CN113220534A (en) | Cluster multi-dimensional anomaly monitoring method, device, equipment and storage medium | |
| WO2015171860A1 (en) | Automatic alert generation | |
| US11423326B2 (en) | Using machine-learning methods to facilitate experimental evaluation of modifications to a computational environment within a distributed system | |
| US10644971B2 (en) | Graph search in structured query language style query | |
| US10848371B2 (en) | User interface for an application performance management system | |
| Xu et al. | Modelling cloud service latency and availability using a deep learning strategy | |
| AU2014200806B1 (en) | Adaptive fault diagnosis | |
| US10235262B2 (en) | Recognition of operational elements by fingerprint in an application performance management system | |
| US20240291718A1 (en) | Predictive Analytics For Network Topology Subsets | |
| US11516234B1 (en) | In-process correlation through class field injection | |
| US20230362079A1 (en) | Anomaly Detection for Cloud Computing Platforms |
Legal Events
| Date | Code | Title | Description |
|---|---|---|---|
| AS | Assignment |
Owner name: INTERNATIONAL BUSINESS MACHINES CORPORATION, NEW YORK Free format text: ASSIGNMENT OF ASSIGNORS INTEREST;ASSIGNORS:QI, YAO DONG;WANG, LAN JUN;WU, HAI SHAN;AND OTHERS;REEL/FRAME:036495/0319 Effective date: 20150730 Owner name: INTERNATIONAL BUSINESS MACHINES CORPORATION, NEW Y Free format text: ASSIGNMENT OF ASSIGNORS INTEREST;ASSIGNORS:QI, YAO DONG;WANG, LAN JUN;WU, HAI SHAN;AND OTHERS;REEL/FRAME:036495/0319 Effective date: 20150730 |
|
| STPP | Information on status: patent application and granting procedure in general |
Free format text: DOCKETED NEW CASE - READY FOR EXAMINATION |
|
| STPP | Information on status: patent application and granting procedure in general |
Free format text: NON FINAL ACTION MAILED |
|
| STPP | Information on status: patent application and granting procedure in general |
Free format text: RESPONSE TO NON-FINAL OFFICE ACTION ENTERED AND FORWARDED TO EXAMINER |
|
| STPP | Information on status: patent application and granting procedure in general |
Free format text: FINAL REJECTION MAILED |
|
| STPP | Information on status: patent application and granting procedure in general |
Free format text: ADVISORY ACTION MAILED |
|
| STPP | Information on status: patent application and granting procedure in general |
Free format text: DOCKETED NEW CASE - READY FOR EXAMINATION |
|
| STPP | Information on status: patent application and granting procedure in general |
Free format text: NOTICE OF ALLOWANCE MAILED -- APPLICATION RECEIVED IN OFFICE OF PUBLICATIONS |
|
| STPP | Information on status: patent application and granting procedure in general |
Free format text: PUBLICATIONS -- ISSUE FEE PAYMENT VERIFIED |
|
| STCF | Information on status: patent grant |
Free format text: PATENTED CASE |