EP1565566B1 - Proteinsynthese-monitoring (psm) - Google Patents
Proteinsynthese-monitoring (psm) Download PDFInfo
- Publication number
- EP1565566B1 EP1565566B1 EP03775772.1A EP03775772A EP1565566B1 EP 1565566 B1 EP1565566 B1 EP 1565566B1 EP 03775772 A EP03775772 A EP 03775772A EP 1565566 B1 EP1565566 B1 EP 1565566B1
- Authority
- EP
- European Patent Office
- Prior art keywords
- protein
- ribosomal
- trna
- fret
- cell
- Prior art date
- Legal status (The legal status is an assumption and is not a legal conclusion. Google has not performed a legal analysis and makes no representation as to the accuracy of the status listed.)
- Expired - Lifetime
Links
- 230000014616 translation Effects 0.000 title claims description 152
- 238000001243 protein synthesis Methods 0.000 title claims description 87
- 238000012544 monitoring process Methods 0.000 title claims description 55
- 108090000623 proteins and genes Proteins 0.000 claims description 232
- 102000004169 proteins and genes Human genes 0.000 claims description 226
- 238000000034 method Methods 0.000 claims description 178
- 210000004027 cell Anatomy 0.000 claims description 135
- 238000002866 fluorescence resonance energy transfer Methods 0.000 claims description 112
- 210000003705 ribosome Anatomy 0.000 claims description 111
- 150000001875 compounds Chemical class 0.000 claims description 50
- 239000002096 quantum dot Substances 0.000 claims description 45
- 238000013519 translation Methods 0.000 claims description 40
- 238000004458 analytical method Methods 0.000 claims description 38
- 238000000338 in vitro Methods 0.000 claims description 38
- 108090000765 processed proteins & peptides Proteins 0.000 claims description 34
- 238000001514 detection method Methods 0.000 claims description 32
- 102000002278 Ribosomal Proteins Human genes 0.000 claims description 31
- 108010000605 Ribosomal Proteins Proteins 0.000 claims description 31
- 230000008569 process Effects 0.000 claims description 29
- 108010076504 Protein Sorting Signals Proteins 0.000 claims description 25
- 239000007850 fluorescent dye Substances 0.000 claims description 25
- 241000894006 Bacteria Species 0.000 claims description 21
- 230000037361 pathway Effects 0.000 claims description 18
- 108091006047 fluorescent proteins Proteins 0.000 claims description 17
- 102000034287 fluorescent proteins Human genes 0.000 claims description 17
- 230000001413 cellular effect Effects 0.000 claims description 16
- 230000003993 interaction Effects 0.000 claims description 16
- 230000005855 radiation Effects 0.000 claims description 16
- 238000012546 transfer Methods 0.000 claims description 15
- 108090000792 Ribosomal protein L1 Proteins 0.000 claims description 13
- 102000004191 Ribosomal protein L1 Human genes 0.000 claims description 13
- 230000003161 proteinsynthetic effect Effects 0.000 claims description 13
- 230000001580 bacterial effect Effects 0.000 claims description 11
- 238000004113 cell culture Methods 0.000 claims description 11
- 238000012545 processing Methods 0.000 claims description 11
- 230000005670 electromagnetic radiation Effects 0.000 claims description 10
- 230000004044 response Effects 0.000 claims description 10
- 238000005259 measurement Methods 0.000 claims description 9
- 108010033826 ribosomal protein S1 Proteins 0.000 claims description 9
- 230000014509 gene expression Effects 0.000 claims description 8
- 108020004418 ribosomal RNA Proteins 0.000 claims description 6
- 230000001131 transforming effect Effects 0.000 claims description 4
- 230000001575 pathological effect Effects 0.000 claims description 3
- 230000001678 irradiating effect Effects 0.000 claims description 2
- 235000018102 proteins Nutrition 0.000 description 201
- 108020004566 Transfer RNA Proteins 0.000 description 197
- 150000001413 amino acids Chemical class 0.000 description 93
- 235000001014 amino acid Nutrition 0.000 description 87
- 238000002372 labelling Methods 0.000 description 83
- 239000000370 acceptor Substances 0.000 description 79
- 108020004999 messenger RNA Proteins 0.000 description 51
- 238000000386 microscopy Methods 0.000 description 45
- 230000005284 excitation Effects 0.000 description 42
- 230000015572 biosynthetic process Effects 0.000 description 37
- 238000001727 in vivo Methods 0.000 description 36
- 238000003786 synthesis reaction Methods 0.000 description 36
- 108020004705 Codon Proteins 0.000 description 28
- 239000000523 sample Substances 0.000 description 27
- 238000003556 assay Methods 0.000 description 26
- 239000000975 dye Substances 0.000 description 26
- 241000588724 Escherichia coli Species 0.000 description 25
- 241000894007 species Species 0.000 description 24
- 238000005516 engineering process Methods 0.000 description 23
- 230000000694 effects Effects 0.000 description 22
- 230000003287 optical effect Effects 0.000 description 22
- WGTODYJZXSJIAG-UHFFFAOYSA-N tetramethylrhodamine chloride Chemical compound [Cl-].C=12C=CC(N(C)C)=CC2=[O+]C2=CC(N(C)C)=CC=C2C=1C1=CC=CC=C1C(O)=O WGTODYJZXSJIAG-UHFFFAOYSA-N 0.000 description 22
- 238000005286 illumination Methods 0.000 description 21
- 108091060545 Nonsense suppressor Proteins 0.000 description 20
- 238000004519 manufacturing process Methods 0.000 description 20
- 238000012216 screening Methods 0.000 description 19
- TWRXJAOTZQYOKJ-UHFFFAOYSA-L Magnesium chloride Chemical compound [Mg+2].[Cl-].[Cl-] TWRXJAOTZQYOKJ-UHFFFAOYSA-L 0.000 description 18
- 239000003814 drug Substances 0.000 description 18
- 229940079593 drug Drugs 0.000 description 17
- 239000003550 marker Substances 0.000 description 17
- YBJHBAHKTGYVGT-ZKWXMUAHSA-N (+)-Biotin Chemical compound N1C(=O)N[C@@H]2[C@H](CCCCC(=O)O)SC[C@@H]21 YBJHBAHKTGYVGT-ZKWXMUAHSA-N 0.000 description 16
- 238000003384 imaging method Methods 0.000 description 16
- 230000027455 binding Effects 0.000 description 15
- 238000002474 experimental method Methods 0.000 description 15
- 102000004196 processed proteins & peptides Human genes 0.000 description 15
- 108020004414 DNA Proteins 0.000 description 14
- 239000000872 buffer Substances 0.000 description 14
- 239000000499 gel Substances 0.000 description 14
- 229920001184 polypeptide Polymers 0.000 description 14
- 238000011160 research Methods 0.000 description 14
- 108091032973 (ribonucleotides)n+m Proteins 0.000 description 13
- 230000008901 benefit Effects 0.000 description 13
- MHMNJMPURVTYEJ-UHFFFAOYSA-N fluorescein-5-isothiocyanate Chemical compound O1C(=O)C2=CC(N=C=S)=CC=C2C21C1=CC=C(O)C=C1OC1=CC(O)=CC=C21 MHMNJMPURVTYEJ-UHFFFAOYSA-N 0.000 description 13
- 108020001507 fusion proteins Proteins 0.000 description 13
- 102000037865 fusion proteins Human genes 0.000 description 13
- 108020005098 Anticodon Proteins 0.000 description 12
- 230000007246 mechanism Effects 0.000 description 11
- 239000002202 Polyethylene glycol Substances 0.000 description 10
- 238000001215 fluorescent labelling Methods 0.000 description 10
- 239000005090 green fluorescent protein Substances 0.000 description 10
- 238000013537 high throughput screening Methods 0.000 description 10
- 239000002773 nucleotide Substances 0.000 description 10
- 125000003729 nucleotide group Chemical group 0.000 description 10
- 229920001223 polyethylene glycol Polymers 0.000 description 10
- 238000004088 simulation Methods 0.000 description 10
- 238000004557 single molecule detection Methods 0.000 description 10
- NLXLAEXVIDQMFP-UHFFFAOYSA-N Ammonia chloride Chemical compound [NH4+].[Cl-] NLXLAEXVIDQMFP-UHFFFAOYSA-N 0.000 description 9
- LFQSCWFLJHTTHZ-UHFFFAOYSA-N Ethanol Chemical compound CCO LFQSCWFLJHTTHZ-UHFFFAOYSA-N 0.000 description 9
- 108010043121 Green Fluorescent Proteins Proteins 0.000 description 9
- 102000004144 Green Fluorescent Proteins Human genes 0.000 description 9
- COLNVLDHVKWLRT-QMMMGPOBSA-N L-phenylalanine Chemical compound OC(=O)[C@@H](N)CC1=CC=CC=C1 COLNVLDHVKWLRT-QMMMGPOBSA-N 0.000 description 9
- 108010090804 Streptavidin Proteins 0.000 description 9
- 125000000266 alpha-aminoacyl group Chemical group 0.000 description 9
- 238000013459 approach Methods 0.000 description 9
- 201000010099 disease Diseases 0.000 description 9
- 208000037265 diseases, disorders, signs and symptoms Diseases 0.000 description 9
- 230000006870 function Effects 0.000 description 9
- 229910001629 magnesium chloride Inorganic materials 0.000 description 9
- 238000002360 preparation method Methods 0.000 description 9
- 239000000243 solution Substances 0.000 description 9
- QKNYBSVHEMOAJP-UHFFFAOYSA-N 2-amino-2-(hydroxymethyl)propane-1,3-diol;hydron;chloride Chemical compound Cl.OCC(N)(CO)CO QKNYBSVHEMOAJP-UHFFFAOYSA-N 0.000 description 8
- ZLOIGESWDJYCTF-UHFFFAOYSA-N 4-Thiouridine Natural products OC1C(O)C(CO)OC1N1C(=O)NC(=S)C=C1 ZLOIGESWDJYCTF-UHFFFAOYSA-N 0.000 description 8
- ZLOIGESWDJYCTF-XVFCMESISA-N 4-thiouridine Chemical compound O[C@@H]1[C@H](O)[C@@H](CO)O[C@H]1N1C(=O)NC(=S)C=C1 ZLOIGESWDJYCTF-XVFCMESISA-N 0.000 description 8
- 108090000364 Ligases Proteins 0.000 description 8
- 102000003960 Ligases Human genes 0.000 description 8
- 108010026552 Proteome Proteins 0.000 description 8
- 229960002685 biotin Drugs 0.000 description 8
- 235000020958 biotin Nutrition 0.000 description 8
- 239000011616 biotin Substances 0.000 description 8
- 238000000423 cell based assay Methods 0.000 description 8
- COLNVLDHVKWLRT-UHFFFAOYSA-N phenylalanine Natural products OC(=O)C(N)CC1=CC=CC=C1 COLNVLDHVKWLRT-UHFFFAOYSA-N 0.000 description 8
- 239000000047 product Substances 0.000 description 8
- 238000005070 sampling Methods 0.000 description 8
- 239000000126 substance Substances 0.000 description 8
- 241000282414 Homo sapiens Species 0.000 description 7
- 240000004808 Saccharomyces cerevisiae Species 0.000 description 7
- 235000014680 Saccharomyces cerevisiae Nutrition 0.000 description 7
- 238000001962 electrophoresis Methods 0.000 description 7
- 239000010445 mica Substances 0.000 description 7
- 229910052618 mica group Inorganic materials 0.000 description 7
- 230000004850 protein–protein interaction Effects 0.000 description 7
- 238000000926 separation method Methods 0.000 description 7
- FAPWRFPIFSIZLT-UHFFFAOYSA-M Sodium chloride Chemical compound [Na+].[Cl-] FAPWRFPIFSIZLT-UHFFFAOYSA-M 0.000 description 6
- 108091005948 blue fluorescent proteins Proteins 0.000 description 6
- 238000004624 confocal microscopy Methods 0.000 description 6
- 239000011521 glass Substances 0.000 description 6
- RAXXELZNTBOGNW-UHFFFAOYSA-N imidazole Natural products C1=CNC=N1 RAXXELZNTBOGNW-UHFFFAOYSA-N 0.000 description 6
- 238000011534 incubation Methods 0.000 description 6
- 230000000670 limiting effect Effects 0.000 description 6
- 230000033001 locomotion Effects 0.000 description 6
- 230000004048 modification Effects 0.000 description 6
- 238000012986 modification Methods 0.000 description 6
- SCVFZCLFOSHCOH-UHFFFAOYSA-M potassium acetate Chemical compound [K+].CC([O-])=O SCVFZCLFOSHCOH-UHFFFAOYSA-M 0.000 description 6
- 238000012552 review Methods 0.000 description 6
- 239000010936 titanium Substances 0.000 description 6
- 101710201279 Biotin carboxyl carrier protein Proteins 0.000 description 5
- 102000004190 Enzymes Human genes 0.000 description 5
- 108090000790 Enzymes Proteins 0.000 description 5
- 108020005038 Terminator Codon Proteins 0.000 description 5
- 238000006243 chemical reaction Methods 0.000 description 5
- 230000000875 corresponding effect Effects 0.000 description 5
- 230000018109 developmental process Effects 0.000 description 5
- 238000010586 diagram Methods 0.000 description 5
- 238000009509 drug development Methods 0.000 description 5
- 229940088598 enzyme Drugs 0.000 description 5
- GNBHRKFJIUUOQI-UHFFFAOYSA-N fluorescein Chemical class O1C(=O)C2=CC=CC=C2C21C1=CC=C(O)C=C1OC1=CC(O)=CC=C21 GNBHRKFJIUUOQI-UHFFFAOYSA-N 0.000 description 5
- 230000007274 generation of a signal involved in cell-cell signaling Effects 0.000 description 5
- 238000010348 incorporation Methods 0.000 description 5
- 108020004707 nucleic acids Proteins 0.000 description 5
- 102000039446 nucleic acids Human genes 0.000 description 5
- 150000007523 nucleic acids Chemical class 0.000 description 5
- 238000000746 purification Methods 0.000 description 5
- 102000005962 receptors Human genes 0.000 description 5
- 108020003175 receptors Proteins 0.000 description 5
- 238000013518 transcription Methods 0.000 description 5
- 230000035897 transcription Effects 0.000 description 5
- QIVBCDIJIAJPQS-VIFPVBQESA-N L-tryptophane Chemical compound C1=CC=C2C(C[C@H](N)C(O)=O)=CNC2=C1 QIVBCDIJIAJPQS-VIFPVBQESA-N 0.000 description 4
- OUYCCCASQSFEME-QMMMGPOBSA-N L-tyrosine Chemical compound OC(=O)[C@@H](N)CC1=CC=C(O)C=C1 OUYCCCASQSFEME-QMMMGPOBSA-N 0.000 description 4
- ISWSIDIOOBJBQZ-UHFFFAOYSA-N Phenol Chemical compound OC1=CC=CC=C1 ISWSIDIOOBJBQZ-UHFFFAOYSA-N 0.000 description 4
- 206010036618 Premenstrual syndrome Diseases 0.000 description 4
- QIVBCDIJIAJPQS-UHFFFAOYSA-N Tryptophan Natural products C1=CC=C2C(CC(N)C(O)=O)=CNC2=C1 QIVBCDIJIAJPQS-UHFFFAOYSA-N 0.000 description 4
- 125000003275 alpha amino acid group Chemical group 0.000 description 4
- ZYGHJZDHTFUPRJ-UHFFFAOYSA-N coumarin Chemical compound C1=CC=C2OC(=O)C=CC2=C1 ZYGHJZDHTFUPRJ-UHFFFAOYSA-N 0.000 description 4
- 239000013078 crystal Substances 0.000 description 4
- 125000000151 cysteine group Chemical class N[C@@H](CS)C(=O)* 0.000 description 4
- 230000001419 dependent effect Effects 0.000 description 4
- 238000011161 development Methods 0.000 description 4
- 238000009826 distribution Methods 0.000 description 4
- 229940000406 drug candidate Drugs 0.000 description 4
- 238000000295 emission spectrum Methods 0.000 description 4
- 238000012869 ethanol precipitation Methods 0.000 description 4
- 238000000695 excitation spectrum Methods 0.000 description 4
- 230000004927 fusion Effects 0.000 description 4
- 239000003068 molecular probe Substances 0.000 description 4
- 238000005457 optimization Methods 0.000 description 4
- YBYRMVIVWMBXKQ-UHFFFAOYSA-N phenylmethanesulfonyl fluoride Chemical compound FS(=O)(=O)CC1=CC=CC=C1 YBYRMVIVWMBXKQ-UHFFFAOYSA-N 0.000 description 4
- 239000013612 plasmid Substances 0.000 description 4
- 230000006916 protein interaction Effects 0.000 description 4
- 239000011541 reaction mixture Substances 0.000 description 4
- 238000001525 receptor binding assay Methods 0.000 description 4
- 230000009467 reduction Effects 0.000 description 4
- 238000007423 screening assay Methods 0.000 description 4
- 230000035945 sensitivity Effects 0.000 description 4
- 230000003595 spectral effect Effects 0.000 description 4
- 239000006228 supernatant Substances 0.000 description 4
- 210000001519 tissue Anatomy 0.000 description 4
- OUYCCCASQSFEME-UHFFFAOYSA-N tyrosine Natural products OC(=O)C(N)CC1=CC=C(O)C=C1 OUYCCCASQSFEME-UHFFFAOYSA-N 0.000 description 4
- 241000206602 Eukaryota Species 0.000 description 3
- PEDCQBHIVMGVHV-UHFFFAOYSA-N Glycerine Chemical compound OCC(O)CO PEDCQBHIVMGVHV-UHFFFAOYSA-N 0.000 description 3
- 108091006054 His-tagged proteins Proteins 0.000 description 3
- KDXKERNSBIXSRK-UHFFFAOYSA-N Lysine Natural products NCCCCC(N)C(O)=O KDXKERNSBIXSRK-UHFFFAOYSA-N 0.000 description 3
- ZMXDDKWLCZADIW-UHFFFAOYSA-N N,N-Dimethylformamide Chemical compound CN(C)C=O ZMXDDKWLCZADIW-UHFFFAOYSA-N 0.000 description 3
- 101710132701 Protein L1 Proteins 0.000 description 3
- VYPSYNLAJGMNEJ-UHFFFAOYSA-N Silicium dioxide Chemical compound O=[Si]=O VYPSYNLAJGMNEJ-UHFFFAOYSA-N 0.000 description 3
- 230000006229 amino acid addition Effects 0.000 description 3
- 238000006664 bond formation reaction Methods 0.000 description 3
- 238000005119 centrifugation Methods 0.000 description 3
- 210000004978 chinese hamster ovary cell Anatomy 0.000 description 3
- 235000018417 cysteine Nutrition 0.000 description 3
- 238000007599 discharging Methods 0.000 description 3
- VHJLVAABSRFDPM-ZXZARUISSA-N dithioerythritol Chemical compound SC[C@H](O)[C@H](O)CS VHJLVAABSRFDPM-ZXZARUISSA-N 0.000 description 3
- 238000007876 drug discovery Methods 0.000 description 3
- 230000007613 environmental effect Effects 0.000 description 3
- 238000000605 extraction Methods 0.000 description 3
- 239000005350 fused silica glass Substances 0.000 description 3
- 238000010191 image analysis Methods 0.000 description 3
- 238000003780 insertion Methods 0.000 description 3
- 230000037431 insertion Effects 0.000 description 3
- 210000001069 large ribosome subunit Anatomy 0.000 description 3
- 238000001294 liquid chromatography-tandem mass spectrometry Methods 0.000 description 3
- 238000004949 mass spectrometry Methods 0.000 description 3
- 239000003921 oil Substances 0.000 description 3
- 239000008188 pellet Substances 0.000 description 3
- 125000001151 peptidyl group Chemical group 0.000 description 3
- 235000011056 potassium acetate Nutrition 0.000 description 3
- GUUBJKMBDULZTE-UHFFFAOYSA-M potassium;2-[4-(2-hydroxyethyl)piperazin-1-yl]ethanesulfonic acid;hydroxide Chemical compound [OH-].[K+].OCCN1CCN(CCS(O)(=O)=O)CC1 GUUBJKMBDULZTE-UHFFFAOYSA-M 0.000 description 3
- 238000004886 process control Methods 0.000 description 3
- 230000004853 protein function Effects 0.000 description 3
- 238000010791 quenching Methods 0.000 description 3
- 230000000171 quenching effect Effects 0.000 description 3
- 230000001105 regulatory effect Effects 0.000 description 3
- 210000004708 ribosome subunit Anatomy 0.000 description 3
- 108091092562 ribozyme Proteins 0.000 description 3
- 239000004065 semiconductor Substances 0.000 description 3
- 239000011780 sodium chloride Substances 0.000 description 3
- 238000001179 sorption measurement Methods 0.000 description 3
- 238000004611 spectroscopical analysis Methods 0.000 description 3
- 238000001228 spectrum Methods 0.000 description 3
- 230000005945 translocation Effects 0.000 description 3
- 230000007306 turnover Effects 0.000 description 3
- XLYOFNOQVPJJNP-UHFFFAOYSA-N water Substances O XLYOFNOQVPJJNP-UHFFFAOYSA-N 0.000 description 3
- 238000001086 yeast two-hybrid system Methods 0.000 description 3
- SNLOIIPRZGMRAB-QMMMGPOBSA-N (2s)-2-azaniumyl-3-(1h-pyrrolo[2,3-b]pyridin-3-yl)propanoate Chemical compound C1=CC=C2C(C[C@H]([NH3+])C([O-])=O)=CNC2=N1 SNLOIIPRZGMRAB-QMMMGPOBSA-N 0.000 description 2
- FZWGECJQACGGTI-UHFFFAOYSA-N 2-amino-7-methyl-1,7-dihydro-6H-purin-6-one Chemical compound NC1=NC(O)=C2N(C)C=NC2=N1 FZWGECJQACGGTI-UHFFFAOYSA-N 0.000 description 2
- ZLHLYESIHSHXGM-UHFFFAOYSA-N 4,6-dimethyl-1h-imidazo[1,2-a]purin-9-one Chemical compound N=1C(C)=CN(C2=O)C=1N(C)C1=C2NC=N1 ZLHLYESIHSHXGM-UHFFFAOYSA-N 0.000 description 2
- OIVLITBTBDPEFK-UHFFFAOYSA-N 5,6-dihydrouracil Chemical compound O=C1CCNC(=O)N1 OIVLITBTBDPEFK-UHFFFAOYSA-N 0.000 description 2
- ZMERMCRYYFRELX-UHFFFAOYSA-N 5-{[2-(iodoacetamido)ethyl]amino}naphthalene-1-sulfonic acid Chemical compound C1=CC=C2C(S(=O)(=O)O)=CC=CC2=C1NCCNC(=O)CI ZMERMCRYYFRELX-UHFFFAOYSA-N 0.000 description 2
- XKRFYHLGVUSROY-UHFFFAOYSA-N Argon Chemical compound [Ar] XKRFYHLGVUSROY-UHFFFAOYSA-N 0.000 description 2
- 244000063299 Bacillus subtilis Species 0.000 description 2
- 235000014469 Bacillus subtilis Nutrition 0.000 description 2
- 102100031680 Beta-catenin-interacting protein 1 Human genes 0.000 description 2
- 108090000994 Catalytic RNA Proteins 0.000 description 2
- 102000053642 Catalytic RNA Human genes 0.000 description 2
- 102000000844 Cell Surface Receptors Human genes 0.000 description 2
- 108010001857 Cell Surface Receptors Proteins 0.000 description 2
- RTZKZFJDLAIYFH-UHFFFAOYSA-N Diethyl ether Chemical compound CCOCC RTZKZFJDLAIYFH-UHFFFAOYSA-N 0.000 description 2
- 108090000045 G-Protein-Coupled Receptors Proteins 0.000 description 2
- 102000003688 G-Protein-Coupled Receptors Human genes 0.000 description 2
- 101000993469 Homo sapiens Beta-catenin-interacting protein 1 Proteins 0.000 description 2
- 102000004310 Ion Channels Human genes 0.000 description 2
- 239000004472 Lysine Substances 0.000 description 2
- DRBBFCLWYRJSJZ-UHFFFAOYSA-N N-phosphocreatine Chemical compound OC(=O)CN(C)C(=N)NP(O)(O)=O DRBBFCLWYRJSJZ-UHFFFAOYSA-N 0.000 description 2
- 206010028980 Neoplasm Diseases 0.000 description 2
- 108700026244 Open Reading Frames Proteins 0.000 description 2
- 108010008281 Recombinant Fusion Proteins Proteins 0.000 description 2
- 102000007056 Recombinant Fusion Proteins Human genes 0.000 description 2
- VMHLLURERBWHNL-UHFFFAOYSA-M Sodium acetate Chemical compound [Na+].CC([O-])=O VMHLLURERBWHNL-UHFFFAOYSA-M 0.000 description 2
- 229930006000 Sucrose Natural products 0.000 description 2
- CZMRCDWAGMRECN-UGDNZRGBSA-N Sucrose Chemical compound O[C@H]1[C@H](O)[C@@H](CO)O[C@@]1(CO)O[C@@H]1[C@H](O)[C@@H](O)[C@H](O)[C@@H](CO)O1 CZMRCDWAGMRECN-UGDNZRGBSA-N 0.000 description 2
- 238000010521 absorption reaction Methods 0.000 description 2
- 239000012082 adaptor molecule Substances 0.000 description 2
- 125000003277 amino group Chemical group 0.000 description 2
- 230000003321 amplification Effects 0.000 description 2
- 239000012062 aqueous buffer Substances 0.000 description 2
- 238000003491 array Methods 0.000 description 2
- QVGXLLKOCUKJST-UHFFFAOYSA-N atomic oxygen Chemical compound [O] QVGXLLKOCUKJST-UHFFFAOYSA-N 0.000 description 2
- 230000001588 bifunctional effect Effects 0.000 description 2
- 108091006004 biotinylated proteins Proteins 0.000 description 2
- 238000004061 bleaching Methods 0.000 description 2
- 201000011510 cancer Diseases 0.000 description 2
- 230000033077 cellular process Effects 0.000 description 2
- 238000012512 characterization method Methods 0.000 description 2
- 238000004587 chromatography analysis Methods 0.000 description 2
- 238000003776 cleavage reaction Methods 0.000 description 2
- 230000000295 complement effect Effects 0.000 description 2
- 238000010276 construction Methods 0.000 description 2
- 229960000956 coumarin Drugs 0.000 description 2
- 235000001671 coumarin Nutrition 0.000 description 2
- 238000007405 data analysis Methods 0.000 description 2
- 238000006731 degradation reaction Methods 0.000 description 2
- 230000003111 delayed effect Effects 0.000 description 2
- 238000004925 denaturation Methods 0.000 description 2
- 230000036425 denaturation Effects 0.000 description 2
- 238000013461 design Methods 0.000 description 2
- 238000009792 diffusion process Methods 0.000 description 2
- 230000003828 downregulation Effects 0.000 description 2
- 230000005672 electromagnetic field Effects 0.000 description 2
- 230000013020 embryo development Effects 0.000 description 2
- 230000002255 enzymatic effect Effects 0.000 description 2
- 210000003527 eukaryotic cell Anatomy 0.000 description 2
- 238000002073 fluorescence micrograph Methods 0.000 description 2
- 238000010363 gene targeting Methods 0.000 description 2
- CPBQJMYROZQQJC-UHFFFAOYSA-N helium neon Chemical compound [He].[Ne] CPBQJMYROZQQJC-UHFFFAOYSA-N 0.000 description 2
- 238000012188 high-throughput screening assay Methods 0.000 description 2
- 230000001939 inductive effect Effects 0.000 description 2
- 230000000977 initiatory effect Effects 0.000 description 2
- NOESYZHRGYRDHS-UHFFFAOYSA-N insulin Chemical compound N1C(=O)C(NC(=O)C(CCC(N)=O)NC(=O)C(CCC(O)=O)NC(=O)C(C(C)C)NC(=O)C(NC(=O)CN)C(C)CC)CSSCC(C(NC(CO)C(=O)NC(CC(C)C)C(=O)NC(CC=2C=CC(O)=CC=2)C(=O)NC(CCC(N)=O)C(=O)NC(CC(C)C)C(=O)NC(CCC(O)=O)C(=O)NC(CC(N)=O)C(=O)NC(CC=2C=CC(O)=CC=2)C(=O)NC(CSSCC(NC(=O)C(C(C)C)NC(=O)C(CC(C)C)NC(=O)C(CC=2C=CC(O)=CC=2)NC(=O)C(CC(C)C)NC(=O)C(C)NC(=O)C(CCC(O)=O)NC(=O)C(C(C)C)NC(=O)C(CC(C)C)NC(=O)C(CC=2NC=NC=2)NC(=O)C(CO)NC(=O)CNC2=O)C(=O)NCC(=O)NC(CCC(O)=O)C(=O)NC(CCCNC(N)=N)C(=O)NCC(=O)NC(CC=3C=CC=CC=3)C(=O)NC(CC=3C=CC=CC=3)C(=O)NC(CC=3C=CC(O)=CC=3)C(=O)NC(C(C)O)C(=O)N3C(CCC3)C(=O)NC(CCCCN)C(=O)NC(C)C(O)=O)C(=O)NC(CC(N)=O)C(O)=O)=O)NC(=O)C(C(C)CC)NC(=O)C(CO)NC(=O)C(C(C)O)NC(=O)C1CSSCC2NC(=O)C(CC(C)C)NC(=O)C(NC(=O)C(CCC(N)=O)NC(=O)C(CC(N)=O)NC(=O)C(NC(=O)C(N)CC=1C=CC=CC=1)C(C)C)CC1=CN=CN1 NOESYZHRGYRDHS-UHFFFAOYSA-N 0.000 description 2
- 150000002500 ions Chemical class 0.000 description 2
- 238000002955 isolation Methods 0.000 description 2
- BPHPUYQFMNQIOC-NXRLNHOXSA-N isopropyl beta-D-thiogalactopyranoside Chemical compound CC(C)S[C@@H]1O[C@H](CO)[C@H](O)[C@H](O)[C@H]1O BPHPUYQFMNQIOC-NXRLNHOXSA-N 0.000 description 2
- 150000002632 lipids Chemical class 0.000 description 2
- 238000004895 liquid chromatography mass spectrometry Methods 0.000 description 2
- 230000004807 localization Effects 0.000 description 2
- 239000000463 material Substances 0.000 description 2
- 238000001840 matrix-assisted laser desorption--ionisation time-of-flight mass spectrometry Methods 0.000 description 2
- 239000000693 micelle Substances 0.000 description 2
- 239000000203 mixture Substances 0.000 description 2
- 238000003199 nucleic acid amplification method Methods 0.000 description 2
- 230000002018 overexpression Effects 0.000 description 2
- GPSSQIRGCXEBSH-UHFFFAOYSA-N oxoarsenic Chemical group [As]=O GPSSQIRGCXEBSH-UHFFFAOYSA-N 0.000 description 2
- 239000001301 oxygen Substances 0.000 description 2
- 229910052760 oxygen Inorganic materials 0.000 description 2
- 239000002245 particle Substances 0.000 description 2
- 150000003904 phospholipids Chemical class 0.000 description 2
- 230000004962 physiological condition Effects 0.000 description 2
- 229920002401 polyacrylamide Polymers 0.000 description 2
- 108010039177 polyphenylalanine Proteins 0.000 description 2
- 230000026447 protein localization Effects 0.000 description 2
- 238000003908 quality control method Methods 0.000 description 2
- 238000004445 quantitative analysis Methods 0.000 description 2
- 238000000163 radioactive labelling Methods 0.000 description 2
- 230000022532 regulation of transcription, DNA-dependent Effects 0.000 description 2
- 238000012827 research and development Methods 0.000 description 2
- 230000003068 static effect Effects 0.000 description 2
- 238000003860 storage Methods 0.000 description 2
- 239000000758 substrate Substances 0.000 description 2
- 239000005720 sucrose Substances 0.000 description 2
- 230000002123 temporal effect Effects 0.000 description 2
- 238000000492 total internal reflection fluorescence microscopy Methods 0.000 description 2
- 238000006257 total synthesis reaction Methods 0.000 description 2
- 231100000419 toxicity Toxicity 0.000 description 2
- 230000001988 toxicity Effects 0.000 description 2
- 239000012096 transfection reagent Substances 0.000 description 2
- LWIHDJKSTIGBAC-UHFFFAOYSA-K tripotassium phosphate Chemical compound [K+].[K+].[K+].[O-]P([O-])([O-])=O LWIHDJKSTIGBAC-UHFFFAOYSA-K 0.000 description 2
- 238000012795 verification Methods 0.000 description 2
- 238000012800 visualization Methods 0.000 description 2
- DGVVWUTYPXICAM-UHFFFAOYSA-N β‐Mercaptoethanol Chemical compound OCCS DGVVWUTYPXICAM-UHFFFAOYSA-N 0.000 description 2
- IHPYMWDTONKSCO-UHFFFAOYSA-N 2,2'-piperazine-1,4-diylbisethanesulfonic acid Chemical compound OS(=O)(=O)CCN1CCN(CCS(O)(=O)=O)CC1 IHPYMWDTONKSCO-UHFFFAOYSA-N 0.000 description 1
- YXNIEZJFCGTDKV-JANFQQFMSA-N 3-(3-amino-3-carboxypropyl)uridine Chemical group O=C1N(CCC(N)C(O)=O)C(=O)C=CN1[C@H]1[C@H](O)[C@H](O)[C@@H](CO)O1 YXNIEZJFCGTDKV-JANFQQFMSA-N 0.000 description 1
- ZPZDIFSPRVHGIF-UHFFFAOYSA-N 3-aminopropylsilicon Chemical compound NCCC[Si] ZPZDIFSPRVHGIF-UHFFFAOYSA-N 0.000 description 1
- 102000052866 Amino Acyl-tRNA Synthetases Human genes 0.000 description 1
- 108700028939 Amino Acyl-tRNA Synthetases Proteins 0.000 description 1
- 125000001433 C-terminal amino-acid group Chemical group 0.000 description 1
- 239000002126 C01EB10 - Adenosine Substances 0.000 description 1
- 101100126625 Caenorhabditis elegans itr-1 gene Proteins 0.000 description 1
- OYPRJOBELJOOCE-UHFFFAOYSA-N Calcium Chemical compound [Ca] OYPRJOBELJOOCE-UHFFFAOYSA-N 0.000 description 1
- 206010010774 Constipation Diseases 0.000 description 1
- 102000004420 Creatine Kinase Human genes 0.000 description 1
- 108010042126 Creatine kinase Proteins 0.000 description 1
- 241000699800 Cricetinae Species 0.000 description 1
- 241000699802 Cricetulus griseus Species 0.000 description 1
- 239000004971 Cross linker Substances 0.000 description 1
- 102000011724 DNA Repair Enzymes Human genes 0.000 description 1
- 108010076525 DNA Repair Enzymes Proteins 0.000 description 1
- 230000005778 DNA damage Effects 0.000 description 1
- 231100000277 DNA damage Toxicity 0.000 description 1
- 230000005971 DNA damage repair Effects 0.000 description 1
- 238000000018 DNA microarray Methods 0.000 description 1
- 238000001712 DNA sequencing Methods 0.000 description 1
- 102000007260 Deoxyribonuclease I Human genes 0.000 description 1
- 108010008532 Deoxyribonuclease I Proteins 0.000 description 1
- SHIBSTMRCDJXLN-UHFFFAOYSA-N Digoxigenin Natural products C1CC(C2C(C3(C)CCC(O)CC3CC2)CC2O)(O)C2(C)C1C1=CC(=O)OC1 SHIBSTMRCDJXLN-UHFFFAOYSA-N 0.000 description 1
- MYMOFIZGZYHOMD-UHFFFAOYSA-N Dioxygen Chemical compound O=O MYMOFIZGZYHOMD-UHFFFAOYSA-N 0.000 description 1
- 108090000204 Dipeptidase 1 Proteins 0.000 description 1
- KCXVZYZYPLLWCC-UHFFFAOYSA-N EDTA Chemical compound OC(=O)CN(CC(O)=O)CCN(CC(O)=O)CC(O)=O KCXVZYZYPLLWCC-UHFFFAOYSA-N 0.000 description 1
- 101000925646 Enterobacteria phage T4 Endolysin Proteins 0.000 description 1
- 102000003951 Erythropoietin Human genes 0.000 description 1
- 108090000394 Erythropoietin Proteins 0.000 description 1
- 241000672609 Escherichia coli BL21 Species 0.000 description 1
- 241000701533 Escherichia virus T4 Species 0.000 description 1
- 102000030782 GTP binding Human genes 0.000 description 1
- 108091000058 GTP-Binding Proteins 0.000 description 1
- 206010019663 Hepatic failure Diseases 0.000 description 1
- 102000002265 Human Growth Hormone Human genes 0.000 description 1
- 108010000521 Human Growth Hormone Proteins 0.000 description 1
- 239000000854 Human Growth Hormone Substances 0.000 description 1
- 108010058683 Immobilized Proteins Proteins 0.000 description 1
- 102000004877 Insulin Human genes 0.000 description 1
- 108090001061 Insulin Proteins 0.000 description 1
- 108090000862 Ion Channels Proteins 0.000 description 1
- FFEARJCKVFRZRR-BYPYZUCNSA-N L-methionine Chemical compound CSCC[C@H](N)C(O)=O FFEARJCKVFRZRR-BYPYZUCNSA-N 0.000 description 1
- 239000000232 Lipid Bilayer Substances 0.000 description 1
- 239000006137 Luria-Bertani broth Substances 0.000 description 1
- 102000018697 Membrane Proteins Human genes 0.000 description 1
- 108010052285 Membrane Proteins Proteins 0.000 description 1
- 206010027476 Metastases Diseases 0.000 description 1
- 241001465754 Metazoa Species 0.000 description 1
- 102000016943 Muramidase Human genes 0.000 description 1
- 108010014251 Muramidase Proteins 0.000 description 1
- 102000003505 Myosin Human genes 0.000 description 1
- 108060008487 Myosin Proteins 0.000 description 1
- 108010062010 N-Acetylmuramoyl-L-alanine Amidase Proteins 0.000 description 1
- 229910017502 Nd:YVO4 Inorganic materials 0.000 description 1
- 108020004485 Nonsense Codon Proteins 0.000 description 1
- 102000019040 Nuclear Antigens Human genes 0.000 description 1
- 108010051791 Nuclear Antigens Proteins 0.000 description 1
- 102000007399 Nuclear hormone receptor Human genes 0.000 description 1
- 108020005497 Nuclear hormone receptor Proteins 0.000 description 1
- 101710163270 Nuclease Proteins 0.000 description 1
- 241000283973 Oryctolagus cuniculus Species 0.000 description 1
- 229940123973 Oxygen scavenger Drugs 0.000 description 1
- 239000007990 PIPES buffer Substances 0.000 description 1
- 229910019142 PO4 Inorganic materials 0.000 description 1
- 108091005804 Peptidases Proteins 0.000 description 1
- 102000008153 Peptide Elongation Factor Tu Human genes 0.000 description 1
- 108010049977 Peptide Elongation Factor Tu Proteins 0.000 description 1
- 108010068204 Peptide Elongation Factors Proteins 0.000 description 1
- 102000002508 Peptide Elongation Factors Human genes 0.000 description 1
- 108090000279 Peptidyltransferases Proteins 0.000 description 1
- 102000045595 Phosphoprotein Phosphatases Human genes 0.000 description 1
- 108700019535 Phosphoprotein Phosphatases Proteins 0.000 description 1
- OAICVXFJPJFONN-UHFFFAOYSA-N Phosphorus Chemical compound [P] OAICVXFJPJFONN-UHFFFAOYSA-N 0.000 description 1
- 101710093543 Probable non-specific lipid-transfer protein Proteins 0.000 description 1
- WDVSHHCDHLJJJR-UHFFFAOYSA-N Proflavine Chemical compound C1=CC(N)=CC2=NC3=CC(N)=CC=C3C=C21 WDVSHHCDHLJJJR-UHFFFAOYSA-N 0.000 description 1
- 239000004365 Protease Substances 0.000 description 1
- 108010029485 Protein Isoforms Proteins 0.000 description 1
- 102000001708 Protein Isoforms Human genes 0.000 description 1
- 102000001253 Protein Kinase Human genes 0.000 description 1
- 238000004617 QSAR study Methods 0.000 description 1
- 230000026279 RNA modification Effects 0.000 description 1
- 230000004570 RNA-binding Effects 0.000 description 1
- 108091030071 RNAI Proteins 0.000 description 1
- 102100037486 Reverse transcriptase/ribonuclease H Human genes 0.000 description 1
- 229920005654 Sephadex Polymers 0.000 description 1
- 239000012507 Sephadex™ Substances 0.000 description 1
- XUIMIQQOPSSXEZ-UHFFFAOYSA-N Silicon Chemical compound [Si] XUIMIQQOPSSXEZ-UHFFFAOYSA-N 0.000 description 1
- 241000041231 Thermanaeromonas burensis Species 0.000 description 1
- RTAQQCXQSZGOHL-UHFFFAOYSA-N Titanium Chemical compound [Ti] RTAQQCXQSZGOHL-UHFFFAOYSA-N 0.000 description 1
- 108091023040 Transcription factor Proteins 0.000 description 1
- 102000040945 Transcription factor Human genes 0.000 description 1
- 102000004357 Transferases Human genes 0.000 description 1
- 229920004890 Triton X-100 Polymers 0.000 description 1
- 239000013504 Triton X-100 Substances 0.000 description 1
- 108090000631 Trypsin Proteins 0.000 description 1
- 102000004142 Trypsin Human genes 0.000 description 1
- 241000700605 Viruses Species 0.000 description 1
- YXNIEZJFCGTDKV-UHFFFAOYSA-N X-Nucleosid Natural products O=C1N(CCC(N)C(O)=O)C(=O)C=CN1C1C(O)C(O)C(CO)O1 YXNIEZJFCGTDKV-UHFFFAOYSA-N 0.000 description 1
- 241000269370 Xenopus <genus> Species 0.000 description 1
- 230000005856 abnormality Effects 0.000 description 1
- 238000000862 absorption spectrum Methods 0.000 description 1
- 238000009825 accumulation Methods 0.000 description 1
- 230000002378 acidificating effect Effects 0.000 description 1
- 230000009471 action Effects 0.000 description 1
- 229960005305 adenosine Drugs 0.000 description 1
- 150000003838 adenosines Chemical class 0.000 description 1
- 239000011543 agarose gel Substances 0.000 description 1
- 230000002776 aggregation Effects 0.000 description 1
- 238000004220 aggregation Methods 0.000 description 1
- 125000001931 aliphatic group Chemical group 0.000 description 1
- JSWZEAMFRNKZNL-UHFFFAOYSA-N alosetron Chemical compound N1C=NC(CN2C(C3=C(N(C4=CC=CC=C43)C)CC2)=O)=C1C JSWZEAMFRNKZNL-UHFFFAOYSA-N 0.000 description 1
- 150000003862 amino acid derivatives Chemical class 0.000 description 1
- 125000000539 amino acid group Chemical group 0.000 description 1
- 235000019270 ammonium chloride Nutrition 0.000 description 1
- 230000033115 angiogenesis Effects 0.000 description 1
- 210000004102 animal cell Anatomy 0.000 description 1
- 239000003242 anti bacterial agent Substances 0.000 description 1
- 229940088710 antibiotic agent Drugs 0.000 description 1
- 230000006907 apoptotic process Effects 0.000 description 1
- 239000007864 aqueous solution Substances 0.000 description 1
- 229910052786 argon Inorganic materials 0.000 description 1
- 229910052785 arsenic Inorganic materials 0.000 description 1
- 238000010420 art technique Methods 0.000 description 1
- 238000004630 atomic force microscopy Methods 0.000 description 1
- 230000004888 barrier function Effects 0.000 description 1
- 230000009286 beneficial effect Effects 0.000 description 1
- 102000006635 beta-lactamase Human genes 0.000 description 1
- 230000002902 bimodal effect Effects 0.000 description 1
- 230000006409 bimodal response Effects 0.000 description 1
- 238000004166 bioassay Methods 0.000 description 1
- 230000003851 biochemical process Effects 0.000 description 1
- 238000003766 bioinformatics method Methods 0.000 description 1
- 230000033228 biological regulation Effects 0.000 description 1
- 229960000074 biopharmaceutical Drugs 0.000 description 1
- 239000007844 bleaching agent Substances 0.000 description 1
- 229920001400 block copolymer Polymers 0.000 description 1
- 210000004556 brain Anatomy 0.000 description 1
- UIZLQMLDSWKZGC-UHFFFAOYSA-N cadmium helium Chemical compound [He].[Cd] UIZLQMLDSWKZGC-UHFFFAOYSA-N 0.000 description 1
- UHYPYGJEEGLRJD-UHFFFAOYSA-N cadmium(2+);selenium(2-) Chemical group [Se-2].[Cd+2] UHYPYGJEEGLRJD-UHFFFAOYSA-N 0.000 description 1
- 239000011575 calcium Substances 0.000 description 1
- 229910052791 calcium Inorganic materials 0.000 description 1
- 238000004422 calculation algorithm Methods 0.000 description 1
- 230000015556 catabolic process Effects 0.000 description 1
- 230000034303 cell budding Effects 0.000 description 1
- 230000006037 cell lysis Effects 0.000 description 1
- 230000003833 cell viability Effects 0.000 description 1
- 230000007248 cellular mechanism Effects 0.000 description 1
- 230000004640 cellular pathway Effects 0.000 description 1
- 230000036755 cellular response Effects 0.000 description 1
- 230000030193 cellular response to external stimulus Effects 0.000 description 1
- 239000001913 cellulose Substances 0.000 description 1
- 229920002678 cellulose Polymers 0.000 description 1
- 230000008859 change Effects 0.000 description 1
- 238000009614 chemical analysis method Methods 0.000 description 1
- 230000002925 chemical effect Effects 0.000 description 1
- 239000003153 chemical reaction reagent Substances 0.000 description 1
- 239000003795 chemical substances by application Substances 0.000 description 1
- 108010081370 chymotrypsin inhibitor 2 Proteins 0.000 description 1
- DCSUBABJRXZOMT-IRLDBZIGSA-N cisapride Chemical compound C([C@@H]([C@@H](CC1)NC(=O)C=2C(=CC(N)=C(Cl)C=2)OC)OC)N1CCCOC1=CC=C(F)C=C1 DCSUBABJRXZOMT-IRLDBZIGSA-N 0.000 description 1
- 229960005132 cisapride Drugs 0.000 description 1
- 230000035071 co-translational protein modification Effects 0.000 description 1
- 239000011248 coating agent Substances 0.000 description 1
- 238000000576 coating method Methods 0.000 description 1
- 230000001427 coherent effect Effects 0.000 description 1
- 206010009887 colitis Diseases 0.000 description 1
- 239000003086 colorant Substances 0.000 description 1
- 230000001143 conditioned effect Effects 0.000 description 1
- 238000001218 confocal laser scanning microscopy Methods 0.000 description 1
- 230000001276 controlling effect Effects 0.000 description 1
- 238000001816 cooling Methods 0.000 description 1
- 230000002596 correlated effect Effects 0.000 description 1
- 239000002537 cosmetic Substances 0.000 description 1
- 108010082025 cyan fluorescent protein Proteins 0.000 description 1
- XUJNEKJLAYXESH-UHFFFAOYSA-N cysteine Natural products SCC(N)C(O)=O XUJNEKJLAYXESH-UHFFFAOYSA-N 0.000 description 1
- 230000009089 cytolysis Effects 0.000 description 1
- 230000003436 cytoskeletal effect Effects 0.000 description 1
- 230000034994 death Effects 0.000 description 1
- 101150047356 dec-1 gene Proteins 0.000 description 1
- 230000007423 decrease Effects 0.000 description 1
- 206010012601 diabetes mellitus Diseases 0.000 description 1
- 238000000502 dialysis Methods 0.000 description 1
- QONQRTHLHBTMGP-UHFFFAOYSA-N digitoxigenin Natural products CC12CCC(C3(CCC(O)CC3CC3)C)C3C11OC1CC2C1=CC(=O)OC1 QONQRTHLHBTMGP-UHFFFAOYSA-N 0.000 description 1
- SHIBSTMRCDJXLN-KCZCNTNESA-N digoxigenin Chemical compound C1([C@@H]2[C@@]3([C@@](CC2)(O)[C@H]2[C@@H]([C@@]4(C)CC[C@H](O)C[C@H]4CC2)C[C@H]3O)C)=CC(=O)OC1 SHIBSTMRCDJXLN-KCZCNTNESA-N 0.000 description 1
- IZFHEQBZOYJLPK-UHFFFAOYSA-N dihydrolipoic acid Chemical compound OC(=O)CCCCC(S)CCS IZFHEQBZOYJLPK-UHFFFAOYSA-N 0.000 description 1
- 238000006073 displacement reaction Methods 0.000 description 1
- 238000012362 drug development process Methods 0.000 description 1
- 238000007905 drug manufacturing Methods 0.000 description 1
- 230000009977 dual effect Effects 0.000 description 1
- 238000004043 dyeing Methods 0.000 description 1
- 201000006549 dyspepsia Diseases 0.000 description 1
- 230000009881 electrostatic interaction Effects 0.000 description 1
- 238000010828 elution Methods 0.000 description 1
- 230000002121 endocytic effect Effects 0.000 description 1
- 230000012202 endocytosis Effects 0.000 description 1
- 238000006911 enzymatic reaction Methods 0.000 description 1
- 229940105423 erythropoietin Drugs 0.000 description 1
- ZMMJGEGLRURXTF-UHFFFAOYSA-N ethidium bromide Chemical compound [Br-].C12=CC(N)=CC=C2C2=CC=C(N)C=C2[N+](CC)=C1C1=CC=CC=C1 ZMMJGEGLRURXTF-UHFFFAOYSA-N 0.000 description 1
- 229960005542 ethidium bromide Drugs 0.000 description 1
- 230000005281 excited state Effects 0.000 description 1
- 230000029142 excretion Effects 0.000 description 1
- 238000010195 expression analysis Methods 0.000 description 1
- 238000011049 filling Methods 0.000 description 1
- 238000002292 fluorescence lifetime imaging microscopy Methods 0.000 description 1
- 238000002795 fluorescence method Methods 0.000 description 1
- 238000000799 fluorescence microscopy Methods 0.000 description 1
- 238000001506 fluorescence spectroscopy Methods 0.000 description 1
- 238000012632 fluorescent imaging Methods 0.000 description 1
- 238000003234 fluorescent labeling method Methods 0.000 description 1
- 230000004907 flux Effects 0.000 description 1
- 235000013305 food Nutrition 0.000 description 1
- 239000012634 fragment Substances 0.000 description 1
- 230000005714 functional activity Effects 0.000 description 1
- 238000010230 functional analysis Methods 0.000 description 1
- 230000009368 gene silencing by RNA Effects 0.000 description 1
- 238000010353 genetic engineering Methods 0.000 description 1
- 229940029575 guanosine Drugs 0.000 description 1
- 230000036541 health Effects 0.000 description 1
- 208000024798 heartburn Diseases 0.000 description 1
- 238000003505 heat denaturation Methods 0.000 description 1
- 102000034345 heterotrimeric G proteins Human genes 0.000 description 1
- 108091006093 heterotrimeric G proteins Proteins 0.000 description 1
- 238000004128 high performance liquid chromatography Methods 0.000 description 1
- HNDVDQJCIGZPNO-UHFFFAOYSA-N histidine Natural products OC(=O)C(N)CC1=CN=CN1 HNDVDQJCIGZPNO-UHFFFAOYSA-N 0.000 description 1
- 210000005260 human cell Anatomy 0.000 description 1
- 235000003642 hunger Nutrition 0.000 description 1
- 230000002209 hydrophobic effect Effects 0.000 description 1
- 238000007654 immersion Methods 0.000 description 1
- 238000000126 in silico method Methods 0.000 description 1
- 238000011503 in vivo imaging Methods 0.000 description 1
- 230000006698 induction Effects 0.000 description 1
- 238000002347 injection Methods 0.000 description 1
- 239000007924 injection Substances 0.000 description 1
- 229960003786 inosine Drugs 0.000 description 1
- 229940125396 insulin Drugs 0.000 description 1
- 230000002452 interceptive effect Effects 0.000 description 1
- 238000000752 ionisation method Methods 0.000 description 1
- 230000002427 irreversible effect Effects 0.000 description 1
- 208000002551 irritable bowel syndrome Diseases 0.000 description 1
- 229910052743 krypton Inorganic materials 0.000 description 1
- DNNSSWSSYDEUBZ-UHFFFAOYSA-N krypton atom Chemical compound [Kr] DNNSSWSSYDEUBZ-UHFFFAOYSA-N 0.000 description 1
- 238000002898 library design Methods 0.000 description 1
- 238000004811 liquid chromatography Methods 0.000 description 1
- 208000007903 liver failure Diseases 0.000 description 1
- 231100000835 liver failure Toxicity 0.000 description 1
- 230000007774 longterm Effects 0.000 description 1
- 229940060963 lotronex Drugs 0.000 description 1
- 239000006166 lysate Substances 0.000 description 1
- 125000003588 lysine group Chemical group [H]N([H])C([H])([H])C([H])([H])C([H])([H])C([H])([H])C([H])(N([H])[H])C(*)=O 0.000 description 1
- 229960000274 lysozyme Drugs 0.000 description 1
- 239000004325 lysozyme Substances 0.000 description 1
- 235000010335 lysozyme Nutrition 0.000 description 1
- 229920002521 macromolecule Polymers 0.000 description 1
- 210000001161 mammalian embryo Anatomy 0.000 description 1
- 238000013507 mapping Methods 0.000 description 1
- 238000001819 mass spectrum Methods 0.000 description 1
- 238000000816 matrix-assisted laser desorption--ionisation Methods 0.000 description 1
- 230000010534 mechanism of action Effects 0.000 description 1
- 238000002483 medication Methods 0.000 description 1
- 239000002609 medium Substances 0.000 description 1
- 239000012528 membrane Substances 0.000 description 1
- 230000005499 meniscus Effects 0.000 description 1
- 230000037353 metabolic pathway Effects 0.000 description 1
- 230000004060 metabolic process Effects 0.000 description 1
- 229910052751 metal Inorganic materials 0.000 description 1
- 239000002184 metal Substances 0.000 description 1
- 230000009401 metastasis Effects 0.000 description 1
- 238000010369 molecular cloning Methods 0.000 description 1
- 230000008450 motivation Effects 0.000 description 1
- 238000002703 mutagenesis Methods 0.000 description 1
- 231100000350 mutagenesis Toxicity 0.000 description 1
- 239000002547 new drug Substances 0.000 description 1
- 229930027945 nicotinamide-adenine dinucleotide Natural products 0.000 description 1
- BOPGDPNILDQYTO-NNYOXOHSSA-N nicotinamide-adenine dinucleotide Chemical compound C1=CCC(C(=O)N)=CN1[C@H]1[C@H](O)[C@H](O)[C@@H](COP(O)(=O)OP(O)(=O)OC[C@@H]2[C@H]([C@@H](O)[C@@H](O2)N2C3=NC=NC(N)=C3N=C2)O)O1 BOPGDPNILDQYTO-NNYOXOHSSA-N 0.000 description 1
- 230000008520 organization Effects 0.000 description 1
- 210000001672 ovary Anatomy 0.000 description 1
- 230000003647 oxidation Effects 0.000 description 1
- 238000007254 oxidation reaction Methods 0.000 description 1
- 238000005192 partition Methods 0.000 description 1
- 230000035515 penetration Effects 0.000 description 1
- NBIIXXVUZAFLBC-UHFFFAOYSA-K phosphate Chemical compound [O-]P([O-])([O-])=O NBIIXXVUZAFLBC-UHFFFAOYSA-K 0.000 description 1
- 239000010452 phosphate Substances 0.000 description 1
- 229950007002 phosphocreatine Drugs 0.000 description 1
- 230000008832 photodamage Effects 0.000 description 1
- 238000005375 photometry Methods 0.000 description 1
- 238000003752 polymerase chain reaction Methods 0.000 description 1
- 108091033319 polynucleotide Proteins 0.000 description 1
- 102000040430 polynucleotide Human genes 0.000 description 1
- 239000002157 polynucleotide Substances 0.000 description 1
- 239000011148 porous material Substances 0.000 description 1
- 230000004481 post-translational protein modification Effects 0.000 description 1
- 229910000160 potassium phosphate Inorganic materials 0.000 description 1
- 235000011009 potassium phosphates Nutrition 0.000 description 1
- OXCMYAYHXIHQOA-UHFFFAOYSA-N potassium;[2-butyl-5-chloro-3-[[4-[2-(1,2,4-triaza-3-azanidacyclopenta-1,4-dien-5-yl)phenyl]phenyl]methyl]imidazol-4-yl]methanol Chemical compound [K+].CCCCC1=NC(Cl)=C(CO)N1CC1=CC=C(C=2C(=CC=CC=2)C2=N[N-]N=N2)C=C1 OXCMYAYHXIHQOA-UHFFFAOYSA-N 0.000 description 1
- 238000007781 pre-processing Methods 0.000 description 1
- 238000001556 precipitation Methods 0.000 description 1
- 125000002924 primary amino group Chemical group [H]N([H])* 0.000 description 1
- 229960000286 proflavine Drugs 0.000 description 1
- 230000001915 proofreading effect Effects 0.000 description 1
- 230000013777 protein digestion Effects 0.000 description 1
- 238000000751 protein extraction Methods 0.000 description 1
- 230000012846 protein folding Effects 0.000 description 1
- 108060006633 protein kinase Proteins 0.000 description 1
- 230000009145 protein modification Effects 0.000 description 1
- 238000001742 protein purification Methods 0.000 description 1
- 230000007026 protein scission Effects 0.000 description 1
- 238000000734 protein sequencing Methods 0.000 description 1
- 230000012743 protein tagging Effects 0.000 description 1
- 230000017854 proteolysis Effects 0.000 description 1
- 238000000575 proteomic method Methods 0.000 description 1
- 210000001243 pseudopodia Anatomy 0.000 description 1
- 238000006862 quantum yield reaction Methods 0.000 description 1
- 238000010188 recombinant method Methods 0.000 description 1
- 230000006798 recombination Effects 0.000 description 1
- 238000005215 recombination Methods 0.000 description 1
- 230000002829 reductive effect Effects 0.000 description 1
- 230000000717 retained effect Effects 0.000 description 1
- 210000001995 reticulocyte Anatomy 0.000 description 1
- 230000033764 rhythmic process Effects 0.000 description 1
- 229920002477 rna polymer Polymers 0.000 description 1
- 150000003839 salts Chemical class 0.000 description 1
- 238000002133 sample digestion Methods 0.000 description 1
- 229910052594 sapphire Inorganic materials 0.000 description 1
- 239000010980 sapphire Substances 0.000 description 1
- 238000013341 scale-up Methods 0.000 description 1
- 238000001963 scanning near-field photolithography Methods 0.000 description 1
- 238000004621 scanning probe microscopy Methods 0.000 description 1
- 230000007017 scission Effects 0.000 description 1
- 239000004054 semiconductor nanocrystal Substances 0.000 description 1
- 238000012163 sequencing technique Methods 0.000 description 1
- 230000035939 shock Effects 0.000 description 1
- 238000004904 shortening Methods 0.000 description 1
- 230000019491 signal transduction Effects 0.000 description 1
- 229910052710 silicon Inorganic materials 0.000 description 1
- 239000010703 silicon Substances 0.000 description 1
- 238000004498 smFRET spectroscopy Methods 0.000 description 1
- 150000003384 small molecules Chemical class 0.000 description 1
- 210000001812 small ribosome subunit Anatomy 0.000 description 1
- 238000000527 sonication Methods 0.000 description 1
- 238000012289 standard assay Methods 0.000 description 1
- 238000010561 standard procedure Methods 0.000 description 1
- 230000037351 starvation Effects 0.000 description 1
- 238000003756 stirring Methods 0.000 description 1
- 229910052717 sulfur Inorganic materials 0.000 description 1
- 125000004434 sulfur atom Chemical group 0.000 description 1
- 230000001629 suppression Effects 0.000 description 1
- 239000012756 surface treatment agent Substances 0.000 description 1
- 230000002194 synthesizing effect Effects 0.000 description 1
- 230000008685 targeting Effects 0.000 description 1
- 238000012360 testing method Methods 0.000 description 1
- 230000001225 therapeutic effect Effects 0.000 description 1
- 229940113082 thymine Drugs 0.000 description 1
- 229910052719 titanium Inorganic materials 0.000 description 1
- 231100000167 toxic agent Toxicity 0.000 description 1
- 239000003440 toxic substance Substances 0.000 description 1
- 231100000027 toxicology Toxicity 0.000 description 1
- 231100000041 toxicology testing Toxicity 0.000 description 1
- 238000005820 transferase reaction Methods 0.000 description 1
- 230000032258 transport Effects 0.000 description 1
- GXPHKUHSUJUWKP-UHFFFAOYSA-N troglitazone Chemical compound C1CC=2C(C)=C(O)C(C)=C(C)C=2OC1(C)COC(C=C1)=CC=C1CC1SC(=O)NC1=O GXPHKUHSUJUWKP-UHFFFAOYSA-N 0.000 description 1
- 229960001641 troglitazone Drugs 0.000 description 1
- 239000012588 trypsin Substances 0.000 description 1
- 230000005641 tunneling Effects 0.000 description 1
- 238000000539 two dimensional gel electrophoresis Methods 0.000 description 1
- 238000010396 two-hybrid screening Methods 0.000 description 1
- 241001515965 unidentified phage Species 0.000 description 1
- 238000009827 uniform distribution Methods 0.000 description 1
- 230000003827 upregulation Effects 0.000 description 1
- 229940045145 uridine Drugs 0.000 description 1
- 238000010200 validation analysis Methods 0.000 description 1
- 230000000007 visual effect Effects 0.000 description 1
- 238000012070 whole genome sequencing analysis Methods 0.000 description 1
- QAOHCFGKCWTBGC-QHOAOGIMSA-N wybutosine Chemical group C1=NC=2C(=O)N3C(CC[C@H](NC(=O)OC)C(=O)OC)=C(C)N=C3N(C)C=2N1[C@@H]1O[C@H](CO)[C@@H](O)[C@H]1O QAOHCFGKCWTBGC-QHOAOGIMSA-N 0.000 description 1
- QAOHCFGKCWTBGC-UHFFFAOYSA-N wybutosine Natural products C1=NC=2C(=O)N3C(CCC(NC(=O)OC)C(=O)OC)=C(C)N=C3N(C)C=2N1C1OC(CO)C(O)C1O QAOHCFGKCWTBGC-UHFFFAOYSA-N 0.000 description 1
- 210000005253 yeast cell Anatomy 0.000 description 1
Images


Classifications
-
- G—PHYSICS
- G01—MEASURING; TESTING
- G01N—INVESTIGATING OR ANALYSING MATERIALS BY DETERMINING THEIR CHEMICAL OR PHYSICAL PROPERTIES
- G01N33/00—Investigating or analysing materials by specific methods not covered by groups G01N1/00 - G01N31/00
- G01N33/48—Biological material, e.g. blood, urine; Haemocytometers
- G01N33/50—Chemical analysis of biological material, e.g. blood, urine; Testing involving biospecific ligand binding methods; Immunological testing
- G01N33/68—Chemical analysis of biological material, e.g. blood, urine; Testing involving biospecific ligand binding methods; Immunological testing involving proteins, peptides or amino acids
- G01N33/6803—General methods of protein analysis not limited to specific proteins or families of proteins
- G01N33/6842—Proteomic analysis of subsets of protein mixtures with reduced complexity, e.g. membrane proteins, phosphoproteins, organelle proteins
-
- B—PERFORMING OPERATIONS; TRANSPORTING
- B82—NANOTECHNOLOGY
- B82Y—SPECIFIC USES OR APPLICATIONS OF NANOSTRUCTURES; MEASUREMENT OR ANALYSIS OF NANOSTRUCTURES; MANUFACTURE OR TREATMENT OF NANOSTRUCTURES
- B82Y10/00—Nanotechnology for information processing, storage or transmission, e.g. quantum computing or single electron logic
-
- B—PERFORMING OPERATIONS; TRANSPORTING
- B82—NANOTECHNOLOGY
- B82Y—SPECIFIC USES OR APPLICATIONS OF NANOSTRUCTURES; MEASUREMENT OR ANALYSIS OF NANOSTRUCTURES; MANUFACTURE OR TREATMENT OF NANOSTRUCTURES
- B82Y5/00—Nanobiotechnology or nanomedicine, e.g. protein engineering or drug delivery
-
- G—PHYSICS
- G01—MEASURING; TESTING
- G01N—INVESTIGATING OR ANALYSING MATERIALS BY DETERMINING THEIR CHEMICAL OR PHYSICAL PROPERTIES
- G01N33/00—Investigating or analysing materials by specific methods not covered by groups G01N1/00 - G01N31/00
- G01N33/48—Biological material, e.g. blood, urine; Haemocytometers
- G01N33/50—Chemical analysis of biological material, e.g. blood, urine; Testing involving biospecific ligand binding methods; Immunological testing
- G01N33/53—Immunoassay; Biospecific binding assay; Materials therefor
- G01N33/536—Immunoassay; Biospecific binding assay; Materials therefor with immune complex formed in liquid phase
- G01N33/542—Immunoassay; Biospecific binding assay; Materials therefor with immune complex formed in liquid phase with steric inhibition or signal modification, e.g. fluorescent quenching
-
- G—PHYSICS
- G01—MEASURING; TESTING
- G01N—INVESTIGATING OR ANALYSING MATERIALS BY DETERMINING THEIR CHEMICAL OR PHYSICAL PROPERTIES
- G01N33/00—Investigating or analysing materials by specific methods not covered by groups G01N1/00 - G01N31/00
- G01N33/48—Biological material, e.g. blood, urine; Haemocytometers
- G01N33/50—Chemical analysis of biological material, e.g. blood, urine; Testing involving biospecific ligand binding methods; Immunological testing
- G01N33/68—Chemical analysis of biological material, e.g. blood, urine; Testing involving biospecific ligand binding methods; Immunological testing involving proteins, peptides or amino acids
- G01N33/6803—General methods of protein analysis not limited to specific proteins or families of proteins
Definitions
- the present invention relates to the monitoring of protein synthesis by ribosomes, and in particular to such monitoring being performed in real time.
- Proteomics is an emerging technology that attempts to study proteins on a large scale in high-throughput. It is not by chance that the term resembles "Genomics".
- proteins are the main vehicles of life processes: they are the biochemical enzymes, form the signal pathways, control the cellular processes, underpin the cell scaffolding, transport molecules and so on. They are also potentially more valuable than DNA in terms of human benefit, due to their importance in human disease: most known drugs are either proteins themselves, or else operate by binding to a protein target. Unfortunately, proteins are also so much more complex and difficult to study than DNA. They are more complex for a number of reasons.
- proteins there are many more proteins than there are genes; protein expression is complex and has a high dynamic range - from single copies to millions per cell; the proteome of one cell type may be very different than that of another, even though their DNA is identical; and proteins may undergo dramatic changes in their structure - through cleavage, modification, and interaction.
- Proteins are more difficult to study than DNA, since protein extraction, separation and identification are difficult; there is no amplification technique that parallels PCR; three-dimensional protein structure is hard to obtain and use; protein expression has high dynamic range; protein modifications, cleavages and interactions are to a large extent unknown; and, finally, both as cause and effect, protein databases are thin and sparsely populated, encompassing a small fraction of all theoretical proteins, especially in higher organisms, such as Homo sapiens.
- Proteomics and Genomics are similar: both raised high hopes of creating a paradigm shift, a breakthrough that will yield a new understanding of cellular processes and human disease, and pave the way to a bounty of new drugs and therapeutics.
- genomic and proteomic data is extremely valuable, it is far from sufficient for achieving the breakthrough that was hoped for ( Miklos, G.L. and Maleszka, R., Protein functions and biological contexts. Electrophoresis 22:169-178, 2001 ). So many pieces of the puzzle are still missing that the clear and complete view of cellular machinery remains hidden.
- One important piece of this puzzle is protein synthesis data- which proteins are produced at which times, under which conditions, and in which amounts. The ability to study and monitor this type of data would be a major breakthrough for all life science related research.
- Mainstream proteomic analysis today includes the processes of protein purification from culture, separation with two-dimensional gel or other chromatographic techniques, mass-spectrometry, and analysis of the resulting spectra for protein identification and characterization.
- two-dimensional gel technology can measure three important protein parameters: mass, pI, and quantity.
- mass the most that may be obtained from gel technology is relative quantitation, and even that at accuracies worse than 50% error- so that only proteins with very strong up- or down-regulation can be identified.
- quantitation at best means quantity of protein in the extracted, processed sample, such as in a gel spot or in a chromatographic fraction; estimation of protein copies in a cell at any given time is not even attempted today.
- MS analysis may be performed, either with a MALDI-TOF or with an LC-MS-MS machine ( Humphery-Smith I., Cordwell S.J., Blackstock W.P., Proteome research: complementarity and limitations with respect to the RNA and DNA worlds, Electrophoresis 18 (1997) 1217-1242 ; Yates J.R., Database searching using mass spectrometry data. Electrophoresis 1998, 19(6): 893-900 ).
- the main stages are spot picking from the gel followed by destaining, or alternatively chromatographic prefractionation, followed by protein digestion with a protease (almost invariably trypsin), mass-spectrometric analysis, and finally database searching, which is performed, surprisingly, only as a semiautomatic procedure with expert supervision and decision making - as in the stages of peak extraction and candidate selection.
- Protein chips are being developed in several labs ( Jenkins, R.E. and Pennington, S.R. Arrays for protein expression profiling: towards a viable alternative to two-dimensional gel electrophoresis? Proteomics. 2001 Jan 1(1):13-29 ). They generally fall into one of three classes: surface chemistry chips, antibody chips, or protein chips for determining protein-protein interactions. All of these may aid protein analysis in some way, but none of them provides the data that the disclosed method provides.
- Yeast-two-hybrid technique is a feat of bioengineering that helps discover protein-protein interactions ( Legrain, P. and Selig, L., Genome-wide protein interaction maps using two-hybrid systems. FEBS Lett. 2000 Aug 25; 480(1):32-6 ).
- the method is indirect in that the interactions occur in yeast or in bacteria, rather than in the original cells being analyzed. It is known to generate a large number of false-positives and also cannot generate dynamic information. Thus, there are clearly a number of significant differences between the present invention and the disclosed method.
- High throughput Screening is the standard route for drug discovery in the pharmaceutical industry.
- HTS relies on a simple assay, such as receptor binding or enzyme activity.
- the assay itself measures a single parameter, e.g. receptor binding. This measurement is initially the only information available on the suitability of the candidate compound as a potential drug.
- the rest of the required information - ADME-TOX for example - is either presumed to be known or else its acquisition is delayed till later stages in the process (see also next section).
- cell-based assays are newer to the pharmaceutical industry. They are usually used for lead optimization and predictive toxicology.
- a measurable cell characteristic has to be developed: this can be a fluorescent-tagged protein, an antibody based marker, or some measurable phenotypic characteristic of the cell.
- Modem examples include cancer-specific dyes (http://www.zetiq.com/site/cama.html) and genetically engineered cell lines ( Shen-Orr, S.S., Milo, R., Mangan, S., and Alon, U., Network motifs in the transcriptional regulation network of Escherichia coli. Nat Genet 2002, 31(1): 64-8; http://www.cellomics.com/ ).
- Cell based assays have many advantages over receptor binding assays. Cells offer better representations of a disease. By screening against disease pathways in whole cells, no prior assumptions are made about what makes a good target. However, cell based screening suffers from certain disadvantages. These disadvantages include the need to engineer a specific cell line with the required reporting capability, and the lack of information about the would-be protein target. In both assay types, standard and cell-based assays, high-throughput screening provides a minimal amount of information on a large number of compounds. This of course limits the scope of information obtainable, and the entire cascade of events following administration of the compound under analysis remains hidden from the researcher.
- US 6,210,941 relates to markers for the detection of nascent proteins translated with cellular or cell-free translation systems and discloses in particular a method for monitoring the synthesis of nascent proteins. It teaches the use of misaminoacylated tRNAs, which are characterized as tRNA molecules charged with anything but a native amino acid molecule, such as a native amino acid coupled with a chemical moiety, a non-native amino acid, an amino acid derivative or analog, or other detectable chemicals, any of which are referred to as "markers”.
- the misaminoacylated tRNAs incorporate their markers into the growing peptide chain during translation forming labeled nascent proteins which can be detected/quantified and isolated by the presence or absence of the marker.
- Said document further teaches that more than one type of marker may be utilized, specifically amino acids bearing distinct reporter molecules in which the interaction between the reporters causes them to be specifically detectable, e.g by resonant energy transfer. It is disclosed that such interactions require close proximity of the reporters, which may be enhanced by choosing tRNA species that will insert markers into positions that are close to each other in the structure of the protein. Such reporters allegedly enable the detection of proteins without purification or isolation from the synthesis system, and are further useful for determining the rate of synthesis of proteins and for optimizing synthesis.
- the deacylated tRNA occupies the P site in the ribosome, thus leaving only the A site for binding of the AcPhe-tRNA. Since the tRNA first added to the ribosomes and bound in the P site does not carry an amino acid, addition of tRNA charged or loaded with an amino acid to the A site can neither initiate peptide chain formation nor elongate any chain as there is no starting amino acid in the P site awaiting further amino acids to be added.
- unlabeled Phe-tRNA was added to ribosomes having labeled AcPhe-tRNA bound to the P site. Said unlabeled Phe-tRNA bound to the ribosomal A site. The authors prevented any formation of a peptide chain by preventing movement of tRNA from the P site to the E site and from the A site to the P site.
- the background art does not teach or suggest an assay for monitoring protein synthesis as it occurs, in real time.
- the background art also does not teach or suggest such an assay which is sensitive and which is also reliable as a whole-cell assay.
- the present invention overcomes these disadvantages of background art by providing a system and method for monitoring protein synthesis in a protein synthesis system.
- the method of the present invention is also referred to herein as "PSM" (protein synthesis monitoring).
- Protein synthesis is monitored by using a marker or a set of markers for protein synthesis in the system, which cause electromagnetic radiation to be emitted. The emitted electromagnetic radiation is then detected and can be analyzed to detect protein synthesis.
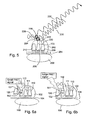
- the present invention provides a method for monitoring protein synthesis in a protein synthesis system, wherein the method comprises the steps of providing in the protein synthesis system at least one fluorescent donor-acceptor pair comprising a donor fluorophore and an acceptor fluorophore, suitable for performing fluorescence resonance energy transfer (FRET), wherein said donor fluorophore is covalently bound to at least one ribosome or a portion thereof, and said acceptor fluorophore is covalently bound to a tRNA, or vice versa; detecting in real time the FRET signals obtained by energy transfer between said donor fluorophore and said acceptor fluorophore; and analyzing said FRET signals to identify one or more proteins being synthesized.
- FRET fluorescence resonance energy transfer
- Said analysing comprises clustering the FRET signals into a list of signal sequences, transforming the signal sequences into one or more data stream of FRET on/off signals, processing the data stream to retrieve a list of protein sequences that match said data stream, and determining, for each of said protein sequence the probability that this protein is responsible for the signal sequence, thereby identifying at least one protein being synthesized.
- the system comprises a bacterium or bacterial culture.
- the system comprises at least one cell.
- the system comprises at least one of a cell-line or a cell culture.
- the system comprises a cell-free protein translation system (in-vitro translation system).
- the signal sequence comprises timing values, image coordinates and signal types or intensity of both the donor and acceptor.
- the fluorophore is a fluorescent protein, a fluorescent dye, or a quantum dot.
- the ribosomal portion is located at or near at least one ribosomal site selected from the ribosomal A site, the ribosomal P site, the ribosomal E site or peptide exit channel site.
- the ribosomal portion is selected from ribosomal RNA and a ribosomal protein.
- the ribosomal protein is selected from ribosomal protein L 1, ribosomal protein S 1 or a combination thereof.
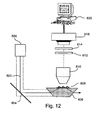
- the detecting comprises irradiating the system with electromagnetic radiation.
- the FRET signal is an emitted radiation detected with a microscope.
- the method is adapted to measure emitted radiation from a single ribosome, wherein said FRET pair is a single FRET pair.
- the method is adapted to measure signals from a plurality of ribosomes and analyzing the radiation emitted from said plurality of ribosomes.
- the detecting further comprises monitoring protein synthesis by detecting a plurality of protein synthetic processes over a period of time.
- the plurality of protein synthetic processes comprise a plurality of interactions between a ribosome and a plurality of different tRNA molecules.
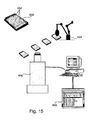
- the present invention provides an apparatus for measuring protein synthesis in a protein synthesis system.
- the apparatus comprises a container comprising a protein synthesis system comprising at least one fluorescent donor-acceptor pair comprising a donor fluorophore and an acceptor fluorophore, suitable for performing fluorescence resonance energy transfer (FRET), wherein said donor fluorophore is covalently bound to at least one ribosome or a portion thereof, and said acceptor fluorophore is covalently bound to a tRNA, or vice versa; a detection system for measuring FRET signals obtained by energy transfer between said donor fluorophore and said acceptor fluorophore, wherein said detection system operates in real time; and a computational device for analyzing the FRET signals.
- FRET fluorescence resonance energy transfer
- the computational device comprises a signal sequencer module for clustering the FRET signals into a list of signal sequences, a sequence analyzer module for transforming the signal sequences into one or more data stream of FRET on/off signals, a protein identification module for processing the data stream to retrieve a list of protein sequences that match said data stream, and a scorer module for determining, for each of said protein sequence the probability that this protein is responsible for the signal sequence, thereby identifying at least one protein being synthesized.
- the system comprises a bacterium or bacterial culture.
- the system comprises at least one cell.
- the at least one cell is at least one cell-line or cell culture.
- the system comprises a cell-free protein translation system (in-vitro translation system).
- the signal sequences comprise timing values, image coordinates and signal types or intensities.
- the fluorophore is a fluorescent protein, a fluorescent dye, or a quantum dot.
- the ribosomal portion is located at or near at least one ribosomal site selected from the ribosomal A site, the ribosomal P site, the ribosomal E site or peptide exit channel site.
- the ribosomal portion is selected from ribosomal RNA and a ribosomal protein. More preferably the ribosomal protein is selected from ribosomal protein L 1, ribosomal protein S 1 or a combination thereof.
- the detection system irradiates the system with electromagnetic radiation.
- the detection system comprises a microscope.
- the detection system measures emitted radiation from a single ribosome, wherein said FRET pair is a single FRET pair.
- the detection system measures a plurality of signals emitted from a plurality of ribosomes, and wherein the computational device performs signal analysis of emitted radiation from said plurality of FRET signals.
- the detection system monitors protein synthesis by detecting a plurality of protein synthetic processes over a period of time.
- the plurality of protein synthetic processes comprise a plurality of interactions of a single ribosome with a plurality of different tRNA molecules.
- the present invention provides a method for analyzing a chemical compound library.
- the method comprises the steps of providing a protein translation system, comprising at least one fluorescent donor-acceptor pair comprising a donor fluorophore and an acceptor fluorophore, suitable for performing FRET, wherein said donor fluorophore is covalently bound to at least one ribosome or a portion thereof, and said acceptor fluorophore is covalently bound to a tRNA, or vice versa; administering each of the compounds to the protein translation system; measuring a response of said system according to the method disclosed above; and analyzing said measurement to provide information about said compound.
- the present invention provides a method for determining cellular protein pathways.
- the method comprises the steps of selecting a cellular or bacterial culture; placing said culture in a plurality of sample containers, subjecting said culture to at least one condition in each of said containers; measuring protein synthesis in each of said containers according to the method disclosed above; and analyzing protein expression patterns in all containers to determine protein pathways.
- the present invention provides the use of the apparatus disclosed above for detecting a pathological condition in a subject.
- the synthesis marker enables the present invention to detect which tRNA is currently being processed by a ribosome, which mRNA codon is being read, or which amino acid is currently being added to the nascent protein. This signal can be captured and analyzed in seconds to reveal the protein's identity. The procedure can be performed for hundreds of ribosomes simultaneously, and so provide, for the first time in biology, a tool for dynamic monitoring of protein synthesis.
- the effects of potential drugs can be assayed to determine the proteins that are being up- or down-regulated by a compound, as well as to determine the sequence of events; protein pathways can be identified by interpretation of the changing translation patterns, noting which proteins are just beginning to be translated and which are ceasing to be translated; rare, hydrophobic, and heavy proteins can be identified at the same efficiency as any other protein; cell-free translation systems can be monitored in real-time and protein production processes can be monitored and optimized.
- Donor and acceptor are selected so that the donor can transfer energy to the acceptor when the donor is excited and the acceptor is in close proximity to the donor.
- a light source illuminates the ribosome, exciting the donor fluorophores and thereby the acceptor fluorophores which are within sufficient proximity of corresponding donors.
- the resulting signals are detected by appropriate optical apparatus and collected by a computerized analysis system as digital data. This digital data may be used as a key for database searching and identification of the protein being synthesized at that moment.
- Protein synthesis information can be tabulated to correlate with chemical or environmental effects applied to the cells being studied.
- the present invention is able to decipher the functionality of chemical compounds; elucidate cellular proteomic mechanisms; control protein production systems; and help study the factors affecting protein synthesis.
- the present invention has many advantages, of which only a few are listed herein. These advantages include but are not limited to, real-time, optionally in-vivo, monitoring of protein synthesis, unprecedented sensitivity, highly accurate quantitation, the ability to monitor cellular events through protein synthesis, the ability to complement other methods such as protein tagging for monitoring protein localization and degradation, elucidation of protein pathways and interactions, and support of protein function analysis.
- the present invention can also optionally be used to monitor protein production and assist in process optimization and control.
- the present invention also has the advantage of providing an assay for protein synthesis which is optionally cell based.
- cell based assays have many advantages over receptor binding assays. Cells offer better representations of a disease. By screening against disease pathways in whole cells, no prior assumptions are made about what makes a good target. However, cell based screening assays, as for other screening assays, provide only a binary, or yes/no answer, for a given compound. This type of answer limits the scope of information obtainable, and causes the entire cascade of events following administration of the compound under analysis to remain hidden from the researcher.
- the present invention has a number of other, additional advantages over background art techniques.
- the present invention provides comprehensive information about protein production in the cell, showing precisely how, when, in what order and in what amounts does the cell respond to the compound following administration.
- the target itself can be seen in the context of other proteins that are co-synthesized with it, before it, or after it; connections with other proteins can be identified.
- the compound can be seen in the context of other compounds that elicit a similar response, allowing SAR and QSAR analyses to be performed.
- the technique holds the important promise of both widening and shortening the drug development process by early removal of compounds from the pipeline, by providing a much larger amount of information about a candidate drug much earlier in the process, and by allowing more compounds and targets to enter this process.
- the present invention has the potential to produce many more drugs in shorter time and with smaller expenditure.
- Another important application of the present invention is as a tool for process optimization, process control and quality control of protein production, either in bio-reactors using bacteria or cell culture, or else in cell free translation systems.
- the present invention can provide indispensable information about the amounts of the target protein being produced, as well as on the precise structure of the proteome backdrop to this manufacturing, ensuring that the desired protein is produced in precisely the required environment.
- This level of control unavailable today, can create a revolution in the way proteins and protein drugs are produced and certified. This can lead to new protein production methods that are easier to control than current ones.
- Fluorescence resonance energy transfer - FRET- has been known for over 50 years ( Ha, T., Single-molecule Fluorescence resonance energy transfer, Methods 25, 78-86 (2001 ), review; De Angelis, D.A., Why FRET over genomics? Physiol. Genomics 1999, 31; 1(2): 93-9 ; Selvin, P.R., The renaissance of fluorescence resonance energy transfer, Nat. Struct. Biol. 2000 Sep;7(9):730-4 ; Kenworthy, A.K, Imaging Protein-Protein Interactions Using Fluorescence Resonance Energy Transfer Microscopy, Methods. 2001 Jul;24(3):289-96 ).
- the technology allows measurement of distances in the nanometer scale up to about 10 nanometers.
- Figure 1 shows a diagram of FRET pair configuration.
- Figure 1A the spectral graphs of donor excitation 250 , donor emission 252 , acceptor excitation 254 and acceptor emission 256 are shown. Note the overlap between the spectral responses of donor emission and acceptor excitation.
- Figure 1B the efficiency of energy transfer is shown as a function of donor-acceptor normalized distance (R 0 is equivalent to 50 in this chart).
- FRET has been recently used to sequence DNA ( Bralavsky, I., Sequence information can be obtained from single DNA molecules, Proc Natl Acad Sci USA., 2003 Apr 1;100(7):3960-4 .), monitor cellular events in live cells ( Zlokrnik et al., Quantitation of transcription and clonal selection ofsingle living cells with beta-lactamase as reporter, science 1998 Jan 2;279(5347):84-8 )), create sensitive biochemical sensors ( Medintz et al., Self-assembled nanoscale biosensors based on quantum dot FRET donors, Nat Mater.
- FRET architecture may make use of a donor-quencher pair rather than a donor-acceptor architecture; for this, the donor-quencher pair forms the marker.
- This implementation is a more robust architecture, allowing the use of metal and other particles instead of fluorescent biomolecules.
- the signal then measured is in fact the donor signal, interrupted by periods of quenching.
- the ribosome itself is composed of two subunits, termed 30S and 50S (there are differences between bacterial and eukaryotic ribosomes- henceforth in this discussion the ribosome is presumed to come from E. coli , although this assumption is made for the purposes of description only and without any intention of being limiting in any way).
- the large unit is composed of a pair of large RNA molecules (5S and 23S), the small subunit of a single RNA molecule (30S). Each unit has several dozen small proteins attached to it ( Alberts, B., Johnson, A., Lewis, J., Raff. M., Roberts, K., and Walter, P., Molecular Biology of the Cell, 4th ed, 2002, Garland Science, N.Y .).
- the ribosome reads the code on mRNA molecules and synthesizes the encoded protein through the mediation of tRNA molecules. The process is performed in three stages: initiation, elongation and termination.
- the ribosome uses an adaptor molecule - transfer RNA, or tRNA. These molecules are a special type of RNA. At one end, they have the anticodon part that binds to the RNA codon. At the other end, they carry the amino acid corresponding to that codon.
- Figure 2A shows a tRNA molecule 2 , with the anticodon loop 4 , the amino acid arm 6 , and a loaded amino acid 8 .
- the tRNA molecules have a cycle of being charging with amino acid and discharging. Charging, or attachment of amino acids to the tRNA molecules, is performed by the aminoacyl-synthetase enzyme family. Discharging is performed by the ribosome, serving as a ribozyme (RNA enzyme).
- tRNA When tRNA is tagged (as for example with a fluorescent label), the tRNA should continue to function normally during the processes of becoming charged with an amino acid, attaching to the elongation factors, and traveling through the ribosome.
- tagging schemes have made use of the shoulder 10 of the molecule in order to create fluorescent labeling schemes that are efficient on the one hand and result in a fully functional tRNA molecule on the other hand.
- coli tRNAs can be efficiently labeled at position 8, which has in many cases a 4-thiouridine base, and at position 47, which has in several cases an amine-reactive X-base (see table below; it should be noted that these position numbers are given according to a standard numbering system for tRNA molecules).
- tRNA functionality requires that the molecule interact properly with the aminoacyl synthetases on the one hand, and with the ribosomal machinery (including the elongation factors) on the other.
- tRNA recognition by aminoacyl synthetases is known to be particularly dependent on the anticodon part and the amino acid arm locus.
- FIG. 2B shows a schematic description of bacterial ribosome structure with the larger (50S) subunit 20 , smaller (30S) subunit 25 , aminoacyl (A) site 50 where tRNAs dock initially, peptidyl (P) site 51 where the growing polypeptide chain is docked, and exit (E) site 52 from where the deacylated tRNA is removed once the cycle is complete.
- tRNAs that are undocked yet 40 and 41 to show that the cycle may continue further, mRNA being decoded 30 and the nascent polypeptide chain being synthesized 45 .
- the ribosome itself is made up of large folded rRNA chains with ribosomal proteins.
- the larger subunit 20 contains two folded rRNAs, known as 23S and 5S.
- the smaller subunit 25 contains one folded rRNA, 30S (not shown). On the folded rRNA chains more than 50 ribosomal proteins are docked (not shown).
- L1, L2 etc for the approximately 36 ribosomal proteins attached to the large subunit
- S1, S2 etc for the approximately 21 ribosomal proteins attached to the small subunit (numbers given are correct for E. coli ribosomes).
- FIG. 2B Three docked tRNAs are seen in Figure 2B .
- the first 42 is in the A (Aminoacyl) site; the second 43 in the P (Peptidyl) site, and the amino acid it carries is at this point connected to the nascent peptide; the third 44 is in the E (exit) site, it has been discharged from the amino acid and will be ejected shortly from the ribosome.
- the heavy line 30 indicates the mRNA being translated, and the dotted line 45 represents the polypeptide being synthesized, tied into the Peptidyl position.
- Stage 1 Codon recognition. A tRNA molecule carrying an amino acid binds to a vacant A-site, while the nascent polypeptide is attached to the P-site.
- Stage 2 Peptide bond creation. A new peptide bond is created and the polypeptide chain is moved to the A-site.
- Stage 3 Translocation. The ribosome translocates a distance of 3 nucleotides with respect to the mRNA, the two tRNA units and the polypeptide chain.
- Stage 4 the cycle repeats itself until a stop codon is reached.
- Stage 1 - Codon recognition- is shown in Figure 3A .
- a tRNA molecule 800 carrying an amino acid 802 binds to a vacant A-site 820 , while the growing polypeptide chain 810 is attached to amino acid 806 on tRNA 804 that is docked in the P-site 822 .
- E site 824 is shown as empty.
- Stage 2 peptide bond formation, is shown in Figure 3B .
- a new peptide bond is created between amino acid 806 and amino acid 802 , and the polypeptide chain 810 is moved to the A-site 820 .
- Stage 3, translocation, is shown in Figure 3C .
- the ribosome translocates 3 nucleotides with respect to the mRNA, the two tRNA units 800 and 804 , and the polypeptide chain 810 .
- Stage 4 the cycle repeats itself until a stop codon is reached.
- FRET detection Single pair FRET - spFRET.
- FRET pairs are attached to the biomolecules of interest, whether in-vitro or in-vivo, and observed by a single-molecule microscopy system. If the FRET pairs are separated by distances that are within the resolution limit of the imaging device, single interactions can be observed.
- FRET technique combines naturally with single molecule detection methods. A good practical review of the technology and its usage can be found in Ha, T, Single-molecule fluorescence resonance energy transfer, METHODS 25, 78-86 (2001 ).
- sampling rate or frame rate of the system.
- the ribosome synthesizes polypeptides at the rate of about 20 amino acids per second.
- the rate is about an order of magnitude lower. If the FRET signal is assumed to be "on" for about half the synthesis cycle, and if at least 4-5 samplings are required for reliable detection, then a sampling rate of about 200 frames per second is required for prokaryotes.
- a ribosome has a diameter of about 20nM, and the distance between two ribosomes (on the same mRNA strand) is on the order of 40nM.
- the resolution of standard optical microscopes, at their diffraction limit, is about 180nM, and for practical resolution of active PSM signals we should assume a distance at least 4 times larger.
- a realistic computation assumes one PSM signal per square micron.
- the field of view is 100 microns square, which typically holds 100 eukaryotic cells and can resolve hundreds and even thousands of ribosomes.
- Fusion proteins are engineered proteins whose amino acid sequence includes two parts: the first part contains the sequence of the fluorescent marker protein and the second part contains the protein of interest to which the fluorescent marker is attached. Fusion proteins with naturally fluorescent proteins can be generated using the method of Baubet et al. (Proc. Natl Acad. Sci. USA 97:7260-5, 2000 ).
- Green fluorescent protein (GFP) and its derivatives include a chromophore built of amino acids located in the center of the molecule.
- GFP excels in being photostable as well as having numerous variants with a choice of excitation and emission wavelengths ( U.S. Patents 5,626,058 and 5,777,079 ; Touchberg et al., Clin Chem. 2002 Oct;48(10):1819-27 ; Hailey et al., Methods Enzymol. 2002;351:34-49 ).
- GFP can be attached to a ribosomal protein through the method of generation of a fusion protein, by well-known recombinant techniques as explained, for example, in Molecular Cloning, A Laboratory Manual, cold Spring Harbor Laboratory, Cold Spring Harbor, New York, chapter 17, 1989 .
- a cell that is engineered to produce this fusion protein can produce ribosomes that include the engineered ribosomal protein as required.
- a comprehensive treatment of green fluorescent protein is Chalfie, M. & Kain, S. (1998) Green fluorescent protein: properties, applications, and protocols, eds. Chalfie, M. & Kain, S. (Wiley-Liss, New York ).
- Quantum dots Another relevant technology is that of semiconductor quantum dots, which has matured sufficiently to be used routinely to label biomolecules ( Jovin, T.M., Quantum dots finally come of age, Nat Biotechnol. 2003 Jan;21(1):32-3 and references therein, Medintz, I.L. et al., Self-assembled nanoscale biosensors based on quantum dot FRET donors, Nat Mater. 2003 Sep;2(9):630-8 ).
- Quantum dots are currently manufactured as colloidal inorganic semiconductor nanocrystals consisting of a CdSe core and a ZnS cap. The absorption spectra of these dots are very wide, while the emission is very narrow (20-40nm FWHM).
- the emission spectrum can be controlled by the size of the dot, where larger dots emit longer wavelengths.
- quantum dots are practically immune to photobleaching, such that monitoring can optionally be performed for minutes or even hours, in contrast with traditional probes, that may bleach out after a few seconds. This is important for this optional application since a protein synthesis monitoring system should be able to monitor protein production over a period of hours.
- a hybrid inorganic-bioreceptor sensor has been produced, where the quantum dot serves as FRET donor and an organic dye as a quencher.
- the use of a quantum dot as a FRET donor is an important optional application for the present invention, as discussed below.
- Quantum dots individually encapsulated in phospholipid block-copolymer micelles have been injected into Xenopus embryo cells, and the embryo development has been followed for several days ( Dubertret et al., "In-vivo imaging of quantum dots encapsulated in phospholipid micelles", Science. 2002 Nov 29;298(5599):1759-62 ).
- Quantum dots are commercially available from Quantum Dot Corporation, Hayward, Ca. These are available ready for use in biological assays, with several surface treatments-biotinylated, conjugated with strepavidin, or conjugated to Protein A. Several spectral profiles are offered for each product. Detailed protocols are available from www.qdots.com.
- the protein to be labeled is genetically fused to a short peptide containing a CCXXCC motif
- the fluorescent label, FlAsH is a derivative of fluorescein that contains two arsenoxide groups.
- the FlAsH label is membrane-permeant and non-fluorescent, acquiring fluorescence only on binding to the CCXXCC motif
- In-vitro translation can be performed using kits such as the nuclease-treated rabbit reticulocyte lysate available from Promega, (Madison, WI). Before in-vitro translation, cellular mRNAs are heated at 67 °C for 10 min to unfold secondary structures that would eventually affect the efficiency of mRNA translation. Reactions are then assembled as recommended by the supplier in the presence of 20 mCi of [35 S ]methionine (ICN Biochemicals). Protein synthesis occurs during incubation at 30° C. Customarily, the resulting proteins are purified and analyzed by radiolabeling.
- the procedure requires centrifugation, rinsing and immune-precipitation followed by separation on SDS-polyacrylamide gels. Following electrophoresis, gels are exposed to film or Phosphor B1 screens, and the bands corresponding to the synthesized protein verified. For PSM applications, radiolabeling of protein products may optionally be performed but is not required.
- cell-free translation systems could optionally produce one protein or many proteins, and their identification and production rates could be measured, controlled, and optimized in real time. This can lead to new protein production methods that are easier to control than the customary methods of bio-production in reactors with bacteria, yeast or CHO-cells, for example. Since the in-vitro translation system is fully controllable, and since it also allows co- and post-translational modifications, this method is an attractive alternative to current technologies.
- Biomolecules can be attached specifically or non-specifically, and in either case, either ribosomes or mRNA templates can be immobilized.
- DNA or RNA can be attached to a charged surface such as an aminopropylsilane-coated surface via electrostatic interaction, as described in 8. Ha, T. et al., (1996) Proc. Natl. Acad. Sci. USA 93, 6264-6268 . Even though this method avoids DNA aggregation and works in water, this immobilization method may interfere with the properties or activity of the ribosome.
- Another nonspecific immobilization method successfully used for single-molecule fluorescence study is trapping molecules inside polyacrylamide pores ( Dickson, R. M., et al., (1996) Science 274, 966-969 ) or agarose gel ( Lu,H. P., et al., (1998) Science 282, 1877-1882 ., Dickson, R. M., et al., (1997) Nature 388, 355-358 .).
- gel immobilization has the merit of not requiring any special modification of the biomolecule, it has some disadvantages.
- the concentration of other small molecules such as enzyme substrates and ions is difficult to change in a short time. Sudden changes in the buffer conditions are necessary for a certain type of single-molecule studies.
- a biotin or a digoxigenin can be attached to an mRNA, rRNA or ribosomal protein, to immobilize them to streptavidin- or antidigoxigenin-coated surfaces respectively.
- histidine tags that are typically introduced to help the purification of recombination proteins can be used to immobilize a ribosomal protein on a Ni-NTA-coated surface.
- a surface can be densely coated by polyethylene glycol (PEG).
- PEG polyethylene glycol
- Bifunctional PEG can be used immobilize nucleic acids specifically to a surface while rejecting protein adsorption.
- mRNA can be optionally immobilized on a polyethylene glycol (PEG) coated surface with biotin-streptavidin linker, and the ribosomes allowed to process the immobilized mRNA.
- the mRNA preferably features 3'-end biotin labeling. Since protein synthesis may not end normally because of the linked 3' end, it is advisable to ensure that the template mRNA continues for at least 20 codons beyond the stop codon.
- a ribosomal protein in another approach, can be labeled with biotin and immobilized on a fused glass slide. The other ribosomal components can then be reconstituted around the immobilized protein. Ribosomal complexes can also be bound to a mica surface, which is transparent and flat on a molecular size scale. Ribosomes, either labeled or unlabeled, undergo binding to mica in a few seconds, allowing the detection of single fluorescence images in aqueous buffer. A large excess of ribosomes and a short incubation period are employed for single molecule detection. The mica-bound ribosomes retain their activities, as shown in Sytnik et al., J. Mol. Biol.
- ADME-TOX A set of parameters relevant to drug candidates that should be measured prior to clinical trials ( A bsorption, D istribution, M etabolism, and E xcretion) and TOX ( T oxicity)
- APD Avalanche photodiode, a sensitive detector of faint optical energy.
- CCD Charge coupled device, a photo sensitive semiconductor device usually arranged as a one- or two-dimensional array of photo sensitive cells.
- CHO Chinese hamster ovary cell line.
- FRET Fluorescence resonance energy transfer. A method by which molecular distances of the order of few nanometers can be determined using appropriate fluorophores.
- FWHM Full width half maximum, a measure of signal resolution in spectrometry.
- GPCR Cell surface receptors that are coupled to heterotrimeric G-proteins (GTP-binding proteins).
- HTS High throughput screening, a method used in drug discovery by which a large library of chemical compounds is assayed for binding to a specific receptor.
- ICAT a method of sample tagging that allows relative quantitation of proteins in two samples using LC-MS-MS.
- LC-MS a mass spectrometer that is directly coupled to a liquid chromatography column, and where ionization commonly is achieved with the electrospray method.
- LC-MS-MS a mass spectrometer of the LC-MS type where ions are further fragmented and the mass spectrum of the fragments is measured. Often used to identify sequences of tryptic peptides.
- MALDI-TOF mass spectrometer that ionizes the sample with the technique of matrix-assisted laser desorption ionization, and measures masses using a time-of-flight mass analyzer.
- NA numerical aperture (of a lens).
- ORF Open reading frame. A putative protein-encoding gene.
- PCR Polymerase chain reaction, a method for in-vitro amplification of DNA.
- PEG polyethylene glycol
- PMT photomultiplier tube, a sensitive photodetector.
- PSM Protein synthesis monitoring
- tRNA transfer RNA, the adaptor molecule that delivers amino acids to the ribosome.
- mRNA messenger RNA, the template by which proteins are synthesized.
- rRNA ribosomal RNA, one of the RNA strands that are part of the ribosome.
- SHIM Second harmonic imaging microscopy.
- TIR Total internal reflection
- TIR-FM total internal reflection fluorescent microscopy.
- TPE two photon excitation, an illumination method for special microscopy applications.
- TPM Two Photon microscopy, a microscopy system that uses TPE illumination.
- Y2H A method for detecting protein-protein interaction in-vivo in Saccharomyces cerevisiae.
- the present invention is of a system and method for monitoring protein synthesis in a protein synthesis system, by using a marker for protein synthesis in the system, which causes electromagnetic radiation to be emitted.
- the protein synthesis system may comprise a single ribosome, or alternatively a plurality of ribosomes.
- the marker comprises at least one photo-active component.
- monitoring includes at least the initial detection of a protein synthetic act or process, such as an interaction between a tRNA and a ribosome for example, in real time. Monitoring may include identification of the tRNA or tRNA species, amino acid or amino acid species, codon or codon species that are being processed. Monitoring may include detecting a plurality of such synthetic acts, such as a plurality of interactions between a ribosome and a plurality of different tRNA molecules for example. Monitoring includes identifying the protein being synthesized. Such monitoring is performed with a protein synthesis system, including a single ribosome or a plurality of ribosomes, with tRNA or tRNA species and/or other protein synthetic components as required, in vivo or in vitro.
- the marker enables the present invention to detect which tRNA is currently being processed by a ribosome, which mRNA codon is being read, or which amino acid is currently being added to the nascent protein. This signal can be captured and analyzed in seconds to reveal the protein's identity.
- the procedure can be performed simultaneously for hundreds of single ribosomes, in vitro or in vivo and so provide, for the first time in biology, a tool for dynamic monitoring of protein synthesis.
- the present invention may be implemented with a cell that is stably engineered, for example through genetic engineering, to form a stable cell culture and/or cell line.
- the cell may optionally be transiently altered or engineered; also a combination of these techniques may be employed, for a single cell or a plurality of cells.
- the present invention may be used for performing a screening assay by detecting or monitoring the protein synthetic act.
- the screening assay may be for detecting a pathological condition in a subject, such as cancer for example.
- the present invention may also be used for pathway elucidation by detecting or monitoring the protein synthetic act.
- the present invention may also be used for cell state analysis by detecting or monitoring protein synthetic act, for example by identifying the synthesis of proteins related to apoptosis, heat shock, DNA damage repair, budding, or any other cell state.
- the ribosome of a live bacterium, cell, or an in-vitro translation mechanism is tagged with a donor fluorphore.
- One or more types of acceptor fluorophores are placed on some of the tRNAs and/or on some of the amino acids and/or on another part of the ribosome.
- a FRET signal is generated when labeled tRNAs, labeled amino acids or appropriate codons are processed. Since only some and not all species of tRNA or amino acids or codons are designed to generate a signal, the resulting signal is a characteristic of the protein being translated, and so, with an appropriate method of signal analysis, this protein may optionally be identified.
- An optical apparatus monitors a marked protein synthesis system (a system featuring at least one marker according to the present invention), optionally by directing electromagnetic radiation of the required wavelength and energy onto the marked system, thereby exciting the donor fluorophores.
- Fluorescence radiation emitted from the acceptor fluorophores is detected by the optical apparatus and the event is recorded by a computerized analysis unit Since only some of the elongation cycles but not all of them generate a signal, the resulting sequence of detection events is a characteristic of the protein being synthesized.
- this signal sequence may optionally be described as a bit stream with zeroes and ones. The stream contains some uncertainty as to the number of bits in each field, as well as other elements of uncertainty.
- the signal is subsequently used to interrogate a database of signals computed from a relevant database of protein sequences. The method disclosed herein describes how to use this signal to identify the protein that is most likely to have produced the signal.
- the method can be able to consider the precise nature of the uncertainty in the detected signal sequence, in order to provide a scoring function that is able to compute the measure of likelihood, for each protein in the database, that this protein species is the one whose synthesis produced the signal sequence that was detected.
- R-T tagging or labeling may optionally include a fluorescent labeling method in which the ribosome and tRNA form a FRET pair.
- Figure 4 shows a specific example of this strategy.
- R-T tagging involves placing a donor on the ribosome and an acceptor on some of the tRNAs. Methods of tagging tRNAs and ribosomes are discussed below.
- the tag can be placed either near the A, the P, or the E site.
- a ribosomal locus near the E site may be tagged. This ensures that the tRNA is identified after the proofreading stage.
- ribosomal proteins may be tagged.
- Several ribosomal proteins are known to be near the E site, such as ribosomal proteins L1, S1 and S21. Experiments have shown that these proteins can be efficiently tagged while retaining ribosome functionality.
- FIG. 4 shows one example of the R-T tagging strategy.
- Ribosome large subunit 160 and small subunit 164 are attached to an mRNA 162 being processed.
- tRNA 170 (with amino acid 180 ) is in A site 171
- tRNA 172 (with amino acid 182 ) in P site 173, tRNA 174 in E site 175 .
- tRNA 176 has just been ejected out of the E site and tRNA 178 is already free of the ribosomal-mRNA complex.
- the growing polypeptide chain 184 is also shown.
- Donor fluorophore 190 is located on ribosomal protein L1, which is attached to large ribosome subunit 160 , just outside the mRNA exit channel (not shown), in proximity to the E site.
- tRNA 176 in this Figure is labeled with a fluorescent label 192 and therefore is in close proximity to the donor fluorophore 190 .
- the donor fluorophore emission spectrum overlaps the excitation spectrum of acceptor fluorophore 192 .
- Radiation energy 194 is made to impinge on donor fluorophore 190 and excite it, causing part of the energy to transfer to acceptor fluorophore 192 , exciting it and causing emission of FRET signal 196 of a lower energy and therefore higher wavelength.
- tRNA 192 When tRNA 192 is not of a tRNA species that has been labeled, a FRET signal is not emitted. Thus, as the ribosome processes the mRNA, an on-off signal is detected by the system that corresponds to the tRNA labeling scheme being used and therefore characterizing the protein being synthesized, allowing the identification of the protein being synthesized.
- R-A tagging or labeling is another example described, in which the ribosome and an amino acid form a FRET pair and/or other donor/acceptor pair and/or fluorescent/quencher pair.
- the donor tag is placed near the peptide exit channel, and so is able to excite the acceptor fluorophores on the amino acids, either natural or engineered.
- the detected FRET signal correlates with the amino acid sequence of the protein being synthesized; however, the proteins include labeled amino acids and are therefore no longer completely natural, a fact which may influence the functioning of the cellular mechanism.
- Ribosome small subunit 200 and large subunit 202 are attached to RNA 204 being processed.
- tRNA 206 is docked in the A site and carries amino acid 220 .
- tRNA 208 is docked in P site and carries amino acid 222 .
- tRNA 210 is docked in the E site and its amino acid has already been removed.
- Donor fluorophore 226 is attached to the ribosome in a location near the exit location of the peptide channel (not shown).
- Donor fluorophore 226 is illuminated with electromagnetic radiation 230 of a frequency compatible with its excitation frequency.
- Emission frequency of donor fluorophore 226 overlaps the excitation frequency of acceptor fluorophore 228 .
- Acceptor fluorophore can be either natural, as in the amino acids tyrosine, tryptophan and phenylalanine for example, or else can be artificially labeled as explained below.
- a FRET 232 signal is generated when acceptor fluorophore 228 passes sufficiently close to donor fluorophore 226.
- unlabeled amino acids are in this position, a FRET signal is not generated.
- an on-off signal is generated that is characteristic of the protein being synthesized, allowing it to be identified.
- R-R tagging or labeling is another example described in which two locations on the ribosome, optionally covalently bound or non-covalently associated moieties, form a FRET pair and/or other donor/acceptor pair, and/or fluorescent/quencher pair.
- both donor and acceptor tags are attached to the ribosome; the combination of both tags may optionally be described as a marker for the present invention.
- One tag (“base”) is preferably located on a fixed part of the ribosome, which makes it static.
- the other (“lever”) is preferably an appendage engineered to be attached to the ribosome, covalently or non-covalently, and is capable of moving in one prescribed direction - towards or away from the location of the mRNA as it exits the ribosome.
- the lever mimics a tRNA molecule in order to recognize exiting mRNA codons.
- the lever is preferably constructed to bind weakly to a specific nucleotide triplet or pair, as in the case of codon-anticodon recognition rules. If, for example, the lever is designed to recognize the nucleotide pair GC, whenever the mRNA sequence contains a GC in the appropriate position, the lever goes “down” and binds to GC, preferably causing a fluorescent signal to be generated or quenched (or optionally a combination, if a plurality of fluorescent moieties is present). For other pairs, the lever stays “up” and this signal is not generated or quenched (or the combination is not generated). The FRET or other type of signal thus marks the advance of the mRNA with a bimodal response. This example has the important benefits of leaving the translation mechanism almost entirely natural - tRNAs and amino acids are completely natural, only an external part of the ribosome has been tampered with.
- the lever is a preferably a modified tRNA molecule, with a "codon loop” and a relatively long and rigid arm, connected to a "hinge". This can be engineered to stem out of a single strand rRNA loop.
- the ribosomal RNA has numerous stretches of single strands, extending from a few bases to a few dozen bases. These single strand loops are convenient for placing an extension that has the required biochemical and physical characteristics.
- the pseudo-anticodon part of the lever is constructed to bind weakly to a specific nucleotide pair, such as GC in the example.
- the mechanism is shown in the "non-recognition" configuration. 100 and 102 are the small and large ribosome subunits, 110 , 111 and 112 are the A, P and E sites respectively. Only the A site 110 and P site 111 are occupied in this diagram.
- a tRNA-like lever 120 connected in this illustrative example to large ribosomal subunit 102 , does not bind (binding taken here to signify at least the creation of Watson-Crick pairs) to the nucleotides on mRNA 104 , which passes between large subunit 102 and small subunit 100. This lack of binding is because the corresponding bases on the mRNA 104 and pseudo-anticodon 120 are not complementary pairs (in the Watson-Crick sense). Therefore lever 120 stays relatively far removed from an acceptor fluorophore 152 .
- Lever 120 carries a donor fluorophore 151 , while the acceptor fluorophore 152 is attached at an appropriate location to the ribosome. When lever 120 remains in the "far" position, a small or null FRET signal is generated.
- Ribosome 122 has protruding chains 126 and 128 (shown in grey).
- the mRNA being translated 124 is shown with nucleotides spaced on it.
- Static label 138 is attached to a location on one of these protruding chains.
- Artificially engineered RNA chain (“lever”) 130 (shown in black) is attached at point 132 to form a movable hinge.
- the main part of RNA chain 130 has a helical structure and therefore is physically rigid.
- the part farthest away from hinge 132 has an anticodon nucleotide sequence 134 .
- On the chain 130 a fluorescent label 136 is attached.
- Figure 6C shows the lever in recognition configuration, where the anticodon 134 recognizes a codon on mRNA 124.
- the lever assumes a position where the fluorescent labels 136 and 138 are in close proximity, allowing a FRET signal to be emitted.
- the lever is in a non-recognition configuration, where the anticodon 134 does not recognize the codon on mRNA 124.
- the lever assumes a position where the fluorescent labels 136 and 138 are relatively far apart, and a FRET signal is not emitted, or else a much smaller FRET signal is emitted than in a recognition configuration.
- the labeling was of the "on/off" kind, that is, one type of label was either used or not used.
- some preferred embodiments of the present invention use more than one type of label.
- the system would have been simpler since database interrogation would have become a matter of a trivial search procedure and, indeed, de-novo protein sequencing would have been possible in-vivo.
- a label optionally forms part or all of the marker according to the present invention. Even if this optional scheme is difficult to achieve, labeling the tRNA species with more than one color increases the amount of information available.
- a plurality or even all tRNAs amino acids or codons are labeled, and not just a part of them.
- this technique is useful for measuring synthesis rates, on/off FRET times, and for system calibration.
- the labeling is done with several types of fluorophores, two, three or more, a large increase in the amount of information and confidence of the resulting identification is obtained when all items are labeled.
- a quenching strategy is used instead of FRET, as noted previously.
- FRET fluorescence-activated FRET
- this strategy instead of a fluorescent donor and acceptor, there is a fluorescent donor and an acceptor quencher that captures the donor energy without emission.
- donor fluorescence is detected as long as the quencher is not sufficiently near to the donor. In PSM, this would generate a signal of donor fluorescence intermitted by periods of quenching.
- tRNAs may be labeled for R-T tagging strategy, as well as one or more amino acids that are labeled for R-A strategy.
- the ribosome is labeled in a way that allows both methods to be used.
- the amino acids are labeled with fluorescent labels that are distinct from tRNA labels.
- the signal analysis system accepts both signals and uses both in order to identify more confidently the protein being synthesized. It is obvious to anyone skilled in the art of single molecule detection and analysis that this is just one example of a wide variety of methods that can be derived from this particular example.
- the natural fluorescence of tRNAs and/or amino acids is utilized.
- a fluorophore is attached to some tRNAs and/or amino acids. It is clear to anyone skilled in this art that the donor and acceptor configurations could be switched.
- the natural fluorescence of some amino acids together with artificially labeled tRNA species can be used in a combination system.
- a large body of research details fluorescent labeling techniques of ribosomes; such labeling may optionally be used with the present invention as a marker or a portion thereof. These include in-vitro and in - vivo labeling, labeling with naturally fluorescent proteins and with organic dyes. Other published techniques that are relevant include labeling with semiconductor quantum dots. Labeling strategies included labeling ribosomal proteins such as ribosomal proteins L1, S1, S21 and others; In addition, 3' and 5' ends or 5S, 16S and 23S rRNA have been labeled ( Robbins and Hardesty, Comparison of ribosomal entry and acceptor transfer ribonucleic acid binding sites on Escherichia coli 70S ribosomes. Fluorescence energy transfer measurements from Phe-tRNAPhe to the 3' end of 16S ribonucleic acid. Biochemistry. 1983 Nov 22; 22(24):5675-9 .).
- Organic dyes can be used to label ribosomal proteins using standard protein labeling techniques. Suppliers of these dyes publish detailed protocols describing their use. General procedures label proteins through their amino groups (lysine). Other procedures target cysteines which are sometimes available for precisely located labeling. In this way, ribosomal proteins S1 and S8 were labeled by coumarin ( Bakin et al., Spatial organization of template polynucleotides on the ribosome determined by fluorescence methods. J Mol Biol.
- a novel labeling strategy uses quantum dots, which are commercially available preconjugated with biotin or streptavidin.
- proteins can be labeled with biotin, so the streptavidin conjugated qdots (commercially available as Qdot TM 525/ Qdot TM 565/ Qdot TM 605/ Qdot TM 655 streptavidin conjugated quantum dots, from Quantum Dot Corporation, Hayward, Ca, USA; the numbers relate to maximal emission wavelength, nm) bind specifically to them.
- One useful method of generating a biotin-labeled protein involves creating a fusion protein between the protein of choice and biotin carboxyl carrier protein (BCCP).
- BCCP biotin carboxyl carrier protein
- the original protein sequence is fused optionally to the last 87 (or 110) codons of the E. coli BCCP.
- the fusion protein When the fusion protein is translated, it has the biotin tag attached to it and binds specifically to streptavidin (cf. Surrey et al., Proc. Natl. Acad. Sci. USA, Vol. 95, pp. 4293-4298, April 1998 ).
- streptavidin cf. Surrey et al., Proc. Natl. Acad. Sci. USA, Vol. 95, pp. 4293-4298, April 1998 .
- This method is also useful in-vivo, since both organic dyes and quantum dots can be engineered to be attached to streptavidin and have membrane permeable characteristics (see, for example, Miyawaki, et al., Nat Cell Biol. 2003 Sep; Suppl:S1-7 . Review; and Akerman et al., PNAS, 99:12617-12621, 2002 .)
- Another method that is useful for in-vivo labeling of ribosomal proteins is the well known strategy of fusing the protein of choice with a naturally fluorescent protein, such as green fluorescent protein, yellow/cyan/blue fluorescent proteins or any other naturally fluorescent protein.
- a naturally fluorescent protein such as green fluorescent protein, yellow/cyan/blue fluorescent proteins or any other naturally fluorescent protein.
- L1 was labeled by fusing it with a naturally fluorescent protein is described in ( Mascarenhas et al., Specific polar localization of ribosomes in Bacillus subtilis depends on active transcription. EMBO Rep. 2001 Aug; 2(8):685-9 ).
- the protein to be labeled is genetically fused to a short peptide containing a CCXXCC motif.
- the fluorescent label, FlAsH a derivative of fluorescein that contains two arsenoxide groups, is membrane-permeant and
- tRNA tag should have a high binding rate, so that preferably above 90% of the labeled tRNA species is actually labeled.
- tRNA molecules can be tagged while retaining their interaction with the aminoacyl synthetases as well as retaining their functionality with the ribosome.
- tRNAs have been tagged with fluorescein ( Watson et al., Macromolecular arrangement in the aminoacyl-tRNA. elongation factor Tu.GTP ternary complex.
- fluorescein Watson et al., Macromolecular arrangement in the aminoacyl-tRNA. elongation factor Tu.GTP ternary complex.
- Plumbridge et al. Characterisation of a new, fully active fluorescent derivative of E. coli tRNA Phe. Nucleic Acids Res.
- some examples include but are not limited to labeling the tRNA with small organic dyes attached to the "shoulder" region of the tRNA, such as in positions 8 and 47 of E.Coli tRNAs which have been often used for this purpose.
- small organic dyes attached to the "shoulder" region of the tRNA, such as in positions 8 and 47 of E.Coli tRNAs which have been often used for this purpose.
- both the anticodon region and the amino acid carrying region are sensitive, both in charging and in discharging.
- the dyes with which most experience has been gained are FITC and TMR. Detailed protocols for tRNA labeling with these dyes are presented below.
- E.Coli tRNA Phe has been labeled by attaching a small organic dye either to the 4-thiouridine at position 8, where the sulfur atom offers the required reactive handle, or to the X-base (3-(3-amino-3-carboxypropyl)uridine) at position 47, which has a primary reactive amine group coupled to the ribonucleic base by an aliphatic handle.
- X-base 3-(3-amino-3-carboxypropyl)uridine
- RNA sequences can be found in http://www.unibayreuth.de/departments/biochemie/trna/ .
- a database of known RNA modifications can be found in http://medstat.med.utah.edu/RNAmods/ .
- E.Coli tRNA Phe contains the highly modified Y base (wybutosine) in position 37 ( Langlois, R., Kim, SH and CRA Cantor.
- Y base wybutosine
- the donor fluorophores need to be specially engineered onto the ribosome.
- this strategy has the disadvantage that the natural fluorescence of tRNA molecules is weaker than that of other specific labels.
- the second approach is using prelabled amino acids.
- One example is The FluoroTectTM Green Lys in-vitro Translation Labeling System, available from Promega (Italy), which allows the fluorescent labeling of in-vitro translation products through the use of a modified charged lysine transfer RNA labeled with the fluorophore BODIPY ® -FL. Using this system, fluorescently labeled lysine residues are incorporated into nascent proteins during translation.
- the third alternative makes use of unnatural amino acids. These are incorporated into a protein by clever use of site-specific, unnatural amino acid mutagenesis, combined with use of the amber suppressor tRNA ( Cornish et al., "Site specific incorporation of biophysical probes into proteins", Proc. Natl Acad. Sci. USA, Bol. 91 2910-2914, 1994 ). In this method, a highly fluorescent unnatural amino acid (such as 7-azatyptophan) is charged onto an amber suppressor tRNA. In parallel, the gene of interest is mutated to include one or more amber codons in predetermined sites.
- the first class involves point detection with detectors that have single elements (photomultiplier tube (PMT) or silicon avalanche photodiode (APD)) used in combination with a confocal scanning optical microscope (CSOM) or near-field scanning optical microscope.
- the second class uses wide-field microscopy with two-dimensional detectors such as a CCD camera.
- One advantage of wide-field microscopy is that hundreds of single-molecules can be detected simultaneously, effectively performing hundreds of single- molecule experiments in parallel. This is especially useful for irreversible reactions or for very rare biological events.
- an arrayed detector has to be used, the time resolution and the sensitivity are not as good as those of point detection cases.
- Wide-field microscopy can be done either through epi-illumination or through prism type evanescent field excitation.
- epi-illumination the excitation light is sent through the epi-illumination port of a conventional fluorescence microscope. Unlike in CSOM, autofluorescence generated from the microscope optics and sample cannot be removed, resulting in an inferior signal/noise ratio.
- evanescent field excitation does not permit excitation light to propagate toward the detector and hence can reduce the autofluorescence to an undetectable level.
- Such an evanescent field excitation is generated by total internal reflection of the excitation light at the glass-water interface; therefore, we call this microscope a total internal reflection microscope (TIRM).
- Confocal microscopy allows the excitation and measurement of signals from a localized region with volume of less than 10 -15 Liter. With appropriately labeled proteins there is a low chance of finding more than one tagged molecule in this volume.
- Confocal microscopes can be equipped with scanning laser illumination. The laser scans the focal plane a spot at a time, allowing images to be formed. The resulting instrument is called confocal scanning optical microscope (CSOM).
- CSOM confocal scanning optical microscope
- laser excitation light is focused to a diffraction-limited spot using a high-numerical-aperture (NA) objective and the fluorescence coming from a single-molecule under the spot is collected using the same objective.
- a pinhole is used to block the out-of-focus autofluorescence signal to achieve single-molecule sensitivity.
- single-molecule CSOM typically scans the sample because the imaging speed is limited by the photon counts rather than by scanning speed.
- Two detectors are needed to detect donor and acceptor emissions simultaneously after their separation using a dichroic beam splitter.
- Computer-controlled data acquisition allows the accumulation of a large quantity of single molecule data by identifying individual molecules on the surface and taking the time records of single-molecule fluorescence signals.
- TIR-FM Total internal reflection fluorescent microscopy
- TIR-FM is a widely used technique for single molecule detection both in - vitro and in-vivo.
- TIR-FM originally developed to observe the interface between two media with different diffractive indices, uses an electromagnetic field called the 'evanescent field' to excite fluorophores.
- the excitation depth in TIR-FM is limited to a very narrow range — typically one hundred to several hundreds of nanometers. Using such a narrow excitation depth is an effective way to overcome the background noise problem.
- TIR-FM total internal reflection fluorescence microscopy
- objective-type TIR-FM a laser beam illuminates the specimen through the objective lens.
- an objective lens that has a numerical aperture larger than 1.33 should be used for objective-type TIR-FM.
- Specially designed objective lenses that have an NA of 1.45 (for a use with regular 1.52 glass and oil) or 1.65 (for a use with high refractive index glass and oil) are now available.
- the typical decay length of an evanescent field is one hundred to several hundreds nanometers, whereas the thickness of various regions of a typical cell is between 0.1 ⁇ m in lamellipodia to ⁇ 10 ⁇ m at the nucleus. Typical distances between the ventral cell surface and the glass surface are ten to a few hundred nanometers.
- the circles represent fluorescent molecules that, in TIR-FM, are visible ( 640 ) and invisible ( 650 ).
- TIR-FM provides superior contrast compared with other far-field microscopy techniques
- its application is limited to the proximity of the cell surface that is, to studying parameters in two dimensions.
- the methods of confocal or two-photon microscopy are applicable.
- Two-photon microscopy is a form of laser-scanning microscopy that uses excitation that has about half the energy required to excite the fluorescent label. This type of excitation is termed two-photon excitation (TPE).
- TPE Two-photon excitation
- the technique relies on the phenomenon of near simultaneous absorption of two photons by the same molecule. When this event occurs, the fluorophore is excited, and subsequently relaxes while emitting a photon with its standard emission characteristics. Obviously, for two photons to be absorbed simultaneously (within 10 -16 second), the flux of photons must be very high.
- TPM has been used in a variety of applications, from measuring calcium dynamics in brain slices and live animals, to in-vivo studies of angiogenesis and metastasis, to studies of hamster embryo development.
- the high intensity of photons required for TPE is basically achieved in two ways.
- a laser beam is focused through a confocal laser-scanning microscope. In the focal plane, this yields the order of 5x10 24 photons per cm 2 per second. This creates some TPE, but coupled with the low detection efficiency it is insufficient for imaging.
- the next level of intensity concentration is achieved by a mode-locked titanium sapphire (Ti:S) laser, that produces about 80 million pulses a second, each with about 100f s duration.
- Ti:S mode-locked titanium sapphire
- maximal intensity is increased drastically and the intensity of TPE is increased by about 5 orders of magnitude.
- the focal point of a TPM image is very sharp, and the light impinging on it is well structured.
- the emission photons on the other hand, are scattered, sometimes considerably.
- a primary consideration in detector choice is the collection angle, and direct detectors such as large area photomultiplier tubes (PMT) close to the objective lens are appropriate.
- TPM fluorophores
- TPM The main advantages of TPM are due to localized excitation, expanded wavelength accessibility of most fluorophores and the complete alleviation of out-of-focus photobleaching and photodamage. In addition, the ability of TPM to simultaneously excite different types of fluorophores with the same laser is important in many applications as well as in PSM.
- TPM instruments are available from several manufacturers: Biorad Microscience (Hemel Hampstead, UK), Zeiss (Oberkochen, Germany) and Leica (Wetzlar, Germany).
- Commercial Ti:S lasers for TPM are available from Spectra-Physics (Mountain View, CA) and Coherent (Sunnyvale, CA).
- Fluorescent lifetime imaging is a technique in which the fluorescent lifetime, rather than intensity, is measured.
- FLIM Fluorescent lifetime imaging
- SHIM Second harmonic imaging microscopy
- Second-harmonic imaging microscopy for visualizing biomolecular arrays in cells, tissues and organisms Nat Biotechnol. 2003 Nov;21(11):1356-60 .
- SHIM is based on a nonlinear optical effect of frequency doubling. This effect requires intense laser light to pass through a special material ⁇ usually an inorganic crystal. The light emerging from the crystal has precisely half the wavelength of the incoming light. In contrast with two-photon microscopy, no fluorescence occurs, and the coherence of the laser light is preserved.
- microscopy techniques including those using fluorescent labels, techniques with non-fluorescent labels, and non-imaging techniques such as atomic force microscopy and photon tunneling microscopy, any of which may optionally be used with the present invention.
- a point detector such as PMT may optionally used, or an area detector such as a camera, for example.
- PMTs When PMTs are required, it is recommended to use a large-area PMT with high gain and low readout noise.
- GaAsP photocathode PMTs are commercially available (Hamamatsu H7422P) which offer high quantum efficiency in the 400-650 nm range. This makes them well suited for TPM fluorescent work and in particular to PSM applications.
- an imaging device When wide-field microscopy is used, an imaging device is preferable for simultaneous observation of a relatively large area (100x100 microns) with a large number of pixels (1000x1000 or more). It is important to use a camera which has a high signal to noise ratio simultaneously with high frame rate.
- cooled CCD cameras In order to achieve the high signal to noise, cooled CCD cameras are used such as available from Princeton Instruments, Vianen, Netherlands.
- intensified CCD cameras have been introduced such as the intensified digital CCD camera system IPentaMAX-512EFT, from Roper Scientific, Trenton, NJ. Such cameras allow the detection of individual fluorophores.
- Illumination module 350 illuminates sample 354 through microscope 352, and the resulting signals are detected by detection module 356.
- the resultant image is then preferably transferred to computerized analysis station 360 which analyzes the images, preferably records the FRET donor and acceptor signals with their precise timing and coordinates in the image, and correlates the resulting signal sequences with protein data from a database 362 , to obtain protein identification data that is optionally presented on the computer screen and optionally stored in database 362 for further analysis.
- the optical data from detection module 356 is received by the computerized analysis station 360 as a sequence of images, preferably at a rate of 60-300 frames per second to ensure that the synthesis cycle, operating at a rate as high as 20 amino acids per second in bacteria (and at a much lower rate in eukaryotes) is properly sampled.
- An exemplary method that analyses this image sequence is shown with regard to Figure 9 .
- Image sequence 400 is first received by recording module 402 .
- An image 403 is processed by preprocessing module 404 that identifies putative signals in the single image. These signals are output as a list of coordinates 405 to signal sequencer module 406 that tracks the signals and clusters them into a list of separated signal sequences 407 .
- t i denotes a timing value
- x i , y i denote image coordinates
- s i denotes signal type or intensity (of both donor and acceptor).
- Signal sequencer module 406 updates this list of sequences S and each updated sequence is sent to sequence analyzer 408 which transforms the sequence S into one or more data-stream 409 of FRET on/off signals, as further described in detail in the simulation experiment below (section entitled “data interpretation simulation”).
- Data stream 409 is preferably sent to protein identification module 410 that processes the data stream 409 and preferably retrieves a list 411 of protein sequences that putatively match data stream 409 .
- a scorer module 412 preferably determines, for each candidate protein sequence from list 411 , the probability that this protein is responsible for the observed signal sequence.
- the scored list 413 of scored protein candidates is analyzed, and each protein candidate 415 with a probability higher than a predetermined probability threshold is displayed on the screen.
- Each such protein candidate 415 may also be recorded in database 420 .
- Another, exemplary method is disclosed by which a plurality, tens, hundreds or even thousands of ribosomes can be monitored simultaneously. This method is important in order to ensure detection of rare or rarely synthesized proteins, such as proteins that have a very low copy number, sometimes less than one copy number per cell, on average.
- the size of the ribosome (along the mRNA) is approximately 20 nM. Along the mRNA strand, there are usually numerous ribosomes at various stages of translation. The distance between these ribosomes is about 40 nM. A typical mRNA may be attached to dozens of ribosomes, depending on the mRNA length. This means that it is sufficient to tag only about 10% of ribosomes.
- This level of tagging can be achieved by limiting the tag concentration with respect to the number of ribosomes in the assay.
- An imaging device with pixel size of about 100nM 2 and 1000X1000 pixels will have a field of view of 100 square microns, which holds 100 eukaryotic cells.
- monitoring 20 ribosomes per cell over a population of 100 cells results in 2000 ribosomes being monitored simultaneously. This enables such a system to identify single-copy proteins in real-time.
- tRNA is the FRET donor. It is labeled with fluorescein isothiocyanate (FITC), a dye whose excitation and emission peaks are 494 and 520 nm, respectively.
- Ribosomal protein L1 is the acceptor and is labeled with TMR (tetra-methyl rhodamine), a dye whose and excitation and emission peaks are 550 and 573 nm, respectively. It has been shown ( Plumbridge et al., NAR 8, 827-843, 1980 ) that tRNA labeled with this protocol retains its activity both in charging (with aminoacyl synthetases) and in the ribosomal synthesis cycle.
- FITC fluorescein isothiocyanate
- TMR tetra-methyl rhodamine
- the example shows labeling of tRNA phe but any tRNA with similar structure (X base) can be similarly labeled (see tRNA base modification table in the section entitled "tRNA labeling" above).
- the labeled tRNA and ribosomal protein are constituted into an in-vitro translation system, and used to translate an appropriate mRNA.
- the tRNA species that is introduced is unique since after the salt-wash stage no tRNA remains. This enables verification of the system's functionality, by comparing signals in a system where all tRNA phe are labeled, as opposed to a similar system in which all tRNA phe are unlabeled..
- a poly-U mRNA is used as the translation template.
- Donor labeling -tRNA phe labeling with FITC - Pure E. coli tRNA phe (Roche Applied Science, Mannheim, Germany) is labeled at the X base (position 47) with FITC (Sigma) (see for example Plumbridge et al., NAR 8, 827-843, 1980 , and Robbins et al., Biochemistry 22, 5674-9, 1983 ).
- FITC FITC
- Approximately 1ml of tRNA phe (130A 260 units) are dialyzed for 8h against a solution of 1M NaCl and 50mM Hepes-KOH (pH 8.0).
- a dimethylformamide solution containing 100mM FITC is added to give a final dye concentration of 10mM.
- the reaction mixture is incubated for 5h at 37° C and then brought to 100mM KCl, and the tRNA is precipitated by addition of 2 volumes of ethanol and incubation for 2h at -20° C.
- the labeled tRNA is further separated from unreacted dye by two additional ethanol precipitations.
- Unlabeled tRNA is removed by passing the tRNA over a BD-cellulose (Serva) column equilibrated with a solution containing 400mM NaCl, 50mM NaOAc (pH 5.0), and 10mM Mg(OAc) 2 .
- the labeled tRNA is loaded in a minimal volume of the same solution.
- a salt gradient of 0.4-2M NaCl is applied to the column.
- the unlabeled tRNA is eluted first, followed by elution of the tRNA phe-X-F .
- the labeled tRNA is concentrated by ethanol precipitation in the presence of 2% NaOAc and subsequently dialyzed versus buffer containing 10mM PIPES, 10mM Mg(OAc) 2 , 100mM NH 4 Cl, 150mMKCl and 1mM DTE.
- the tRNA that is used in all experiments is nearly 100% labeled. Where necessary, this is accomplished by isolation of the specific labeled tRNA species using HPLC, as described in [ Odom et al., Methods Enzymol. 164, 174-187, 1988 ].
- TMR Tetra-methyl rhodamine
- Aminoacylation of labeled tRNAphe - Cell-free translation systems may include only the ribosomal machinery and whatever tRNAs are chosen to be introduced, or else they may include the entire enzymatic set including the 20 aminoacyl synthetases and the amino acids required for recharging the tRNAs.
- An example for the latter type of system is described in Shimizu et al., Nature Biotech. 19, 751-5, 2001 .
- the synthetases are not present, as described in this illustrative example, it is necessary to separately charge the labeled tRNA with the appropriate amino acid in order for the tRNA to function during protein synthesis.
- tRNA species that are present in the system are only those which are expressly introduced. Charging the labeled tRNA with phenylalanine proceeds according to the following protocol ( Plumbridge et al., NAR 8, 827-843, 1980 , Johnson et al., J. Mol Biol. 156, 113-40, 1982 ) (additional, different protocols can also be found in Robbins et al Biochemistry 20, 5301-9, 1981 , and in Janiak F et al, Biochem 29, 4268-77 1990 .) The reaction mixture contains 20 ⁇ M phenylalanin, 2mM ATP, 300 ⁇ g of S100 enzymes (purified as described in Johnson et al., J.
- Ribosomal proteins L1 or S1 are amplified by PCR from E.Coli genome and cloned into vector pET21a (Novagen) to generate His-tagged protein plasmids (see for example Shimizu et al., Nature Biotech. 19, 751-5, 2001 ).
- the plasmids obtained are transformed into E. coli BL21/DE3 strains. His-tagged proteins are purified as follows: BL21 cells are grown to an OD 600 of 0.5-0.9 in Luria-Bertani (LB) broth.
- Isopropyl- ⁇ -D-thiogalactoside IPTG is added to a final concentration of 0.1mM, and the cells are grown for an additional 4h at 37°C. Collected cells are resuspended in a buffer [50mM HEPES-KOH pH 7.6, 1 M NH 4 Cl, 10mM MgCl 2 , 0.3mg/ml lysozyme, 0.1% Triton X-100, 0.2mM phenylmethylsulfonyl fluoride (PMSF), and 7mM ⁇ -mercaptoethanol] and are lysed by sonication.
- a buffer 50mM HEPES-KOH pH 7.6, 1 M NH 4 Cl, 10mM MgCl 2 , 0.3mg/ml lysozyme, 0.1% Triton X-100, 0.2mM phenylmethylsulfonyl fluoride (PMSF), and 7mM ⁇ -mercaptoethanol
- Proteins are eluted with a linear gradient from 10mM to 400mM imidazole in HT buffer. Fraction containing His-tagged proteins are dialyzed against stock buffer [50mM HEPES-KOH pH 7.6, 100mM KCl, 10mM MgCl 2 , 30% glycerol and 7mM ⁇ ME] and are frozen in small aliquots at -80°C.
- stock buffer [50mM HEPES-KOH pH 7.6, 100mM KCl, 10mM MgCl 2 , 30% glycerol and 7mM ⁇ ME]
- E. Coli cells (150g) are resuspended in 150ml of buffer containing 20mM Tris-HCl pH 7.2, 20mM MgCl 2 , 200mM NH 4 Cl, 2mM ⁇ ME, at 4°C. The cells are then broken by 3 passes through a French press at 1260kg/cm 2 . 401 ⁇ l of DNase I are added and the tube is centrifuged twice for 20min at 18,000revs/min. The supernatant is centrifuged for 3h at 30,000revs/min.
- the pellet of 70S ribosomes is resuspended in buffer A containing 20mM Tris-HCl pH 7.2, 10mM MgCl 2 , 500mM NH 4 Cl, 2mM ⁇ ME, and centrifuged through 30% (w/v) sucrose for 15h at 38,000revs/min.
- the 70S pellet is resuspended in buffer A and centrifuged for 15min at 18,000revs/min.
- the supernatant is dialyzed against 100 volumes of buffer containing 20mM Tris-HCl pH 7.2, 1mM MgCl 2 , 200mM NH 4 Cl, 2mM ⁇ ME, and centrifuged through a 10% to 30% (w/v) sucrose gradient for 16h at 22,000revs/min. Fraction corresponding to the 30S subunit peak are pooled and the MgCl 2 concentration is increased to 20mM and then the 30S subunits are precipitated with 0.67 volume ethanol. The 50S subunits are precipitated with 100mg/ml polyethylenglycol (M r 6000).
- pellets of subunits are resuspended in buffer containing 20mM Tris-HCl pH 7.2, 20mM MgCl 2 , 200mM NH 4 Cl, 2mM ⁇ ME, and dialyzed against the same buffer for 3h at 4°C. Subunits are stored in -70°C.
- Preparation of ribosomes and ribosomal 50S subunits lacking protein L1 from E. Coli - preparation of 50S subunits lacking protein L1 (50S-L1) from E.coli mutant strain, which does not contain ribosomal protein L1, is performed as described in Odom et al., Biochemistry 29, 10734-44, 1990 , Odom et al Biochemistry 19 5947-54, 1980 .
- Labeled L1 is incorporated into 50S in a reaction mixture containing 400pmol of 50S-L1, 440pmol of labeled L1, 10mM Tris-HCl pH 7.5, 8mM Mg(OAc) 2 , 150mM NH 4 Cl, and 5mM ⁇ ME, in final volume of 100 ⁇ l. Incubation is for 10min at 35°C. Subunits isolated by centrifugation at 49,000rpm for 4h (see for example Odom et al., Biochemistry 29, 10734-44, 1990 ).
- Poly(U)-dependent polyphenylalanine synthesis by TMR-labeled ribosomes and FITC-labeled Phe-tRNA phe In total volume of 100 ⁇ l: 25mM Tris-HCl pH 7.5,12-14mM MgCl2, 25mM NH4Cl, 100mM KCl, 3mM dithioerythritol, 4mM ⁇ ME, 0.8mM ATP, 0.05mM GTP, 5mM phosphocreatine, 2.5 ⁇ g of creatine phosphokinase, 4 ⁇ g labeled phe-tRNA phe , 20 ⁇ g poly(U), ⁇ 60 ⁇ g of E coli postribosomal supernatant (prepared as described in Odom et al.
- Ribosomal protein L1 is the FRET donor. It is labeled with a quantum dot whose emission peaks at 525 nm.
- tRNA is the acceptor and it is labeled with TMR (tetra-methyl rhodamine), a dye whose excitation peaks at 550nm and emission at 573nm.
- TMR tetra-methyl rhodamine
- tRNA could also be labeled with FITC as in the previous example, and a quantum dot with appropriate emission characteristics selected.
- tRNA labeled with this protocol retains its activity both in the aminoacyl synthetases and in the ribosomal synthesis cycle.
- any tRNA with 4-thiouridine in position 8 can optionally be similarly labeled.
- the labeled tRNA and ribosomal protein are constituted into an in - vitro translation system, and used to translate an appropriate mRNA. Once the setup is ready, system testing can proceed as explained in the previous example.
- ribosomal protein S1 could also be similarly labeled. Ribosomal protein S1 contains two cysteines, and therefore could be labeled with an appropriate protocol. For example, coumarin could be used as donor for a TMR acceptor.
- the labeling protocols are described in Odom et al. Arch Biochem Biophys 230, 178-193, 1984 , or Bakin et al., J. Mol. Biol. 221, 441-453 1991 .
- Donor labeling- ribosomal protein L1 labeling with quantum dots (QD) L1 protein is first biotinylated using FluoReporter Biotin-XX protein labeling kit (Molecular Probes, cat# F-2610) according to manufacturer protocol. Then, the biotinylated protein is linked to QdotTM 525 Streptavidin Conjugate (QuantumDot) according to manufacturer protocol.
- QD quantum dots
- the tRNA phe is removed by ethanol precipitation.
- the non-covalently bound dye is removed by two phenol extractions: the first is performed at pH 4.6 and a second after heat denaturation of tRNA Phe -TMR in 10mM Tris-HCl pH 7.0, 1mM EDTA at 85°C for 2min.
- the labeled tRNA is then extracted with ether. After ethanol precipitation the labeled tRNA is dialyzed against 1mM potassium acetate pH 5.0.
- the final tRNAPhe-TMR adducts are reactivated at 37° C for 10min prior to the experiment.
- Figure 10 shows an illustrative apparatus for bulk in-vitro protein synthesis monitoring, where PSM signals are generated in solution.
- Scanning laser 300 with appropriate wavelength and energy impinges a light beam 302 optionally through dichroic mirror 304, preferably into an inverted upright confocal microscope 306, optionally and preferably focusing on a movable fused silica slide 308 on which sample wells 310 are located.
- the laser energy excites the donor fluorophores, which transfer energy without photon transfer to the acceptor fluorophores according to the scheme used.
- FRET energy transfer occurs when an acceptor tag is in sufficient proximity to a donor tag.
- the fluorescence signal emitted from the acceptor passes back through microscope 306 and dichroic mirror 304, to be collected by detector 312.
- An example of an available commercial system that embodies this type of optical design is the Olympus FluoView 500 confocal microscope available from Olympus America Inc., Melville, New York.
- the system enables a choice of laser illumination (Blue Argon (488nm), Multi-line Argon (457nm, 488nm, 514nm), Green Helium Neon (543nm), Red Helium Neon (633nm), Yellow Krypton (568nm), 442nm Helium Cadmium, 440nm Diode, 405nm Diode UV Argon (351nm), 750nm IR), a choice of PMTs with an option for several PMTs used in parallel, and several scanning modes (XY, XYZ, XYT etc).
- the PMT readout is transferred digitally to computer system 314 for image analysis, signal processing and subsequent identification of the proteins being synthesized.
- Figure 11 shows a close-up of the exemplary system shown in Figure 10 , at the sample level.
- the illuminated volume has the shape of a pinched cylinder, depicted by hyperbolic section 330.
- Movable microscope slide 322 supports well 326 in which the sample is enclosed.
- An imaged pixel lies in the image plane 328, bringing to a minimum the volume of illuminated sample, and thereby bringing to a minimum the number of ribosomes imaged at any one time.
- the FRET signals both donor and acceptor to be detected return along the same optical path between lines 324 and into objective lens 320, as described above.
- Figure 12 describes one exemplary optical apparatus for data acquisition, based on a wide-field microscope equipped with TIR illumination and intensified CCD camera. This setup is useful both for in-vitro single-molecule protein synthesis monitoring application, where the ribosomes are immobilized on the microscope slide, and for in-vivo PSM, where the ribosomes are monitored inside living bacteria or cells.
- laser 600 is a diode-pumped doubled YAG laser (Crystalaser, Reno, NV) that can excite a wide range of dyes.
- Laser illumination 602 travels through a dichroic mirror 604 (Chroma Technology, Brattleboro, Vermont) and into a dove prism 606 such as a small Pellin Broca prism (CVI laser, http://www.cvilaser.com/) where the illumination undergoes TIR.
- the prism is optically coupled to the fused silica bottom of the sample chamber 608, so that evanescent waves illuminate up to 150 nm above the surface of the fused silica.
- ICCD intensified ccd
- the impact-ionization process generates low-noise as multiplication of photon-generated charge takes place on the CCD, which undergoes deep thermoelectric cooling.
- This camera can be operated at 10 MHz for high-speed image visualization or more slowly for high-precision photometry. Supravideo frame rates are achievable through subregion readout.
- the camera readout is transferred digitally to computer system 620 for image analysis, signal processing and subsequent identification of the proteins being synthesized.
- the synthesizing system For in-vitro single molecule PSM, the synthesizing system must be immobilized on the microscope slide. There are two basic options for immobilization. One is to immobilize the ribosomes. Ribosomal complexes can be immobilized onto a mica surface, which is transparent and flat on a molecular size scale. Ribosomes, either labeled or unlabeled, undergo binding to mica in a few seconds, allowing the detection of single fluorescence images in aqueous buffer. A large excess of ribosomes and a short incubation period are employed for single molecule detection. The mica-bound ribosomes retain their activities, as shown in Sytnik et al., J. Mol. Biol. (1999), 285, 49-54 , where detailed protocols are provided.
- Another option is to immobilize the mRNA and allow the ribosomes to process the immobilized mRNA.
- the mRNA can be immobilized on a polyethylene glycol (PEG) coated surface with biotin-streptavidin linker.
- PEG polyethylene glycol
- the mRNA should undergo 3'-end biotin labeling. Since protein synthesis will not end normally because of the linked 3' end, it is advisable to ensure that the template mRNA continues for at least 90 nucleotides beyond the stop codon.
- FIG. 13 describes an exemplary optical apparatus for data acquisition, based on a scanning two-photon microscopy system. This setup is useful for monitoring protein synthesis in single ribosomes in-vivo, in prokaryotic bacteria or cells of higher organisms. It is also optionally useful for in-vitro PSM assays according to the present invention.
- laser 650 is a Nd:YVO 4 pump laser producing 10 W power that drives the mode-locked Ti:S pulsed laser 652.
- the Ti:S laser provides up to I W at the peak wavelengths of the laser.
- the pulsed beam from Ti:S laser 652 enters a beam scanner 654 that allows control of the beam intensity, as well as adjusting the size of the beam at the back aperture of the objective, thereby controlling the parameters of two-photon excitation spot geometry.
- the beam scanner, or beam-conditioning unit provides the control of beam alignment, intensity and size and its main purpose is to optimize the filling of the objective lens by the scan beam.
- the main role of the beam scanner is to scan the beam over the image area and thereby produce the sampled image.
- the conditioned, scanned beam 656 now travels to microscope 660, through dichroic mirror 658 into objective 662 and focused onto the live cell sample in sample holder 668.
- the fluorescent signals are collected again by the objective, passed through the mirror and detected by PMT detector 664.
- the detected digital data is transferred digitally to computer system 666 for image analysis, signal processing and subsequent identification of the proteins being synthesized.
- An example of an available commercial system that embodies this type of optical design is the Radiance 2100TM MP multiphoton microscopy system available from Bio-Rad Laboratories, cell science division, Hercules, CA. In this instrument, scanning speeds of 25 to 1800 Lines Per Second (LPS) and frame rates of 45 frames/sec can be obtained, with a wide choice of lasers, basic microscopes, and detectors, including true photon counting of up to 20M photons per second. Various scanning modes (XY, XYZ, XYT etc.) are also available.
- CHO Choinese hamster ovary
- fluorescent tagging For in-vivo monitoring of protein synthesis, fluorescent tagging according to R-T, strategy is performed.
- R-T tagging strategy is used and disclosed in detail.
- ribosome tagging and tRNA tagging have to be properly handled.
- FRET acceptor There are two preferred choices for tRNA labeling as FRET acceptor: FITC (excitation and emission peaks are 494 and 520 nm, respectively) and TMR (excitation and emission peaks at 550 and 573 nm, respectively).
- TMR is attached to the thiouridine at position 8
- FITC is attached to the X-base at position 47, as explained in detail previously.
- the ribosome is labeled as FRET donor on ribosomal protein L1 in this illustrative example.
- the particular choice of labeling fluorophore for L1 depends on the acceptor fluorophore chosen.
- Four exemplar illustrated donor/acceptor choices are shown in the following table: Table 3 L1 Donor fluorophore tRNA acceptor fluorophore L1-GFP fusion protein TMR L1-BFP fusion protein FITC L1-CCPGCC- FlAsH TMR L1-BCCP-QdotTM525 TMR
- L1 for ribosome tagging, optional but preferred fluorescent labeling of ribosomal protein L1 as FRET donor is described in detail.
- Three alternative methods for in-vivo tagging of L1 are described. All three require fusing L1 to an additional peptide or protein. This fusion is preferably performed by insertion of a vector encoding the fusion protein into the cells.
- L1 is fused to a naturally fluorescent protein such as GFP or BFP, as described in Chalfie, M. & Kain, S. (1998), Preface in: Green fluorescent protein: properties, applications, and protocols, eds. Chalfie, M. & Kain, S. (Wiley-Liss, New York), pp. vii-ix .
- GFP naturally fluorescent protein
- BFP BFP
- L1 is fused to a short peptide of 6-20 amino acids containing a CCXXCC motif (for example CCPGCC).
- CCXXCC motif for example CCPGCC
- This motif binds specifically to a bi-arsenoxide group.
- FlAsH a dye derivative of fluorescein
- the FlAsH label is membrane-permeant and non-fluorescent, and acquires fluorescence only on binding to the CCXXCC motif.
- L1 is fused to a sequence tag derived from biotin carboxyl carrier protein (BCCP), thereby becoming biotinylated in-vivo ( Nilsson et al., "Affinity Fusion Strategies for Detection, Purification, and Immobilization of Recombinant Proteins", Protein expression and purification 11, 1-16 (1997 )).
- BCCP biotin carboxyl carrier protein
- This allows streptavidin conjugated quantum dots to be attached to the biotinylated protein.
- QdotTM525 Streptavidin Conjugate Quantantum Dot Corporation, Hayward, Ca
- In-vivo labeling with Qdots are described in Jaiswal JK, Mattoussi H, Mauro JM, Simon SM, Nat Biotechnol. 2003 Jan;21(1):47-51 .
- ribosomes should be labeled.
- One exemplary method that achieves this goal requires placing the fusion L1 protein under the regulation of a very weak promoter, to ensure low expression levels.
- careful control of the externally introduced dye (FlAsH or Qdots) amounts is an alternative, optional and simpler mechanism.
- tRNAs are preferably labeled in-vitro and then delivered into the cells.
- tRNAs can be inserted into cells by one of at least the following three procedures: 1. by injection, as described in Ilegems, E., et al., Nucleic Acids Res. 2002 Dec 1 ;30(23); 2 . by using TransMessenger transfection reagent (Qiagen, Hilden, Germany) according to the manufacturer protocol. 3. by using TransIT-TKO transfection reagent (Mirus Corporation, Madison, WI) according to the manufacturer protocol.
- RNAi can simply absorb RNAi from solution. This ability may imply that tRNA molecules can also be simply absorbed by cells, a strategy which is preferably tested individually in each cell-line and labeling strategy.
- suppressor tRNA may optionally be used to ensure that native tRNA does not compete with labeled tRNA during the PSM assay.
- the suppressor tRNA is preferably the only tRNA species to be labeled, and therefore the only one to generate a PSM FRET signal.
- the suppressor tRNA introduced into the cells recognizes a codon that is usually recognized by the cell as a stop codon.
- the amber (UAG) codon is usually employed for this aim.
- the suppressor tRNA is preferably not a substrate for any of the cellular aminoacyl-tRNA synthetases.
- This suppressor tRNA molecule is preferably subsequently aminoacylated with a highly fluorescent unnatural amino such as 7-azatryptophan, and a special template mRNA is introduced that is engineered to contain amber codons in prespecified locations.
- a template tRNA is based on bacteriophage T4 lyzosyme protein (T4L), as explained in Cornish et al., "Site specific incorporation of biophysical probes into proteins", Proc. Natl Acad. Sci. USA, Bol. 91 2910-2914 , 19.
- This fluorescent amino acid is preferably incorporated in a fluorescent protein wherever an amber codon was processed with the suppressor tRNA.
- the charged suppressor tRNA is doubly labeled, once as a FRET acceptor and once with the fluorescent amino acid it is charged with.
- the engineered T4L protein will be indicative of the functioning both of the suppressor tRNA and of the PSM assay. In this way it is possible to obtain independent verification of the results of the PSM assay. Additionally, the accuracy of the PSM method can optionally be correlated with detection of the fluorescent translation products. Important parameters such as quantitation accuracy of the PSM assay can be measured.
- the suppressor tRNA is preferably constructed on the basis of the E.coli tRNA Phe , E . coli tRNA Asn , or E . coli tRNA Asp , as described in the references below. All of these tRNAs have a 4-thiouridine in position 8 and so can be labeled with TMR, E.Coli tRNA Phe also has an X-base in position 47 and can therefore be labeled with FITC. Detailed labeling protocols were described previously in the section entitled "Labeling and wet setup for in-vitro protein synthesis monitoring".
- suppressor tRNA Preparation of suppressor tRNA - details.
- a variety of suppressor tRNAs have been misacylated and tested for their ability to incorporate amino acids into proteins in response to an amber nonsense mutation.
- Chamberlain and coworkers focused their efforts on E . coli tRNA Gly ( Bain et al., Biochemistry 1991, 30, 5411-5421 ).
- Schultz and coworkers determined that suppressor tRNA Asn from E . coli and tRNA Gln from T. thermophila showed the best overall suppression efficiency for amino acid incorporation into model proteins T4 lysozyme and chlorismate mutase ( Cload et al, Chem. & Biol. 1996, 3, 1033-1038 ).
- E . coli amber (UAG) suppressor is optionally and preferably prepared from E . coli tRNA Phe or tRNA Asn according to the protocols in the references above.
- the tRNA amber suppressor has a CUA anticodon sequence.
- Other tRNAs can also serve as a basis for engineering a suppressor tRNA for the amber codon for PSM, as long as they contain a 4-thiouridine in position 8 or an X-base in position 47, to allow labeling.
- Other tRNAs that do not have these modifications may also optionally be used but an appropriate labeling strategy compliant with amino-acylation and translation should be devised.
- the stages of the experiment optionally and preferably include: Creation of the suppressor tRNAs; Fluorescent labeling of the suppressor tRNAs; Charging the suppressor tRNAs with 7-azatryptophan. (cf. Cornish et al., Proc. Natl Acad. Sci. USA, Bol. 91 2910-2914 , 19); Insertion of a vector that codes both for the L1 fusion protein (one of 3 choices) and the template mRNA encoding for the reporter protein (such as the amber-labeled bacteriophage T4L); Once the transfected vector undergoes transcription, the labeled, charged suppressor tRNAs and any additional dyes (FlAsH or Qdots) are inserted.
- the turnover rate of tRNAs is in the order of 1-2 days ( Schlegel et al., "The turnover of tRNAs microinjected into animal cells", Nucleic Acids Research, Vol 5, Issue 10 3715-3729 ), so that the production of the endogenous tRNAs that have been placed under control needs to be stopped a sufficient amount of time before labeled tRNAs are introduced and the PSM assay starts operating.
- CHO-ind-tRNA phe cell-line is optionally and preferably established from CHO cells in which the endogenous gene coding for tRNA Phe is placed under the control of inducible POL III promoter.
- inducible POL III promoters are described in Wolfgang M. et al., (2001) NAR 29, 1672-1682 ; Tuschl T. (2002) Nature Biotechnol. 20, 446-448 ; Van de Wetering, M., et al, (2003) EMBO Rep 4, 609-15 ; Hurlstone, A., et al., (2002) EMBO L. 21,2303-11 .
- the replacement of the natural control elements of the required tRNA genes by inducible control is performed by gene targeting techniques as described in ( Joyner, AL (ed), "Gene Targeting: A Practical Approach", Oxford University Press; 2nd edition, 2000 ).
- the stages of the experiment optionally and preferably include: Establishing the cell-line CHO-ind-tRNA phe ; Fluorescent labeling of the E.Coli tRNA Phe molecules; Insertion of a vector that contains the L1 fusion protein (optionally according to one of three previously described choices); Down regulation of the POL III promoter driving the unlabeled tRNA phe transcription; and Introduction of L1 dyes (if required) and labeled tRNA Phe .
- This Example describes a simulation of an illustrative method for signal processing according to the present invention.
- a specific, illustrative algorithm of data analysis that permits real-time identification of the protein being synthesized from raw FRET signals is described.
- the data processing proceeds by stages according to the following diagram ( Figure 14-A ).
- the raw, or double signal 510 is the signal obtained simultaneously from donor and from acceptor of a single FRET pair, as is customary for FRET analysis.
- a typical graph of the double signal is shown in Figure 14-B , with acceptor signal 520 and donor signal 521. These graphs were created by a simulation program written in C++ under Microsoft visual studio development suite.
- the model assumes that signals are generated with parameters as indicated below. Random number generation was used to create noise according to the prescribed parameters.
- Donor signal is shown in thin black line, acceptor signal in thick grey line.
- the simulated signal generation model assumes a sampling rate of 200 samples per second, a synthesis rate of 20 amino acids per second, average “off " signal of 1.2/0.1 relative brightness values for donor/acceptor, respectively, and an average “on” signal of 0.2/0.9 for donor/acceptor, respectively.
- the "on” and “off” values are assumed to have been previously calibrated by experimental measurements.
- the FRET signal is "on" for 50% of the synthesis cycle time of a single amino acid, on average, with an average deviation of 10% from this value; the synthesis cycle time changes on average by 8% from the average cycle time; the signal noise level is 18% of maximal signal; and labeling efficiency is 95% (that is, at most 1:20 tRNAs that should have been labeled turn out to be unlabeled).
- the analysis process can begin its operation.
- the first stage in the analysis produces the FRET signal 511 from the double signal 510. This is a binary signal at the original sampling rate.
- a sample graph of this signal is shown in graph 530 ( Figure 14-C ). Only the “on” periods are shown.
- the computation of the FRET signal involves a simple subtraction of acceptor signal minus donor signal. If this is positive, an "on” FRET bit is output, else, an "off” bit. Note that the signals are calibrated for their "on” and “off” values. If the calibration values are different than the values shown in figure 14B , other decision schemes such as a weighted difference of the signals (a*acceptor-b*donor, with a and b some fixed positive weights) may optionally be required.
- the next stage produces the synthesis signal 512, which provides a time reading for each "on" period. It is assumed that when a FRET signal is emitted, it takes place only during part of the synthesis cycle. Thus, it is easy to separate adjacent FRET periods. On the other hand, when the peptide sequence includes a several adjacent non-labeled sequence elements, separation of the units is not straightforward and has to be computed.
- the synthesis signal records the time points of the center of each FRET period. To compute this synthesis signal 512, the beginning and end points of each FRET period are recorded first. In the simulation experiment the initial three periods occurred at times .088-.1126, .0233-.0258, .284-.308. The midpoints of these intervals, .1003, .245, .296 are the values that form the synthesis signal. All time values are given in seconds.
- the next stage produces the label sequence tree 513.
- the number Noff of "off" cycles between t 1 and t 2 can be computed with an uncertainty that can be evaluated as follows.
- the standard deviation of the accumulated time required for N cycles is therefore ⁇ N ⁇ ⁇ c , in interval units.
- the distribution of the total duration of N cycles can be assumed normal with standard deviation ⁇ Nc .
- every additional "on” signal generates one or more labeled sequences.
- the label sequences that were generated, with their probabilities are FN (.018), FFN (.939), FFFN(.043), where "F” stands for “off” and "N” stands for "on”.
- sequence with highest probability is identical to the original input sequence.
- branches can split and re-split; some branches are deleted since their probability falls below the acceptable threshold; and in this way the measured label sequence tree evolves.
- each candidate sequence is sent for database interrogation and scoring (see below). Branches that do not appear in the database are deleted or otherwise marked for special consideration.
- the final stage in the protein identification module is the database interrogation stage.
- the database has to be compiled. Every protein sequence is simply transformed to a label sequence by marking each amino acid as "N" of "F” according to whether its synthesis will result in a FRET signal or not.
- all subsequences of a given length (say, 100 cycles) that start with an "N" are determined.
- the database can also take into account labeling efficiency. For example, if a given amino acid residue is considered to be labeled with an efficiency of, say, 90%, than every sequence where this residue appears is used to derive mis-labeled sequences at a rate of 10%. All these mislabeled sequences are stored in the database as well. This may mean that longer sequences are required to positively identify a protein.
- the R-A labeling scheme is herein analyzed as an example.
- the other two schemes, R-T and R-R labeling can easily be analyzed in a similar way.
- k of the 20 amino acids are labeled and 20-k are unlabeled.
- the random hit probability should be better than 1:10 6 , or, in other words, l ⁇ ⁇ l > 10 6 . This is because there are at most several hundred thousand sequences in the database (see above).
- the formula l ⁇ ⁇ l > 10 6 connects the ratio ⁇ of labeled amino acids with the length l of a polypeptide chain required for confident identification.
- Table 5 Number of labeled amino acids Minimal number of residues ( l ) required for confident identification Total synthesis time in bacteria (seconds) for confident identification 1 80 4.0 3 42 2.0 5 28 1.4 6 26 1.3 10 23 1.06
- High throughput screening is a method developed since the late 1980s. Today systems are available that can screen up to a million compounds in one day. High throughput screening requires an assay to be devised that is compatible with the screening instrument, an assay that enables quick rejection of most of the compounds as irrelevant, and approves only a small fraction for continued research.
- the present invention is suitable for a very thorough and informative assay, as explained above, in the sense that it provides information not only concerning binding of the screened compound to a single protein target, one that has been suspected to be related to the disease for which a drug is sought, but provides, for every compound tested, information about the full spectrum of proteins induced by the compound with their expression timing.
- functional activity of a compound on a specific cell type can be usefully studied by subjecting it to protein synthesis monitoring assay as disclosed herein only once for a given organism or cell-line.
- the illustrative strategy suitable for screening of a chemical compound library with the system and method disclosed herein is depicted in Figure 15 .
- a cell line with tagged ribosomes is cultured and placed in a multiwell plate 450.
- This can have a 96 well plate format, a 384 well plate format or any other format compatible with automated screening.
- the wells 452 in the plate need to be optically amenable for microscopy as shown in Figures 7 ,1011, 12 and 13 .
- a robot 454 administers one compound out of the library being screened into each well and protein synthesis analysis is performed by a protein synthesis monitoring system 456.
- a suitable sampling regime should be adopted. As an illustrative example a protein synthesis monitoring measurement for 30 seconds every 10 minutes for a total of one hour. Other regimes may optionally be also used.
- screening database 458 The list of proteins synthesized by the cell together with the synthesis timing during the sampling period for the particular well are stored in screening database 458.
- a sampling regime as described allows screening of 20 compounds per hour per protein synthesis measurement unit. In this way, screening of a library with one million compounds can take one year with five protein synthesis monitoring units or one month with 50. Obviously many alternative regimes can also be used.
- the data obtained for each compound through this PSM screening provides a list of the proteins induced by the compounds, together with the synthesis timing.
- the changes of the state of the cellular machine, caused by the administration of the compound can be discerned.
- the PSM assay of one compound shows a significant increase in the production of DNA repair enzymes, this may mean that the administered compound may cause DNA damage. This obviously means that the compound can never become a drug candidate.
- This type of information today is available only at toxicity studies stage in the drug development pipeline. Obtaining this kind of information at a very early stage of the process can save years of work and very large expenditures.
- Bioinformatics analysis of the PSM data collected for each compound can further yield information concerning the main and side effects of a compound, the states of the cellular machinery that it creates, and the protein pathways that it triggers.
- the method disclosed here has numerous attractive advantages.
- choice of drug leads and further development of drugs from these leads becomes much more of a research program and less of a guesswork. In this way, over a period of several months, a hitherto unobtainable amount of critical information is compiled about each of the compounds in the library.
- a customary receptor-binding assay produces only one bit of information for each compound - "binds" or "doesn't bind".
- screening with the present invention is not so much a screening system (that rejects most of the candidates), as much as a system for assigning function for entire chemical libraries.
- the cells being monitored can be human cells, bacterial cultures, yeast or any other appropriate collection of cells or cell line.
- Another important application of protein synthesis monitoring is as a tool for process optimization, process control and quality control of protein production, either in bio-reactors using bacteria or cell culture, or else in cell free translation systems.
- the present invention can provide indispensable information about the precise amounts of the target protein being produced, as well as on the comprehensive structure of the proteome backdrop to this manufacturing, ensuring that the desired protein is produced in precisely the required environment and in the right amounts.
- This level of control unavailable today, can create a revolution in the way proteins and protein drugs are produced and certified. This can lead to new protein production methods that are easier to control than current ones.
- the present invention can be used to monitor proteins being produced by bacteria, yeast, cell lines, cell-free translation system protein production systems or any other protein production processes.
- Numerous biopharmaceuticals are thus produced, including drugs and medical agents such as insulin, human growth hormone, erythropoietin, therapeutic antibodies, and other diagnostics and medical aids.
- the system disclosed herein can be integrated into the production system, enabling production yields and rates to be measured, controlled, and optimized in real time.
- PSM can help monitor precisely the cellular state and environment during the production of the target protein. This monitoring can ensure a hitherto unavailable level of control for protein production, and can also lead to new protein production methods that are easier to control than the customary methods. This new monitoring capability can make a large impact on the quality, quantity and cost of protein production, as well as allowing tighter regulatory control of protein production.
- This example describes how the methods disclosed herein can be used for basic biological research.
- One important field of research is the understanding of protein and metabolic pathways in the cell. Numerous methods have been suggested and several technologies have been developed to try and decipher the complex net of protein interactions and pathways of bacteria and cells. These include protein-protein interaction mapping from assays, from computerized analysis of research papers, and from clever setups as described in ( Shen-Orr, S.S., Milo, R., Mangan, S., and Alon, U., Network motifs in the transcriptional regulation network of Escherichia coli., Nat Genet 2002, 31(1): 64-8 ).
- the present invention offers important advantages for pathway elucidation.
- cells are cultured and placed in a suitable screening setup.
- the cells are then subjected to various external stimuli, such as temperature changes, chemical deprivation (such as phosphate starvation), administration of toxic agents, attack by phages or viruses and any other stimulus that is thought to be relevant to the pathway being investigated.
- external stimuli such as temperature changes, chemical deprivation (such as phosphate starvation), administration of toxic agents, attack by phages or viruses and any other stimulus that is thought to be relevant to the pathway being investigated.
- the cells or bacteria are studied using the present invention for an appropriate duration before, during and after the stimulus, and the response of the protein synthesis apparatus of the cell is tabled.
- a computerized analysis module analyzes the different responses, including the timing order of protein synthesis, which proteins tend to co-translate, what are their amounts, and what causality relationships occur between them.
- pathway elements can be determined as explained, for example, in Rosen et al., FEMS Microbiol. Ecol. 2001 , and Heckler et al., Int. J. Med. Microbiol 2000 .
- the dynamic information of cellular response to external stimulus is an extremely important probe of cellular behavior, which previously could not be measured.
- protein synthesis monitoring is used to identify protein pathways and protein-protein interaction maps.
- different chemical and environmental conditions are applied to cells or to cell lines, and protein synthesis is monitored for each one of these conditions.
- the protein synthesis patterns are indicative of the cellular pathways, and the protein synthesis data for the entire experiment is used to map the cells protein interaction, thereby enabling understanding of the intricate connections and functions of proteins in the cells.
Landscapes
- Health & Medical Sciences (AREA)
- Life Sciences & Earth Sciences (AREA)
- Engineering & Computer Science (AREA)
- Chemical & Material Sciences (AREA)
- Molecular Biology (AREA)
- Immunology (AREA)
- Physics & Mathematics (AREA)
- Hematology (AREA)
- Urology & Nephrology (AREA)
- Biomedical Technology (AREA)
- Biophysics (AREA)
- Bioinformatics & Cheminformatics (AREA)
- Biotechnology (AREA)
- Nanotechnology (AREA)
- General Health & Medical Sciences (AREA)
- Medicinal Chemistry (AREA)
- Food Science & Technology (AREA)
- Cell Biology (AREA)
- Bioinformatics & Computational Biology (AREA)
- Analytical Chemistry (AREA)
- Biochemistry (AREA)
- Microbiology (AREA)
- General Physics & Mathematics (AREA)
- Pathology (AREA)
- Proteomics, Peptides & Aminoacids (AREA)
- Crystallography & Structural Chemistry (AREA)
- Theoretical Computer Science (AREA)
- Mathematical Physics (AREA)
- General Engineering & Computer Science (AREA)
- Medical Informatics (AREA)
- Pharmacology & Pharmacy (AREA)
- Measuring Or Testing Involving Enzymes Or Micro-Organisms (AREA)
- Investigating Or Analysing Biological Materials (AREA)
Claims (35)
- Verfahren zum Überwachen der Proteinsynthese in einem Proteinsynthesesystem, wobei das Verfahren umfasst:Bereitstellen mindestens eines fluoreszierenden Donor-Akzeptor Paares in dem Proteinsynthesesystem, umfassend ein Donorfluorophor und ein Akzeptorfluorophor, die zum Durchführen eines Fluoreszenz-Resonanz-Energie-Transfers (FRET) geeignet sind, wobei das Donorfluorophor an mindestens ein Ribosom oder einen Abschnitt davon kovalent gebunden ist, und das Akzeptorfluorophor an eine tRNA, oder umgekehrt, kovalent gebunden ist; undNachweisen der FRET Signale in Echtzeit, die durch Energietransfer zwischen dem Donorfluorophor und dem Akzeptorfluorophor erhalten werden; undAnalysieren der FRET Signale, um ein oder mehrere Proteine zu identifizieren, die/das synthetisiert wurde(n), wobei das Analysieren umfasst:Anhäufen der FRET Signale in einer Liste von Signalsequenzen;Transformieren der Signalsequenzen in einen oder mehrere FRET An/Aus Signal-Datenströme;Verarbeiten der Datenströme/ des Datenstroms, um eine Liste von Proteinsequenzen abzufragen, die zu den Datenströmen/ dem Datenstrom passen; undBestimmen der Wahrscheinlichkeit für jede der Proteinsequenzen, dass dieses Protein für die Signalsequenz verantwortlich ist, wodurch mindestens ein Protein identifiziert wird, das synthetisiert wurde.
- Verfahren nach Anspruch 1, wobei das System ein Bakterium oder eine Bakterienkultur umfasst.
- Verfahren nach Anspruch 1, wobei das System mindestens eine Zelle umfasst.
- Verfahren nach Anspruch 3, wobei das System mindestens eines einer Zelllinie oder einer Zellkultur umfasst.
- Verfahren nach Anspruch 1, wobei das System ein zellfreies Proteintranslationssystem (in-vitro Translationsystem) umfasst.
- Verfahren nach Anspruch 1, wobei die Signalsequenz Zeitintervallwerte, Bildkoordinaten und Signal-Typen oder Intensität von sowohl dem Donor als auch dem Akzeptor umfasst.
- Verfahren nach Anspruch 1, wobei das Fluorophor ein fluoreszierendes Protein, ein fluoreszierender Farbstoff, oder ein Quantenpunkt ist.
- Verfahren nach Anspruch 1, wobei der ribosomale Abschnitt an oder in der Nähe mindestens einer Ribosomenstelle lokalisiert ist, die ausgewählt ist unter der ribosomalen A Stelle, the ribosomalen P Stelle, der ribosomalen E Stelle oder Peptid-Exit-Tunnel-Stelle.
- Verfahren nach Anspruch 1, wobei der ribosomale Abschnitt ausgewählt ist unter ribosomaler RNA und einem ribosomalen Protein.
- Verfahren nach Anspruch 9, wobei das ribosomale Protein ausgewählt ist unter ribosomalen Protein L1, ribosomalen Protein S 1 oder einer Kombination davon.
- Verfahren nach einem der Ansprüche 1-10, wobei das Nachweisen umfasst Bestrahlen des Systems mit elektromagnetischer Strahlung umfasst.
- Verfahren nach einem der Ansprüche 1-11, wobei das FRET Signal eine emittierte Strahlung ist, die mit einem Mikroskop bestimmt wird.
- Verfahren nach Anspruch 12, das zum Messen emittierter Strahlung von einem einzelnen Ribosom angepasst ist, wobei das FRET Paar ein einzelnes FRET Paar ist.
- Verfahren nach einem der Ansprüche 1-12, das zum Messen von Signalen mehrerer Ribosomen und Analysieren der Strahlung angepasst ist, die von den mehreren Ribosomen emittiert wird.
- Verfahren nach einem der Ansprüche 1-14, wobei das Nachweisen ferner Überwachen der Proteinsynthese durch Nachweisen mehrerer Proteinsynthesevorgänge über einen Zeitraum umfasst.
- Verfahren nach Anspruch 15, wobei die mehreren Proteinsynthesevorgänge mehrere Wechselwirkungen zwischen einem Ribosom und mehreren unterschiedlichen tRNA Molekülen umfassen.
- Vorrichtung zum Überwachen der Proteinsynthese in einem Proteinsynthesesystem, worin die Vorrichtung umfasst:einen Behälter, der ein Proteinsynthesesystem umfasst, das mindestens ein fluoreszierendes Donor-Akzeptor Paar umfasst, das ein Donorfluorophor und ein Akzeptorfluorophor umfasst, die zum Durchführen eines Fluoreszenz-Resonanz-Energie-Transfers (FRET) geeignet sind, worin das Donorfluorophor an mindestens ein Ribosom oder einen Abschnitt davon kovalent gebunden ist, und das Akzeptorfluorophor an eine tRNA, oder umgekehrt, kovalent gebunden ist;ein Detektionssystem zum Überwachen der FRET Signale, die durch Energietransfer zwischen dem Donorfluorophor und dem Akzeptorfluorophor erhalten werden, worin das Detektionssystem in Echtzeit arbeitet; undeine Rechenvorrichtung zum Analysieren der FRET Signale, worin die Rechenvorrichtung umfasst:ein Signalsequenziermodul zum Anhäufen der FRET Signale in einer Liste von Signalsequenzen;ein Sequenzanalysemodul zum Transformieren der Signalsequenzen in einen oder mehrere Datenströme von FRET An/Aus Signalen;ein Proteinidentifikationsmodul zum Verarbeiten der Datenströme/ des Datenstroms, um eine Liste von Proteinsequenzen abzufragen, die zu den Datenstörmen/ dem Datenstrom passen; undein Scorermodul zum Bestimmen der Wahrscheinlichkeit für jede der Proteinsequenzen, dass dieses Protein für die Signalsequenz verantwortlich ist, wodurch mindestens ein Protein identifiziert wird, das synthetisiert wurde.
- Vorrichtung nach Anspruch 17, zum Überwachen der Proteinsynthese, worin das System ein Bakterium oder eine Bakterienkultur umfasst.
- Vorrichtung nach Anspruch 17, zum Überwachen der Proteinsynthese, worin das System mindestens eine Zelle umfasst.
- Vorrichtung nach Anspruch 19, worin die mindestens eine Zelle mindestens eine Zellline oder Zellkultur ist.
- Vorrichtung nach Anspruch 17, zum Überwachen der Proteinsynthese, worin das System ein zellfreies Proteintranslationssystem (in-vitro Translationsystem) umfasst.
- Vorrichtung nach einem der Ansprüche 17-21, worin die Signalsequenzen Zeitintervallwerte, Bildkoordinaten und Signal-Typen oder Intensitäten umfassen.
- Vorrichtung nach Anspruch 17, worin das Fluorophor ein fluoreszierendes Protein, ein fluoreszierender Farbstoff, oder ein Quantenpunkt ist.
- Vorrichtung nach Anspruch 17, worin der ribosomale Abschnitt an oder in der Nähe mindestens einer Ribosomenstelle lokalisiert ist, die ausgewählt ist unter der ribosomalen A Stelle, der ribosomalen P Stelle, der ribosomalen E Stelle oder Peptid-Exit-Tunnel-Stelle.
- Vorrichtung nach Anspruch 24, worin der ribosomale Abschnitt ausgewählt ist unter ribosomaler RNA und einem ribosomalen Protein.
- Vorrichtung nach Anspruch 25, worin das ribosomale Protein ausgewählt ist unter ribosomalen Protein L1, ribosomalen Protein S 1 oder einer Kombination davon.
- Vorrichtung nach einem der Ansprüche 17-26, worin das Detektionssystem das System mit elektromagnetischer Strahlung bestrahlt.
- Vorrichtung nach einem der Ansprüche 17-27, worin das Detektionssystem ein Mikroskop umfasst.
- Vorrichtung nach Anspruch 28, worin das Detektionssystem emittierte Strahlung von einem einzelnen Ribosom misst, worin das FRET Paar ein einzelnes FRET Paar ist.
- Vorrichtung nach einem der Ansprüche 17-28, worin das Detektionssystem mehrere Signale misst, die von mehrere Ribosomen emittiert werden, und worin die Rechenvorrichtung eine Signalanalyse der emittierten Strahlung der mehreren FRET Signale durchführt.
- Vorrichtung nach einem der Ansprüche 17-30, worin das Detektionssystem die Proteinsynthese durch Nachweisen mehrerer Proteinsynthesevorgänge über einen Zeitraum überwacht.
- Vorrichtung nach Anspruch 31, worin die mehreren Proteinsynthesevorgänge mehrere Wechselwirkungen eines einzelnen Ribosoms mit mehreren unterschiedlichen tRNA Molekülen umfassen.
- Verfahren zum Analysieren einer Bibliothek chemischer Verbindungen, wobei das Verfahren umfasst:Bereitstellen einer Bibliothek von Verbindungen;Bereitstellen eines Proteintranslationssystems, umfassend mindestens ein fluoreszierendes Donor-Akzeptor Paar, das ein Donorfluorophor und ein Akzeptorfluorophor umfasst, die zum Durchführen einer FRET geeignet sind, wobei das Donorfluorophor an mindestens ein Ribosom oder einen Abschnitt davon kovalent gebunden ist, und das Akzeptorfluorophor an eine tRNA, oder umgekehrt, kovalent gebunden ist; Applizieren jeder der Verbindungen an das Proteintranslationssystem;Messen einer Reaktion des Systems nach dem Verfahren nach einem der Ansprüche 1-16; undAnalysieren der Messung, um Informationen über die Verbindung bereitzustellen.
- Verfahren zum Bestimmen zellulärer Protein-Pathways, umfassend:Auswählen einer Zelle oder einer Bakterienkultur;Platzieren der Kultur in mehrere Probenbehälter;Unterziehen der Kultur mindestens einer Bedingung in jedem der Behälter;Messen der Proteinsynthese in jedem der Behälter nach dem Verfahren nach den Ansprüchen 1-16; undAnalysieren der Proteinexpressionsmuster in allen Behälters, um Protein-Pathways zu bestimmen.
- Verwendung der Vorrichtung nach einem der Ansprüche 17-32 zum Nachweisen eines pathologischen Zustands in einem Subjekt.
Applications Claiming Priority (3)
| Application Number | Priority Date | Filing Date | Title |
|---|---|---|---|
| US42953202P | 2002-11-29 | 2002-11-29 | |
| US429532P | 2002-11-29 | ||
| PCT/IL2003/001011 WO2004050825A2 (en) | 2002-11-29 | 2003-11-27 | Protein synthesis monitoring (psm) |
Publications (3)
| Publication Number | Publication Date |
|---|---|
| EP1565566A2 EP1565566A2 (de) | 2005-08-24 |
| EP1565566A4 EP1565566A4 (de) | 2007-04-11 |
| EP1565566B1 true EP1565566B1 (de) | 2013-09-25 |
Family
ID=32469329
Family Applications (1)
| Application Number | Title | Priority Date | Filing Date |
|---|---|---|---|
| EP03775772.1A Expired - Lifetime EP1565566B1 (de) | 2002-11-29 | 2003-11-27 | Proteinsynthese-monitoring (psm) |
Country Status (5)
| Country | Link |
|---|---|
| US (1) | US7807349B2 (de) |
| EP (1) | EP1565566B1 (de) |
| AU (1) | AU2003283791B2 (de) |
| CA (1) | CA2517566C (de) |
| WO (1) | WO2004050825A2 (de) |
Families Citing this family (30)
| Publication number | Priority date | Publication date | Assignee | Title |
|---|---|---|---|---|
| US8442773B2 (en) | 2002-11-29 | 2013-05-14 | Anima Cell Metrology | Protein synthesis monitoring (PSM) |
| US7807349B2 (en) | 2002-11-29 | 2010-10-05 | Anima Cell Metrology | Protein synthesis monitoring (PSM) |
| US7706984B2 (en) * | 2003-03-11 | 2010-04-27 | The Regents Of The University Of California | Method and device for identifying molecular species |
| EP1751299B1 (de) * | 2004-05-26 | 2010-01-27 | Anima Cell Metrology | Verfahren zur auswertung von ribonukleotidsequenzen |
| US8323886B2 (en) * | 2004-06-18 | 2012-12-04 | Wlodek Mandecki | Fluorescence methods of detecting a protein-elongation related complex and corollary sequence information |
| GB0514553D0 (en) | 2005-07-15 | 2005-08-24 | Nonlinear Dynamics Ltd | A method of analysing a representation of a separation pattern |
| GB0514555D0 (en) | 2005-07-15 | 2005-08-24 | Nonlinear Dynamics Ltd | A method of analysing separation patterns |
| US7879975B2 (en) | 2006-06-29 | 2011-02-01 | The Invention Science Fund I, Llc | Methods for arbitrary peptide synthesis |
| US7777002B2 (en) | 2006-06-29 | 2010-08-17 | The Invention Science Fund I, Llc | Methods for arbitrary peptide synthesis |
| US7923533B2 (en) | 2006-06-29 | 2011-04-12 | The Invention Science Fund I, Llc | Methods for arbitrary peptide synthesis |
| US7910695B2 (en) | 2006-06-29 | 2011-03-22 | The Invention Science Fund I, Llc | Methods for arbitrary peptide synthesis |
| US7879974B2 (en) | 2006-06-29 | 2011-02-01 | The Invention Science Fund I, Llc | Methods for arbitrary peptide synthesis |
| US8481259B2 (en) | 2007-02-05 | 2013-07-09 | Intelligent Bio-Systems, Inc. | Methods and devices for sequencing nucleic acids in smaller batches |
| US11940413B2 (en) | 2007-02-05 | 2024-03-26 | IsoPlexis Corporation | Methods and devices for sequencing nucleic acids in smaller batches |
| US11035823B2 (en) | 2009-03-17 | 2021-06-15 | Qiagen Sciences, Llc | Methods and devices for sequencing nucleic acids in smaller batches |
| DE112008000363B4 (de) | 2007-02-05 | 2021-12-02 | Qiagen Sciences, LLC (n.d.Ges.d. Staates Delaware) | Vorrichtung zur Detektion und ihre Verwendung |
| WO2009002866A1 (en) | 2007-06-22 | 2008-12-31 | The Trustees Of The University Of Pennsylvania | Fluorescent labeling of transfer rna and study of protein synthesis |
| US20090035807A1 (en) * | 2007-07-31 | 2009-02-05 | Wyeth | Analysis of polypeptide production |
| WO2009047760A2 (en) | 2007-10-09 | 2009-04-16 | Anima Cell Metrology, Inc. | Systems and methods for measuring translation activity in viable cells |
| US20100075361A1 (en) * | 2008-04-09 | 2010-03-25 | Government of the United States of America the Secretary of the Navy(ONR/NRL) | Methods of generating florescence resonance energy transfer (fret) between semiconductor quantum dots and fluorescent dyes/proteins via multi-photon excitation, achieving zero background or direct excitation contributions to the fret signature |
| US8609421B2 (en) | 2009-06-12 | 2013-12-17 | Pacific Biosciences Of California, Inc. | Single-molecule real-time analysis of protein synthesis |
| CA2775231C (en) | 2009-09-24 | 2018-06-05 | Anima Cell Metrology, Inc. | Systems and methods for measuring translation of target proteins in cells |
| DE102010012857B4 (de) * | 2010-03-25 | 2015-02-19 | Tim Liedl | Vorrichtung zum Erfassen einer Weggröße |
| WO2012011110A2 (en) * | 2010-07-22 | 2012-01-26 | Ramot At Tel Aviv University Ltd. | Systems and methods for detection of cellular stress |
| WO2017085718A1 (en) | 2015-11-17 | 2017-05-26 | Anima Biotech Inc. | FUNCTIONAL TRANSFER tRNA-APTAMER MOLECULES |
| DE202016008224U1 (de) * | 2016-01-20 | 2017-05-03 | Erich Utsch Ag | Verpackungsbehälter für Kennzeichen-Platinen sowie zur Verwendung solcher Verpackungsbehälter eingerichtete Prägepresse |
| US11821018B2 (en) | 2020-02-14 | 2023-11-21 | Nuclera Ltd. | Methods for cell-free protein expression |
| GB202013063D0 (en) * | 2020-08-21 | 2020-10-07 | Nuclera Nucleics Ltd | Real-time monitoring of in vitro protein synthesis |
| AU2021327851A1 (en) * | 2020-08-21 | 2023-03-02 | Nuclera Nucleics Ltd | Monitoring of in vitro protein synthesis |
| WO2023021295A2 (en) * | 2021-08-18 | 2023-02-23 | Nuclera Nucleics Ltd | Methods and compositions for improved biomolecule assays on digital microfluidic devices |
Family Cites Families (7)
| Publication number | Priority date | Publication date | Assignee | Title |
|---|---|---|---|---|
| US6210941B1 (en) * | 1997-06-27 | 2001-04-03 | The Trustees Of Boston University | Methods for the detection and isolation of proteins |
| US5643722A (en) * | 1994-05-11 | 1997-07-01 | Trustees Of Boston University | Methods for the detection and isolation of proteins |
| US5777079A (en) * | 1994-11-10 | 1998-07-07 | The Regents Of The University Of California | Modified green fluorescent proteins |
| US5626058A (en) * | 1995-04-24 | 1997-05-06 | Karpowich; John W. | Rotary actuator for a bicycle brake |
| AU7086800A (en) | 1999-08-30 | 2001-03-26 | Government Of The United States Of America, As Represented By The Secretary Of The Department Of Health And Human Services, The | High speed parallel molecular nucleic acid sequencing |
| WO2003064604A2 (en) | 2002-01-25 | 2003-08-07 | The Board Of Trustees Of The Leland Stanford Junior University | Translation profiling |
| US7807349B2 (en) * | 2002-11-29 | 2010-10-05 | Anima Cell Metrology | Protein synthesis monitoring (PSM) |
-
2003
- 2003-11-27 US US10/537,071 patent/US7807349B2/en active Active
- 2003-11-27 EP EP03775772.1A patent/EP1565566B1/de not_active Expired - Lifetime
- 2003-11-27 CA CA2517566A patent/CA2517566C/en not_active Expired - Fee Related
- 2003-11-27 AU AU2003283791A patent/AU2003283791B2/en not_active Ceased
- 2003-11-27 WO PCT/IL2003/001011 patent/WO2004050825A2/en not_active Application Discontinuation
Non-Patent Citations (1)
| Title |
|---|
| ODOM O W ET AL: "Movement of tRNA but not the nascent peptide during peptide bond formation on ribosomes", BIOCHEMISTRY, AMERICAN CHEMICAL SOCIETY, US, vol. 29, no. 48, 4 December 1990 (1990-12-04), pages 10734 - 10744, XP002551149, ISSN: 0006-2960, DOI: 10.1021/BI00500A004 * |
Also Published As
| Publication number | Publication date |
|---|---|
| AU2003283791B2 (en) | 2010-04-22 |
| WO2004050825A2 (en) | 2004-06-17 |
| US7807349B2 (en) | 2010-10-05 |
| WO2004050825A3 (en) | 2004-12-02 |
| CA2517566C (en) | 2016-01-05 |
| AU2003283791A1 (en) | 2004-06-23 |
| EP1565566A2 (de) | 2005-08-24 |
| CA2517566A1 (en) | 2004-06-17 |
| US20060228708A1 (en) | 2006-10-12 |
| EP1565566A4 (de) | 2007-04-11 |
Similar Documents
| Publication | Publication Date | Title |
|---|---|---|
| EP1565566B1 (de) | Proteinsynthese-monitoring (psm) | |
| Tian et al. | Labeling and single-molecule methods to monitor G protein-coupled receptor dynamics | |
| Tinoco et al. | Biological mechanisms, one molecule at a time | |
| Sasmal et al. | Single-molecule fluorescence resonance energy transfer in molecular biology | |
| Gust et al. | A starting point for fluorescence-based single-molecule measurements in biomolecular research | |
| Ökten et al. | Myosin VI walks hand-over-hand along actin | |
| Roy et al. | A practical guide to single-molecule FRET | |
| Loveland et al. | A general approach to break the concentration barrier in single-molecule imaging | |
| CA2567749C (en) | Methods for evaluating ribonucleotide sequences | |
| US8442773B2 (en) | Protein synthesis monitoring (PSM) | |
| EP1949104B1 (de) | Verfahren zur messung der affinität von biomolekülen | |
| Effraim et al. | Natural amino acids do not require their native tRNAs for efficient selection by the ribosome | |
| Zhang et al. | General strategy to improve the photon budget of thiol-conjugated cyanine dyes | |
| Rueda et al. | Single molecule fluorescence control for nanotechnology | |
| Leake et al. | A guide to small fluorescent probes for single-molecule biophysics | |
| US20170370917A1 (en) | Molecular sensors | |
| IL168822A (en) | Method and apparatus for protein synthesis monitoring based on electromagnetic radiation | |
| Kinz-Thompson et al. | smFRET studies of the ‘encounter’complexes and subsequent intermediate states that regulate the selectivity of ligand binding | |
| Manzoor et al. | Nanoscale gizmos–the novel fluorescent probes for monitoring protein activity | |
| Poluri et al. | Experimental methods for determination of protein–protein interactions | |
| EP3510401A1 (de) | Molekulare sensoren | |
| Pappas et al. | Exploring biomolecular interactions by single-molecule fluorescence | |
| Filius et al. | Full-length single-molecule protein fingerprinting | |
| JP4747292B2 (ja) | 翻訳テンプレートおよびそのライブラリー、それらから合成される蛋白質および蛋白質のライブラリー、ならびにそれらを構成する要素、ならびにそれらの製造法および利用方法 | |
| Laskowski | Characterization of insertion and interactions of membrane proteins with atomic force microscopy |
Legal Events
| Date | Code | Title | Description |
|---|---|---|---|
| PUAI | Public reference made under article 153(3) epc to a published international application that has entered the european phase |
Free format text: ORIGINAL CODE: 0009012 |
|
| 17P | Request for examination filed |
Effective date: 20050603 |
|
| AK | Designated contracting states |
Kind code of ref document: A2 Designated state(s): AT BE BG CH CY CZ DE DK EE ES FI FR GB GR HU IE IT LI LU MC NL PT RO SE SI SK TR |
|
| AX | Request for extension of the european patent |
Extension state: AL LT LV MK |
|
| DAX | Request for extension of the european patent (deleted) | ||
| RIC1 | Information provided on ipc code assigned before grant |
Ipc: C12M 1/00 20060101ALI20070228BHEP Ipc: G06F 19/00 20060101ALI20070228BHEP Ipc: C12Q 1/00 20060101ALI20070228BHEP Ipc: G01N 33/53 20060101AFI20070228BHEP Ipc: C12Q 1/02 20060101ALI20070228BHEP Ipc: C12Q 1/48 20060101ALI20070228BHEP Ipc: C12Q 1/34 20060101ALI20070228BHEP Ipc: C12Q 1/37 20060101ALI20070228BHEP |
|
| A4 | Supplementary search report drawn up and despatched |
Effective date: 20070309 |
|
| 17Q | First examination report despatched |
Effective date: 20070713 |
|
| RAP1 | Party data changed (applicant data changed or rights of an application transferred) |
Owner name: ANIMA CELL METROLOGY |
|
| REG | Reference to a national code |
Ref country code: DE Ref legal event code: R079 Ref document number: 60344986 Country of ref document: DE Free format text: PREVIOUS MAIN CLASS: C12Q0001020000 Ipc: G01N0033542000 |
|
| GRAP | Despatch of communication of intention to grant a patent |
Free format text: ORIGINAL CODE: EPIDOSNIGR1 |
|
| RIC1 | Information provided on ipc code assigned before grant |
Ipc: G01N 33/68 20060101ALI20130313BHEP Ipc: B82Y 5/00 20110101ALI20130313BHEP Ipc: B82Y 10/00 20110101ALI20130313BHEP Ipc: G01N 33/542 20060101AFI20130313BHEP |
|
| INTG | Intention to grant announced |
Effective date: 20130412 |
|
| GRAS | Grant fee paid |
Free format text: ORIGINAL CODE: EPIDOSNIGR3 |
|
| GRAA | (expected) grant |
Free format text: ORIGINAL CODE: 0009210 |
|
| AK | Designated contracting states |
Kind code of ref document: B1 Designated state(s): AT BE BG CH CY CZ DE DK EE ES FI FR GB GR HU IE IT LI LU MC NL PT RO SE SI SK TR |
|
| REG | Reference to a national code |
Ref country code: GB Ref legal event code: FG4D |
|
| REG | Reference to a national code |
Ref country code: CH Ref legal event code: EP |
|
| REG | Reference to a national code |
Ref country code: AT Ref legal event code: REF Ref document number: 633905 Country of ref document: AT Kind code of ref document: T Effective date: 20131015 |
|
| REG | Reference to a national code |
Ref country code: IE Ref legal event code: FG4D |
|
| REG | Reference to a national code |
Ref country code: DE Ref legal event code: R096 Ref document number: 60344986 Country of ref document: DE Effective date: 20131121 |
|
| REG | Reference to a national code |
Ref country code: CH Ref legal event code: NV Representative=s name: ROMAN VUILLE, CH |
|
| REG | Reference to a national code |
Ref country code: NL Ref legal event code: T3 |
|
| PG25 | Lapsed in a contracting state [announced via postgrant information from national office to epo] |
Ref country code: SE Free format text: LAPSE BECAUSE OF FAILURE TO SUBMIT A TRANSLATION OF THE DESCRIPTION OR TO PAY THE FEE WITHIN THE PRESCRIBED TIME-LIMIT Effective date: 20130925 |
|
| REG | Reference to a national code |
Ref country code: AT Ref legal event code: MK05 Ref document number: 633905 Country of ref document: AT Kind code of ref document: T Effective date: 20130925 |
|
| PG25 | Lapsed in a contracting state [announced via postgrant information from national office to epo] |
Ref country code: FI Free format text: LAPSE BECAUSE OF FAILURE TO SUBMIT A TRANSLATION OF THE DESCRIPTION OR TO PAY THE FEE WITHIN THE PRESCRIBED TIME-LIMIT Effective date: 20130925 Ref country code: GR Free format text: LAPSE BECAUSE OF FAILURE TO SUBMIT A TRANSLATION OF THE DESCRIPTION OR TO PAY THE FEE WITHIN THE PRESCRIBED TIME-LIMIT Effective date: 20131226 Ref country code: SI Free format text: LAPSE BECAUSE OF FAILURE TO SUBMIT A TRANSLATION OF THE DESCRIPTION OR TO PAY THE FEE WITHIN THE PRESCRIBED TIME-LIMIT Effective date: 20130925 |
|
| PG25 | Lapsed in a contracting state [announced via postgrant information from national office to epo] |
Ref country code: BE Free format text: LAPSE BECAUSE OF FAILURE TO SUBMIT A TRANSLATION OF THE DESCRIPTION OR TO PAY THE FEE WITHIN THE PRESCRIBED TIME-LIMIT Effective date: 20130925 |
|
| PG25 | Lapsed in a contracting state [announced via postgrant information from national office to epo] |
Ref country code: RO Free format text: LAPSE BECAUSE OF FAILURE TO SUBMIT A TRANSLATION OF THE DESCRIPTION OR TO PAY THE FEE WITHIN THE PRESCRIBED TIME-LIMIT Effective date: 20130925 Ref country code: EE Free format text: LAPSE BECAUSE OF FAILURE TO SUBMIT A TRANSLATION OF THE DESCRIPTION OR TO PAY THE FEE WITHIN THE PRESCRIBED TIME-LIMIT Effective date: 20130925 Ref country code: CZ Free format text: LAPSE BECAUSE OF FAILURE TO SUBMIT A TRANSLATION OF THE DESCRIPTION OR TO PAY THE FEE WITHIN THE PRESCRIBED TIME-LIMIT Effective date: 20130925 Ref country code: SK Free format text: LAPSE BECAUSE OF FAILURE TO SUBMIT A TRANSLATION OF THE DESCRIPTION OR TO PAY THE FEE WITHIN THE PRESCRIBED TIME-LIMIT Effective date: 20130925 |
|
| PG25 | Lapsed in a contracting state [announced via postgrant information from national office to epo] |
Ref country code: AT Free format text: LAPSE BECAUSE OF FAILURE TO SUBMIT A TRANSLATION OF THE DESCRIPTION OR TO PAY THE FEE WITHIN THE PRESCRIBED TIME-LIMIT Effective date: 20130925 Ref country code: ES Free format text: LAPSE BECAUSE OF FAILURE TO SUBMIT A TRANSLATION OF THE DESCRIPTION OR TO PAY THE FEE WITHIN THE PRESCRIBED TIME-LIMIT Effective date: 20130925 Ref country code: CY Free format text: LAPSE BECAUSE OF FAILURE TO SUBMIT A TRANSLATION OF THE DESCRIPTION OR TO PAY THE FEE WITHIN THE PRESCRIBED TIME-LIMIT Effective date: 20130925 |
|
| REG | Reference to a national code |
Ref country code: DE Ref legal event code: R097 Ref document number: 60344986 Country of ref document: DE |
|
| PG25 | Lapsed in a contracting state [announced via postgrant information from national office to epo] |
Ref country code: PT Free format text: LAPSE BECAUSE OF FAILURE TO SUBMIT A TRANSLATION OF THE DESCRIPTION OR TO PAY THE FEE WITHIN THE PRESCRIBED TIME-LIMIT Effective date: 20140127 |
|
| PG25 | Lapsed in a contracting state [announced via postgrant information from national office to epo] |
Ref country code: MC Free format text: LAPSE BECAUSE OF FAILURE TO SUBMIT A TRANSLATION OF THE DESCRIPTION OR TO PAY THE FEE WITHIN THE PRESCRIBED TIME-LIMIT Effective date: 20130925 |
|
| PLBE | No opposition filed within time limit |
Free format text: ORIGINAL CODE: 0009261 |
|
| STAA | Information on the status of an ep patent application or granted ep patent |
Free format text: STATUS: NO OPPOSITION FILED WITHIN TIME LIMIT |
|
| REG | Reference to a national code |
Ref country code: IE Ref legal event code: MM4A |
|
| PG25 | Lapsed in a contracting state [announced via postgrant information from national office to epo] |
Ref country code: IT Free format text: LAPSE BECAUSE OF FAILURE TO SUBMIT A TRANSLATION OF THE DESCRIPTION OR TO PAY THE FEE WITHIN THE PRESCRIBED TIME-LIMIT Effective date: 20130925 |
|
| 26N | No opposition filed |
Effective date: 20140626 |
|
| PG25 | Lapsed in a contracting state [announced via postgrant information from national office to epo] |
Ref country code: DK Free format text: LAPSE BECAUSE OF FAILURE TO SUBMIT A TRANSLATION OF THE DESCRIPTION OR TO PAY THE FEE WITHIN THE PRESCRIBED TIME-LIMIT Effective date: 20130925 |
|
| REG | Reference to a national code |
Ref country code: DE Ref legal event code: R097 Ref document number: 60344986 Country of ref document: DE Effective date: 20140626 |
|
| PG25 | Lapsed in a contracting state [announced via postgrant information from national office to epo] |
Ref country code: IE Free format text: LAPSE BECAUSE OF NON-PAYMENT OF DUE FEES Effective date: 20131127 |
|
| PG25 | Lapsed in a contracting state [announced via postgrant information from national office to epo] |
Ref country code: TR Free format text: LAPSE BECAUSE OF FAILURE TO SUBMIT A TRANSLATION OF THE DESCRIPTION OR TO PAY THE FEE WITHIN THE PRESCRIBED TIME-LIMIT Effective date: 20130925 |
|
| PG25 | Lapsed in a contracting state [announced via postgrant information from national office to epo] |
Ref country code: BG Free format text: LAPSE BECAUSE OF FAILURE TO SUBMIT A TRANSLATION OF THE DESCRIPTION OR TO PAY THE FEE WITHIN THE PRESCRIBED TIME-LIMIT Effective date: 20130925 Ref country code: LU Free format text: LAPSE BECAUSE OF NON-PAYMENT OF DUE FEES Effective date: 20131127 Ref country code: HU Free format text: LAPSE BECAUSE OF FAILURE TO SUBMIT A TRANSLATION OF THE DESCRIPTION OR TO PAY THE FEE WITHIN THE PRESCRIBED TIME-LIMIT; INVALID AB INITIO Effective date: 20031127 |
|
| REG | Reference to a national code |
Ref country code: FR Ref legal event code: PLFP Year of fee payment: 13 |
|
| REG | Reference to a national code |
Ref country code: FR Ref legal event code: PLFP Year of fee payment: 14 |
|
| REG | Reference to a national code |
Ref country code: FR Ref legal event code: PLFP Year of fee payment: 15 |
|
| REG | Reference to a national code |
Ref country code: DE Ref legal event code: R082 Ref document number: 60344986 Country of ref document: DE Representative=s name: 2K PATENT- UND RECHTSANWAELTE PARTNERSCHAFT MB, DE |
|
| PGFP | Annual fee paid to national office [announced via postgrant information from national office to epo] |
Ref country code: NL Payment date: 20201125 Year of fee payment: 18 |
|
| PGFP | Annual fee paid to national office [announced via postgrant information from national office to epo] |
Ref country code: FR Payment date: 20201120 Year of fee payment: 18 Ref country code: GB Payment date: 20201120 Year of fee payment: 18 Ref country code: DE Payment date: 20201119 Year of fee payment: 18 Ref country code: CH Payment date: 20201118 Year of fee payment: 18 |
|
| REG | Reference to a national code |
Ref country code: DE Ref legal event code: R119 Ref document number: 60344986 Country of ref document: DE |
|
| REG | Reference to a national code |
Ref country code: CH Ref legal event code: PL |
|
| REG | Reference to a national code |
Ref country code: NL Ref legal event code: MM Effective date: 20211201 |
|
| GBPC | Gb: european patent ceased through non-payment of renewal fee |
Effective date: 20211127 |
|
| PG25 | Lapsed in a contracting state [announced via postgrant information from national office to epo] |
Ref country code: LI Free format text: LAPSE BECAUSE OF NON-PAYMENT OF DUE FEES Effective date: 20211130 Ref country code: CH Free format text: LAPSE BECAUSE OF NON-PAYMENT OF DUE FEES Effective date: 20211130 |
|
| PG25 | Lapsed in a contracting state [announced via postgrant information from national office to epo] |
Ref country code: NL Free format text: LAPSE BECAUSE OF NON-PAYMENT OF DUE FEES Effective date: 20211201 |
|
| PG25 | Lapsed in a contracting state [announced via postgrant information from national office to epo] |
Ref country code: GB Free format text: LAPSE BECAUSE OF NON-PAYMENT OF DUE FEES Effective date: 20211127 Ref country code: DE Free format text: LAPSE BECAUSE OF NON-PAYMENT OF DUE FEES Effective date: 20220601 |
|
| PG25 | Lapsed in a contracting state [announced via postgrant information from national office to epo] |
Ref country code: FR Free format text: LAPSE BECAUSE OF NON-PAYMENT OF DUE FEES Effective date: 20211130 |