EP1553589A1 - Method for playback or recording of an optical recording medium - Google Patents
Method for playback or recording of an optical recording medium Download PDFInfo
- Publication number
- EP1553589A1 EP1553589A1 EP04000107A EP04000107A EP1553589A1 EP 1553589 A1 EP1553589 A1 EP 1553589A1 EP 04000107 A EP04000107 A EP 04000107A EP 04000107 A EP04000107 A EP 04000107A EP 1553589 A1 EP1553589 A1 EP 1553589A1
- Authority
- EP
- European Patent Office
- Prior art keywords
- region
- abnormal region
- abnormal
- optical recording
- recording medium
- Prior art date
- Legal status (The legal status is an assumption and is not a legal conclusion. Google has not performed a legal analysis and makes no representation as to the accuracy of the status listed.)
- Withdrawn
Links
- 230000003287 optical effect Effects 0.000 title claims abstract description 47
- 238000000034 method Methods 0.000 title claims abstract description 39
- 230000002159 abnormal effect Effects 0.000 claims abstract description 123
- 230000007547 defect Effects 0.000 claims description 13
- 230000009191 jumping Effects 0.000 claims description 8
- 230000003362 replicative effect Effects 0.000 claims description 2
- 238000011156 evaluation Methods 0.000 description 4
- 238000001514 detection method Methods 0.000 description 3
- 238000013459 approach Methods 0.000 description 2
- 230000010365 information processing Effects 0.000 description 2
- 238000005259 measurement Methods 0.000 description 2
- 238000000691 measurement method Methods 0.000 description 2
- 238000012545 processing Methods 0.000 description 2
- 230000005540 biological transmission Effects 0.000 description 1
- 230000008034 disappearance Effects 0.000 description 1
- 238000012854 evaluation process Methods 0.000 description 1
- 230000006870 function Effects 0.000 description 1
- 238000003780 insertion Methods 0.000 description 1
- 230000037431 insertion Effects 0.000 description 1
- 238000004519 manufacturing process Methods 0.000 description 1
- 238000003908 quality control method Methods 0.000 description 1
- 230000006641 stabilisation Effects 0.000 description 1
- 238000011105 stabilization Methods 0.000 description 1
- 238000012546 transfer Methods 0.000 description 1
Images




Classifications
-
- G—PHYSICS
- G11—INFORMATION STORAGE
- G11B—INFORMATION STORAGE BASED ON RELATIVE MOVEMENT BETWEEN RECORD CARRIER AND TRANSDUCER
- G11B20/00—Signal processing not specific to the method of recording or reproducing; Circuits therefor
- G11B20/00086—Circuits for prevention of unauthorised reproduction or copying, e.g. piracy
- G11B20/00978—Circuits for prevention of unauthorised reproduction or copying, e.g. piracy wherein the record carrier stores a trial version of a content
-
- G—PHYSICS
- G11—INFORMATION STORAGE
- G11B—INFORMATION STORAGE BASED ON RELATIVE MOVEMENT BETWEEN RECORD CARRIER AND TRANSDUCER
- G11B20/00—Signal processing not specific to the method of recording or reproducing; Circuits therefor
- G11B20/10—Digital recording or reproducing
- G11B20/18—Error detection or correction; Testing, e.g. of drop-outs
-
- G—PHYSICS
- G01—MEASURING; TESTING
- G01N—INVESTIGATING OR ANALYSING MATERIALS BY DETERMINING THEIR CHEMICAL OR PHYSICAL PROPERTIES
- G01N21/00—Investigating or analysing materials by the use of optical means, i.e. using sub-millimetre waves, infrared, visible or ultraviolet light
- G01N21/84—Systems specially adapted for particular applications
- G01N21/88—Investigating the presence of flaws or contamination
-
- G—PHYSICS
- G01—MEASURING; TESTING
- G01N—INVESTIGATING OR ANALYSING MATERIALS BY DETERMINING THEIR CHEMICAL OR PHYSICAL PROPERTIES
- G01N21/00—Investigating or analysing materials by the use of optical means, i.e. using sub-millimetre waves, infrared, visible or ultraviolet light
- G01N21/84—Systems specially adapted for particular applications
- G01N21/88—Investigating the presence of flaws or contamination
- G01N21/95—Investigating the presence of flaws or contamination characterised by the material or shape of the object to be examined
-
- G—PHYSICS
- G11—INFORMATION STORAGE
- G11B—INFORMATION STORAGE BASED ON RELATIVE MOVEMENT BETWEEN RECORD CARRIER AND TRANSDUCER
- G11B20/00—Signal processing not specific to the method of recording or reproducing; Circuits therefor
- G11B20/10—Digital recording or reproducing
- G11B20/18—Error detection or correction; Testing, e.g. of drop-outs
- G11B20/1816—Testing
-
- G—PHYSICS
- G11—INFORMATION STORAGE
- G11B—INFORMATION STORAGE BASED ON RELATIVE MOVEMENT BETWEEN RECORD CARRIER AND TRANSDUCER
- G11B7/00—Recording or reproducing by optical means, e.g. recording using a thermal beam of optical radiation by modifying optical properties or the physical structure, reproducing using an optical beam at lower power by sensing optical properties; Record carriers therefor
- G11B7/08—Disposition or mounting of heads or light sources relatively to record carriers
- G11B7/09—Disposition or mounting of heads or light sources relatively to record carriers with provision for moving the light beam or focus plane for the purpose of maintaining alignment of the light beam relative to the record carrier during transducing operation, e.g. to compensate for surface irregularities of the latter or for track following
-
- G—PHYSICS
- G11—INFORMATION STORAGE
- G11B—INFORMATION STORAGE BASED ON RELATIVE MOVEMENT BETWEEN RECORD CARRIER AND TRANSDUCER
- G11B7/00—Recording or reproducing by optical means, e.g. recording using a thermal beam of optical radiation by modifying optical properties or the physical structure, reproducing using an optical beam at lower power by sensing optical properties; Record carriers therefor
- G11B7/08—Disposition or mounting of heads or light sources relatively to record carriers
- G11B7/09—Disposition or mounting of heads or light sources relatively to record carriers with provision for moving the light beam or focus plane for the purpose of maintaining alignment of the light beam relative to the record carrier during transducing operation, e.g. to compensate for surface irregularities of the latter or for track following
- G11B7/0948—Disposition or mounting of heads or light sources relatively to record carriers with provision for moving the light beam or focus plane for the purpose of maintaining alignment of the light beam relative to the record carrier during transducing operation, e.g. to compensate for surface irregularities of the latter or for track following specially adapted for detection and avoidance or compensation of imperfections on the carrier, e.g. dust, scratches, dropouts
Definitions
- the present invention generally relates to a method for playback or recording of an optical recording medium. More specifically, it relates to a method for analyzing abnormal regions on an optical recording medium, and to an apparatus for reading from and/or writing to optical recording media using such method.
- optical recording media nowadays a plurality of formats of optical recording media can be found on the market.
- These formats include, for example, CD (Compact Disk), CD-R(W) (Compact Disk Recordable/Rewritable), DVD-ROM (Digital Versatile Disk Read-Only Memory), DVD-R(W) (Digital Versatile Disk-Recordable/Rewritable), DVD+R(W) (Digital Versatile Disk+Recordable/Rewritable), or BD (Blu ray disk).
- CD Compact Disk
- CD-R(W) Compact Disk Recordable/Rewritable
- DVD-ROM Digital Versatile Disk Read-Only Memory
- DVD-R(W) Digital Versatile Disk-Recordable/Rewritable
- DVD+R(W) Digital Versatile Disk+Recordable/Rewritable
- BD Blu ray disk
- optical recording media During production of these optical recording media, abnormal areas might occur on the optical recording media. Though such abnormal optical recording media should generally not pass quality control, it cannot be excluded that these media enter the market anyway. Furthermore, blank high density optical recording media for recording often do not fulfill the necessary specifications all over the recording area. Therefore, these media might comprise regions that cannot be recorded or played back. Finally, users might make mistakes when handling the recording media, which could cause scratches or the like, or when recording data on a blank optical recording medium. For example, a user might record data in the CD format on a DVD, or use an incorrect bit rate for recording. This also leads to regions on the optical recording medium which cannot be played back by any apparatus for reading from and/or writing to optical recording media.
- An optical recording medium 1 comprises a plurality of tracks, in which data are stored in form of pits 2. Between two data regions A and C an abnormal region B is located, e.g. a mirror region. If an apparatus for reading from and/or writing to optical recording media encounters such a region on the specific optical recording medium, it is likely to stop playback or recording of the recording medium.
- This object is achieved by a method for analyzing an abnormal region on an optical recording medium, including the steps of:
- the step of determining the type of the abnormal region includes:
- the step of obtaining information on the type of abnormal region during the speed controlled jump includes evaluating a data signal and/or a track crossing signal obtained from the optical recording medium.
- the data signal HF obtained during the jump may be analyzed using a bottom-top detector.
- the HF pattern changes for some region types when crossing the abnormal region, while for other region types the HF pattern is rather similar to the normal HF pattern of the recording medium.
- the region type can be determined.
- the signal change is a reliable indication for the length of the region.
- the disappearance of the track crossing signal is an indication for the type of abnormal region.
- Measuring the length of the abnormal region is favorably performed by either measuring the time needed for jumping over the abnormal region, or by counting a number of pulses emitted by a phase locked loop during jumping over the abnormal region, the phase locked loop replicating a track crossing signal obtained before reaching the abnormal region in the jumping step. Since the jump over the abnormal region is speed controlled, a measurement of the time needed for the jump allows to calculate the length of the region. Alternatively, the number of track crossings are counted. However, while crossing the abnormal region no track crossing signal is available. Therefore, the track crossing signal is substituted by the output pulses of a PLL representing virtual track crossings. Since these pulses are counted over the whole region, the region length can be calculated.
- the method further includes the steps of:
- the step of measuring the length of the abnormal region includes counting the number of wrong syncs in the abnormal region. A counter is initiated as soon as the first wrong sync signal is detected. The counter is stopped as soon as the wrong sync signal is missing. The number of wrong syncs allows to calculate the length of the wrong structure region.
- the position, the length and/or the type of the abnormal region are stored on the optical recording medium. This has the advantage that if the optical recording medium is inserted in the apparatus for reading from and/or writing to optical recording media, these regions do not need to be analyzed again. Of course, it is well possible to check whether the stored information is correct by analyzing the regions again.
- an apparatus for reading from and/or writing to optical recording media performs a method according to the invention or includes a device performing a method according to the invention for analyzing an abnormal region on an optical recording medium.
- the region type is identified by either analyzing a data signal HF generated by a 4-quadrant photo detection unit or with the help of a sync signal. Different techniques are used for calculating the lengths of the regions. Depending on the region type the measurement is either performed using a phase lock loop (PLL), investigating the sync signals, or measuring time units. Of course, other methods can also be used.
- PLL phase lock loop
- the obtained information is either used for further information processing within a recording medium drive of the apparatus or is handed directly to a host within the apparatus.
- Fig. 2 the behavior of the data signal HF obtained from an optical recording medium is shown for the different types 1 to 5 of abnormal regions. It can be seen that the HF pattern for region types 1 to 3 changes when crossing the abnormal region. Thus, by investigating the HF signal using a bottom-top detector the region type can be determined. Furthermore, the signal change is a reliable indication for the length of the region. For the abnormal regions of types 4 and 5, however, the HF pattern is rather similar to the normal HF pattern of the recording medium. Therefore, different techniques are used in order to determine the type as well as the size of the regions.
- Fig. 3 a method for determining the types and lengths of abnormal regions on an optical recording medium is shown.
- the optical recording medium is analyzed 20. This can be done, for example, by reading the table of content (TOC).
- TOC table of content
- the locations of abnormal regions are determined, e.g. by rapidly scanning the optical recording medium with a pickup unit, or by other suitable means. It is likewise possible to store the locations of known abnormal regions on the optical recording medium.
- the step of analyzing 20 the optical recording medium includes reading the stored locations of abnormal regions.
- a speed controlled jump 22 is made over the first abnormal region essentially perpendicular to the tracks by the pickup unit for determining the type and length of this region. It is first assumed that the abnormal region is either a defect region, a mirror region, or a groove region, since the evaluation of these types of region does only take a short time compared with the evaluation of wrong structure or wrong bitrate regions. In case the abnormal region belongs to one of the three types, a corresponding detector signal is emitted. For this purpose the data signal HF is analyzed using a bottom-top detector, for example. After determination 23 of the region type the length is calculated 24. A detailed description of this calculation will be given below with reference to Figs. 4 and 5. The obtained type and length of the region are sent 25 to a host of the apparatus and the method continues 26 with the next region.
- the pickup unit jumps back 30 to the start address of the region and reads the complete region.
- the information gained from a sync signal located in the data packets is then interpreted and allows to determine 31 the type of region.
- the sync signal also allows to calculate 32 the length of the region. A detailed description of this calculation will be given below with reference to Fig. 6. Also in this case the obtained type and length of the region are sent 33 to a host of the apparatus and the method continues 34 with the next region.
- the region length can be determined either in meters or with the unit "number of track crossing equivalents", as it is favorably used for further information processing.
- T2 time period of region crossing [s]
- T1 time period of single track crossing [s]
- the time T2 needed for the region crossing has to be determined in order to solve the equation.
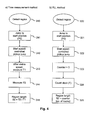
- a first method for this purpose the time measurement method, is depicted in Fig. 4a). After detection 240 of the abnormal region the pickup jumps 241 to a start position P0 just before the abnormal region. Then a speed-controlled jump is initiated 242. The distance between P0 and the beginning of the region is chosen sufficiently long to allow to stabilize a speed-controlled pickup jump to a constant velocity v. The jump, therefore, covers a stabilization time, a series of track crossings as well as the whole abnormal region. Three detectors for mirror, groove and defect are implemented in order to determine the region type. Two factors need to be measured in order to solve the above equation (2), namely the time period T1 of a single track crossing and the time period T2 of the region crossing.
- T1 and T2 are shown in Fig. 5.
- Signal A is the data signal HF
- signal B is a track crossing signal TC
- signal C is the digitized track crossing signal
- signal D is a detector output signal
- signal E is the output of a track crossing PLL
- signal F is an input signal for a counter.
- T1 and T2 are obtained using the digitized track crossing signal C and the detector output signal D.
- the time period T1 of single track crossing is determined 243 using a counter.
- the detector signal D is emitted indicating either a groove, a mirror or a defect region.
- the detector signal D initiates a further counter, which continues counting until the detector output signal D goes low at the end P2 of the abnormal region, and which measures 244 the time T2.
- the length of the abnormal region in track crossing number equivalents is obtained 245 from equation (2).
- phase locked loop (PLL) method is depicted in Fig. 4b). Similar to the time measurement method, also the PLL method uses a speed controlled pickup jump for measuring the time period T1 of a single track crossing. After detection 320 of the abnormal region the pickup jumps 321 to a start position P0 just before the abnormal region. Then a speed-controlled jump is initiated 322. However, instead of also measuring the time period T2 while crossing the abnormal region, a PLL is locked onto the track crossing signal B or the digitized track crossing signal C before reaching the beginning of the abnormal region. The PLL delivers a track crossing signal E. Again three detectors are implemented for indicating the region type. Either the groove detector, the mirror detector or the defect detector signals the beginning of the abnormal region.
- the track crossing signal is substituted by the continuous PLL output pulses E representing imaginary track crossings.
- the PLL output pulses E are used as an input signal F for a counter, which after a reset to zero 323 sums up 324 the number of PLL periods during crossing the region. After crossing the abnormal region, the PLL is locked again to the track crossing signal B.
- the number of PLL periods counted during crossing the abnormal region is equivalent to the number of virtual track crossings, which allows to calculate 325 the region length.
- Fig. 6 a hardware implementation and the signal components necessary for realizing the above track crossing PLL are schematically depicted.
- the related waveforms are shown in Fig. 5.
- the analog track crossing signal B is transformed into a digital waveform C by a slicer 3 and input into a first input (input 1) of a phase comparator 4.
- a switch 5, a loop filter 6 and a voltage controlled oscillator (VCO) 7 complete the function of a phase-locked loop (PLL). Connecting the output of the VCO to a second input (input 2) of the phase comparator 4 closes the PLL loop. If the track-crossing signal B is available (P0 to P1), the switch 5 is closed and the output signal of the VCO 7 is controlled to be in phase with the input signal (cf.
- the detector signal D changes and opens the switch 5. Therefore, the output of the loop filter 6 holds the last voltage and forces the VCO 7 to maintain the momentary frequency.
- the missing pulses are substituted by the PLL.
- the substituted pulses are led to a counter 9, which starts counting at the point P1 and stops at the point P2. In the end, the content of the counter 9 represents the length of the abnormal zone.
- a micro controller 10 resets the counter 9 at P1, reads out the content at or after P2 and provides this information for further processing.
- the above described methods for determining the length of an abnormal region are not applicable to wrong structure and wrong bitrate abnormal regions. Therefore, when a wrong structure or a wrong bitrate region needs to be evaluated, the pickup does not simply cross the region simulating the tracks to pass, but also reads the data paying special attention to the sync signal used for synchronizing the data transfer.
- These sync signals are part of each data packet and are detected by a sync-detector. In order to differentiate between different syncs, a plurality of sync-detectors or a variable sync detector are favorably implemented.
- Fig. 7 The behavior of PLL and sync signals in wrong bitrate and wrong structure regions is shown in Fig. 7.
- Signal A indicates the data signal HF
- signal B is the PLL signal of a bit clock PLL, i.e. of the PLL for generating the bit clock from the HF signal
- signal C is a sync signal for the type of structure encountered in the wrong structure region
- signal D is the sync signal as reproduced assuming a correct structure.
- the sync-detector for the wrong structure detects the wrong syncs.
- a counter is initiated as soon as the first wrong sync signal is detected. The counter is stopped as soon as the wrong sync signal is missing. The number of wrong syncs allows to calculate the length of the wrong structure region.
- a wrong bitrate special region generates a similar HF pattern as the normal data structure on the recording medium. Also the sync signals are comparable. Therefore, the data frequency is investigated.
- a frequency jump of the PLL is noticed on entering and leaving the wrong bitrate region, as indicated in signal D. Since the bitrate is changed in wrong bitrate regions, also the data packet transmission rate is changed. Therefore, a different number of syncs located in the data packets is transmitted compared to the correct bitrate operation.
- the correct sync signal is observed during the complete abnormal region checking process. As soon as the correct sync signal misses, i.e. when an abnormal region is encountered, a counter is started counting the number of syncs following a missing sync. In addition, the PLL is checked for a frequency jump. Since the number of skipped syncs at the end of the abnormal region is known, the region length can be calculated.
Landscapes
- Engineering & Computer Science (AREA)
- Signal Processing (AREA)
- General Health & Medical Sciences (AREA)
- Chemical & Material Sciences (AREA)
- Analytical Chemistry (AREA)
- Biochemistry (AREA)
- Physics & Mathematics (AREA)
- General Physics & Mathematics (AREA)
- Immunology (AREA)
- Pathology (AREA)
- Life Sciences & Earth Sciences (AREA)
- Health & Medical Sciences (AREA)
- Computer Security & Cryptography (AREA)
- Optical Recording Or Reproduction (AREA)
- Signal Processing For Digital Recording And Reproducing (AREA)
Abstract
The present invention relates to a method for analyzing
abnormal regions on an optical recording medium. The method
includes the steps of:
- detecting (21) the abnormal region;
- determining (23, 31) the type of the abnormal region; and
- measuring (24, 32) the length of the abnormal region.
Description
The present invention generally relates to a method for
playback or recording of an optical recording medium. More
specifically, it relates to a method for analyzing abnormal
regions on an optical recording medium, and to an apparatus for
reading from and/or writing to optical recording media using
such method.
Nowadays a plurality of formats of optical recording media can
be found on the market. These formats include, for example, CD
(Compact Disk), CD-R(W) (Compact Disk Recordable/Rewritable),
DVD-ROM (Digital Versatile Disk Read-Only Memory), DVD-R(W)
(Digital Versatile Disk-Recordable/Rewritable), DVD+R(W)
(Digital Versatile Disk+Recordable/Rewritable), or BD (Blu ray
disk). Besides these generally available formats, a number of
proprietary formats exists, which are used for game disks or
professional applications.
During production of these optical recording media, abnormal
areas might occur on the optical recording media. Though such
abnormal optical recording media should generally not pass
quality control, it cannot be excluded that these media enter
the market anyway. Furthermore, blank high density optical
recording media for recording often do not fulfill the
necessary specifications all over the recording area.
Therefore, these media might comprise regions that cannot be
recorded or played back. Finally, users might make mistakes
when handling the recording media, which could cause scratches
or the like, or when recording data on a blank optical
recording medium. For example, a user might record data in the
CD format on a DVD, or use an incorrect bit rate for recording.
This also leads to regions on the optical recording medium
which cannot be played back by any apparatus for reading from
and/or writing to optical recording media.
In the following all regions which do not conform to the
standard of the recording medium they are located on will be
called 'abnormal regions', though they are not necessarily
abnormal in the sense that they cannot be played back at all.
An example of an abnormal region is shown in Fig. 1. An optical
recording medium 1 comprises a plurality of tracks, in which
data are stored in form of pits 2. Between two data regions A
and C an abnormal region B is located, e.g. a mirror region. If
an apparatus for reading from and/or writing to optical
recording media encounters such a region on the specific
optical recording medium, it is likely to stop playback or
recording of the recording medium.
It is an object of the invention to propose a method for
playback or recording of an optical recording medium which
overcomes the above mentioned problems.
This object is achieved by a method for analyzing an abnormal
region on an optical recording medium, including the steps of:
- detecting the abnormal region;
- determining the type of the abnormal region; and
- measuring the length of the abnormal region.
Favorably the step of determining the type of the abnormal
region includes:
- making a speed controlled jump over the abnormal region;
- obtaining information on the type of abnormal region during the speed controlled jump; and
- differentiating between a first group of types and a second group of types of abnormal region based on the obtained information.
Advantageously, the step of obtaining information on the type
of abnormal region during the speed controlled jump includes
evaluating a data signal and/or a track crossing signal
obtained from the optical recording medium.
For example, the data signal HF obtained during the jump may be analyzed using a bottom-top detector. The HF pattern changes for some region types when crossing the abnormal region, while for other region types the HF pattern is rather similar to the normal HF pattern of the recording medium. Thus, by investigating the HF signal using a bottom-top detector the region type can be determined. Furthermore, the signal change is a reliable indication for the length of the region. Also the disappearance of the track crossing signal is an indication for the type of abnormal region.
For example, the data signal HF obtained during the jump may be analyzed using a bottom-top detector. The HF pattern changes for some region types when crossing the abnormal region, while for other region types the HF pattern is rather similar to the normal HF pattern of the recording medium. Thus, by investigating the HF signal using a bottom-top detector the region type can be determined. Furthermore, the signal change is a reliable indication for the length of the region. Also the disappearance of the track crossing signal is an indication for the type of abnormal region.
Measuring the length of the abnormal region is favorably
performed by either measuring the time needed for jumping over
the abnormal region, or by counting a number of pulses emitted
by a phase locked loop during jumping over the abnormal region,
the phase locked loop replicating a track crossing signal
obtained before reaching the abnormal region in the jumping
step. Since the jump over the abnormal region is speed
controlled, a measurement of the time needed for the jump
allows to calculate the length of the region. Alternatively,
the number of track crossings are counted. However, while
crossing the abnormal region no track crossing signal is
available. Therefore, the track crossing signal is substituted
by the output pulses of a PLL representing virtual track
crossings. Since these pulses are counted over the whole
region, the region length can be calculated.
Advantageously, the method further includes the steps of:
- jumping back to the start of the abnormal region;
- reading data stored in the abnormal region; and
- evaluating the data for determining the type of abnormal region.
Advantageously, the step of measuring the length of the
abnormal region includes counting the number of wrong syncs in
the abnormal region. A counter is initiated as soon as the
first wrong sync signal is detected. The counter is stopped as
soon as the wrong sync signal is missing. The number of wrong
syncs allows to calculate the length of the wrong structure
region.
According to one aspect of the invention, the position, the
length and/or the type of the abnormal region are stored on the
optical recording medium. This has the advantage that if the
optical recording medium is inserted in the apparatus for
reading from and/or writing to optical recording media, these
regions do not need to be analyzed again. Of course, it is well
possible to check whether the stored information is correct by
analyzing the regions again.
Favorably, an apparatus for reading from and/or writing to
optical recording media performs a method according to the
invention or includes a device performing a method according to
the invention for analyzing an abnormal region on an optical
recording medium.
For a better understanding of the invention, an exemplary
embodiment is specified in the following description with
reference to the figures. It is understood that the invention
is not limited to this exemplary embodiment and that specified
features can also expediently be combined and/or modified
without departing from the scope of the present invention. In
the figures:
- Fig. 1
- shows an abnormal region on an optical recording medium;
- Fig. 2
- depicts the behavior of a data signal for different types of abnormal regions;
- Fig. 3
- shows a method for determining the types and lengths of abnormal regions on an optical recording medium;
- Fig. 4
- depicts different methods for measuring the length of an abnormal region;
- Fig. 5
- shows the characteristics of different signals when crossing a mirror region;
- Fig. 6
- schematically depicts a track crossing PLL; and
- Fig. 7
- shows the characteristics of different signals when crossing a wrong bitrate or wrong structure region.
There are basically five types of abnormal regions. Each
requires a unique approach in order to determine its size and
its type.
The region type is identified by either analyzing a data signal
HF generated by a 4-quadrant photo detection unit or with the
help of a sync signal. Different techniques are used for
calculating the lengths of the regions. Depending on the region
type the measurement is either performed using a phase lock
loop (PLL), investigating the sync signals, or measuring time
units. Of course, other methods can also be used. The obtained
information is either used for further information processing
within a recording medium drive of the apparatus or is handed
directly to a host within the apparatus.
In Fig. 2 the behavior of the data signal HF obtained from an
optical recording medium is shown for the different types 1 to
5 of abnormal regions. It can be seen that the HF pattern for
region types 1 to 3 changes when crossing the abnormal region.
Thus, by investigating the HF signal using a bottom-top
detector the region type can be determined. Furthermore, the
signal change is a reliable indication for the length of the
region. For the abnormal regions of types 4 and 5, however, the
HF pattern is rather similar to the normal HF pattern of the
recording medium. Therefore, different techniques are used in
order to determine the type as well as the size of the regions.
In Fig. 3 a method for determining the types and lengths of
abnormal regions on an optical recording medium is shown. In
order to gain information on the type of optical recording
medium and other relevant data after insertion of an optical
recording medium in an apparatus for reading from and/or
writing to optical recording media the optical recording medium
is analyzed 20. This can be done, for example, by reading the
table of content (TOC). In the next step the locations of
abnormal regions are determined, e.g. by rapidly scanning the
optical recording medium with a pickup unit, or by other
suitable means. It is likewise possible to store the locations
of known abnormal regions on the optical recording medium. In
this case the step of analyzing 20 the optical recording medium
includes reading the stored locations of abnormal regions.
Favorably also the known abnormal regions are checked again for
their type and their location and length.
Once the locations of the abnormal regions have been
determined, a speed controlled jump 22 is made over the first
abnormal region essentially perpendicular to the tracks by the
pickup unit for determining the type and length of this region.
It is first assumed that the abnormal region is either a defect
region, a mirror region, or a groove region, since the
evaluation of these types of region does only take a short time
compared with the evaluation of wrong structure or wrong
bitrate regions. In case the abnormal region belongs to one of
the three types, a corresponding detector signal is emitted.
For this purpose the data signal HF is analyzed using a bottom-top
detector, for example. After determination 23 of the region
type the length is calculated 24. A detailed description of
this calculation will be given below with reference to Figs. 4
and 5. The obtained type and length of the region are sent 25
to a host of the apparatus and the method continues 26 with the
next region.
In case no detector signal is obtained, i.e. the abnormal
region neither is a groove region, nor a mirror region, nor a
defect region, it is assumed that either a wrong structure or a
wrong bitrate region is present. Since neither the type nor the
length of the region can be determined with the method applied
to defect, mirror or groove regions, a different approach is
used. The pickup unit jumps back 30 to the start address of the
region and reads the complete region. The information gained
from a sync signal located in the data packets is then
interpreted and allows to determine 31 the type of region.
Furthermore, the sync signal also allows to calculate 32 the
length of the region. A detailed description of this
calculation will be given below with reference to Fig. 6. Also
in this case the obtained type and length of the region are
sent 33 to a host of the apparatus and the method continues 34
with the next region.
In case the type of region cannot be determined 31, either
because a different type of defect is encountered or because
the presumed abnormal region is not abnormal, i.e. the
information stored on the recording medium is incorrect, a
corresponding error message is passed 35 to the host for
further processing.
Different methods for determining the length of an abnormal
region in case of a defect region, a mirror region or a groove
region are depicted in Fig. 4. The methods are based on the
principle that upon a constant track crossing speed and upon a
constant track pitch the length of the abnormal region is
proportional to the track pitch:
S2 = n·S1 n∈N
with S1 = track pitch [m] = const
S2 = region length
S2 = region length
The region length can be determined either in meters or with
the unit "number of track crossing equivalents", as it is
favorably used for further information processing.
S2 = T2/T1 = T2·v/S1
with S2 = region length [track crossing number equivalent]
T2 = time period of region crossing [s]
T1 = time period of single track crossing [s]
v = velocity [m/s] = const.
T2 = time period of region crossing [s]
T1 = time period of single track crossing [s]
v = velocity [m/s] = const.
As can be seen, the time T2 needed for the region crossing has
to be determined in order to solve the equation. A first method
for this purpose, the time measurement method, is depicted in
Fig. 4a). After detection 240 of the abnormal region the pickup
jumps 241 to a start position P0 just before the abnormal
region. Then a speed-controlled jump is initiated 242. The
distance between P0 and the beginning of the region is chosen
sufficiently long to allow to stabilize a speed-controlled
pickup jump to a constant velocity v. The jump, therefore,
covers a stabilization time, a series of track crossings as
well as the whole abnormal region. Three detectors for mirror,
groove and defect are implemented in order to determine the
region type. Two factors need to be measured in order to solve
the above equation (2), namely the time period T1 of a single
track crossing and the time period T2 of the region crossing.
The signals used for determining T1 and T2 are shown in Fig. 5.
Signal A is the data signal HF, signal B is a track crossing
signal TC, signal C is the digitized track crossing signal,
signal D is a detector output signal, signal E is the output of
a track crossing PLL, and signal F is an input signal for a
counter. T1 and T2 are obtained using the digitized track
crossing signal C and the detector output signal D. Just before
the abnormal region, when a stable jump velocity is achieved,
the time period T1 of single track crossing is determined 243
using a counter. Once the abnormal region is reached at a point
P1, the track crossing signal B is no longer available.
Instead, the detector signal D is emitted indicating either a groove, a mirror or a defect region. The detector signal D initiates a further counter, which continues counting until the detector output signal D goes low at the end P2 of the abnormal region, and which measures 244 the time T2. When both time periods T1 and T2 have been determined the length of the abnormal region in track crossing number equivalents is obtained 245 from equation (2).
Instead, the detector signal D is emitted indicating either a groove, a mirror or a defect region. The detector signal D initiates a further counter, which continues counting until the detector output signal D goes low at the end P2 of the abnormal region, and which measures 244 the time T2. When both time periods T1 and T2 have been determined the length of the abnormal region in track crossing number equivalents is obtained 245 from equation (2).
An alternative method, the phase locked loop (PLL) method, is
depicted in Fig. 4b). Similar to the time measurement method,
also the PLL method uses a speed controlled pickup jump for
measuring the time period T1 of a single track crossing. After
detection 320 of the abnormal region the pickup jumps 321 to a
start position P0 just before the abnormal region. Then a
speed-controlled jump is initiated 322. However, instead of
also measuring the time period T2 while crossing the abnormal
region, a PLL is locked onto the track crossing signal B or the
digitized track crossing signal C before reaching the beginning
of the abnormal region. The PLL delivers a track crossing
signal E. Again three detectors are implemented for indicating
the region type. Either the groove detector, the mirror
detector or the defect detector signals the beginning of the
abnormal region. When crossing the abnormal region, no track
crossing signal B is available. Therefore, the track crossing
signal is substituted by the continuous PLL output pulses E
representing imaginary track crossings. The PLL output pulses E
are used as an input signal F for a counter, which after a
reset to zero 323 sums up 324 the number of PLL periods during
crossing the region. After crossing the abnormal region, the
PLL is locked again to the track crossing signal B. The number
of PLL periods counted during crossing the abnormal region is
equivalent to the number of virtual track crossings, which
allows to calculate 325 the region length.
In Fig. 6 a hardware implementation and the signal components
necessary for realizing the above track crossing PLL are
schematically depicted. The related waveforms are shown in
Fig. 5. The analog track crossing signal B is transformed into
a digital waveform C by a slicer 3 and input into a first input
(input 1) of a phase comparator 4. A switch 5, a loop filter 6
and a voltage controlled oscillator (VCO) 7 complete the
function of a phase-locked loop (PLL). Connecting the output of
the VCO to a second input (input 2) of the phase comparator 4
closes the PLL loop. If the track-crossing signal B is
available (P0 to P1), the switch 5 is closed and the output
signal of the VCO 7 is controlled to be in phase with the input
signal (cf. signals B and C). When a black dot or a mirror zone
is detected, the detector signal D changes and opens the switch
5. Therefore, the output of the loop filter 6 holds the last
voltage and forces the VCO 7 to maintain the momentary
frequency. Over the whole duration of the zone (P1 to P2), the
missing pulses are substituted by the PLL. Using an AND gate 8,
the substituted pulses are led to a counter 9, which starts
counting at the point P1 and stops at the point P2. In the end,
the content of the counter 9 represents the length of the
abnormal zone. A micro controller 10 resets the counter 9 at
P1, reads out the content at or after P2 and provides this
information for further processing.
As indicated before, the above described methods for
determining the length of an abnormal region are not applicable
to wrong structure and wrong bitrate abnormal regions.
Therefore, when a wrong structure or a wrong bitrate region
needs to be evaluated, the pickup does not simply cross the
region simulating the tracks to pass, but also reads the data
paying special attention to the sync signal used for
synchronizing the data transfer. These sync signals are part of
each data packet and are detected by a sync-detector. In order
to differentiate between different syncs, a plurality of sync-detectors
or a variable sync detector are favorably
implemented.
The behavior of PLL and sync signals in wrong bitrate and wrong
structure regions is shown in Fig. 7. The figure allows to
explain the signal evaluation process for both types of
abnormal region. Signal A indicates the data signal HF, signal
B is the PLL signal of a bit clock PLL, i.e. of the PLL for
generating the bit clock from the HF signal, signal C is a sync
signal for the type of structure encountered in the wrong
structure region, and signal D is the sync signal as reproduced
assuming a correct structure. In case of a wrong structure
region, the sync-detector for the wrong structure detects the
wrong syncs. A counter is initiated as soon as the first wrong
sync signal is detected. The counter is stopped as soon as the
wrong sync signal is missing. The number of wrong syncs allows
to calculate the length of the wrong structure region.
A wrong bitrate special region generates a similar HF pattern
as the normal data structure on the recording medium. Also the
sync signals are comparable. Therefore, the data frequency is
investigated. By evaluating the PLL applied for the region
length calculation for defect, mirror and groove regions, a
frequency jump of the PLL is noticed on entering and leaving
the wrong bitrate region, as indicated in signal D. Since the
bitrate is changed in wrong bitrate regions, also the data
packet transmission rate is changed. Therefore, a different
number of syncs located in the data packets is transmitted
compared to the correct bitrate operation. The correct sync
signal is observed during the complete abnormal region checking
process. As soon as the correct sync signal misses, i.e. when
an abnormal region is encountered, a counter is started
counting the number of syncs following a missing sync. In
addition, the PLL is checked for a frequency jump. Since the
number of skipped syncs at the end of the abnormal region is
known, the region length can be calculated.
Claims (11)
- Method for analyzing an abnormal region on an optical recording medium, including the steps of:detecting (21) the abnormal region;determining (23, 31) the type of the abnormal region; andmeasuring (24, 32) the length of the abnormal region.
- Method according to claim 1, wherein the step of determining (23, 31) the type of the abnormal region includes:making a speed controlled jump (22) over the abnormal region;obtaining information on the type of abnormal region during the speed controlled jump (22); anddifferentiating (23) between a first group of types and a second group of types of abnormal region based on the obtained information.
- Method according to claim 2, wherein the step of obtaining information on the type of abnormal region during the speed controlled jump (22) includes evaluating a data signal (HF) and/or a track crossing signal (TC) obtained from the optical recording medium.
- Method according to one of claims 1 to 3, wherein the step of measuring (24, 32) the length of the abnormal region includes one of:measuring (244) the time needed for jumping (22) over the abnormal region; andcounting (324) a number of pulses emitted by a phase locked loop during jumping (22) over the abnormal region, the phase locked loop replicating a track crossing signal obtained before reaching the abnormal region in the jumping step (22).
- Method one of claims 1 to 3, further including the steps of:jumping back (30) to the start of the abnormal region;reading (30) data stored in the abnormal region; andevaluating (31) the data for determining the type of abnormal region.
- Method according to claim 5, wherein the step of evaluating (31) the data for determining the type of abnormal region includes at least one of:evaluating a sync signal included in the data; andevaluating the data frequency in the abnormal region.
- Method according to claim 5 or 6, wherein the step of measuring (24, 32) the length of the abnormal region includes counting the number of wrong syncs in the abnormal region.
- Method according to one of claims 1 to 7, further including the step of storing the position, the length and/or the type of the abnormal region on the optical recording medium.
- Method according to anyone of claims 1 to 8, wherein the types of abnormal region include at least one of a groove region, a mirror region, a defect region, a wrong bitrate region and a wrong structure region.
- Device for analyzing an abnormal region on an optical recording medium, characterized in that it performs a method according to one of claim 1 to 10.
- Apparatus for reading from and/or writing to optical recording media, characterized in that it performs a method according to one of claims 1 to 9 or includes a device according to claim 10 for analyzing an abnormal region on an optical recording medium.
Priority Applications (9)
| Application Number | Priority Date | Filing Date | Title |
|---|---|---|---|
| EP04000107A EP1553589A1 (en) | 2004-01-07 | 2004-01-07 | Method for playback or recording of an optical recording medium |
| EP04300725A EP1553590A1 (en) | 2004-01-07 | 2004-10-25 | Method for playback or recording of an optical recording medium |
| JP2006548131A JP4341677B2 (en) | 2004-01-07 | 2004-11-26 | Method for reproducing or recording optical recording medium |
| US10/584,686 US7821893B2 (en) | 2004-01-07 | 2004-11-26 | Method for analyzing an abnormal region on an optical recording medium |
| KR1020067013545A KR101103008B1 (en) | 2004-01-07 | 2004-11-26 | Method for reproducing or recording an optical recording medium |
| PCT/EP2004/013506 WO2005069298A1 (en) | 2004-01-07 | 2004-11-26 | Method for playback or recording of an optical recording medium |
| CN2004800394652A CN1902701B (en) | 2004-01-07 | 2004-11-26 | Method for playback or recording of an optical recording medium |
| MYPI20050049A MY143923A (en) | 2004-01-07 | 2005-01-06 | Method for playback or recording of an optical recording medium. |
| TW094100309A TWI362033B (en) | 2004-01-07 | 2005-01-06 | Method for playback or recording of an optical recording medium |
Applications Claiming Priority (1)
| Application Number | Priority Date | Filing Date | Title |
|---|---|---|---|
| EP04000107A EP1553589A1 (en) | 2004-01-07 | 2004-01-07 | Method for playback or recording of an optical recording medium |
Publications (1)
| Publication Number | Publication Date |
|---|---|
| EP1553589A1 true EP1553589A1 (en) | 2005-07-13 |
Family
ID=34585940
Family Applications (1)
| Application Number | Title | Priority Date | Filing Date |
|---|---|---|---|
| EP04000107A Withdrawn EP1553589A1 (en) | 2004-01-07 | 2004-01-07 | Method for playback or recording of an optical recording medium |
Country Status (8)
| Country | Link |
|---|---|
| US (1) | US7821893B2 (en) |
| EP (1) | EP1553589A1 (en) |
| JP (1) | JP4341677B2 (en) |
| KR (1) | KR101103008B1 (en) |
| CN (1) | CN1902701B (en) |
| MY (1) | MY143923A (en) |
| TW (1) | TWI362033B (en) |
| WO (1) | WO2005069298A1 (en) |
Families Citing this family (5)
| Publication number | Priority date | Publication date | Assignee | Title |
|---|---|---|---|---|
| TWI261827B (en) * | 2005-05-30 | 2006-09-11 | Benq Corp | Optical disc label printing using optical pickup unit with multiple foci |
| WO2008069246A1 (en) * | 2006-12-07 | 2008-06-12 | Nec Corporation | Optical disc device and optical disc type identifying method |
| US8687313B2 (en) | 2011-06-23 | 2014-04-01 | Western Digital Technologies, Inc. | Disk drive mapping out data tracks to avoid thermal asperities |
| US8694841B1 (en) | 2012-06-20 | 2014-04-08 | Western Digital Technologies, Inc. | Methods and devices for preventing potential media errors from growing thermal asperities |
| US8611031B1 (en) * | 2012-08-16 | 2013-12-17 | Western Digital Technologies, Inc. | Methods and devices for adaptive margining |
Citations (5)
| Publication number | Priority date | Publication date | Assignee | Title |
|---|---|---|---|---|
| EP0397126A2 (en) * | 1989-05-11 | 1990-11-14 | Mitsubishi Denki Kabushiki Kaisha | Defect inspecting apparatus for disc-shaped information recording media |
| US5485444A (en) * | 1991-06-07 | 1996-01-16 | Deustsche Thomson-Brandt Gmbh | Signalization of types of defects of an optical information carrier |
| US6263469B1 (en) * | 1998-10-22 | 2001-07-17 | Oak Technology, Inc. | Methods and systems for accessing data from a DVD using a sync detector including a 26 state finite state machine |
| US6336202B1 (en) * | 1997-09-08 | 2002-01-01 | International Business Machines Corporation | Data storage system, storage medium and method of controlling a data storage system |
| US20030141997A1 (en) * | 2002-01-29 | 2003-07-31 | Akira Kawabe | Information playback apparatus with an unusual waveform circuit |
Family Cites Families (6)
| Publication number | Priority date | Publication date | Assignee | Title |
|---|---|---|---|---|
| JPS5448213A (en) * | 1977-09-26 | 1979-04-16 | Hitachi Ltd | Track format system |
| JP2563458B2 (en) | 1988-03-31 | 1996-12-11 | 松下電器産業株式会社 | Defect inspection device for disk-shaped optical recording medium |
| US5199017A (en) * | 1991-09-11 | 1993-03-30 | International Business Machines Corporation | Optical disk drive and method for counting the number of tracks on an optical disk |
| EA003236B1 (en) * | 1999-07-15 | 2003-02-27 | Конинклейке Филипс Электроникс Н.В. | Method of scanning a recorded disc for defects and recording device for recording information on a disc-shaped recording medium |
| JP3865634B2 (en) * | 2000-03-28 | 2007-01-10 | 松下電器産業株式会社 | Data reproducing apparatus, program, and recording medium |
| KR100604892B1 (en) * | 2004-08-10 | 2006-07-28 | 삼성전자주식회사 | Optical disc reproducing / recording system having a defect detection circuit for defect management of rewritable optical discs and method thereof |
-
2004
- 2004-01-07 EP EP04000107A patent/EP1553589A1/en not_active Withdrawn
- 2004-11-26 CN CN2004800394652A patent/CN1902701B/en not_active Expired - Fee Related
- 2004-11-26 WO PCT/EP2004/013506 patent/WO2005069298A1/en not_active Ceased
- 2004-11-26 KR KR1020067013545A patent/KR101103008B1/en not_active Expired - Fee Related
- 2004-11-26 JP JP2006548131A patent/JP4341677B2/en not_active Expired - Fee Related
- 2004-11-26 US US10/584,686 patent/US7821893B2/en not_active Expired - Fee Related
-
2005
- 2005-01-06 MY MYPI20050049A patent/MY143923A/en unknown
- 2005-01-06 TW TW094100309A patent/TWI362033B/en active
Patent Citations (5)
| Publication number | Priority date | Publication date | Assignee | Title |
|---|---|---|---|---|
| EP0397126A2 (en) * | 1989-05-11 | 1990-11-14 | Mitsubishi Denki Kabushiki Kaisha | Defect inspecting apparatus for disc-shaped information recording media |
| US5485444A (en) * | 1991-06-07 | 1996-01-16 | Deustsche Thomson-Brandt Gmbh | Signalization of types of defects of an optical information carrier |
| US6336202B1 (en) * | 1997-09-08 | 2002-01-01 | International Business Machines Corporation | Data storage system, storage medium and method of controlling a data storage system |
| US6263469B1 (en) * | 1998-10-22 | 2001-07-17 | Oak Technology, Inc. | Methods and systems for accessing data from a DVD using a sync detector including a 26 state finite state machine |
| US20030141997A1 (en) * | 2002-01-29 | 2003-07-31 | Akira Kawabe | Information playback apparatus with an unusual waveform circuit |
Also Published As
| Publication number | Publication date |
|---|---|
| JP4341677B2 (en) | 2009-10-07 |
| KR101103008B1 (en) | 2012-01-05 |
| US7821893B2 (en) | 2010-10-26 |
| TWI362033B (en) | 2012-04-11 |
| CN1902701A (en) | 2007-01-24 |
| TW200525512A (en) | 2005-08-01 |
| MY143923A (en) | 2011-07-29 |
| KR20070005555A (en) | 2007-01-10 |
| US20070153656A1 (en) | 2007-07-05 |
| CN1902701B (en) | 2012-06-27 |
| WO2005069298A1 (en) | 2005-07-28 |
| JP2007518207A (en) | 2007-07-05 |
Similar Documents
| Publication | Publication Date | Title |
|---|---|---|
| US7821893B2 (en) | Method for analyzing an abnormal region on an optical recording medium | |
| KR100363166B1 (en) | Circuit and method of preventing misrecording | |
| EP1553590A1 (en) | Method for playback or recording of an optical recording medium | |
| EP1225571B1 (en) | Pre-pit detecting apparatus | |
| JP4083993B2 (en) | AR measuring apparatus for optical recording medium having pre-pits | |
| KR100570926B1 (en) | Recorded information evaluation method and device and information recording medium therefor | |
| JP3432663B2 (en) | Rotation control method and device | |
| US7016285B2 (en) | Linking gap detecting device and method of optical recording medium | |
| KR100661386B1 (en) | Optical disc device | |
| CN100407326C (en) | Sync Signal Protection Circuit | |
| JP3929271B2 (en) | Pre-pit waveform measuring device for optical recording medium having pre-pits | |
| JP4203244B2 (en) | Apparatus and method for measuring prepit waveform of optical recording medium | |
| JPH0312040A (en) | Phase margin measurement method | |
| JPH0312041A (en) | Method for measuring phase margin | |
| TWI228708B (en) | Apparatus and method for calculating performance data of an optical recording medium | |
| KR100626434B1 (en) | Land Prefit Detector | |
| JP2007310975A (en) | Address information detection circuit | |
| JPH04105276A (en) | Phase margin measuring method | |
| KR20070002716A (en) | Optical information storage medium test method, test apparatus thereof, jitter measuring method and jitter measuring device | |
| JP2006127699A (en) | Optical disk recording/reproducing device | |
| JP2006134515A (en) | Optical disk AR value measuring apparatus, AR value measuring method, and optical disk | |
| JPH06267179A (en) | Disc player | |
| JPH02308478A (en) | Bit error rate measurement method | |
| JPH05325267A (en) | Method and device for checking optical disk | |
| JP2006318617A (en) | Reference clock generation circuit and recording medium recording apparatus |
Legal Events
| Date | Code | Title | Description |
|---|---|---|---|
| PUAI | Public reference made under article 153(3) epc to a published international application that has entered the european phase |
Free format text: ORIGINAL CODE: 0009012 |
|
| AK | Designated contracting states |
Kind code of ref document: A1 Designated state(s): AT BE BG CH CY CZ DE DK EE ES FI FR GB GR HU IE IT LI LU MC NL PT RO SE SI SK TR |
|
| AX | Request for extension of the european patent |
Extension state: AL LT LV MK |
|
| AKX | Designation fees paid | ||
| STAA | Information on the status of an ep patent application or granted ep patent |
Free format text: STATUS: THE APPLICATION IS DEEMED TO BE WITHDRAWN |
|
| 18D | Application deemed to be withdrawn |
Effective date: 20060114 |
|
| REG | Reference to a national code |
Ref country code: DE Ref legal event code: 8566 |