EP1533611B1 - Apparatus and method for measuring micro mass using oscillation circuit - Google Patents
Apparatus and method for measuring micro mass using oscillation circuit Download PDFInfo
- Publication number
- EP1533611B1 EP1533611B1 EP04026084.6A EP04026084A EP1533611B1 EP 1533611 B1 EP1533611 B1 EP 1533611B1 EP 04026084 A EP04026084 A EP 04026084A EP 1533611 B1 EP1533611 B1 EP 1533611B1
- Authority
- EP
- European Patent Office
- Prior art keywords
- cantilever
- resonance frequency
- mass
- subject
- micro
- Prior art date
- Legal status (The legal status is an assumption and is not a legal conclusion. Google has not performed a legal analysis and makes no representation as to the accuracy of the status listed.)
- Expired - Lifetime
Links
Images



Classifications
-
- G—PHYSICS
- G01—MEASURING; TESTING
- G01N—INVESTIGATING OR ANALYSING MATERIALS BY DETERMINING THEIR CHEMICAL OR PHYSICAL PROPERTIES
- G01N29/00—Investigating or analysing materials by the use of ultrasonic, sonic or infrasonic waves; Visualisation of the interior of objects by transmitting ultrasonic or sonic waves through the object
- G01N29/02—Analysing fluids
- G01N29/036—Analysing fluids by measuring frequency or resonance of acoustic waves
-
- G—PHYSICS
- G01—MEASURING; TESTING
- G01G—WEIGHING
- G01G3/00—Weighing apparatus characterised by the use of elastically-deformable members, e.g. spring balances
- G01G3/12—Weighing apparatus characterised by the use of elastically-deformable members, e.g. spring balances wherein the weighing element is in the form of a solid body stressed by pressure or tension during weighing
- G01G3/16—Weighing apparatus characterised by the use of elastically-deformable members, e.g. spring balances wherein the weighing element is in the form of a solid body stressed by pressure or tension during weighing measuring variations of frequency of oscillations of the body
-
- G—PHYSICS
- G01—MEASURING; TESTING
- G01N—INVESTIGATING OR ANALYSING MATERIALS BY DETERMINING THEIR CHEMICAL OR PHYSICAL PROPERTIES
- G01N2291/00—Indexing codes associated with group G01N29/00
- G01N2291/02—Indexing codes associated with the analysed material
- G01N2291/025—Change of phase or condition
- G01N2291/0256—Adsorption, desorption, surface mass change, e.g. on biosensors
-
- G—PHYSICS
- G01—MEASURING; TESTING
- G01N—INVESTIGATING OR ANALYSING MATERIALS BY DETERMINING THEIR CHEMICAL OR PHYSICAL PROPERTIES
- G01N2291/00—Indexing codes associated with group G01N29/00
- G01N2291/04—Wave modes and trajectories
- G01N2291/042—Wave modes
- G01N2291/0427—Flexural waves, plate waves, e.g. Lamb waves, tuning fork, cantilever
Definitions
- the present invention relates to an apparatus and method for measuring micro mass using an oscillation circuit, and more particularly, to an apparatus and method for measuring mass of biomolecule such as DNA and protein by oscillating a cantilever using an oscillation circuit.
- variation of a resonance frequency of a micro matter according to a variation of mass is first measured, and the varied mass is measured based on the varied resonance frequency.
- a typical method for measuring micro matter using such a mass micro-balancing technology is a quartz crystal mass micro-balancing (QCM).
- QCM quartz crystal mass micro-balancing
- the QCM is generally used to measure mass per unit area of a subject (to-be-measured).
- the QCM determines increased mass according to variation of a shear mode of quartz oscillator.
- the QCM has advantages that it is designed to make it easy to input/output a signal and excel in sensitiveness. However, the mass must be evenly distributed on a surface of the quartz oscillator and a shear mode having a high resonance frequency must be used.
- U.S. Patent No. 5,719,324 discloses a sensor for measuring micro mass using light.
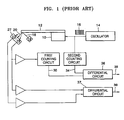
- the sensor disclosed in the Patent comprises a cantilever 12, a piezoelectric element 10 supporting the cantilever 12, and a laser diode 19 formed on a tip portion of the cantilever 12 to eradiate laser beams 20.
- the piezoelectric element 10 is excited by a pulse wave from an oscillator 14, thereby exciting the piezoelectric element 10.
- the cantilever 12 When the subject is disposed on the cantilever 12, the cantilever 12 is deformed by the mass of the examining subject. As this point, the laser beams 20 eradiated from the cantilever 12 are detected by a photodetector 27 having first and second cells 23 and 29. The deformation of the cantilever 12 is measured based on an amount of light detected by the photodetector 27, thereby determining varied mass.
- the reference numerals 30 and 34 indicate counting circuits, the reference numerals 36 and 37 represent differential circuits, and the reference numerals 38 and 39 indicate signals outputted from the differential circuits 36 and 37.
- the method using the light requires an accurate position control of the laser diode and the photodetector. Therefore, a separated position controller controlling the position of the laser diode and the photodetector is required. In addition, since a member for oscillating the cantilever and a member for measuring mass are formed independent from each other, a volume of the apparatus is increased, complicating the structure.
- a piezo resistance material is doped in the cantilever to increase the mass of the cantilever, causing the cantilever to be deformed by the increased mass.
- the deformation of the cantilever causes the resistance to be varied.
- the mass is measured by measuring output voltage varied by the resistance variation.
- the cantilever since the cantilever is not actively oscillated, the variation of the cantilever is too small to precisely measure micro mass. Furthermore, a variety of periphery devices such as a device for measuring varied resistance, a device for comparing an input signal for oscillating with an output signal of a resonance frequency varied by the increased mass, and the like are required, increasing the manufacturing costs and volume of the apparatus.
- the present invention provides an apparatus and method that can precisely measure micro mass of a subject without using any additional periphery devices by actively self-vibrating a cantilever using an oscillation circuit.
- micro mass measuring apparatus according to claim 1.
- the oscillation circuit comprises an amplifier for amplifying an output signal from the cantilever; and a feedback for inputting the amplified signal to the cantilever.
- the cantilever may be formed in a triangular-shape.
- a ratio between a length, width and thickness of the cantilever may be in a range of 20:6:1-20:18:1.
- An area of the cantilever, on which the subject is attached may be 1/15-1/10 of an entire area of the cantilever.
- a thickness of the piezoelectric element may be about 40-60% of a thickness of the cantilever.
- a length of the piezoelectric element may be about 50-60% of a length of the cantilever.
- FIG. 2 shows a schematic diagram of a micro mass measuring apparatus according to an embodiment of the present invention.
- a micro mass measuring apparatus of the present invention comprises a micro cantilever 50 for measuring mass of a subject p and an oscillation circuit 60 for oscillating the micro cantilever 50 actively and for measuring a varied resonance frequency of the micro cantilever 50.
- the subject can be biomolecle such as DNA and protein.
- a piezoelectric element 53 is formed on the cantilever 50.
- the oscillation circuit 60 is coupled to the piezoelectric element 53.
- the piezoelectric element 53 may be formed by depositing PZT on the cantilever 50.
- the oscillation circuit 60 comprises an amplifier 57 and a feedback 58.
- the amplifier 57 amplifies a first resonance frequency outputted from the piezoelectric element 53 of the micro cantilever 50 and the feedback 58 allows the piezoelectric element 53 to vibrate the cantilever 50 with the first resonance frequency.
- a frequency measuring device 65 is coupled to the oscillation circuit 60 to measure a variation of the resonance frequency.
- the frequency measuring device 65 may be formed of a simple electric circuit using, for example, a pulse counter.
- a micro variation of the resonance frequency which is caused by the increase of mass when the subject p is disposed on the cantilever 50, can be easily measured.
- the cantilever 50 can continuously vibrate with the first resonance frequency.
- the resonance frequency varied by the subject p is measured by the frequency measuring device 65. Therefore, it is possible to vibrate itself and measure mass of the cantilever 50 using the single piezoelectric element 53.
- the measuring apparatus of the present invention further comprises a data transferring device (not shown) for transferring the variation amount of the frequency to a computer.
- the bio subject p is attached on an end of the micro cantilever 50 employing the oscillation circuit 60 and the micro mass of the bio subject p is measured using the mass micro-balancing technology.
- the micro cantilever 50 deposited with the piezoelectric element 53 may be manufactured through a micro electro mechanical system (MEMS) process.
- MEMS micro electro mechanical system
- the attachment of the bio subject p may be realized through a biochemical reaction.
- the oscillation circuit 60 is comprised of the amplifier 57 for amplifying a signal from the cantilever 50 and the feedback 58 for inputting the amplified signal to the cantilever 50.
- an electric power source 59 for supplying voltage to the oscillation circuit 60.
- the electric power source may be one of pulse and step-type power sources.
- a small battery may be used as the power source 59.
- micro cantilever 50 is a simple mechanical structure which clearly show displacement and formed in a micro-size through the MEMS process, it can be applied to a lab-on-a-chip (LOC) that can measure micro mass of a bio subject such as the DNA and protein.
- LOC lab-on-a-chip
- the micro cantilever 50 is preferably designed having a shape and size that can provide sensitiveness that is good for measuring the micro mass. For example, when mass density of the DNA or protein is 10-15 , g/ ⁇ m2, it is preferable that the cantilever 50 is designed having a shape and size providing a sensitiveness of about 1 Hz/10-15g and resolution of about 10-15g/Hz.
- the cantilever is designed having a simple shape and a size that can provide sensitiveness required for the measurement of the micro mass.
- the MEMS process can be simplified.
- the micro cantilever 50 is designed having a shape and size that can satisfy a separation factor proper to measure the micro mass.
- the cantilever 50 can be designed satisfying both the sensitiveness and the separation factor.
- the cantilever 50 may be designed having a triangular-shape or a rectangular-shape. The sensitiveness and separation factor of the triangular cantilever will be compared with those of the rectangular cantilever.
- ⁇ m/ ⁇ f(g/Hz) represents resolution.
- the sensitiveness is an inverse number of the resolution. That is, the lower the resolution, the higher the sensitiveness. That is, when the resonance frequency per unit mass is greatly varied, it means that the sensitiveness is high.
- the resolution of the micro cantilever is proportional to its m/f, and the sensitiveness thereof is proportional to the f/m. Accordingly, a cantilever that is designed having small mass and a high resonance frequency is more proper for the micro mass measuring apparatus.
- the sensitiveness of the cantilever formed in the triangular-shape will be compared with that of the cantilever formed in the rectangular-shape with regards to a length L, a width b and a thickness t of the cantilever 50.
- the triangular cantilever and the rectangular cantilever are formed in an identical material and have same a length, same a width and same a thickenss.
- the stiffness Kr of the rectangular cantilever and the stiffness Kt of the triangular cantilever can be respectively represented by following Formulas 10 and 11.
- E, I, ⁇ are respectively the modulus coefficient, second moment of inertia of area, density of the cantilever.
- k t E 6 ⁇ b ⁇ t 3 L 3
- Formula 14 can be obtained as follows: ⁇ ⁇ f ⁇ ⁇ m r ⁇ 21 1 2 ⁇ ⁇ ⁇ E 1 / 2 p 3 / 2 ⁇ 1 b ⁇ L 3
- Formula 15 can be obtained as follows: ⁇ ⁇ f ⁇ ⁇ m t ⁇ 30 1 2 ⁇ ⁇ ⁇ E 1 / 2 p 3 / 2 ⁇ 1 b ⁇ L 3
- the sensitiveness ( ⁇ f/ ⁇ m)t of the triangular cantilever is relatively higher than that ( ⁇ f/ ⁇ m)r of the rectangular cantilever. This notes that it is preferable that the cantilever is formed in the triangular-shape. However, as far as the sensitiveness and the separation factor are satisfied, the rectangular cantilever can be also used.
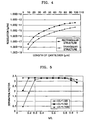
- FIG. 4 shows a graph illustrating the resolutions of the triangular cantilever and the rectangular cantilever.
- the resolution is an inverse number of the sensitiveness. That is, the lower the resolution, the higher the sensitiveness.
- a separation factor is first defined and a ratio between a length, width and thickness of the cantilever is determined.
- the separation factor is defined by a value obtained by dividing a difference between the first and second resonance frequencies of the cantilever by the first resonance frequency.
- the separation factor represents an adjacent degree of the first and second resonance frequencies.
- a first resonance frequency mode is used for the cantilever used as a detecting sensor for detecting vibration of a series of structures where the infinity number of vibration modes are compositely generated.
- the second resonance frequency is too near the first resonance frequency, it may be confused to measure the first resonance frequency. Accordingly, to accurately measure the first resonance frequency, an interval between the first and second resonance frequency must be above a predetermined level.
- the separation factor is defined to provide the predetermined level.
- the separation factor is defined by a value obtained by dividing the difference between the first and second resonance frequencies ft1 and ft2 of the triangular cantilever by the first resonance frequency ft1, it can be represented by Formula 16 as follows: f t ⁇ 2 - f t ⁇ 1 f t ⁇ 1
- the shape of the triangular cantilever is concretely determined by a shape ratio between a length, a width and a thickness.
- the shape ratio is determined to obtain a predetermined satisfactory value of the separation factor and a predetermined satisfactory value of the sensitiveness.
- the separation factor of the triangular cantilever will be described hereinafter.
- FIG. 5 shows a graph illustrating a separation factor of a triangular cantilever.
- the horizontal axis indicates a value (b/L) obtained by dividing a width b by a length L
- the vertical axis indicates a separation factor according to the variation of the value (b/L).
- results obtained when a ratio t/L of the length L to the thickness t is 1/20, 1/50 and 1/100 are illustrated.
- a resonance frequency ft 1 2 ⁇ ⁇ ⁇ E 3 ⁇ p t L 2
- the micro cantilever Since the micro cantilever is operated in liquid to detect the bio subject, a mass added effect must be considered. That is, when the cantilever vibrates in the liquid, an effect is obtained as if the mass of the cantilever is increased due to the mass of the liquid. When the mass of the cantilever is increased, the resonance frequency of the cantilever is reduced. According to Formula15, the sensitiveness of the cantilever is reduced as the resonance frequency is reduced.
- the separation factor has a predetermined value (a maximum value) regardless of the value (t/L). That is, the separation factor may be maximized when the ratio (b/L) is in a range of 0.3-0.9.
- the actual length L, width b and thickness t are determined.
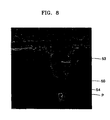
- FIG. 8 shows a photograph illustrating the micro cantilever manufactured through the MEMS process.
- a probe 54 is provided on an end of the cantilever 50.
- the bio subject such as DNA and protein is disposed on the probe 54. Since the bio subject p is disposed on an extreme end of the cantilever 54, the mass added effect can be maximized.
- An area of the probe 54 may be 1/10 of an entire area of the cantilever.
- the bio subject is attached on the probe 54 through a biochemical reaction. That is, by concentrically attaching the bio subject on the extreme end of the cantilever as far as possible, the mass added effect can be maximized.
- DNA has mass density of about 6x10-15g/ ⁇ m 2 and protein has mass density of about 2x10-15g/ ⁇ m 2 .
- Formula 15 representing the sensitiveness, it is possible to measure the mass of the cantilever.
- the cantilever is formed of silicon through the MEMS process.
- the variation ⁇ ft of the resonance frequency is 150Hz considering that the resonance frequency is varied within a range of 0-150Hz as the bio subject p is locally attached on the cantilever.
- the range of the resonance frequency is determined to suggest a determining reference if there is a specific bio subject that is a part of a lab on a chip (LOC) to which the inventive apparatus is applied.
- the probe 54 is biochemically-treated so that the bio-subject can be attached only on the probe 54. Therefore, the mass of the bio subject attached on the probe can be identified according to the variation of the resonance frequency.
- the variation of the resonance frequency when the variation of the resonance frequency is 50Hz, it can be regarded that the bio subject is attached on a 1/3 of the probe area. In addition, when the variation of the resonance frequency is 75Hz, it can be regarded that the bio subject is attached on half of the probe area.
- the variation of 0-150Hz of the resonance frequency is enough high when it is considered that the variation of the first resonance frequency according to the increase of the mass of the DNA or protein is very small.
- the size of the triangular cantilever can be calculated based on the above-described conditions.
- the length, width and thickness of the cantilever are respectively 40 ⁇ m, 12 ⁇ m and 2 ⁇ m.
- the length, width and thickness of the cantilever are respectively 100 ⁇ m, 30 ⁇ m and 5 ⁇ m.
- the piezoelectric element may be formed of the PZT.
- the size of the piezoelectric element may be determined to obtain a large mount of output current. When there is a large amount of output current, the mass detecting performance with respect to the subject p may be improved.
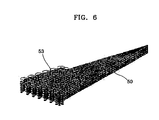
- FIG. 6 shows a finite element model for a numerical analysis, illustrating the triangular cantilever 50 deposited with the piezoelectric element 53.
- the piezoelectric element may be deposited on an area of the cantilever as large as possible. Since output current from the piezoelectric element is most affected by the size of the piezoelectric element, it is preferable that the piezoelectric element is formed as large as possible to effectively measure the resonance frequency according to the variation of the micro mass.
- the piezoelectric element 53 may be formed in a trapezoid-shape.
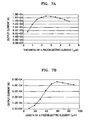
- FIG. 7A shows a graph illustrating the variation of the output current according to the thickness of the piezoelectric element 53. As shown in the graph, when the thickness t1 is 2.5 ⁇ m, the largest amount of output current is obtained.
- the output current is measured while increasing the length of the piezoelectric element 53 in a state where the thickness t1 is 2.5 ⁇ m.
- the result is shown in FIG. 7B .
- a thickness of the piezoelectric element is 40-60% of that of the cantilever and a length thereof is 50-60% of that of the cantilever. That is, the thickness ratio and the length ratio between the piezoelectric element and the cantilever can be determined based on a case where a property of the micro cantilever manufactured through the MEMS process is similar to the numerical analysis result and the mathematical piezoelectric model.
- FIG. 8 shows the micro cantilever manufactured through the MEMS process and
- FIG. 9 shows graph illustrating signals outputted from the oscillation circuit through the oscilloscope.
- a lower wave signal is a feedback vibration signal of the micro cantilever, which is returned to the cantilever through the oscillation circuit.
- An upper wave signal is a feedback signal outputted through the micro cantilever. That is, the upper wave signal shows a self-vibration signal representing that the cantilever continuously self-vibrates with the first resonance frequency.
- the micro mass measuring apparatus of the present invention is designed such that the self-vibration of the cantilever and the measurement of subject mass can be simultaneously realized by the piezoelectric element applied with the oscillation circuit. Accordingly, an external driver such as a function generator is not required in the present invention.
- the micro mass it is preferable that a possibly large amount of the protein (the subject) is attached on the cantilever.
- sea mussel protein having high adhesive strength is used.
- An end of the micro cantilever 50 is stained with an aqueous solution containing the subject (the sea mussel protein).
- the oscillation circuit is connected to the cantilever 50 to measure the variation of the frequency.
- the first resonance frequency measured by the frequency measuring device 65 is 1.238544MHz.
- the variation of the resonance frequency by the sea mussel protein is 85Hz.
- the mass of the sea mussel protein calculated using Formula 15 representing the sensitiveness is 0.179483 x 10⁻¹²(g).
- the oscillation circuit 60 self-vibrates the cantilever 50 at the first resonance frequency. After the subject p is disposed on the cantilever 50, the cantilever 50 is further self-vibrated with the first varied resonance frequency and the mass of the subject p is measured using the varied resonance frequency.
- the oscillation circuit 60 continuously excites the cantilever through the piezoelectric element 53 and the first resonance frequency of the cantilever is measured.
- the resonance frequency varied by the subject P is measured to measure the variation of the resonance frequency.
- the mass of the subject P is measured using Formula 15 according to the variation of the resonance frequency.
- the cantilever is actively driven by the oscillation circuit and the mass of the subject can be measured according to the resonance frequency variation by the subject p without using a separated measuring device.
- the self driving of the cantilever and the measuring of the resonance frequency are simultaneously realized by the single piezoelectric element, a separated vibrator and a separated resonance frequency measuring device are not required. Accordingly, the structure of the micro mass measuring apparatus can be simplified.
- the micro cantilever may be manufactured through the MEMS process.
- mass of a variety of bio subjects can be measured simultaneously. Therefore, when the micro cantilever is applied to the LOC, it becomes possible to realize a portable DNA or protein detector.
Landscapes
- Physics & Mathematics (AREA)
- General Physics & Mathematics (AREA)
- Acoustics & Sound (AREA)
- Health & Medical Sciences (AREA)
- Life Sciences & Earth Sciences (AREA)
- Chemical & Material Sciences (AREA)
- Analytical Chemistry (AREA)
- Biochemistry (AREA)
- General Health & Medical Sciences (AREA)
- Immunology (AREA)
- Pathology (AREA)
- Measurement Of Mechanical Vibrations Or Ultrasonic Waves (AREA)
Description
- The present invention relates to an apparatus and method for measuring micro mass using an oscillation circuit, and more particularly, to an apparatus and method for measuring mass of biomolecule such as DNA and protein by oscillating a cantilever using an oscillation circuit.
- In a mass micro-balancing technology, variation of a resonance frequency of a micro matter according to a variation of mass is first measured, and the varied mass is measured based on the varied resonance frequency.
- A typical method for measuring micro matter using such a mass micro-balancing technology is a quartz crystal mass micro-balancing (QCM). Sauerbrey systematically theorizes a relationship between variation of resonance frequency and increase of mass in the QCM. According to the theory of Sauerbrey, the resonance frequency is linearly reduced as the mass is increased.
- The QCM is generally used to measure mass per unit area of a subject (to-be-measured). The QCM determines increased mass according to variation of a shear mode of quartz oscillator. The QCM has advantages that it is designed to make it easy to input/output a signal and excel in sensitiveness. However, the mass must be evenly distributed on a surface of the quartz oscillator and a shear mode having a high resonance frequency must be used.
- As the mass micro-balancing technology, a method using light and a method using piezo-resistance have been proposed.
-
U.S. Patent No. 5,719,324 discloses a sensor for measuring micro mass using light. - As shown in
FIG. 1 , the sensor disclosed in the Patent comprises acantilever 12, apiezoelectric element 10 supporting thecantilever 12, and alaser diode 19 formed on a tip portion of thecantilever 12 toeradiate laser beams 20. Thepiezoelectric element 10 is excited by a pulse wave from anoscillator 14, thereby exciting thepiezoelectric element 10. - When the subject is disposed on the
cantilever 12, thecantilever 12 is deformed by the mass of the examining subject. As this point, thelaser beams 20 eradiated from thecantilever 12 are detected by aphotodetector 27 having first andsecond cells cantilever 12 is measured based on an amount of light detected by thephotodetector 27, thereby determining varied mass. Thereference numerals reference numerals reference numerals differential circuits - However, the method using the light requires an accurate position control of the laser diode and the photodetector. Therefore, a separated position controller controlling the position of the laser diode and the photodetector is required. In addition, since a member for oscillating the cantilever and a member for measuring mass are formed independent from each other, a volume of the apparatus is increased, complicating the structure.
- In the method using the piezo resistance, a piezo resistance material is doped in the cantilever to increase the mass of the cantilever, causing the cantilever to be deformed by the increased mass. The deformation of the cantilever causes the resistance to be varied. The mass is measured by measuring output voltage varied by the resistance variation.
- However, in the above-described methods, since the cantilever is not actively oscillated, the variation of the cantilever is too small to precisely measure micro mass. Furthermore, a variety of periphery devices such as a device for measuring varied resistance, a device for comparing an input signal for oscillating with an output signal of a resonance frequency varied by the increased mass, and the like are required, increasing the manufacturing costs and volume of the apparatus.
- The present invention provides an apparatus and method that can precisely measure micro mass of a subject without using any additional periphery devices by actively self-vibrating a cantilever using an oscillation circuit.
- In an aspect of the present invention, there is provided a micro mass measuring apparatus according to
claim 1. - According to an embodiment of the present invention, the oscillation circuit comprises an amplifier for amplifying an output signal from the cantilever; and a feedback for inputting the amplified signal to the cantilever.
- The cantilever may be formed in a triangular-shape.
- A ratio between a length, width and thickness of the cantilever may be in a range of 20:6:1-20:18:1.
- An area of the cantilever, on which the subject is attached, may be 1/15-1/10 of an entire area of the cantilever.
- A thickness of the piezoelectric element may be about 40-60% of a thickness of the cantilever. A length of the piezoelectric element may be about 50-60% of a length of the cantilever.
- In another aspect of the present invention, there is provided a method for measuring micro mass using a mass micro-balancing technology according to claim 8.
- Preferred embodiments are subject of the dependent claims.
- The above and other features and advantages of the present invention will become more apparent by describing in detail exemplary embodiments thereof with reference to the attached drawings in which:
-
FIG. 1 is a schematic diagram of a conventional micro cantilever sensor; -
FIG. 2 is a schematic diagram of a micro mass measuring apparatus according to an embodiment of the present invention; -
FIGS. 3A and 3B are views illustrating examples of a cantilever employed to a micro mass measuring apparatus according to an embodiment of the present invention; -
FIG. 4 is a graph illustrating resolution with respect to a length of a cantilever employed to a micro mass measuring apparatus according to an embodiment of the present invention; -
FIG. 5 is a graph illustrating a separation factor with respect to a ratio between a length and width of a cantilever employed to a micro mass measuring apparatus according to an embodiment of the present invention; -
FIG. 6 is a view of a finite element model of a cantilever deposited with a piezoelectric element employed to a micro mass measuring apparatus according to an embodiment of the present invention; -
FIG. 7A is a graph illustrating output current with respect to a thickness of a piezoelectric element employed to a micro mass measuring apparatus according to an embodiment of the present invention; -
FIG. 7B is a graph illustrating output current with respect to a length of a piezoelectric element employed to a micro mass measuring apparatus according to an embodiment of the present invention; -
FIG. 8 is a photograph of a cantilever deposited with a piezoelectric element that is fabricated by an MEMS process; and -
FIG. 9 is a graph illustrating a self-vibration signal and a feedback signal that are generated by an oscillation circuit applied to a micro mass measuring apparatus according to an embodiment of the present invention. - The present invention will now be described more fully with reference to the accompanying drawings, in which exemplary embodiments of the invention are shown. The invention may, however, be embodied in many different forms and should not be construed as being limited to the embodiments set forth herein; rather, these embodiments are provided so that this disclosure will be thorough and complete, and will fully convey the concept of the invention to those skilled in the art. In the drawings, the thicknesses of layers and regions are exaggerated for clarity.
-
FIG. 2 shows a schematic diagram of a micro mass measuring apparatus according to an embodiment of the present invention. - Referring to
FIG. 2 , a micro mass measuring apparatus of the present invention comprises amicro cantilever 50 for measuring mass of a subject p and anoscillation circuit 60 for oscillating themicro cantilever 50 actively and for measuring a varied resonance frequency of themicro cantilever 50. - The subject can be biomolecle such as DNA and protein.
- A
piezoelectric element 53 is formed on thecantilever 50. Theoscillation circuit 60 is coupled to thepiezoelectric element 53. Thepiezoelectric element 53 may be formed by depositing PZT on thecantilever 50. - The
oscillation circuit 60 comprises anamplifier 57 and afeedback 58. Theamplifier 57 amplifies a first resonance frequency outputted from thepiezoelectric element 53 of themicro cantilever 50 and thefeedback 58 allows thepiezoelectric element 53 to vibrate thecantilever 50 with the first resonance frequency. - A
frequency measuring device 65 is coupled to theoscillation circuit 60 to measure a variation of the resonance frequency. Thefrequency measuring device 65 may be formed of a simple electric circuit using, for example, a pulse counter. When the frequency measuring device is coupled to theoscillation circuit 60, a micro variation of the resonance frequency, which is caused by the increase of mass when the subject p is disposed on thecantilever 50, can be easily measured. - As described above, by applying the
oscillation circuit 60 to themicro cantilever 50 to which thepiezoelectric element 53 is coupled, thecantilever 50 can continuously vibrate with the first resonance frequency. After the subject p is disposed on themicro cantilever 50, the resonance frequency varied by the subject p is measured by thefrequency measuring device 65. Therefore, it is possible to vibrate itself and measure mass of thecantilever 50 using the singlepiezoelectric element 53. - The measuring apparatus of the present invention further comprises a data transferring device (not shown) for transferring the variation amount of the frequency to a computer.
- To measure micro mass of the subject such as DNA and protein according to the present invention, the bio subject p is attached on an end of the
micro cantilever 50 employing theoscillation circuit 60 and the micro mass of the bio subject p is measured using the mass micro-balancing technology. - The
micro cantilever 50 deposited with thepiezoelectric element 53 may be manufactured through a micro electro mechanical system (MEMS) process. The attachment of the bio subject p may be realized through a biochemical reaction. - The
oscillation circuit 60 is comprised of theamplifier 57 for amplifying a signal from thecantilever 50 and thefeedback 58 for inputting the amplified signal to thecantilever 50. There is further provided anelectric power source 59 for supplying voltage to theoscillation circuit 60. The electric power source may be one of pulse and step-type power sources. A small battery may be used as thepower source 59. - Since the
micro cantilever 50 is a simple mechanical structure which clearly show displacement and formed in a micro-size through the MEMS process, it can be applied to a lab-on-a-chip (LOC) that can measure micro mass of a bio subject such as the DNA and protein. - The
micro cantilever 50 is preferably designed having a shape and size that can provide sensitiveness that is good for measuring the micro mass. For example, when mass density of the DNA or protein is 10-15 , g/µm2, it is preferable that thecantilever 50 is designed having a shape and size providing a sensitiveness of about 1 Hz/10-15g and resolution of about 10-15g/Hz. - That is, it is preferable that the cantilever is designed having a simple shape and a size that can provide sensitiveness required for the measurement of the micro mass. When the cantilever has a simple shape, the MEMS process can be simplified.
- Furthermore, it is preferable that the
micro cantilever 50 is designed having a shape and size that can satisfy a separation factor proper to measure the micro mass. Thecantilever 50 can be designed satisfying both the sensitiveness and the separation factor. For example, as shown inFIGS. 3a and 3b , thecantilever 50 may be designed having a triangular-shape or a rectangular-shape. The sensitiveness and separation factor of the triangular cantilever will be compared with those of the rectangular cantilever. - When the subject p is not attached on the
micro cantilever 50, a resonance frequency fr of the rectangular cantilever is as follows:
where, kr and mr are respectively stiffness and mass of the rectangular cantilever. - When the subject p is not attached on the
micro cantilever 50, a resonance frequency ft of the triangular cantilever is as follows:
where, kt and mt are respectively stiffness and mass of the triangular cantilever. - When the subject p is attached on the
micro cantilever 50, a varied resonance frequency f0r of the rectangular cantilever is as follows:
- When the subject p is attached on the
micro cantilever 50, a varied resonance frequency f0t of the triangular cantilever is as follows:
- When the cantilever is formed in the rectangular-shape, a variation Δfr of the resonance frequency according to the variation of the micro mass of the subject p can be calculated using
Formulas 
- When the cantilever is formed in the triangular-shape, a variation Δft of the resonance frequency according to the variation of the micro mass of the subject p can be calculated using the
Formulas 
- Here, since mass mr and mt of the cantilever is sufficiently greater than mass Δm of the subject p, when an assumption (Δm/m≪1) is applied to
Formulas 

- According to
Formulas 
- In Formula 9, Δm/ Δf(g/Hz) represents resolution. The sensitiveness is an inverse number of the resolution. That is, the lower the resolution, the higher the sensitiveness. That is, when the resonance frequency per unit mass is greatly varied, it means that the sensitiveness is high.
- In addition, the resolution of the micro cantilever is proportional to its m/f, and the sensitiveness thereof is proportional to the f/m. Accordingly, a cantilever that is designed having small mass and a high resonance frequency is more proper for the micro mass measuring apparatus.
- As shown in
FIGS. 3A and 3B , the sensitiveness of the cantilever formed in the triangular-shape will be compared with that of the cantilever formed in the rectangular-shape with regards to a length L, a width b and a thickness t of thecantilever 50. At this point, it is assumed that the triangular cantilever and the rectangular cantilever are formed in an identical material and have same a length, same a width and same a thickenss. - The stiffness Kr of the rectangular cantilever and the stiffness Kt of the triangular cantilever can be respectively represented by following
Formulas 10 and 11. Here, E, I, ρ are respectively the modulus coefficient, second moment of inertia of area, density of the cantilever.

- The mass mr of the rectangular cantilever and the mass mt of the triangular cantilever are as follows:


- When
Formulas Formula 14 can be obtained as follows:
- When
Formulas 11 and 13 are applied to Formula 7,Formula 15 can be obtained as follows:
- When comparing
Formula 14 withFormula 15, it can be noted that the sensitiveness (Δf/Δm)t of the triangular cantilever is relatively higher than that (Δf/Δm)r of the rectangular cantilever. This notes that it is preferable that the cantilever is formed in the triangular-shape. However, as far as the sensitiveness and the separation factor are satisfied, the rectangular cantilever can be also used. -
FIG. 4 shows a graph illustrating the resolutions of the triangular cantilever and the rectangular cantilever. The resolution is an inverse number of the sensitiveness. That is, the lower the resolution, the higher the sensitiveness. - Referring to
FIG. 4 , when a length L of the triangular cantilever is identical to that of the rectangular cantilever, the sensitiveness of the triangular cantilever is higher than that of the rectangular cantilever. - To determine an actual size of the triangular cantilever, a separation factor is first defined and a ratio between a length, width and thickness of the cantilever is determined. Here, the separation factor is defined by a value obtained by dividing a difference between the first and second resonance frequencies of the cantilever by the first resonance frequency. The separation factor represents an adjacent degree of the first and second resonance frequencies.
- A first resonance frequency mode is used for the cantilever used as a detecting sensor for detecting vibration of a series of structures where the infinity number of vibration modes are compositely generated. At this point, when the second resonance frequency is too near the first resonance frequency, it may be confused to measure the first resonance frequency. Accordingly, to accurately measure the first resonance frequency, an interval between the first and second resonance frequency must be above a predetermined level. The separation factor is defined to provide the predetermined level. Since the separation factor is defined by a value obtained by dividing the difference between the first and second resonance frequencies ft1 and ft2 of the triangular cantilever by the first resonance frequency ft1, it can be represented by
Formula 16 as follows:
- The shape of the triangular cantilever is concretely determined by a shape ratio between a length, a width and a thickness. The shape ratio is determined to obtain a predetermined satisfactory value of the separation factor and a predetermined satisfactory value of the sensitiveness. The separation factor of the triangular cantilever will be described hereinafter.
-
FIG. 5 shows a graph illustrating a separation factor of a triangular cantilever. The horizontal axis indicates a value (b/L) obtained by dividing a width b by a length L, and the vertical axis indicates a separation factor according to the variation of the value (b/L). In addition, results obtained when a ratio t/L of the length L to the thickness t is 1/20, 1/50 and 1/100 are illustrated. - Furthermore, when
Formulas 11 and 13 are applied toFormula 2, a resonance frequency ft can be obtained as follows:
- Since the micro cantilever is operated in liquid to detect the bio subject, a mass added effect must be considered. That is, when the cantilever vibrates in the liquid, an effect is obtained as if the mass of the cantilever is increased due to the mass of the liquid. When the mass of the cantilever is increased, the resonance frequency of the cantilever is reduced. According to Formula15, the sensitiveness of the cantilever is reduced as the resonance frequency is reduced.
- By increasing a ratio (t/L) of the thickness to the length of the cantilever to increase the stiffness of the cantilever, it is possible to overcome the mass added effect. Therefore, it is most preferable to set the ratio (t/L) of 1/20.
- Referring to
FIG. 5 , there is a range in which the separation factor has a predetermined value (a maximum value) regardless of the value (t/L). That is, the separation factor may be maximized when the ratio (b/L) is in a range of 0.3-0.9. - That is, when the value (t/L) is 1/20 and the value (b/L) is in a range of 0.3-0.9, the separation factor and the sensitiveness are simultaneously satisfied. Therefore, the shape ratio of the cantilever may be determined in a range of L:b:t=(20:6:1)-(20:18:1).
- On the basis of the above-described shape ratio, the actual length L, width b and thickness t are determined.
-
FIG. 8 shows a photograph illustrating the micro cantilever manufactured through the MEMS process. - Referring to
FIG. 8 , aprobe 54 is provided on an end of thecantilever 50. The bio subject such as DNA and protein is disposed on theprobe 54. Since the bio subject p is disposed on an extreme end of thecantilever 54, the mass added effect can be maximized. An area of theprobe 54 may be 1/10 of an entire area of the cantilever. - The bio subject is attached on the
probe 54 through a biochemical reaction. That is, by concentrically attaching the bio subject on the extreme end of the cantilever as far as possible, the mass added effect can be maximized. - DNA has mass density of about 6x10-15g/µm2 and protein has mass density of about 2x10-15g/µm2. By applying these values to
Formula 15 representing the sensitiveness, it is possible to measure the mass of the cantilever. When it is assumed that the area of theprobe 54 is 1/10 of the that of the cantilever, the probe can be represented as "(1/10) (bL/2)=(1/10) (3L/10) U2 = 3L2 /200." - The cantilever is formed of silicon through the MEMS process. The silicon has property values (E=112GPa, p =2330kg/m3). When these property values are applied to
Formula 15, the length L, width b and thickness b of the triangular cantilever can be determined. - At this point, it is assumed that the variation Δft of the resonance frequency is 150Hz considering that the resonance frequency is varied within a range of 0-150Hz as the bio subject p is locally attached on the cantilever. By measuring the resonance frequency, it is possible to determine mass of the bio subject p attached on the
probe 54. The range of the resonance frequency is determined to suggest a determining reference if there is a specific bio subject that is a part of a lab on a chip (LOC) to which the inventive apparatus is applied. Theprobe 54 is biochemically-treated so that the bio-subject can be attached only on theprobe 54. Therefore, the mass of the bio subject attached on the probe can be identified according to the variation of the resonance frequency. - For example, when the variation of the resonance frequency is 50Hz, it can be regarded that the bio subject is attached on a 1/3 of the probe area. In addition, when the variation of the resonance frequency is 75Hz, it can be regarded that the bio subject is attached on half of the probe area. The variation of 0-150Hz of the resonance frequency is enough high when it is considered that the variation of the first resonance frequency according to the increase of the mass of the DNA or protein is very small.
- The size of the triangular cantilever can be calculated based on the above-described conditions. When the bio subject is the DNA, the length, width and thickness of the cantilever are respectively 40µm, 12µm and 2µm. When the bio subject is the protein, the length, width and thickness of the cantilever are respectively 100µm, 30µm and 5µm. These values are determined through a numeral analysis considering area density of the DNA and protein with respect to cantilevers having an identical shape ratio to each other such that the cantilever can be manufactured through the MEMS process and have sufficient sensitiveness.
- Next, a thickness and length of the piezoelectric element are determined. The piezoelectric element may be formed of the PZT. The size of the piezoelectric element may be determined to obtain a large mount of output current. When there is a large amount of output current, the mass detecting performance with respect to the subject p may be improved.
- In a numerical analysis, Q factor of 1000 and input voltage of 200m/V are inputted.
FIG. 6 shows a finite element model for a numerical analysis, illustrating thetriangular cantilever 50 deposited with thepiezoelectric element 53. The piezoelectric element may be deposited on an area of the cantilever as large as possible. Since output current from the piezoelectric element is most affected by the size of the piezoelectric element, it is preferable that the piezoelectric element is formed as large as possible to effectively measure the resonance frequency according to the variation of the micro mass. For example, thepiezoelectric element 53 may be formed in a trapezoid-shape. - To identify the affection of a thickness of the piezoelectric on the output current, the thickness t1 (see
FIG. 3 ) is gradually varied in a state where a length L1 is 30µm.FIG. 7A shows a graph illustrating the variation of the output current according to the thickness of thepiezoelectric element 53. As shown in the graph, when the thickness t1 is 2.5µm, the largest amount of output current is obtained. - To identify the variation of the output current according to the length L1 of the piezoelectric element, the output current is measured while increasing the length of the
piezoelectric element 53 in a state where the thickness t1 is 2.5µm. The result is shown inFIG. 7B . As shown in the graph, when the length L of the piezoelectric element is increased up to 60µm, the output current is monotonically increased. When the length L is increased above 60µm, the output current is gently reduced. According to a numeral analysis based on the result, it is preferable that a thickness of the piezoelectric element is 40-60% of that of the cantilever and a length thereof is 50-60% of that of the cantilever. That is, the thickness ratio and the length ratio between the piezoelectric element and the cantilever can be determined based on a case where a property of the micro cantilever manufactured through the MEMS process is similar to the numerical analysis result and the mathematical piezoelectric model. -
FIG. 8 shows the micro cantilever manufactured through the MEMS process andFIG. 9 shows graph illustrating signals outputted from the oscillation circuit through the oscilloscope. - In
FIG. 9 , a lower wave signal is a feedback vibration signal of the micro cantilever, which is returned to the cantilever through the oscillation circuit. An upper wave signal is a feedback signal outputted through the micro cantilever. That is, the upper wave signal shows a self-vibration signal representing that the cantilever continuously self-vibrates with the first resonance frequency. - As described above, the micro mass measuring apparatus of the present invention is designed such that the self-vibration of the cantilever and the measurement of subject mass can be simultaneously realized by the piezoelectric element applied with the oscillation circuit. Accordingly, an external driver such as a function generator is not required in the present invention.
- The more concrete measuring example will be described hereinafter.
- To measure the micro mass, it is preferable that a possibly large amount of the protein (the subject) is attached on the cantilever. To attach the protein on the cantilever as much as possible, sea mussel protein having high adhesive strength is used. An end of the
micro cantilever 50 is stained with an aqueous solution containing the subject (the sea mussel protein). The oscillation circuit is connected to thecantilever 50 to measure the variation of the frequency. At this point, the first resonance frequency measured by thefrequency measuring device 65 is 1.238544MHz. The variation of the resonance frequency by the sea mussel protein is 85Hz. The mass of the sea mussel protein calculated usingFormula 15 representing the sensitiveness is 0.179483 x 10⁻¹²(g). - In the method for measuring the micro mass, the
oscillation circuit 60 self-vibrates thecantilever 50 at the first resonance frequency. After the subject p is disposed on thecantilever 50, thecantilever 50 is further self-vibrated with the first varied resonance frequency and the mass of the subject p is measured using the varied resonance frequency. - When there is no subject p on the cantilever, the
oscillation circuit 60 continuously excites the cantilever through thepiezoelectric element 53 and the first resonance frequency of the cantilever is measured. - After the subject p is reattached on the
cantilever 50, the resonance frequency varied by the subject P is measured to measure the variation of the resonance frequency. The mass of the subject P is measured usingFormula 15 according to the variation of the resonance frequency. As described above, the cantilever is actively driven by the oscillation circuit and the mass of the subject can be measured according to the resonance frequency variation by the subject p without using a separated measuring device. - According to the above described micro mass measuring apparatus and method, since the self driving of the cantilever and the measuring of the resonance frequency are simultaneously realized by the single piezoelectric element, a separated vibrator and a separated resonance frequency measuring device are not required. Accordingly, the structure of the micro mass measuring apparatus can be simplified. In addition, the micro cantilever may be manufactured through the MEMS process. In addition, when an arrangement having a plurality of cantilevers is designed, mass of a variety of bio subjects can be measured simultaneously. Therefore, when the micro cantilever is applied to the LOC, it becomes possible to realize a portable DNA or protein detector.
- While the present invention has been particularly shown and described with reference to exemplary embodiments thereof, it will be understood by those of ordinary skill in the art that various changes in form and details may be made therein without departing from the scope of the present invention as defined by the following claims.
Claims (8)
- A micro mass measuring apparatus comprising:a cantilever (50) on which a subject is attachable;a piezoelectric element (53) formed on the cantilever (50);an oscillation circuit (60) for actively vibrating the cantilever (50) through the piezoelectric element at a first resonance frequency and providing a first resonance frequency varied by the subject; anda frequency measuring device (65) for measuring a resonance frequency of the cantilever (50);wherein a shape ratio t/L and b/L between a length L, a width b and a thickness t of the cantilever (50) is determined by sensitiveness and a separation factor, wherein sensitiveness is given by the ratio of the change of resonance frequency and the change of mass , and wherein the separation factor is defined by a value obtained by dividing a difference between a first resonance frequency of the cantilever and a first resonance frequency varied by the subject by the first resonance frequency.
- The micro mass measuring apparatus of claim 1, wherein the oscillation circuit (60) comprises:an amplifier (57) for amplifying an output signal from the cantilever (50); anda feedback (58) for inputting the amplified signal to the cantilever (50).
- The micro mass measuring apparatus of claim 1, wherein the cantilever (50) is formed in a triangular-shape.
- The micro mass measuring apparatus of claim 3, wherein the shape ratio between a length, width and thickness of the cantilever (50) is in a range of 20:6:1-20:18:1.
- The micro mass measuring apparatus of claim 1, wherein an area of the cantilever (50), on which the subject is attachable, is 1/15-1/10 of an entire area of the cantilever (50).
- The micro mass measuring apparatus of claim 1, wherein a thickness of the piezoelectric element (53) is about 40-60% of a thickness of the cantilever (50).
- The micro mass measuring apparatus of claim 1, wherein a length of the piezoelectric element (53) is about 50-60% of a length of the cantilever (50).
- A method for measuring micro mass using a mass micro-balancing technology, comprising:self-vibrating a cantilever (50) through a piezoelectric element (53) using an oscillation circuit (60) at a first resonance frequency;attaching a subject on the cantilever (50) and self-vibrating the cantilever (50) with a first resonance frequency varied by the subject; andmeasuring mass of the subject using resonance frequencies variation due to the subject;wherein a shape ratio t/L and b/L between a length L, a width b and a thickness t of the cantilever (50) is determined by sensitiveness and a separation factor, wherein sensitiveness is given by the ratio of the change of resonance frequency and the change of mass , and wherein the separation factor is defined by a value obtained by dividing a difference between a first resonance frequency of the cantilever and a first resonance frequency varied by the subject by the first resonance frequency.
Applications Claiming Priority (2)
| Application Number | Priority Date | Filing Date | Title |
|---|---|---|---|
| KR2003079898 | 2003-11-12 | ||
| KR1020030079898A KR100552696B1 (en) | 2003-11-12 | 2003-11-12 | Apparatus and method for fine mass measurement with oscillation circuit |
Publications (2)
| Publication Number | Publication Date |
|---|---|
| EP1533611A1 EP1533611A1 (en) | 2005-05-25 |
| EP1533611B1 true EP1533611B1 (en) | 2015-01-07 |
Family
ID=34431758
Family Applications (1)
| Application Number | Title | Priority Date | Filing Date |
|---|---|---|---|
| EP04026084.6A Expired - Lifetime EP1533611B1 (en) | 2003-11-12 | 2004-11-03 | Apparatus and method for measuring micro mass using oscillation circuit |
Country Status (5)
| Country | Link |
|---|---|
| US (1) | US7331231B2 (en) |
| EP (1) | EP1533611B1 (en) |
| JP (1) | JP4155960B2 (en) |
| KR (1) | KR100552696B1 (en) |
| CN (1) | CN1616947A (en) |
Families Citing this family (25)
| Publication number | Priority date | Publication date | Assignee | Title |
|---|---|---|---|---|
| CN101014848B (en) * | 2004-08-11 | 2011-05-18 | 日本电波工业株式会社 | Sensing device |
| EP1977224B1 (en) | 2006-01-23 | 2013-04-03 | Drexel University | Self-exciting, self-sensing piezoelectric cantilever sensor |
| SE531775C2 (en) * | 2006-04-26 | 2009-08-04 | Nems Ab | Device and component for real-time parallel detection of individual nanomechanical movements of a collection / array of individual and independent oscillating beams |
| CN101490539A (en) * | 2006-05-10 | 2009-07-22 | 德雷塞尔大学 | Self-exciting, self-sensing piezoelectric cantilever sensor for detection of airborne analytes directly in air |
| GB2444510B (en) * | 2006-12-09 | 2010-04-14 | Univ Sheffield | Substance detection system and method |
| KR100849466B1 (en) * | 2007-01-31 | 2008-07-30 | 포항공과대학교 산학협력단 | Micro piezoelectric cantilever sensor and oscillation circuit for it |
| JP4930941B2 (en) * | 2007-03-28 | 2012-05-16 | 国立大学法人群馬大学 | Cantilever type sensor |
| JP4959632B2 (en) * | 2007-06-01 | 2012-06-27 | アオイ電子株式会社 | Nano tweezers and gripping method |
| USD587007S1 (en) * | 2007-07-16 | 2009-02-24 | Phillips Iii Rene V | Hydration pack |
| KR20090124789A (en) * | 2008-05-30 | 2009-12-03 | 주식회사 캔티스 | Apparatus for measuring resonance characteristics of cantilever structure and its measuring method |
| KR101243645B1 (en) * | 2009-08-04 | 2013-03-25 | 한양대학교 산학협력단 | Airborne dust particles monitoring device and airborne dust particles detecting method using the same |
| JP5434648B2 (en) * | 2010-02-12 | 2014-03-05 | セイコーエプソン株式会社 | Ink discharge amount measuring apparatus and ink discharge amount measuring method |
| JP5419767B2 (en) * | 2010-03-24 | 2014-02-19 | オリンパス株式会社 | Detection sensor, substance detection method |
| ITTO20100651A1 (en) | 2010-07-28 | 2012-01-29 | Ist Sperimentale It Lazzaro Spallanza | PROCEDURE AND EQUIPMENT FOR THE CHARACTERIZATION AND SEPARATION OF SPERMFERCEE WITH SUSPENDED LEVER MICROMETRIC SENSORS |
| WO2012059828A2 (en) * | 2010-11-01 | 2012-05-10 | Koc Universitesi | Miniaturized integrated micro electo-mechanical systems (mems) optical sensor array |
| KR101147849B1 (en) | 2011-07-22 | 2012-05-24 | 전남대학교산학협력단 | Screening apparatus for medicine |
| CN102305658B (en) * | 2011-07-31 | 2012-11-14 | 大连理工大学 | An electrostatic adsorption micromass sensor |
| KR101294359B1 (en) | 2012-06-19 | 2013-08-08 | 전남대학교산학협력단 | Piezoelectric film structure body of both ends fixed type |
| CN103453969B (en) * | 2013-09-11 | 2015-05-20 | 北华航天工业学院 | Space mass measuring instrument |
| ES2642640B1 (en) * | 2016-04-11 | 2018-10-26 | Nanodreams, S.L. | Procedure to obtain the adsorption position, mass and stiffness of a particle |
| CN106918380B (en) * | 2017-02-17 | 2019-10-29 | 大连理工大学 | A high-sensitivity micro-mass testing method and portable mass testing device |
| CN107290240B (en) * | 2017-07-27 | 2019-12-10 | 江苏集萃有机光电技术研究所有限公司 | Quartz crystal microbalance and detection method |
| CN110702795B (en) * | 2019-10-21 | 2024-08-16 | 肇庆学院 | Electromagnetic suspension micro-mass measurement system |
| KR20240029443A (en) | 2022-08-26 | 2024-03-05 | 삼성전자주식회사 | Sensor device and method of operating the same |
| CN117129065A (en) * | 2023-07-25 | 2023-11-28 | 南京航空航天大学 | Method for measuring the mass of tiny soft particles |
Family Cites Families (16)
| Publication number | Priority date | Publication date | Assignee | Title |
|---|---|---|---|---|
| CA1180914A (en) | 1981-08-17 | 1985-01-15 | James M. O'connor | Micromechanical chemical sensor |
| US4623030A (en) * | 1985-10-21 | 1986-11-18 | Alcor, Inc. | Piezoelectric ratio weighing device |
| US5719324A (en) * | 1995-06-16 | 1998-02-17 | Lockheed Martin Energy Systems, Inc. | Microcantilever sensor |
| GB9801286D0 (en) * | 1998-01-21 | 1998-03-18 | Univ Cambridge Tech | Sensor |
| US6080939A (en) | 1998-06-12 | 2000-06-27 | Rupprecht & Pataschnick Company, Inc. | Mass determination device having counterbalanced normalized temperature coefficients |
| US6126311A (en) * | 1998-11-02 | 2000-10-03 | Claud S. Gordon Company | Dew point sensor using mems |
| CN1182920C (en) | 1999-05-03 | 2005-01-05 | 坎森有限公司 | Sensors for Micro Fluid Handling Systems |
| JP2001056278A (en) | 1999-08-20 | 2001-02-27 | Stanley Electric Co Ltd | Mass detection type gas sensor |
| CA2405358C (en) | 2000-04-05 | 2007-10-30 | The Charles Stark Draper Laboratory, Inc. | Apparatus and method for measuring the mass of a substance |
| JP3764853B2 (en) | 2001-05-28 | 2006-04-12 | 喜萬 中山 | Nanomaterial mass measurement method and apparatus |
| US6797631B2 (en) * | 2001-08-07 | 2004-09-28 | Korea Institute Of Science And Technology | High sensitive micro-cantilever sensor and fabricating method thereof |
| WO2003055063A1 (en) | 2001-12-06 | 2003-07-03 | University Of Pittsburgh | Tunable piezoelectric micro-mechanical resonator |
| DE10209245B4 (en) * | 2002-03-04 | 2005-12-22 | Concentris Gmbh | Device and method for the detection of microorganisms |
| US20040208788A1 (en) * | 2003-04-15 | 2004-10-21 | Colton Jonathan S. | Polymer micro-cantilevers and their methods of manufacture |
| US20030209058A1 (en) * | 2002-05-07 | 2003-11-13 | Merrill John H. | MIP microcantilever sensor and a method of using thereof |
| US7521257B2 (en) * | 2003-02-11 | 2009-04-21 | The Board Of Regents Of The Nevada System Of Higher Education On Behalf Of The University Of Nevada, Reno | Chemical sensor with oscillating cantilevered probe and mechanical stop |
-
2003
- 2003-11-12 KR KR1020030079898A patent/KR100552696B1/en not_active Expired - Fee Related
-
2004
- 2004-10-26 JP JP2004311053A patent/JP4155960B2/en not_active Expired - Fee Related
- 2004-10-27 US US10/974,455 patent/US7331231B2/en not_active Expired - Fee Related
- 2004-11-03 EP EP04026084.6A patent/EP1533611B1/en not_active Expired - Lifetime
- 2004-11-11 CN CNA2004100946594A patent/CN1616947A/en active Pending
Also Published As
| Publication number | Publication date |
|---|---|
| US20050097962A1 (en) | 2005-05-12 |
| EP1533611A1 (en) | 2005-05-25 |
| CN1616947A (en) | 2005-05-18 |
| KR20050045728A (en) | 2005-05-17 |
| KR100552696B1 (en) | 2006-02-20 |
| US7331231B2 (en) | 2008-02-19 |
| JP4155960B2 (en) | 2008-09-24 |
| JP2005148062A (en) | 2005-06-09 |
Similar Documents
| Publication | Publication Date | Title |
|---|---|---|
| US7331231B2 (en) | Apparatus and method for measuring micro mass using oscillation circuit | |
| JP4388614B2 (en) | Sensor for measuring the viscosity and density of a medium | |
| US9038443B1 (en) | Microfabricated resonant fluid density and viscosity sensor | |
| US5684276A (en) | Micromechanical oscillating mass balance | |
| US8349611B2 (en) | Resonant sensors and methods of use thereof for the determination of analytes | |
| Park et al. | Capacitive micromachined ultrasonic transducer (CMUT) as a chemical sensor for DMMP detection | |
| US8329452B2 (en) | Active NEMS arrays for biochemical analyses | |
| EP1007914A1 (en) | Resonator sensors employing piezoelectric benders for fluid property sensing | |
| US6595058B2 (en) | Method and apparatus for determining dynamic response of microstructure by using pulsed broad bandwidth ultrasonic transducer as BAW hammer | |
| Buser et al. | Resonant silicon structures | |
| US20030042907A1 (en) | Sensor for non-contacting electrostatic detector | |
| US6573725B2 (en) | Sensor for non-contacting electrostatic detector | |
| KR100328532B1 (en) | Angular velocity detector | |
| Weinberg et al. | Modeling flexural plate wave devices | |
| US9032795B2 (en) | MEMS resonator, sensor having the same and manufacturing method for MEMS resonator | |
| US20100095774A1 (en) | Mass measuring device and cantilever | |
| JP3908713B2 (en) | Cantilever with force direction sensor for atomic force microscope | |
| JPH10185787A (en) | Fatigue test equipment | |
| US20150143911A1 (en) | Physical/chemical sensor and method for measuring specific substance | |
| US20240418624A1 (en) | System and method for measuring at least one property of a particle using a mechanically coupled mechanical resonator and gravimetric sensor | |
| JP3603447B2 (en) | Flow measurement device | |
| WO2001061312A1 (en) | Method of determining viscosity | |
| US20260009711A1 (en) | Mechanical resonator for use in a system for measuring a property of a particle | |
| White et al. | Excitation of thick-film resonant sensor structures | |
| Kazinczi et al. | 3-D resonator bridges as sensing elements |
Legal Events
| Date | Code | Title | Description |
|---|---|---|---|
| PUAI | Public reference made under article 153(3) epc to a published international application that has entered the european phase |
Free format text: ORIGINAL CODE: 0009012 |
|
| 17P | Request for examination filed |
Effective date: 20041103 |
|
| AK | Designated contracting states |
Kind code of ref document: A1 Designated state(s): AT BE BG CH CY CZ DE DK EE ES FI FR GB GR HU IE IS IT LI LU MC NL PL PT RO SE SI SK TR |
|
| AX | Request for extension of the european patent |
Extension state: AL HR LT LV MK YU |
|
| AKX | Designation fees paid |
Designated state(s): DE FR GB |
|
| 17Q | First examination report despatched |
Effective date: 20120713 |
|
| RAP1 | Party data changed (applicant data changed or rights of an application transferred) |
Owner name: SAMSUNG ELECTRONICS CO., LTD. |
|
| GRAP | Despatch of communication of intention to grant a patent |
Free format text: ORIGINAL CODE: EPIDOSNIGR1 |
|
| INTG | Intention to grant announced |
Effective date: 20140715 |
|
| GRAS | Grant fee paid |
Free format text: ORIGINAL CODE: EPIDOSNIGR3 |
|
| GRAA | (expected) grant |
Free format text: ORIGINAL CODE: 0009210 |
|
| AK | Designated contracting states |
Kind code of ref document: B1 Designated state(s): DE FR GB |
|
| REG | Reference to a national code |
Ref country code: GB Ref legal event code: FG4D |
|
| REG | Reference to a national code |
Ref country code: DE Ref legal event code: R082 Ref document number: 602004046454 Country of ref document: DE Representative=s name: GRUENECKER, KINKELDEY, STOCKMAIR & SCHWANHAEUS, DE Ref country code: DE Ref legal event code: R082 Ref document number: 602004046454 Country of ref document: DE Representative=s name: GRUENECKER PATENT- UND RECHTSANWAELTE PARTG MB, DE |
|
| REG | Reference to a national code |
Ref country code: DE Ref legal event code: R096 Ref document number: 602004046454 Country of ref document: DE Effective date: 20150219 |
|
| REG | Reference to a national code |
Ref country code: DE Ref legal event code: R097 Ref document number: 602004046454 Country of ref document: DE |
|
| PLBE | No opposition filed within time limit |
Free format text: ORIGINAL CODE: 0009261 |
|
| STAA | Information on the status of an ep patent application or granted ep patent |
Free format text: STATUS: NO OPPOSITION FILED WITHIN TIME LIMIT |
|
| 26N | No opposition filed |
Effective date: 20151008 |
|
| REG | Reference to a national code |
Ref country code: FR Ref legal event code: ST Effective date: 20160729 |
|
| PG25 | Lapsed in a contracting state [announced via postgrant information from national office to epo] |
Ref country code: FR Free format text: LAPSE BECAUSE OF NON-PAYMENT OF DUE FEES Effective date: 20151130 |
|
| PGFP | Annual fee paid to national office [announced via postgrant information from national office to epo] |
Ref country code: DE Payment date: 20181022 Year of fee payment: 15 |
|
| PGFP | Annual fee paid to national office [announced via postgrant information from national office to epo] |
Ref country code: GB Payment date: 20181023 Year of fee payment: 15 |
|
| REG | Reference to a national code |
Ref country code: DE Ref legal event code: R119 Ref document number: 602004046454 Country of ref document: DE |
|
| GBPC | Gb: european patent ceased through non-payment of renewal fee |
Effective date: 20191103 |
|
| PG25 | Lapsed in a contracting state [announced via postgrant information from national office to epo] |
Ref country code: DE Free format text: LAPSE BECAUSE OF NON-PAYMENT OF DUE FEES Effective date: 20200603 Ref country code: GB Free format text: LAPSE BECAUSE OF NON-PAYMENT OF DUE FEES Effective date: 20191103 |