EP1530033A1 - System for measuring chromaticity in visible and invisible regions - Google Patents
System for measuring chromaticity in visible and invisible regions Download PDFInfo
- Publication number
- EP1530033A1 EP1530033A1 EP03784482A EP03784482A EP1530033A1 EP 1530033 A1 EP1530033 A1 EP 1530033A1 EP 03784482 A EP03784482 A EP 03784482A EP 03784482 A EP03784482 A EP 03784482A EP 1530033 A1 EP1530033 A1 EP 1530033A1
- Authority
- EP
- European Patent Office
- Prior art keywords
- image
- color
- pseudo color
- color image
- visible
- Prior art date
- Legal status (The legal status is an assumption and is not a legal conclusion. Google has not performed a legal analysis and makes no representation as to the accuracy of the status listed.)
- Withdrawn
Links
Images












Classifications
-
- H—ELECTRICITY
- H04—ELECTRIC COMMUNICATION TECHNIQUE
- H04N—PICTORIAL COMMUNICATION, e.g. TELEVISION
- H04N1/00—Scanning, transmission or reproduction of documents or the like, e.g. facsimile transmission; Details thereof
- H04N1/46—Colour picture communication systems
- H04N1/56—Processing of colour picture signals
- H04N1/60—Colour correction or control
-
- G—PHYSICS
- G01—MEASURING; TESTING
- G01J—MEASUREMENT OF INTENSITY, VELOCITY, SPECTRAL CONTENT, POLARISATION, PHASE OR PULSE CHARACTERISTICS OF INFRARED, VISIBLE OR ULTRAVIOLET LIGHT; COLORIMETRY; RADIATION PYROMETRY
- G01J3/00—Spectrometry; Spectrophotometry; Monochromators; Measuring colours
- G01J3/28—Investigating the spectrum
- G01J3/2823—Imaging spectrometer
-
- G—PHYSICS
- G01—MEASURING; TESTING
- G01J—MEASUREMENT OF INTENSITY, VELOCITY, SPECTRAL CONTENT, POLARISATION, PHASE OR PULSE CHARACTERISTICS OF INFRARED, VISIBLE OR ULTRAVIOLET LIGHT; COLORIMETRY; RADIATION PYROMETRY
- G01J3/00—Spectrometry; Spectrophotometry; Monochromators; Measuring colours
- G01J3/28—Investigating the spectrum
- G01J3/30—Measuring the intensity of spectral lines directly on the spectrum itself
- G01J3/36—Investigating two or more bands of a spectrum by separate detectors
-
- G—PHYSICS
- G01—MEASURING; TESTING
- G01J—MEASUREMENT OF INTENSITY, VELOCITY, SPECTRAL CONTENT, POLARISATION, PHASE OR PULSE CHARACTERISTICS OF INFRARED, VISIBLE OR ULTRAVIOLET LIGHT; COLORIMETRY; RADIATION PYROMETRY
- G01J3/00—Spectrometry; Spectrophotometry; Monochromators; Measuring colours
- G01J3/46—Measurement of colour; Colour measuring devices, e.g. colorimeters
-
- G—PHYSICS
- G01—MEASURING; TESTING
- G01J—MEASUREMENT OF INTENSITY, VELOCITY, SPECTRAL CONTENT, POLARISATION, PHASE OR PULSE CHARACTERISTICS OF INFRARED, VISIBLE OR ULTRAVIOLET LIGHT; COLORIMETRY; RADIATION PYROMETRY
- G01J3/00—Spectrometry; Spectrophotometry; Monochromators; Measuring colours
- G01J3/46—Measurement of colour; Colour measuring devices, e.g. colorimeters
- G01J3/465—Measurement of colour; Colour measuring devices, e.g. colorimeters taking into account the colour perception of the eye; using tristimulus detection
Definitions
- This invention relates to a system enabling the measurement of chromaticity (chromatic value and color specification value) in the visible and invisible ranges.
- An image of invisible light for example, ultraviolet light of wavelengths in the range of 200nm to 400nm or near-infrared light of wavelengths in the range of 700nm to 2200nm
- visible light light of wavelengths in the range of 400 to 700nm
- extremely useful information concerning the physical state or chemical state of the subject that cannot be recognized by the human eye for example, information concerning the state of decomposition of a food, etc.
- an invisible light image is normally a black-and-white image that cannot be visually recognized readily by a human
- an image processing method which enables the luminance information to be discriminated readily by pseudo color display, is employed.
- an image processing method in which the optical spectrum of all of the emitted light including the invisible light emitted from a subject is partitioned into a plurality of wavelength ranges, and then coloring is performed by assigning specific colors, which are visually recognizable by humans and are not isochromatic with respect to each other (for example, the three colors of red, green, and blue), to the partitioned ranges, respectively, thereby generating a pseudo color display image.
- This method applies the human eye characteristic that differences in image information can be recognized more readily with a color image than with a black-and-white image.
- the color image pickup device disclosed in Japanese Patent Application Laid-Open No. H6-121325 can be cited.
- color values chromatic value and color specification value
- color standard characteristics color matching function
- the information desired to be acquired from a subject sample is information concerning physical state or chemical state differences to be observed, which exist between a subject sample and a standard sample representing a subject set to which the subject sample belongs, and differences that can be discriminated optically.
- Examples of the above-mentioned physical state differences between a standard sample and a subject sample include differences due to the existence of a structure, such as in cases where a structure that does not exist in a standard sample exists in a subject sample, differences due to the existence of shape characteristics, such as in cases where a shape characteristic that is normally found in a standard sample is not found in a subject sample, and the like.
- Examples of the above-mentioned chemical state differences between a standard sample and a subject sample include differences due to the existence of a concentration distribution region of a specific chemical substance, such as in cases where the subject sample has a region in which a chemical substance, which exists only within a certain concentration range in a standard sample, exists at a high concentration that exceeds the above-mentioned range, and the like.
- This invention has been made in view of the above problems, and an object thereof is to provide a system enabling chromaticity measurement in the visible and invisible ranges that adequately enables the information desired to be acquired from a subject sample to be adequately evaluated quantitatively by use of color values of the invisible range and color display of a pseudo color image.
- color values chromatic value and color specification value
- color standard characteristic color matching functions
- the information desired to be acquired from a subject sample is information concerning physical state or chemical state differences to be observed, which exist between a subject sample and a standard sample representing a subject set to which the subject sample belongs, and differences that can be discriminated optically.
- Examples of the above-mentioned physical state differences between a standard sample and a subject sample include differences due to the existence of a structure, such as in cases where a structure that does not exist in a standard sample exists in a subject sample, differences due to the existence of shape characteristics, such as in cases where a shape characteristic that is normally found in a standard sample is not found in a subject sample, and the like.
- Examples of the above-mentioned chemical state differences between a standard sample and a subject sample include differences due to the existence of a concentration distribution region of a specific chemical substance, such as in cases where the subject sample has a region in which a chemical substance, which exists only within a certain concentration range in a standard sample, exists at a high concentration that exceeds the above-mentioned range, and the like.
- This invention has been made in view of the above problems, and an object thereof is to provide a system enabling chromaticity measurement in the visible and invisible ranges that adequately enables the information desired to be acquired from a subject sample to be adequately evaluated quantitatively by use of color values of the invisible range and color display of a pseudo color image.
- the present inventors have found a major factor by which the information desired to be acquired from a subject sample has not being able to be adequately evaluated quantitatively with the above-described conventional image pickup system.
- the major factor is that the standards for partitioning an optical spectrum of emitted light of all wavelength ranges (ranges including invisible ranges) emitted from a subject sample into a plurality of wavelength ranges are not determined in adequate association with the information desired to be acquired from the subject sample.
- the present inventors found another major factor by which the information desired to be acquired from a subject sample has not been able to be adequately evaluated quantitatively with the conventional image pickup system.
- the major factor is that the coloration standard (the standard for determining the sensitivity function to be used) for performing coloration by allocating specific colors to (applying sensitivity function such as color matching function to) the respective wavelength ranges obtained by partitioning the above-mentioned emitted light spectrum into a plurality of wavelength ranges is also not determined in adequate association with the information desired to be acquired from the subject sample in the conventional image pickup system.
- the present inventors found that, by determining the standard for partitioning an optical spectrum of emitted light emitted from a subject sample into a plurality of wavelength ranges, and the standard for determining the sensitivity functions to be used, in adequate association with the information desired to be acquired from the subject sample, a method used for a color specification system for carrying out color display of a color image of visible light can be applied to a pseudo color image.
- the present inventors thereby found that the color information of a pseudo color image can be quantified numerically as relative values with respect to specific standard associated with the information desired to be acquired from a subject sample and have thereby arrived at the present invention.
- this invention provides a system enabling chromaticity measurement in the visible and invisible range, comprising at least: a spectroscopic optical part for receiving emitted light of all wavelength ranges emitted from a subject sample and spectrally separating the above-mentioned emitted light into three or more component lights having mutually different central wavelengths; a photoelectric conversion part for photoelectrically converting the three or more component lights, respectively, and generating three or more electric signals, respectively, corresponding to the three or more component lights; an image processing part for processing the three or more electric signals to generate a pseudo color image of the sample and compute a numerical value defined based on a color specification system for performing color display of the pseudo color image; and an image outputting part for outputting the pseudo color image and/or the numerical value, wherein the image processing part comprises at least: image signal generation processing means for generating three or more basic pseudo color image signals by applying three or more sensitivity functions independently to all of the three or more electric signals; vector conversion processing means for generating the three or more pseudo color image
- a subject of the same type as a subject sample in a subject set to which the subject sample belongs refers to a subject belonging to the same category as the subject sample that is subject to measurement.
- the “category” is determined in accordance with whether or not there exists an optically discriminable difference between the optical spectra obtained, respectively, from a standard sample and the subject sample in terms of obtaining the information desired to be acquired from the subject sample. If the above difference exists, the subjects can be deemed as belonging to the same category.
- the subject sample is a specific variety of apple
- whether the category should be limited down to this specific variety or should not be limited down to the specific variety but be defined as “apple” or as “fruit” may be determined in accordance with the information desired to be acquired from the subject sample.
- three or more sensitivity functions are determined based on the correlation between the physical state or chemical state differences to be observed that occur among respective subjects constituting the subject set to which the subject sample belongs, and the differences in waveform occurring among the optical spectra of the respective subjects constituting the subject set.
- the signals which are obtained by applying three or more sensitivity functions, respectively, and independently to the electrical signals obtained by photoelectric conversion of the optical spectrum measured from the subject sample belonging to the subject set, are thus closely associated with the information desired to be acquired from the subject sample.
- the color information constituting the pseudo color image obtained finally is thus closely associated with the information desired to be acquired from the subject sample.
- the color information of the pseudo color image obtained finally can be quantified numerically by a method used in a color specification system for carrying out color display of visible light color images, the numerically quantified color information of the pseudo color information are closely associated with the information desired to be acquired from the subject sample. Consequently, with the present invention, the information desired to be acquired from a subject sample can be adequately evaluated quantitatively using the color display of the pseudo color image.
- the information desired to be acquired from a subject sample can be ascertained accurately in the form of numerical values defined based on the color specification system.
- This invention also provides a system enabling chromaticity measurement in the visible and invisible range, comprising at least: a spectroscopic optical part for receiving emitted light of all wavelength ranges emitted from a subject sample and spectrally separating the above-mentioned emitted light into three or more component lights having mutually different central wavelengths; wavelength conversion optical parts which are provided, respectively, for each of said three or more component lights and generates three or more pseudo color component lights corresponding to the three or more component lights respectively by performing wavelength conversion of each of the three or more component lights and thereby optically applying sensitivity functions to each of the three or more component lights; a photoelectric conversion part for photoelectrically converting the three or more pseudo color component lights respectively and thereby generating three or more basic pseudo color image signals respectively corresponding to the three or more pseudo color component lights; an image processing part for processing the three or more basic pseudo color image signals to generate a pseudo color image of the sample and calculate a numerical value defined based on a color specification system for performing color display of the pseudo color image; and
- the information desired to be acquired from a subject sample can be adequately evaluated quantitatively using the color display of the pseudo color image as in the case of the formerly described system enabling chromaticity measurement in the visible and invisible ranges having an arrangement in which sensitivity functions are applied by numerical calculation.
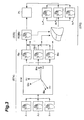
- Fig. 1 is an explanatory diagram showing the basic configuration of a first embodiment of a system enabling chromaticity measurement in the visible and invisible ranges of the present invention.
- the system 1 enabling chromaticity measurement in the visible and invisible ranges of the first embodiment comprises a camera part 2, an image processing part 4, and a monitor 5 and a printer 6, which serve as image outputting parts.
- the camera part 2 has a spectroscopic optical part 2a, a photoelectric conversion part 2b, and an A/D conversion part 2c.
- a preprocessing part 4a of the image processing part 4, to be described later, may be integrated to the camera part 2.
- the spectroscopic optical part 2a receives emitted light L1 of all wavelength ranges emitted from a subject sample and spectrally separates this emitted light into three or more component lights having central wavelengths that differ from each other.
- this spectroscopic optical part 2a is not limited as long as it has an arrangement enabling the generation of the above-mentioned three or more component lights having central wavelengths that differ from each other, it is preferable that the spectroscopic optical part 2a has an arrangement enabling spectral separation into 16 or more component lights in the case where a spectroscopic process is to be applied because the sensitivity characteristics can be reset by use of sensitivity functions described below.
- interference filters and an optical fiber plate are especially preferable.
- the use of the interference filters and optical fiber plate is described for cases of handling mainly visible colors, in the application to spectroscopic optical part 2a of the present embodiment, there is a difference in that the interference filters and the optical fiber plate are to provided not just for the visible range but for the entire wavelength range of electromagnetic waves.
- a spectroscopic filter in which at least 16 interference filters are arranged as a set and a plurality of such sets are arrayed two-dimensionally, and an optical fiber plate being formed by integrating a plurality of optical waveguides which are optically coupled respectively and independently to the interference filters, are preferable.
- the photoelectric conversion part 2b performs respective photoelectric conversion of the three or more component lights generated by the spectroscopic optical part 2a and generates three or more electrical signals respectively corresponding to the three or more component lights. More specifically, the photoelectric conversion part 2b comprises, for example, a plurality of light receiving elements (not shown) which are optically coupled respectively and independently to the respective light emitting ends of the optical waveguides of the optical fiber plate.
- each of the above-mentioned light receiving elements is arranged as a set comprising a photoelectric transducer (not shown), which generates charges in accordance with the input light intensity, and a switch element (not shown), which is connected to a signal output terminal of the photoelectric transducer and outputs the charges accumulated in the photoelectric transducer in response to a scan signal from the image processing part.
- the spectroscopic image sensor described in Japanese Patent Publication No. 2713838 is preferable.
- This spectroscopic imaging sensor has an arrangement in which the A/D conversion part 2c and preprocessing part 4a are integrated.
- the A/D conversion part 2c has an amp (not shown), equipped with an integrating circuit which converts the charges (current signals) output from the respective light receiving elements into voltage signals individually, and an A/D converter (not shown), converting the voltage signals (analog values) output from the amp into digital values and outputting the digital values.
- the camera part 2 may have the arrangement equipped in a so-called single-plate, three-plate, or four-plate type camera.
- the spectroscopic optical part 2a has the same arrangement as that of a normal camera that receives emitted light L1 of all wavelength ranges emitted from a subject sample and performs spectral separation, for example, into three or more (or four or more) component lights having mutually different central wavelengths.
- the aforementioned camera part 2 having the spectroscopic imaging type arrangement is suited for the case of use for the purpose of sampling narrow bands and observing fine spectral characteristics
- the present camera 2 with the arrangement of a so-called single-plate, three-plate, or four-plate type camera is suited for the case of use of sampling and observing images of wider band characteristics (for example, with half-width values of no less than 80nm).
- the preprocessing part 4a which shall be described later and is provided for the purpose of applying sensitivity functions, is eliminated and the data are sent directly to the main unit part 4b of the image processing part 4.
- the camera part 2 with an arrangement in which interference filters are arranged on a turret and rotated to take in bandpass images successively such as a "two-dimensional colorimetry system" which is described in Color Forum Japan 95, pp. 91-94, may be equipped.
- Monitor 5 and printer 6 which serve as image outputting parts, respectively, output pseudo color images formed by image processing part 4, and/or numerical values defined based on a color specification system. Furthermore, monitor 5 and printer 6 are, respectively, equipped with a D/A converter (not shown) for generating analog signals by D/A conversion of signals based on numerical values for the color display of basic pseudo color image signals (referred to as "raw invisible color images (signals)” in the description of operations given below) and pseudo color image signals (referred to as "basic invisible color images (signals)” in the description of operations given below), which are generated by the image processing part 4 to be described below, and sending these analog signals to monitor 5 and/or printer 6.
- the camera part 2 and image processing part 4 may be integrated as a unit or may be separated and the form thereof is not limited.
- the image processing part 4 is mainly comprised of the preprocessing part 4a which executes a preprocess of applying sensitivity functions to the three or more digital signals (three or more electric signals) output from camera part 2, and the main unit part 4b which executes process subsequent the preprocess.
- the image processing part 4 is also equipped with a central control unit (not shown) for controlling preprocessing part 4a and main unit part 4b, generating a pseudo color image by processing and converting the three or more digital signals output from camera part 2 into pseudo color image signals, and computing numerical values that are defined based on the color specification system for performing color display of the pseudo color image.
- This central control unit has a CPU, a ROM, and a RAM (none of which are shown).
- the CPU of the central control unit comprises a microprocessor, etc., and performs the various computing processes (image signal generation process (preprocess), vector conversion process, image forming process, color specification process, process for determining sensitivity functions, process for determining a matrix M, and control of the entire system enabling chromaticity measurement in the visible and invisible range) to be described below.
- Programs for the various processes mentioned above are stored in advance in the ROM of the central control unit, and the RAM is used for reading and writing various data in the control and computation processes.
- the central control unit furthermore has input/output ports (not shown), which are connected to the CPU.
- Various components of the camera part 2 are electrically connected to these input/output ports via control circuits for controlling the various components.
- the monitor 5 and printer 6 are also connected independently to the input/output ports via control circuits that control the D/A converters.
- the camera part 2, monitor 5, and printer 6 are thus provided, via the input/output ports, with various signals, etc., that are generated by the computing processes of the CPU.
- the central control unit also has a storage device (not shown), and this storage device is connected via the input/output ports to the CPU.
- the CPU controls the various processes of the system 1 enabling chromaticity measurement in the visible and invisible ranges by accessing the storage device and using, as necessary, data, such as those described below, which are stored in the storage device.
- this storage device stores data for generating, in the image signal generation process to be described below, three or more basic pseudo color image signals by application, in the preprocess at preprocessing part 4a, of three or more sensitivity functions independently to all of the three or more digital signals (three or more electric signals) output from camera part 2.
- stored in the storage device are data for generating, in the vector conversion process to be described below, three or more pseudo color image signals by vector conversion by application of matrix M to the three or more basic pseudo color image signals that are output after the image signal generation process.
- stored in the storage device are data for generating, in the image forming process to be described below, a pseudo color image by synthesis of the three or more pseudo color image signals output by the vector conversion process.
- stored in the storage device are data for computing, in the color specification process to be described below, the numerical values, defined based on the color specification system, by carrying out a numerical calculation process using the three or more pseudo color image signals output from the vector conversion process.
- stored in the storage device are data for determining, in the process for determining the sensitivity functions to be described below, the three or more sensitivity functions based on a correlation between physical state or chemical state differences to be observed that occur between a standard sample, which represents a sample set, and the subject sample and differences between the standard waveform of an optical spectrum of the standard sample and the waveform of an optical spectrum of the sample.
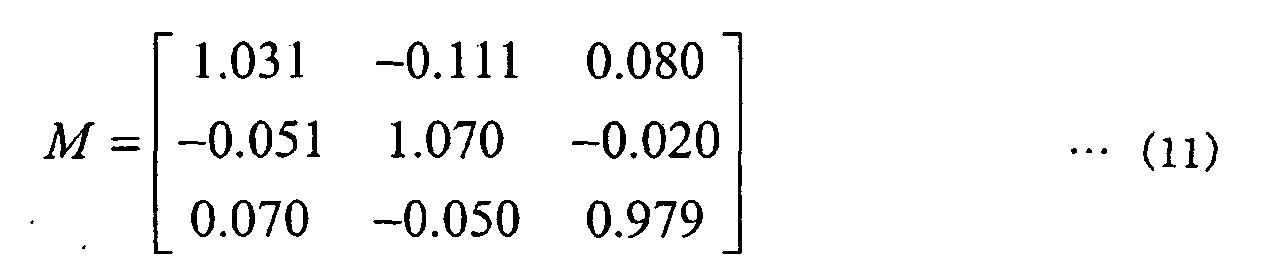
- stored in the storage device are data for determining the matrix M, in the matrix M determining process to be described below, so that it reduces the color reproduction errors that occur in the process of generating the three or more pseudo color image signals and approaches optical characteristics.
- the main power supply (not shown) of the system 1 enabling chromaticity measurement in the visible and invisible range is turned ON to activate the image processing part 4.
- the CPU of the central control unit of the image processing part 4 then outputs drive signals to the camera part 2, monitor 5, and printer 6.
- the camera part 2 may be arranged as a separate unit
- the image processing part 4 may be arranged from a normal, commercially-available personal computer, software for controlling the above-mentioned calculation and processing functions of this invention, and additional hardware, and commercially available units may be used as the monitor 5 and printer 6.
- the "basic pseudo color image signals” will be referred to as “raw invisible color images (signals).” Also, the “pseudo color image signals” will be referred to as “basic invisible color images (signals).”
- emitted light L1 of all wavelength ranges emitted from the subject sample 10 is received by the spectroscopic optical part 2a.
- An entire image P 0 or a partial region E1 of the subject sample 10 may be received as the image received at this point.
- a continuous emission spectrum ⁇ 0 S0 of the received image is decomposed into n (n ⁇ 3) component lights having mutually different central wavelengths, ⁇ 0 S1 , ⁇ 0 S2 , ... ⁇ 0 Sn , by means of n (n ⁇ 3) optical filters (ST1).
- emitted light L1 is not limited in particular and, for example, may be transmitted light that has been transmitted through the subject sample 10 or reflected light from the subject sample 10.
- the n component lights having mutually different central wavelengths ⁇ 0 S1 , ⁇ 0 S2 , ... ⁇ 0 Sn are, respectively, converted photoelectrically and converted, via A/D conversion part 2c, into n (n ⁇ 3) digitized bandpass images (signals) ⁇ S1 , ⁇ S2 , ... ⁇ Sn , corresponding to the n component lights (ST2).
- the n (n ⁇ 3) bandpass images signals ⁇ S1 , ⁇ S2 , ... ⁇ Sn are then input into and processed at the image processing part 4.
- the image signal generation process preprocess
- three sensitivity functions ⁇ 0 1 , ⁇ 0 2 , and ⁇ 0 3 which are determined in advance in accordance with the information desired to be acquired from the subject sample, are applied independently to all of the n (n ⁇ 3) bandpass images (signals) ⁇ S1 , ⁇ S2 , ... ⁇ Sn to form three raw invisible color images (signals) ⁇ 1 , ⁇ 2 , and ⁇ 3 (ST3).
- the number of sensitivity functions used is not restricted in particular as long as it is no less than three, and an optimal number may be determined in accordance with the information desired to be acquired from the subject in the process of determining the sensitivity functions to be described below.
- the vector conversion process is applied to the three raw invisible color images (signals) ⁇ 1 , ⁇ 2 , and ⁇ 3 and three basic invisible color images (signals) R iv , G iv , and B iv are thereby formed (ST4). That is, the three basic invisible color images (signals) R iv , G iv , and B iv are formed by applying the matrix M to the three raw invisible color images (signals) ⁇ 1 , ⁇ 2 , and ⁇ 3 as shown in Equation (1) below.
- vector conversion is applied the intensities of all pixels of the three raw invisible color images (signals) ⁇ 1 , ⁇ 2 , and ⁇ 3 to generate the basic invisible color images (signals) R iv , G iv , and B iv .
- R iv G iv B iv ] [ ⁇ 1 ⁇ 2 ⁇ 3 ]M
- this process is carried out in order to determine the sensitivity functions for the entire processing system by determining the sensitivity functions (ideal sensitivity characteristics), which will be described below, by use of the camera part 2 (or a spectroscope having another arrangement) having a spectroscopic imaging sensor type arrangement or the like, and thereafter using these sensitivity functions (ideal sensitivity characteristics) in (ST3).
- the optical characteristics thereof are determined using the determined sensitivity functions
- only positive-only sensitivity characteristics can be prepared in this case by the determination of the sensitivity functions by the optical filters.
- the obtained optimal sensitivity functions contain negative parts
- conversion from the positive-only sensitivity functions to sensitivity functions containing negative parts must be carried out.
- the vector conversion process using matrix M is used for the conversion.
- the matrix M which is used in the vector conversion process, is preferably determined as follows. That is, when the optimal sensitivity functions (ideal sensitivity characteristics) have been determined as shall be described below, the M can be applied to the sensitivity characteristics, having only positive characteristics, so as to match the optimal sensitivity characteristics and thereby approach the optimal sensitivity characteristics.
- This vector conversion process is second carried out for the following purpose. That is, the process is carried out to perform color correction so that when the invisible image is viewed with the human eyes, the pseudo color image will be acceptable psychologically and mentally.
- Matrix M is a 3 * 3 matrix (3-row by 3-column) matrix, and for example, when matrix M is a unit matrix, no conversion is carried out and the input values and the output values after conversion will be of exactly the same intensity ratios.
- the pseudo color image RGB iv is then synthesized from basic invisible color images (signals) R iv , G iv , and B iv by the image forming process (ST5).
- the pseudo color image RGB iv can be assigned to respective conventional light emitters of RGB and can be displayed on the display of the monitor 5. Though the basic invisible color images (signals) and the pseudo color image are normally in a one-to-one correspondence, adjustment may be necessary depending on the type of the light emitters of the display of the monitor 5.
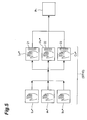
- pseudo absorption color images (signals), based on absorbance may be determined for the basic invisible color images (signals) R iv , G iv , and B iv as shown in Fig. 4 (ST7) and these may be used to form a pseudo absorption color image, based on absorbance (ST8).
- the invisible absorption color images (signals) based on absorbance are expressed as "-logR iv ,” “-logG iv ,” and "-logB iv .” By synthesizing these, a pseudo color absorption image RGB iv ⁇ , based on absorbance, can be displayed.
- the invisible absorption color images (signals) based on absorbance may expressed as “(1 - R iv ) 2 /2R iv ,” “(1 - G iv ) 2 /2G iv ,” and “(1 - B iv ) 2 /2B iv ,” using functions, such as the Kubelka Munk functions, etc., that express absorbance with scattering being taken into consideration (not shown).
- Displays using these invisible absorption color images (signals) based on absorbance and the pseudo absorption color image based on absorbance are effective in that the degree of absorption can be displayed as an intensity parameter, for example, in a case where an image of a sample (for example, chlorophyll in plants), having a specific absorption band within a certain wavelength band, is taken.
- the color specification process is performed in parallel to this image forming process (ST6). That is, numerical values, defined based on a color specification system for performing a color display, are calculated.
- This color specification process is a process for the purpose that process, which is carried out as a color process in the visible light range, is applied to the basic invisible color images (signals) R iv , G iv , and B iv or pseudo color image RGB iv , which is the synthetic image of these images, to determine numerical values on a color solid of the basic invisible color images (signals) R iv , G iv , and B iv or pseudo color image RGB iv , which contain or contains invisible information.
- the basic invisible color images (signals) R iv , G iv , and B iv or pseudo color image RGB iv which contain or contains invisible information, are or is used in place of a color image containing only visible information to express and evaluate the basic invisible color images (signals) R iv , G iv , and B iv as numerical values on the coordinates of the color solid arranged from lightness, saturation, and hue, which is close to human sense.
- L*a*b* color specification system which is a basic color conversion
- L*a*b* color specification system which is a basic color conversion
- the input values of an image are X, Y, and Z, and 100% reflectance, 100% transmittance, or the energy value of 100% is expressed by Xn, Yn, and Zn (factors that differ according to the light source characteristics)
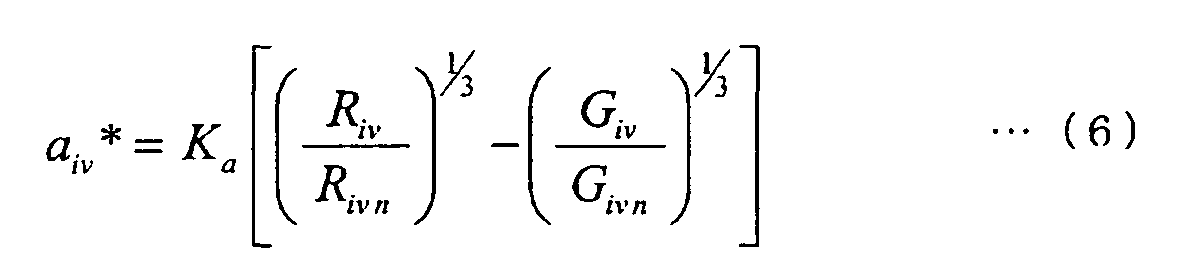
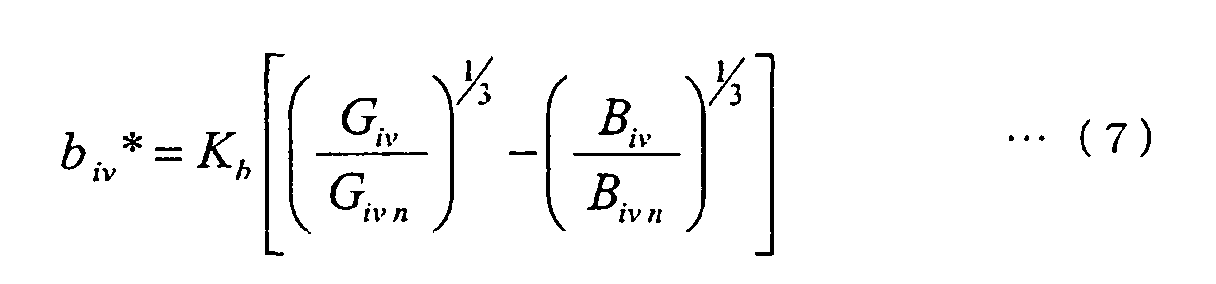
- L*, a*, and b* can be expressed by the following Equations (2) to (4).
- Equations (2) to (4) are effective only in the case of color display in L*a*b* space (only in regard to images in the visible range) and will be meaningless coefficients when, for example, the wavelength range of measurement is an invisible range, such as the near infrared range, etc.
- L* iv , a* iv , and b* iv are defined and used as numerical values on a color solid of the basic invisible color images (signals) R iv , G iv , and B iv or pseudo color image RGB iv , which contain or contains invisible information.
- R ivn indicates the value representing the pseudo color, red.
- G ivn indicates the value representing the pseudo color, green.
- B ivn indicates the value representing the pseudo color, blue.
- Kl, Ka, and Kb indicate constants.
- Kl, Ka, and Kb may be determined, respectively, in accordance with human sensation and regardless of the subject and thus consequently, may normally be the same as the factors for the visible range.
- examination of a higher level that is, a color specification system which has correlation with the sensitivity functions may be considered and examinations may be carried out without considering that a human will view the final image.
- the above-mentioned constants may be determined in accordance with the sensitivity functions.
- the power factor is set to 1/3 and made the same as Equations (2) to (4) since the relationship between luminance (a physical quantity) and lightness (a human psychophysical quantity) of object colors can be expressed by this power factor in substantially all cases in the visible range. Also, The principal method of use of this invention's system is to observe an invisible object while showing it on a display and displaying and recording the color values, and a visible-range color relationship exists between the displayed pseudo colors and the human eyes. Therefore, the present inventors considered that the use of a power factor of 1/3 as it is to be effective.
- the present inventors also consider that the above-mentioned power factor can be used in expressing the relationship between luminance (a physical quantity) and lightness (a human psychophysical quantity) of object colors.
- the present inventors also consider the use of the above-mentioned power factor to be effective in cases where sensation indices (sensation functions) of animals besides humans or sensation indices (sensation functions) of an inorganic form are handled.
- the invisible absorption color images (signals) based on absorption are determined and these are used to form a pseudo color image based on absorption in the image forming process as was described above using Fig. 4, the invisible absorption color images (signals) based on absorption (for example, -logR iv , -logG iv , and -logB iv ) or the pseudo absorption color image RGB iv ⁇ based on absorption may be used in place of R iv , G iv , and B iv or RGB iv (ST9).
- L iv *, a iv *, and b iv * expressed by Equations (5) to (7) may be used to calculate numerical values H iv 0 and C iv *, defined by the following Equations (8) and (9) and these may be used along with L iv * as another set of numerical values on the color solid of the pseudo color image RGB iv as shown in Fig. 5 (ST10). That is, expression in terms of L iv * (lightness), H iv * (hue), and C iv * (saturation) is also possible. Also, in place of C iv * (saturation), a numerical value S iv *, defined by the following Equation (10) may be used as the saturation.
- L iv * (lightness) indicates the lightness in a principal central wavelength region
- C iv * (saturation) indicates how much an arbitrary wavelength component intensity protrudes characteristically with respect to a gray line (that is, the average lightness line of R iv , G iv , and B iv )
- H iv * (hue) indicates the direction of inclination, among all directions, expressed by the three energies.
- this signifies the hue, such as red, orange, yellow, green, blue, indigo, and purple, and the same applies in the invisible range.
- L iv * lightness
- H iv * high intensity
- C iv * saturatedation
- pseudo color bars 21, 22, and 23 which indicate the density information of any value of L iv *, H iv *, and C iv * may furthermore be displayed (see Fig. 13).
- the image P1 which is output to the monitor 5 and/or printer 6, shall now be described.
- the image P1 in addition to the above-mentioned pseudo color image RGB iv or RGB iv ⁇ , various optical spectra of the subject, a table of the numerical data of L iv *, a iv *, b iv *, H iv *, C iv *, r iv , g iv , etc., two-dimensional or three-dimensional graphs of the numerical data of L iv *, a iv *, b iv *, H iv *, C iv *, r iv , g iv , etc., may be displayed suitably in combination.
- the pseudo color image RGB iv or RGB iv ⁇ an entire image of the subject and an image of a partial region may be displayed independently of each other.
- a normal visible light image may be displayed in combination with a pseudo color image.
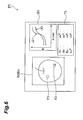
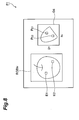
- the pseudo color image RGB iv As an example of the image P1 to be output to the monitor 5 and/or printer 6, the pseudo color image RGB iv , an optical spectrum graph G1 showing profiles LE1 and LE2 of reflectance R at partial regions E1 and E2 of the subject, and a table T1 of the numerical data of L iv *, a iv *, b iv *, H iv *, C iv *, r iv , g iv , etc., may be displayed in combination as shown in Fig. 6.
- the above-mentioned RGB iv the graph G1, a two-dimensional graph G2 of a iv * and b iv * (wherein a coordinate point PE1 and a coordinate point PE2, which are based on partial regions E1 and E2 of the subject, are plotted), and a two-dimensional graph G2 of u iv * and v iv * (wherein a coordinate point PE1 and a coordinate point PE2, which are based on partial regions E1 and E2 of the subject, are plotted) may be displayed in combination as shown in Fig. 7.
- u iv * indicates the u iv * among L iv *, u iv *, and v iv *, which have been modified from CIE 1976 L*u*v* in the same manner as the method of modifying to L iv *, a iv *, and b iv * from the above-mentioned visible color specification system, CIE L*a*b*.
- v iv * indicates the v iv * among L iv *, u iv *, and v iv *, which have been modified from CIE 1976 L*u*v* in the same manner as the method of modifying to L iv *, a iv *, and b iv * from the above-mentioned visible color specification system, CIE L*a*b*.
- the pseudo color image RGB iv and graph G4 of r iv and g iv may be displayed in combination as shown in Fig. 8.
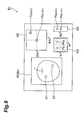
- the above-mentioned RGB iv , the graph G2, a two-dimensional graph G5 of ⁇ a iv * and ⁇ b iv * (wherein a coordinate point P (E1 - E1) and a coordinate point PE (E2 - E1) , which are based on partial regions E1 and E2 of the subject, are plotted), and a one-dimensional graph G6 of ⁇ L iv * (wherein a coordinate point P (E1 - E1) and a coordinate point PE (E2 -E1) , which are based on partial regions E1 and E2 of the subject, are plotted) may be displayed in combination as shown in Fig. 9.
- ⁇ a iv * indicates the difference between two a iv *'s
- ⁇ b iv * indicates the difference between two a iv *'s
- RGB iv the graph G1, and an optical spectrum graph G1, showing profiles LE1 and LE2 of transmittance Abs in partial regions E1 and E2 of the subject, may be displayed in combination as shown in Fig. 10.
- the number of images that are taken in first is the minimum number of 3
- a broken line display for the number of wavelengths may be drawn as it is, a graph may instead be drawn upon increasing the number of data by performing spectral estimation.
- RGB iv the graph G1, and an optical spectrum graph G8, showing profiles LE1 and LE2 of K/S values in partial regions E1 and E2 of the subject, may be displayed in combination as shown in Fig. 11.
- K/S value refers to (absorption coefficient)/(scattering coefficient).
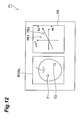
- a three-dimensional graph G9 of L iv *, a iv *, and b iv * (wherein a coordinate point PE1 and a coordinate point PE2, which are based on partial regions E1 and E2 of the subject, are plotted) may be displayed as shown in Fig. 12.
- a pseudo color image of H iv * and a graph (pseudo color bar) 22, in which the density information of the H iv * values are numerically quantified may be displayed in combination as shown in Fig. 13.
- a three-dimensional pseudo color image of H iv * and a graph (pseudo color bar) G10 in which the density information of the H iv * values are numerically quantified and the density information are displayed three-dimensionally, may be displayed in combination as shown in Fig. 14.
- the coefficients QR iv , QG iv , and QB iv of the degrees of absorption, and modification to color density values qr iv and qg iv using these coefficients are also important.
- QR iv is equivalent to -logR iv and (1 - R iv ) 2 /2R iv and indicates the so-called absorbance image value of R iv .
- QG iv is equivalent to -logG iv and (1 - G iv ) 2 /2G iv and indicates the so-called absorbance image value of G iv .
- QB iv is equivalent to -logB iv and (1 - B iv ) 2 /2B iv and indicates the so-called absorbance image value of B iv .
- Sensitivity functions ⁇ 0 1 , ⁇ 0 2 , and ⁇ 0 3 which are used in the image pickup system 1, are determined based on a correlation between physical state or chemical state differences to be observed that occur among respective subjects 10, making up a subject set comprising subjects 10 of the same type, and differences occurring among optical spectra of the respective subjects 10 making up the above-mentioned subject set.
- optimal sensitivity functions may be determined in advance according to each subject for which an image is to be picked up, the data of these functions may be stored in the storage unit of the central control unit in image processing part 4, and a program that uses the data may be stored in a ROM.
- a program that determines the sensitivity functions may be stored in the above-mentioned ROM and the data of the determined optimal sensitivity functions may be stored in the storage device and used each time basic invisible color images (signals) + a pseudo color image are to be formed.
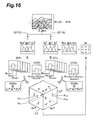
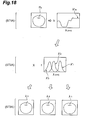
- the method shown in Fig. 15 is a method in which optimal sensitivity functions are determined by considering human sight characteristics and human sensation characteristics in addition to the invisible range image information in order to clearly express the physical state or chemical state differences to be observed that occur among the respective subjects 10 that make up the subject set comprising the subjects 10 of the same type.
- the subject set comprising a predetermined number of subjects, is divided into a number of clusters based on the physical state or chemical state differences to be observed among the respective subjects (ST11).
- rough optical spectra optical spectra
- clustering may be performed in association with the physical state or chemical state differences to be observed in these rough data.
- Test results of the subject sample such as the results of destructive tests or non-destructive tests, etc., may also be used in combination.
- Optical spectra ⁇ 11 to ⁇ 14 optical spectra, such as reflection spectra, transmission spectra, absorption spectra, etc.
- the image pickup system 1 may be used or another spectroscopic device may be used.
- initial sensitivity functions ⁇ 0 10 , ⁇ 0 20 , and ⁇ 0 30 which serve as the initial models for determining optimal sensitivity functions ⁇ 0 1 , ⁇ 0 2 , and ⁇ 0 3 , are hypothesized (ST13).
- the optimal sensitivity functions ⁇ 0 1 , ⁇ 0 2 , and ⁇ 0 3 are determined by modifying initial sensitivity functions ⁇ 0 10 , ⁇ 0 20 , and ⁇ 0 30 . More specifically, from the standpoint of ease of modification, bandpass-type functions are used as initial sensitivity functions ⁇ 0 10 , ⁇ 0 20 , and ⁇ 0 30 . The determination of the wavelength values of these functions is thus important.
- characteristic wavelengths are selected from the spectral data of the optical spectra.
- this characteristic wavelength value is a wavelength value for which the spectral intensity I takes on a maximum value or a minimum value, it is not restricted in particular as long as it is a value that reflects the physical state or chemical state differences to be observed among the respective subjects making up the subject set, and may be a wavelength value at a shoulder portion of an optical spectrum.
- the initial sensitivity functions ⁇ 0 10 , ⁇ 0 20 , and ⁇ 0 30 are then applied to the optical spectra ⁇ 11 to ⁇ 14 to obtain basic invisible color images (signals) R iv1 , G iv1 , and B iv1 , and these are joined to prepare an initial pseudo color image RGB iv1 (ST14).
- That characteristics which basically reflect the physical state or chemical state differences to be observed among respective subjects making up a subject set, are allocated to and expressed in the respective values of R iv , G iv , and B iv , in the above described manner means that these characteristics determine the basic hues.
- the respective characteristics are thus represented by hues, and the levels or amounts thereof are represented by the darkness of color or more simply the saturation (more strictly speaking, the synthetic vector of lightness and saturation).
- the respective characteristics are thus represented by hues, and the levels or amounts thereof are represented by the darkness of color or more simply the saturation (more strictly speaking, the synthetic vector of lightness and saturation).
- initial sensitivity functions ⁇ 0 10 , ⁇ 0 20 , and ⁇ 0 30 are suitably modified and adjusted while viewing this image (for example, intensity I or wavelength values ⁇ A , ⁇ B , and ⁇ C may be changed). If an image that is recognizable in terms of color can be obtained at the stage of RGB iv1 , initial sensitivity functions ⁇ 0 10 , ⁇ 0 20 , and ⁇ 0 30 will be optimal sensitivity functions ⁇ 0 1 , ⁇ 0 2 , and ⁇ 0 3 .
- the initial bandpass-type shapes are provided with a bulge. Care is required in providing this bulge, since if the bulge is increased more than necessary, the saturation differences will become low. Also, if the saturation differences are to be emphasized to increase the color selection ability, the saturation differences can be increased by providing negative characteristics at regions at which the respective bands intersect, that is, at regions at which the sensitivity functions overlap. The sensitivity characteristics are thus modified and adjusted while viewing the image.
- sensation characteristics equivalent to those of the visible range are preferably incorporated.
- the relationship between cold colors and warm colors is kept to the relationship of bluish colors and reddish-orange colors as it is, and in cases where a natural object is the subject, a fresh object has a blue or green sensation in terms of hue while a decomposing object that is not fresh has a tannish, brownish, or reddish sensation.
- the wavelength selection of the initial, bandpass-type sensitivity functions and the handling of R iv , G iv , and B iv are preferably in accordance with sensation characteristics equivalent to those of the visible range.
- the sensitivity functions (characteristics) determine the value of the final invisible values (R iv , G iv , B iv , L iv *, a iv *, and b iv *), the sensitivity functions must be specified each time. However, if the determined sensitivity functions are verified according to each sample and each wavelength used and become high in the frequency of use in the industry, the method of specification thereof will become simplified.
- an optimal sensitivity function determination method will be a method by which the optimal sensitivity functions are determined without the involvement of human sensation.
- sensitivity functions that are in accordance, for example, to the number of retinal cones and sight characteristics of the animal may be used as the optimal sensitivity functions.
- values that are furthermore converted secondarily and optimized are used as the sensitivity functions.
- the desired pseudo color images can be formed from the original spectral distribution (optical spectrum) of the subject by determining optimal sensitivity functions having large wavelength widths, such as described above.
- a desired pseudo color image cannot be obtained readily in many cases from broad weighted functions (sensitivity functions), such as those described above, and the original spectral distribution.
- a near infrared range optical spectrum of a wavelength range of 800 to 2500nm has strong multicollinearity and the absorption by the respective substance components are, respectively, distributed over a wide wavelength range. Since a characteristic absorption spectrum is thus less likely to appear in comparison to visible range spectra, optical spectra (reflection spectra or absorption spectra) of subjects that are made up of the same types of substances will take on nearly the same shape and it will be difficult to determine optimal sensitivity functions by the method described using Fig. 15.
- multiple linear regression (MLR) or principal component regression may be used to select wavelengths of high correlation with the information on the subject that are to be obtained (for example, the concentration of a specific component contained in the subject).
- MLR linear regression
- principal component regression principal component regression
- an image of higher precision can be obtained by replacing the raw image with an absorption image or a second-order differentiation image.
- this method tends to be effectively applicable to cases where the pseudo color image information that are to be obtained are limited to those for displaying, in a quantifiable manner, the concentrations of a specific substance contained in a subject.
- a concentration map (image) of the component to be obtained is obtained, this can be displayed as a pseudo color image of the concentrations of a single substance or concentration maps (images) can be obtained for three components, respectively, and these three images can be made to correspond to R iv , G iv , and B iv , respectively, to provide a pseudo color display. It thus becomes possible to directly view an image created by the three components, and since a color solid positioning image can be formed from the images of the three components, analysis of a more advance level is enabled. In this case, the optimal functions become narrow in wavelength width, and for example when each image is sampled at a wavelength width interval of 2nm, the shortest wavelength width (2nm) tends to be selected in many cases.
- Standard spectra which are to serve as standards for a pseudo color image corresponding to the information desired to be obtained from a subject to be observed.
- Each such standard spectrum is a spectrum of the same wavelength range as the above-mentioned optimal sensitivity functions and is a spectrum for forming chromaticity points that can be distributed uniformly in the color coordinate space of the color specification system that is employed (for example, the L iv *a iv *b iv * color specification system in the present embodiment).
- the number of standard spectra is less than twelve, the tendency for color value calculation of high precision to be somewhat difficult becomes high. Also, from the standpoint of carrying out color value calculation of higher precision, the number of standard spectra is preferably no less than 18.
- each of these standard spectra D1 to D12 is multiplied by optimal sensitivity functions b ivs 0 , g ivs 0 , and r ivs 0 (which correspond to the above-mentioned sensitivity functions ⁇ 0 1 , ⁇ 0 2 , and ⁇ 0 3 ) to generate 12 sets of basic pseudo color image signals (R iv,stn1 , G iv,stn1 , B iv,stn1 ) to (R iv,stn12 , G iv,stn12 , B iv,stn12 ), which are to serve as standards.
- Sensitivity functions b iv 0 , g iv 0 , and r iv 0 are then determined by applying matrix M (which is a 3-row by 3-column matrix the first time around) to physical sensitivity functions b ivp 0 , g ivp 0 , and r ivp 0 , obtained from spectroscopic optical part 2 (and corresponding to the n (n ⁇ 3) digitized bandpass images (signals) ⁇ S1 , ⁇ S2 , ... ⁇ Sn that were described above using Fig. 2).
- PCA principal component analysis
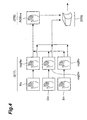
- this second embodiment's system 1A enabling chromaticity measurement in the visible and invisible ranges has the same arrangement as the first embodiment's system 1 enabling chromaticity measurement in the visible and invisible ranges.
- Wavelength conversion optical part 7 optically applies sensitivity functions to each of the three or more component lights, output by the spectroscopic optical part, by performing wavelength conversion on each of the three or more component lights and thereby generates three or more pseudo color component lights, respectively, corresponding to the three or more component lights.
- emitted light L1 of all wavelength ranges emitted from subject sample 10 is received by the spectroscopic optical part 2a.
- An entire image P 0 or a partial region E1 of subject sample 10 may be received as the image received at this point.
- a continuous emission spectrum ⁇ 0 S0 of the received image is then decomposed, for example, into three component lights, respectively, having mutually different central wavelengths, by means of a spectroscopic prism (spectroscopic optical part 2a) that can spectrally divide the incident light into three (ST1A to ST2A).
- the three component lights emitted from the spectroscopic prism are then subject to wavelength conversion by optical filters (wavelength conversion part 7), respectively, positioned at the three light emitting surfaces of the spectroscopic prism (ST2A).
- the optical filters have optimal sensitivity characteristics ⁇ 0 S1 , ⁇ 0 S2 , and ⁇ 0 S3 , respectively, matched to the three component lights.
- the three component lights that are emitted from the spectroscopic prism are thus optically multiplied by the sensitivity functions and changed to three pseudo color component lights in being subject to the wavelength conversion.
- the three pseudo color component lights are then, respectively, converted photoelectrically at the photoelectric conversion part 2b, and three basic pseudo color image signals ⁇ 1 , ⁇ 2 , and ⁇ 3 , corresponding to the three pseudo color component lights, are thereby formed (ST3A).
- the color specification system to be used in the color specification process that is carried out at the image processing part is not restricted in particular, and a color specification system based on a color specification system besides the above-mentioned L*a*b* color specification system may be defined and used.
- Cieluv color specification system can be cited as color specification systems that can serve as a base, and a color specification system that is based on any of these (a color specification system that takes the place of the L iv *a iv *b iv * color specification system) may be defined and used.
- sensitivity functions ⁇ 0 1 , ⁇ 0 2 , and ⁇ 0 3 may be multiplied to determine the above-mentioned pseudo color image signals -logR iv , -logG iv , and -logB iv , which are based on absorbance, and pseudo color image RGB iv ⁇ , which is synthesized from these signals and is based on absorbance.
- the sensitivity functions are normally determined based on a correlation between physical state or chemical state differences to be observed that occur among respective subjects that make up a subject set and differences in waveform occurring among optical spectra of the respective subjects making up the subject set, this invention is not limited thereto in particular.
- the sensitivity functions need not be just functions in the visible wavelength range, such as those shown in Fig. 19, but may instead be functions in a range of ultraviolet wavelengths that are shorter than visible wavelengths, in the visible range, and in a range of near infrared wavelengths that are longer than visible wavelengths.
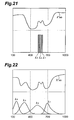
- the sensitivity functions may be functions that divide a wavelength range of certain width within the visible range into three regions and incorporate these regions as shown in Fig. 21.
- the functions may have broad band characteristics as shown in Fig. 22.
- the sensitivity functions are basically summarized as three functions as in the above description of the embodiments, three or more functions may be used depending on the color specification system used in the color specification process. For example, since there are cases where the four colors of red, yellow, green, and blue, etc., are used, the sensitivity functions may be summarized as four functions.
- SAS-S (M) indicates a product of the trade-name, "SAS-S,” made by Mitsubishi Pencil Co., Ltd.
- Pigma indicates a product of the trade-name, "Nouvel Pigma Graphic,” made by Sakura Color Products Corp.
- Twin (T) indicates a product of the trade-name, "Fude-pen Twin,” made by Tombow Pencil Co., Ltd.
- Sharp H (M) indicates a product of the trade-name, "Uni 0.5 HB,” made by Mitsubishi Pencil Co., Ltd.
- "Uni-Ball (M)” indicates a product of the trade-name, "Uni-Ball,” made by Mitsubishi Pencil Co., Ltd.
- N-500 (Z) indicates a product of the trade-name, "N-500,” made by Zebra Co., Ltd.
- Equation (12) since just positive-only sensitivity characteristics can be provided as shown in Fig. 25, the following Equation (12) must be used to convert to the optimal sensitivity functions of Fig. 26.
- Equation (12) For reference, if the reverse operation is required for calculation, that is, if the positive-only sensitivity characteristics need to be calculated from the optimal sensitivity functions, this can be carried out using matrix "M -1 " shown in Equation (12) below.
- the values of (11) and (12) are matrix values that are effective for the present experimental results.
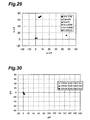
- the numerical values for visible range color images and color display thereof were determined by calculation using the prior-art method. Furthermore, the numerical values for invisible range pseudo color images and color display thereof were determined by calculation using the optimal sensitivity functions shown in Fig. 26. The results are shown in Fig. 27, Fig. 28, and Fig. 29.
- the sRGB values of the color specification system for Internet, the XYZ values, and the L*a*b* values are shown in Table 1.
- the respective samples have image data R sRGB , G sRGB , and B sRGB values in the range of 0 to 11, which are extremely low with respect to the value of 255 for white, and are recognized as being practically black. Although slight differences in color density can be recognized, recognition of differences of color among the respective samples was impossible.
- Fig. 28 shows the results using the data for 550 to 950nm and the ideal sensitivity characteristics shown in Fig. 26. Also, Equations (5) to (7) were used calculate the L iv *, a iv *, and b iv * values. In this case, the differences among the near infrared range spectra can be recognized and the characteristics of the three types of numerical values (L iv *, a iv *, and b iv *) can be distinguished on the chromaticity coordinates.
- the invisible range is a range that cannot be seen with the eyes
- the application of factors suited to the eyes (116 as L*, 200 as b*, and 500 as a*) can be said to be meaningless.
- the following can also be said. That is, second, if the light amount proportions in the invisible range are to be considered as colors, these can be understood more readily by allocation to pseudo colors as described above.
- Equations (5) to (7) are based on the invisible range and inorganic standard values (200 in both) are basically used, in Equation (3), the factors, Kl, Ka, and Kb are incorporated to accommodate for both lines of thought (that is, the consideration of the invisible range just in the form of internal calculation equations or the consideration of color values premised on viewing by humans upon conversion from the invisible range to the visible range once).
- Fig. 30, Fig. 31, and Fig. 32 are graphs arranged in the same manner as Fig. 27, Fig. 28, and Fig. 29, respectively.
- the samples can only be recognized as being practically black in the visible range, when the invisible chromaticity coordinates are used, the samples of "No. 3" and “No. 2" exhibit red chromaticity values.
- the sample of "No. 3" is displayed as being red in color and the sample of "No. 2" is displayed as being red of higher saturation than the sample of "No. 3.”
Landscapes
- Physics & Mathematics (AREA)
- Spectroscopy & Molecular Physics (AREA)
- General Physics & Mathematics (AREA)
- Engineering & Computer Science (AREA)
- Multimedia (AREA)
- Signal Processing (AREA)
- Spectrometry And Color Measurement (AREA)
- Image Processing (AREA)
- Color Television Image Signal Generators (AREA)
- Facsimile Image Signal Circuits (AREA)
- Color Image Communication Systems (AREA)
Abstract
Description



The present inventors also consider the use of the above-mentioned power factor to be effective in cases where sensation indices (sensation functions) of animals besides humans or sensation indices (sensation functions) of an inorganic form are handled.

| Sample | L* | a* | b* | X | Y | Z | RsRGB | GsRGB | BsRGB |
| SAS-S(M) | 22.99 | 5.37 | -3.83 | 3.97 | 3.80 | 4.88 | 4.58 | 3.48 | 4.60 |
| Pigma (N) | 27.24 | 0.46 | 2.11 | 4.96 | 5.18 | 5.17 | 5.53 | 5.12 | 4.69 |
| Twin (T) | 30.59 | 0.76 | 3.19 | 6.23 | 6.48 | 6.25 | 7.11 | 6.38 | 5.63 |
| SharpH (M) | 40.80 | -0.01 | 1.09 | 11.16 | 11.74 | 12.36 | 11.95 | 11.72 | 11.29 |
| Uni-ball (M) | 32.81 | 0.41 | 2.41 | 7.12 | 7.45 | 7.44 | 7.93 | 7.38 | 6.74 |
| N-5000 (Z) | 29.18 | 8.06 | -1.88 | 6.34 | 5.91 | 6.91 | 8.03 | 5.22 | 6.45 |
| Fabric No. 1 | 17.98 | 0.07 | -0.11 | 2.39 | 2.51 | 2.75 | 2.52 | 2.51 | 2.53 |
| Fabric No. 2 | 9.87 | 4.18 | -6.67 | 1.18 | 1.11 | 1.83 | 1.20 | 1.02 | 1.78 |
| Fabric No. 3 | 23.27 | 1.65 | -3.39 | 3.80 | 3.88 | 4.89 | 3.90 | 3.80 | 4.59 |
| Sample | Liv* | aiv* | biv* | Riv | Giv | Biv | λ1 | λ2 | λ3 |
| SAS-S(M) | 65.21 | 13.06 | 67.39 | 38.30 | 34.31 | 4.79 | 36.05 | 34.70 | 5.66 |
| Pigma (N) | 29.19 | 4.27 | 3.79 | 6.31 | 5.91 | 5.09 | 6.25 | 5.91 | 5.13 |
| Twin (T) | 37.98 | 115.04 | 12.32 | 33.63 | 10.08 | 6.58 | 34.06 | 8.97 | 8.30 |
| SharpH (M) | 41.51 | -0.60 | 2.97 | 12.09 | 12.18 | 11.12 | 12.01 | 12.21 | 11.14 |
| Uni-ball (M) | 34.86 | 4.11 | 4.09 | 8.91 | 8.43 | 7.30 | 8.84 | 8.43 | 7.36 |
| N-5000 (Z) | 74.04 | 18.08 | 69.90 | 53.62 | 46.77 | 7.77 | 50.71 | 47.21 | 9.03 |
| Fabric No. 1 | 17.96 | 1.19 | 1.14 | 2.57 | 2.51 | 2.36 | 2.56 | 2.51 | 2.37 |
| Fabric No. 2 | 9.24 | 202.87 | -6.92 | 24.22 | 1.03 | 1.60 | 24.96 | -0.14 | 3.21 |
| Fabric No. 3 | 22.95 | 163.97 | -2.52 | 29.24 | 3.79 | 4.23 | 30.04 | 2.50 | 6.00 |
| Sample | Liv* | aiv* | biv* | Riv | Giv | Biv | λ1 | λ2 | λ3 |
| SAS-S(M) | 70.01 | 5.22 | 67.39 | 38.30 | 34.31 | 4.79 | 36.05 | 34.70 | 5.66 |
| Pigma (N) | 38.95 | 1.71 | 3.79 | 6.31 | 5.91 | 5.09 | 6.25 | 5.91 | 5.13 |
| Twin (T) | 46.54 | 46.02 | 12.32 | 33.63 | 10.08 | 6.58 | 34.06 | 8.97 | 8.30 |
| Shar pH (M) | 49.57 | -0.24 | 2.97 | 12.09 | 12.18 | 11.12 | 12.01 | 12.21 | 11.14 |
| Uni-ball (M) | 43.85 | 1.64 | 4.09 | 8.91 | 8.43 | 7.30 | 8.84 | 8.43 | 7.36 |
| N-5000 (Z) | 77.62 | 7.23 | 69.90 | 53.62 | 46.77 | 7.77 | 50.71 | 47.21 | 9.03 |
| Fabric No. 1 | 29.27 | 0.47 | 1.14 | 2.57 | 2.51 | 2.36 | 2.56 | 2.51 | 2.37 |
| Fabric No. 2 | 21.76 | 81.15 | -6.92 | 24.22 | 1.03 | 1.60 | 24.96 | -0.14 | 3.21 |
| Fabric No. 3 | 33.58 | 65.59 | -2.52 | 29.24 | 3.79 | 4.23 | 30.04 | 2.50 | 6.00 |
Claims (6)
- A system enabling chromaticity measurement in the visible and invisible range, the system comprising at least:a spectroscopic optical part for receiving emitted light of all wavelength ranges emitted from a subject sample and spectrally separating the emitted light into three or more component lights having mutually different central wavelengths;a photoelectric conversion part for photoelectrically converting the three or more component lights, respectively, and generating three or more electric signals, respectively, corresponding to the three or more component lights;an image processing part for processing the three or more electric signals to generate a pseudo color image of the sample and compute a numerical value defined based on a color specification system for performing color display of the pseudo color image; andan image outputting part for outputting the pseudo color image and/or the numerical value,the image processing part comprising at least:image signal generation processing means for generating three or more basic pseudo color image signals by applying three or more sensitivity functions independently to all of the three or more electric signals, respectively;vector conversion processing means for generating the three or more pseudo color image signals by performing vector conversion by applying a matrix M to the three or more basic pseudo color image signals;image formation processing means for generating the pseudo color image by synthesizing the three or more pseudo color image signals; andcolor specification processing means for computing the numerical value defined based on the color specification system by use of the three or more pseudo color image signals,the three or more sensitivity functions being determined based on a correlation between physical state or chemical state differences to be observed that occur among respective subjects constituting a subject set to which the subject sample belongs, and differences in waveform occurring among optical spectra of the respective subjects constituting the subject set, andthe matrix M being a matrix for approaching optimal sensitivity characteristic and being determined so that, in consequence, the color reproduction error that is generated when generating the three or more pseudo color image signals is minimized.
- A system enabling chromaticity measurement in the visible and invisible range, said system comprising at least:a spectroscopic optical part for receiving emitted light of all wavelength ranges emitted from a subject sample and spectrally separating the emitted light into three or more component lights having mutually different central wavelengths;wavelength conversion optical parts which are provided, respectively, for each of said three or more component lights and generates three or more pseudo color component lights corresponding to the three or more component lights respectively by performing wavelength conversion of each of the three or more component lights and thereby optically applying sensitivity functions to each of the three or more component lights;a photoelectric conversion part for photoelectrically converting the three or more pseudo color component lights respectively and thereby generating three or more basic pseudo color image signals respectively corresponding to the three or more pseudo color component lights;an image processing part for processing the three or more basic pseudo color image signals to generate a pseudo color image of the sample and compute a numerical value defined based on a color specification system for performing color display of the pseudo color image; andan image outputting part for outputting the pseudo color image and/or the numerical value,the image processing part comprising at least:vector conversion processing means for generating the three or more pseudo color image signals by performing vector conversion by applying a matrix M to the three or more basic pseudo color image signals;image formation processing means for generating the pseudo color image by synthesizing the three or more pseudo color image signals; andcolor specification processing means for computing the numerical value defined based on said color specification system by use of the three or more pseudo color image signals;the three or more sensitivity functions being determined based on a correlation between physical state or chemical state differences to be observed that occur among respective subjects constituting a subject set to which the subject sample belongs, and differences in waveform occurring among optical spectra of the respective subjects constituting the subject set, andthe matrix M being a matrix for approaching optimal sensitivity characteristic and being determined so that, in consequence, the color reproduction error that is generated when generating the three or more pseudo color image signals is minimized.
- The system enabling chromaticity measurement in the visible and invisible range according to Claim 1 or 2, the system enabling to output a pseudo color image generated for an entire image of the subject sample and a pseudo color image generated for a partial region image of the subject sample respectively and independently to the image outputting part.
- The system enabling chromaticity measurement in the visible and invisible range according to any one of Claims 1 to 3, the system enabling to output an optical spectrum measured for an entire image of the subject sample and optical spectra measured for a partial region image of the subject sample respectively and independently to the image outputting part.
- The system enabling chromaticity measurement in the visible and invisible range according to any one of Claims 1 to 4, the system enabling to output the numerical value computed for an entire image of the subject sample and the numerical value computed for a partial region image of the subject sample respectively and independently in the form of a table or a graph to the image outputting part.
- The system enabling chromaticity measurement in the visible and invisible range according to any one of Claims 1 to 5, the system enabling to measure a color value of arbitrary point of an interior or a surface of the subject sample.
Applications Claiming Priority (3)
| Application Number | Priority Date | Filing Date | Title |
|---|---|---|---|
| JP2002233809 | 2002-08-09 | ||
| JP2002233809A JP4080812B2 (en) | 2002-08-09 | 2002-08-09 | System that can measure chromaticity in visible and invisible regions |
| PCT/JP2003/009410 WO2004015381A1 (en) | 2002-08-09 | 2003-07-24 | System for measuring chromaticity in visible and invisible regions |
Publications (2)
| Publication Number | Publication Date |
|---|---|
| EP1530033A1 true EP1530033A1 (en) | 2005-05-11 |
| EP1530033A4 EP1530033A4 (en) | 2011-10-05 |
Family
ID=31711878
Family Applications (1)
| Application Number | Title | Priority Date | Filing Date |
|---|---|---|---|
| EP03784482A Withdrawn EP1530033A4 (en) | 2002-08-09 | 2003-07-24 | System for measuring chromaticity in visible and invisible regions |
Country Status (5)
| Country | Link |
|---|---|
| EP (1) | EP1530033A4 (en) |
| JP (1) | JP4080812B2 (en) |
| AU (1) | AU2003252261A1 (en) |
| CA (1) | CA2495174A1 (en) |
| WO (1) | WO2004015381A1 (en) |
Cited By (2)
| Publication number | Priority date | Publication date | Assignee | Title |
|---|---|---|---|---|
| TWI392859B (en) * | 2009-11-18 | 2013-04-11 | Univ Nat Formosa | A novel method and equipment for measuring chromaticity coordinate and intensity of light |
| US8836795B2 (en) | 2009-07-30 | 2014-09-16 | Yasushi Nagamune | Image capturing device and image capturing method |
Families Citing this family (12)
| Publication number | Priority date | Publication date | Assignee | Title |
|---|---|---|---|---|
| BRPI0608982A2 (en) | 2005-05-11 | 2010-01-12 | Olympus Medical Systems Corp | signal processing device for biological observation apparatus |
| JP4504324B2 (en) * | 2005-05-13 | 2010-07-14 | オリンパスメディカルシステムズ株式会社 | Biological observation device |
| JP5547717B2 (en) * | 2009-04-07 | 2014-07-16 | ローム株式会社 | Photoelectric conversion device and imaging device |
| JP5918956B2 (en) * | 2011-09-26 | 2016-05-18 | 学校法人光産業創成大学院大学 | Image display device |
| WO2016159189A1 (en) * | 2015-03-31 | 2016-10-06 | 株式会社ニコン | Imaging device |
| JP2019128295A (en) * | 2018-01-25 | 2019-08-01 | 国立研究開発法人産業技術総合研究所 | Imaging device, imaging system, and imaging method |
| JP7077646B2 (en) * | 2018-02-13 | 2022-05-31 | 株式会社ニコン | Image generators, imaging systems, programs, image generation methods, information management systems and terminals |
| JP7028075B2 (en) | 2018-06-12 | 2022-03-02 | オムロン株式会社 | Image processing equipment, image processing method, image sensor |
| JP7331649B2 (en) * | 2019-11-12 | 2023-08-23 | セイコーエプソン株式会社 | Spectroscopic measurement method and spectroscopic measurement device |
| CN114972125B (en) * | 2022-07-29 | 2022-12-06 | 中国科学院国家天文台 | True color image recovery method and device for deep space detection multispectral image |
| WO2025163811A1 (en) * | 2024-01-31 | 2025-08-07 | Ntt株式会社 | Video processing device, video processing method, and video processing program |
| CN121167528B (en) * | 2025-09-05 | 2026-07-24 | 杭州万事利丝绸数码印花有限公司 | A method, apparatus, and storage medium for classifying fabrics based on color characteristics. |
Family Cites Families (7)
| Publication number | Priority date | Publication date | Assignee | Title |
|---|---|---|---|---|
| JPS63234941A (en) * | 1986-11-29 | 1988-09-30 | オリンパス光学工業株式会社 | Image pickup apparatus |
| JPS62182705A (en) * | 1987-01-24 | 1987-08-11 | Olympus Optical Co Ltd | Endoscope device |
| JPH06121325A (en) * | 1992-10-07 | 1994-04-28 | Nippon Hoso Kyokai <Nhk> | Color imaging device |
| JPH11328392A (en) * | 1998-05-19 | 1999-11-30 | Konica Corp | Image processing device |
| JP3730424B2 (en) * | 1998-12-07 | 2006-01-05 | ホーチキ株式会社 | Differential spectrum image processing device |
| JP2002543863A (en) * | 1999-05-07 | 2002-12-24 | アプライド スペクトラル イメイジング リミテッド | Spectral biological imaging of the eye |
| JP4782277B2 (en) * | 2000-11-29 | 2011-09-28 | 株式会社ユーテック | Infrared color image forming device |
-
2002
- 2002-08-09 JP JP2002233809A patent/JP4080812B2/en not_active Expired - Fee Related
-
2003
- 2003-07-24 CA CA002495174A patent/CA2495174A1/en not_active Abandoned
- 2003-07-24 EP EP03784482A patent/EP1530033A4/en not_active Withdrawn
- 2003-07-24 WO PCT/JP2003/009410 patent/WO2004015381A1/en not_active Ceased
- 2003-07-24 AU AU2003252261A patent/AU2003252261A1/en not_active Abandoned
Cited By (3)
| Publication number | Priority date | Publication date | Assignee | Title |
|---|---|---|---|---|
| US8836795B2 (en) | 2009-07-30 | 2014-09-16 | Yasushi Nagamune | Image capturing device and image capturing method |
| US8854472B1 (en) | 2009-07-30 | 2014-10-07 | Yasushi Nagamune | Imagine capturing device and image capturing method |
| TWI392859B (en) * | 2009-11-18 | 2013-04-11 | Univ Nat Formosa | A novel method and equipment for measuring chromaticity coordinate and intensity of light |
Also Published As
| Publication number | Publication date |
|---|---|
| EP1530033A4 (en) | 2011-10-05 |
| JP2004077143A (en) | 2004-03-11 |
| AU2003252261A1 (en) | 2004-02-25 |
| WO2004015381A1 (en) | 2004-02-19 |
| CA2495174A1 (en) | 2004-02-19 |
| JP4080812B2 (en) | 2008-04-23 |
Similar Documents
| Publication | Publication Date | Title |
|---|---|---|
| US8705833B2 (en) | Computer-aided staining of multispectral images | |
| EP0650591B1 (en) | Non-invasive testing | |
| US6690466B2 (en) | Spectral imaging system | |
| US12069383B2 (en) | Hybrid visible and near infrared imaging with an RGB color filter array sensor | |
| CA2495174A1 (en) | System enabling chromaticity measurement in the visible and invisible ranges | |
| US6028311A (en) | Rapid non-invasive optical analysis using broad bandpass spectral processing | |
| US20050182328A1 (en) | System enabling chromaticity measurement in the visible and invisible ranges | |
| KR100238960B1 (en) | Apparatus for chromatic vision measurement | |
| CN109906370B (en) | Optical coherence tomography imaging device and measurement method | |
| CN107505046B (en) | Multispectral color measurement method | |
| Gökmen et al. | A Non-Contact Computer Vision Based Analysis of Color in Foods. | |
| WO2016152900A1 (en) | Image processing device and image capturing device | |
| JP6378767B2 (en) | Imaging device and analysis device | |
| KR101705818B1 (en) | Apparatus, system and method for measuring luminance and chromaticity | |
| US20200386670A1 (en) | Color measurements of turbid liquids | |
| US12467789B2 (en) | Information processing device, information processing system, and information processing method | |
| Spigulis et al. | Multi-spectral skin imaging by a consumer photo-camera | |
| JP2005189119A (en) | Color measuring method and color measuring device | |
| RU2063063C1 (en) | Method and device for measurement and/or quantitative representation of color quality | |
| JP3261888B2 (en) | Liquid color detection device | |
| CN107271387A (en) | The three-dimensional color space L*C*h* measurement quantization methods of grape wine color | |
| RU2059211C1 (en) | Method of measurement of colour of leather or other similar materials | |
| Ding et al. | Application of color mixing for safety and quality inspection of agricultural products | |
| JP3454881B2 (en) | Color measurement device | |
| Nishidate et al. | Estimation of bluish appearance of veins in skin tissue using spectrocolorimetry |
Legal Events
| Date | Code | Title | Description |
|---|---|---|---|
| PUAI | Public reference made under article 153(3) epc to a published international application that has entered the european phase |
Free format text: ORIGINAL CODE: 0009012 |
|
| 17P | Request for examination filed |
Effective date: 20050211 |
|
| AK | Designated contracting states |
Kind code of ref document: A1 Designated state(s): AT BE BG CH CY CZ DE DK EE ES FI FR GB GR HU IE IT LI LU MC NL PT RO SE SI SK TR |
|
| AX | Request for extension of the european patent |
Extension state: AL LT LV MK |
|
| DAX | Request for extension of the european patent (deleted) | ||
| RBV | Designated contracting states (corrected) |
Designated state(s): DE FR GB |
|
| A4 | Supplementary search report drawn up and despatched |
Effective date: 20110905 |
|
| RIC1 | Information provided on ipc code assigned before grant |
Ipc: G01J 3/36 20060101ALI20110830BHEP Ipc: G01J 3/28 20060101ALI20110830BHEP Ipc: H04N 9/04 20060101ALI20110830BHEP Ipc: H04N 1/60 20060101ALI20110830BHEP Ipc: H04N 1/04 20060101ALI20110830BHEP Ipc: G06T 1/00 20060101ALI20110830BHEP Ipc: G01J 3/46 20060101AFI20110830BHEP |
|
| 17Q | First examination report despatched |
Effective date: 20110920 |
|
| STAA | Information on the status of an ep patent application or granted ep patent |
Free format text: STATUS: THE APPLICATION IS DEEMED TO BE WITHDRAWN |
|
| 18D | Application deemed to be withdrawn |
Effective date: 20120131 |