Technical Field
The present invention relates to a method for
determining the optimum recording power in an optical disc
drive that records information by emitting a laser beam to
an optical disc medium.
Background Art
Optical disc drives have been widely developed in
recent years as means for recording and reproducing large
amounts of data, various approaches have been used to
achieve ever higher recording densities, and one of these is
the phase-change optical disc drive using a reversible state
change between crystalline and amorphous phases.
A phase-change optical disc drive forms marks
(amorphous parts) and spaces (crystalline parts) disposed
between marks on an optical disc medium by emitting a
semiconductor laser to the optical disc medium at two
power levels, a peak power level for making a crystalline
part amorphous, and a bias power level for making an
amorphous part crystalline.
Because reflectivity differs in marks and spaces,
a recorded signal is read during playback using this
difference in reflectivity.
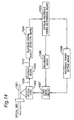
The configuration of a conventional phase-change
optical disc drive is shown in Fig. 14. In Fig. 14 reference
numeral 1001 is an optical disc, 1002 is an optical head,
1003 is a playback means, 1004 is a playback signal quality
detection means, 1005 is an optimum recording power
determining means, 1006 is a recording means, 1007 is a
laser drive circuit, and 1008 is a recording power setting
means.
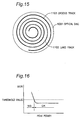
The track configuration of a conventional optical
disc 1001 is shown in Fig. 15. The optical disc 1001 is an
optical disc having recording areas in both the groove-shaped
tracks (groove tracks 1101) and the tracks between
grooves (land tracks 1102), forming a continuous spiral by
alternating the groove tracks and land tracks every
revolution.
After the optical disc 1001 is loaded into the
optical disc drive and specific operations for identifying the
disc type and rotation control are completed, the optical
head 1002 moves to an area for determining the optimum
emission power. Note that this area is provided at the
innermost circumference or the outermost circumference of
the disc, and is a recording area separate from the user
area for recording user data.
Both peak power and bias power- are determined
with a phase-change optical disc drive, and the method for
determining the peak power is described here.
First, initial values for the peak power and bias
power are set in the laser drive circuit 1007 by the
recording power setting means 1008. The power for
recording to a land track and the power for recording to a
groove track are equal at this time.
A signal for recording one land track revolution
and one groove track revolution from a specific position is
then sent from the recording means 1006 to the laser drive
circuit 1007 and recorded by the optical head 1002. The
light output of the semiconductor laser that is a component
of the optical head 1002 is gathered as a light spot on the
optical disc. 1001, and a recording mark is formed according
to the light emission waveform.
When land track and groove track recording ends,
the semiconductor laser of the optical head 1002 emits at
the playback power level, the track just recorded is played
back, and a signal 1009 that varies according to the
presence of a recording mark on the optical disc 1001 is
input to the playback means 1003 as a playback signal. The
playback signal 1009 is subjected to playback signal
processing such as amplification, waveform equalization,
and digitizing by the playback means 1003, and signal 1010
is then input to the playback signal quality detection means
1004.
The playback signal quality detection means 1004
detects the signal quality of signal 1010, and inputs the
detection result to the optimum recording power
determining means 1005.
The playback signal quality detection means 1004
here detects the BER (byte error rate) when the recorded
signal is played back. The BER detected at this time is the
average for the reproduced track. The relationship between
peak power and BER is shown in Fig. 16.
The horizontal axis is peak power and the vertical
axis is the BER in Fig. 16. If the playback conditions are
equal, recording accuracy generally increases as the BER
decreases. Therefore, if the BER is less than or equal to a
given threshold value, the detection result is OK, and if
greater than or equal to the threshold value the detection
result is NG.
Following the flow chart in Fig. 17, for example,
the optimum recording power determining means 1005 sets
the peak power higher than the initial power level if the
first result from the playback signal quality detection means
1004 is NG, for example, sets the peak power lower than
the initial power level if the result is OK, and then records
and plays a land track and groove track at the set peak
power in the same way as before.
If the first result from the playback signal quality
detection means 1004 is NG and the second result is OK,
the optimum recording power determining means 1005
determines the average power of the present peak power
and the previous peak power plus a specific margin to be
the optimum recording power.
If the first result from the playback signal quality
detection means 1004 is OK and the second result is NG,
the optimum recording power determining means 1005
determines the average power of the present peak power
and the previous peak power plus a specific margin to be
the optimum recording power.
However, because the area for determining the
optimum emission power and the user area for recording
user data are in separate places, a relative tilt can occur
between the two areas due, for example, to disc warpage or
how the head is mounted, and there are cases with the prior
art described above where the user data is recorded with
power effectively weaker than the emission power set in the
area for determining the optimum emission power, and
conversely cases where the user data is recorded with
power effectively stronger than the emission power set in
the area for determining the optimum emission power.
As shown in Fig. 13 mark width is generally fatter
when recorded with strong emission power. Therefore, a
problem is that when a track recorded with effectively
strong emission power using one recording device is then
overwritten with effectively weaker emission power using
another recording device, an unerased mark remnant
results in the area where the mark was formed on the base
layer, this becomes noise during playback, and playback
performance drops.
The present invention is directed to the above
problem, and provides an optical disc drive and an optimum
recording power determination method with the object of
recording correctly even when the effective emission power
varies.
Disclosure of Invention
To achieve this object in a recording power
determination method of an optical disc drive for recording
to an optical disc having a spiral track, a recording power
determination method of the present invention records at a
first recording power (P3), records at a second recording
power (P4) that is lower by a specific amount than the first
recording power and plays back, determines whether a
specified playback signal quality is achieved, and sets the
recording power for data recording to a recording power
greater than or equal to the second recording power and
less than or equal to the first recording power when the
specific playback signal quality is achieved.
Furthermore, to achieve this object in a recording
power determination method of an optical disc drive for
recording to an optical disc having a spiral track, a
recording power determination method of the present
invention records at a second recording power (P3) that is
greater by a specific amount than a first recording power
(P2), records at a third recording power (P4) that is lower
by a specific amount than the first recording power (P2)
and plays back, determines whether a specified playback
signal quality is achieved, and sets the recording power for
data recording to a recording power greater than or equal
to the third recording power and less than or equal to the
second recording power when the specific playback signal
quality is achieved.
Furthermore, to achieve this object in a recording
power determination method of an optical disc drive for
recording to an optical disc having a spiral track, a
recording power determination method of the present
invention sets the recording power, continuously records
with that recording power to three or more tracks, plays
back a track having a recorded track on both sides,
determines whether a specified playback signal quality is
achieved, and sets that recording power to the recording
power for data recording when the specific playback signal
quality is achieved.
Furthermore, to achieve this object an optical
disc drive according to the present invention has a
recording power setting means for setting laser beam
recording power, a recording means for recording, a
playback means for reading, a playback signal quality
detection means for detecting playback signal quality, and
a control means, and by controlling the recording power
setting means, recording means, playback means, and
playback signal quality detection means the control means
records at a first recording power (P3), records at a
second recording power (P4) that is lower by a specific
amount than the first recording power and reads,
determines whether a specified playback signal quality is
achieved, and sets the recording power for data recording
to a recording power greater than or equal to the second
recording power and less than or equal to the first
recording power when the specified playback signal quality
is achieved.
Furthermore, to achieve this object an optical
disc drive according to the present invention has a
recording power setting means for setting laser beam
recording power, a recording means for recording, a
playback means for reading, a playback signal quality
detection means for detecting playback signal quality, and
a control means, and by controlling the recording power
setting means, recording means, playback means, and
playback signal quality detection means the control means
records at a second recording power (P3) that is greater by
a specific amount than a first recording power (P2),
records at a third recording power (P4) that is lower by a
specific amount than the first recording power (P2) and
reads, determines whether a specified playback signal
quality is achieved, and sets the recording power for data
recording to a recording power greater than or equal to the
third recording power and less than or equal to the second
recording power when the specific playback signal quality is
achieved.
Furthermore, to achieve this object an optical
disc drive according to the present invention has a
recording power setting means for setting laser beam
recording power, a recording means for recording, a
playback means for reading, a playback signal quality
detection means for detecting playback signal quality, and
a control means, and by controlling the recording power
setting means, recording means, playback means, and
playback signal quality detection means the control means
sets the recording power, continuously records with that
recording power to three or more tracks, reads a track
having a recorded track on both sides and determines
whether a specified playback signal quality is achieved, and
sets that recording power to. the recording power for data
recording when the specific playback signal quality is
achieved.
By recording with recording power having assured
upper and lower power margins, an optical disc drive
according to the present invention can correctly record data
even when recording by an optical disc drive that records
with power effectively weaker than the emission power
determined in the area for determining the optimum
emission power to an area recorded by an optical disc drive
that records with power effectively stronger than the
emission power set in the area for determining the optimum
emission power.
Moreover, data can be recorded more accurately
by recording with recording power considering cases in
which adjacent tracks are recorded.
Brief Description of Drawings
Fig. 1 is a block diagram of an optical disc drive
according to an embodiment of the present invention,
Fig. 2 is a track configuration diagram for an
optical disc according to an embodiment of the present
invention,
Fig. 3 is a graph showing the correlation between
peak power and BER,
Fig. 4 is a flow chart of an embodiment of the
present invention,
Fig. 5 is a flow chart of an embodiment of the
present invention,
Fig. 6 is a flow chart of an embodiment of the
present invention,
Fig. 7 is a flow chart of an embodiment of the
present invention,
Fig. 8 is a flow chart of an embodiment of the
present invention,
Fig. 9 is a flow chart of an embodiment of the
present invention,
Fig. 10 is a flow chart of an embodiment of the
present invention,
Fig. 11 is a configuration diagram of an ECC
block in an embodiment of the present invention,
Fig. 12 is a graph of the correlation between
peak power and jitter,
Fig. 13 is a graph of the correlation between
peak power and recording mark width,
Fig. 14 is a block diagram of an optical disc drive
according to the prior art,
Fig. 15 is a track configuration diagram of an
optical disc drive according to the prior art,
Fig. 16 is a graph of the correlation between
peak power and BER, and
Fig. 17 is a flow chart according to the prior art.
Best Mode for Carrying Out the Invention
An optical disc drive according to an embodiment
of the present invention is described below with reference
to the accompanying figures.
Fig. 1 shows the configuration of a phase-change
optical disc drive according to an embodiment of the
present invention. In Fig. 1 100 is a control means, 101 is
an optical disc, 102 is an optical head, 103 is a playback
means, 104 is a playback signal quality detection means,
105 is an optimum recording power determining means, 106
is a recording means, 107 is a laser drive circuit, and 108
is a recording power setting means.
Fig. 2 shows the track configuration of an optical
disc 101 in an embodiment of the invention. The optical
disc 101 is an optical disc having recording areas in both
the groove-shaped tracks (groove tracks 202, 203) and the
tracks between grooves (land tracks 201, 204), forming a
continuous spiral by alternating the groove tracks and land
tracks every revolution.
After the optical disc 101 is loaded into the
optical disc drive and specific operations for identifying the
disc type and rotation control are completed, the optical
head 102 moves to a test area for determining the optimum
recording power.
This test area is part of the recording area and is
an area provided at the innermost circumference or the
outermost circumference of the disc. There is also a user
area for the user to record data in the recording area. An
operation for determining the recording power is described
below. A sequence of operations by the optical head 102,
playback means 103, playback signal quality detection
means 104, optimum recording power determining means
105, recording means 106, laser drive circuit 107, and
recording power setting means 108 is controlled by the
control means 100.
First, initial values for the peak power and bias
power are set in the laser drive circuit 100 by the recording
power setting means 108. The power for recording to a land
track and the power for recording to a groove track are
equal at this time.
A test signal for continuously test recording at
least one land track revolution or one groove track
revolution from a specific position in the test area is then
sent from the recording means 106 to the laser drive circuit
107 and recorded by the optical head 102. A case in which
one land track revolution and one groove track revolution
are continuously test recorded is described in this
embodiment. There are approximately 30 sectors in one
land track revolution of the test area, and approximately 30
sectors in one groove track revolution. Light output from
the semiconductor laser that is a component of the optical
head 102 is focused as a spot on the optical disc 101 and a
recording mark is formed according to the light emission
waveform.
When test recording ends the semiconductor
laser of the optical head 102 emits at the playback power
level, continuously reads the previous test-recorded land
track revolution and groove track revolution, and a playback
signal 109 that changes according to the presence of
recording marks on the optical disc 101 is input to the
playback means 103 as a playback signal. The playback
signal 109 is then subject to playback signal processing
such as amplification, waveform equalization, and digitizing,
and signal 110 is input to playback signal quality detection
means 104.
The playback signal quality detection means 104
detects the signal quality of signal 110, and inputs the
detection result to the optimum recording power
determining means 105. When the number of sectors
reproduced from the land track and the number of sectors in
the groove track are substantially equal, the reproduced
signal quality detection result is the average reproduced
signal quality result of both land and groove tracks.
The playback signal quality detection means 104
here detects the BER (byte error rate) when reproducing
the test-recorded signal. Fig. 3 shows the relationship
between peak power and BER. In Fig. 3 the horizontal axis
is peak power and the vertical axis is the BER. If the
playback conditions are equal, recording accuracy generally
increases as the BER decreases.
Therefore, the BER is detected for each sector
for the approximately 60 sectors in the test-recorded land
track revolution and groove track revolution, and when the
detected BER is less than or equal to a specific threshold
value the sector is considered an OK sector (a sector that
was appropriately recorded), and when it is greater than or
equal to a specific threshold value the sector is considered
an NG sector (a sector that was not appropriately recorded).
The control means 100 controls power
determination according to a flow chart as shown in Fig. 4
and Fig. 5, for example.
In step 402 the optical head moves to the test
area.
In step 403 the initial peak power is determined.
This can use a value predetermined for the playback device,
can use a value determined in a previous power
determination operation in the playback device and
recorded and stored in the playback device, can use a
value pre-written to the optical disc, or can use a value
determined in a previous power determination operation in
a separate playback device and recorded and stored to the
optical disc. This step 403 is executed particularly by the
recording power setting means 108.
A land/groove recording/playback test is
performed in step 406. As described above this test
continuously test records one land track revolution and one
groove track revolution in the test area, and then
continuously plays back the same land track and groove
track. This step 406 is performed particularly by the
recording means 106 and playback means 103.
In step 407A the BER is detected for each sector,
and an OK sector or NG sector determination is made. In
addition, whether half or more of the sectors is an OK
sector is determined for the approximately 60 sectors in the
test-recorded land track and groove track. If half or more of
the sectors are OK sectors (that is, if the detection result is
OK), the process advances to step 407B, and if half or more
of the sectors are NG sectors (that is, the detection result
is NG), the procedure advances to step 407C.
In step 407B the OK flag denoting detection
result OK is set and the procedure advances to step 408.
In step 407C the NG flag denoting detection
result NG is set and the procedure advances to step 409.
These steps 407A, 407B, and 407C are executed
particularly by the playback signal quality detection means
104.
Whether the NG flag is set, that is, whether
detection result NG resulted from step 407A in the past (not
the immediately preceding, but step 407A once before), is
determined in step 408. If it was output, the procedure
advances to step 410A. If not, the procedure goes to step
404A.
In step 404A the currently set peak power is
lowered a specific amount, for example, 5% below the
initial power setting.
Whether the peak power after being lowered is
less than a predetermined minimum power Pmin is
determined in step 404B. If less, recording stops. If not
less, the procedure returns to step 406 and the land/groove
recording/playback test runs.
Whether the OK flag is set, that is, whether
detection result OK was output in a past step 407A (not the
immediately preceding, but step 407A once before), is
determined in step 409. If it was, the procedure advances
to step 410A. If it was not output, the procedure goes to
step 405A.
In step 405A the currently set peak power is
increased a specific amount, for example, 5% above the
initial power setting.
Whether the peak power after being increased is
greater than a predetermined maximum power Pmax is
determined in step 405B. If greater, recording stops. If not
greater, the procedure returns to step 406 and the
land/groove recording/playback test runs.
In step 410B the average power (P1) is obtained
from the next equation.
P1 = {Pn + (Pn-1)}/2
where Pn is the selected peak power set after step 404A or
after step 405A, and P(n-1) is the previous peak power set
before step 404A or before step 405A in the routine in
which the selected peak power was obtained.
In step 411 a provisional peak power (P2) is
obtained from the following equation.
P2 = K1 x P1
where coefficient K1 is a value K1 > 1 and adds a margin to
P1. For example, if K1 = 1.2, a margin of 20% is added.
Steps 408, 404A, 404B, 409, 405A, and 405B are executed
particularly by the optimum recording power determining
means 105.
When average power P1 is thus determined it is
decided in step 410B after passing step 4078 at least once
and passing step 407C in the next routine (or after passing
step 407C at least once and then passing step 407B in the
next routine). This is to set the average peak power P1
near the boundary between the power area where an OK
sector is obtained and the power area where an NG sector
is obtained, that is, near boundary point PB in Fig. 3.
Three typical cases in which average peak power
(P1) and provisional peak power (P2) are calculated are
described next.
If half or more of the sectors are NG sectors in
the first results from playback signal quality detection
means 104 and half or more of the sectors are OK sectors
in the second results, the optimum recording power
determining means 105 calculates the provisional peak
power (P2) adding a specific margin to the peak power from
the first pass and the average power (P1) of the peak power
in the second pass.
If half or more of the sectors are OK sectors in
the first results from playback signal quality detection
means 104 and half or more of the sectors are NG sectors
in the second results, the optimum recording power
determining means 105 calculates the provisional peak
power (P2) adding a specific margin to the peak power from
the first pass and the average power (P1) of the peak power
in the second pass.
If half or more of the sectors are OK sectors in
the first results from playback signal quality detection
means 104 and half or more of the sectors are also OK
sectors in the second results, a power level less than the
peak power used for recording the second time is set,
recording and playback are repeated at this peak power
level, and playback signal quality is detected. If half or
more of the sectors are NG sectors in the third results from
the playback signal quality detection means 104, the
optimum recording power determining means 105 calculates
provisional peak power (P2) adding a specific margin to the
peak power from the second pass and the average power
(P1) of the peak power in the third pass.
A method for further adjusting the provisional
peak power (P2) calculated in step 411 and obtaining the
optimum peak power (P5) is described next using the flow
chart in Fig. 5.
The provisional peak power (P2) will differ
according to the recording device in products from different
manufacturers, different models from the same
manufacturer, and different production periods, but is
expected to be within an allowable range (margin).
The upper limit (P3) for the provisional peak
power is estimated in step 412, and a land/groove recording
test using this upper limit is run in step 413. Upper limit
(P3) is estimated using the next equation.
P3 = K2 x P2
where coefficient K2 is a value K2 > 1, for example, K2 =
1.05 to 1.10.
A lower limit (P4) for the provisional peak power
is estimated in step 414, and a land/groove recording test
using this lower limit is run in step 415 in the same area as
the test area recorded in step 413. Lower limit (P4) is
estimated using the next equation.
P4 = K3 x P2
where coefficient K3 is a value K3 < 1, for example, K3 =
0.90 to 0.95.
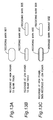
A mark from the recording test performed in step
413 is shown in Fig. 13 (a). Because the provisional peak
power is at the upper limit in this case, the mark is a
relatively fat mark. The mark from the recording test
performed in step 415 is shown in Fig. 13 (c). Because the
provisional peak power is at the lower limit in this case, the
mark is a relatively narrow mark, and an unerased mark
remnant of the fat mark is left around the narrow mark.
Note that Fig. 13 (b) shows a case in which an unrecorded
track is recorded with the provisional peak power at the
lower limit.
To check whether such a remnant will adversely
affect the playback signal, the BER of each sector is
detected and the sectors are determined to be OK sectors
or NG sectors in step 416. Whether 2/3 or more of the
approximately 60 sectors in the test-recorded land track
revolution and groove track revolution are OK sectors is
also determined. If 2/3 or more of the sectors are OK
sectors (that is, the detection result is OK), the procedure
advances to step 417, and if 1/3 or more of the sectors are
NG sectors (that is, the detection result is NG), the
procedure advances to step 418.
The optimum peak power P5 is calculated from
the next equation in step 417.
P5 = K4 x P3 + (1-K4) x P4
where coefficient K4 is a value K4 < 1, such as K4 = 0.5.
Because the playback signal quality should be
better than the playback signal quality in step 416 when the
playback signal quality is checked by overwriting within the
allowable range using power less than or equal to the upper
limit and greater than or equal to the lower limit of the
provisional peak power, the power (P5) internally dividing
P4 and P3 at a specific ratio is determined to be the peak
power for user data recording.
K1 is increased in step 418. For example, 20% to
25% of the original K1 is added.
It should be noted that the internal division ratio
may be set with consideration for the average offset
between the emission power determined in the area for
determining the optimum emission power and the emission
power for user data recording. If the detection result is OK
in step 416 when the average offset is small, P2 calculated
in step 411 can be used directly as P5.
It should be noted that the playback signal
quality detection method is the same in step 407 and step
416 while changing the level for an OK detection result, but
different detection methods can be used as described below.
It should be noted that one land track revolution
and one groove track revolution are used as the period for
continuous recording and continuous playback in the
present embodiment, but recording can be by sector unit in
an optical disc drive that records by sector unit.
Likewise, one land track revolution and one
groove track revolution are used as the period for
continuous recording and continuous playback in the
present embodiment, but recording can be by block unit in
an optical disc drive that records by block unit.
For example, playback signal quality can be
detected by recording in ECC (error code correction) block
units and counting the number of detected errors. Fig. 11
shows the configuration of a DVD-RAM ECC block; one ECC
block is 182 bytes x 208 bytes. Because P1 here is the
horizontal parity code and P0 is the- vertical parity code,
and errors can be detected by detecting these, the block is
determined NG if, for example, an error is detected in the
vertical direction from 8 or more rows of the 208 rows, and
the block is OK if an error is detected in less than eight
rows.
By recording with recording power having assured
upper and lower power margins as described in this
embodiment of the invention, data can be correctly
recorded even when recording with power effectively
weaker than the emission power determined in the area for
determining the optimum emission power to an area
recorded with power effectively stronger than the emission
power set in the area for determining the optimum emission
power.
It should be noted that reasons for the emission
power during user data recording to differ from the
emission power set in the area for determining the optimum
emission power include, for example, a relative tilt between
the two areas due to disc warpage or the head installation,
variation in the radial direction in the recording sensitivity
of the disc itself, variation from the set power in the laser
power actually output from the optical head, and smudging
in the area for determining the optimum emission power. It
should be noted that in addition to the above items the
upper and lower power margins depend on multiple factors
including the recording performance of the disc and error
correction capability, but approximately ±5% to ±10% is
appropriate, and an improvement in performance or a
reduction in variation is conversely required if a greater
margin is necessary.
Furthermore, because the optimum power differs
slightly due to slight variations in disc properties in high
density recording where the mark length is 0.5 µm or less,
optimized recording with an assured power margin is
possible by optimizing the margin coefficient K1.
It should be noted that the margin coefficient K1,
high power setting coefficient K2, lower power setting
coefficient K3, and optimum peak power setting coefficient
K4 can be stored in the optical disc drive or recorded to a
specific area on disc.
It should be noted that because the margin
coefficient K1 could be changed, the changed value could
be stored to the optical disc drive with the information
identifying the disc, or it could be recorded to a specific
area on the disc together with information for identifying
the optical disc drive. By storing the value of K1 after it is
changed, the optimum recording power can be efficiently
determined at the time of the next recording.
It should be further noted that test recording is
performed in step 413 after test recording in step 406 in the
present embodiment, but test recording at power level P2
can be done before test recording at high power, and
erasing with bias power can also be done. This can reduce
the effects of unerased mark remnants due to recording
until P1 is determined.
Because power may be insufficient in the area for
recording user data if there is substantially no tilt to the
optical axis in the area for determining the optimum
emission power of the disc, recording is done at the power
(P2) to which the margin is not added (step 513) as shown
in the flow charts in Fig. 6 and Fig. 7, power (P4) reduced
by the margin is then set (step 514), recording and
playback are done at power (P4) (step 515), and the
playback signal quality is detected (step 516). If the
detection result is OK, a specific power (P5) greater than or
equal to P4 and less than or equal to P2 is set as the peak
power for user data recording (step 517).
When test recording in the area for determining
the optimum emission power often only the minimum
necessary tracks are recorded in order to conserve the test
recording area and shorten the power setting time. For
example, if test recording is done in part of groove track
202 and part of land track 204 in Fig. 2, the optimum
recording power can be determined for at least a groove
track and land track. However, recording is to adjacent
tracks in most cases when actually recording user data, and
adjacent tracks may also be recorded at other times.
Because this means it is possible for playback signal
quality to degrade in the same track, more precise
recording according to user data recording requirements is
possible by continuously recording to land track 201,
groove track 202, land track 204, and groove track 203 to
determine the optimum recording power. A power
determination method considering recording to adjacent
tracks is shown in the flow charts in Fig. 8, Fig. 9, and Fig.
10.
It should be noted that the same detection
method can be used for detecting playback signal quality
while changing the level for, determining an OK detection
result in step 607 and steps 616 and 622, or different
detection methods could be used.
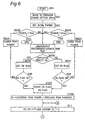
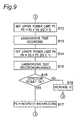
Note that this embodiment adds a process for
recording adjacent tracks shown in Fig. 10 after the power
margin confirmation process shown in Fig. 8 and Fig. 9
(which are the same as Fig. 4 and Fig. 5). This has the
effect of determining the optimum recording power with
consideration for adjacent tracks even in cases where
power margin confirmation is not included.
The power is set in step 619. For example, the
peak power is set to the power (P5) obtained in step 617.
Four tracks, that is, land track 201, groove track
202, land track 204, and groove track 203, are continuously
recorded in step 620.
The same four tracks are then played back in
step 621.
The same check done in steps 607 and 616 is
then performed in step 622, the procedure advances to step
623 if some specific percentage (2/3, for example) or more
of the sectors are OK sectors (that is, the detection result
was OK), and the procedure advances to step 624 if some
specific percentage (1/3, for example) or more of the
sectors are NG sectors (that is, the detection result was
NG). Because an NG detection result means that peak
power was high, a fat mark is recorded and a mark on an
adjacent track could be falsely read during playback.
K1 is then reduced in step 624. If the value of K1
is 1.2, for example, it is reduced to 1.18. The percentage of
the reduction is, for example, approximately 2% of the first
K1 value.
Peak power (P5) is then set as the optimum peak
power (P6) in step 623.
It should be noted that four tracks are
continuously recorded in this embodiment, but the invention
shall not be limited to four tracks insofar as both adjacent
tracks to the track from which playback signal quality is
detected are recorded. Furthermore, if the optimum
recording power is determined for land tracks only, for
example, it is sufficient to record three or more tracks.
It should be further noted that continuous track
recording in step 620 follows recording in step 615 in the
present embodiment, but recording at power P2 could
precede continuous track recording, or erasing at the bias
power level could be done. This can reduce the effects of
unerased mark remnants, for example, due to power margin
confirmation.
It should be further noted that the playback
signal quality detection means 104 detects the BER (byte
error rate) when playing back the recorded signal in this
present embodiment, but the invention shall not be limited
to the BER (byte error rate) and something else such as the
bit error rate or jitter, for example, could be used insofar as
playback signal quality can be detected.
A method for detecting jitter is described as an
example of another method. The relationship between peak
power and jitter is shown in Fig. 12. The horizontal axis in
Fig. 12 is peak power and the vertical axis is jitter.
Jitter is a temporal offset between the playback
signal and source signal, occurs because of a drop in the
playback signal amplitude due to insufficient laser emission
power, for example, decreases as the playback signal
amplitude increases, and is substantially constant when the
playback signal amplitude is saturated. Jitter is also
increased by remnants such as shown in Fig. 13. If the
playback conditions are equal, recording is generally more
accurate as jitter decreases. A sector is an OK sector if
jitter is less than or equal to some threshold value, and is
an NG sector if greater than or equal to the threshold value.
Jitter can be detected, for example, using the
output signal of a phase comparator comprising a PLL
(phase locked loop) circuit that extracts a synchronization
signal synchronized to the basic period of a digitized signal.
It should be noted that the playback signal
quality detection means 104 of the present embodiment
evaluates each sector without distinguishing land tracks
and groove tracks, but each sector can be evaluated
separately by land tracks and groove tracks. By separately
evaluating land tracks and groove tracks the recording
power can be set appropriately for each track when the
recording characteristics differ between the tracks.
Furthermore, by distinguishing land tracks and
groove tracks during playback, it is not necessary to play
back the other track after the recording power is
determined for one track, and less time is needed for
recording power determination.
It should be noted that the recording power
setting means 108 sets the recording power without
distinguishing land tracks and groove tracks, but the
recording power can be set separately for land tracks and
groove tracks. By distinguishing land tracks and groove
tracks recording power appropriate to each track can be set
as the initial power setting when the recording
characteristics differ between the tracks, the number of
times the recording power is set can be reduced, it is not
necessary to record the other track after the recording
power is determined for one track, less time is needed for
recording power determination, and deterioration due to
repeated recording can be reduced.
It will be further noted that the present
embodiments are described with reference to an optical
disc capable of recording to both land tracks and groove
tracks, but also apply to optical discs that record to only
one track.