EP1256788B1 - Verfahren und System zur optischen Spektrumsanalyse mit Korrektur einer ungleichmässigen Abtastrate - Google Patents
Verfahren und System zur optischen Spektrumsanalyse mit Korrektur einer ungleichmässigen Abtastrate Download PDFInfo
- Publication number
- EP1256788B1 EP1256788B1 EP02002177A EP02002177A EP1256788B1 EP 1256788 B1 EP1256788 B1 EP 1256788B1 EP 02002177 A EP02002177 A EP 02002177A EP 02002177 A EP02002177 A EP 02002177A EP 1256788 B1 EP1256788 B1 EP 1256788B1
- Authority
- EP
- European Patent Office
- Prior art keywords
- local oscillator
- signal
- optical
- frequency
- sweep rate
- Prior art date
- Legal status (The legal status is an assumption and is not a legal conclusion. Google has not performed a legal analysis and makes no representation as to the accuracy of the status listed.)
- Expired - Lifetime
Links
- 230000003287 optical effect Effects 0.000 title claims description 132
- 238000012937 correction Methods 0.000 title claims description 22
- 238000000034 method Methods 0.000 title claims description 14
- 238000010183 spectrum analysis Methods 0.000 title claims description 9
- 238000001228 spectrum Methods 0.000 claims description 55
- 238000005259 measurement Methods 0.000 claims description 50
- 239000006185 dispersion Substances 0.000 claims description 17
- 238000001514 detection method Methods 0.000 claims description 14
- 230000000694 effects Effects 0.000 claims description 7
- 239000000835 fiber Substances 0.000 description 39
- 239000013307 optical fiber Substances 0.000 description 14
- 230000001419 dependent effect Effects 0.000 description 5
- 230000005540 biological transmission Effects 0.000 description 4
- 230000010287 polarization Effects 0.000 description 4
- 238000012545 processing Methods 0.000 description 4
- 230000003595 spectral effect Effects 0.000 description 4
- 230000001934 delay Effects 0.000 description 3
- 230000003111 delayed effect Effects 0.000 description 3
- 230000001427 coherent effect Effects 0.000 description 2
- 238000010586 diagram Methods 0.000 description 2
- BJQHLKABXJIVAM-UHFFFAOYSA-N bis(2-ethylhexyl) phthalate Chemical compound CCCCC(CC)COC(=O)C1=CC=CC=C1C(=O)OCC(CC)CCCC BJQHLKABXJIVAM-UHFFFAOYSA-N 0.000 description 1
- 230000000903 blocking effect Effects 0.000 description 1
- 230000007423 decrease Effects 0.000 description 1
- 238000012544 monitoring process Methods 0.000 description 1
- 230000000737 periodic effect Effects 0.000 description 1
- 230000005855 radiation Effects 0.000 description 1
- 230000002269 spontaneous effect Effects 0.000 description 1
Images


Classifications
-
- G—PHYSICS
- G01—MEASURING; TESTING
- G01J—MEASUREMENT OF INTENSITY, VELOCITY, SPECTRAL CONTENT, POLARISATION, PHASE OR PULSE CHARACTERISTICS OF INFRARED, VISIBLE OR ULTRAVIOLET LIGHT; COLORIMETRY; RADIATION PYROMETRY
- G01J9/00—Measuring optical phase difference; Determining degree of coherence; Measuring optical wavelength
- G01J9/04—Measuring optical phase difference; Determining degree of coherence; Measuring optical wavelength by beating two waves of a same source but of different frequency and measuring the phase shift of the lower frequency obtained
-
- G—PHYSICS
- G01—MEASURING; TESTING
- G01J—MEASUREMENT OF INTENSITY, VELOCITY, SPECTRAL CONTENT, POLARISATION, PHASE OR PULSE CHARACTERISTICS OF INFRARED, VISIBLE OR ULTRAVIOLET LIGHT; COLORIMETRY; RADIATION PYROMETRY
- G01J3/00—Spectrometry; Spectrophotometry; Monochromators; Measuring colours
- G01J3/28—Investigating the spectrum
- G01J3/45—Interferometric spectrometry
- G01J3/453—Interferometric spectrometry by correlation of the amplitudes
Definitions
- the invention relates generally to the field of optical measurements and measuring systems, and more particularly to a method and system for optical spectrum analysis that utilizes optical heterodyne detection.
- DWDM Dense wavelength division multiplexing
- OSAs optical spectrum analyzers
- grating-based OSAs and autocorrelation-based OSAs encounter mechanical constraints, such as constraints on beam size and the scanning of optical path lengths, which limit the spectral resolution that can be obtained.
- optical heterodyne detection systems can be utilized to monitor DWDM systems.
- optical heterodyne detection systems can be utilized for optical spectrum analysis of an input optical signal.
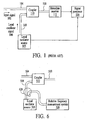
- Fig. 1 is a depiction of a prior art heterodyne-based OSA that includes an optical coupler 110 that combines an input signal 102 from an input fiber 104 with a swept local oscillator signal 106 from a local oscillator source 105 via local oscillator fiber 108.
- the combined optical signal travels on an output fiber 118 and is detected by a heterodyne receiver 112.
- the heterodyne receiver converts optical radiation from the combined optical signal into an electrical signal.
- Square law detection results in mixing of the two combined optical signals and produces a heterodyne beat signal at a frequency that is equal to the frequency difference between the combined optical signals.
- the heterodyne beat signal is processed by a signal processor 116 to determine a characteristic of the input signal, such as frequency, wavelength, or amplitude.
- a constant sweep rate is ideal, known local oscillator sources produce local oscillator signals that sweep at non-uniform rates.
- Fig. 2 depicts an example graph of a local oscillator signal 206 that has a non-uniform sweep rate. The non-uniformity of the local oscillator signal sweep rate causes inaccurate frequency measurements of the input signal.
- FIG. 3 depicts an example input signal spectrum, including multiple DWDM channels 309, which may be input into the heterodyne-based OSA. As depicted in Fig. 3, each of the DWDM channels is separated by a frequency band of the same width.
- Fig. 4 depicts an example output from a heterodyne-based OSA that results from the non-uniformly swept local oscillator signal depicted in Fig. 2 in relation to the input signal spectrum of Fig. 3. As shown in Fig. 4, the measured spectrum that results from the non-uniformly swept local oscillator signal does not accurately reflect the actual input signal spectrum. Specifically, the non-uniformity in the local oscillator signal sweep rate translates directly into errors in the accuracy of the measured signal spectrum (as indicated by the channels that have a different channel spacing than the channels depicted in Fig. 3).
- heterodyne-based OSA that can correct for the non-uniformities in the sweep rate of a local oscillator source.
- European Patent Application EP 0 855 811 discloses a scanning based wavelength measurement system which is based on a fixed cavity Fabry-Perrot Etalon which, when the output of a tunable laser is passed through it, produces a number of reference equi-spaced transmission maxima.
- EP 1 130 813 and EP 1 182 805 disclose optical heterodyne detection systems comprising a frequency counter for monitoring the frequency of the local oscillator signal.
- the frequency information is utilized by the processor to improve the wavelength accuracy of the heterodyne measurement.
- a method and system for heterodyne-based optical spectrum analysis involve the features disclosed in claims 1 and 5.
- Fig. 5 depicts an embodiment of a heterodyne-based OSA that utilizes sweep rate correction to generate corrected spectrum information.
- the optical spectrum analyzer includes a signal fiber 504, a local oscillator source 505, a local oscillator fiber 508, an optical coupler 510, a heterodyne receiver 512, a signal processor 516, and a relative frequency measurement system 520.
- the heterodyne-based OSA may also include an optional attenuator 522 and an optional optical filter 524 that are optically connected to attenuate and filter the input signal. It should be noted that throughout the description, similar reference numerals are utilized to identify similar elements.
- the signal fiber 504 carries an input signal that is to be detected by the heterodyne-based OSA.
- the signal fiber is a single mode optical fiber as is known in the field.
- the optical signals that are carried in optical fibers may alternatively be carried in other types of optical waveguides or in free space.
- the input signal 502 includes optical signals that are generated from conventional devices as is known in the field of optical communications systems.
- the input signal may be generated from a single laser or multiple lasers and may consist of a single wavelength or multiple wavelengths as is known in the field of wavelength division multiplexing.
- the input signal is typically modulated to carry digital information as is known in the field of optical communications.
- the input signal 502 has unknown optical characteristics that are measured by the optical spectrum analyzer.
- the input signal may alternatively be an optical signal that is input with known optical characteristics, in which case the optical spectrum analyzer can be utilized for optical network or component analysis.
- the optical spectrum analyzer is utilized for optical network or component analysis, the characteristics of a network or a single component can be determined by inputting a known input signal into the network or the single component and then measuring the response to the known signal.
- the local oscillator source 505 generates a swept local oscillator signal.
- the local oscillator source is a highly coherent tunable laser, such as an external cavity laser, that is tunable over a wavelength range of one nanometer or greater.
- the local oscillator source generates a highly coherent local oscillator signal that is swept across a range of frequencies, or wavelengths, in order to detect the input signal over the range of frequencies or wavelengths.
- the sweep rate of the local oscillator signal at 1,550 nanometers is approximately 6.15 / ⁇ s or 40nm/s, however the sweep rate can be higher or lower and the sweep range is approximately 100 nm.
- the local oscillator source has an optical output that is connected to the coupler and another optical output that is connected to the relative frequency measurement system 520.
- the optical output that is connected to the coupler outputs a high power local oscillator signal and the optical output that is connected to the relative frequency measurement system outputs a low power source spontaneous emission (SSE) that has a characteristic of low optical noise.
- the local oscillator source also has an electrical output that outputs frequency information to the signal processor (as indicated by line 526).
- the local oscillator source provides, to the signal processor, absolute frequency information that indicates the absolute frequency of the swept local oscillator signal.
- the absolute frequency information is obtained from circuitry that controls the local oscillator source.
- the local oscillator source provides absolute frequency information, the absolute frequency information is not a measure of the actual frequency of the swept local oscillator signal and typically does not reflect non-uniformities in the frequency sweep rate of the local oscillator signal.
- the local oscillator source has one optical output that is optically connected to the coupler.
- a portion of the swept local oscillator signal is tapped off from the main signal and the tapped portion is optically connected to the relative frequency measurement system.
- Fig. 6 depicts a tap 528 located between the local oscillator source 505 and the coupler 510. The tap provides a sample of the swept local oscillator signal to the relative frequency measurement system 520.
- the local oscillator fiber 508 is an optical fiber, such as a single mode optical fiber, that carries the local oscillator signal 506 to the optical coupler 510.
- the optical coupler 510 combines the input signal 502 and the swept local oscillator signal 506 onto a common waveguide. As shown in Fig. 5, the optical coupler combines the input signal and the swept local oscillator signal and distributes the combined optical signal into an output fiber 518. Output fiber 518 guides the combined optical signal to the heterodyne receiver 512. Although only one output fiber is shown in Fig. 5, more than one output fiber can be utilized to transmit portions of the combined optical signal to the heterodyne receiver 512 for balanced detection.
- the optical coupler 510 may be a 3dB fiber-optic coupler, although other optical couplers may be utilized.
- the optical coupler is substantially independent of the wavelength and polarization of the input signal 502 and the swept local oscillator signal 506.
- the optical coupler is a single mode coupler.
- the output fiber 518 is a single mode optical fiber that carries the combined optical signal from the optical coupler 510 to the heterodyne receiver 512. Multiple output fibers may be utilized when the heterodyne receiver is, for example, a balanced receiver.
- the heterodyne receiver 512 is connected to receive the combined optical signal from the optical coupler 510.
- the heterodyne receiver utilizes square law detection, which results in mixing of the input signal and the swept local oscillator signal. Mixing of the two optical signals produces a heterodyne beat signal at a frequency that is equal to the frequency difference between the input signal and the swept local oscillator signal.
- the heterodyne beat signal generated by the heterodyne receiver is provided to the signal processor 516 via an electrical connection 564.
- the heterodyne receiver may include photodetectors, signal amplifiers, filters, and analog-to-digital converters, as is known in the field.
- the heterodyne receiver may utilize other detection devices, such as a non-linear mixing element.
- Other configurations of the heterodyne receiver may be implemented, such as, for example, a balanced receiver.
- the relative frequency measurement system 520 receives a portion of the swept local oscillator signal and outputs measured local oscillator frequency sweep rate information to the signal processor 516 (as indicated by line 530).
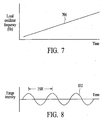
- the relative frequency measurement system includes an interferometer that yields measured local oscillator sweep rate information in the form of a fringe pattern signal that is generated in response to a swept input optical frequency. Example embodiments of the relative frequency measurement system are described below with reference to Figs. 18 - 24.
- the interferometer produces a sinusoidal fringe pattern signal (or multiple fringe patterns if multiple photodetectors are used) in which the change in optical frequency of the input local oscillator signal can be determined by counting the peaks (or other features) of the sinusoidal fringe pattern signal.
- the peaks of the sinusoidal fringe pattern signal represent the free spectral range (FSR) of the interferometer and the free spectral range is inversely proportional to the delay ( ⁇ ) of the interferometer.
- the time that elapses between each peak of the sinusoidal fringe pattern signal is used to calculate the sweep rate of the optical frequency.
- Fig. 8 is a graph of the fringe pattern signal 832 that is detected from an interferometer in response to the optical signal 706 depicted in Fig. 7.
- the period of the sinusoidal fringe pattern signal which is equivalent to the FSR, is constant with respect to time, and therefore represents a constant sweep rate.
- Fig. 9 is a graph of the frequency of an optical signal 906 that sweeps at a non-uniform rate for some portion of time
- Fig. 10 is a graph of the fringe pattern signal 1032 that is generated from an interferometer in response to the optical signal 906 depicted in Fig. 9.
- the period of the sinusoidal fringe pattern signal is not constant with respect to time.
- the rate of change of the frequency can be determined by counting the peaks of the fringe pattern signal and dividing by the elapsed time between each peak. The different time intervals between the peaks of the fringe pattern signal represent the non-uniformity in the sweep rate of the input signal's optical frequency.
- the signal processor 516 includes a multifunction processor that receives electrical signals from the heterodyne receiver 512, from the local oscillator source 505, and from the relative frequency measurement system 520.
- the processor isolates the heterodyne beat signal and utilizes the frequency information from the local oscillator source and from the relative frequency measurement system to generate an output signal that is indicative of an optical parameter, such as optical frequency, wavelength, or amplitude, of the input signal 502.
- the signal processor may include analog signal processing circuitry, digital signal processing circuitry, or software or any combination thereof, as is known in the field of electrical signal processing. The signal processor is described below with reference to Fig. 16.
- Fig. 11 depicts an example of the signal processor of Fig. 5.
- the signal processor 1116 in the embodiment of Fig. 11 includes a spectrum measurement module 1136 and a sweep rate correction module 1138.
- the spectrum measurement module receives the heterodyne beat signal from the heterodyne receiver and absolute frequency information from the local oscillator source and outputs measured spectrum information.
- the sweep rate correction module receives the measured spectrum information from the spectrum measurement module and the measured local oscillator frequency sweep rate information (i.e., the fringe pattern signal) from the relative frequency measurement system and outputs corrected spectrum information.
- the sweep rate correction module utilizes the fringe pattern signal to generate actual sweep rate information and then uses the actual sweep rate information to correct the frequency scale of the measured spectrum information.
- the corrected spectrum information is corrected to account for non-uniformities in the frequency sweep rate of the local oscillator signal.
- the spectrum measurement and sweep rate correction modules may be sub-elements of a multifunction processor and may include hardware or software, or any combination thereof.
- the local oscillator source 505 generates a swept local oscillator signal 506 that is transmitted through the local oscillator fiber 508 to the optical coupler 510.
- a sample of the swept local oscillator signal is also transmitted through the sample fiber 540 to the relative frequency measurement system 520 and absolute local oscillator frequency information is provided to the signal processor via the electrical connection 526.
- An example graph of the swept local oscillator signal frequency versus time is depicted in Fig. 12.
- the non-uniform sweep rate is represented by the non-linear section of the frequency versus time graph.
- an input signal 502 propagates through the input fiber 504 of the heterodyne-based OSA towards the optical coupler 510.
- An example signal spectrum of the input signal is depicted in Fig. 13.
- the input signal is a wavelength division multiplexed signal that includes multiple evenly spaced channels 1309. For example, each of the channels may be spaced apart by 100 GHz.
- the input signal and the swept local oscillator signal are combined by the optical coupler into a combined optical signal.
- the combined optical signal is output onto output fiber 518 and transmitted to the heterodyne receiver 512.
- the combined optical signal is detected and mixed by the heterodyne receiver.
- a heterodyne beat signal is generated in response to the combined optical signal and the heterodyne beat signal is output to the signal processor via the electrical connection 564. Meanwhile, the frequency sweep rate of the swept local oscillator signal sample that is received by the relative frequency measurement system is measured and measured local oscillator sweep rate information is output to the signal processor.
- the spectrum measurement module 1136 receives the heterodyne beat signal from the heterodyne receiver and the absolute local oscillator frequency information from the local oscillator source.
- the spectrum measurement module utilizes the heterodyne beat signal and the absolute local oscillator frequency information to generate measured spectrum information.
- Fig. 14 depicts the measured spectrum that is generated in response to the input signal spectrum that is depicted in Fig. 13 and the non-uniformly swept local oscillator signal that is depicted in Fig. 12.
- the measured spectrum of Fig. 14 does not accurately reflect the input signal spectrum of Fig.
- the sweep rate correction module 1138 receives the measured spectrum information from the spectrum measurement module 1136 and the measured local oscillator frequency sweep rate information (i.e., a fringe pattern signal) from the relative frequency measurement system.
- the sweep rate correction module utilizes the measured spectrum information and the measured local oscillator frequency sweep rate information to generate corrected spectrum information.
- the corrected spectrum information takes into account the non-uniformities in the sweep rate of the local oscillator signal. That is, the corrected spectrum information corrects the horizontal scale of the amplitude versus optical frequency graph that is typically displayed by an OSA.
- Fig. 15 depicts the corrected spectrum information that is generated by the sweep rate correction module in response to the measured spectrum information and the measured local oscillator frequency sweep rate information.
- the corrected spectrum information depicted in Fig. 15 accurately reflects the input signal spectrum that is depicted in Fig. 13.
- the optional attenuator 522 is integrated into the input fiber 504 in order to attenuate the input signal 502. Attenuating the input signal reduces the intensity noise that is generated by the input signal during detection by the heterodyne receiver 512.
- the particular type of attenuator is not critical and therefore various types of attenuators, as are known in the field of optical attenuation, may be utilized.
- the attenuator is adjustable such that the level of attenuation can be varied as needed to control the intensity of the input signal that is passed to the optical coupler 510. In an embodiment, the attenuator can be adjusted to completely block transmission of the input signal. Completely blocking transmission of the input signal can be useful during system calibration.
- the optional optical filter 524 is a tunable bandpass filter that is tuned to track the swept local oscillator signal 506. That is, the optical filter is tuned so that the optical filter has the highest optical transmission over a frequency band that corresponds to the frequency of the swept local oscillator signal.
- the optical filter may be tuned to track the swept local oscillator signal utilizing known frequency tracking techniques.
- the center of the filter passband is tuned to the frequency of the swept local oscillator signal.
- the center of the filter passband is tuned slightly off the local oscillator frequency in order to generate the heterodyne signal at a higher frequency, for example, when image rejection is important.
- Tunable optical filters are well known in the field of optical communications and can be implemented utilizing components such as diffraction gratings, dielectric interference filters, periodic Bragg devices, such as tunable fiber Bragg gratings, Fabry-Perot interferometers, and other known interferometers.
- Fig. 16 depicts the signal processor Fig. 5.
- the signal processor 1616 of Fig. 16 is designed to correct the local oscillator frequency information prior to generating measured spectrum information.
- the signal processor includes a spectrum measurement module 1036 and a sweep rate correction module 1638.
- the sweep rate correction module receives absolute frequency information from the local oscillator source and measured local oscillator frequency sweep rate information from the relative frequency measurement system.
- the sweep rate correction module utilizes the measured local oscillator frequency sweep rate information to correct the absolute local oscillator frequency information before the absolute local oscillator frequency information is provided to the spectrum measurement module.
- the corrected absolute local oscillator frequency information is provided to the spectrum measurement module in real-time.
- the spectrum measurement module utilizes the heterodyne beat signal and the corrected absolute local oscillator frequency information to generate corrected spectrum information in real-time that accurately accounts for non-uniformities in the frequency sweep rate of the local oscillator signal.
- the spectrum measurement and sweep rate correction modules may be sub-elements of a multifunction processor and may include hardware or software, or any combination thereof.
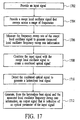
- FIG. 17 A process flow diagram of a method for optical spectrum analysis that utilizes optical heterodyne detection is depicted in Fig. 17.
- an input signal is provided.
- a swept local oscillator signal that sweeps across a range of frequencies is provided.
- the frequency sweep rate of the swept local oscillator signal is measured to generate measured local oscillator frequency sweep rate information.
- the input signal is combined with the swept local oscillator signal to create a combined optical signal.
- the combined optical signal is detected to generate a heterodyne beat signal.
- an output signal which is indicative of an optical parameter of the input signal, is generated from the heterodyne beat signal and the measured local oscillator frequency sweep rate information.
- the relative frequency measurement systems also commonly referred to as interferometers or wave counters, all impart a delay on some portion of the swept local oscillator signal so that the relative change of frequency of the swept local oscillator signal can be determined from the detected interference fringes.
- Fig. 18 depicts a Michelson interferometer 1850 that includes a coupler 1852, a delay 1854 that delays an optical signal by a delay time, ⁇ , two Faraday mirrors 1856, and a photodetector 1858.
- the interferometer couples the swept local oscillator signal onto two fibers and then reflects the two optical signals back to the photodetector.
- the two signals are delayed relative to one another by the delay time, ⁇ and therefore differ in frequency.
- the delay between the two signals results in an optical frequency dependent fringe pattern signal at the output of the photodetector.
- the fringe pattern signal is used as described above, to determine the sweep rate of the local oscillator signal.
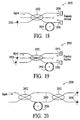
- Fig. 19 depicts an interferometer 1950 that is similar to the interferometer of Fig. 18 except that it includes two photodetectors 1958 that are coupled to detect the two reflected optical signals.
- a third fiber integrated into coupler 1952 allows reflected signal to be detected by the second photodetector. Adding a second photodetector can reduce counting errors that are caused by changes in the frequency sweep direction.
- Fig. 20 depicts a Mach-Zehnder interferometer 2050 that includes two couplers 2052, two parallel optical fibers 2060 and a delay 2054 on one of the parallel optical fibers.
- the interferometer couples the swept local oscillator signal onto the two parallel fibers and one of the two signals is delayed by ⁇ .
- the two signals are recombined at the second coupler and then output to the two photodetectors.
- the two signals are separated by the delay, ⁇ , and the frequency dependent optical phase between the two signals causes frequency-dependent fringe pattern signals to be generated at the outputs of the photodetectors 2058.
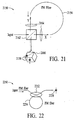
- Fig. 21 depicts an interferometer 2150 that includes a first polarizing beam splitter 2162, two lenses 2164, a delay fiber 2154, a second beam splitter 2166, and two photodetectors 2158 that are coupled to the second beam splitter.
- the first polarizing beam splitter splits the incoming swept local oscillator signal into two orthogonally polarized optical signals that propagate through the delay fiber in opposite directions.
- the delay fiber is polarization maintaining (PM) fiber. Within the PM fiber, a delay is imparted on one of the orthogonally polarized optical signals relative to the other orthogonally polarized optical signal.
- PM polarization maintaining
- the two orthogonally polarized optical signals are recombined at the polarizing beam splitter and are directed to the second beam splitter.
- the second beam splitter splits the recombined optical signal into two signals for detection by the two photodetectors. Because a delay is imparted on one of the polarized signals, the difference in phase between the two signals causes fringe pattern signals to be generated at the outputs of the photodetectors.
- the fringe pattern signals are used, as described above, to determine the sweep rate of the local oscillator signal.
- Fig. 22 depicts an interferometer 2250 that includes a coupler 2252, a delay loop 2254, and a photodetector 2258.
- all of the optical fiber is PM fiber.
- the interferometer couples a portion of the swept local oscillator signal onto the delay loop where the optical signal on the delay loop where a delay to time, ⁇ , is imparted on the signal.
- the delayed signal is then recombined at the optical coupler and propagates to the photodetector. Because of the delay imparted on the signal that travels in the delay loop, a fringe pattern signal is generated at the output of the photodetector.
- the fringe pattern signal is used, as described above, to determine the sweep rate of the local oscillator signal.
- Fig. 23 depicts an interferometer 2350 that includes a beam splitter 2362 and a polarization rotating mirror 2356 that are connected by a PM fiber 2354, and a photodetector 2358.
- the beam splitter splits the swept local oscillator signal into two portions, with a first portion being detected by the photodetector without delay. The second portion propagates along the PM fiber until it is reflected by the polarization rotating mirror thereby sending light down both the slow axis and the fast axis of the PM fiber.
- the reflected optical signal enters the beam splitter and a portion of the optical signal is detected by the photodetector.
- the difference in phase between the detected signals causes a fringe pattern signal that is used to determine the sweep rate of the local oscillator signal.
- Fig. 24 depicts an interferometer 2450 that includes a first PM fiber 2470, a 45 degree splice 2468, a second PM fiber 2472, a beam splitter 2462, and two photodetectors 2458 at the output of the beam splitter.
- the swept local oscillator signal is initially launched into the first PM fiber on-axis.
- the 45 degree splice splits the swept local oscillator signal into two orthogonally polarized signals, with one signal fifty percent on the x-axis and the other signal being fifty percent on the y-axis.
- Within the second PM fiber a delay is imparted on one of the orthogonally polarized optical signals relative to the other orthogonally polarized optical signals.
- the two orthogonally polarized optical signals are combined by the polarizing beam splitter and detected by the two photodetectors. Because a delay is imparted on one of the polarized signals, the difference in phase between the two signals causes fringe pattern signals to be generated at the outputs of the photodetectors.
- chromatic dispersion causes the delay ⁇ to vary with the frequency of the swept local oscillator signal and can cause the measured local oscillator frequency sweep rate information to be inaccurate.
- One technique to account for chromatic dispersion involves designing dispersion correction into the relative frequency measurement system and another technique involves incorporating a dispersion correction algorithm into the signal processor.
- designing dispersion correction into the relative frequency measurement system involves using two optical fibers that are oriented so that they have frequency-dependent delays that cancel each other out. That is, the two optical fibers have equal and opposite frequency-dependent delays.
- an optical fiber having a delay characteristic that increases with frequency can be spliced to an optical fiber having a delay characteristic that decreases with frequency.
- the length of the fibers is set such that the chromatic dispersion effects of the second fiber cancel the chromatic dispersion effects of the first fiber.
- optical fibers with reduced chromatic dispersion are utilized to reduce the effects of chromatic dispersion.
- incorporating a dispersion correction algorithm into the signal processor involves utilizing knowledge of the frequency dependence of the optical delay to reduce the effects of chromatic dispersion.
- the algorithm utilizes absolute frequency information from the local oscillator source to calculate the effects of dispersion and then corrects for the calculated effects.
- the sweep rate correction module utilizes the local oscillator frequency information from the local oscillator source (as indicated by dashed line 1140) to reduce chromatic dispersion-induced error.
- optical components of the optical heterodyne detection system are described as being connected by optical fibers, the individual devices may be integrated onto a monolithic device, such as a planar waveguide circuit. Alternatively, the optical elements may be connected by free space.
Landscapes
- Physics & Mathematics (AREA)
- Spectroscopy & Molecular Physics (AREA)
- General Physics & Mathematics (AREA)
- Optical Communication System (AREA)
- Optical Modulation, Optical Deflection, Nonlinear Optics, Optical Demodulation, Optical Logic Elements (AREA)
Claims (7)
- System für eine optische Spektrumsanalyse, das folgendes umfaßt:eine Lokaloszillatorquelle (505) zum Erzeugen eines durchlaufenden Lokaloszillatorsignals, welches einen Frequenzbereich durchläuft;einen optischen Koppler (510), der einen ersten Eingang und einen zweiten Eingang hat, wobei der erste Eingang optisch verbunden ist, um ein Eingangssignal zu empfangen, der zweite Eingang optisch mit der Lokaloszillatorquelle verbunden ist, um das durchlaufende Lokaloszillatorsignal zu empfangen, und der optische Koppler einen Ausgang zum Ausgeben eines kombinierten optischen Signals umfaßt, welches das Eingangssignal und das durchlaufende Lokaloszillatorsignal umfaßt;einen Heterodynempfänger (512) mit einem Eingang zum Empfangen des kombinierten optischen Signals von dem optischen Koppler und einem Ausgang zum Ausgeben eines Heterodyn-Schwebungssignal, welches für das kombinierte optische Signal repräsentativ ist;ein Relativfrequenz-Meßsystem (520), welches optisch mit der Lokaloszillatorquelle verbunden ist, um gemessene Lokaloszillator-Frequenzdurchlaufrateninformation in Antwort auf das durchlaufende Lokaloszillatorsignal zu erzeugen; gekennzeichnet durcheinen Signalprozessor (1616), der folgendes umfaßt:ein Durchlaufraten-Korrekturmodul (1638), welches Absolutfrequenz-Information aus der Lokaloszillatorquelle und die gemessene Lokaloszillator-Frequenzdurchlaufrateninformation von dem Relativfrequenz-Meßsystem (520) empfängt, um korrigierte Lokaloszillator-Frequenzinformation zu erzeugen, wobei die korrigierte Lokaloszillator-Frequenzinformation Nicht-Gleichförmigkeiten in der Frequenzdurchlaufrate des durchlaufenden Lokaloszillatorsignals berücksichtigt; undein Spektrummeßmodul (1636) zum Erzeugen eines Ausgangssignals, welches kennzeichnend für einen optischen Parameter des Eingangssignals ist, in Antwort auf das Heterodyn-Schwebungssignal und die korrigierte Lokaloszillator-Frequenzinformation.
- System nach einem der vorhergehenden Ansprüche, bei dem das Relativfrequenz-Meßsystem (520) Mittel zum Verzögern eines Teils des durchlaufenden Lokaloszillatorsignals umfaßt, so daß die relative Änderung der Frequenz des durchlaufenden Lokaloszillatorsignals ermittelt werden kann.
- System nach einem der vorhergehenden Ansprüche 1 bis 2, bei dem das Relativfrequenz-Meßsystem (520) ein Interferometersystem (1850; 1950; 2050; 2150; 2250; 2350; 2450) umfaßt, welches ein sinusförmiges Interferenzmustersignal in Antwort auf das durchlaufende Lokaloszillatorsignal erzeugt.
- System nach Anspruch 3, bei dem das Interferometersystem (1850; 1950; 2050; 2150; 2250; 2350; 2450) optische Wellenleiter mit entgegengesetzten Eigenschaften bezüglich chromatischer Dispersion umfaßt, um die chromatische Dispersion des durchlaufenden Lokaloszillatorsignals zu verringern.
- Verfahren zur optischen Spektrumsanalyse, welches optische Heterodyndetektion verwendet, wobei das Verfahren folgendes umfaßt:Bereitstellen (1702) eines Eingangssignals;Bereitstellen (1704) eines durchlaufenden Lokaloszillatorsignals, welches einen Frequenzbereich durchläuft;Messen (1706) der Frequenz-Durchlaufrate des durchlaufenden Lokaloszillatorsignals, um gemessene Lokaloszillator-Frequenzdurchlaufrateninformation zu erzeugen; Kombinieren (1708) des Eingangssignals mit dem durchlaufenden Lokaloszillatorsignal um ein kombiniertes optisches Signal zu erzeugen;Detektieren (1710) des kombinierten optischen Signals, um ein Heterodyn-Schwebungssignal zu erzeugen;gekennzeichnet durch die folgenden Schritte:Empfangen von Absolutfrequenzinformation von einer Lokaloszillatorquelle und der gemessenen Lokaloszillator-Frequenzdurchlaufrateninformation von dem Relativfrequenz-Meßsystem, zum Erzeugen von korrigierter Lokaloszillator-Frequenzinformation, wobei die korrigierte Lokaloszillator-Frequenzinformation Nicht-Gleichförmigkeiten in der Frequenzdurchlaufrate des durchlaufenden Lokaloszillatorsignals berücksichtigt; undErzeugen eines Ausgangssignals, welches für einen optischen Parameter des Eingangssignals gekennzeichnet ist, in Antwort auf das Heterodyn-Schwebungssignal und der korrigierten Lokaloszillator-Frequenzinformation.
- Verfahren nach Anspruch 5, bei dem der Schritt des Messens (1706) der Frequenzdurchlaufrate des durchlaufenden Lokaloszillatorsignals einen Schritt umfaßt, in dem ein in der Zeit veränderliches Interferenzmustersignal in Antwort auf das durchlaufende Lokaloszillatorsignal detektiert wird.
- Verfahren nach Anspruch 5 oder 6, bei dem der Schritt des Messens (1706) der Durchlaufrate des durchlaufenden Lokaloszillatorsignals zum Erzeugen der gemessenen Lokaloszillator-Frequenzdurchlaufrateninformatiön einen Schritt umfaßt, in dem die Effekte von chromatischer Dispersion auf die gemessene Lokaloszillator-Frequenzdurchlaufrateninformation korrigiert werden.
Applications Claiming Priority (2)
| Application Number | Priority Date | Filing Date | Title |
|---|---|---|---|
| US09/854,070 US6590666B2 (en) | 2001-05-11 | 2001-05-11 | Method and system for optical spectrum analysis with non-uniform sweep rate correction |
| US854070 | 2001-05-11 |
Publications (3)
| Publication Number | Publication Date |
|---|---|
| EP1256788A2 EP1256788A2 (de) | 2002-11-13 |
| EP1256788A3 EP1256788A3 (de) | 2004-09-22 |
| EP1256788B1 true EP1256788B1 (de) | 2007-04-18 |
Family
ID=25317643
Family Applications (1)
| Application Number | Title | Priority Date | Filing Date |
|---|---|---|---|
| EP02002177A Expired - Lifetime EP1256788B1 (de) | 2001-05-11 | 2002-01-29 | Verfahren und System zur optischen Spektrumsanalyse mit Korrektur einer ungleichmässigen Abtastrate |
Country Status (4)
| Country | Link |
|---|---|
| US (1) | US6590666B2 (de) |
| EP (1) | EP1256788B1 (de) |
| JP (1) | JP2002350236A (de) |
| DE (1) | DE60219550T2 (de) |
Families Citing this family (10)
| Publication number | Priority date | Publication date | Assignee | Title |
|---|---|---|---|---|
| US6646746B1 (en) * | 2000-10-02 | 2003-11-11 | Agilent Technologies, Inc. | Method and system for optical heterodyne detection of an optical signal |
| US6856400B1 (en) * | 2000-12-14 | 2005-02-15 | Luna Technologies | Apparatus and method for the complete characterization of optical devices including loss, birefringence and dispersion effects |
| US6906804B2 (en) * | 2002-12-16 | 2005-06-14 | Lucent Technologies Inc. | WDM channel monitor and wavelength locker |
| JP2006266797A (ja) * | 2005-03-23 | 2006-10-05 | Anritsu Corp | 光ヘテロダイン干渉装置 |
| DE102006025122A1 (de) * | 2005-05-31 | 2006-12-07 | Yokogawa Electric Corporation, Musashino | Vorrichtung zur Messung einer optischen Charakteristik |
| US8611744B2 (en) * | 2010-12-31 | 2013-12-17 | Infinera Corporation | Monitoring system employing carrier recovery |
| DE112011105112T5 (de) | 2011-03-28 | 2014-01-09 | Agilent Technologies Inc. | Heterodyner Optik-Spektrum-Analysator |
| US9178611B2 (en) | 2011-06-28 | 2015-11-03 | Intuitive Surgical Operations, Inc. | Fiber optic network interrogation tool for combined swept-heterodyne optical spectrum analysis and optical frequency-domain reflectometry |
| JP7420140B2 (ja) | 2019-07-18 | 2024-01-23 | 日本電信電話株式会社 | 波長掃引光測定システム |
| IT202200004667A1 (it) * | 2022-03-11 | 2022-06-11 | Sestosensor S R L | Rivelatore di fase e polarizzazione per sensori acustici distribuiti a fibre ottiche ed interrogatore basato sullo stesso |
Family Cites Families (12)
| Publication number | Priority date | Publication date | Assignee | Title |
|---|---|---|---|---|
| US4856899A (en) | 1985-12-20 | 1989-08-15 | Yokogawa Electric Corporation | Optical frequency analyzer using a local oscillator heterodyne detection of incident light |
| US4905244A (en) * | 1986-09-26 | 1990-02-27 | United States Department Of Energy | Heterodyne laser spectroscopy system |
| JPH07336301A (ja) * | 1994-06-06 | 1995-12-22 | Kokusai Denshin Denwa Co Ltd <Kdd> | 光波長多重通信装置 |
| JP3459070B2 (ja) | 1995-02-24 | 2003-10-20 | アンリツ株式会社 | 回折格子の回転角検出装置 |
| JP3262311B2 (ja) * | 1996-02-09 | 2002-03-04 | 日本電信電話株式会社 | 周波数掃引誤差検出方法および回路、光周波数掃引光源、ならびに光周波数領域反射測定回路 |
| US5780843A (en) * | 1996-07-16 | 1998-07-14 | Universite Laval | Absolute optical frequency calibrator for a variable frequency optical source |
| GB9701627D0 (en) * | 1997-01-27 | 1997-03-19 | Plessey Telecomm | Wavelength manager |
| US6166816A (en) * | 1998-12-31 | 2000-12-26 | Blake; James N. | Combination fiber optic current/voltage sensor |
| US6434176B1 (en) * | 1999-02-05 | 2002-08-13 | Zygo Corporation | Frequency stabilized laser system |
| US6204924B1 (en) * | 1999-02-23 | 2001-03-20 | Exfo Electro-Optical Engineering Inc. | Method and apparatus for measuring polarization mode dispersion of optical devices |
| US6970250B1 (en) * | 2000-01-20 | 2005-11-29 | Agilent Technologies, Inc. | Method and system for optical heterodyne detection of an optical signal that utilizes optical attenuation |
| US6766115B1 (en) * | 2000-08-22 | 2004-07-20 | Agilent Technologies, Inc. | Multiport optical component testing using a single optical receiver |
-
2001
- 2001-05-11 US US09/854,070 patent/US6590666B2/en not_active Expired - Fee Related
-
2002
- 2002-01-29 DE DE60219550T patent/DE60219550T2/de not_active Expired - Fee Related
- 2002-01-29 EP EP02002177A patent/EP1256788B1/de not_active Expired - Lifetime
- 2002-05-02 JP JP2002130756A patent/JP2002350236A/ja active Pending
Also Published As
| Publication number | Publication date |
|---|---|
| JP2002350236A (ja) | 2002-12-04 |
| DE60219550D1 (de) | 2007-05-31 |
| DE60219550T2 (de) | 2007-12-27 |
| US6590666B2 (en) | 2003-07-08 |
| EP1256788A2 (de) | 2002-11-13 |
| US20020167670A1 (en) | 2002-11-14 |
| EP1256788A3 (de) | 2004-09-22 |
Similar Documents
| Publication | Publication Date | Title |
|---|---|---|
| US6043883A (en) | Wavemeter and an arrangement for the adjustment of the wavelength of the signals of an optical source | |
| US6937346B2 (en) | Wavemeter having two interference elements | |
| US7027743B1 (en) | System and method for optical heterodyne detection of an optical signal including optical pre-selection that is adjusted to accurately track a local oscillator signal | |
| US20050078317A1 (en) | Synchronizing the filter wavelength of an optical filter with the wavelength of a swept local oscillator signal | |
| US7499182B2 (en) | Optical signal measurement system | |
| EP1278087B1 (de) | Mehrfachempfänger für verschiedene Polarisationen mit planaren Wellenleitern und plolarisierendem Strahlteiler | |
| US6259529B1 (en) | Wavelength-selective polarization-diverse optical heterodyne receiver | |
| US5841536A (en) | Polarization interferometer apparatus using the polarization dependent phase lag in a birefringent retarder | |
| EP1256788B1 (de) | Verfahren und System zur optischen Spektrumsanalyse mit Korrektur einer ungleichmässigen Abtastrate | |
| US6256103B1 (en) | System and method for optical heterodyne detection of an optical signal | |
| EP1253730B1 (de) | Verfahren und Vorrichtung zur Spektranalyse mit Detektion mit angepasstem Filter | |
| EP1266248A1 (de) | Verfahren und vorrichtung zum abschätzen der chromatischen dispersion in faser-br | |
| US6535289B1 (en) | System and method for optical heterodyne detection of an optical signal | |
| EP1130813B1 (de) | Verfahren und Vorrichtung zum optischen Überlagerungsempfang mittels optischer Dämpfung | |
| JPH0634446A (ja) | 固定検光子を用いた偏波分散測定方法及び装置 | |
| JP2976919B2 (ja) | 波長計測装置及び該波長計測装置を備えた波長制御装置 | |
| JPH02165026A (ja) | 半導体レーザのfm変調特性測定装置 | |
| Simova et al. | Modified phase-shift method for the characterization of fiber gratings: accuracy and comparison with other methods |
Legal Events
| Date | Code | Title | Description |
|---|---|---|---|
| PUAI | Public reference made under article 153(3) epc to a published international application that has entered the european phase |
Free format text: ORIGINAL CODE: 0009012 |
|
| AK | Designated contracting states |
Kind code of ref document: A2 Designated state(s): AT BE CH CY DE DK ES FI FR GB GR IE IT LI LU MC NL PT SE TR |
|
| AX | Request for extension of the european patent |
Free format text: AL;LT;LV;MK;RO;SI |
|
| PUAL | Search report despatched |
Free format text: ORIGINAL CODE: 0009013 |
|
| AK | Designated contracting states |
Kind code of ref document: A3 Designated state(s): AT BE CH CY DE DK ES FI FR GB GR IE IT LI LU MC NL PT SE TR |
|
| AX | Request for extension of the european patent |
Extension state: AL LT LV MK RO SI |
|
| 17P | Request for examination filed |
Effective date: 20050223 |
|
| 17Q | First examination report despatched |
Effective date: 20050329 |
|
| AKX | Designation fees paid |
Designated state(s): DE FR GB |
|
| GRAP | Despatch of communication of intention to grant a patent |
Free format text: ORIGINAL CODE: EPIDOSNIGR1 |
|
| RAP1 | Party data changed (applicant data changed or rights of an application transferred) |
Owner name: AGILENT TECHNOLOGIES, INC. |
|
| GRAS | Grant fee paid |
Free format text: ORIGINAL CODE: EPIDOSNIGR3 |
|
| GRAA | (expected) grant |
Free format text: ORIGINAL CODE: 0009210 |
|
| AK | Designated contracting states |
Kind code of ref document: B1 Designated state(s): DE FR GB |
|
| REF | Corresponds to: |
Ref document number: 60219550 Country of ref document: DE Date of ref document: 20070531 Kind code of ref document: P |
|
| ET | Fr: translation filed | ||
| PLBE | No opposition filed within time limit |
Free format text: ORIGINAL CODE: 0009261 |
|
| STAA | Information on the status of an ep patent application or granted ep patent |
Free format text: STATUS: NO OPPOSITION FILED WITHIN TIME LIMIT |
|
| 26N | No opposition filed |
Effective date: 20080121 |
|
| PGFP | Annual fee paid to national office [announced via postgrant information from national office to epo] |
Ref country code: DE Payment date: 20080313 Year of fee payment: 7 |
|
| PGFP | Annual fee paid to national office [announced via postgrant information from national office to epo] |
Ref country code: FR Payment date: 20080108 Year of fee payment: 7 |
|
| GBPC | Gb: european patent ceased through non-payment of renewal fee |
Effective date: 20080129 |
|
| PG25 | Lapsed in a contracting state [announced via postgrant information from national office to epo] |
Ref country code: GB Free format text: LAPSE BECAUSE OF NON-PAYMENT OF DUE FEES Effective date: 20080129 |
|
| PG25 | Lapsed in a contracting state [announced via postgrant information from national office to epo] |
Ref country code: DE Free format text: LAPSE BECAUSE OF NON-PAYMENT OF DUE FEES Effective date: 20090801 |
|
| REG | Reference to a national code |
Ref country code: FR Ref legal event code: ST Effective date: 20091030 |
|
| PG25 | Lapsed in a contracting state [announced via postgrant information from national office to epo] |
Ref country code: FR Free format text: LAPSE BECAUSE OF NON-PAYMENT OF DUE FEES Effective date: 20090202 |