EP1220159A2 - Derived data display adjustment system - Google Patents
Derived data display adjustment system Download PDFInfo
- Publication number
- EP1220159A2 EP1220159A2 EP01310702A EP01310702A EP1220159A2 EP 1220159 A2 EP1220159 A2 EP 1220159A2 EP 01310702 A EP01310702 A EP 01310702A EP 01310702 A EP01310702 A EP 01310702A EP 1220159 A2 EP1220159 A2 EP 1220159A2
- Authority
- EP
- European Patent Office
- Prior art keywords
- derived data
- data
- calculation
- adjustment
- derived
- Prior art date
- Legal status (The legal status is an assumption and is not a legal conclusion. Google has not performed a legal analysis and makes no representation as to the accuracy of the status listed.)
- Withdrawn
Links
Images




Classifications
-
- G—PHYSICS
- G06—COMPUTING OR CALCULATING; COUNTING
- G06T—IMAGE DATA PROCESSING OR GENERATION, IN GENERAL
- G06T11/00—Two-dimensional [2D] image generation
- G06T11/20—Drawing from basic elements
- G06T11/26—Drawing of charts or graphs
Definitions
- the present invention relates to a system for adjusting a displayed image showing analysis results by graphically displaying a plurality of data stored in a computer, while at the same time, calculating the derived data and displaying the data so that image elements will not overlap on the screen.
- thermal analysis which is one field of physical analysis, it is performed as a routine operation to input and store the detected data in a computer, graphically display the data on a display to understand and analyze the detection results, and calculate and graphically display the derived data from the detected data.
- each detector and the computer are connected by a data line, and a program for thermal analysis data processing is prepared in a memory of the computer, which has an operational function of performing calculation or statistical processing of various derived data calculated from the detected data, and a function of displaying the various obtained data on a display, and thus, with the analysis apparatus therefore being constituted by the whole system including the detection means, the computer and peripheral equipment.
- DSC Differential Scanning Calorimeter
- the target is then designated (which calculation source data or which derived data) and the operation (derived data calculation or derived data adjustment) is carried out.
- the designation of the necessary parameters [step 4] for calculating a selection [step 2] of a derived data type is carried out after first implementing designation [step 1] as to whether or not to perform calculations on derived data, and which data to perform calculations on.
- designation [step 1] as to whether or not to perform calculations on derived data, and which data to perform calculations on.
- alterations are again performed after designating other interfering data from when calculation/adjustment of the derived data is completed with respect to this data.
- a derived data display adjustment system of the present invention when derived data calculation or derived data adjustment is executed, selection of new graph elements to be subjected to derived data calculation or derived data adjustment is possible, with a derived data calculation user interface being displayed when selected graph elements are computable, and with a derived data adjustment user interface being displayed when computation is not possible.
- a possible process to be performed for said graphic element at the state as set in a computer will be specified, and a user interface to perform said process will be displayed.
- the present invention therefore sets out to provide a derived data display adjustment system that when derived data of a plurality of data is created to be compared, enables a change between a calculation mode or adjustment mode for other derived data at operational turning points and a flexible and easy operation by making operation less restrictive than in the related method where, if an operation for a derived data in calculation mode or adjustment mode is started once, it is impossible to change to any other process in a different mode unless a series of fixed operations of calculation or adjustment are started and finished, so that it is necessary to go back to a first step and repeat a whole process.
- a mechanism for making it possible to select graphical elements at a time where a calculation of derived data is made for certain data, with a determination then being made as to whether or not a graphical element selected during this time is data for which derived data calculations are possible. Calculation is possible in cases where this is another data curve and an interface for calculating derived data is therefore displayed as a determination that it is possible to calculate derived data for this data. If, during this time, a selected graphical element is a calculated numerical value display, then the calculation results are for a graphical element for which calculations are not possible. It is therefore determined that an adjustment operation can be achieved, and adjustment mode is therefore gone to so that a derived data adjustment user interface is displayed.
- FIG. 1 The basic construction of the derived data display adjustment system according to the present invention is shown in FIG. 1.
- Reference numeral 1 denotes a computer body
- 2 denotes input means such as a mouse, a key board, etc
- 3 denotes a display.
- the computer body 1 includes derived data type selection means 4, graphical element selection means 5, derived data calculating user interface 6, derived data calculating means 7, derived data adjusting user interface 8, derived data adjusting means 9 and also includes an analytical data storage unit 10 for storing analyzed data from a detector (not shown), a derived data storage unit 11for storing calculated data from the derived data calculating means 7 and adjusted data from the derived data adjusting means 9, and graphical display means 12 for receiving signals from the analytical data storage unit 10, the derived data storage unit 11, and the graphical element selection means 5, and generating a graphical display signal for output to the display 3.
- a graphical display signal for the analytical data stored at the analytical data storage unit 10 is generated at the graphical display means 12 for graphical display at
- Step 3(S3) When calculation is possible, a derived data calculation user interface 6 is started up and a parameter input screen is displayed.
- Step 4(S4) When parameters are inputted from the input means 2 at this stage using the derived data calculation user interface 6, [Step 5(S5)] then a state where calculation is possible is ascertained, the derived data calculation means 7 operates so as to calculate derived data, and the calculation results are stored in the derived data storage unit 11.
- Step 6(S6) When the same derived data calculations are performed for the same graphical elements at this time, [Step 4] is returned to, the derived data calculation user interface 6 is activated again and the parameter input screen is displayed.
- Step 5 If parameters are inputted again anew from the input means 2 to the derived data calculation user interface 6 [Step 5], then [Step 6] is repeated. The following step is then preceded to when the same derived data calculations are not continued for the same graphical elements at this time.
- Step 7(S7) When the same derived data calculations are not carried out for the same graphical elements, the user determines whether or not the same derived data calculations are to be carried out for other data, or whether adjustment of derived data is to be carried out [Step 8(S8)]. When this is performed, [Step 9(S9)] is proceeded to and selection of a new graphical element is performed.
- Step 9 When the same derived data calculations are not performed on other data and derived data adjustment is also not performed, calculation completion is designated, calculation mode is ended [step 13(S13)], and the derived data calculation operation is complete. Further, in [Step 3], when the selected graphical element cannot be subjected to calculations, the derived data adjustment user interface 8 is activated and the parameter input screen is displayed. [Step 10 (S10)] When parameters are inputted from the input means 2 at this stage using the derived data adjusting user interface 8, [Step 11(S11)] the derived data adjustment means 9 operates so as to adjust the derived data, and the adjustment results are stored in the derived data storage unit 11.
- Step 12 (S12) The aforementioned [Step 8] is proceeded to in order that the user can make a determination as to whether to perform the same derived data calculations on other data at this time or whether to perform adjustment of the derived data.
- [Step 9] is returned to, and when this is not carried out, the process ends after passing through [Step 13] as a result of the derived data calculation already having ended.
- Amain feature of the present invention is that there is provided a function [Step 9] whereby, at the turning point [Step 8] of whether to perform derived data calculations or perform derived data adjustment, when the same derived data calculation is to be performed on other data or adjustment of the derived data is to be performed, it is possible to select graphical elements anew.
- a further function [Step 3] is also provided whereby when selection of graphical element is carried out, a determination as to whether or not calculation is possible is made automatically at the computer so that it is not necessary for the user to select whether or not to perform a calculation or perform adjustment.
- the derived data stored at the derived data storage unit 11 is also sent to the graphical display means 12, a display signal for the derived data can be synthesized to give a graphical display in a numerical format at the graphical display means 12 and can then be displayed at the display 3.
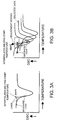
- FIG. 3A A specific example of a derived data display adjustment system of the present invention is now described giving an example of data for a differential scanning calorimeter constituting thermal analysis apparatus.
- the kind of characteristic curve shown in FIG. 3A is obtained by the DSC for each item of data.
- the display then becomes as shown in FIG. 3B when DSC curves obtained for a plurality of items of data at the analysis apparatus are displayed at the display.
- interpolation melting start temperatures are calculated for each item of data for comparison and investigation, with it being wished to give notification of this in the form of a graphical display for ease of understanding.
- derived data display adjustment system of the present invention when calculation of derived data or adjustment of derived data is implemented in a process of analysis by analysis apparatus, it is possible to select new graphic elements for which it is wished to calculate or adjust derived data.
- graphical elements selected during this time may be subjected to calculations, a derived data calculation user interface is displayed.
- a derived data adjustment user interface is displayed. Transitions between calculating mode and adjustment mode and selection of data to be taken as a target at turning points in the aforementioned operation may therefore be freely executed simply by designating graphical elements on a screen.
- the operation therefore has a small turn-around compared with the related method, troublesome operations are reduced, the load on the user is alleviated and the desired graphical display can be easily and rapidly made. Further, mode transitions can be easily implemented and in addition to being able to perform adjustment with respect to the displaying of derived data that interferes with displaying of other data, derived data calculation operations for the other data are entered and the burden placed on the user (stressfulness) is alleviated.
- a moveable derived data display region is also displayed so that when a graphical element is selected with a cursor, with the conditions set at the computer, a user interface corresponding to executable processing is displayed for this graphical element, and an instruction operation that specifies the operating mode simply by specifying the graphical element may be carried out. This reduces the labor involved and dramatically reduces the burden placed on the operator.
Landscapes
- Physics & Mathematics (AREA)
- General Physics & Mathematics (AREA)
- Engineering & Computer Science (AREA)
- Theoretical Computer Science (AREA)
- User Interface Of Digital Computer (AREA)
- Investigating Or Analyzing Materials Using Thermal Means (AREA)
- Image Generation (AREA)
- Controls And Circuits For Display Device (AREA)
Abstract
Description
If not, the operation can be terminated.
Next, a menu is displayed and the type of derived data to be calculated is designated (derived data type selection means 4) from the input means 2. [Step 2(S2)]
A determination is made as to whether or not the specified graphical element is capable of being subjected to derived data calculations. [Step 3(S3)] When calculation is possible, a derived data
When parameters are inputted from the input means 2 at this stage using the derived data
When the same derived data calculations are performed for the same graphical elements at this time, [Step 4] is returned to, the derived data
When the same derived data calculations are not carried out for the same graphical elements, the user determines whether or not the same derived data calculations are to be carried out for other data, or whether adjustment of derived data is to be carried out [Step 8(S8)].
When this is performed, [Step 9(S9)] is proceeded to and selection of a new graphical element is performed. [Step 9] When the same derived data calculations are not performed on other data and derived data adjustment is also not performed, calculation completion is designated, calculation mode is ended [step 13(S13)], and the derived data calculation operation is complete. Further, in [Step 3], when the selected graphical element cannot be subjected to calculations, the derived data
Amain feature of the present invention is that there is provided a function [Step 9] whereby, at the turning point [Step 8] of whether to perform derived data calculations or perform derived data adjustment, when the same derived data calculation is to be performed on other data or adjustment of the derived data is to be performed, it is possible to select graphical elements anew. A further function [Step 3] is also provided whereby when selection of graphical element is carried out, a determination as to whether or not calculation is possible is made automatically at the computer so that it is not necessary for the user to select whether or not to perform a calculation or perform adjustment. The derived data stored at the derived
In this case the derived data to be investigated is the interpolated melting start temperature. The two points selected are self-evident as the stabilization point for both sides of the point of inflection of the low temperature side curve and the maximum gradient point for the root diameter DSC curve. This selection is therefore appointed as a user operation. This is achieved through input of the operation parameters.
However, the interpolated melting start temperature displayed numerically is displayed in such a manner as to be superimposed with other data curves, making the graph difficult to see. It is therefore wished to move the position of displaying these numerical values prior to executing interpolated temperature calculations for other data.
In the above operation, derived data calculation and adjustment is completed for one item of data. The procedure in (a) to (h) is also repeated for other items of data. Finally, a graphical display that is easy to see as shown in FIG. 4F can be made. In the above procedure, that operated by the operator is (a), (b), (d), (f), (h), with (c), (e) and (g) being automatically executed in the process flow of the analysis apparatus.
In this embodiment, interpolated melting start temperature of a DSC is given as an example of derived data but a wide variety of other data types may also be adopted. For example, with JIS K7121, in addition to the melting temperature there are amelting peak temperature and an interpolation melting start temperature, giving three types. In addition, a liquid crystal temperature and a glass transfer temperature are also obtained as derived data. Further, in the field of thermal analysis, with regards to DSC's, thermogravimetry (TG) and thermo-mechanical analysis (TMA) etc., a plurality of JIS's are defined according to the object of utilization of a multiplicity of derived data. First order differentiation data and integration data obtained using differentiation or integration operations can also be utilized. There is also derived data decided upon between participants that is not publicly defined. The example described here is not limited in this respect, and the present invention may also be applied to calculation and adjustment of derived data for this kind of broader range.
Claims (4)
- A derived data display adjustment system which enables to select new graph elements to be subjected to calculation or adjustment of derived data when calculation or adjustment of derived data is executed, with a derived data calculation user interface being displayed when selected graph elements are computable, and with a derived data adjustment user interface being displayed when the computation is not possible.
- The derived data display adjustment system of claim 1, wherein the user interface corresponding to an executable process is displayed in a situation where the computer is set up when a graph element is selected.
- The derived data display adjustment system of claim 2, wherein a cursor is displayed as the derived data calculation user interface when the graph element is a data curve.
- The derived data display adjustment system of claim 2, wherein a moveable derived data display region is displayed as the derived data adjustment user interface when the graph element is a derived data display.
Applications Claiming Priority (4)
| Application Number | Priority Date | Filing Date | Title |
|---|---|---|---|
| JP2000395257 | 2000-12-26 | ||
| JP2000395257 | 2000-12-26 | ||
| JP2001026370A JP4223689B2 (en) | 2000-12-26 | 2001-02-02 | Derived data display adjustment system |
| JP2001026370 | 2001-02-02 |
Publications (2)
| Publication Number | Publication Date |
|---|---|
| EP1220159A2 true EP1220159A2 (en) | 2002-07-03 |
| EP1220159A3 EP1220159A3 (en) | 2003-10-01 |
Family
ID=26606677
Family Applications (1)
| Application Number | Title | Priority Date | Filing Date |
|---|---|---|---|
| EP01310702A Withdrawn EP1220159A3 (en) | 2000-12-26 | 2001-12-20 | Derived data display adjustment system |
Country Status (3)
| Country | Link |
|---|---|
| US (1) | US6911979B2 (en) |
| EP (1) | EP1220159A3 (en) |
| JP (1) | JP4223689B2 (en) |
Families Citing this family (6)
| Publication number | Priority date | Publication date | Assignee | Title |
|---|---|---|---|---|
| US8671213B2 (en) | 2002-03-14 | 2014-03-11 | Citrix Systems, Inc. | Methods and apparatus for generating graphical and media displays at a client |
| US7376695B2 (en) * | 2002-03-14 | 2008-05-20 | Citrix Systems, Inc. | Method and system for generating a graphical display for a remote terminal session |
| US7496852B2 (en) * | 2006-05-16 | 2009-02-24 | International Business Machines Corporation | Graphically manipulating a database |
| DE102013011730B3 (en) * | 2013-07-12 | 2014-08-14 | Netzsch-Gerätebau GmbH | Method for evaluating a measurement result of a thermal analysis, and use of the method, computer device, computer program product and system for carrying out the method |
| JP6530611B2 (en) * | 2015-01-23 | 2019-06-12 | 株式会社日立ハイテクサイエンス | Method of processing thermal analysis data and thermal analyzer |
| US10618151B2 (en) * | 2015-06-15 | 2020-04-14 | Milwaukee Electric Tool Corporation | Hydraulic crimper tool |
Family Cites Families (7)
| Publication number | Priority date | Publication date | Assignee | Title |
|---|---|---|---|---|
| US4821303A (en) * | 1986-12-05 | 1989-04-11 | The Dow Chemical Company | Combined thermal analyzer and x-ray diffractometer |
| US5247468A (en) * | 1988-09-27 | 1993-09-21 | Tektronix, Inc. | System for calculating and displaying user-defined output parameters describing behavior of subcircuits of a simulated circuit |
| US5623282A (en) * | 1991-12-31 | 1997-04-22 | Microsoft Corporation | Method and system for the direct manipulation of cells in an electronic spreadsheet program or the like |
| US5579462A (en) * | 1994-11-03 | 1996-11-26 | Bio-Rad Laboratories | User interface for spectrometer |
| WO1999028811A1 (en) | 1997-12-04 | 1999-06-10 | Northern Telecom Limited | Contextual gesture interface |
| US6262728B1 (en) * | 1998-11-03 | 2001-07-17 | Agilent Technologies, Inc. | System and method for annotating a graphical user interface display in a computer-based system |
| US6603477B1 (en) * | 2000-08-11 | 2003-08-05 | Ppg Industries Ohio, Inc. | Method of rendering a graphical display based on user's selection of display variables |
-
2001
- 2001-02-02 JP JP2001026370A patent/JP4223689B2/en not_active Expired - Lifetime
- 2001-12-04 US US10/005,032 patent/US6911979B2/en not_active Expired - Lifetime
- 2001-12-20 EP EP01310702A patent/EP1220159A3/en not_active Withdrawn
Also Published As
| Publication number | Publication date |
|---|---|
| EP1220159A3 (en) | 2003-10-01 |
| JP4223689B2 (en) | 2009-02-12 |
| US6911979B2 (en) | 2005-06-28 |
| US20020085036A1 (en) | 2002-07-04 |
| JP2002257763A (en) | 2002-09-11 |
Similar Documents
| Publication | Publication Date | Title |
|---|---|---|
| JP5142510B2 (en) | Graphical user interface providing method and system | |
| JPH05314270A (en) | Graph display system | |
| JPH1145334A (en) | Comparative display method for images and recording medium | |
| US6911979B2 (en) | Derived data display adjustment system | |
| JP4940974B2 (en) | Position cursor display device and position cursor display method | |
| JP5413143B2 (en) | Image processing apparatus, image processing method, program, and recording medium | |
| JP2000121382A (en) | Time series data correction device | |
| CN113362364B (en) | Information processing device, information processing method, and computer readable medium | |
| JP2003039357A (en) | Robot teaching device | |
| JP2009163750A (en) | Information processing device | |
| JPH1186010A (en) | Graph display device | |
| JP7632193B2 (en) | Display Control Program | |
| JPH0830679A (en) | Creating and updating process control line table | |
| JPH1166330A (en) | Graph display device | |
| JP2009000342A (en) | Medical image display device | |
| JPH0863318A (en) | Trend graph display device | |
| JP2008108201A (en) | Partial selection controller of biopolymer | |
| EP0406445A1 (en) | Graphic parameter setting and plotting method | |
| JP2008129700A (en) | Data processing system and program thereof | |
| JP2006018517A (en) | Analysis result output method, analysis result output device, computer program, and recording medium | |
| JP2817935B2 (en) | Graphic processing unit | |
| US20190294437A1 (en) | Image edit apparatus, image edit method, and recording medium | |
| JPH10320572A (en) | Graph output device | |
| JPH04145587A (en) | Graphic picking up method for picture processor | |
| JPH08179750A (en) | Graph display device |
Legal Events
| Date | Code | Title | Description |
|---|---|---|---|
| PUAI | Public reference made under article 153(3) epc to a published international application that has entered the european phase |
Free format text: ORIGINAL CODE: 0009012 |
|
| AK | Designated contracting states |
Kind code of ref document: A2 Designated state(s): AT BE CH CY DE DK ES FI FR GB GR IE IT LI LU MC NL PT SE TR |
|
| AX | Request for extension of the european patent |
Free format text: AL;LT;LV;MK;RO;SI |
|
| PUAL | Search report despatched |
Free format text: ORIGINAL CODE: 0009013 |
|
| AK | Designated contracting states |
Kind code of ref document: A3 Designated state(s): AT BE CH CY DE DK ES FI FR GB GR IE IT LI LU MC NL PT SE TR |
|
| AX | Request for extension of the european patent |
Extension state: AL LT LV MK RO SI |
|
| 17P | Request for examination filed |
Effective date: 20040401 |
|
| AKX | Designation fees paid |
Designated state(s): DE FR GB |
|
| RAP1 | Party data changed (applicant data changed or rights of an application transferred) |
Owner name: SII NANOTECHNOLOGY INC. |
|
| 17Q | First examination report despatched |
Effective date: 20060711 |
|
| STAA | Information on the status of an ep patent application or granted ep patent |
Free format text: STATUS: THE APPLICATION IS DEEMED TO BE WITHDRAWN |
|
| 18D | Application deemed to be withdrawn |
Effective date: 20061122 |