EP1120675A2 - Gerät und Verfahren zum Analysieren von erfassten Abtast-Daten - Google Patents
Gerät und Verfahren zum Analysieren von erfassten Abtast-Daten Download PDFInfo
- Publication number
- EP1120675A2 EP1120675A2 EP00124682A EP00124682A EP1120675A2 EP 1120675 A2 EP1120675 A2 EP 1120675A2 EP 00124682 A EP00124682 A EP 00124682A EP 00124682 A EP00124682 A EP 00124682A EP 1120675 A2 EP1120675 A2 EP 1120675A2
- Authority
- EP
- European Patent Office
- Prior art keywords
- detectors
- angle
- subsystem
- region
- display
- Prior art date
- Legal status (The legal status is an assumption and is not a legal conclusion. Google has not performed a legal analysis and makes no representation as to the accuracy of the status listed.)
- Granted
Links
- 238000000034 method Methods 0.000 title claims abstract description 46
- 238000012545 processing Methods 0.000 claims abstract description 34
- 238000012800 visualization Methods 0.000 claims abstract description 25
- 238000005259 measurement Methods 0.000 claims description 31
- 150000002500 ions Chemical class 0.000 claims description 9
- 239000000126 substance Substances 0.000 claims description 4
- 238000010586 diagram Methods 0.000 description 14
- 230000009466 transformation Effects 0.000 description 13
- 230000008569 process Effects 0.000 description 11
- 230000003287 optical effect Effects 0.000 description 10
- 230000011218 segmentation Effects 0.000 description 9
- 238000010200 validation analysis Methods 0.000 description 8
- 230000008859 change Effects 0.000 description 7
- 239000013598 vector Substances 0.000 description 6
- 238000000799 fluorescence microscopy Methods 0.000 description 5
- 239000007850 fluorescent dye Substances 0.000 description 5
- 230000000694 effects Effects 0.000 description 4
- 238000005286 illumination Methods 0.000 description 4
- 238000004519 manufacturing process Methods 0.000 description 4
- 230000035790 physiological processes and functions Effects 0.000 description 4
- 238000000926 separation method Methods 0.000 description 4
- 230000000007 visual effect Effects 0.000 description 4
- BHPQYMZQTOCNFJ-UHFFFAOYSA-N Calcium cation Chemical compound [Ca+2] BHPQYMZQTOCNFJ-UHFFFAOYSA-N 0.000 description 3
- 230000006978 adaptation Effects 0.000 description 3
- 239000012491 analyte Substances 0.000 description 3
- 238000013459 approach Methods 0.000 description 3
- 229910001424 calcium ion Inorganic materials 0.000 description 3
- 238000004040 coloring Methods 0.000 description 3
- 238000004624 confocal microscopy Methods 0.000 description 3
- 239000000975 dye Substances 0.000 description 3
- 238000000386 microscopy Methods 0.000 description 3
- 230000003595 spectral effect Effects 0.000 description 3
- 238000013528 artificial neural network Methods 0.000 description 2
- 230000008901 benefit Effects 0.000 description 2
- 238000004061 bleaching Methods 0.000 description 2
- 239000011575 calcium Substances 0.000 description 2
- 238000013461 design Methods 0.000 description 2
- 239000003814 drug Substances 0.000 description 2
- 238000002474 experimental method Methods 0.000 description 2
- 238000001506 fluorescence spectroscopy Methods 0.000 description 2
- 230000006870 function Effects 0.000 description 2
- 238000000691 measurement method Methods 0.000 description 2
- 231100000760 phototoxic Toxicity 0.000 description 2
- 238000013139 quantization Methods 0.000 description 2
- 230000009467 reduction Effects 0.000 description 2
- 230000035945 sensitivity Effects 0.000 description 2
- 238000000862 absorption spectrum Methods 0.000 description 1
- 238000009825 accumulation Methods 0.000 description 1
- 239000000654 additive Substances 0.000 description 1
- 230000000996 additive effect Effects 0.000 description 1
- 238000003491 array Methods 0.000 description 1
- 238000004364 calculation method Methods 0.000 description 1
- 238000006243 chemical reaction Methods 0.000 description 1
- 239000003086 colorant Substances 0.000 description 1
- 230000006835 compression Effects 0.000 description 1
- 238000007906 compression Methods 0.000 description 1
- 230000007423 decrease Effects 0.000 description 1
- 238000009792 diffusion process Methods 0.000 description 1
- 238000006073 displacement reaction Methods 0.000 description 1
- 238000000295 emission spectrum Methods 0.000 description 1
- 238000005516 engineering process Methods 0.000 description 1
- 230000002349 favourable effect Effects 0.000 description 1
- 239000003269 fluorescent indicator Substances 0.000 description 1
- 238000000338 in vitro Methods 0.000 description 1
- 230000037427 ion transport Effects 0.000 description 1
- 238000005457 optimization Methods 0.000 description 1
- 230000008447 perception Effects 0.000 description 1
- 230000009897 systematic effect Effects 0.000 description 1
- 238000004448 titration Methods 0.000 description 1
- 230000002588 toxic effect Effects 0.000 description 1
- 238000011144 upstream manufacturing Methods 0.000 description 1
Images


Classifications
-
- G—PHYSICS
- G02—OPTICS
- G02B—OPTICAL ELEMENTS, SYSTEMS OR APPARATUS
- G02B21/00—Microscopes
- G02B21/16—Microscopes adapted for ultraviolet illumination ; Fluorescence microscopes
-
- G—PHYSICS
- G02—OPTICS
- G02B—OPTICAL ELEMENTS, SYSTEMS OR APPARATUS
- G02B21/00—Microscopes
- G02B21/0004—Microscopes specially adapted for specific applications
- G02B21/002—Scanning microscopes
Definitions
- the invention relates to a method and apparatus for analyzing acquired scan data, and a scanning fluorescence microscope having a method for analyzing acquired scan data.
- the invention refers in particular to a method for acquiring and processing signals of a process that are not directly observable because of the multiplicative superimposition of a global interference signal.
- Optical measurement methods based on fluorescence are widely used for biological measurements (for example: fluorescence microscopy, fluorescence spectroscopy or cytometrie). According to the progress in biology and bio technology it is possible to stain specifically the various components of a biological cell. This provides an insight to physiological processes of cells or cell clusters. Measurements using specific fluorescent dyes enable the determination of analyte concentrations (for example Na + , K + , Ca 2+ , Mg 2+ , pH(H + ) and others) by measuring the fluorescent properties of the dyes bonded to the analytes. These properties and fluorescence microscopy provide the possibility to image physiological processes of living cells. The information forms a basis for the understanding of the ion transport within a living cell or the reaction of pharmaceuticals or external stimulus on the living cell.
- analyte concentrations for example Na + , K + , Ca 2+ , Mg 2+ , pH(H + ) and others
- ratiometric dyes are used and a ratio is calculated from the measured intensities of the different spectral bands or areas.
- the dyes perform different absorption and emission spectra's due to the binding of the analyte.
- concentration is calculated from the ration of the two intensities detected (see Lakowicz, J.R.: PRINCIPLES OF FLUORESCENCE SPECTROSCOPY 2 n d Ed. New York: Kluwer Academic/Plenum Publisher, 1999).
- Tsien R.Y. Waggoner A.: "Fluorophores for Confocal Microscopy” In: Pawlwy J.B.: HANDBOOK OF BIOLOGICAL CONFOCAL MICROSCOPY. 2 nd Edition New York: Plenum Press, 1995); Tsien R.Y.: Fluorescent Indicators of Ion Concentration. In: Taylor, D. L., Wang, Y-I.: Fluorescence Microscopy of Living Cells in Culture Part B". METHODS IN CELL BIOLOGY, Vol. 30., 157-192. San Diego: Academic Press, 1998).
- an apparatus for analyzing and visualizing acquired physiological scan data comprises: a display; a first subsystem wherein the first subsystem comprises at least two detectors each responsive to a different wavelength; a second subsystem comprising a processing unit receiving the signals accumulated by the at least two detectors and calculating polar coordinates for the signals acquired by the first and second detectors; a unit for quantizing the angle component of the polar coordinates and adjusting the information capacity to the available display; and a visualization unit for assigning color to the values measured.
- the method improves the measurement result and optimizes the visualization of the scan data.
- the scanning fluorescence microscope analyzes and visualizes the acquired physiological scan data and thereby improves the measurement results and optimizes the visualization of the scan data and in addition to that allow a reduction in production costs.
- a scanning fluorescence microscope with means for analyzing and visualizing acquired physiological scan data comprising:
- the measurement results and the visualization of the measurement results should be optimized. This object is accomplished by a method for analyzing and visualizing acquired physiological scan data comprising the steps of:
- the present invention also encompasses a method which, in one embodiment, is used in connection with a scanning fluorescence microscope.
- FIG. 1 shows a schematic illustration of a system having a confocal microscope. It is clear that the present invention also applies to conventional fluorescence microscopes or any other application which detects, with two detectors, signals that differ in wavelength.
- the description in conjunction with a confocal microscope is not regarded as a limitation.
- the microscope comprises an illumination system 2 that generates a light beam L. Incident light beam L is directed by an optical device 4 to a scanning device 6.
- Scanning device 6 comprises a scanning mirror system 7 which is moveable such that light beam L is scanned across a specimen 10. Before light beam L reaches specimen 10, the light passes through an optical system 8. The light reflected from the specimen and the fluorescent light each travel along beam path L back to optical device 4.
- Detectors 12 and 14 convert the received light into a first and second electrical signal I 1 and I 2 respectively, which is proportional to the power of the light received from the specimen.
- First electrical signal I 1 is fed to a first input port 16 1 .
- Second electrical signal I 2 is fed to a second input port 16 1 .
- First input port 16 1 and second input port 162 are part of a control and processing unit 16.
- the output from control and processing unit 16 is sent to a display unit 18 which provides, besides other data in visual form, visual user guidance.
- Control and processing unit 16 is realized with a plurality of FPGA (field programmable gate array) units.
- FIG. 2 depicts, in enlarged fashion, the two detectors 12 and 14 together with the processing electronics. This represents acquisition and coding on the basis of a multivariate detector model.
- the first and second detectors 12 and 14 respectively receive first and second signals I 1 ,and I 2 .
- First and second signals I 1 , and I 2 arrive via corresponding electrical connections in a control and processing unit 16, which is configured as a polar coordinate quantizer.
- Each two of the values received by the various detectors 12 and 14 can be combined into a vector.
- First signal I 1 is conveyed to a first input port 16 1 and second signal I 2 is conveyed to a second input port 16 2 .
- Vector is shown in Equation 1.
- Equation 4 This change ⁇ I can be separated into two directions: in a direction parallel to g, no change in the ratio can occur; in a direction perpendicular to the straight line g (corresponding to ⁇ r ), a maximal change in the ratio occurs. Since this applies equally to all points, it is an obvious step to expand into polar coordinates as shown in Equation 4, in which R indicates the radius and ⁇ the angle for representing the first and second signals I 1 , and I 2 in polar coordinates: As is evident from Equation 4, only angle ⁇ contains the relevant information. In a scanning microscope (e.g. in a confocal microscope), the signals I 1 and I 2 deriving from first and second detectors 12 and 14 are necessarily discrete.
- Equation 9 The resolution of a small signal around the working point therefore depends on the position of the working point I: the working point I has a controlling influence on the measurement. The resolution is higher for large detected values than for small values, the deciding factor being the particular radius on which the working point I lies. For this reason, the coding indicated above (Equation 8) is rather conservative.
- the influence of the working point I is unpredictable, and is superimposed on a trend over time toward lower values due to photo toxic effects (e.g. bleaching).
- the purpose of determining a ratio between the first and second signals I 1 is I 2 is precisely to eliminate these time-related influences, which cannot be done completely because of the influence of the working point I .
- every measurement extending over a period of time suffers from a loss of resolution over time.
- the resolution defined by the ratio is therefore only a theoretical value, and cannot be achieved in practice.
- An obvious choice here is to work with an expected (in the statistical sense) working point.
- First and second detectors 12 and 14 and control and processing unit 16 can easily be incorporated into the structure of existing units, for example into confocal or other scanning optical microscopes (cf. FIG. 1).
- Control and processing unit 16 is configured in the form of a polar coordinate quantizer.
- the polar coordinate quantizer can be implemented or configured in several ways.
- One embodiment is to perform the requisite processing of the data using analog electronics.
- First and second detectors 12 and 14 supply first and second detector signals l 1 and I 2 .
- Detector signals I 1 and I 2 are converted into the polar coordinates by way of an analog circuit, and then the polar coordinates are quantized. This method is laborious but, in principle, possible.
- Another embodiment is to use digital circuits. Quantization of first and second signals l 1 and I 2 by first and second detectors 12 and 14, and processing, occur in the digital realm. Some possibilities for doing so include field programmable gate arrays (FPGA), personal computers (PC), or digital signal processors (DSP). This usually enables a more economical implementation. Additional possible configurations are 2D lookup tables; COORDIC algorithms (FPGA or PC); direct calculation using division, adders and multipliers, and lookup tables; and approximation via a digital neural network.
- FPGA field programmable gate arrays
- PC personal computers
- DSP digital signal processors
- Equation 12 The in vitro calibration using Ca 2+ ions is reproduced by Equation 12, the pH value by Equation 13, and cAMP by Equation 14:
- [ Ca 2+ ] K r - r min r max - r , [ pH ] ⁇ log r - r min r max - r
- [ cAMP ] K ( r - r min r max - r ) 1/n in which r min is the measured ratio without calcium ions and r max the measured ratio with the maximum concentration of calcium ions. All the underlying processes are delimited by one r min and one r max .
- Any measurement point that is received in the hatched region is unequivocally a measurement error. This can be used to validate the measurement results.
- One possibility is to assign a specific color to not useable measurement results (for example by coloring points in the image red).
- this delimitation could also be used to reduce memory even further (although this is not discussed further here).
- the oblique operating boundaries can advantageously be verified in the transformation space that is described (boundary angles), and saturation intensities can be verified in the non-transformed space.
- an implementation in analog electronics, digital electronics, or software are possible.
- the segmented signal can be visualized directly; in an image, for example, all physiological components can be coded green, and all invalid components red.
- White region 20 depicted in FIG. 3 is the aforementioned working region, which is of high quality when it possesses the greatest possible opening angle and the largest possible surface area in l 1 -l 2 diagram 24. This quality criterion can easily be verified, and is particularly favorable for use in an automated system adjustment method.
- One example is definition of the external corner points while at the same time displaying the l 1 -l 2 plane in a derived form.
- FIG. 4 shows a configuration that is suitable for visualizing the aforementioned criteria.
- First and second signals I 1 and I 2 are delivered to control and processing unit 16.
- Also provided upstream from control and processing unit 16 are a first and a second branch 30 and 32, which convey first and second signals l 1 and l 2 to first and second comparison elements 34 and 36, respectively.
- Angle coordinate ⁇ of the polar coordinate of the particular measurement point is similarly conveyed to a third comparison element 38, which defines the lower limits of angle coordinate ⁇ .
- Angle coordinate ⁇ is additionally conveyed to a fourth comparison element 40, which defines the upper limits of angle coordinate ⁇ .
- Each of the comparison elements possesses an output 34a, 36b, 38a, and 40a, through which the signals are sent to a validation unit 42. The corresponding signals are sent from validation unit 42 out to display 18, and presented to the user in visual form.
- FIG. 5 shows a schematic depiction of the invention which illustrates the correlation among the individual sub processes.
- the data to be processed are sent to a first section 50.
- the data derive, for example, from a corresponding receiving unit 50a.
- the data possess a particular coding of the amplitudes of signal pairs.
- This is a transformation of the amplitude vectors followed by quantization (see description of FIG. 2).
- the result of the transformation is to separate the usable signal and interference signal. This simplifies the system design and results in lower manufacturing costs, since after the transformation usually only a scalar variable needs to be processed.
- the transformation maps the original two-dimensional signal space onto a compact region in a one-dimensional signal space (compactness).
- the usable signal can be coded and memory can be used efficiently economized.
- the resolution of the transformed, coded signal pair corresponds exactly to the degrees of freedom of the generating process. Virtual but unachievable resolutions, which occur with other methods, are thus avoided.
- the data, transformed in first section 50, are conveyed to a second section 52. Because of the coding described in first section 50, the acquired image data are directly accessible to visualization. The data can be depicted directly on display 18. An amplitude vector can distinguish 65,536 states with currently standard 8-bit wide A/D converters, and 16,777,216 states at 12 bits. Human perception, however, is limited to about 200 colors and 500 brightness levels (see Mallot, "Sehen und die cookedatler Information" [Vision and the processing of visual information], pages 108-109, Braunschweig, Vieweg, 1998). The coding defined in first section 50 greatly decreases the number of sections, and reduces the visualization to the essential information. The technical and human components are adapted to one another.
- the coded visualization is optimal in the sense that very small changes are mapped onto color changes that are just perceptible (optimization in terms of perceptual theory).
- coloring using a conventional 8-bit lookup coloring table is possible.
- pseudocoloring see Lehmann, "Bildtechnik für die Medizin” [Image processing for medicine], pages 356-358) can still be used.
- a third stage 54 the biophysical models of physiological processes are linked to the data of the multivariate detector model from first section 50. This allows plausibility to be verified based on the acquired signals.
- the signal pair is segmented into a physiological and a non-physiological component. The details are described above in the section entitled “Signal separation (physiological and non-physiological).” This approach can be used to reduce human error during an experimental run, and serves to validate experiments that have already been performed.
- the data necessary for validation are obtained in a validation module 54a that is connected to third section 54.
- the data obtained and ascertained in the second and third sections 52 and 54 are conveyed to a fourth section 56. Calibration is then performed in fourth section 56 using a calibration module 56a.
- the physiological data obtained in third section 54 can be checked during execution, and concurrently visualized in second section 52. This approach eliminates operating uncertainties, and reduces human error during an experimental run. The user has a guide. A further effect is to improve ergonomics and working effectiveness.
- An automation unit acts on the fourth section 56.
- the method can be optimally incorporated into the system design by way of computer-aided help functions. This results in direct guidance of the user by software. The necessary settings can be automated relatively easily.
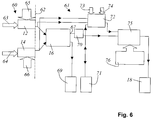
- FIG. 6 shows a graphic depiction of the entire system.
- the system is subdivided into two subsystems, separated from one another by a dashed line 62.
- a first subsystem 60 comprises electronic and optical means (not depicted) used to obtain signals.
- a second subsystem 61 is implemented in the form of hardware or software. A combination of electronic components with software is possible, as well.
- First subsystem 60 comprises first and second detectors 12 and 14 and their control systems (not explicitly depicted), such as gain and offset, which are necessarily implemented in the unit as hardware. Possibilities for this are, for example, a microscope, cell sorter, spectral camera, etc.
- First detector 12 receives the fluorescent light of wavelength ⁇ 1 , symbolized by an arrow 63, emitted from the specimen.
- Second detector 14 receives the fluorescent light of wavelength ⁇ 2 , symbolized by an arrow 64, emitted from the specimen.
- First and second detectors 12 and 14 also must be calibrated.
- the parameters are the gain and the zero point of detectors 12 and 14.
- An arrow 65 depicts the effect of the parameters gain g1 and zero point o1 on first detector 12.
- An arrow 66 depicts the effect of the parameters gain g2 and zero point o2 on second detector 14.
- the simplest form of calibration has an input mask (not depicted) on display 18 for the gain (g1, g2) and zero point (o1, o2). Adjustments can be made, for example, with a slider or a panel box (not depicted here).
- a first output 67 of control and processing unit 16 supplies a signal for angle coordinate ⁇ of the polar coordinate.
- Angle coordinate ⁇ is conveyed to a quantizer 70. From there the quantized signals can be conveyed to a memory unit 71, from which they can also be retrieved at any time.
- a second output 68 of control and processing unit 16 supplies a signal for local coordinate R of the polar coordinate. Local coordinate R can be conveyed to a canceler 69 or a memory unit as well. In the case of conventional ratiometric applications, however, this is obvious, and simply allows attractive visualization.
- Second stage 61 also comprises a segmenter 72 into which flow the signals of first and second detectors 12 and 14, and also the signal from quantizer 70.
- the quantized signals can also be retrieved from memory unit 71.
- An arrow 73 indicates calibration parameters r min and r max which represent the influencing variables for segmenter 72.
- An arrow 74 indicates calibration parameters l min and l max that also represent influencing variables for segmenter 72.
- Segmenter 72 performs a validation.
- the corresponding signal is then conveyed to a visualization unit 75.
- a color adaptation unit 76 also acting on visualization unit 75 is a color adaptation unit 76, with which the user can adjust the image on display 18.
- Visualization unit 75 additionally contains the quantified signals of quantifier 70. The color information is adapted to the expected measured values.
- visualization unit 75 The algorithms implemented in visualization unit 75 are not specified further here. All algorithms profit from the improved signal dynamics that can be achieved with control and processing unit 16. For image data, accumulation or filters (for "attractiveness” purposes) could be integrated. For volumetric data (for example in confocal microscopy), there could be a volume renderer.
- FIG. 7 shows one possible presentation of the data on display 18 after segmentation.
- the segmentation model of itself can be visualized by way of a geometric analogy and presented to the user. This can be done with a presentation as in FIG. 7, similar to a cytofluorogram.
- First signal I 1 is plotted on the ordinate, and second signal l 2 on the abscissa.
- the individual measurement points are depicted as a cloud between the coordinate axes. What is depicted is the l 1 -l 2 space as in FIG. 3, together with frequency information indicating how often each particular combination of the first and second signals ( l 1 und l 2 ) occurs in an image. This space can also be used to visualize the segmentation polygon.
- FIG. 8 shows an exemplary embodiment for adjusting a segmentation polygon 80 on display 18.
- the simplest form of calibration has an input mask for r min , r max , l min, l max .
- the gain and zero point are set by way of the system (generally using a panel box or slider, which is depicted correspondingly on the screen).
- a corner 82 of segmentation polygon 80 located opposite the coordinate origin can be adjusted using a first slider 84 on the abscissa and a second slider 86 on the ordinate.
- a third slider 88 on the abscissa and a fourth slider 87 on the ordinate make it possible to adjust the upper limit l 1-max of first signal l 1 and the upper limit l 2 - max of second signal l 2 .
- FIGS. 9a through 9h are a graphic depiction of the calibration procedure for determining the polygon.
- FIG. 9a shows the first step in calibration.
- a background region H is defined.
- a region of interest F represents, for example, the cell being examined or the cell of interest.
- the polygon can then be constructed sequentially using these two regions (or points) H and F.
- region of interest F migrates as indicated by an arrow 93. Region of interest F achieves an increased intensity in diagram 90.
- the chemical intervention is done for example by pouring a solution of the ion of interest onto the sample.
- the gain of first detector 12 is adjusted so as to reach almost the end of the detector sensitivity/resolution.
- Region of interest F moves in the direction of an arrow 94 away from the abscissa of diagram 90.
- First line 95 connects the background region H and the region of interest F
- second line 96 passes through region of interest F and runs parallel to the abscissa of diagram 90.
- FIG. 9f the ion of interest is now released by intervention.
- the region of interest F migrates in the direction of an arrow 97 away from the intersection of first and second lines 95 and 96.
- the intersection is identified by a dotted box.
- the gain of second detector 14 is adjusted so as to reach almost the end of the detector sensitivity/resolution.
- the region of interest F migrates in the direction of an arrow 98 parallel to the abscissa of diagram 90.
- region of interest F allows a third and fourth line 99 and 100 to be defined.
- Third line 99 connects the background region H and region of interest F.
- the fourth line passes through region of interest F and is parallel to the ordinate of diagram 90.
- This algorithm maximizes the surface area of the resulting polygon, can serve as an explanatory component, and encompasses almost all the calibration parameters. These can subsequently be saved and reused when necessary (similar cells, similar environment).
- the steps described in FIGS. 9b, 9d, 9e, 9g, and 9h can be performed automatically. Each step in itself is relatively simple.
- the steps described in FIGS. 9d and 9g can be performed either by directly modifying the gain on the panel box or also by dragging region of interest F on display 18.
Landscapes
- Physics & Mathematics (AREA)
- Chemical & Material Sciences (AREA)
- Analytical Chemistry (AREA)
- General Physics & Mathematics (AREA)
- Optics & Photonics (AREA)
- Investigating, Analyzing Materials By Fluorescence Or Luminescence (AREA)
- Measuring And Recording Apparatus For Diagnosis (AREA)
Applications Claiming Priority (2)
| Application Number | Priority Date | Filing Date | Title |
|---|---|---|---|
| US17024399P | 1999-12-10 | 1999-12-10 | |
| US170243P | 1999-12-10 |
Publications (3)
| Publication Number | Publication Date |
|---|---|
| EP1120675A2 true EP1120675A2 (de) | 2001-08-01 |
| EP1120675A3 EP1120675A3 (de) | 2003-01-08 |
| EP1120675B1 EP1120675B1 (de) | 2005-01-05 |
Family
ID=22619130
Family Applications (1)
| Application Number | Title | Priority Date | Filing Date |
|---|---|---|---|
| EP00124682A Expired - Lifetime EP1120675B1 (de) | 1999-12-10 | 2000-11-11 | Gerät und Verfahren zum Analysieren von erfassten Abtast-Daten |
Country Status (3)
| Country | Link |
|---|---|
| US (1) | US6721690B2 (de) |
| EP (1) | EP1120675B1 (de) |
| DE (1) | DE60017240T2 (de) |
Cited By (1)
| Publication number | Priority date | Publication date | Assignee | Title |
|---|---|---|---|---|
| WO2003067891A1 (de) | 2002-02-02 | 2003-08-14 | Leica Microsystems Heidelberg Gmbh | Verfahren zur datenverarbeitung in einem scanmikroskop mit schnellem scanner und scanmikroskop mit schnellem scanner |
Families Citing this family (2)
| Publication number | Priority date | Publication date | Assignee | Title |
|---|---|---|---|---|
| CN107664922B (zh) * | 2016-07-29 | 2019-09-17 | 上海微电子装备(集团)股份有限公司 | 扫描反射镜振幅测量装置及测量方法 |
| EP3538941B1 (de) | 2016-11-10 | 2025-04-23 | The Trustees of Columbia University in the City of New York | Schnelles hochauflösendes bildgebungsverfahren für grosse proben |
Family Cites Families (6)
| Publication number | Priority date | Publication date | Assignee | Title |
|---|---|---|---|---|
| US5283433A (en) | 1992-10-05 | 1994-02-01 | The Regents Of The University Of California | Scanning confocal microscope providing a continuous display |
| US6339217B1 (en) * | 1995-07-28 | 2002-01-15 | General Nanotechnology Llc | Scanning probe microscope assembly and method for making spectrophotometric, near-field, and scanning probe measurements |
| US5561611A (en) * | 1994-10-04 | 1996-10-01 | Noran Instruments, Inc. | Method and apparatus for signal restoration without knowledge of the impulse response function of the signal acquisition system |
| US6387707B1 (en) * | 1996-04-25 | 2002-05-14 | Bioarray Solutions | Array Cytometry |
| GB9803368D0 (en) * | 1998-02-17 | 1998-04-15 | Cambridge Consultants | Measurement system |
| US6376843B1 (en) * | 1999-06-23 | 2002-04-23 | Evotec Oai Ag | Method of characterizing fluorescent molecules or other particles using generating functions |
-
2000
- 2000-11-11 EP EP00124682A patent/EP1120675B1/de not_active Expired - Lifetime
- 2000-11-11 DE DE60017240T patent/DE60017240T2/de not_active Expired - Lifetime
- 2000-12-10 US US09/681,051 patent/US6721690B2/en not_active Expired - Lifetime
Cited By (2)
| Publication number | Priority date | Publication date | Assignee | Title |
|---|---|---|---|---|
| WO2003067891A1 (de) | 2002-02-02 | 2003-08-14 | Leica Microsystems Heidelberg Gmbh | Verfahren zur datenverarbeitung in einem scanmikroskop mit schnellem scanner und scanmikroskop mit schnellem scanner |
| US7802027B2 (en) | 2002-02-02 | 2010-09-21 | Leica Microsystems Cms Gmbh | Method for data processing in a scan microscope comprising a fast scanner and scan microscope comprising a fast scanner |
Also Published As
| Publication number | Publication date |
|---|---|
| US6721690B2 (en) | 2004-04-13 |
| US20020027193A1 (en) | 2002-03-07 |
| DE60017240T2 (de) | 2005-12-29 |
| EP1120675B1 (de) | 2005-01-05 |
| DE60017240D1 (de) | 2005-02-10 |
| EP1120675A3 (de) | 2003-01-08 |
Similar Documents
| Publication | Publication Date | Title |
|---|---|---|
| US12130418B2 (en) | Microscope system | |
| US20220349754A1 (en) | Brillouin imaging devices, and systems and methods employing such devices | |
| FR2651321A1 (fr) | Procede de formation d'une image de la distribution bidimensionnelle de la concentration ionique dans une cellule vivante. | |
| WO2013010023A2 (en) | Standardizing fluorescence microscopy systems | |
| EP3353712B1 (de) | Automatische fleckenfindung in pathologie-hellfeldbildern | |
| US10746599B2 (en) | System and method for spectral interpolation using multiple illumination sources | |
| KR20200122375A (ko) | 샘플에서 피분석물을 검출하기 위한 카메라를 보정하고 이용하기 위한 방법들 및 시스템들 | |
| Luo et al. | 4D dual-mode staring hyperspectral-depth imager for simultaneous spectral sensing and surface shape measurement | |
| US11982568B2 (en) | Systems and methods for in situ optimization of tunable light emitting diode sources | |
| CN118401811A (zh) | 光谱装置和带有光谱装置的终端设备以及工作方法 | |
| EP1120675B1 (de) | Gerät und Verfahren zum Analysieren von erfassten Abtast-Daten | |
| JP2022535391A (ja) | 顕微鏡対物レンズの視野を横断する合焦平面の変動を補正するためのシステムおよび方法 | |
| JP7697649B2 (ja) | 補正パラメータ設定方法及びデータ補正方法 | |
| US11366013B2 (en) | Method of obtaining quantum efficiency distribution, method of displaying quantum efficiency distribution, program for obtaining quantum efficiency distribution, program for displaying quantum efficiency distribution, fluorescence spectrophotometer, and display device | |
| CN120102549A (zh) | 用于检测病理组织样本的拉曼光谱自动聚焦系统及方法 | |
| Lenty | Tree-ring growth measurements automation using machine vision | |
| US12022584B2 (en) | Apparatus, method for calibrating an apparatus and device therefor | |
| Quintana-Quintana et al. | Roadmap for the characterization and validation of hyperspectral microscopic systems | |
| Lin et al. | Calibrating fluorescence microscopy with 3D-speckler (3D fluorescence speckle analyzer) | |
| US20020085763A1 (en) | Method, arrangement, and system for ascertaining process variables | |
| WO2015133475A1 (ja) | 顕微鏡装置および解析方法 | |
| JP4850014B2 (ja) | 分光測光システム及び該システムの照明光源位置の補正方法 | |
| CN114813695B (zh) | 基于拉曼散射光谱和定量相位的双模态成像系统、方法 | |
| Shah et al. | Photometric calibration for automated multispectral imaging of biological samples | |
| Gonzálvez Läth | Development of a Software Application for an Optical Scattering Measurement Device |
Legal Events
| Date | Code | Title | Description |
|---|---|---|---|
| PUAI | Public reference made under article 153(3) epc to a published international application that has entered the european phase |
Free format text: ORIGINAL CODE: 0009012 |
|
| AK | Designated contracting states |
Kind code of ref document: A2 Designated state(s): AT BE CH CY DE DK ES FI FR GB GR IE IT LI LU MC NL PT SE TR |
|
| AX | Request for extension of the european patent |
Free format text: AL;LT;LV;MK;RO;SI |
|
| PUAL | Search report despatched |
Free format text: ORIGINAL CODE: 0009013 |
|
| RIC1 | Information provided on ipc code assigned before grant |
Free format text: 7G 02B 21/16 A, 7G 02B 21/00 B, 7G 06F 19/00 B, 7G 01N 21/64 B |
|
| AK | Designated contracting states |
Kind code of ref document: A3 Designated state(s): AT BE CH CY DE DK ES FI FR GB GR IE IT LI LU MC NL PT SE TR |
|
| AX | Request for extension of the european patent |
Free format text: AL;LT;LV;MK;RO;SI |
|
| 17P | Request for examination filed |
Effective date: 20030612 |
|
| 17Q | First examination report despatched |
Effective date: 20030714 |
|
| AKX | Designation fees paid |
Designated state(s): CH DE FR LI |
|
| RBV | Designated contracting states (corrected) |
Designated state(s): DE FR GB |
|
| RBV | Designated contracting states (corrected) |
Designated state(s): CH DE FR LI |
|
| RBV | Designated contracting states (corrected) |
Designated state(s): DE FR GB |
|
| GRAP | Despatch of communication of intention to grant a patent |
Free format text: ORIGINAL CODE: EPIDOSNIGR1 |
|
| GRAS | Grant fee paid |
Free format text: ORIGINAL CODE: EPIDOSNIGR3 |
|
| GRAA | (expected) grant |
Free format text: ORIGINAL CODE: 0009210 |
|
| AK | Designated contracting states |
Kind code of ref document: B1 Designated state(s): DE FR GB |
|
| REG | Reference to a national code |
Ref country code: GB Ref legal event code: FG4D |
|
| REG | Reference to a national code |
Ref country code: IE Ref legal event code: FG4D |
|
| REF | Corresponds to: |
Ref document number: 60017240 Country of ref document: DE Date of ref document: 20050210 Kind code of ref document: P |
|
| ET | Fr: translation filed | ||
| PLBE | No opposition filed within time limit |
Free format text: ORIGINAL CODE: 0009261 |
|
| STAA | Information on the status of an ep patent application or granted ep patent |
Free format text: STATUS: NO OPPOSITION FILED WITHIN TIME LIMIT |
|
| 26N | No opposition filed |
Effective date: 20051006 |
|
| REG | Reference to a national code |
Ref country code: GB Ref legal event code: FG4D |
|
| REG | Reference to a national code |
Ref country code: FR Ref legal event code: PLFP Year of fee payment: 16 |
|
| REG | Reference to a national code |
Ref country code: FR Ref legal event code: PLFP Year of fee payment: 17 |
|
| REG | Reference to a national code |
Ref country code: FR Ref legal event code: PLFP Year of fee payment: 18 |
|
| PGFP | Annual fee paid to national office [announced via postgrant information from national office to epo] |
Ref country code: FR Payment date: 20171129 Year of fee payment: 18 |
|
| PGFP | Annual fee paid to national office [announced via postgrant information from national office to epo] |
Ref country code: GB Payment date: 20171130 Year of fee payment: 18 |
|
| PGFP | Annual fee paid to national office [announced via postgrant information from national office to epo] |
Ref country code: DE Payment date: 20180131 Year of fee payment: 18 |
|
| REG | Reference to a national code |
Ref country code: DE Ref legal event code: R119 Ref document number: 60017240 Country of ref document: DE |
|
| GBPC | Gb: european patent ceased through non-payment of renewal fee |
Effective date: 20181111 |
|
| PG25 | Lapsed in a contracting state [announced via postgrant information from national office to epo] |
Ref country code: FR Free format text: LAPSE BECAUSE OF NON-PAYMENT OF DUE FEES Effective date: 20181130 Ref country code: DE Free format text: LAPSE BECAUSE OF NON-PAYMENT OF DUE FEES Effective date: 20190601 |
|
| PG25 | Lapsed in a contracting state [announced via postgrant information from national office to epo] |
Ref country code: GB Free format text: LAPSE BECAUSE OF NON-PAYMENT OF DUE FEES Effective date: 20181111 |