EP1102004B1 - Sample analyzing monitor and combustion control system using the same - Google Patents
Sample analyzing monitor and combustion control system using the same Download PDFInfo
- Publication number
- EP1102004B1 EP1102004B1 EP00124831A EP00124831A EP1102004B1 EP 1102004 B1 EP1102004 B1 EP 1102004B1 EP 00124831 A EP00124831 A EP 00124831A EP 00124831 A EP00124831 A EP 00124831A EP 1102004 B1 EP1102004 B1 EP 1102004B1
- Authority
- EP
- European Patent Office
- Prior art keywords
- gas
- internal standard
- ion
- concentration
- target material
- Prior art date
- Legal status (The legal status is an assumption and is not a legal conclusion. Google has not performed a legal analysis and makes no representation as to the accuracy of the status listed.)
- Expired - Lifetime
Links
Images


Classifications
-
- H—ELECTRICITY
- H01—ELECTRIC ELEMENTS
- H01J—ELECTRIC DISCHARGE TUBES OR DISCHARGE LAMPS
- H01J49/00—Particle spectrometers or separator tubes
- H01J49/0009—Calibration of the apparatus
-
- F—MECHANICAL ENGINEERING; LIGHTING; HEATING; WEAPONS; BLASTING
- F23—COMBUSTION APPARATUS; COMBUSTION PROCESSES
- F23G—CREMATION FURNACES; CONSUMING WASTE PRODUCTS BY COMBUSTION
- F23G5/00—Incineration of waste; Incinerator constructions; Details, accessories or control therefor
- F23G5/50—Control or safety arrangements
-
- H—ELECTRICITY
- H01—ELECTRIC ELEMENTS
- H01J—ELECTRIC DISCHARGE TUBES OR DISCHARGE LAMPS
- H01J49/00—Particle spectrometers or separator tubes
- H01J49/02—Details
- H01J49/04—Arrangements for introducing or extracting samples to be analysed, e.g. vacuum locks; Arrangements for external adjustment of electron- or ion-optical components
- H01J49/0422—Arrangements for introducing or extracting samples to be analysed, e.g. vacuum locks; Arrangements for external adjustment of electron- or ion-optical components for gaseous samples
-
- G—PHYSICS
- G01—MEASURING; TESTING
- G01N—INVESTIGATING OR ANALYSING MATERIALS BY DETERMINING THEIR CHEMICAL OR PHYSICAL PROPERTIES
- G01N33/00—Investigating or analysing materials by specific methods not covered by groups G01N1/00 - G01N31/00
- G01N33/0004—Gaseous mixtures, e.g. polluted air
- G01N33/0009—General constructional details of gas analysers, e.g. portable test equipment
- G01N33/0027—General constructional details of gas analysers, e.g. portable test equipment concerning the detector
- G01N33/0036—General constructional details of gas analysers, e.g. portable test equipment concerning the detector specially adapted to detect a particular component
- G01N33/0047—Organic compounds
- G01N33/0049—Halogenated organic compounds
Definitions
- dioxin congeners and so on contained in combustion ash are thermally decomposed by heating the ash, so as to reduce the dioxin congeners and so on.
- Polychlorinated benzene congeners and polychlorinated phenol congeners in the ash before and after the heating are analyzed to estimate the elimination ratio of the dioxin congeners. In this manner, the condition for the thermal decomposition is optimized.
- JP-A-9-243601 which discloses a monitoring device with many of the features of claim 1, polychlorinated benzene congeners and polychlorinated phenol congeners in flue gas are subjected to real-time measurement, and the concentration of dioxin congeners is continuously obtained.
- the flue gas is introduced to a laser ionizing mass spectrometer to ionize the flue gas.
- the flue gas is subjected to mass spectrometry.
- the concentrations of the polychlorinated benzene congeners and the polychlorinated phenol congeners are obtained.
- the concentration of the dioxin congeners is indirectly calculated.
- the concentration N CP of the polychlorinated phenol congeners to be obtained can be basically represented by the summation of concentrations of monochlorophenol (MCP), dichlorophenol (DCP), trichlorophenol (TCP), tetrachlorophenol (TECP), and pentapolychlorinated phenol (PCP).
- MCP monochlorophenol
- DCP dichlorophenol
- TCP trichlorophenol
- TECP tetrachlorophenol
- PCP pentapolychlorinated phenol
- the concentration N CP to be obtained with a dioxin monitor can be represented as follows: N C ⁇ P ⁇ N D ⁇ C ⁇ P + N T ⁇ C ⁇ P + N T ⁇ E ⁇ C ⁇ P + N P ⁇ C ⁇ P
- N CP Q, P 1 , T 1
- the concentration N s of an internal standard is adjusted in the manner that the internal standard has properties similar to the following: the average amount of dichlorophenol and the average concentration of interfering components such as hydrogen chloride, each of which was beforehand measured in a certain incineration furnace.
- the ratios k DCP , k TCP and k TECP in this case are decided. If polychlorinated phenol congeners having a concentration of, for example, about 1-10 ⁇ g/Nm 3 is quantitatively analyzed, it is advisable that the concentration N s is set to 5 ⁇ g/Nm 3 .
- dibromphenol, tribromophenol and tetrabromophenol are used as internal standards for DCP, TCP, and TECP, respectively.
- an activated carbon filter is set and the internal standard is caused to be absorbed thereon.
- the internal standard may be discharged into a furnace which can attain perfect combustion.
- the internal standard is put into a heat-resistant container which is made of a metal and has a hole having a diameter of about 0.1 mm to several mm, and the container is put into the internal standard vaporizer 30.
- the gas flow rate is about 1-3 L(liter) /min. Therefore, a surplus flow is discharged through a bypass line 32.
- a filter having a pore size of about 0.2 ⁇ m is set up.
- the ionization section (ion source) 11 used in the mass spectrometer include ion sources using atmospheric pressure chemical ionization, chemical ionization, electron impact ionization, molecule ionization by plasma, and ionization by glow discharge.
- a counter flow type atmospheric pressure chemical ion source which was developed by the present Applicant, is used.
- the concentration of the internal standard changes by a change in the amount of air flowing in the internal standard gas. Therefore, the flow rate of the air is preferably controlled into a constant value with a mass flow controller 31.
- the flow rate F2 is preferably controlled into a constant value with a mass flow meter 23. It is necessary that the flow rate F2 of the flow toward the needle electrode is 10 ml/min. or more.
- polytetrafluoroethylene lining pipes or glass lining pipes instead of the glass lining pipes, glass tubes or quartz tubes cut into small sizes may be packed into pipes. There may be used a fused silica column having a wide bore, which is used as a column for gas chromatography (GC).
- GC gas chromatography
- Dioxin and related compound thereto are present in only a minute amount in flue gas. These compounds are easily absorbed on the walls of the sample-collecting system, which are composed of the pipes, the filter and so on. In order to prevent such absorption as much as possible, the whole of the sample-collecting system is heated, or the pipes are made of a material having small absorption ability.
- the amount of flue gas flowing in the pipes is made large, the absorption can be reduced. That is, the retention time of the flue gas in the pipes is shortened as much as possible.
- the internal standard vaporizer 30 By setting up the internal standard vaporizer 30, it is possible to subject the monitor section to a periodic inspection through a valve 16 for exchanging internal standards, and a pipe 8 for the internal standard. That is, the internal standard gas is introduced instead of flue gas, and then it is checked whether or not the amount of ions originating from the observed internal standard is more than a certain constant value. When the observed ion intensity is more than a constant value, maintenance is required. In the present invention, it is important that the internal standard is supplied at a constant concentration. Thus, it is preferable to check whether or not the concentration of the internal standard which is being added changes by GS/MS or the like.
- Negative ions generated in the ion source of the present invention pass through a first ion taking-in pore 37 (diameter: about 0.3 mm, length: about 20 mm) made in a first flange-type electrode 36, a second ion taking-in pore 38 (diameter: about 0.6 mm, length: about 0.3 mm), and a third ion taking-in pore 39 (diameter: about 0.3 mm, length: about 0.3 mm) , each of which is heated to 100-300°C with a heater (not illustrated).
- FIG. 5 illustrates a case in which a scroll pump 27 (pumping capacity: about 900 L/min.) and a turbo molecule pump 40 (pumping capacity: about 200-300 L/min.) are used for evacuations of the differential pumping portion and the mass spectrometer, respectively.
- the scroll pump 27 is also used as a pump for evacuating the back pressure side of the turbo molecule pump 40.
- the pressure between the second ion taking-in pore 38 and the third ion taking-ion pore 39 is from 0.1 to 10 Torr.
- a differential pumping portion using two pores may be used.
- the generated ions pass through the third ion taking-in pore 39, and subsequently the ions are converged into a convergent lens 41.
- a convergent lens 41 a Einzel lens composed of three electrodes, or the like lens is used.
- the ions pass through an electrode 42 with a slit.
- the ions which have passed through the third ion taking-in pore 39 are converged into this slit through the convergent lens 41.
- Neutral particles or the like particles which are not converged collide with the vicinity of the slit so that these particles do not go easily toward the mass spectrometer.
- the ions which have passed through the double cylindrical type lens 45 are introduced into an ion trap mass spectrometer.
- the ion trap is composed of a gate electrode 46, end cap electrodes 47a and 47b, a ring electrode 48, shielding electrodes 49a and 49b, insulating rings 50a and 50b, and an ion taking-in lens 51.
- the gate electrode 46 has a function of preventing introduction of ions from the outside to the mass spectrometer when the ions trapped in the mass spectrometer are taken outside the mass spectrometer.
- the pressure in the ion trap mass spectrometer when the buffer gas is introduced is from about 10 -3 to 10 -4 Torr.
- the ion trap mass spectrometer is controlled by a mass spectrometer control unit.
- the ion trap mass spectrometer has a property of trapping ions.
- one of good points of the ion trap mass spectrometer is that even a small concentration of the sample can be detected if the time for trapping ions is extended. Accordingly, even when the concentration of the sample is small, ions can be concentrated high times in the ion trap mass spectrometer.
- pretreatment of the sample such as concentration thereof, can be made very simple.
- the reduction ratio based on reaction or absorption in the filter 2 or the pipes in the middle, and the ionization efficiency and detection efficiency in the mass spectrometer 12 are equal. Therefore, such a case is very effective for systems in which absorption onto the pipes is greatly caused.
- the stable isotope is usually expensive. Thus, a problem about costs may arise.
- a measurement is started (step 601). Thereafter, MS spectra or MS/MS spectra are analyzed (step 602) to measure the ion strength of a target trace gas (step 603) and measure the ion strength of an internal standard (step 604).
- MS spectra or MS/MS spectra are analyzed (step 602) to measure the ion strength of a target trace gas (step 603) and measure the ion strength of an internal standard (step 604).
- the ion source 11 and the mass spectrometer 12 it is checked whether the ion strength of the internal standard drops or rises extremely (step 605). In the case that it is abnormal, a warning is issued (step 606), and a necessary maintenance is done (step 607).
- the ion strength ratio of the target trace gas to the internal standard is measured (step 608) when the internal standard is an isotope of the target trace gas. Thereafter, the ratio is multiplied by the concentration of the internal standard that was beforehand measured, to calculate the concentration of the target trace gas (step 609). In the other cases, the concentration of the target trace gas is calculated from a correlation between the target trace gas and the internal standard which was beforehand obtained (step 609). After the calculation of the concentration and display thereof, the following measurement will be started (step 610).
- FIG. 11 shows one example of the sequence of the measurement in this case. According to this sequence, it can be checked whether a caused abnormality is routine or sudden.
- the sequence up to the measurement of the ion strength of a target trace gas (step 603) and the measurement of the ion strength of an internal standard (step 604) is the same as shown in FIG. 10 .
- the ion strength of the internal standard is checked (step 605).
- the vacuum degree of the mass spectrometer, the values of the respective flow meters, the temperature of the piping, the temperature inside the monitor, the current of corona discharge, and the strength of all ions are checked (steps 611, 612, 613, 614, 615 and 616), respectively.
- the positive ion- and negative ion-analyzing modes is alternatively used. In this way, data on positive ions and negative ions can be obtained by one measurement operation.
- the polarity of voltages applied to the ion optics (composed of the ion source, the ion orbit converging lens and so on) , the detector and so on must be reversed.
- a high voltage is applied to its needle electrode and opposite electrode.
- a positive voltage is applied to the needle electrode.
- a negative ion measuring mode a negative voltage is applied to the needle electrode.
- the polarity of voltages applied to the ion optics and the detector must be reversed dependently on the polarity of ions to be measured.
Landscapes
- Chemical & Material Sciences (AREA)
- Analytical Chemistry (AREA)
- Engineering & Computer Science (AREA)
- Mechanical Engineering (AREA)
- General Engineering & Computer Science (AREA)
- Other Investigation Or Analysis Of Materials By Electrical Means (AREA)
- Electron Tubes For Measurement (AREA)
- Sampling And Sample Adjustment (AREA)
- Incineration Of Waste (AREA)
Description
- The present invention relates to an calibrating process for analyzing a sample and a device therefor, and particularly to a sample analyzing monitor in which dioxin and related compounds contained in combustion flue gas resulting from incineration of non-industrial waste and industrial waste, exhaust gas from metal refining processes, exhaust gas from cars, or the atmosphere are detected to determine the concentration of the dioxins or the dioxin precursors in the flue gas or the atmosphere; and a combustion control system in which the results from the monitoring by means of the monitor are used for combustion control.
- It is known that dioxins are contained in exhaust gas from metal refining processes, exhaust gas from cars, or waste liquid from a bleaching process of pulp or the like. The word "dioxins" is a general term of polychlorinated dibenzo-p-dioxins (PCDDs) having 75 kinds of isomers and polychlorinated dibenzofurans (PCDFs) having 135 kinds of isomers. A broad sense of the word includes coplanar polychlorinated biphenyl (coplanar PCBs). Dioxin and compounds related thereto are abbreviated to "dioxins congeners" hereinafter.
- Findings on the mechanism of generation of dioxin congeners have been accumulated (BUNSEKI, 1998, pp. 512-519). Conditions for generating dioxin congeners varies greatly, dependently on sites, the mechanism of the generation thereof and so on, and are highly complicated. It is considered that in a combustion process at high temperature in an incineration plant or the like, de novo synthesis is an influential mechanism of generation of dioxin congeners. In the de novo synthesis, a chloride of a metal such as cobalt, iron or copper in fly ash functions as a catalyst so that carbon reacts with chlorine. In the basic reaction of the de novo synthesis, carbon atoms, chlorine atoms and oxygen atoms which coexist at high temperature are subjected to radical reaction so that not only dioxin congeners but also many organic chlorine compounds such as polychlorinated benzene congeners and polychlorinated phenol congeners are produced. The produced polychlorinated benzene congeners and polychlorinated phenol congeners turns to precursor congeners of dioxin congeners. It is said that the precursors turn to dioxin congeners. It is also said that in an incineration plant, dioxin congeners are generated mainly by two processes. One thereof is a process in which dioxin congeners are generated upon imperfect combustion inside a combustion furnace, the combustion temperature of which is lower than 800°C. The other is de novo synthesis inside a boiler or a dust collector at a temperature of 250-550°C.
- Various measures are taken to reduce the generation of dioxin congeners in incineration plants as much as possible. To suppress the discharge of dioxin congeners to surroundings, it is desired that combustion conditions are improved or techniques for removing dioxin congeners efficiently are developed. However, much time and labor have been required for the development of the techniques for suppressing the discharge of dioxin congeners. For example, the following process has been conducted: the process of combusting wastes under a certain condition, determining the concentration of dioxin congeners in flue gas or fly ash under this condition, obtaining a correlation between the combustion condition and the amount of the generated dioxin congeners, and searching an optimal combustion condition or an optimal removal condition from the correlation.
- In order to monitor the operation situation of actual incineration plants, there has been recently suggested a process in which the concentration of dioxin congeners, which have a very low concentration, is not directly measured but an alternative substance which has a relatively high concentration is assayed and then the concentration of the dioxin congeners is estimated from the result of the assay. Examples of such a technique include processes and devices disclosed in the Bulletin of Institute of Environmental Science & Technology of Yokohama National University (Vol. 18, 1992),
JP-A-Nos. 4-161849 5-312796 7-155731 9-015229 9-243601 - In the techniques disclosed in the Bulletin of Institute of Environmental Science & Technology of Yokohama National University (Vol. 18, 1992) and
JP-A-Nos. 4-161849 5-312796 - In the technique disclosed in
JP-A-7-155731 - In the technique disclosed in
JP-A-9-015229 - In
JP-A-9-243601 claim 1, polychlorinated benzene congeners and polychlorinated phenol congeners in flue gas are subjected to real-time measurement, and the concentration of dioxin congeners is continuously obtained. The flue gas is introduced to a laser ionizing mass spectrometer to ionize the flue gas. The flue gas is subjected to mass spectrometry. Thus, the concentrations of the polychlorinated benzene congeners and the polychlorinated phenol congeners are obtained. At last, the concentration of the dioxin congeners is indirectly calculated. -
JP-A-9-55185 - It is expected that the generation of dioxin congeners from incineration plants is reduced by a dioxin-reducing manner based on improvement in combustion conditions, adoption of a removal technique, or the like. However, it is indispensable to measure, at a real time, how much dioxin congeners are reduced by such a dioxin-reducing manner. From such a viewpoint, the above-mentioned methods have the following problems.
- Each of the Bulletin of the Institute of Environmental Science & Technology of Yokohama National University (Vol. 18, 1992) and
JP-A-Nos. 4-161849 5-312796 -
JP-A-7-155731 JP-A-9-015229 -
JP-A-9-243601 - In
JP-A-9-55185 JP-A-9-55185 JP-A-9-55185 -
WO-A-99/13492 -
WO-A-99/23779 - An object of the present invention is to make it possible to measure the concentration of a target trace gas in gas containing various impurities while the concentration is calibrated moment by moment and to realize an on-line real-time analysis at high precision.
- This object is met by the monitoring device set forth in
claim 1. - Specifically, the concentration of the target trace gas is calibrated and quantitatively measured as follows. (1) An internal standard having properties, such as ionization efficiency and vapor pressure, similar to the target trace gas is introduced at a constant concentration to the side of an incineration furnace of a pretreatment section of a monitor, and then the ion strength ratio of the target trace gas to the internal standard is measured to determine the target trace gas quantitatively.
- In this way, it is possible to correct an error resulting from a change in the ion strength on the basis of effects of impurities and an error resulting from a change in the concentration on the basis of adhesion of the target trace gas to pipes in the middle and the pretreatment section. As a result, the target trace gas can be quantitatively measured. (2) While the amount of waste gas introduced from an incineration furnace to a monitor is monitored to calibrate a change in the amount of an introduced target trace gas based on a change in the amount of the introduced waste gas, an internal standard having properties, such as ionization efficiency and vapor pressure, similar to the target trace gas is introduced at a constant concentration to an ion source of the monitor. In this way, the ion strength ratio of the target trace gas to the internal standard is measured to determine the target trace gas quantitatively.
-
-
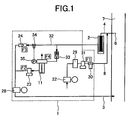
FIG. 1 is a view illustrating a piping arrangement of an embodiment of the present invention. -
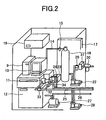
FIG. 2 is a view illustrating the exterior of the piping arrangement illustrated inFIG. 1 . -
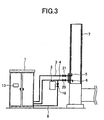
FIG. 3 is a schematic view illustrating the whole of the exterior of the piping arrangement illustrated inFIG. 1 , including a flue gas duct. -
FIG. 4 is a view illustrating an example of an internal standard vaporizer in the present invention. -
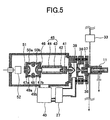
FIG. 5 is a sectional view illustrating an example of a mass spectrometer. -
FIG. 6 is a view illustrating a piping arrangement for adding an internal standard. -
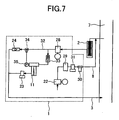
FIG. 7 is a view illustrating a piping arrangement of a further embodiment of the present invention. -
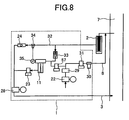
FIG. 8 is view illustrating a piping arrangement of a still further embodiment of the present invention. -
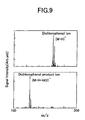
FIG. 9 is a characteristic graph showing a measurement result according to the present invention. -
FIG. 10 is a flowchart for showing an example of measurement sequence in the present invention. -
FIG. 11 is a flowchart for showing another example of measurement sequence in the present invention. -
FIG. 12 is a view for explaining a mode of taking in positive and negative ions in an ion source section in the present invention. -
FIG. 13 is a graph for explaining an example of quantitative analysis according to the present invention. - First, the basis of the present invention will be described. Signal quantity measured with a mass spectrometer used in a monitor unit, that is, ion strength is generally represented by the product of factors expressing the concentration of a sample gas, the ionization efficiency of an ion source, the ion transmission ratio in the mass spectrometer, the detection efficiency therein, and so on.
- For example, quantitative analysis of polychlorinated phenol congeners will be described. The same process for quantitative analysis as described below can be applied to the case that materials to be quantitatively analyzed are other materials such as polychlorinated benzene congeners or dioxin congeners.
- The concentration NCP of the polychlorinated phenol congeners to be obtained can be basically represented by the summation of concentrations of monochlorophenol (MCP), dichlorophenol (DCP), trichlorophenol (TCP), tetrachlorophenol (TECP), and pentapolychlorinated phenol (PCP). However, monochlorophenol generates no chlorinated dioxin by condensation reaction. Thus, monochlorophenol is excluded. That is, the concentration NCP to be obtained with a dioxin monitor can be represented as follows:

- When flue gas is introduced from a flue gas duct to the monitoring device, absorption of sample molecules in the flue gas to the inner wall of the piping as the duct or desorption thereof from the inner wall comes into question. Therefore, the concentration N depends substantially on the absorption energy Q of the sample molecules, the partial pressure P1 thereof, and the temperature T1 of the piping. In other words, the concentration N is a function of theses factors. Therefore, NCP (Q, P1, T1) can be represented as follows:

- Next, the respective concentrations NDCP, NTCP, NTECP and NPCP will be discussed. In general, ion strength I measured with a mass spectrometer can be represented by the following equation:

wherein N is the concentration of a sample gas, α is the ionization efficiency of an ion source, and β is the ion transmission ratio in the mass spectrometer, the detection efficiency therein or the like. In this case, a is a function of the temperature T2 of the ion source, a function of the concentration M of interfering components such as hydrogen chloride, and a function of the pressure P2 inside the ion source. - It can be considered that β does not change dependently on the kind of polychlorinated phenols, Accordingly, the ion strengths IDCP, ITCP, ITECP and IPCP of DCP, TCP, TECP and PCP can be represented by the following formulae, respectively:


- From the above, the concentration NCP can be represented by the following formula:

- In this case, the most simple quantitative analysis of the concentration NCP (M, P1, P2, Q, T1, T2) can be performed as follows.
- In the case that polychlorinated phenol congeners which are actually generated from an incineration plant are analyzed, the amount of DCP is 1-20% of the polychlorinated phenol congeners, the amount of TCP is 10-40% thereof, the amount of TECP is 10-40% thereof, and the amount of PCP is small. Therefore, the concentration NCP to be obtained through the dioxin monitor can be represented by the summation of the concentrations of DCP, TCP and TECP.
- Actual measurement is made, using a certain material of the piping, under a certain temperature T1 of the piping and a certain temperature T2 of the ion source. Therefore, the concentration NCP is not any function of the temperatures T1 or T2.
- In this case, the concentration NCP can be simply represented by the following formula:


- When an internal standard S having an ionization efficiency (α s) and a concentration (Ns) is added to flue gas, the observed ion strength of the internal standard S can be represented under a constant condition by the following formula:

- Therefore, if the ratio of each of the known concentrations NDCP, NTCP and NTECP to the concentration Ns (known concentration) is measured in the range of the concentration to be quantitatively analyzed for polychlorinated phenol congeners (about 0.01-1000 µ g/Nm3), the ratio α between the ionization efficiencies can be obtained in a certain constant condition. It can be considered that in this case, the dependency of the ion strength of the sample molecules upon the pressure of the ion source is equal to the dependency of the ion strength of the internal standard molecules upon the pressure of the ion source. Therefore, the ratio between the ionization efficiencies does not depend on the pressure P2. When the sample molecules and the internal standard molecules have substantially the same absorption energy and concentration, it can be considered that the ratio between the ionization efficiencies does not depend on the absorption energy Q and the pressure P2. That is, using the ratios:


and
the concentration NCP can be finally represented by the following formula:
- The manner of coping with change in the ionization efficiency or the ion strength by the concentration of interfering components comes into question. If the dependencies of the ion strengths (ionization efficiencies) of the sample molecules and the selected internal standard upon the concentration of the interfering components are substantially the same, the concentration NCP is not any function of the concentration M of the interfering components. For this reason, it is necessary to measure the dependency of the ion strength of each of DCP, TCP, TECP, and the sample used as the internal standard (for example, an organic halogen compound such as dibromophenol) upon the concentration of hydrogen chloride.
- When the dependencies of the ion strengths of the sample molecules and the internal standard upon the concentration of the interfering component are substantially the same, the concentration NCP can be represented by the following formula:

- In the case that dichlorophenol congeners are actually analyzed quantitatively, the concentration Ns of an internal standard is adjusted in the manner that the internal standard has properties similar to the following: the average amount of dichlorophenol and the average concentration of interfering components such as hydrogen chloride, each of which was beforehand measured in a certain incineration furnace. The ratios kDCP, kTCP and kTECP in this case are decided. If polychlorinated phenol congeners having a concentration of, for example, about 1-10 µ g/Nm3 is quantitatively analyzed, it is advisable that the concentration Ns is set to 5 µ g/Nm3.
- It can be considered that, in particular, in the case in which the isotope DDCP, DTCP or DTECP of DCP, TCP or TECP is used as an internal standard, the ionization efficiencies thereof are the same. Thus, the ratio k is one.
- In the above-mentioned case, one kind of the internal standard is used to analyze polychlorinated phenol congeners consisting of di, tri, and tetrachlorophenols. However, in the case of plural materials to be quantitatively analyzed, an internal standard can be prepared for each of the plural materials. In this case, the above-mentioned formula can be represented by the following formula:

wherein the different internal standards are represented bysubscripts - For example, dibromphenol, tribromophenol and tetrabromophenol are used as internal standards for DCP, TCP, and TECP, respectively.
- In the case that the dependencies of ion strengths of a target trace gas and an internal standard upon the concentration of interfering components are different, DCP, TCP, TECP and the internal standard each of which has an experimentally-known concentration are used to obtain a correlation between the ion strengths of DCP, TCP and TECP and the ion strength of the internal standard when the concentration M of impurities changes. From this correlation, the concentration of the target trace gas can be obtained.
- In other words, a correlation between the ion strengths in the following case is obtained: the case that temperature T, pressure P and the concentration of an internal standard are measured under the same conditions; the internal standard and each of DCP, TCP and TECP having a known concentration are simultaneously introduced into an ion source; and the concentration of hydrogen chloride are changed.
- The following relationships can be approved:


and
- When the concentrations of DCP, TCP and TECP when this correlation has been obtained are represented by NA,DCP, NA,TCP, and NA,TECP, respectively, the concentrations NDCP, NTCP, and NTECP of DCP, TCP and TECP in the case that the concentration of the interfering components in the flue gas has changed are represented by the following formulae:


and
- The concentration NCP of the polychlorinated phenol congeners can be represented by the following formula:

- The quantitative analysis using an internal standard additive has been described above, and the method of selecting an optimal internal standard additive will be described.
- The internal standard additive is preferably a rare isotope of a target trace gas. In many case, however, a rare isotope is very expensive or is difficult to obtain. Thus, it is necessary to substitute a different substance for the isotope.
- Atmospheric pressure chemical ionization or chemical ionization is greatly affected by other impurities, and is an ionization process which requires frequent calibrations. Since such ionization process has a simple step of ionization, it is easy to select an appropriate additive. Such a process advances according to the following steps. Ionization (primary ionization) is first caused by electrons generated by discharge or the like. The primary ionization is based on interaction between electrons having excessive energy and neutral molecules, and is unselective ionization. It is however said that subsequent collisions are caused about 105-106 times in an atmospheric ion source or about 104-105 times in a chemical ion source. By ion-molecule reaction or charge transfer reaction caused at this time, electrical charges are transferred to products which are more easily ionized (secondary ionization) . As is presumed from such an ionization process, the secondary ionization is very selective. In such an ionization process, positive ions or negative ions are generated mainly by proton transfer reaction or charge transfer reaction. In order to decide an internal standard additive, it is necessary to assume the final step of the secondary ionization. For example, an aromatic molecule has a small ionization energy; thus, the molecule has a property of discharging electrons to turn to a positive ion (M+) . A molecule having a high basicity, such as a molecule having an amino group, has a property of turning to a positive ion (M+1+) by proton transfer reaction. A molecule having a large electron affinity, such as an aromatic nitro compound, has a property of attracting an electron to turn to a negative ion (M-). A substance having a high acidity, such as HCl, has a property of delivering a proton to another substance to turn to a negative ion (M-1-) . These can be simply estimated from the mass number and the ion electrical charge to be detected as compared with the original molecule (M).
- The following will discuss a case in which 2,4-dichlorophenol is measured. When 2,4-dichlorophenol is measured in the negative mode of atmospheric pressure chemical ionization, an ion of (M-1-) is detected. From this fact, it can be understood that this ionization is caused by the delivery of hydrogen. Thus, values obtained by subtracting the electron affinity of a dissociated molecule from a dissociating energy of a bond with hydrogen are compared as a parameter. This parameter is described "Mass spectrometer, Vol.28, No.3, 185 (1980)". As an actual parameter for phenol congeners, data described in Journal of the American Chemical Society, Vol.99, No.7, 2222(1977) are referred to.
- Referring to the drawings, an embodiment of the specific structure of the present invention (that is, a piping arrangement including a mass spectrometer in the case that an internal standard is added) will be described.
-
FIG. 1 is a view illustrating a piping arrangement of an embodiment of the present invention.FIG. 2 is a view illustrating the exterior thereof, andFIG. 3 is a schematic view illustrating the whole of the exterior of the piping arrangement including a flue gas duct. A target trace gas is attracted from aflue gas duct 7 of a combustion furnace to anonline measurement device 1 through anozzle 6 and apipe 4. The gas is absorbed with apump 28 to introduce the gas into theonline measurement device 1. The analyzed gas is discharged to theflue gas duct 7 through an fluegas return pipe 3. The gas absorbed from theflue gas duct 7 passes through thepipe 4, and fine particles called dust or mist are removed with afilter 2. Thereafter, the gas is introduced into themeasurement device 1. From the atmosphere absorbed with apump 22, dust is removed with afilter 29, and an internal standard gas is added to the upstream of thefilter 2 through an internalstandard vaporizer 30 and a pipe 8 connected thereto. Alternatively, the internal standard may be introduced with an air cylinder instead of thepump 22. The concentration of the internal standard is set up to a value similar to the average concentration of the target trace gas in flue gas which was beforehand measured by GC/MS or the like. If the concentration of polychlorinated phenol congeners is, for example, 1-10 µ g/Nm3 in measurement thereof in the flue gas duct, the concentration of the internal standard to be added is set to about 5 µ g/Nm3. In the case that a problem arises when the sample gas to which the internal standard is added is discharged into the flue gas duct, an activated carbon filter is set and the internal standard is caused to be absorbed thereon. Alternatively, the internal standard may be discharged into a furnace which can attain perfect combustion. The internal standard is put into a heat-resistant container which is made of a metal and has a hole having a diameter of about 0.1 mm to several mm, and the container is put into the internalstandard vaporizer 30. - The shape of the internal
standard vaporizer 30 may be any one if thegenerator 30 has a structure wherein the evaporated internal standard can be mixed with air from thepump 22. An example thereof is shown inFIG. 4A . The size and the shape of the hole of the container into which the internal standard is put may be decided in the manner that a target concentration can be generated dependently on the evaporated amount of the internal standard. In the case that there are plural target trace gases and plural internal standards are added accordingly, plural containers in which the plural internal standards are put are put into the internal standard vaporizer. Since the generation amount of the internal standard is greatly affected by temperature, it is important that the a heater is wound around the internalstandard vaporizer 30 to control the temperature thereof into a constant value. In the case of preventing a phenomenon that the internal standard is filled into the piping by stopping the introduction of flue gas for a long time, for example, for maintenance, it is advisable that a branched pipe is set up as shown inFIG. 4B and the internal standard is returned by continuing to send the air. - In the mass spectrometer, it is sufficient that the gas flow rate is about 1-3 L(liter) /min. Therefore, a surplus flow is discharged through a
bypass line 32. In order to remove finer dust from the gas introduced into anionization section 11, a filter having a pore size of about 0.2 µ m is set up. Examples of the ionization section (ion source) 11 used in the mass spectrometer include ion sources using atmospheric pressure chemical ionization, chemical ionization, electron impact ionization, molecule ionization by plasma, and ionization by glow discharge. In the present embodiment, a counter flow type atmospheric pressure chemical ion source, which was developed by the present Applicant, is used. This ion source uses a method in which a target trace gas can be effectively ionized when a sample to be introduced into the ionization section is caused to flow conversely to the direction along which ions generated near a needle electrode advance by an electric field, that is, to flow toward the needle electrode. The flow rate of the sample toward the needle electrodes is set to 10 ml(milliliter)/min. or more. - A relationship between the concentration C1 measured in the ion source and the concentration C2 in the flue gas in the flue gas duct is as follows:

wherein the flow rate of the gas containing the internal standard is represented by F1, the counter flow rate of the gas flowing in the ion source is represented by F2, the flow rate of the gas flowing in the bypass is represented by F3, and the flow rate of the gas flowing from the ion source to the vacuum section of the mass spectrometer is represented by F4. - At this time, in connection with the flow rate F1, the concentration of the internal standard changes by a change in the amount of air flowing in the internal standard gas. Therefore, the flow rate of the air is preferably controlled into a constant value with a
mass flow controller 31. When the counter flow rate F2 changes continuously, the ion efficiencies of the target trace gas and the internal standard in the ion source also change. Therefore, in order to make an accidental error at the time of calibration small, the flow rate F2 is preferably controlled into a constant value with amass flow meter 23. It is necessary that the flow rate F2 of the flow toward the needle electrode is 10 ml/min. or more. The flow rate F4 may be estimated from the pore size and the length of the pore for taking in ions or may be beforehand obtained by experiments. The bypass flow rate F3 is measured with a mass flow meter and the flow rate F4 may be made to a constant value since the pressure of the ion source is controlled with apressure control valve 34. Pressure signals for controlling thepressure control valve 34 are sent from a pressure sensor 35 (non-illustrated inFIG. 2 ) attached to the ion source. - The
dust filter 2 is a filter into which metal elements having a length of several µ m are filled and can be suitably exchanged when it is blocked with ash or dust. To reduce absorption of the sample gas, it is necessary to raise the temperature of the wall of thedust filter 2 up to a higher temperature than the temperature of thepipe 4 for the sample gas. When the temperature of the pipe for the sample gas is about 120°C in the case that dioxin precursors such as polychlorinated benzene and polychlorinated phenol are measured, it is effective that the temperature of thedust filter 2 is raised up to a high value of about 180 to 200°C. Many solid impurities or fly ash can be removed with thedust filter 2. If a metal filter is set up at the downstream thereof, inflow of finer dust into theion source 11 can be prevented. - The size of the dust to be removed can be controlled by the size of the mesh of the metal filter. In many cases, a filter having a mesh of about 0.1 to 0.5 µ m is used. This part can be exchanged. Dependently on the amount of solid impurities or fly ash in the site where sample gas is collected, plural filters may be combined. If in this case the meshes of the filters are gradually made finer from the upstream of the pipes in this site to the downstream thereof, measurement for a long time can be attained. In order to prevent corrosion based on flue gas, it is preferable that the pipes and the valves are made of stainless steel or titanium, which is not easily corroded.
- In order to prevent absorption of trace components of the walls of the pipes, it is preferable to use, as the pipes, polytetrafluoroethylene lining pipes or glass lining pipes. Instead of the glass lining pipes, glass tubes or quartz tubes cut into small sizes may be packed into pipes. There may be used a fused silica column having a wide bore, which is used as a column for gas chromatography (GC).
- The sample gas is attracted with a
pump 28 for introducing the sample gas, and is introduced into theion source 11. The flow rate of the introduced sample gas depends on the inner size and the length of the used pipe for the sample gas, the air-sending speed of thispump 28, and so on. The flow rate is usually from about 1 to 300 L/min. As thispump 28, a mechanical pump such as a diaphragm pump may be used. - Dioxin and related compound thereto are present in only a minute amount in flue gas. These compounds are easily absorbed on the walls of the sample-collecting system, which are composed of the pipes, the filter and so on. In order to prevent such absorption as much as possible, the whole of the sample-collecting system is heated, or the pipes are made of a material having small absorption ability.
- If the amount of flue gas flowing in the pipes is made large, the absorption can be reduced. That is, the retention time of the flue gas in the pipes is shortened as much as possible.
- Considering that a
mass spectrometer 12, acomputer 9, ascreen 10, and meters such as a flow controller are near the flue gas duct and outside rooms, they are set up inside a monitor rack highly sealed up, wherein the temperature thereof is controlled to some extent (about 10-50°C) with an air-conditioner 18. Data obtained from measurement with themass spectrometer 12 are transferred to a combustion control device or the like through signal lines and control lines. In this case, themass spectrometer 12 may be made in such a manner that results on a CRT or a printer can be observed through a peep hole by thespectrometer 12 itself. By setting up the internalstandard vaporizer 30, it is possible to subject the monitor section to a periodic inspection through avalve 16 for exchanging internal standards, and a pipe 8 for the internal standard. That is, the internal standard gas is introduced instead of flue gas, and then it is checked whether or not the amount of ions originating from the observed internal standard is more than a certain constant value. When the observed ion intensity is more than a constant value, maintenance is required. In the present invention, it is important that the internal standard is supplied at a constant concentration. Thus, it is preferable to check whether or not the concentration of the internal standard which is being added changes by GS/MS or the like. - Referring to
FIG. 5 , themass spectrometer 12 will be specifically described. When generated ions are analyzed, various kinds of mass spectrometers can be used. A case in which an ion trap mass spectrometer of ion accumulating type is used will be described hereinafter. The same description can be applied to cases in which other mass spectrometers (a quadruple mass spectrometer wherein mass separation is performed using the same high frequency electrical field, or a magnetic field type mass spectrometer using mass dispersion) are used. - Negative ions generated in the ion source of the present invention pass through a first ion taking-in pore 37 (diameter: about 0.3 mm, length: about 20 mm) made in a first flange-
type electrode 36, a second ion taking-in pore 38 (diameter: about 0.6 mm, length: about 0.3 mm), and a third ion taking-in pore 39 (diameter: about 0.3 mm, length: about 0.3 mm) , each of which is heated to 100-300°C with a heater (not illustrated). Voltage can be applied between the first ion taking-in pore 37 and the second ion taking-ion pore 38, and between the second ion taking-in pore 38 and the third ion taking-ion pore 39. Thus, ion transmission ratio is improved and simultaneously cluster ions generated by adiabatic expansion are cleaved by collision with remaining molecules. In this way, ions of the sample molecules are generated. A differential pumping portion is usually evacuated with a roughing vacuum pump such as a rotary pump, a scroll pump, or a mechanical booster pump. This portion may also be evacuated with a turbo molecule pump.FIG. 5 illustrates a case in which a scroll pump 27 (pumping capacity: about 900 L/min.) and a turbo molecule pump 40 (pumping capacity: about 200-300 L/min.) are used for evacuations of the differential pumping portion and the mass spectrometer, respectively. Thescroll pump 27 is also used as a pump for evacuating the back pressure side of theturbo molecule pump 40. The pressure between the second ion taking-in pore 38 and the third ion taking-ion pore 39 is from 0.1 to 10 Torr. A differential pumping portion using two pores (the first ion taking-in pore 37 and the third ion taking-ion pore 39) may be used. However, the flow rate of the flowing-in gas becomes larger than the above-mentioned case; therefore, a manner as follows is necessary: increase in the pumping speed of the used vacuum pump, separation of the pores, or the like. In this case, application of voltage between the two pores is also important. - The generated ions pass through the third ion taking-in
pore 39, and subsequently the ions are converged into aconvergent lens 41. As thisconvergent lens 41, a Einzel lens composed of three electrodes, or the like lens is used. The ions pass through anelectrode 42 with a slit. The ions which have passed through the third ion taking-inpore 39 are converged into this slit through theconvergent lens 41. Neutral particles or the like particles which are not converged collide with the vicinity of the slit so that these particles do not go easily toward the mass spectrometer. The ions which have passed through theelectrode 42 with the slit are deflected and converged with a doublecylindrical type lens 45 composed of an innercylindrical electrode 43 and an outercylindrical electrode 44. The doublecylindrical type lens 45 causes deflection and convergence, using an electrical field of the outer cylindrical electrode which is spread out from the opening of the inner electrode. The details thereof is disclosed inJP-A-7-85834 - The ions which have passed through the double
cylindrical type lens 45 are introduced into an ion trap mass spectrometer. The ion trap is composed of agate electrode 46,end cap electrodes ring electrode 48, shieldingelectrodes rings lens 51. Thegate electrode 46 has a function of preventing introduction of ions from the outside to the mass spectrometer when the ions trapped in the mass spectrometer are taken outside the mass spectrometer. The ions introduced into the ion trap mass spectrometer through the ion taking-inpore 39 collide with buffer gas, such as helium, introduced into the ion trap mass spectrometer so that the orbit of the ions becomes small. Thereafter, each of the ions having different mass numbers is discharged from the ion taking-in pore outside the ion trap mass spectrometer by scanning the high frequency voltage applied between theend cap electrodes ring electrode 48. Each of the ions passes through the ion taking-inlens 51 and is then detected with anion detector 52. - The pressure in the ion trap mass spectrometer when the buffer gas is introduced is from about 10-3 to 10-4 Torr. The ion trap mass spectrometer is controlled by a mass spectrometer control unit. The ion trap mass spectrometer has a property of trapping ions. Thus, one of good points of the ion trap mass spectrometer is that even a small concentration of the sample can be detected if the time for trapping ions is extended. Accordingly, even when the concentration of the sample is small, ions can be concentrated high times in the ion trap mass spectrometer. Thus, pretreatment of the sample, such as concentration thereof, can be made very simple.
- In the case that as the sample gas supplied from the sample line a stable isotope is used, the reduction ratio based on reaction or absorption in the
filter 2 or the pipes in the middle, and the ionization efficiency and detection efficiency in themass spectrometer 12 are equal. Therefore, such a case is very effective for systems in which absorption onto the pipes is greatly caused. However, the stable isotope is usually expensive. Thus, a problem about costs may arise. - On the other hand, in the case that the reduction ratio on the filter or the pipes is small, or the ratio can be regarded as substantially constant during the measurement, there is known a method of adding an internal standard just before the
ion source 11 as illustrated inFIG. 6 . It is advisable to select, as the internal standard, a substance having substantially the same ionization step and ionization efficiency as a target trace gas, and causing the generation of ion having different mass numbers. - In the piping arrangements illustrated in
FIGs. 1 and6 , the method for introducing flue gas from theflue gas duct 7 to the taking-in ion source is a method of absorbing the flue gas with thepump 28 arranged at the downstream side of the ion source. However, in the case that gas discharged from the pump does not hinder the measurement (for example, mass-number overlap is not caused, and sensitivity is not lowered) and a target trace gas does not adhere to the inside of the pump so that ion strength of the generated ions is not lowered, it is allowable to set up thepump 28 between the ion source and the flue gas duct, and pump out and introduce the flue gas from the flue gas duct to the ion source, as illustrated as a further embodiment inFIG. 7 . In this case, the pressure in the ion source is higher than in the above-mentioned case in which the flue gas is absorbed into the ion source. Therefore, the ion strength of the generated ions becomes large. It is advisable that an oilless pump having high-temperature resistance is used as thepump 28 to prevent absorption and degassing. - In the case that the concentration of impurities is high so that the sensitivity to a target trace gas drops remarkably and measurement accuracy deteriorates, air whose flow rate is controlled is introduced into the inlet of the ion source to dilute flue gas, as illustrated as a still further embodiment in
FIG. 8 . In this way, the effect of the impurities can be weakened. In this case, the target trace gas is also diluted. Therefore, it is necessary to mind that the flue gas is diluted not to exceed the detection limit of the device. - The following will describe the sequence of the measurement of the present invention. In the case that flue gas is subjected to gas analysis, ions of impurities (chemical noises) having the same mass number as a target trace gas may be contained in the flue gas. This causes an accidental error in quantitative analysis. That is, the measured value becomes larger than a true value. In this case, multi-step mass spectrometry (MS/MS) is used to separate the ions of the impurities from the ions of the target trace gas. If MS/MS is used in the case that the target trace gas is dichlorophenol, the target trace gas is decomposed to ions of dichlorophenol-decomposition products and ions of impurities. Thus, the molecular ion quantity originating from dichlorophenol can be measured. In the case of trichlorophenol or tetrachlorophenol, it cannot be decomposed. Therefore, ions of impurities are decomposed and them the strength of the remaining ions which have not been decomposed is measured to analyze the ion quantity of trichlorophenol or tetrachlorophenol.
- Referring to
FIG. 10 , one example of the sequence of the measurement of the present invention will be described. A measurement is started (step 601). Thereafter, MS spectra or MS/MS spectra are analyzed (step 602) to measure the ion strength of a target trace gas (step 603) and measure the ion strength of an internal standard (step 604). In order to check whether theion source 11 and themass spectrometer 12 work normally, it is checked whether the ion strength of the internal standard drops or rises extremely (step 605). In the case that it is abnormal, a warning is issued (step 606), and a necessary maintenance is done (step 607). In the case that it is normal, the ion strength ratio of the target trace gas to the internal standard is measured (step 608) when the internal standard is an isotope of the target trace gas. Thereafter, the ratio is multiplied by the concentration of the internal standard that was beforehand measured, to calculate the concentration of the target trace gas (step 609). In the other cases, the concentration of the target trace gas is calculated from a correlation between the target trace gas and the internal standard which was beforehand obtained (step 609). After the calculation of the concentration and display thereof, the following measurement will be started (step 610). - In the case that the present device is used as a monitor for measuring flue gas, the present device self-diagnoses whether an abnormality breaks out in measured signals, background, or the temperature, pressure or flow rate of the flue gas, or the like during online measurement or, if necessary, one time per day. Thereafter, necessary steps such as automatic washing, automatic calibration, issue of the warning "the device is abnormal", or stop of the device are taken.
- In order to know a sudden abnormal state, another process is necessary.
FIG. 11 shows one example of the sequence of the measurement in this case. According to this sequence, it can be checked whether a caused abnormality is routine or sudden. The sequence up to the measurement of the ion strength of a target trace gas (step 603) and the measurement of the ion strength of an internal standard (step 604) is the same as shown inFIG. 10 . The ion strength of the internal standard is checked (step 605). Moreover, the vacuum degree of the mass spectrometer, the values of the respective flow meters, the temperature of the piping, the temperature inside the monitor, the current of corona discharge, and the strength of all ions are checked (steps - When any abnormality does not arise, dioxin congeners, polychlorinated benzene congeners and polychlorinated phenol congeners are subjected to sequential measurements (step 620) . The value of each of these components is compared with the average value (step 621) . If the resultant deviation is larger than a given value, a warning is issued outside (step 622) and then an automatic diagnoses is made (step 623). Calibration is made (step 624), and then the next measurement is started (step 625). When the outbreak of an abnormality is recognized by the automatic diagnosis, a high-rank warning is issued to stop the monitor device (step 626). As values for issuing the warning, high and low values may be set up. When the measured value exceeds the low value, only a lamp is turned on for caution. When the measured value rises further and exceeds the high value, the lump is turned on and in addition thereto a buzzer is sounded as an alarm. Such a monitoring system is used not only for the check of the concentrations of the components in the flue gas which is being measured, but also for checks of the ion strength of the internal standard , the vacuum degree of the mass spectrometer, the values of the respective flow meters, the temperature of the piping, the temperature inside the monitor, the current of corona discharge, and the strength of all ions (
steps - If mass spectra are constantly obtained and recorded not only upon the outbreak of an abnormality but also during the monitoring by integrating a mass spectrum scanning step into a cycle for monitoring dioxin congeners or the like, the state of the incineration plant can be grasped at all times. Ions of water make their appearance as a large peak in a mass spectrum, for example, if a great deal of watery rubbish is burned. Ions of chlorine make their appearance as a large peak in a mass spectrum if a great deal of vinyl chloride is burned. If observation of a mass spectrum is periodically taken in during the monitoring of trace components and this mass spectrum is monitored, the state of an abnormality can be grasped. The measured mass spectrum is compared with an average mass spectrum measured on an earlier occasion (comparative mass spectrum). If a new mass peak makes its appearance or a large mass peak disappears, it is acknowledged that an abnormality breaks out. That is, the strengths of the same peaks of m/z (the ratio of mass to the number of charges) on two mass spectra for comparison are subjected to subtraction. If no peaks are present on the mass spectra, the strength is regarded as zero. If a large peak makes its appearance on the subtraction spectrum, this is based on a component which makes its appearance suddenly on the flue gas. Therefore, a warning is issued outside to inform appearance of an abnormal component.
- The measured data are processed in a data processing unit. The data are filed and recorded together with set values of combustion conditions, measured values and so on. To sites where a value over a standard value is exhibited, color such as red or pink is displayed. In this way, a warning is issued to a watchman. The data are output to a printer or a CRT if necessary. The data are sent to a combustion monitor/control system.
- In the case that dioxin congeners, polychlorinated phenol congeners or chlorobenezene congeners in flue gas are measured, it is effective that negative corona discharge is used to detect the target trace gas as a negative ion. As an index compound indicating the combustion state of an incineration furnace, chain-form hydrocarbons are also used. In this case, it is effective to use positive corona discharge in order to detect the hydrocarbons. When the ion strength ratios between the detected hydrocarbons are measured and the hydrocarbons having a large mass number are detected at a high level, it can be considered that the state of combustion is imperfect. Therefore, if any one of positive discharge and negative discharge is changed to the other at regular intervals (for example, at intervals of several minutes) to change any one of measurement of the hydrocarbons and measurement of dioxin congeners, polychlorinated phenol congeners or polychlorinated benzene congeners to the other, the state of combustion in the incineration furnace can be more specifically grasped.
- The following will describe a specific method for changing any one of positive (+) and negative (-) discharges to the other in the ion source.
FIG. 12 illustrates one example of a mode of taking in positive and negative ions. - As illustrated in
FIG. 12 , in synchronization with amplitudes (101, 102, 103) of high frequency waves applied to the ring electrode [see (a)], the following are changed: ionization modes (401, 402) of the ion source[see (d)]; ion transmission modes (301, 302) of the ion optics [see (c)]; and ion detection modes (501, 502) of the detector [see (e)] . About the voltage applied to the gate electrode [see (b)], anion transmission interval 201 and anion shielding interval 202 are alternatively set up. The polarity of the applied voltage is reversed dependently on the ionization mode. - As described above, the positive ion- and negative ion-analyzing modes is alternatively used. In this way, data on positive ions and negative ions can be obtained by one measurement operation. To reverse the polarity of ions to be measured, the polarity of voltages applied to the ion optics (composed of the ion source, the ion orbit converging lens and so on) , the detector and so on must be reversed. For example, in the above-mentioned counter flow type atmospheric pressure chemical ion source developed by the present Applicant, a high voltage is applied to its needle electrode and opposite electrode. In a positive ion measuring mode, a positive voltage is applied to the needle electrode. In a negative ion measuring mode, a negative voltage is applied to the needle electrode. In the same way, the polarity of voltages applied to the ion optics and the detector must be reversed dependently on the polarity of ions to be measured.
- About these parts where polarity should be reversed, especial attention should be paid to the change of the ionization mode of the ion source. In the positive ion measuring mode, a positive voltage of several kV is applied to the needle electrode, and in the negative ion measuring mode, a negative voltage of several kV is applied thereto. Immediately after the polarity of the voltage applied to the needle electrode is reversed, the generation of ions becomes unstable. Careful investigations have not been made on the time from the reversion of the polarity to the stabilization of the generation of ions. If the time is presumed from experience up to now, the time is about 0.05 second. Therefore, if the ionization mode is changed in a remaining
ion removing interval 103 after a series of operations for obtaining a mass spectrum, that is, anion trapping interval 102 and amass separation interval 102, a waiting time for some time is necessary. To reduce this waiting time, it is advisable to change the mode of the ion source in themass separation interval 102, as shown inFIG. 12 . The change of the ion optics and the reversion of the polarity of the gate voltage are preferably synchronized with the change of the ionization mode of the ion source. However, the ionization mode of the ion source is not immediately changed. Preferably, therefore, an iongeneration stopping interval 403 is set up when the ionization mode of the ion source is changed, and in this iongeneration stopping interval 403 the ion optics are changed and the polarity of the gate voltage is reversed. It is advisable that the voltage at the detector is reversed in theion trapping interval 101 or in the remainingion removing interval 103. This is because ions are detected in themass separation interval 102. As illustrated inFIG. 12 , a positiveion detecting interval 501 and a negativeion detection interval 502 are alternatively arranged. - As described above, the mode of the ion source can be changed and the polarity of the gate voltage or the ion optics can be reversed in the
mass separation interval 102 or the remainingion removing interval 103. The change and reversion are desirably synchronized. The mode of the detector can be changed in the ion trapping interval or the remainingion removing interval 103. The point that attention should be paid about the whole of the device including pipes of the sample collection system is that flue gas is caused to flow into the atmospheric ion source, the pipes and so on at all times during measurement to keep the exchange of the gas and materials absorbed on the walls into an equilibrium state and lose absorption of trace components on the walls. When the flow of flue gas is stopped for the stop of the incineration furnace, the maintenance thereof or the exchange of filters in the sampling system, high-purity nitrogen gas or the like is caused to flow automatically to prevent stains on the atmospheric ion source and the pipes. Purge gas such as high-purity gas is caused to flow dependently on stains on the atmospheric ion source and the pipes, for example, one time per week. When the sending-out of the internal standard from the internalstandard vaporizer 30 is stopped in the monitoring device illustrated inFIG. 1 and so on, nitrogen gas sent from a nitrogen gas cylinder (not illustrated) flows through the valves to the pipes, and the atmosphericchemical ion source 11, so as to wash them. By causing nitrogen gas to flow at the time of start or stop of the device or flow periodically in the middle of measurement, the device can be cleaned up. The high-purity nitrogen gas may be introduced into thesample collecting pipe 4, separately from the internal standard sample introducing system. In the case that pure nitrogen is introduced into the introducing system and subsequently flue gas is introduced to start measurement, the flue gas is caused to flow continuously for 30 minutes or more to prevent absorption on the walls of the pipes. -
FIG. 13 shows one example of quantitative analysis wherein a target trace gas is trichlorophenol and an internal standard is a deuterium hydrogen substituted isotope of trichlorophenol (an isotope obtained by substituting two hydrogen on the benzene ring with deuterium hydrogens, the mass number of which increases by 2). - Trichlorophenol, which is to be measured, has 3 chlorine atoms. An isotope of chlorine having a mass number of 35, and an isotope thereof having a mass number of 37 are present at a ratio of 3 : 1. Therefore, a spectrum wherein at sites having mass numbers of 195, 197, 199 and 201, relative strengths are 27, 27, 9 and 1, respectively, is detected. On the other hand, peaks of the isotope whose mass number increases by 2 are detected at sites having mass numbers of 197, 199, 201 and 203. The relative strengths thereof are the same as above. Thus, the peaks overlap at the sites of the mass number of 197, 199 and 201.
- In other words, each of peaks actually measured is detected as the sum of the strength of the target trace gas and that of the internal standard (the isotope) . The concentration of trichlorophenol and the ratio a of the ion strengths thereof would be equal to the concentration of the isotope and the ratio a of the strengths thereof. When the concentration of the trichlorophenol to be measured is represented by (unknown) Cx and the concentration of the isotope is represented by (known) Cy, the ion strength (In) at each of the mass numbers can be represented by the following equation:

wherein β is the ratio of peaks at the site having each of the mass numbers. - Since unknown numbers are two numbers, i.e., Cx and α, two mass numbers about which chemical noises are less and sensitivity is high are selected from the 4 peaks and then a simultaneous linear equation is solved. Thus, Cx can be obtained. In the case that an isotope of dichlorophenol or tetrachlorophenol is used as an internal standard, an calibration can be made in the same way.
- In the case that a 13 substituted isotope of trichlorophenol (an isotope obtained by substituting Cs (i.e., carbons) on the benzene ring with 13Cs, the mass number of which increases by 6) is used, only its peak at the mass number of 201 overlaps with a peak of polychlorinated phenol in flue gas. About the isotope, therefore, the peak at the mass number of 203 is analyzed, and about trichlorophenol in the flue gas the peak at the mass number of 195 or 197 is analyzed. They are compared, and an calibration can be made. When the mass number of the isotope for the calibration overlaps with the mass number of each of the components contained in the flue gas, an accidental error is generated at the time of the calibration. Thus, another isotope should be used. No problems arise in the case that they can be separated by MS/MS.
- As described, according to the present invention, as an calibration means for online monitoring using mass spectrometry, a substance having a similar ionization efficiency, for example, a rare isotope is added at a constant concentration as an internal standard. The ion quantity thereof is measured. In this way, the concentration of a target trace gas in gas containing impurities can be calibrated while being continuously calibrated. Thus, high-accuracy analysis can be made.
- As a result, dioxin and related compounds contained in combustion flue gas resulting from incineration of non-industrial waste and industrial waste, exhaust gas from metal refining processes, exhaust gas from cars, or the atmosphere are detected. In this way, the concentration of the dioxin congeners and the related compounds such as dioxin precursors can be measured at a high accuracy and at a real time. Furthermore, monitored results can be used for optimal control of combustion. As a secondary result, mechanisms such as complex valves become unnecessary since an internal standard gas for calibration is caused to flow continuously. Thus, reduction in costs can be expected.
Claims (3)
- A monitoring device for analyzing a sample, comprising:a sampling nozzle (6) adapted to be disposed in a gas duct for sampling a gas which includes a target material gas to be analyzed;a filter (2) for removing small particles from the sampled gas;a sample introduction tube (4) connecting said sampling nozzle (6) and said filter (2);an internal standard vaporizer (30) including a container (53) for holding an internal standard gas having a similar chemical property and substantially the same ionization efficiency as the target material gas, a heat controller for controlling the temperature of the vaporizer (30) and a gas flow controller (31) for controlling the gas flow through the vaporizer (30) to permit continuously adding the internal standard gas at a known concentration to the target material gas in said sample introduction tube (4);a chemical ionisation source (11) for ionizing the target material gas in the sampled gas and the internal standard gas, at the same time;a mass spectrometer (12) for subjecting ions generated in the chemical ionisation source (11) from the target material gas and the internal standard gas to mass spectrometry; anda data processing unit (9) for processing results of the mass spectrometry, the data processing unit (9) being adapted to continuously analyze the target material gas quantitatively in real time by calculating the ratio of the ion signal intensity of the target material gas to that of the internal standard gas, for correcting errors resulting from effects of impurities, from absorption of the target material gas to an inner wall of piping which the target material gas passes, and from desorption of the target material gas from the piping wall.
- The device of claim 1, further comprising means for controlling the temperature of the internal standard vaporizer (30) to constant.
- The device of claim 1, wherein the internal standard vaporizer (30) is adapted to provide a source of gas which results from a replacement of at least part of the elements constituting the target material gas by a stable and rare isotope thereof.
Applications Claiming Priority (2)
| Application Number | Priority Date | Filing Date | Title |
|---|---|---|---|
| JP32927799A JP4105348B2 (en) | 1999-11-19 | 1999-11-19 | Sample analysis monitor device and combustion control system using the same |
| JP32927799 | 1999-11-19 |
Publications (2)
| Publication Number | Publication Date |
|---|---|
| EP1102004A1 EP1102004A1 (en) | 2001-05-23 |
| EP1102004B1 true EP1102004B1 (en) | 2012-05-23 |
Family
ID=18219663
Family Applications (1)
| Application Number | Title | Priority Date | Filing Date |
|---|---|---|---|
| EP00124831A Expired - Lifetime EP1102004B1 (en) | 1999-11-19 | 2000-11-14 | Sample analyzing monitor and combustion control system using the same |
Country Status (3)
| Country | Link |
|---|---|
| US (1) | US6580067B1 (en) |
| EP (1) | EP1102004B1 (en) |
| JP (1) | JP4105348B2 (en) |
Families Citing this family (31)
| Publication number | Priority date | Publication date | Assignee | Title |
|---|---|---|---|---|
| US20040036018A1 (en) * | 2001-06-06 | 2004-02-26 | Yoshihiro Deguchi | Device and method for detecting trace amounts of organic components |
| JP3477457B2 (en) | 2001-06-06 | 2003-12-10 | 三菱重工業株式会社 | Organic halide decomposition processing system |
| US6879936B2 (en) * | 2002-01-09 | 2005-04-12 | Fisher Controls International Llc | Diagnostic apparatus and methods for a chemical detection system |
| US6649909B2 (en) * | 2002-02-20 | 2003-11-18 | Agilent Technologies, Inc. | Internal introduction of lock masses in mass spectrometer systems |
| JP3787116B2 (en) | 2002-11-06 | 2006-06-21 | 株式会社日立製作所 | How to detect chemical agents |
| DE10301421A1 (en) * | 2003-01-16 | 2004-07-29 | Bayer Ag | Process analysis systems with automatic liquid sample preparation and connection to process control systems |
| JP4603786B2 (en) * | 2003-09-22 | 2010-12-22 | 株式会社日立ハイテクノロジーズ | Chemical substance monitoring device and chemical substance monitoring method |
| US8685339B2 (en) | 2003-11-21 | 2014-04-01 | Pin/Nip, Inc. | Field and storage chemical test kit |
| US20050112775A1 (en) * | 2003-11-21 | 2005-05-26 | Forsythe John M. | Field and storage chemical test method |
| US7009176B2 (en) * | 2004-03-08 | 2006-03-07 | Thermo Finnigan Llc | Titanium ion transfer components for use in mass spectrometry |
| JP4407337B2 (en) * | 2004-03-25 | 2010-02-03 | 株式会社島津製作所 | Chromatograph mass spectrometer |
| JP2006322899A (en) * | 2005-05-20 | 2006-11-30 | Hitachi Ltd | Gas monitoring device |
| JP2008139130A (en) * | 2006-12-01 | 2008-06-19 | Hitachi Ltd | Real-time analysis apparatus and method |
| FR2910966B1 (en) * | 2006-12-28 | 2009-04-17 | Commissariat Energie Atomique | COUPLED MEASURING DEVICE FOR GLOBAL AND CONTINUOUS TRACKING OF TARESTS PRESENT IN A GASEOUS FLOW |
| FR2910967B1 (en) | 2006-12-28 | 2009-04-03 | Commissariat Energie Atomique | DEVICE AND METHOD FOR CONTINUOUSLY MEASURING TARGET CONCENTRATION IN A GASEOUS FLOW |
| JP5227556B2 (en) * | 2007-09-06 | 2013-07-03 | 株式会社日立製作所 | Analysis equipment |
| WO2010100816A1 (en) * | 2009-03-05 | 2010-09-10 | 株式会社 日立ハイテクノロジーズ | Analysis apparatus |
| JP4920067B2 (en) * | 2009-09-24 | 2012-04-18 | 株式会社日立ハイテクノロジーズ | Chemical substance monitoring device and chemical substance monitoring method |
| JP5413590B2 (en) * | 2009-11-11 | 2014-02-12 | 株式会社島津製作所 | Liquid chromatograph mass spectrometer |
| JP5657904B2 (en) * | 2010-03-26 | 2015-01-21 | 株式会社日立ハイテクソリューションズ | Gas analyzer and gas analysis method |
| WO2012048308A2 (en) * | 2010-10-08 | 2012-04-12 | Photon Machines, Inc. | Spark emission particle detector |
| JP2011081017A (en) * | 2011-01-24 | 2011-04-21 | Hitachi High-Technologies Corp | Chemical substance monitor device and chemical substance monitoring method |
| JP5697489B2 (en) * | 2011-03-02 | 2015-04-08 | 大陽日酸株式会社 | Method and apparatus for analyzing oxygen concentration |
| JP5675442B2 (en) | 2011-03-04 | 2015-02-25 | 株式会社日立ハイテクノロジーズ | Mass spectrometry method and mass spectrometer |
| US11002684B2 (en) | 2012-10-25 | 2021-05-11 | Agilent Technologies, Inc. | Chemiluminescent detector having coating to reduce excited species adsorption |
| US9448177B2 (en) | 2012-10-25 | 2016-09-20 | Agilent Technologies, Inc. | Flame photometric detector |
| JP6505268B1 (en) * | 2018-01-11 | 2019-04-24 | 株式会社日立ハイテクサイエンス | Mass spectrometer and mass spectrometry method |
| CN110346187A (en) * | 2019-06-26 | 2019-10-18 | 浙江中通检测科技有限公司 | A kind of dioxin detection sampling apparatus |
| HUP1900246A1 (en) * | 2019-07-05 | 2021-01-28 | Univ Szegedi | Method and equipment for monitoring a spark particle generator |
| EP4266041A4 (en) * | 2020-12-17 | 2024-11-13 | Hitachi High-Tech Corporation | Method for controlling mass spectrometer |
| FR3162280A1 (en) * | 2024-05-15 | 2025-11-21 | Totalenergies Onetech | System for determining the composition of an industrial gas circulating in an installation, installation and associated measurement method |
Family Cites Families (16)
| Publication number | Priority date | Publication date | Assignee | Title |
|---|---|---|---|---|
| US3624710A (en) * | 1969-07-03 | 1971-11-30 | Monsanto Co | System for analysis |
| US4234549A (en) * | 1979-06-29 | 1980-11-18 | Union Carbide Corporation | Novel combustion process for an organic substrate |
| JPH04161849A (en) | 1990-10-25 | 1992-06-05 | Kubota Corp | Method for measuring trace amounts of organic substances in incinerator exhaust gas |
| US5101105A (en) * | 1990-11-02 | 1992-03-31 | Univeristy Of Maryland, Baltimore County | Neutralization/chemical reionization tandem mass spectrometry method and apparatus therefor |
| JPH05312796A (en) | 1992-05-14 | 1993-11-22 | Kubota Corp | Semi-continuous measuring and monitoring device for chlorobenzenes as an alternative index for dioxins in exhaust gas |
| JP3367719B2 (en) | 1993-09-20 | 2003-01-20 | 株式会社日立製作所 | Mass spectrometer and electrostatic lens |
| JP2981093B2 (en) * | 1993-11-09 | 1999-11-22 | 株式会社日立製作所 | Atmospheric pressure ionization mass spectrometer |
| JPH07155731A (en) | 1993-12-09 | 1995-06-20 | Mitsui Eng & Shipbuild Co Ltd | Thermal dechlorination treatment method for dust collection ash |
| RU2091789C1 (en) * | 1994-01-28 | 1997-09-27 | Войсковая часть 61469 | Internal-standard composition for quantitative determination of polychlorinated dibenzo-n-dioxins |
| JPH0915229A (en) | 1995-04-26 | 1997-01-17 | Nkk Corp | Method for quantifying dioxins in exhaust gas |
| JPH0955185A (en) * | 1995-08-11 | 1997-02-25 | Furontetsuku:Kk | Mass filter type gas analyzer with calibration gas system and its operating method |
| EP1637878A1 (en) * | 1995-12-23 | 2006-03-22 | The Queens University of Belfast | Gas inlet system |
| JPH09243601A (en) * | 1996-03-07 | 1997-09-19 | Nkk Corp | Measuring device for trace organic compounds in exhaust gas |
| US5703360A (en) * | 1996-08-30 | 1997-12-30 | Hewlett-Packard Company | Automated calibrant system for use in a liquid separation/mass spectrometry apparatus |
| CA2299439C (en) * | 1997-09-12 | 2007-08-14 | Bruce A. Andrien | Multiple sample introduction mass spectrometry |
| JP3876554B2 (en) * | 1998-11-25 | 2007-01-31 | 株式会社日立製作所 | Method and apparatus for monitoring chemical substance and combustion furnace using the same |
-
1999
- 1999-11-19 JP JP32927799A patent/JP4105348B2/en not_active Expired - Fee Related
-
2000
- 2000-11-14 EP EP00124831A patent/EP1102004B1/en not_active Expired - Lifetime
- 2000-11-15 US US09/712,132 patent/US6580067B1/en not_active Expired - Lifetime
Non-Patent Citations (1)
| Title |
|---|
| "Internal Standard", 20100101, 1 January 2010 (2010-01-01), pages 1 - 2, XP007917537, Retrieved from the Internet <URL:http://en.wikipedia.org/w/index.php?oldid=408476716> * |
Also Published As
| Publication number | Publication date |
|---|---|
| JP2001147216A (en) | 2001-05-29 |
| US6580067B1 (en) | 2003-06-17 |
| JP4105348B2 (en) | 2008-06-25 |
| EP1102004A1 (en) | 2001-05-23 |
Similar Documents
| Publication | Publication Date | Title |
|---|---|---|
| EP1102004B1 (en) | Sample analyzing monitor and combustion control system using the same | |
| US6723286B2 (en) | Chemical monitoring method and apparatus, and incinerator | |
| JP4550802B2 (en) | Obstacle substance detection method and obstacle substance detection system | |
| EP1093151B1 (en) | Ion source, mass spectrometer, mass spectrometry, and monitoring system | |
| US6677582B2 (en) | Ion source and mass spectrometer | |
| Bérail et al. | Determination of total Hg isotopic composition at ultra-trace levels by on line cold vapor generation and dual gold-amalgamation coupled to MC-ICP-MS | |
| US7663098B2 (en) | Gas monitoring apparatus and gas monitoring method | |
| Sortino et al. | A new method for sampling fumarolic gases: Analysis of major, minor and metallic trace elements with ammonia solutions | |
| JP2001351569A (en) | Online monitoring device for gas measurement | |
| JP4054493B2 (en) | Ion source | |
| Bettinelli et al. | Determination of trace elements in power plant emissions by inductively coupled plasma mass spectrometry: comparison with other spectrometric techniques | |
| JP3663975B2 (en) | Exhaust gas monitoring device | |
| JP4603786B2 (en) | Chemical substance monitoring device and chemical substance monitoring method | |
| JP2002189020A (en) | Exhaust gas measurement device | |
| Hassaine et al. | Continuous emission monitoring of metals in flue gases by ICP-OES: role of calibration and sample gas | |
| JP3654046B2 (en) | Exhaust gas monitoring system | |
| JP2002189019A (en) | Exhaust gas measurement and monitoring system | |
| JP4235028B2 (en) | Analysis method of air pollutants | |
| Tao et al. | On-line mercury speciation in exhaust gas by using solid-phase chemical reduction | |
| JP4291398B2 (en) | Mass spectrometer and dangerous substance detection device | |
| JP4062341B2 (en) | Ionization mass spectrometer, analysis method, and measurement system using the same | |
| Ren et al. | Real-time monitoring of monocyclic non-chlorinated aromatic compounds in incineration flue gas by photoionization time-of-flight mass spectrometer for dioxin prediction | |
| JPH0674940A (en) | Atmospheric pressure ionization mass spectrometry method and mass spectrometer | |
| JP4197676B2 (en) | Monitoring system | |
| JP2001208333A (en) | Apparatus and method for controlling emission of dioxins in waste incinerator |
Legal Events
| Date | Code | Title | Description |
|---|---|---|---|
| PUAI | Public reference made under article 153(3) epc to a published international application that has entered the european phase |
Free format text: ORIGINAL CODE: 0009012 |
|
| AK | Designated contracting states |
Kind code of ref document: A1 Designated state(s): DE FR GB |
|
| AX | Request for extension of the european patent |
Free format text: AL;LT;LV;MK;RO;SI |
|
| 17P | Request for examination filed |
Effective date: 20011122 |
|
| AKX | Designation fees paid |
Free format text: DE FR GB |
|
| 17Q | First examination report despatched |
Effective date: 20040517 |
|
| 17Q | First examination report despatched |
Effective date: 20040517 |
|
| GRAP | Despatch of communication of intention to grant a patent |
Free format text: ORIGINAL CODE: EPIDOSNIGR1 |
|
| RIC1 | Information provided on ipc code assigned before grant |
Ipc: F23G 5/50 20060101AFI20110718BHEP Ipc: H01J 49/04 20060101ALI20110718BHEP |
|
| GRAS | Grant fee paid |
Free format text: ORIGINAL CODE: EPIDOSNIGR3 |
|
| GRAA | (expected) grant |
Free format text: ORIGINAL CODE: 0009210 |
|
| AK | Designated contracting states |
Kind code of ref document: B1 Designated state(s): DE FR GB |
|
| REG | Reference to a national code |
Ref country code: GB Ref legal event code: FG4D |
|
| REG | Reference to a national code |
Ref country code: DE Ref legal event code: R096 Ref document number: 60047193 Country of ref document: DE Effective date: 20120719 |
|
| PLBE | No opposition filed within time limit |
Free format text: ORIGINAL CODE: 0009261 |
|
| STAA | Information on the status of an ep patent application or granted ep patent |
Free format text: STATUS: NO OPPOSITION FILED WITHIN TIME LIMIT |
|
| 26N | No opposition filed |
Effective date: 20130226 |
|
| REG | Reference to a national code |
Ref country code: DE Ref legal event code: R097 Ref document number: 60047193 Country of ref document: DE Effective date: 20130226 |
|
| PGFP | Annual fee paid to national office [announced via postgrant information from national office to epo] |
Ref country code: GB Payment date: 20141112 Year of fee payment: 15 Ref country code: FR Payment date: 20141110 Year of fee payment: 15 Ref country code: DE Payment date: 20141111 Year of fee payment: 15 |
|
| REG | Reference to a national code |
Ref country code: DE Ref legal event code: R119 Ref document number: 60047193 Country of ref document: DE |
|
| GBPC | Gb: european patent ceased through non-payment of renewal fee |
Effective date: 20151114 |
|
| REG | Reference to a national code |
Ref country code: FR Ref legal event code: ST Effective date: 20160729 |
|
| PG25 | Lapsed in a contracting state [announced via postgrant information from national office to epo] |
Ref country code: DE Free format text: LAPSE BECAUSE OF NON-PAYMENT OF DUE FEES Effective date: 20160601 Ref country code: GB Free format text: LAPSE BECAUSE OF NON-PAYMENT OF DUE FEES Effective date: 20151114 |
|
| PG25 | Lapsed in a contracting state [announced via postgrant information from national office to epo] |
Ref country code: FR Free format text: LAPSE BECAUSE OF NON-PAYMENT OF DUE FEES Effective date: 20151130 |