EP0766202B1 - Image processing method and apparatus - Google Patents
Image processing method and apparatus Download PDFInfo
- Publication number
- EP0766202B1 EP0766202B1 EP96115572A EP96115572A EP0766202B1 EP 0766202 B1 EP0766202 B1 EP 0766202B1 EP 96115572 A EP96115572 A EP 96115572A EP 96115572 A EP96115572 A EP 96115572A EP 0766202 B1 EP0766202 B1 EP 0766202B1
- Authority
- EP
- European Patent Office
- Prior art keywords
- image signal
- image
- band
- filtering
- signal
- Prior art date
- Legal status (The legal status is an assumption and is not a legal conclusion. Google has not performed a legal analysis and makes no representation as to the accuracy of the status listed.)
- Expired - Lifetime
Links
- 238000003672 processing method Methods 0.000 title description 6
- 238000000034 method Methods 0.000 claims description 122
- 230000008569 process Effects 0.000 claims description 97
- 238000001914 filtration Methods 0.000 claims description 65
- 230000004044 response Effects 0.000 claims description 25
- 230000001131 transforming effect Effects 0.000 claims description 9
- 230000006870 function Effects 0.000 description 173
- 238000012545 processing Methods 0.000 description 77
- 101000920618 Homo sapiens Transcription and mRNA export factor ENY2 Proteins 0.000 description 45
- 102100031954 Transcription and mRNA export factor ENY2 Human genes 0.000 description 45
- 238000006243 chemical reaction Methods 0.000 description 40
- 230000000694 effects Effects 0.000 description 22
- 230000010354 integration Effects 0.000 description 19
- 238000010586 diagram Methods 0.000 description 12
- 230000005855 radiation Effects 0.000 description 10
- 210000000988 bone and bone Anatomy 0.000 description 7
- 210000002784 stomach Anatomy 0.000 description 7
- 239000002131 composite material Substances 0.000 description 6
- 238000012886 linear function Methods 0.000 description 5
- 230000008859 change Effects 0.000 description 4
- 238000003780 insertion Methods 0.000 description 4
- 230000037431 insertion Effects 0.000 description 4
- 210000000038 chest Anatomy 0.000 description 3
- 238000003745 diagnosis Methods 0.000 description 3
- 230000002452 interceptive effect Effects 0.000 description 3
- 210000004072 lung Anatomy 0.000 description 3
- 210000000481 breast Anatomy 0.000 description 2
- 239000002184 metal Substances 0.000 description 2
- 238000012986 modification Methods 0.000 description 2
- 230000004048 modification Effects 0.000 description 2
- NAWXUBYGYWOOIX-SFHVURJKSA-N (2s)-2-[[4-[2-(2,4-diaminoquinazolin-6-yl)ethyl]benzoyl]amino]-4-methylidenepentanedioic acid Chemical compound C1=CC2=NC(N)=NC(N)=C2C=C1CCC1=CC=C(C(=O)N[C@@H](CC(=C)C(O)=O)C(O)=O)C=C1 NAWXUBYGYWOOIX-SFHVURJKSA-N 0.000 description 1
- 230000003321 amplification Effects 0.000 description 1
- 230000015572 biosynthetic process Effects 0.000 description 1
- 238000007796 conventional method Methods 0.000 description 1
- 238000012937 correction Methods 0.000 description 1
- 230000007423 decrease Effects 0.000 description 1
- 238000003199 nucleic acid amplification method Methods 0.000 description 1
Images


Classifications
-
- G—PHYSICS
- G06—COMPUTING; CALCULATING OR COUNTING
- G06T—IMAGE DATA PROCESSING OR GENERATION, IN GENERAL
- G06T3/00—Geometric image transformation in the plane of the image
- G06T3/40—Scaling the whole image or part thereof
- G06T3/4007—Interpolation-based scaling, e.g. bilinear interpolation
-
- G—PHYSICS
- G06—COMPUTING; CALCULATING OR COUNTING
- G06T—IMAGE DATA PROCESSING OR GENERATION, IN GENERAL
- G06T3/00—Geometric image transformation in the plane of the image
- G06T3/40—Scaling the whole image or part thereof
- G06T3/403—Edge-driven scaling
-
- G—PHYSICS
- G06—COMPUTING; CALCULATING OR COUNTING
- G06T—IMAGE DATA PROCESSING OR GENERATION, IN GENERAL
- G06T5/00—Image enhancement or restoration
- G06T5/10—Image enhancement or restoration by non-spatial domain filtering
-
- G06T5/75—
-
- G—PHYSICS
- G06—COMPUTING; CALCULATING OR COUNTING
- G06V—IMAGE OR VIDEO RECOGNITION OR UNDERSTANDING
- G06V10/00—Arrangements for image or video recognition or understanding
- G06V10/20—Image preprocessing
- G06V10/30—Noise filtering
Definitions
- This invention relates to a method of and an apparatus for forming unsharp images, which have different frequency characteristics, from an image signal.
- an image is transformed into multi-resolution images by a Fourier transform, a wavelet transform, a sub-band transform, or the like, and the image signal representing the image is thereby decomposed into signals falling within a plurality of different frequency bands. Thereafter, of the decomposed signals, a signal falling within a desired frequency band is subjected to predetermined image processing.
- a method has been proposed, wherein an original image is transformed into multi-resolution images by utilizing an unsharp mask filter as in the technique using the wavelet transform, and image processing is then carried out on an unsharp image signal representing the unsharp image of each resolution.
- the proposed method is utilized in image processing of radiation images, and the like.
- a radiation image i.e., a tomographic image
- a tomographic image recording operation described in, for example, U.S.P. 4,581,535
- an image pattern of such a portion occurs as an interfering pattern (or an interfering shadow) in the direction, along which the recording medium moves, and at a center region which is to be used in the radiation image.
- An image processing method for eliminating the flow pattern is proposed in, for example, Japanese Unexamined Patent Publication No. 3(1991)-276265.
- the proposed image processing method low frequency components corresponding to the flow pattern are removed from the image signal, which represents the radiation image obtained from the tomographic image recording operation, and an image free of the flow pattern is thereby obtained from the resulting image signal.
- the unsharp image signal described above can also be utilized in the process for eliminating the flow pattern.
- the methods for carrying out the frequency emphasis processing are disclosed in, for example, U.S. Patent Nos. 4,315,318 and 4,317,179.
- an unsharp mask image signal hereinbelow often referred to as the unsharp image signal
- Sorg an original image signal
- the obtained difference value is multiplied by an emphasis coefficient ⁇ .
- the resulting product is then added to the original image signal Sorg.
- the frequency emphasis processing is represented by Formula (1) shown below.
- Sproc Sorg+ ⁇ (Sorg-Sus) wherein Sproc represents the signal obtained from the frequency emphasis processing, Sorg represents the original image signal, Sus represents the unsharp image signal, and ⁇ represents the emphasis coefficient.
- each of picture elements located at every second row and every second column in the array of picture elements constituting the image is taken as the middle picture element.
- the unsharp image signal Sus representing an unsharp image, which results from the unsharp mask processing and has a resolution lower than the resolution of the original image, can also be obtained by utilizing an unsharp mask filter, which has a predetermined size, and calculating the mean value or the weighted mean value of the values of the picture elements located within the unsharp mask filter.
- the applicant also proposed a method for compressing a dynamic range of an image, wherein an unsharp image signal is utilized, and the level of contrast of the parts of the image having a high or low image density or the level of contrast of the whole image is rendered low such that the difference between the highest image density and the lowest image density in the original image may become small, i.e. such that the dynamic range of the original image may become narrow.
- a method for compressing a dynamic range of an image is disclosed in, for example, U.S.P. 5,454,044.
- a processed image signal Sproc is obtained, which represents an image having a dynamic range narrower than the dynamic range of the original image.
- the differential coefficient of the function f(Sus) is set to be continuous, no artificial contour occurs in the image represented by the processed image signal Sproc.
- the range of image density of the image can be compressed such that the parts of the image covering a wide range of image density can be used and may have good image quality in the reproduced visible image, and the image quality of fine image structures at each of parts having various levels of image density may be kept good.
- the unsharp image signal is formed with the unsharp mask filter
- the unsharp image signal is affected by the image density of the edge in the image. Therefore, if the frequency emphasis processing, the dynamic range compressing process, or the flow pattern eliminating process described above is carried out by using the unsharp image signal, the problems will occur in that an artifact, such as overshoot, undershoot, or an artificial contour, occurs, and the image quality of the image obtained from the processing cannot be kept good.
- EP-A-0 610 604 an original image having a predetermined number of pixels and a predetermined resolution is processed so as to obtain reduced resolution versions of the original image. Processing of image data according to EP-A-0 610 604 is made so as to allow different display modes as well as reduced storage space.
- EP-A-0 610 604 teaches to subsample a lowpass filtered original image repeatedly to generate a structure of image of successively smaller dimensions.
- the lowpass images are expanded to the next higher level by upsampling and filtering to form a prediction image, which is subtracted from its corresponding lowpass image to generate difference images or residual images.
- the purpose of this encoding technique is to provide efficient storage of the data.
- EP-A-0 610 604 discloses different numbers of picture elements of a plurality of images. When the resolution level changes, so does the size of the image.
- the object of the present invention is to provide a method of forming unsharp images, in which the amount of operations for obtaining multi-resolution unsharp images is kept small and which is capable of being carried out with an apparatus having a small size.
- Another object of the present invention is to provide an apparatus for forming unsharp images.
- the present invention provides a method, of and an apparatus for forming unsharp images having the features of claims 1 and 2, respectively.
- the filtering process is carried out by using the filter having a predetermined size and with respect to each of the picture elements of the image, which are selected at predetermined intervals, and the first filtering-processed image is thereby obtained.
- the filtering process is then carried out on the first filtering-processed image, and the second filtering-processed image is thereby obtained.
- the filtering process is successively carried out on the respective filtering-processed images, which are obtained successively. Therefore, from the filtering process carried out successively, the plurality of the image are obtained, in which the high frequency components have been removed in steps from the original image.
- the filtering process is carried out with respect to each of the picture elements of the image, which are selected at predetermined intervals, and therefore the sizes of the filtering-processed images become small in steps from the size of the original image.
- the interpolating operation process is then carried out on each of the filtering-processed images, and the size of each of the filtering-processed images is thereby enlarged.
- the multi-resolution transformed images each of which is constituted of the same number of picture elements as that of the picture elements constituting the original image, i.e., each of which has the same size as that of the original image, can be obtained.
- the multi-resolution images are obtained by successively carrying out the filtering process by using the filter having the predetermined size. Therefore, it becomes unnecessary to use a plurality of filters. Accordingly, it becomes unnecessary to provide a memory for storing the information representing the plurality of filters, and the multi-resolution transforming apparatus can be kept small in size. Also, even if the size of the filter is not set to be large, the images of low resolution can be obtained in steps. Therefore, the problems can be prevented from occurring in that the amount of operations becomes large due to an increase in the size of the filter. As a result, the multi-resolution unsharp images can be obtained quickly.
- FIG. 1 is a block diagram showing the concept behind the multi-resolution transforming apparatus in accordance with the present invention.
- the multi-resolution transforming apparatus comprises a filtering process means 10 and an interpolating process means 11.
- the filtering process means 10 carries a filtering process on a received original image signal Sorg.
- the filtering process is carried out by using a filter having a predetermined size and with respect to each of picture elements selected at predetermined intervals, a first filtering-processed image being thereby obtained.
- the filtering process means 10 carries out the filtering process with the filter, which has the predetermined size, on the first filtering-processed image, a second filtering-processed image being thereby obtained.
- the filtering process means 10 successively carries out the filtering process on the respective filtering-processed images, which are thus obtained successively.
- the interpolating process means 11 carries out an interpolating operation process on the plurality of the filtering-processed images and thereby obtains multi-resolution unsharp image signals, each of which is constituted of the same number of picture elements as that of the picture elements constituting the original image, i.e. each of which has the same size as the size of the original image.
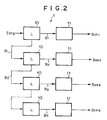
- FIG 2 is a block diagram showing how the plurality of the unsharp image signals are formed in the multi-resolution transforming apparatus shown in Figure 1.
- the digital original image signal Sorg representing the original image is subjected to the filtering process, which is carried out with a low pass filter L in the filtering process means 10.
- a low pass filter L by way of example, a 5 ⁇ 1 grid-like filter F shown in Figure 3 may be used.
- the filter F approximately corresponds to a one-dimensional Gaussian distribution.
- the Gaussian signal has good locality characteristics both in the frequency space and in the spatial domain and is therefore utilized as the filter F.
- the filtering process is carried out with the filter F along x and y directions in the array of picture elements of the original image. In this manner, the filtering process is carried out with respect to the entire original image signal Sorg.
- FIG. 4 is an explanatory view showing how the filtering process is carried out.
- the filtering process is carried out by using the filter F shown in Figure 3 and with respect to the image signal components of the original image signal Sorg, which represent the picture elements located at every second row and every second column in the array of picture elements of the original image.
- a filtering-processed image signal B1 is obtained from the filtering process.
- the filtering-processed image signal B1 represents a filtering-processed image, which has a size 1/4 times (1/2 times in each of the x direction and the y direction) as large as the size of the original image.
- the filtering process is carried out on the filtering-processed image signal B1 by using the filter F.
- the filtering process is carried out with respect to the image signal components of the filtering-processed image signal B1, which represent the picture elements located at every second row and every second column in the array of picture elements of the filtering-processed image.
- Each of the filtering-processed image signals Bk represents the filtering-processed image, which has a size 1/2 2k times as large as the size of the original image.
- the filtering-processed image signals Bk have the frequency characteristics shown in Figure 5.
- the filtering-processed image signals Bk have the response characteristics such that the high frequency components may have been eliminated successively as the value of k becomes large.
- the filtering process is carried out by using the one-dimensional filter F shown in Figure 3 and along the x direction and the y direction of the original image.
- the filtering process may be carried out on the original image signal Sorg and each of the filtering-processed image signals Bk by using a 5 ⁇ 5 two-dimensional filter.
- the interpolating operation process is carried out on each of the filtering-processed image signals Bk. From the interpolating operation process, multi-resolution unsharp images having the same size as the size of the original image are obtained. How the interpolating operation process is carried out will be described hereinbelow.
- the filter F in accordance with the Gaussian signal is used as the low pass filter, and therefore a Gaussian signal is utilized as the interpolation coefficient for carrying out the interpolating operation.
- the filter for carrying out the interpolating operation becomes identical with a 5 ⁇ 1 one-dimensional filter F1 shown in Figure 7. Firstly, a single picture element having a value of 0 is inserted between two adjacent picture elements in the filtering-processed image represented by the filtering-processed image signal B1. In this manner, the - size of the filtering-processed image represented by the filtering-processed image signal B1 is enlarged to the same size as the size of the original image.
- Figure 8 illustrates the filtering-processed image signal B1, which has been obtained from the insertion of the picture elements having a value of 0, as a one-dimensional pattern. Thereafter, a filtering process is carried out on the filtering-processed image signal B1, which has been obtained from the insertion of the picture elements having a value of 0, by using the filter F1 shown in Figure 7.
- the filter F1 shown in Figure 7 is the 5 ⁇ 1 filter.
- the filtering process which is carried out on the filtering-processed image signal B1 by using the filter F1 becomes substantially equivalent to the filtering process, which is carried out with two kinds of filters, i.e. a 2 ⁇ 1 filter (0.5, 0.5) and a 3 ⁇ 1 filter (0.1, 0.8, 0.1).
- an unsharp image signal Sus1 is obtained, which is constituted of the same number of image signal components as that in the original image signal Sorg, i.e. which represents an unsharp image having the same size as that of the original image.
- the filter for carrying out the interpolating operation becomes identical with a 11 ⁇ 1 one-dimensional filter F2 shown in Figure 9.
- three picture elements having a value of 0 are inserted between two adjacent picture elements in the filtering-processed image represented by the filtering-processed image signal B2.
- the size of the filtering-processed image represented by the filtering-processed image signal B2 is enlarged to the same size as the size of the original image.
- a filtering process is carried out on the filtering-processed image signal B2, which has been obtained from the insertion of the picture elements having a value of 0, by using the filter F2 shown in Figure 9.
- the filter F2 shown in Figure 9 is the 11 ⁇ 1 filter.
- the filtering process which is carried out on the filtering-processed image signal B2 by using the filter F2 becomes substantially equivalent to the filtering process, which is carried out with four kinds of filters, i.e. a 2 ⁇ 1 filter (0.5, 0.5) and 3 ⁇ 1 filters (0.3, 0.65, 0.05), (0.13, 0.74, 0.13), and (0.05, 0.65, 0.3).
- an unsharp image signal Sus2 is obtained, which is constituted of the same number of image signal components as that in the original image signal Sorg.
- the filtering process described above is carried out on all of the filtering-processed image signals Bk.
- a filter having a length of 3 ⁇ 2 k -1 is prepared in accordance with Formula (5).
- 2 k -1 number of picture elements having a value of 0 are inserted between two adjacent picture elements of each filtering-processed image signal Bk, and the size of the filtering-processed image represented by the filtering-processed image signal Bk is thereby enlarged to the same size as that of the original image.
- the filtering process is carried out on the filtering-processed image signal Bk, which has been obtained from the insertion of the picture elements having a value of 0, by using the filter having a length of 3 ⁇ 2 k -1.
- the filtering process carried out with the filter having a length of 3 ⁇ 2 k -1 becomes equivalent to the filtering process, which is carried out by using a filter having a length of 2 or 3 with a period of 2 k .
- n number of unsharp image signals Susk are obtained.
- multi-resolution unsharp images are obtained, which have different levels of resolution, i.e. which have different frequency response characteristics.
- the filtering process becomes substantially equivalent to the filtering process carried out with a filter having a length of 2 or 3. Therefore, even though the length of the filter becomes long, the amount of operations does not become very large. Accordingly, the amount of operations can be kept small, and the multi-resolution unsharp image signals Susk can be obtained quickly.
- the filtering process is carried out along the x direction and the y direction of the image by using the one-dimensional filter having a length of 3 ⁇ 2 k -1.
- a two-dimensional filter may be prepared previously, the filtering process of each of the filtering-processed images may be carried out by using the two-dimensional filter, and the unsharp image signals Susk may thereby be obtained.
- a (3 ⁇ 2 k -1) ⁇ (3 ⁇ 2 k -1) filter is used as the filter used in the filtering process for carrying out the interpolating operation on the filtering-processed image.
- the filtering process with the two-dimensional filter becomes equivalent to the filtering process, which is carried out by using a 2 ⁇ 2 or 3 ⁇ 3 filter with a period of 2 k . Therefore, as in cases where the one-dimensional filter described above is used, even though the size of the filter becomes large, the amount of operations for carrying out the filtering process does not become very large.
- the multi-resolution transforming method and apparatus in accordance with the present invention even if the size of the filter used for the filtering process is not set to be large, the low-resolution images can be obtained in steps. Therefore, the problems can be prevented from occurring in that the amount of operations becomes large due to an increase in the size of the filter. As a result, the unsharp image signals can be obtained quickly. Also, the filtering process is carried out by repeatedly using the same filter. Therefore, it becomes unnecessary to use a plurality of filters having different sizes. Accordingly, it becomes unnecessary to provide a memory having a large capacity for storing the information representing the plurality of filters, and the multi-resolution transforming apparatus can be kept small in size.
- the unsharp image signals Susk having been obtained in the manner described above have the frequency characteristics shown in Figure 11. As illustrated in Figure 11, the unsharp image signals Susk have the frequency characteristics such that the high frequency components of the original image signal Sorg may have been eliminated successively as the value of k becomes large. Examples of an image processing method and apparatus, wherein processing for emphasizing predetermined frequency components of the original image signal is carried out by utilizing the unsharp image signals, will be described hereinbelow.
- FIG 12 is a block diagram showing an example of the image processing apparatus, wherein the multi-resolution transforming apparatus shown in Figure 1 is provided as an unsharp image signal forming means.
- the image processing apparatus also comprises a band-limited image signal forming means 2 for forming a plurality of band-limited image signals from the unsharp image signals Susk, which have been formed by the unsharp image signal forming means 1.
- the image processing apparatus further comprises a conversion means 3 for carrying out a converting process on at least a single band-limited image signal, which is among the plurality of the band-limited image signals having been formed by the band-limited image signal forming means 2, such that at least a portion of the band-limited image signal may become small.
- the image processing apparatus still further comprises an integration means 4 for integrating the converted band-limited image signals, which have been obtained from the conversion means 3, and thereby forming an integration signal.
- the image processing apparatus also comprises a frequency emphasis processing means 5 for multiplying the integration signal by a predetermined emphasis coefficient, adding the resulting product to the original image signal Sorg, and thereby obtaining a processed image signal Sproc, in which the high frequency components of the original image have been emphasized.
- FIG 13 is a block diagram showing the entire constitution of the example of the image processing apparatus.
- the plurality of the unsharp image signals Susk which have been formed by the unsharp image signal forming means 1 are then processed in the band-limited image signal forming means 2 and the conversion means 3.
- the band-limited image signals are formed from the original image signal Sorg and the plurality of the unsharp image signals Susk, which have been formed by the unsharp image signal forming means 1.
- Each of the band-limited image signals is obtained from a subtracter 21, which subtracts the unsharp image signals Susk of two adjacent frequency bands (as for the original image signal Sorg, Sorg and Sus1) from each other.
- the values of Sorg - Sus1, Sus1 - Sus2, ..., SusN-1 - SusN are calculated successively, and the plurality of the band-limited image signals are thereby obtained.
- Figure 14 shows the frequency characteristics of the band-limited image signals. As illustrated in Figure 14, the band-limited image signals have the frequency characteristics such that they may represent the bands of low frequency components of the original image signal Sorg as the value of k of the unsharp image signal Susk becomes large.
- each of the band-limited image signals is converted in accordance with the level of the band-limited image signal.
- the conversion of each band-limited image signal is carried out by a converter 22 by utilizing, for example, a function f shown in Figure 15.
- the function f has the characteristics such that the inclination of the function may be equal to 1 with respect to the band-limited image signal having the absolute value, which is smaller than a threshold value Th1, and such that the inclination of the function may be smaller than 1 with respect to the band-limited image signal having the absolute value, which is larger than the threshold value Th1.
- the same function may be utilized for the respective band-limited image signals, or different functions may be utilized for the respective band-limited image signals.
- the band-limited image signals, which have been converted with the function f, are fed into an operation device 23, which is provided with the integration means 4 and the frequency emphasis processing means 5 described above.
- the processing is carried out in the manner described below. Firstly, the band-limited image signals, which have been converted with the function f, are integrated, and the integration signal is thereby obtained.
- the frequency emphasis processing means 5 the integration signal is multiplied by an emphasis coefficient ⁇ , which has a value in accordance with the value of the original image signal Sorg. The resulting product is then added to the original image signal Sorg, and the processed image signal Sproc is thereby obtained.
- the aforesaid processing carried out by the band-limited image signal forming means 2, the conversion means 3, the integration means 4, and the frequency emphasis processing means 5 may be represented by Formula (6) shown below.
- the processed image signal Sproc which has been obtained in the manner described above, has the frequency response characteristics shown in Figure 16.
- the band-limited image signals have the characteristics such that, in a flat region in which the change in the image density of the original image is comparatively small, the absolute value of the signal value of each band-limited image signal may be small in each frequency band.
- Figure 52 in a region in the vicinity of an edge in the image, at which the image density changes sharply, in cases where the band-limited image signal is of a comparatively low frequency band, i.e.
- the edge in the image is contained in the unsharp mask, which is set for a picture element located in the vicinity of the edge. Therefore, in such cases, the band-limited image signal is affected by the edge, and the absolute value of the signal value of the band-limited image signal becomes comparatively large. In this manner, a portion, which does not constitute the edge in the image, is affected by the image density value of the edge, and an artifact, such as overshoot or undershoot, occurs at the edge portion in the image, which is obtained from the image processing.
- the band-limited image signal is converted with the aforesaid function f such that, in cases where the absolute value of the band-limited image signal is larger than the threshold value Th1, the absolute value may become small.
- the band-limited image signals having thus been converted are integrated, and the obtained integration signal is emphasized with the predetermined emphasis coefficient.
- the signal concerning the high frequency components, which is to be added to the original image signal Sorg, is thereby obtained.
- the processed image signal Sproc has the frequency characteristics indicated by the solid line. Also, as indicated by the broken line in Figure 16, in the region in the vicinity of an edge, the processed image signal Sproc has the frequency characteristics such that the response with respect to a comparatively low frequency band may become low.
- the same effects can be obtained as those obtained when the size of the unsharp mask for obtaining the unsharp image signal, i.e. Sus in Formula (1), is set to be smaller than the size of the actual unsharp mask in region in the vicinity of an edge.
- the band-limited image signal corresponding to the region in the vicinity of an edge and having a signal value, the absolute value of which is comparatively large is converted into the signal, which has small influence upon the signal concerning the high frequency components to be added to the original image signal Sorg. Accordingly, in the region in the vicinity of an edge, at which the image density changes sharply, the influence of a signal, which causes an artifact to occur, can be weakened. As a result, an image having no artifact and having good image quality can be obtained from the processing.
- the processed image signal Sproc is obtained with Formula (6).
- the processed image signal Sproc may be obtained with Formula (7) shown below.
- Formula (6) and Formula (7) are different in the point described below.
- the band-limited image signal is obtained by subtracting the signals of two adjacent frequency bands from each other.
- the band-limited image signal is obtained by subtracting each of the unsharp image signals Susk of all frequency bands from the original image signal Sorg.
- the processed image signal Sproc obtained with Formula (7) has the frequency characteristics shown in Figure 17. As illustrated in Figure 17, in the flat region in which no edge is located, the processed image signal Sproc has the frequency characteristics indicated by the solid line.
- the processed image signal Sproc has the frequency characteristics such that the response with respect to a comparatively low frequency band may become low.
- the same effects can be obtained as those obtained when the size of the unsharp mask for obtaining the unsharp image signal Susk is set to be smaller than the size of the actual unsharp mask in region in the vicinity of an edge.
- the frequency characteristics indicated by the broken line in Figure 17 are compared with those in Figure 16, the response in Figure 17 becomes low over the entire frequency band. Therefore, in the frequency characteristics shown in Figure 17, the response becomes low also in the flat region, which is not located in the vicinity of an edge. Accordingly, the processed image signal Sproc should preferably be obtained with Formula (6).
- the function for converting the band-limited image signal is set such that, in cases where the absolute value of the band-limited image signal is larger than the threshold value Th1, the absolute value may become small.
- the function for converting the band-limited image signal may be set such that, in cases where the absolute value of the band-limited image signal is larger than the threshold value Th1, the absolute value may become small,and such that, in cases where the absolute value of the band-limited image signal is smaller than a threshold value Th2, the absolute value may become small.
- a correction may be made such that, as the absolute value of the band-limited image signal becomes smaller than the threshold value Th2, which is smaller than the threshold value Th1, the absolute value of the band-limited image signal may be converted to a small value.
- the response with respect to the components, which have a small absolute value of a signal value and may be considered as being noise in the image can be rendered low. As a result, noise in the processed image can be reduced.
- the processed image signal Sproc is obtained with Formula (6) or Formula (7).
- the processed image signal Sproc may be obtained with Formula (8) shown below.
- Formula (7) and Formula (8) are different in the point described below.
- the band-limited image signal is obtained by subtracting each of the unsharp image signals Susk of all frequency bands from the original image signal Sorg.
- the band-limited image signals in Formula (8) have the frequency characteristics shown in Figure 19.
- the processed image signal Sproc obtained with Formula (8) has the frequency characteristics such that the high frequency components may have been eliminated.
- the high frequency components which can be considered as being noise in the image, are also emphasized, and therefore noise becomes perceptible in the resulting processed image.
- the processed image signal Sproc can be obtained such that the high frequency components may have been eliminated. Therefore, noise is not emphasized, and a processed image having good image quality can be obtained.
- the processing may be carried out with Formula (9) shown below.
- Formula (6) shown above the band-limited image signal (Sorg - Sus1) is used.
- Formula (9) the band-limited image signal (Sorg - Sus1) is not used.
- the highest frequency components shown in Figure 14 are eliminated. Therefore, as in the processing carried out with Formula (8), the processed image signal Sproc can be obtained such that the high frequency components may have been eliminated. Accordingly, noise is not emphasized, and a processed image having good image quality can be obtained.
- the frequency band which is to be used in making a diagnosis, or the like, varies for different portions of the object, the images of which were recorded.
- the comparatively low frequency components should preferably be emphasized in the lung image
- the comparatively high frequency components should preferably be emphasized in the stomach image such that the patterns of the folds of the walls of the stomach may be viewed.
- images containing patterns of bones or metal members, such as artificial bones it is necessary to prevent an artifact from occurring due to excessive emphasis of the edges of the bone patterns or the metal member patterns.
- the images which do not contain edges, e.g.
- the shape of the function f shown in Figure 15 should preferably be altered in accordance with the portion of the object, the image of which was recorded, or the frequency bands of the band-limited image signals.
- the function f should preferably be set as indicated by B such that the high frequency components of the band-limited image signals may be restricted, and an artifact may be prevented from occurring at an edge.
- the function f should preferably be set as indicated by A, and the converting process should preferably be carried out such that the high frequency components of the band-limited image signals may also be emphasized, and the absolute values of the band-limited image signals may become large over approximately the entire frequency band.
- the band-limited image signals should preferably be emphasized over the entire frequency band, and therefore the function f should preferably be altered as shown in Figure 21 in accordance with the frequency bands of the band-limited image signals.
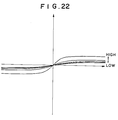
- the function f should preferably be altered as shown in Figure 22 in accordance with the frequency bands of the band-limited image signals.
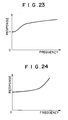
- Figure 23 shows the frequency characteristics of the processed image signal Sproc, which is obtained by converting the band-limited image signals in accordance with the functions f shown in Figure 21.
- Figure 24 shows the frequency characteristics of the processed image signal Sproc, which is obtained by converting the band-limited image signals in accordance with the functions f shown in Figure 22.
- the response is emphasized over approximately the entire frequency band.
- the response with respect to the high frequency band is emphasized to a higher extent than the response with respect to the other frequency bands.
- the processing should preferably be carried out such that the response may be emphasized over the entire frequency band. In such cases, the lung field patterns becomes perceptible. Also, as for the double contrast image of the stomach, the processing should preferably be carried out such that the response with respect to the high frequency band may be emphasized. In such cases, the patterns of the folds of the walls of the stomach becomes perceptible. Also, in cases where the processing is carried out such that the absolute values of the band-limited image signals may be changed in accordance with the frequency bands of the band-limited image signals or the portion of the object, the image of which was recorded, an image having good image quality in accordance with the portion of the object, the image of which was recorded, or the frequency bands can be obtained.
- the conversion of the band-limited image signals in the conversion means 3 may be carried out regardless of the aforesaid threshold value Th1 and in accordance with a plurality of functions f1 to fN, which vary for different frequency bands, such that the absolute value of each band-limited image signal may be converted to a value, which is not larger than the absolute value of the band-limited image signal and is determined in accordance with the absolute value of the band-limited image signal.
- functions f1 to fN a combination of appropriate functions should preferably be set in accordance with the characteristics of the image processing which is to be achieved.
- the processed image signal Sproc can be adjusted, such that it may have arbitrary frequency characteristics, by varying the functions, which are used in the conversion means 3, for different frequency bands. Therefore, the frequency characteristics of the processed image signal Sproc can be adjusted in accordance with the conditions, which are required for the images to be processed in the respective apparatuses described above.
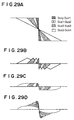
- Figures 29A, 29B, 29C, and 29D are explanatory views showing the problems encountered with the conventional technique, in which the same function is employed as the functions f1 to fN, i.e. in which the band-limited image signals of all frequency bands are converted with the same converting method.
- Figures 29A, 29B, 29C, and 29D the processing in the vicinity of an edge, at which the image density changes sharply, is illustrated in steps.
- Figure 29A shows a step-like profile of the original image signal and the profiles of the unsharp image signals having been formed from the original image signal.
- Figure 29B shows the profiles of the band-limited image signals with respect to the signals shown in Figure 29A.
- Figure 29C shows the profiles of the converted image signals.
- Figure 29D shows the profile of the signal obtained by integrating the converted image signals.
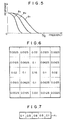
- Figure 25 shows examples of the functions used for the formation of the band-limited image signals.
- the value of the band-limited image signal to be processed is plotted on the horizontal axis, and the value obtained by processing the band-limited image signal is plotted on the vertical axis.
- Each of the functions illustrated in Figure 25 converts the band-limited image signal such that the absolute value of the band-limited image signal may be converted to a value, which is not larger than the absolute value of the band-limited image signal and is determined in accordance with the absolute value of the band-limited image signal.
- each of the functions carries out the conversion such that, as for the band-limited image signal, the absolute value of which is larger than a predetermined value, the value of the converted image signal may become approximately equal to a predetermined level.
- the aforesaid predetermined value is set to be smaller than those in the other functions.
- the functions have the characteristics such that each function may pass through the origin, such that the inclination of the function may be equal to at most 1 regardless of the value of the band-limited image signal processed with the function, and such that the inclination of the function may become equal to 0 or may converge to 0 as the absolute value of the signal value of the band-limited image signal processed with the function becomes large.
- the functions also have the characteristics such that, in a function for processing a high frequency band, the absolute value of the processed signal value, which absolute value is associated with the point in the function where the inclination of the function becomes equal to 0 or a predetermined value close to 0, may take a smaller value than those in the other functions.
- the functions shown in Figure 25 carry out the conversion such that a band-limited image signal having a large amplitude may be restricted, and such that the degree of restriction of a band-limited image signal of a high frequency band may be higher than the degree of restriction of a band-limited image signal of a low frequency band.
- Such conversion is carried out by considering the feature in that the high frequency components contained in an edge in an actual radiation image have a smaller amplitude than the amplitude of low frequency components. Specifically, even at a very sharp edge in an actual radiation image, the signal does not take a definite step-like profile illustrated in Figure 30A, but the amplitude of the high frequency components becomes smaller than the amplitude of the low frequency components as illustrated in Figure 30B. Therefore, in accordance with the amplitude of the respective frequency components, as for a band-limited image signal having a high frequency, the restriction should preferably be carried out starting with a small amplitude.
- the functions shown in Figure 25 can achieve such restriction.
- Each of the functions illustrated in Figure 26 converts the band-limited image signal such that the absolute value of the band-limited image signal may be converted to a value, which is not larger than the absolute value of the band-limited image signal and is determined in accordance with the absolute value of the band-limited image signal.
- the absolute value of the converted image signal that is obtained when the band-limited image signal having a signal value, the absolute value of which falls within a predetermined range close to 0, is converted, takes a value smaller than those in the other functions.
- the functions have the characteristics such that each function may pass through the origin, and such that the inclination of the function may be equal to at most 1 regardless of the value of the band-limited image signal processed with the function.
- the functions also have the characteristics such that, in a function for processing a low frequency band, the inclination of the function in the region, in which the absolute value of the band-limited image signal is close to 0, may be smaller than those in the other functions.
- Figure 27 is a graph showing examples of functions, which have both of the characteristics of the functions shown in Figure 25 and the characteristics of the functions shown in Figure 26. With the functions shown in Figure 27, both of the effects of the functions shown in Figure 25 and the effects of the functions shown in Figure 26 can be obtained.
- Figures 28A-1, 28B-1, 28C-1 and Figures 28A-2, 28B-2, 28C-2 show examples of the effects obtained.
- Figures 28A-1, 28B-1, and 28C-1 show the frequency characteristics of the signals of the respective frequency bands having been formed by the examples.
- Figures 28A-2, 28B-2, and 28C-2 show the frequency characteristics with respect to the entire frequency band, which correspond respectively to Figures 28A-1, 28B-1, and 28C-1.
- the frequency characteristics shown in Figures 28A-1 and 28A-2 are obtained when a function having an inclination of 1 is set for all of the frequency bands.
- the frequency characteristics shown in Figures 28B-1 and 28B-2 are obtained when the inclination of the function is set to be small for a low frequency band.
- the frequency characteristics shown in Figures 28C-1 and 28C-2 are obtained when the inclination of the function is set to be 1 for a specific frequency band and is set to be smaller than 1 for the other frequency bands such that band pass frequency characteristics may be obtained as a whole.
- the example shown in Figures 28C-1 and 28C-2 is useful when, for example, only the information of a specific frequency band is to be obtained.
- the converting process carried out by the conversion means 3 may be varied in accordance with the value of the emphasis coefficient ⁇ . The effects obtained in such cases will be described hereinbelow by taking the processing with functions, which are free from the threshold value, as an example.
- the functions shown in Figures 31 and 32 restrict each band-limited image signal such that it may become smaller than the absolute value of the band-limited image signal.
- the combination of the functions is defined such that, as the value of the emphasis coefficient ⁇ becomes large, the difference between the degree of restriction, which is carried out with the function for processing a high frequency band, and the degree of restriction, which is carried out with the function for processing a low frequency band, may become large.
- the function for processing the high frequency band is kept the same regardless of the value of the emphasis coefficient ⁇ , and the degree of restriction, which is carried out with the function for processing the low frequency band, is set to be high as the value of the emphasis coefficient ⁇ becomes large.
- the function for processing the low frequency band is kept the same regardless of the value of the emphasis coefficient ⁇ , and the degree of restriction, which is carried out with the function for processing the high frequency band, may be changed.
- all of the functions may be changed such that the difference in the degree of restriction may become large.
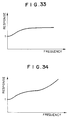
- Figure 33 shows the response of the image signal, in which the high frequency components have been emphasized with the combination of the functions shown in Figure 31.
- Figure 34 shows the response of the image signal, in which the high frequency components have been emphasized with the combination of the functions shown in Figure 32. From Figures 33 and 34, it will be found that, in cases where the value of the emphasis coefficient ⁇ is large, only the degree of emphasis of the high frequency components becomes high, and the degree of emphasis of the low frequency components is kept approximately the same as when the value of the emphasis coefficient ⁇ is small.
- the value of the emphasis coefficient is set to be large such that the high frequency components carrying a small amount of information may be emphasized.
- the low frequency components are also emphasized.
- the level of contrast becomes very high, and an artifact will occur.
- the combination of the functions is set as shown in Figure 32 such that, even if the value of the emphasis coefficient ⁇ is set to be large, the degree of emphasis of the low frequency components may not change very much, an artifact can be prevented from occurring.
- Figure 31 a single set of functions are shown which may be used when the value of the emphasis coefficient ⁇ is small. Also, in Figure 32, a single set of functions are shown which may be used when the value of the emphasis coefficient ⁇ is large.
- the examples shown in Figures 31 and 32 do not mean that only two sets of the functions are used, but merely illustrate how the characteristics of the functions may be changed in accordance with a change in the value of the emphasis coefficient ⁇ . Therefore, it is also possible to classify the extent of the change in the value of the emphasis coefficient ⁇ into several different levels, and to determine a set of functions in accordance with each of the classified levels. In cases where such levels are set finely, an image having better image quality can be obtained.
- the non-linear functions are determined on the basis of the consideration in that the value of the emphasis coefficient is set to be large in order for only the high frequency components to be emphasized.
- the effects, which should be obtained from the changing of the value of the emphasis coefficient are not limited to the emphasis of the high frequency components. Therefore, as the non-linear functions, various functions may be utilized in accordance with the effects, which are to be obtained.
- the non-linear functions sets of the plurality of non-linear functions varying for different frequency bands are employed.
- the effects can also be obtained when a single same non-linear function is employed for all of the frequency bands, depending upon the effects, which are to be obtained from the changing of the value of the emphasis coefficient.
- FIG 35 is a block diagram showing this example of the image processing apparatus.
- the band-limited image signals are formed from the original image signal Sorg and the plurality of the unsharp image signals Susk, which have been formed by the unsharp image signal forming means 1.
- Each of the band-limited image signals is obtained from the subtracter 21, which subtracts the unsharp image signals Susk of two adjacent frequency bands (as for the original image signal Sorg, Sorg and Sus1) from each other.
- the values of Sorg - Sus1, Sus1 - Sus2, ..., SusN-1 - SusN are calculated successively, and the plurality of the band-limited image signals are thereby obtained.
- the signal Sus2 - Sus3 is employed as the corresponding auxiliary image signal. Therefore, a single means substantially serves as the band-limited image signal forming means and an auxiliary image signal forming means. Specifically, the signal, which has been formed by the band-limited image signal forming means, is processed as the band-limited image signal and is also processed as the auxiliary image signal corresponding to the adjacent band-limited image signal.
- each of the band-limited image signals having thus been obtained is converted in the conversion means 3.
- the conversion is carried out on each band-limited image signal by using the converter 22 and a converter 24 shown in Figure 35.
- the converting process is carried out by using one of the functions f1 to fN for the respective frequency bands, and a restricted image signal is thereby obtained.
- a converting process is carried out by using a function g, and a magnification ratio signal is thereby obtained.
- a multiplier 25 the restricted image signal is multiplied by the magnification ratio signal. The conversion is carried out in this manner. In such cases, as illustrated in Figure 35, the signals of two adjacent frequency bands are multiplied by each other.
- the restricted image signal which has been obtained by converting the band-limited image signal Sus1 - Sus2, and the magnification ratio signal, which has been obtained by converting the auxiliary image signal Sus2 - Sus3, are multiplied by each other.
- the converter 22 for carrying out the conversion with the function fk corresponds to a restricted image signal forming means.
- the converter 24 for carrying out the conversion with the function g corresponds to a magnification ratio signal forming means.
- the multiplier 25 for multiplying the output signals, which have been obtained from the converters 22 and 24, by each other corresponds to a multiplication means.
- the functions f1 to fN may be identical with one another or may be different from one another. They may be set arbitrarily in accordance with the characteristics of the image processing which is to be carried out.
- the functions f1 to fN the functions are used, each of which restricts the band-limited image signal such that it may become smaller than the absolute value of the band-limited image signal, and which vary for different frequency bands.
- the functions shown in Figure 25 are used.
- a function shown in Figure 36 may be used.
- the auxiliary image signal is converted such that a converted value close to 1 may be obtained when the absolute value of the auxiliary image signal is small and such that, as the absolute value of the auxiliary image signal becomes large, a converted value close to 0 may be obtained.
- K represents the minimum value of the absolute value of the auxiliary image signal among the values, for which the converted values become equal to 0.
- the converted image signals which have been obtained from the conversion means 3, are fed into the operation device 23, which is provided with the integration means 4 and the frequency emphasis processing means 5.
- the processing is carried out in the manner described below. Firstly, the plurality of the converted image signals are integrated, and the integration signal is thereby obtained.
- the integration signal is multiplied by an emphasis coefficient ⁇ , which has a value determined in accordance with the value of the original image signal Sorg.
- the resulting product is then added to the original image signal Sorg, and the processed image signal Sproc is thereby obtained.
- This process and the other processes described above may be represented by Formula (10) shown below.
- Sproc represents the image signal, in which the high frequency components have been emphasized
- Sorg represents the original image signal
- g represents the function for converting the auxiliary image signal and thereby obtaining the magnification ratio signal
- ⁇ (Sorg) represents the emphasis coefficient determined in accordance with the original image signal.
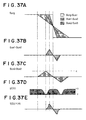
- Figures 37A, 37B, 37C, 37D, and 37E show the effects obtained when an image signal corresponding to a region in the vicinity of an edge in the image is processed in the embodiment of Figure 35.
- Figure 37A shows a step-like profile of the original image signal, which corresponds to the region in the vicinity of an edge in the image, and the profiles of the unsharp image signals having been formed from the original image signal.
- Figure 37B shows the profile of the band-limited image signal with respect to the signals shown in Figure 37A.
- Figure 37C shows the profile of the auxiliary image signal containing the signal of the frequency band, which is lower by a single level than the frequency band of the band-limited image signal shown in Figure 37B.
- Figure 37D shows the profile of the magnification ratio signal, which is obtained when the auxiliary image signal shown in Figure 37C is processed with the function g.
- Figure 37E shows the profile of the processed signal, which is obtained when the restricted image signal having been obtained by processing the band-limited image signal shown in Figure 37B with the function f is multiplied by the magnification ratio signal shown in Figure 37D.
- the value K shown in Figure 37C is identical with the value K shown in Figure 36. It is illustrated that, when the value of the auxiliary image signal shown in Figure 37C becomes equal to K, the value of the magnification ratio signal shown in Figure 37D becomes equal to 0.
- the band-limited image signal shown in Figure 37B is converted merely such that its absolute value may become small, the shape of the peak of the signal will become smooth, but the rise portion of the signal will be kept sharp.
- the processed signal shown in Figure 37E its rise portion is smooth. In cases where the rise portion of each band-limited image signal is thus rendered smooth, a step-like artifact can be prevented from occurring at the boundaries among the frequency bands in the signal, which is obtained by integrating the band-limited image signals.
- the auxiliary image signals, which are processed with the function g, are not limited to those described above.
- the image processing is carried out with Formula (11) shown below.
- Sproc Sorg+ ⁇ (Sorg) ⁇ Fusm(Sorg,Sus1,Sus2,...,SusN)
- Fusm(Sorg,Sus1,Sus2,...,SusN) ⁇ f1(Sorg - Sus1) ⁇ g(Sorg - Sus2) +f2(Sus1 - Sus2) ⁇ g(Sorg - Sus3)+... +fk(Susk-1 - Susk) ⁇ g(Sorg - Susk+1)+...
- Sproc represents the image signal, in which the high frequency components have been emphasized
- Sorg represents the original image signal
- g represents the function for converting the auxiliary image signal and thereby obtaining the magnification ratio signal
- ⁇ (Sorg) represents the emphasis coefficient determined in accordance with the original image signal.
- Figures 38A-1, 38B-1, 38C-1, 38D-1, and 38E-1 show the effects obtained when an image signal corresponding to a region in the vicinity of an edge in the image, which edge has a high level of contrast, is processed in the embodiment utilizing Formula (11).
- Figure 38A-1 shows a step-like profile of the original image signal, which corresponds to the region in the vicinity of an edge in the image, and the profiles of the unsharp image signals having been formed from the original image signal.
- Figure 38B-1 shows the profile of the band-limited image signal with respect to the signals shown in Figure 38A-1.
- Figure 38C-1 shows the profile of the auxiliary image signal containing the signal of the frequency band, which is lower by a single level than the frequency band of the band-limited image signal shown in Figure 38B-1.
- Figure 38D-1 shows the profile of the magnification ratio signal, which is obtained when the auxiliary image signal shown in Figure 38C-1 is processed with the function g.
- Figure 38E-1 shows the profile of the processed image signal, which is obtained when the restricted image signal having been obtained by processing the band-limited image signal shown in Figure 38B-1 with the function f is multiplied by the magnification ratio signal shown in Figure 38D-1.
- Figures 38A-2, 38B-2, 38C-2, 38D-2, and 38E-2 show the effects obtained when an image signal corresponding to a region in the vicinity of an edge in the image, which edge has a low level of contrast, is processed in the example utilizing Formula (11).
- Figures 38A-2, 38B-2, 38C-2, 38D-2, and 38E-2 are the views respectively similar to Figures 38A-1, 38B-1, 38C-1, 38D-1, and 38E-1.
- the signal obtained from the conversion becomes small as for the edge having a high level of contrast.
- the signal obtained from the conversion has a level close to the level of the original band-limited image signal.
- the signals obtained from the conversion are then integrated, and the integration signal thus obtained is added to the original image signal Sorg for the purposes of emphasis.
- the effects can be obtained such that the edge having a high level of contrast may not be emphasized strongly, and the edge having a low level of contrast is emphasized more strongly than the edge having the high level of contrast.
- FIG 39 is a block diagram showing this example of the image processing apparatus.
- the band-limited image signals are formed from the original image signal Sorg and the plurality of the unsharp image signals Susk, which have been formed by the unsharp image signal forming means 1.
- Each of the band-limited image signals is obtained from the subtracter 21, which subtracts the unsharp image signals Susk of two adjacent frequency bands (as for the original image signal Sorg, Sorg and Sus1) from each other.
- the values of Sorg - Sus1, Sus1 - Sus2, ..., SusN-1 - SusN are calculated successively, and the plurality of the band-limited image signals are thereby obtained.
- each of the band-limited image signals having thus been obtained is converted in the conversion means 3.
- a band-limited image signal to be converted which is of a certain frequency band
- a signal i.e., an auxiliary image signal
- an adder 26 corresponds to a composite band-limited image signal forming means.
- the function shown in Figure 40 may be employed.
- the function g shown in Figure 40 has the characteristics such that the function may pass through the origin, such that the inclination of the function at the origin may be equal to approximately 0, such that the inclination of the function may increase gradually as the value to be processed becomes large, and such that the inclination of the function may ultimately become equal to approximately 1.
- the degree of restriction is set to be high when the level of the signal to be processed is low. Also, as the level of the signal to be processed becomes high, the degree of restriction is set to be low.
- the portion of this function, at which the inclination increases gradually from the origin affects the wave form of the rise portion of the auxiliary image signal.
- a sharp rise portion can be rendered smooth.
- the level of the actual band-limited image signal is limited, and therefore any of functions, the inclination of which increases gradually from 0 in the region in the vicinity of the origin, may be employed as the function g.
- a function shown in Figure 41 may also be employed.
- signal amplification is not carried out, and therefore the inclination of the function is set to be at most 1.
- the effects are obtained from the gradual increase of the inclination of the function in the region in the vicinity of the origin. Therefore, in so far as the inclination of the function in the region in the vicinity of the origin increases gradually, the inclination of the function need not necessarily be limited to at most 1.
- the functions f1 to fN which are used in this example, may be identical with one another or may be different from one another. They may be set arbitrarily in accordance with the characteristics of the image processing which is to be carried out. In this example, as the functions f1 to fN, by way of example, the functions shown in Figure 25 are used.
- the converted image signals which have been obtained from the conversion means 3, are fed into the operation device 23, which is provided with the integration means 4 and the frequency emphasis processing means 5.
- the processing is carried out in the manner described below. Firstly, the plurality of the converted image signals are integrated, and the integration signal is thereby obtained.
- the integration signal is multiplied by an emphasis coefficient ⁇ , which has a value determined in accordance with the value of the original image signal Sorg.
- the resulting product is then added to the original image signal Sorg, and the processed image signal Sproc is thereby obtained.
- This process and the other processes described above may be represented by Formula (12) shown below.
- Sproc represents the image signal, in which the high frequency components have been emphasized
- Sorg represents the original image signal
- g represents the function for converting the band-limited image signal and thereby obtaining the auxiliary image signal
- ⁇ (Sorg) represents the emphasis coefficient determined in accordance with the original image signal.
- Figures 42A, 42B, 42C, 42D, 42E, and 42F show the effects obtained when an image signal corresponding to a region in the vicinity of an edge in the image is processed in the embodiment of Figure 39.
- Figure 42A shows a step-like profile of the original image signal, which corresponds to the region in the vicinity of an edge in the image, and the profiles of the unsharp image signals having been formed from the original image signal.
- Figures 42B 42C show the profiles of the band-limited image signals with respect to the signals shown in Figure 42A. In cases where the band-limited image signal shown in Figure 42B is taken as the band-limited image signal to be converted, the band-limited image signal shown in Figure 42C is taken as the low frequency side band-limited image signal.
- Figure 42D shows the profile of the auxiliary image signal, which is obtained when the low frequency side band-limited image signal shown in Figure 42C is processed with the function g.
- Figure 42E shows the profile of the composite band-limited image signal, which is obtained by adding the band-limited image signal to be converted, that is shown in Figure 42B, and the auxiliary image signal, which is shown in Figure 42D, to each other.
- Figure 42F shows the profile of the converted image signal, which is obtained by processing the composite band-limited image signal of Figure 42E with the function f. If the band-limited image signal shown in Figure 42B is converted merely such that its absolute value may become small, the shape of the peak of the signal will become smooth, but the rise portion of the signal will be kept sharp.
Description
- This invention relates to a method of and an apparatus for forming unsharp images, which have different frequency characteristics, from an image signal.
- Techniques for obtaining an image signal, which represents an image, carrying out appropriate image processing on the image signal, and thereafter reproducing a visible image from the processed image signal have heretofore been carried out in various fields. For example, in methods for carrying out such techniques, an image is transformed into multi-resolution images by a Fourier transform, a wavelet transform, a sub-band transform, or the like, and the image signal representing the image is thereby decomposed into signals falling within a plurality of different frequency bands. Thereafter, of the decomposed signals, a signal falling within a desired frequency band is subjected to predetermined image processing.
- As one of such methods, a method has been proposed, wherein an original image is transformed into multi-resolution images by utilizing an unsharp mask filter as in the technique using the wavelet transform, and image processing is then carried out on an unsharp image signal representing the unsharp image of each resolution. The proposed method is utilized in image processing of radiation images, and the like.
- Also, in the field of radiation image processing, when a radiation image (i.e., a tomographic image) of a tomographic plane is recorded with a tomographic image recording operation described in, for example, U.S.P. 4,581,535, it often occurs that the amount of transmitted radiation changes sharply at a portion, which is located at a position other than the tomographic plane. In such cases, an image pattern of such a portion occurs as an interfering pattern (or an interfering shadow) in the direction, along which the recording medium moves, and at a center region which is to be used in the radiation image. (Such an interfering pattern will hereinafter be referred to as the "flow pattern.") An image processing method for eliminating the flow pattern is proposed in, for example, Japanese Unexamined Patent Publication No. 3(1991)-276265. With the proposed image processing method, low frequency components corresponding to the flow pattern are removed from the image signal, which represents the radiation image obtained from the tomographic image recording operation, and an image free of the flow pattern is thereby obtained from the resulting image signal. The unsharp image signal described above can also be utilized in the process for eliminating the flow pattern.
- The applicant proposed the methods for carrying out frequency emphasis processing on an image signal by utilizing an unsharp image signal in order that a visible radiation image having good image quality can be reproduced and used as an effective tool in, particularly, the accurate and efficient diagnosis of an illness. The methods for carrying out the frequency emphasis processing are disclosed in, for example, U.S. Patent Nos. 4,315,318 and 4,317,179. With the frequency emphasis processing, an unsharp mask image signal (hereinbelow often referred to as the unsharp image signal)' Sus is subtracted from an original image signal Sorg, which has been detected from a radiation image. The obtained difference value is multiplied by an emphasis coefficient β. The resulting product is then added to the original image signal Sorg. In this manner, predetermined frequency components in the image can be emphasized. The frequency emphasis processing is represented by Formula (1) shown below.
- The unsharp image signal Sus can be obtained by carrying out an operation with Formula (2)
- The unsharp image signal Sus representing an unsharp image, which results from the unsharp mask processing and has a resolution lower than the resolution of the original image, can also be obtained by utilizing an unsharp mask filter, which has a predetermined size, and calculating the mean value or the weighted mean value of the values of the picture elements located within the unsharp mask filter.
- The applicant also proposed a method for compressing a dynamic range of an image, wherein an unsharp image signal is utilized, and the level of contrast of the parts of the image having a high or low image density or the level of contrast of the whole image is rendered low such that the difference between the highest image density and the lowest image density in the original image may become small, i.e. such that the dynamic range of the original image may become narrow. A method for compressing a dynamic range of an image is disclosed in, for example, U.S.P. 5,454,044. The proposed method comprises the steps of calculating an unsharp image signal Sus from the original image signal representing the original image, and processing the original image signal with Formula (3)
- In the image processing described above, in order for the original image to be transformed into the multi-resolution images by utilizing unsharp mask filters, it is necessary to use a plurality of filters having different sizes. In particular, in order for an unsharp image having a low resolution to be obtained, it is necessary to use a filter having a large size. However, if the size of the filter becomes large, the amount of operations for carrying out the filtering process will become very large, and a long time will be required to carry out the operations for conducting the unsharp mask processing. Also, it will become necessary to use a storage means having a large capacity for storing the information, which represents the plurality of the filters for obtaining the plurality of unsharp images having different levels of resolution. Therefore, the apparatus for carrying out the processing cannot be kept small, and the cost of the apparatus cannot be kept low.
- Further, in cases where the unsharp image signal is formed with the unsharp mask filter, in the region in the vicinity of an edge in the image, at which the image density changes sharply, the unsharp image signal is affected by the image density of the edge in the image. Therefore, if the frequency emphasis processing, the dynamic range compressing process, or the flow pattern eliminating process described above is carried out by using the unsharp image signal, the problems will occur in that an artifact, such as overshoot, undershoot, or an artificial contour, occurs, and the image quality of the image obtained from the processing cannot be kept good.
- According to EP-A-0 610 604 an original image having a predetermined number of pixels and a predetermined resolution is processed so as to obtain reduced resolution versions of the original image. Processing of image data according to EP-A-0 610 604 is made so as to allow different display modes as well as reduced storage space.
- EP-A-0 610 604 teaches to subsample a lowpass filtered original image repeatedly to generate a structure of image of successively smaller dimensions.
- At a later stage, the lowpass images are expanded to the next higher level by upsampling and filtering to form a prediction image, which is subtracted from its corresponding lowpass image to generate difference images or residual images. The purpose of this encoding technique is to provide efficient storage of the data.
- Consequently, EP-A-0 610 604 discloses different numbers of picture elements of a plurality of images. When the resolution level changes, so does the size of the image.
- The object of the present invention is to provide a method of forming unsharp images, in which the amount of operations for obtaining multi-resolution unsharp images is kept small and which is capable of being carried out with an apparatus having a small size.
- Another object of the present invention is to provide an apparatus for forming unsharp images.
- The present invention provides a method, of and an apparatus for forming unsharp images having the features of claims 1 and 2, respectively.
- With the method and apparatus in accordance with the present invention, the filtering process is carried out by using the filter having a predetermined size and with respect to each of the picture elements of the image, which are selected at predetermined intervals, and the first filtering-processed image is thereby obtained. The filtering process is then carried out on the first filtering-processed image, and the second filtering-processed image is thereby obtained. In this manner, the filtering process is successively carried out on the respective filtering-processed images, which are obtained successively. Therefore, from the filtering process carried out successively, the plurality of the image are obtained, in which the high frequency components have been removed in steps from the original image. Also, the filtering process is carried out with respect to each of the picture elements of the image, which are selected at predetermined intervals, and therefore the sizes of the filtering-processed images become small in steps from the size of the original image. The interpolating operation process is then carried out on each of the filtering-processed images, and the size of each of the filtering-processed images is thereby enlarged. In this manner, the multi-resolution transformed images, each of which is constituted of the same number of picture elements as that of the picture elements constituting the original image, i.e., each of which has the same size as that of the original image, can be obtained.
- Specifically, the multi-resolution images are obtained by successively carrying out the filtering process by using the filter having the predetermined size. Therefore, it becomes unnecessary to use a plurality of filters. Accordingly, it becomes unnecessary to provide a memory for storing the information representing the plurality of filters, and the multi-resolution transforming apparatus can be kept small in size. Also, even if the size of the filter is not set to be large, the images of low resolution can be obtained in steps. Therefore, the problems can be prevented from occurring in that the amount of operations becomes large due to an increase in the size of the filter. As a result, the multi-resolution unsharp images can be obtained quickly.
-
- Figure 1 is a block diagram showing the concept behind the multi-resolution transforming apparatus in accordance with the present invention,
- Figure 2 is a block diagram showing how a plurality of unsharp image signals are formed,
- Figure 3 is an explanatory view showing a (one-dimensional) filter, which is used in the process for forming the unsharp image signals,
- Figure 4 is an explanatory view showing how a filtering process is carried out,
- Figure 5 is a graph showing frequency characteristics of filtering-processed image signals,
- Figure 6 is an explanatory view showing a (two-dimensional) filter, which may be used in a filtering process means,
- Figure 7 is an explanatory view showing a filter, which is used in an interpolating operation carried out on a filtering-processed image signal B1,
- Figure 8 is an explanatory view showing how an interpolating operation is carried out,
- Figure 9 is an explanatory view showing a filter, which is used in an interpolating operation carried out on a filtering-processed image signal B2,
- Figure 10 is an explanatory view showing how an interpolating operation is carried out,
- Figure 11 is a graph showing frequency characteristics of unsharp image signals,
- Figure 12 is a block diagram showing the concept behind an image processing apparatus with frequency emphasis processing means,
- Figure 13 is a block diagram showing an example of the image processing apparatus in accordance with figure 12,
- Figure 14 is a graph showing examples of frequency characteristics of band-limited image signals,
- Figure 15 is a graph showing an example of a function, which is used in a converting process carried out on a band-limited image signal in a conversion means,
- Figure 16 is a graph showing an example of frequency characteristics of a processed image signal,
- Figure 17 is a graph showing a different example of frequency characteristics of a processed image signal,
- Figure 18 is a graph showing a different example of a function, which is used in a converting process carried out on a band-limited image signal in the conversion means,
- Figure 19 is a graph showing different examples of frequency characteristics of band-limited image signals,
- Figure 20 is a graph showing examples of functions used in a converting process carried out on band-limited image signals in accordance with the portions of an object, the images of which were recorded,
- Figure 21 is a graph showing examples of functions used in a converting process carried out on band-limited image signals in accordance with the levels of frequency bands,
- Figure 22 is a graph showing different examples of functions used in a converting process carried out on band-limited image signals in accordance with frequency bands,
- Figure 23 is a graph showing frequency characteristics of a processed image signal, which is obtained with the functions shown in Figure 21,
- Figure 24 is a graph showing frequency characteristics of a processed image signal, which is obtained with the functions shown in Figure 22,
- Figure 25 is a graph showing examples of functions, which are used in a converting process carried out in the conversion means,
- Figure 26 is a graph showing different examples of functions, which are used in a converting process carried out in the conversion means,
- Figure 27 is a graph showing examples of functions, which have both of the characteristics of the functions shown in Figure 25 and the characteristics of the functions shown in Figure 26,
- Figures 28A-1, 28B-1, and 28C-1 are graphs showing frequency characteristics with respect to respective frequency bands,
- Figures 28A-2, 28B-2, and 28C-2 are graphs showing frequency characteristics with respect to the entire frequency band, which correspond respectively to Figures 28A-1, 28B-1, and 28C-1,
- Figures 29A, 29B, 29C, and 29D are explanatory views showing the problems encountered when all of band-limited image signals are converted with a single kind of function,
- Figure 30A is an explanatory view showing ideal patterns of frequency components at an edge in the image,
- Figure 30B is an explanatory view showing actual patterns of frequency components at an edge in the image,
- Figure 31 is a graph showing examples of functions, which are used for the conversion of band-limited image signals in cases where the value of an emphasis coefficient is small,
- Figure 32 is a graph showing examples of functions, which are used for the conversion of band-limited image signals in cases where the value of an emphasis coefficient is large,
- Figure 33 is a graph showing the response of an image signal, which is obtained when the functions shown in Figure 31 are used for the conversion,
- Figure 34 is a graph showing the response of an image signal, which is obtained when the functions shown in Figure 32 are used for the conversion,
- Figure 35 is a block diagram showing a different example of the image processing apparatus in accordance with figure 12,
- Figure 36 is a graph showing an example of a function, which is used in a magnification ratio signal forming means,
- Figures 37A, 37B, 37C, 37D, and 37E are explanatory views showing the effects of the embodiment shown in Figure 35,
- Figures 38A-1, 38B-1, 38C-1, 38D-1, 38E-1, and Figures 38A-2, 38B-2, 38C-2, 38D-2, 38E-2 are explanatory views showing the effects of the embodiment shown in Figure 35,
- Figure 39 is a block diagram showing a further different example of the image processing apparatus in accordance with figure 12.
- Figure 40 is a graph showing an example of a function for forming an auxiliary image signal by converting a band-limited image signal,
- Figure 41 is a graph showing a different example of a function for forming an auxiliary image signal by converting a band-limited image signal, and
- Figures 42A, 42B, 42C, 42D, 42E, and 42F are explanatory views showing the effects of the embodiment shown in Figure 39.
-
- The present invention will hereinbelow be described in further detail with reference to the accompanying drawings.
- Figure 1 is a block diagram showing the concept behind the multi-resolution transforming apparatus in accordance with the present invention. As illustrated in Figure 1, the multi-resolution transforming apparatus comprises a filtering process means 10 and an interpolating process means 11. The filtering process means 10 carries a filtering process on a received original image signal Sorg. The filtering process is carried out by using a filter having a predetermined size and with respect to each of picture elements selected at predetermined intervals, a first filtering-processed image being thereby obtained. Thereafter, the filtering process means 10 carries out the filtering process with the filter, which has the predetermined size, on the first filtering-processed image, a second filtering-processed image being thereby obtained. In this manner, the filtering process means 10 successively carries out the filtering process on the respective filtering-processed images, which are thus obtained successively. The interpolating process means 11 carries out an interpolating operation process on the plurality of the filtering-processed images and thereby obtains multi-resolution unsharp image signals, each of which is constituted of the same number of picture elements as that of the picture elements constituting the original image, i.e. each of which has the same size as the size of the original image.
- Figure 2 is a block diagram showing how the plurality of the unsharp image signals are formed in the multi-resolution transforming apparatus shown in Figure 1. As illustrated in Figure 2, the digital original image signal Sorg representing the original image is subjected to the filtering process, which is carried out with a low pass filter L in the filtering process means 10. As the low pass filter L, by way of example, a 5×1 grid-like filter F shown in Figure 3 may be used. The filter F approximately corresponds to a one-dimensional Gaussian distribution. The filter F may be represented by Formula
- The filtering process is carried out with the filter F along x and y directions in the array of picture elements of the original image. In this manner, the filtering process is carried out with respect to the entire original image signal Sorg.
- In the filtering process means 10, the filtering process with the filter F is carried out in the manner described below. Figure 4 is an explanatory view showing how the filtering process is carried out. As illustrated in Figure 4, the filtering process is carried out by using the filter F shown in Figure 3 and with respect to the image signal components of the original image signal Sorg, which represent the picture elements located at every second row and every second column in the array of picture elements of the original image. From the filtering process, a filtering-processed image signal B1 is obtained. The filtering-processed image signal B1 represents a filtering-processed image, which has a size 1/4 times (1/2 times in each of the x direction and the y direction) as large as the size of the original image. Thereafter, the filtering process is carried out on the filtering-processed image signal B1 by using the filter F. The filtering process is carried out with respect to the image signal components of the filtering-processed image signal B1, which represent the picture elements located at every second row and every second column in the array of picture elements of the filtering-processed image. The filtering process with the filter F is thus carried out successively, and n number of filtering-processed image signals Bk, where k=1 to n, are thereby obtained. Each of the filtering-processed image signals Bk represents the filtering-processed image, which has a size 1/22k times as large as the size of the original image. Also, the filtering-processed image signals Bk have the frequency characteristics shown in Figure 5. As illustrated in Figure 5, the filtering-processed image signals Bk have the response characteristics such that the high frequency components may have been eliminated successively as the value of k becomes large. In Figure 5, the response characteristics of only the three filtering-processed image signals Bk, where k=1, 2, and 3, are shown.
- In the embodiment described above, the filtering process is carried out by using the one-dimensional filter F shown in Figure 3 and along the x direction and the y direction of the original image. Alternatively, as illustrated in Figure 6, the filtering process may be carried out on the original image signal Sorg and each of the filtering-processed image signals Bk by using a 5×5 two-dimensional filter.
- Thereafter, in the interpolating process means 11 shown in Figure 2, the interpolating operation process is carried out on each of the filtering-processed image signals Bk. From the interpolating operation process, multi-resolution unsharp images having the same size as the size of the original image are obtained. How the interpolating operation process is carried out will be described hereinbelow.
- As the interpolating operation technique, one of various techniques, such as a B spline technique, may be employed. In this embodiment, the filter F in accordance with the Gaussian signal is used as the low pass filter, and therefore a Gaussian signal is utilized as the interpolation coefficient for carrying out the interpolating operation. The interpolation coefficient utilizing the Gaussian signal is represented by Formula (5)
- In the interpolating operation for the filtering-processed image signal B1, k=1 and therefore σ =1. In cases where σ=1 in Formula (5) shown above, the filter for carrying out the interpolating operation becomes identical with a 5×1 one-dimensional filter F1 shown in Figure 7. Firstly, a single picture element having a value of 0 is inserted between two adjacent picture elements in the filtering-processed image represented by the filtering-processed image signal B1. In this manner, the - size of the filtering-processed image represented by the filtering-processed image signal B1 is enlarged to the same size as the size of the original image. Figure 8 illustrates the filtering-processed image signal B1, which has been obtained from the insertion of the picture elements having a value of 0, as a one-dimensional pattern. Thereafter, a filtering process is carried out on the filtering-processed image signal B1, which has been obtained from the insertion of the picture elements having a value of 0, by using the filter F1 shown in Figure 7.
- The filter F1 shown in Figure 7 is the 5×1 filter. As illustrated in Figure 8, in the filtering-processed image represented by the filtering-processed image signal B1 obtained from the inserting operation, a single picture element having a value of 0 has been inserted between two adjacent picture elements. Therefore, the filtering process, which is carried out on the filtering-processed image signal B1 by using the filter F1, becomes substantially equivalent to the filtering process, which is carried out with two kinds of filters, i.e. a 2×1 filter (0.5, 0.5) and a 3×1 filter (0.1, 0.8, 0.1). From the filtering process, an unsharp image signal Sus1 is obtained, which is constituted of the same number of image signal components as that in the original image signal Sorg, i.e. which represents an unsharp image having the same size as that of the original image.
- Thereafter, a filtering process is carried out on the filtering-processed image signal B2. In the interpolating operation for the filtering-processed image signal B2, k=2 and therefore σ=2. In cases where σ=2 in Formula (5) shown above, the filter for carrying out the interpolating operation becomes identical with a 11×1 one-dimensional filter F2 shown in Figure 9. Firstly, as illustrated in Figure 10, three picture elements having a value of 0 are inserted between two adjacent picture elements in the filtering-processed image represented by the filtering-processed image signal B2. In this manner, the size of the filtering-processed image represented by the filtering-processed image signal B2 is enlarged to the same size as the size of the original image. Thereafter, a filtering process is carried out on the filtering-processed image signal B2, which has been obtained from the insertion of the picture elements having a value of 0, by using the filter F2 shown in Figure 9.
- The filter F2 shown in Figure 9 is the 11×1 filter. As illustrated in Figure 10, in the filtering-processed image represented by the filtering-processed image signal B2 obtained from the inserting operation, three picture elements having a value of 0 have been inserted between two adjacent picture elements. Therefore, the filtering process, which is carried out on the filtering-processed image signal B2 by using the filter F2, becomes substantially equivalent to the filtering process, which is carried out with four kinds of filters, i.e. a 2×1 filter (0.5, 0.5) and 3×1 filters (0.3, 0.65, 0.05), (0.13, 0.74, 0.13), and (0.05, 0.65, 0.3). From the filtering process, an unsharp image signal Sus2 is obtained, which is constituted of the same number of image signal components as that in the original image signal Sorg.
- The filtering process described above is carried out on all of the filtering-processed image signals Bk. In the interpolating operation for the filtering-processed image signals Bk, a filter having a length of 3×2k-1 is prepared in accordance with Formula (5). Also, 2k-1 number of picture elements having a value of 0 are inserted between two adjacent picture elements of each filtering-processed image signal Bk, and the size of the filtering-processed image represented by the filtering-processed image signal Bk is thereby enlarged to the same size as that of the original image. Thereafter, the filtering process is carried out on the filtering-processed image signal Bk, which has been obtained from the insertion of the picture elements having a value of 0, by using the filter having a length of 3× 2k-1.
- The filtering process carried out with the filter having a length of 3×2k-1 becomes equivalent to the filtering process, which is carried out by using a filter having a length of 2 or 3 with a period of 2k. From the filtering process, n number of unsharp image signals Susk are obtained. When visible images are reproduced from the unsharp image signals Susk, multi-resolution unsharp images are obtained, which have different levels of resolution, i.e. which have different frequency response characteristics. As described above, even though the length of the filter becomes long, the filtering process becomes substantially equivalent to the filtering process carried out with a filter having a length of 2 or 3. Therefore, even though the length of the filter becomes long, the amount of operations does not become very large. Accordingly, the amount of operations can be kept small, and the multi-resolution unsharp image signals Susk can be obtained quickly.
- In this embodiment, the filtering process is carried out along the x direction and the y direction of the image by using the one-dimensional filter having a length of 3×2k-1. Alternatively, a two-dimensional filter may be prepared previously, the filtering process of each of the filtering-processed images may be carried out by using the two-dimensional filter, and the unsharp image signals Susk may thereby be obtained. In such cases, as the filter used in the filtering process for carrying out the interpolating operation on the filtering-processed image, a (3×2k-1)×(3×2k-1) filter is used. As in cases where the one-dimensional filter described above is used, the filtering process with the two-dimensional filter becomes equivalent to the filtering process, which is carried out by using a 2×2 or 3×3 filter with a period of 2k. Therefore, as in cases where the one-dimensional filter described above is used, even though the size of the filter becomes large, the amount of operations for carrying out the filtering process does not become very large.
- As described above, with the multi-resolution transforming method and apparatus in accordance with the present invention, even if the size of the filter used for the filtering process is not set to be large, the low-resolution images can be obtained in steps. Therefore, the problems can be prevented from occurring in that the amount of operations becomes large due to an increase in the size of the filter. As a result, the unsharp image signals can be obtained quickly. Also, the filtering process is carried out by repeatedly using the same filter. Therefore, it becomes unnecessary to use a plurality of filters having different sizes. Accordingly, it becomes unnecessary to provide a memory having a large capacity for storing the information representing the plurality of filters, and the multi-resolution transforming apparatus can be kept small in size.
- The unsharp image signals Susk having been obtained in the manner described above have the frequency characteristics shown in Figure 11. As illustrated in Figure 11, the unsharp image signals Susk have the frequency characteristics such that the high frequency components of the original image signal Sorg may have been eliminated successively as the value of k becomes large. Examples of an image processing method and apparatus, wherein processing for emphasizing predetermined frequency components of the original image signal is carried out by utilizing the unsharp image signals, will be described hereinbelow.
- Figure 12 is a block diagram showing an example of the image processing apparatus, wherein the multi-resolution transforming apparatus shown in Figure 1 is provided as an unsharp image signal forming means. As illustrated in Figure 12, the image processing apparatus comprises an unsharp image signal forming means 1 for forming multi-resolution unsharp image signal Susk, where k=1 to n, which have different frequency response characteristics, from a received original image signal Sorg. The image processing apparatus also comprises a band-limited image signal forming means 2 for forming a plurality of band-limited image signals from the unsharp image signals Susk, which have been formed by the unsharp image signal forming means 1. The image processing apparatus further comprises a conversion means 3 for carrying out a converting process on at least a single band-limited image signal, which is among the plurality of the band-limited image signals having been formed by the band-limited image signal forming means 2, such that at least a portion of the band-limited image signal may become small. The image processing apparatus still further comprises an integration means 4 for integrating the converted band-limited image signals, which have been obtained from the conversion means 3, and thereby forming an integration signal. The image processing apparatus also comprises a frequency emphasis processing means 5 for multiplying the integration signal by a predetermined emphasis coefficient, adding the resulting product to the original image signal Sorg, and thereby obtaining a processed image signal Sproc, in which the high frequency components of the original image have been emphasized.
- Figure 13 is a block diagram showing the entire constitution of the example of the image processing apparatus. As illustrated in Figure 13, the plurality of the unsharp image signals Susk, which have been formed by the unsharp image signal forming means 1, are then processed in the band-limited image signal forming means 2 and the conversion means 3. Firstly, the band-limited image signals are formed from the original image signal Sorg and the plurality of the unsharp image signals Susk, which have been formed by the unsharp image signal forming means 1. Each of the band-limited image signals is obtained from a subtracter 21, which subtracts the unsharp image signals Susk of two adjacent frequency bands (as for the original image signal Sorg, Sorg and Sus1) from each other. Specifically, the values of Sorg - Sus1, Sus1 - Sus2, ..., SusN-1 - SusN are calculated successively, and the plurality of the band-limited image signals are thereby obtained. Figure 14 shows the frequency characteristics of the band-limited image signals. As illustrated in Figure 14, the band-limited image signals have the frequency characteristics such that they may represent the bands of low frequency components of the original image signal Sorg as the value of k of the unsharp image signal Susk becomes large.
- Thereafter, in the conversion means 3, each of the band-limited image signals is converted in accordance with the level of the band-limited image signal. The conversion of each band-limited image signal is carried out by a converter 22 by utilizing, for example, a function f shown in Figure 15. The function f has the characteristics such that the inclination of the function may be equal to 1 with respect to the band-limited image signal having the absolute value, which is smaller than a threshold value Th1, and such that the inclination of the function may be smaller than 1 with respect to the band-limited image signal having the absolute value, which is larger than the threshold value Th1. The same function may be utilized for the respective band-limited image signals, or different functions may be utilized for the respective band-limited image signals.
- The band-limited image signals, which have been converted with the function f, are fed into an operation device 23, which is provided with the integration means 4 and the frequency emphasis processing means 5 described above. In the operation device 23, the processing is carried out in the manner described below. Firstly, the band-limited image signals, which have been converted with the function f, are integrated, and the integration signal is thereby obtained. In the frequency emphasis processing means 5, the integration signal is multiplied by an emphasis coefficient β, which has a value in accordance with the value of the original image signal Sorg. The resulting product is then added to the original image signal Sorg, and the processed image signal Sproc is thereby obtained.
- The aforesaid processing carried out by the band-limited image signal forming means 2, the conversion means 3, the integration means 4, and the frequency emphasis processing means 5 may be represented by Formula (6) shown below.
- By way of example, the processed image signal Sproc, which has been obtained in the manner described above, has the frequency response characteristics shown in Figure 16. Specifically, the band-limited image signals have the characteristics such that, in a flat region in which the change in the image density of the original image is comparatively small, the absolute value of the signal value of each band-limited image signal may be small in each frequency band. On the other hand, as illustrated in Figure 52, in a region in the vicinity of an edge in the image, at which the image density changes sharply, in cases where the band-limited image signal is of a comparatively low frequency band, i.e. in cases where the size of the unsharp mask used for obtaining the unsharp image signal Susk is comparatively large, the edge in the image is contained in the unsharp mask, which is set for a picture element located in the vicinity of the edge. Therefore, in such cases, the band-limited image signal is affected by the edge, and the absolute value of the signal value of the band-limited image signal becomes comparatively large. In this manner, a portion, which does not constitute the edge in the image, is affected by the image density value of the edge, and an artifact, such as overshoot or undershoot, occurs at the edge portion in the image, which is obtained from the image processing.
- Therefore, the band-limited image signal is converted with the aforesaid function f such that, in cases where the absolute value of the band-limited image signal is larger than the threshold value Th1, the absolute value may become small. The band-limited image signals having thus been converted are integrated, and the obtained integration signal is emphasized with the predetermined emphasis coefficient. The signal concerning the high frequency components, which is to be added to the original image signal Sorg, is thereby obtained.
- Therefore, as illustrated in Figure 16, in the flat region in which no edge is located, the processed image signal Sproc has the frequency characteristics indicated by the solid line. Also, as indicated by the broken line in Figure 16, in the region in the vicinity of an edge, the processed image signal Sproc has the frequency characteristics such that the response with respect to a comparatively low frequency band may become low. Thus the same effects can be obtained as those obtained when the size of the unsharp mask for obtaining the unsharp image signal, i.e. Sus in Formula (1), is set to be smaller than the size of the actual unsharp mask in region in the vicinity of an edge.
- In this manner, the band-limited image signal corresponding to the region in the vicinity of an edge and having a signal value, the absolute value of which is comparatively large, is converted into the signal, which has small influence upon the signal concerning the high frequency components to be added to the original image signal Sorg. Accordingly, in the region in the vicinity of an edge, at which the image density changes sharply, the influence of a signal, which causes an artifact to occur, can be weakened. As a result, an image having no artifact and having good image quality can be obtained from the processing.
- In the example described above, the processed image signal Sproc is obtained with Formula (6). Alternatively, the processed image signal Sproc may be obtained with Formula (7) shown below. Formula (6) and Formula (7) are different in the point described below. Specifically, in Formula (6), the band-limited image signal is obtained by subtracting the signals of two adjacent frequency bands from each other. On the other hand, in Formula (7), the band-limited image signal is obtained by subtracting each of the unsharp image signals Susk of all frequency bands from the original image signal Sorg. The processed image signal Sproc obtained with Formula (7) has the frequency characteristics shown in Figure 17. As illustrated in Figure 17, in the flat region in which no edge is located, the processed image signal Sproc has the frequency characteristics indicated by the solid line. Also, as indicated by the broken line in Figure 17, in the region in the vicinity of an edge, the processed image signal Sproc has the frequency characteristics such that the response with respect to a comparatively low frequency band may become low. Thus the same effects can be obtained as those obtained when the size of the unsharp mask for obtaining the unsharp image signal Susk is set to be smaller than the size of the actual unsharp mask in region in the vicinity of an edge. When the frequency characteristics indicated by the broken line in Figure 17 are compared with those in Figure 16, the response in Figure 17 becomes low over the entire frequency band. Therefore, in the frequency characteristics shown in Figure 17, the response becomes low also in the flat region, which is not located in the vicinity of an edge. Accordingly, the processed image signal Sproc should preferably be obtained with Formula (6). With Formula (6), the response in the flat region does not become low, and only the response in the region in the vicinity of an edge becomes low.
- Also, in the example described above, as illustrated in Figure 15, the function for converting the band-limited image signal is set such that, in cases where the absolute value of the band-limited image signal is larger than the threshold value Th1, the absolute value may become small. Alternatively, for example, as illustrated in Figure 18, the function for converting the band-limited image signal may be set such that, in cases where the absolute value of the band-limited image signal is larger than the threshold value Th1, the absolute value may become small,and such that, in cases where the absolute value of the band-limited image signal is smaller than a threshold value Th2, the absolute value may become small.
- In this manner, a correction may be made such that, as the absolute value of the band-limited image signal becomes smaller than the threshold value Th2, which is smaller than the threshold value Th1, the absolute value of the band-limited image signal may be converted to a small value. In such cases, the response with respect to the components, which have a small absolute value of a signal value and may be considered as being noise in the image, can be rendered low. As a result, noise in the processed image can be reduced.
- Further, in the examples described above, the processed image signal Sproc is obtained with Formula (6) or Formula (7). As another alternative, the processed image signal Sproc may be obtained with Formula (8) shown below. Formula (7) and Formula (8) are different in the point described below. Specifically, in Formula (7), the band-limited image signal is obtained by subtracting each of the unsharp image signals Susk of all frequency bands from the original image signal Sorg. On the other hand, in Formula (8), each of the unsharp image signals Susk, where k=2 to N, is subtracted from the unsharp image signal Sus1. The band-limited image signals in Formula (8) have the frequency characteristics shown in Figure 19. As illustrated in Figure 19, the processed image signal Sproc obtained with Formula (8) has the frequency characteristics such that the high frequency components may have been eliminated.
- In the processing carried out with Formula (7), the high frequency components, which can be considered as being noise in the image, are also emphasized, and therefore noise becomes perceptible in the resulting processed image. On the other hand, as illustrated in Figure 19, in the processing carried out with Formula (8), the processed image signal Sproc can be obtained such that the high frequency components may have been eliminated. Therefore, noise is not emphasized, and a processed image having good image quality can be obtained.
- As a further alternative, the processing may be carried out with Formula (9) shown below. In Formula (6) shown above, the band-limited image signal (Sorg - Sus1) is used. On the other hand, in Formula (9), the band-limited image signal (Sorg - Sus1) is not used. As a result, the highest frequency components shown in Figure 14 are eliminated. Therefore, as in the processing carried out with Formula (8), the processed image signal Sproc can be obtained such that the high frequency components may have been eliminated. Accordingly, noise is not emphasized, and a processed image having good image quality can be obtained.
- The frequency band, which is to be used in making a diagnosis, or the like, varies for different portions of the object, the images of which were recorded. For example, as for the images obtained with the double contrast image recording of the lungs and the stomach, the comparatively low frequency components should preferably be emphasized in the lung image, and the comparatively high frequency components should preferably be emphasized in the stomach image such that the patterns of the folds of the walls of the stomach may be viewed. As for images containing patterns of bones or metal members, such as artificial bones, it is necessary to prevent an artifact from occurring due to excessive emphasis of the edges of the bone patterns or the metal member patterns. However, as for the images, which do not contain edges, e.g. those of bones, such as mamma images, and in which an artifact will not occur easily, if the emphasis of frequency components is carried out in the same manner as that for the images containing bone patterns, the image portions, which is to be used in making a diagnosis, will become difficult to view. Therefore, the shape of the function f shown in Figure 15 should preferably be altered in accordance with the portion of the object, the image of which was recorded, or the frequency bands of the band-limited image signals.
- For example, as illustrated in Figure 20, as for the image containing bone patterns, the function f should preferably be set as indicated by B such that the high frequency components of the band-limited image signals may be restricted, and an artifact may be prevented from occurring at an edge. As for the image containing no bone pattern, such as a mamma image, the function f should preferably be set as indicated by A, and the converting process should preferably be carried out such that the high frequency components of the band-limited image signals may also be emphasized, and the absolute values of the band-limited image signals may become large over approximately the entire frequency band.
- As for a chest image, the band-limited image signals should preferably be emphasized over the entire frequency band, and therefore the function f should preferably be altered as shown in Figure 21 in accordance with the frequency bands of the band-limited image signals. As for the double contrast image of the stomach, the high frequency components of the band-limited image signals should preferably be emphasized, and the low frequency components should preferably be restricted. Therefore, the function f should preferably be altered as shown in Figure 22 in accordance with the frequency bands of the band-limited image signals. Figure 23 shows the frequency characteristics of the processed image signal Sproc, which is obtained by converting the band-limited image signals in accordance with the functions f shown in Figure 21. Figure 24 shows the frequency characteristics of the processed image signal Sproc, which is obtained by converting the band-limited image signals in accordance with the functions f shown in Figure 22. As illustrated in Figure 23, as for the chest image, the response is emphasized over approximately the entire frequency band. Also, as illustrated in Figure 24, as for the double contrast image of the stomach, the response with respect to the high frequency band is emphasized to a higher extent than the response with respect to the other frequency bands.
- As described above, as for the chest image, the processing should preferably be carried out such that the response may be emphasized over the entire frequency band. In such cases, the lung field patterns becomes perceptible. Also, as for the double contrast image of the stomach, the processing should preferably be carried out such that the response with respect to the high frequency band may be emphasized. In such cases, the patterns of the folds of the walls of the stomach becomes perceptible. Also, in cases where the processing is carried out such that the absolute values of the band-limited image signals may be changed in accordance with the frequency bands of the band-limited image signals or the portion of the object, the image of which was recorded, an image having good image quality in accordance with the portion of the object, the image of which was recorded, or the frequency bands can be obtained.
- The conversion of the band-limited image signals in the conversion means 3 may be carried out regardless of the aforesaid threshold value Th1 and in accordance with a plurality of functions f1 to fN, which vary for different frequency bands, such that the absolute value of each band-limited image signal may be converted to a value, which is not larger than the absolute value of the band-limited image signal and is determined in accordance with the absolute value of the band-limited image signal. As the functions f1 to fN, a combination of appropriate functions should preferably be set in accordance with the characteristics of the image processing which is to be achieved.
- In the example which is free from the threshold value, the processed image signal Sproc can be adjusted, such that it may have arbitrary frequency characteristics, by varying the functions, which are used in the conversion means 3, for different frequency bands. Therefore, the frequency characteristics of the processed image signal Sproc can be adjusted in accordance with the conditions, which are required for the images to be processed in the respective apparatuses described above.
- Effects obtained by varying the functions for different frequency bands will be described hereinbelow. Figures 29A, 29B, 29C, and 29D are explanatory views showing the problems encountered with the conventional technique, in which the same function is employed as the functions f1 to fN, i.e. in which the band-limited image signals of all frequency bands are converted with the same converting method. In Figures 29A, 29B, 29C, and 29D, the processing in the vicinity of an edge, at which the image density changes sharply, is illustrated in steps. Figure 29A shows a step-like profile of the original image signal and the profiles of the unsharp image signals having been formed from the original image signal. Figure 29B shows the profiles of the band-limited image signals with respect to the signals shown in Figure 29A. Figure 29C shows the profiles of the converted image signals. Figure 29D shows the profile of the signal obtained by integrating the converted image signals.
- As illustrated in Figure 29D, ordinarily, in the signal obtained by integrating the converted image signals, unnatural joints are formed at the boundaries among the frequency bands. The unnatural joints cause a streak-like artifact to occur. In order for such problems to be prevented, the converted image signals must be formed by considering such that the boundaries among the frequency bands may join in a pattern as natural as possible. However, in cases where the function is set to be uniform, arbitrary conversion, in which the influence of the boundaries among the frequency bands is taken into consideration, cannot be carried out on the respective band-limited image signals. As a result, the streak-like artifact cannot be prevented from occurring. On the other hand, in the example where different functions are used for different frequency bands, and the functions are set by considering the boundaries among the frequency bands, the streak-like artifact is prevented from occurring.
- Examples of the functions varying for different frequency bands will be described hereinbelow. Figure 25 shows examples of the functions used for the formation of the band-limited image signals. In Figure 25, the value of the band-limited image signal to be processed is plotted on the horizontal axis, and the value obtained by processing the band-limited image signal is plotted on the vertical axis. Each of the functions illustrated in Figure 25 converts the band-limited image signal such that the absolute value of the band-limited image signal may be converted to a value, which is not larger than the absolute value of the band-limited image signal and is determined in accordance with the absolute value of the band-limited image signal. Also, each of the functions carries out the conversion such that, as for the band-limited image signal, the absolute value of which is larger than a predetermined value, the value of the converted image signal may become approximately equal to a predetermined level. In a function for processing a high frequency band, the aforesaid predetermined value is set to be smaller than those in the other functions.
- In other words, the functions have the characteristics such that each function may pass through the origin, such that the inclination of the function may be equal to at most 1 regardless of the value of the band-limited image signal processed with the function, and such that the inclination of the function may become equal to 0 or may converge to 0 as the absolute value of the signal value of the band-limited image signal processed with the function becomes large. The functions also have the characteristics such that, in a function for processing a high frequency band, the absolute value of the processed signal value, which absolute value is associated with the point in the function where the inclination of the function becomes equal to 0 or a predetermined value close to 0, may take a smaller value than those in the other functions.
- The functions shown in Figure 25 carry out the conversion such that a band-limited image signal having a large amplitude may be restricted, and such that the degree of restriction of a band-limited image signal of a high frequency band may be higher than the degree of restriction of a band-limited image signal of a low frequency band. Such conversion is carried out by considering the feature in that the high frequency components contained in an edge in an actual radiation image have a smaller amplitude than the amplitude of low frequency components. Specifically, even at a very sharp edge in an actual radiation image, the signal does not take a definite step-like profile illustrated in Figure 30A, but the amplitude of the high frequency components becomes smaller than the amplitude of the low frequency components as illustrated in Figure 30B. Therefore, in accordance with the amplitude of the respective frequency components, as for a band-limited image signal having a high frequency, the restriction should preferably be carried out starting with a small amplitude. The functions shown in Figure 25 can achieve such restriction.
- Functions shown in Figure 26 will be described hereinbelow. Each of the functions illustrated in Figure 26 converts the band-limited image signal such that the absolute value of the band-limited image signal may be converted to a value, which is not larger than the absolute value of the band-limited image signal and is determined in accordance with the absolute value of the band-limited image signal. In a function for processing a low frequency band, the absolute value of the converted image signal, that is obtained when the band-limited image signal having a signal value, the absolute value of which falls within a predetermined range close to 0, is converted, takes a value smaller than those in the other functions.
- In other words, the functions have the characteristics such that each function may pass through the origin, and such that the inclination of the function may be equal to at most 1 regardless of the value of the band-limited image signal processed with the function. The functions also have the characteristics such that, in a function for processing a low frequency band, the inclination of the function in the region, in which the absolute value of the band-limited image signal is close to 0, may be smaller than those in the other functions.
- These functions have the effects described below. Specifically, when the integration signal shown in Figure 29D, which has been obtained by integrating the converted image signals, is added to the original image signal Sorg, the joint between the original image signal Sorg and the integration signal can be formed in a natural pattern. More specifically, the rise of the signal can be rendered natural.
- Figure 27 is a graph showing examples of functions, which have both of the characteristics of the functions shown in Figure 25 and the characteristics of the functions shown in Figure 26. With the functions shown in Figure 27, both of the effects of the functions shown in Figure 25 and the effects of the functions shown in Figure 26 can be obtained.
- As described above, in the examples where the functions used for the respective frequency bands are varied in accordance with the characteristics of the image processing which is to be achieved, the frequency characteristics of the entire frequency band can be adjusted appropriately. Figures 28A-1, 28B-1, 28C-1 and Figures 28A-2, 28B-2, 28C-2 show examples of the effects obtained. Figures 28A-1, 28B-1, and 28C-1 show the frequency characteristics of the signals of the respective frequency bands having been formed by the examples. Figures 28A-2, 28B-2, and 28C-2 show the frequency characteristics with respect to the entire frequency band, which correspond respectively to Figures 28A-1, 28B-1, and 28C-1. The frequency characteristics shown in Figures 28A-1 and 28A-2 are obtained when a function having an inclination of 1 is set for all of the frequency bands. The frequency characteristics shown in Figures 28B-1 and 28B-2 are obtained when the inclination of the function is set to be small for a low frequency band. The frequency characteristics shown in Figures 28C-1 and 28C-2 are obtained when the inclination of the function is set to be 1 for a specific frequency band and is set to be smaller than 1 for the other frequency bands such that band pass frequency characteristics may be obtained as a whole. The example shown in Figures 28C-1 and 28C-2 is useful when, for example, only the information of a specific frequency band is to be obtained.
- In the aforesaid examples wherein the signal value larger than the aforesaid threshold value is restricted, and in the aforesaid embodiments wherein the entire signal value is restricted regardless of a threshold value, the converting process carried out by the conversion means 3 may be varied in accordance with the value of the emphasis coefficient β. The effects obtained in such cases will be described hereinbelow by taking the processing with functions, which are free from the threshold value, as an example.
- Specifically, in cases where the value of the emphasis coefficient β is comparatively small, as the functions f1 to fN, the functions shown in Figure 31 are used. Also, in cases where the value of the emphasis coefficient β is large, as the functions f1 to fN, the functions shown in Figure 32 are used. In Figures 31 and 32, "high" represents the function used for the conversion of a band-limited image signal of a high frequency band, and "low" represents the function used for the conversion of a band-limited image signal of a low frequency band.
- The functions shown in Figures 31 and 32 restrict each band-limited image signal such that it may become smaller than the absolute value of the band-limited image signal. In this example, as will be understood when Figures 31 and 32 are compared with each other, the combination of the functions is defined such that, as the value of the emphasis coefficient β becomes large, the difference between the degree of restriction, which is carried out with the function for processing a high frequency band, and the degree of restriction, which is carried out with the function for processing a low frequency band, may become large. Specifically, the function for processing the high frequency band is kept the same regardless of the value of the emphasis coefficient β, and the degree of restriction, which is carried out with the function for processing the low frequency band, is set to be high as the value of the emphasis coefficient β becomes large. Alternatively, the function for processing the low frequency band is kept the same regardless of the value of the emphasis coefficient β, and the degree of restriction, which is carried out with the function for processing the high frequency band, may be changed. As another alternative, all of the functions may be changed such that the difference in the degree of restriction may become large.
- Figure 33 shows the response of the image signal, in which the high frequency components have been emphasized with the combination of the functions shown in Figure 31. Figure 34 shows the response of the image signal, in which the high frequency components have been emphasized with the combination of the functions shown in Figure 32. From Figures 33 and 34, it will be found that, in cases where the value of the emphasis coefficient β is large, only the degree of emphasis of the high frequency components becomes high, and the degree of emphasis of the low frequency components is kept approximately the same as when the value of the emphasis coefficient β is small.
- In cases where the combination of the functions is determined regardless of the emphasis coefficient β, if the value of the emphasis coefficient is set to be large, the degree of emphasis will become high for all of the frequency bands. In general, the value of the emphasis coefficient is set to be large such that the high frequency components carrying a small amount of information may be emphasized. However, in such cases, the low frequency components are also emphasized. As a result, the level of contrast becomes very high, and an artifact will occur. On the other hand, in cases where the combination of the functions is set as shown in Figure 32 such that, even if the value of the emphasis coefficient β is set to be large, the degree of emphasis of the low frequency components may not change very much, an artifact can be prevented from occurring.
- In Figure 31, a single set of functions are shown which may be used when the value of the emphasis coefficient β is small. Also, in Figure 32, a single set of functions are shown which may be used when the value of the emphasis coefficient β is large. However, the examples shown in Figures 31 and 32 do not mean that only two sets of the functions are used, but merely illustrate how the characteristics of the functions may be changed in accordance with a change in the value of the emphasis coefficient β. Therefore, it is also possible to classify the extent of the change in the value of the emphasis coefficient β into several different levels, and to determine a set of functions in accordance with each of the classified levels. In cases where such levels are set finely, an image having better image quality can be obtained.
- In the example described above, the non-linear functions are determined on the basis of the consideration in that the value of the emphasis coefficient is set to be large in order for only the high frequency components to be emphasized. However, the effects, which should be obtained from the changing of the value of the emphasis coefficient, are not limited to the emphasis of the high frequency components. Therefore, as the non-linear functions, various functions may be utilized in accordance with the effects, which are to be obtained. In the aforesaid example, as the non-linear functions, sets of the plurality of non-linear functions varying for different frequency bands are employed. However, the effects can also be obtained when a single same non-linear function is employed for all of the frequency bands, depending upon the effects, which are to be obtained from the changing of the value of the emphasis coefficient.
- A different of an image processing method and apparatus will be described hereinbelow. In this example, the processes carried out by the unsharp image signal forming means 1, the band-limited image signal forming means 2, the integration means 4, and the frequency emphasis processing means 5 are the same as those in the aforesaid example shown in Figure 12. Therefore, only the process carried out by the conversion means 3 will be described hereinbelow.
- Figure 35 is a block diagram showing this example of the image processing apparatus. As in the aforesaid example, the band-limited image signals are formed from the original image signal Sorg and the plurality of the unsharp image signals Susk, which have been formed by the unsharp image signal forming means 1. Each of the band-limited image signals is obtained from the subtracter 21, which subtracts the unsharp image signals Susk of two adjacent frequency bands (as for the original image signal Sorg, Sorg and Sus1) from each other. Specifically, the values of Sorg - Sus1, Sus1 - Sus2, ..., SusN-1 - SusN are calculated successively, and the plurality of the band-limited image signals are thereby obtained. In this example, for example, as for the band-limited image signal Sus1 - Sus2, the signal Sus2 - Sus3 is employed as the corresponding auxiliary image signal. Therefore, a single means substantially serves as the band-limited image signal forming means and an auxiliary image signal forming means. Specifically, the signal, which has been formed by the band-limited image signal forming means, is processed as the band-limited image signal and is also processed as the auxiliary image signal corresponding to the adjacent band-limited image signal.
- Thereafter, each of the band-limited image signals having thus been obtained is converted in the conversion means 3. The conversion is carried out on each band-limited image signal by using the converter 22 and a converter 24 shown in Figure 35. In the converter 22, the converting process is carried out by using one of the functions f1 to fN for the respective frequency bands, and a restricted image signal is thereby obtained. In the converter 24, a converting process is carried out by using a function g, and a magnification ratio signal is thereby obtained. In a multiplier 25, the restricted image signal is multiplied by the magnification ratio signal. The conversion is carried out in this manner. In such cases, as illustrated in Figure 35, the signals of two adjacent frequency bands are multiplied by each other. For example, the restricted image signal, which has been obtained by converting the band-limited image signal Sus1 - Sus2, and the magnification ratio signal, which has been obtained by converting the auxiliary image signal Sus2 - Sus3, are multiplied by each other. The converter 22 for carrying out the conversion with the function fk corresponds to a restricted image signal forming means. The converter 24 for carrying out the conversion with the function g corresponds to a magnification ratio signal forming means. Also, the multiplier 25 for multiplying the output signals, which have been obtained from the converters 22 and 24, by each other corresponds to a multiplication means.
- The functions f1 to fN may be identical with one another or may be different from one another. They may be set arbitrarily in accordance with the characteristics of the image processing which is to be carried out. In this example, as the functions f1 to fN, the functions are used, each of which restricts the band-limited image signal such that it may become smaller than the absolute value of the band-limited image signal, and which vary for different frequency bands. By way of example, the functions shown in Figure 25 are used.
- As the function g, for example, a function shown in Figure 36 may be used. With the function g shown in Figure 36, the auxiliary image signal is converted such that a converted value close to 1 may be obtained when the absolute value of the auxiliary image signal is small and such that, as the absolute value of the auxiliary image signal becomes large, a converted value close to 0 may be obtained. In Figure 36, K represents the minimum value of the absolute value of the auxiliary image signal among the values, for which the converted values become equal to 0.
- The converted image signals, which have been obtained from the conversion means 3, are fed into the operation device 23, which is provided with the integration means 4 and the frequency emphasis processing means 5. In the operation device 23, the processing is carried out in the manner described below. Firstly, the plurality of the converted image signals are integrated, and the integration signal is thereby obtained. The integration signal is multiplied by an emphasis coefficient β, which has a value determined in accordance with the value of the original image signal Sorg. The resulting product is then added to the original image signal Sorg, and the processed image signal Sproc is thereby obtained. This process and the other processes described above may be represented by Formula (10) shown below.
- Figures 37A, 37B, 37C, 37D, and 37E show the effects obtained when an image signal corresponding to a region in the vicinity of an edge in the image is processed in the embodiment of Figure 35. Figure 37A shows a step-like profile of the original image signal, which corresponds to the region in the vicinity of an edge in the image, and the profiles of the unsharp image signals having been formed from the original image signal. Figure 37B shows the profile of the band-limited image signal with respect to the signals shown in Figure 37A. Figure 37C shows the profile of the auxiliary image signal containing the signal of the frequency band, which is lower by a single level than the frequency band of the band-limited image signal shown in Figure 37B. Figure 37D shows the profile of the magnification ratio signal, which is obtained when the auxiliary image signal shown in Figure 37C is processed with the function g. Figure 37E shows the profile of the processed signal, which is obtained when the restricted image signal having been obtained by processing the band-limited image signal shown in Figure 37B with the function f is multiplied by the magnification ratio signal shown in Figure 37D. The value K shown in Figure 37C is identical with the value K shown in Figure 36. It is illustrated that, when the value of the auxiliary image signal shown in Figure 37C becomes equal to K, the value of the magnification ratio signal shown in Figure 37D becomes equal to 0. If the band-limited image signal shown in Figure 37B is converted merely such that its absolute value may become small, the shape of the peak of the signal will become smooth, but the rise portion of the signal will be kept sharp. On the other hand, in the processed signal shown in Figure 37E, its rise portion is smooth. In cases where the rise portion of each band-limited image signal is thus rendered smooth, a step-like artifact can be prevented from occurring at the boundaries among the frequency bands in the signal, which is obtained by integrating the band-limited image signals.
- The auxiliary image signals, which are processed with the function g, are not limited to those described above. In a different example of an image processing apparatus, the image processing is carried out with Formula (11) shown below.
- Figures 38A-1, 38B-1, 38C-1, 38D-1, and 38E-1 show the effects obtained when an image signal corresponding to a region in the vicinity of an edge in the image, which edge has a high level of contrast, is processed in the embodiment utilizing Formula (11). Figure 38A-1 shows a step-like profile of the original image signal, which corresponds to the region in the vicinity of an edge in the image, and the profiles of the unsharp image signals having been formed from the original image signal. Figure 38B-1 shows the profile of the band-limited image signal with respect to the signals shown in Figure 38A-1. Figure 38C-1 shows the profile of the auxiliary image signal containing the signal of the frequency band, which is lower by a single level than the frequency band of the band-limited image signal shown in Figure 38B-1. Figure 38D-1 shows the profile of the magnification ratio signal, which is obtained when the auxiliary image signal shown in Figure 38C-1 is processed with the function g. Figure 38E-1 shows the profile of the processed image signal, which is obtained when the restricted image signal having been obtained by processing the band-limited image signal shown in Figure 38B-1 with the function f is multiplied by the magnification ratio signal shown in Figure 38D-1. Figures 38A-2, 38B-2, 38C-2, 38D-2, and 38E-2 show the effects obtained when an image signal corresponding to a region in the vicinity of an edge in the image, which edge has a low level of contrast, is processed in the example utilizing Formula (11). Figures 38A-2, 38B-2, 38C-2, 38D-2, and 38E-2 are the views respectively similar to Figures 38A-1, 38B-1, 38C-1, 38D-1, and 38E-1. As illustrated in these figures, in cases where the value of Sorg - Susk is used as the value to be processed with the function g, the signal obtained from the conversion becomes small as for the edge having a high level of contrast. As for the edge having a high level of contrast, the signal obtained from the conversion has a level close to the level of the original band-limited image signal.
- The signals obtained from the conversion are then integrated, and the integration signal thus obtained is added to the original image signal Sorg for the purposes of emphasis. In such cases, the effects can be obtained such that the edge having a high level of contrast may not be emphasized strongly, and the edge having a low level of contrast is emphasized more strongly than the edge having the high level of contrast.
- The two kinds of the formulas have the effects described above. Various modifications are possible as for the functions f and g and how the band-limited image signal, which is to be processed with the function g, is formed.
- A further different example of an image processing method and apparatus will be described hereinbelow. In this embodiment, the processes carried out by the unsharp image signal forming means 1, the band-limited image signal forming means 2, the integration means 4, and the frequency emphasis processing means 5 are the same as those in the aforesaid example shown in Figure 12. Therefore, only the process carried out by the conversion means 3 will be described hereinbelow.
- Figure 39 is a block diagram showing this example of the image processing apparatus. As in the aforesaid example, the band-limited image signals are formed from the original image signal Sorg and the plurality of the unsharp image signals Susk, which have been formed by the unsharp image signal forming means 1. Each of the band-limited image signals is obtained from the subtracter 21, which subtracts the unsharp image signals Susk of two adjacent frequency bands (as for the original image signal Sorg, Sorg and Sus1) from each other. Specifically, the values of Sorg - Sus1, Sus1 - Sus2, ..., SusN-1 - SusN are calculated successively, and the plurality of the band-limited image signals are thereby obtained.
- Thereafter, each of the band-limited image signals having thus been obtained is converted in the conversion means 3. As illustrated in Figure 39, in the conversion means 3, a band-limited image signal to be converted, which is of a certain frequency band, and a signal (i.e., an auxiliary image signal), which has been obtained by converting a low frequency side band-limited image signal of a frequency band, that is lower by a single level than the frequency band of the band-limited image signal to be converted, with a function g in the converter 24, are added to each other. In this manner, a composite band-limited image signal is obtained. The composite band-limited image signal having been obtained from the addition is then converted with a function fk in the converter 22. The converter 24 for carrying out the conversion with the function g corresponds to an auxiliary image signal forming means, and an adder 26 corresponds to a composite band-limited image signal forming means.
- As the function g, for example, the function shown in Figure 40 may be employed. The function g shown in Figure 40 has the characteristics such that the function may pass through the origin, such that the inclination of the function at the origin may be equal to approximately 0, such that the inclination of the function may increase gradually as the value to be processed becomes large, and such that the inclination of the function may ultimately become equal to approximately 1. Specifically, with this function, the degree of restriction is set to be high when the level of the signal to be processed is low. Also, as the level of the signal to be processed becomes high, the degree of restriction is set to be low. In the processing described above, the portion of this function, at which the inclination increases gradually from the origin, affects the wave form of the rise portion of the auxiliary image signal. Specifically, in cases where the conversion is carried out with this function, a sharp rise portion can be rendered smooth. The level of the actual band-limited image signal is limited, and therefore any of functions, the inclination of which increases gradually from 0 in the region in the vicinity of the origin, may be employed as the function g. For example, a function shown in Figure 41 may also be employed. In this example, signal amplification is not carried out, and therefore the inclination of the function is set to be at most 1. However, the effects are obtained from the gradual increase of the inclination of the function in the region in the vicinity of the origin. Therefore, in so far as the inclination of the function in the region in the vicinity of the origin increases gradually, the inclination of the function need not necessarily be limited to at most 1.
- The functions f1 to fN, which are used in this example, may be identical with one another or may be different from one another. They may be set arbitrarily in accordance with the characteristics of the image processing which is to be carried out. In this example, as the functions f1 to fN, by way of example, the functions shown in Figure 25 are used.
- The converted image signals, which have been obtained from the conversion means 3, are fed into the operation device 23, which is provided with the integration means 4 and the frequency emphasis processing means 5. In the operation device 23, the processing is carried out in the manner described below. Firstly, the plurality of the converted image signals are integrated, and the integration signal is thereby obtained. The integration signal is multiplied by an emphasis coefficient β, which has a value determined in accordance with the value of the original image signal Sorg. The resulting product is then added to the original image signal Sorg, and the processed image signal Sproc is thereby obtained. This process and the other processes described above may be represented by Formula (12) shown below.
- Figures 42A, 42B, 42C, 42D, 42E, and 42F show the effects obtained when an image signal corresponding to a region in the vicinity of an edge in the image is processed in the embodiment of Figure 39. Figure 42A shows a step-like profile of the original image signal, which corresponds to the region in the vicinity of an edge in the image, and the profiles of the unsharp image signals having been formed from the original image signal. Figures 42B 42C show the profiles of the band-limited image signals with respect to the signals shown in Figure 42A. In cases where the band-limited image signal shown in Figure 42B is taken as the band-limited image signal to be converted, the band-limited image signal shown in Figure 42C is taken as the low frequency side band-limited image signal. Figure 42D shows the profile of the auxiliary image signal, which is obtained when the low frequency side band-limited image signal shown in Figure 42C is processed with the function g. Figure 42E shows the profile of the composite band-limited image signal, which is obtained by adding the band-limited image signal to be converted, that is shown in Figure 42B, and the auxiliary image signal, which is shown in Figure 42D, to each other. Figure 42F shows the profile of the converted image signal, which is obtained by processing the composite band-limited image signal of Figure 42E with the function f. If the band-limited image signal shown in Figure 42B is converted merely such that its absolute value may become small, the shape of the peak of the signal will become smooth, but the rise portion of the signal will be kept sharp. On the other hand, in the converted image signal of Figure 42F, its rise portion is smooth. In cases where the rise portion of each band-limited image signal is thus rendered smooth, a step-like artifact can be prevented from occurring at the boundaries among the frequency bands in the signal, which is obtained by integrating the band-limited image signals.
- In this example, various modifications are possible as for, for example, the functions f and g.
Claims (2)
- A method of forming unsharp images, wherein an original image constituted of a lattice-like array of picture elements, which are located at predetermined intervals along the rows and columns of the lattice-like array, is transformed into a plurality of images having different frequency response characteristics, the method comprising the steps of:i) carrying out a filtering process on the original image, the filtering process being carried out by using a filter having a predetermined size and with respect to each of picture elements selected at predetermined intervals, a first filtering-processed image being thereby obtained,ii) carrying out said filtering process on said first filtering-processed image, a second filtering-processed image being thereby obtained,iii) successively carrying out said filtering process on the respective filtering-processed images, which are thus obtained successively, the original image being thereby transformed into a plurality of images having different levels of resolution, andiv) carrying out an interpolating operation process on each of the plurality of said images having different levels of resolution, whereby unsharp images having different frequency response characteristics, each of which is constituted of the same number of picture elements as that of the picture elements constituting the original image, are obtained.
- An apparatus for forming unsharp images, wherein an original image constituted of a lattice-like array of picture elements, which are located at predetermined intervals along the rows and columns of the lattice-like array, is transformed into a plurality of images having different frequency response characteristics, the apparatus comprising:i) a filtering means for transforming the original image into a plurality of images having different levels of resolution by:carrying out a filtering process on the original image, the filtering process being carried out by using a filter having a predetermined size and with respect to each of picture elements selected at predetermined intervals, a first filtering-processed image being thereby obtained,carrying out said filtering process on said first filtering-processed image, a second filtering-processed image being thereby obtained, andsuccessively carrying out said filtering process on the respective filtering-processed images, which are thus obtained successively, andii) an interpolating operation means for carrying out an interpolating operation process on each of the plurality of said images having different levels of resolution, and thereby obtaining unsharp images having different frequency response characteristics, each of which is constituted of the same number of picture elements as that of the picture elements constituting the original image.
Priority Applications (2)
| Application Number | Priority Date | Filing Date | Title |
|---|---|---|---|
| EP01118152A EP1168243B1 (en) | 1995-09-29 | 1996-09-27 | Image processing method and apparatus |
| EP01118156A EP1156451B1 (en) | 1995-09-29 | 1996-09-27 | Image processing method and apparatus |
Applications Claiming Priority (33)
| Application Number | Priority Date | Filing Date | Title |
|---|---|---|---|
| JP25208995 | 1995-09-29 | ||
| JP252089/95 | 1995-09-29 | ||
| JP25208895 | 1995-09-29 | ||
| JP25209095 | 1995-09-29 | ||
| JP252090/95 | 1995-09-29 | ||
| JP25208995 | 1995-09-29 | ||
| JP25208895 | 1995-09-29 | ||
| JP252088/95 | 1995-09-29 | ||
| JP25209095 | 1995-09-29 | ||
| JP32312195 | 1995-12-12 | ||
| JP323121/95 | 1995-12-12 | ||
| JP32312195 | 1995-12-12 | ||
| JP16906396 | 1996-06-28 | ||
| JP169062/96 | 1996-06-28 | ||
| JP169064/96 | 1996-06-28 | ||
| JP16906296 | 1996-06-28 | ||
| JP16906596 | 1996-06-28 | ||
| JP169063/96 | 1996-06-28 | ||
| JP16906296 | 1996-06-28 | ||
| JP16906496 | 1996-06-28 | ||
| JP169065/96 | 1996-06-28 | ||
| JP16906596 | 1996-06-28 | ||
| JP16906396 | 1996-06-28 | ||
| JP16906496 | 1996-06-28 | ||
| JP17249896 | 1996-07-02 | ||
| JP172498/96 | 1996-07-02 | ||
| JP17249896A JP4014671B2 (en) | 1995-09-29 | 1996-07-02 | Multi-resolution conversion method and apparatus |
| JP18215596A JP3816151B2 (en) | 1995-09-29 | 1996-07-11 | Image processing method and apparatus |
| JP18215596 | 1996-07-11 | ||
| JP18215696A JP3738788B2 (en) | 1995-09-29 | 1996-07-11 | Image dynamic range compression processing method and apparatus |
| JP18215696 | 1996-07-11 | ||
| JP182156/96 | 1996-07-11 | ||
| JP182155/96 | 1996-07-11 |
Related Child Applications (2)
| Application Number | Title | Priority Date | Filing Date |
|---|---|---|---|
| EP01118152A Division EP1168243B1 (en) | 1995-09-29 | 1996-09-27 | Image processing method and apparatus |
| EP01118156A Division EP1156451B1 (en) | 1995-09-29 | 1996-09-27 | Image processing method and apparatus |
Publications (3)
| Publication Number | Publication Date |
|---|---|
| EP0766202A2 EP0766202A2 (en) | 1997-04-02 |
| EP0766202A3 EP0766202A3 (en) | 1998-01-14 |
| EP0766202B1 true EP0766202B1 (en) | 2002-12-18 |
Family
ID=27582216
Family Applications (3)
| Application Number | Title | Priority Date | Filing Date |
|---|---|---|---|
| EP96115572A Expired - Lifetime EP0766202B1 (en) | 1995-09-29 | 1996-09-27 | Image processing method and apparatus |
| EP01118156A Expired - Lifetime EP1156451B1 (en) | 1995-09-29 | 1996-09-27 | Image processing method and apparatus |
| EP01118152A Expired - Lifetime EP1168243B1 (en) | 1995-09-29 | 1996-09-27 | Image processing method and apparatus |
Family Applications After (2)
| Application Number | Title | Priority Date | Filing Date |
|---|---|---|---|
| EP01118156A Expired - Lifetime EP1156451B1 (en) | 1995-09-29 | 1996-09-27 | Image processing method and apparatus |
| EP01118152A Expired - Lifetime EP1168243B1 (en) | 1995-09-29 | 1996-09-27 | Image processing method and apparatus |
Country Status (2)
| Country | Link |
|---|---|
| US (1) | US5991457A (en) |
| EP (3) | EP0766202B1 (en) |
Families Citing this family (52)
| Publication number | Priority date | Publication date | Assignee | Title |
|---|---|---|---|---|
| JP4035216B2 (en) * | 1997-12-25 | 2008-01-16 | キヤノン株式会社 | Image processing method and image processing apparatus |
| US6678420B1 (en) | 1998-06-19 | 2004-01-13 | Fuji Photo Film Co., Ltd. | Method, apparatus and recording medium for image processing |
| US6285798B1 (en) * | 1998-07-06 | 2001-09-04 | Eastman Kodak Company | Automatic tone adjustment by contrast gain-control on edges |
| EP1513102A3 (en) * | 1998-07-06 | 2006-07-05 | Eastman Kodak Company | Automatic tone adjustment by contrast gain-control on edges |
| EP1020816B1 (en) | 1999-01-14 | 2005-08-31 | Fuji Photo Film Co., Ltd. | Method of and system for image processing and recording medium for carrying out the method |
| EP1059811A2 (en) | 1999-06-10 | 2000-12-13 | Fuji Photo Film Co., Ltd. | Method and system for image processing, and recording medium |
| US6546124B1 (en) * | 1999-07-02 | 2003-04-08 | General Electric Company | Method and apparatus for performing an adaptive extended dynamic range algorithm |
| US7460157B2 (en) * | 2000-02-02 | 2008-12-02 | Fujifilm Corporation | Image storing-transferring method and apparatus, image processing method, image processing system, and image processor |
| JP3999432B2 (en) * | 2000-02-08 | 2007-10-31 | 富士フイルム株式会社 | Image processing method and apparatus, and recording medium |
| US6741739B1 (en) * | 2000-05-03 | 2004-05-25 | Itt Manufacturing Enterprises | Method and apparatus for improving signal to noise ratio using wavelet decomposition and frequency thresholding |
| EP1223553A3 (en) * | 2000-10-17 | 2003-09-24 | Fuji Photo Film Co., Ltd. | Apparatus for suppressing noise by adapting filter characteristics to input image signal based on characteristics of input image signal |
| JP2002123816A (en) * | 2000-10-18 | 2002-04-26 | Fuji Photo Film Co Ltd | Tomographic image processing method, device, and storage medium |
| EP1217826A3 (en) * | 2000-12-19 | 2005-05-25 | Konica Corporation | Image processing apparatus |
| JP3848082B2 (en) * | 2000-12-27 | 2006-11-22 | キヤノン株式会社 | X-ray imaging apparatus and method, control apparatus and method |
| JPWO2002084997A1 (en) * | 2001-04-11 | 2004-08-05 | ソニー株式会社 | Edge enhancement device |
| JP3754933B2 (en) | 2001-06-19 | 2006-03-15 | キヤノン株式会社 | Image processing apparatus, image processing system, image processing method, program, and storage medium |
| US7064740B2 (en) | 2001-11-09 | 2006-06-20 | Sharp Laboratories Of America, Inc. | Backlit display with improved dynamic range |
| US20030231321A1 (en) * | 2002-03-25 | 2003-12-18 | Tatsuya Aoyama | Method of and system for image processing, method of and apparatus for image generation, and computer program |
| US6937775B2 (en) * | 2002-05-15 | 2005-08-30 | Eastman Kodak Company | Method of enhancing the tone scale of a digital image to extend the linear response range without amplifying noise |
| US7181086B2 (en) * | 2002-06-06 | 2007-02-20 | Eastman Kodak Company | Multiresolution method of spatially filtering a digital image |
| US7149335B2 (en) * | 2002-09-27 | 2006-12-12 | General Electric Company | Method and apparatus for enhancing an image |
| US7043090B2 (en) * | 2002-10-02 | 2006-05-09 | Eastman Kodak Company | Enhancing the tonal characteristics of digital images using expansive and compressive tone scale functions |
| US7280703B2 (en) * | 2002-11-14 | 2007-10-09 | Eastman Kodak Company | Method of spatially filtering a digital image using chrominance information |
| US20070003167A1 (en) * | 2003-06-04 | 2007-01-04 | Koninklijke Philips Electronics N.V. | Interpolation of images |
| JP3870173B2 (en) * | 2003-06-11 | 2007-01-17 | キヤノン株式会社 | Image processing method, image processing apparatus, program, and computer recording medium |
| US7672528B2 (en) * | 2003-06-26 | 2010-03-02 | Eastman Kodak Company | Method of processing an image to form an image pyramid |
| US7580158B2 (en) * | 2003-08-28 | 2009-08-25 | Fujifilm Corporation | Image processing apparatus, method and program |
| EP1667064A4 (en) * | 2003-09-11 | 2009-06-10 | Panasonic Corp | Visual processing device, visual processing method, visual processing program, and semiconductor device |
| US20070109447A1 (en) * | 2003-09-11 | 2007-05-17 | Haruo Yamashita | Visual processing device, visual processing method, visual processing program, and semiconductor device |
| WO2005027040A1 (en) * | 2003-09-11 | 2005-03-24 | Matsushita Electric Industrial Co., Ltd. | Image processing apparatus, image processing method, and image processing program |
| EP1667066B1 (en) * | 2003-09-11 | 2020-01-08 | Panasonic Intellectual Property Corporation of America | Visual processing device, visual processing method, visual processing program, integrated circuit, display device, imaging device, and mobile information terminal |
| JP4455897B2 (en) * | 2004-02-10 | 2010-04-21 | 富士フイルム株式会社 | Image processing method, apparatus, and program |
| US7602369B2 (en) | 2004-05-04 | 2009-10-13 | Sharp Laboratories Of America, Inc. | Liquid crystal display with colored backlight |
| US7777714B2 (en) | 2004-05-04 | 2010-08-17 | Sharp Laboratories Of America, Inc. | Liquid crystal display with adaptive width |
| US8395577B2 (en) | 2004-05-04 | 2013-03-12 | Sharp Laboratories Of America, Inc. | Liquid crystal display with illumination control |
| US7872631B2 (en) | 2004-05-04 | 2011-01-18 | Sharp Laboratories Of America, Inc. | Liquid crystal display with temporal black point |
| US7898519B2 (en) | 2005-02-17 | 2011-03-01 | Sharp Laboratories Of America, Inc. | Method for overdriving a backlit display |
| US8050511B2 (en) | 2004-11-16 | 2011-11-01 | Sharp Laboratories Of America, Inc. | High dynamic range images from low dynamic range images |
| US8050512B2 (en) | 2004-11-16 | 2011-11-01 | Sharp Laboratories Of America, Inc. | High dynamic range images from low dynamic range images |
| DE102005003227A1 (en) * | 2005-01-24 | 2006-08-03 | Siemens Ag | Method for reducing clustering artifacts in ConeBeam CT image data sets |
| US9143657B2 (en) | 2006-01-24 | 2015-09-22 | Sharp Laboratories Of America, Inc. | Color enhancement technique using skin color detection |
| US8121401B2 (en) | 2006-01-24 | 2012-02-21 | Sharp Labortories of America, Inc. | Method for reducing enhancement of artifacts and noise in image color enhancement |
| US8941580B2 (en) | 2006-11-30 | 2015-01-27 | Sharp Laboratories Of America, Inc. | Liquid crystal display with area adaptive backlight |
| US8824831B2 (en) | 2007-05-25 | 2014-09-02 | Qualcomm Technologies, Inc. | Advanced noise reduction in digital cameras |
| US7983503B2 (en) * | 2007-05-25 | 2011-07-19 | Zoran Corporation | Advanced noise reduction in digital cameras |
| US8330768B2 (en) | 2007-07-27 | 2012-12-11 | Sharp Laboratories Of America, Inc. | Apparatus and method for rendering high dynamic range images for standard dynamic range display |
| JP5083138B2 (en) * | 2008-09-12 | 2012-11-28 | 株式会社ニコン | Image classification device |
| JP5672527B2 (en) * | 2010-09-01 | 2015-02-18 | パナソニックIpマネジメント株式会社 | Image processing apparatus and image processing method |
| EP2535872A1 (en) * | 2011-06-15 | 2012-12-19 | Fujifilm Corporation | Radiographic imaging system |
| US8873877B2 (en) * | 2011-11-01 | 2014-10-28 | Dolby Laboratories Licensing Corporation | Adaptive false contouring prevention in layered coding of images with extended dynamic range |
| IN2014DN05834A (en) * | 2012-03-27 | 2015-05-15 | Hitachi Medical Corp | |
| JP5519753B2 (en) * | 2012-09-28 | 2014-06-11 | 富士フイルム株式会社 | Tomographic image generating apparatus and method |
Family Cites Families (21)
| Publication number | Priority date | Publication date | Assignee | Title |
|---|---|---|---|---|
| US4315318A (en) * | 1978-12-26 | 1982-02-09 | Fuji Photo Film Co., Ltd. | Method and apparatus for processing a radiation image |
| US4317179A (en) * | 1978-12-26 | 1982-02-23 | Fuji Photo Film Co., Ltd. | Method and apparatus for processing a radiographic image |
| US4581535A (en) * | 1981-10-16 | 1986-04-08 | Fuji Photo Film Co., Ltd. | Method of recording X-ray image |
| US4794531A (en) * | 1984-11-07 | 1988-12-27 | Hitachi, Ltd | Unsharp masking for image enhancement |
| US4903205A (en) * | 1985-10-15 | 1990-02-20 | Fuji Photo Film Co. Ltd. | Method and apparatus for displaying radiation image, and method and apparatus for calculating unsharp mask signal used for the same |
| CA1316591C (en) * | 1987-10-20 | 1993-04-20 | Kazuhiro Hishinuma | Method and apparatus for radiation image processing and x-ray image processing |
| EP0356432A4 (en) * | 1988-02-22 | 1990-12-12 | Brandeau, Edward P. | Digital image noise suppression method using svd block transform |
| US5048111A (en) * | 1989-11-06 | 1991-09-10 | Eastman Kodak Company | Hybrid subband-based hierarchical storage and display method for high resolution digital images in a multiuse environment |
| JP2663189B2 (en) * | 1990-01-29 | 1997-10-15 | 富士写真フイルム株式会社 | Image dynamic range compression processing method |
| US5131057A (en) * | 1990-02-12 | 1992-07-14 | Wright State University | Method for video-to-printing image resolution conversion |
| JP2689176B2 (en) * | 1990-03-26 | 1997-12-10 | 富士写真フイルム株式会社 | Tomography image processor |
| DE69214229T2 (en) * | 1991-08-14 | 1997-04-30 | Agfa Gevaert Nv | Method and device for improving the contrast of images |
| US5333065A (en) * | 1991-12-09 | 1994-07-26 | Agfa-Gevaert | Signal to density mapping with controlled contrast |
| JP2849964B2 (en) * | 1991-12-26 | 1999-01-27 | 富士写真フイルム株式会社 | Image processing method and apparatus |
| EP0610604A1 (en) * | 1993-02-11 | 1994-08-17 | Agfa-Gevaert N.V. | Multiple processing of radiographic images based on a pyramidal image decomposition |
| JP3425780B2 (en) * | 1993-03-30 | 2003-07-14 | コニカ株式会社 | Dynamic range compression method for radiographic images |
| US5471987A (en) * | 1993-03-30 | 1995-12-05 | Konica Corporation | Method of compressing a dynamic range for a radiation image |
| JP3434532B2 (en) * | 1993-04-01 | 2003-08-11 | コニカ株式会社 | Dynamic range compression method for radiographic images |
| JP3196864B2 (en) * | 1993-04-19 | 2001-08-06 | 富士写真フイルム株式会社 | Image dynamic range compression processing method |
| US5717789A (en) * | 1993-09-08 | 1998-02-10 | California Institute Of Technology | Image enhancement by non-linear extrapolation in frequency space |
| JPH07299053A (en) * | 1994-04-29 | 1995-11-14 | Arch Dev Corp | Computer diagnosis support method |
-
1996
- 1996-09-27 EP EP96115572A patent/EP0766202B1/en not_active Expired - Lifetime
- 1996-09-27 EP EP01118156A patent/EP1156451B1/en not_active Expired - Lifetime
- 1996-09-27 EP EP01118152A patent/EP1168243B1/en not_active Expired - Lifetime
- 1996-09-30 US US08/723,313 patent/US5991457A/en not_active Expired - Lifetime
Also Published As
| Publication number | Publication date |
|---|---|
| EP0766202A3 (en) | 1998-01-14 |
| EP1156451B1 (en) | 2004-06-02 |
| EP1168243B1 (en) | 2004-06-09 |
| EP1156451A3 (en) | 2002-01-23 |
| EP1168243A2 (en) | 2002-01-02 |
| EP0766202A2 (en) | 1997-04-02 |
| EP1156451A2 (en) | 2001-11-21 |
| US5991457A (en) | 1999-11-23 |
| EP1168243A3 (en) | 2002-01-23 |
Similar Documents
| Publication | Publication Date | Title |
|---|---|---|
| EP0766202B1 (en) | Image processing method and apparatus | |
| US6072913A (en) | Image processing method and apparatus | |
| US5960123A (en) | Method and apparatus for enhancing contrast in images by emphasis processing of a multiresolution frequency band | |
| US6005983A (en) | Image enhancement by non-linear extrapolation in frequency space | |
| US5717789A (en) | Image enhancement by non-linear extrapolation in frequency space | |
| US6069982A (en) | Estimation of frequency dependence and grey-level dependence of noise in an image | |
| US7181086B2 (en) | Multiresolution method of spatially filtering a digital image | |
| US5907642A (en) | Method and apparatus for enhancing images by emphasis processing of a multiresolution frequency band | |
| EP1059811A2 (en) | Method and system for image processing, and recording medium | |
| US20070086671A1 (en) | Image processing apparatus | |
| US7672528B2 (en) | Method of processing an image to form an image pyramid | |
| EP0685800B1 (en) | Method and apparatus for digital signal processing | |
| US5881181A (en) | Method and apparatus for compressing the dynamic range of an image | |
| US5949915A (en) | Image processing method and apparatus | |
| JP4004561B2 (en) | Image processing method and apparatus | |
| US20010026643A1 (en) | Image processing method and system, and storage medium | |
| JPH1063839A (en) | Image processing method and device therefor | |
| US5748799A (en) | Image processing method and apparatus | |
| JP4598115B2 (en) | Image processing method and apparatus, and recording medium | |
| JP4014671B2 (en) | Multi-resolution conversion method and apparatus | |
| US6091519A (en) | Gradation transforming method and apparatus | |
| JP4267159B2 (en) | Image processing method and apparatus, and recording medium | |
| EP0797346A1 (en) | Digital image recording apparatus and method | |
| JP4213337B2 (en) | Image processing method and apparatus, and recording medium | |
| JP2002183726A (en) | Image processing device |
Legal Events
| Date | Code | Title | Description |
|---|---|---|---|
| PUAI | Public reference made under article 153(3) epc to a published international application that has entered the european phase |
Free format text: ORIGINAL CODE: 0009012 |
|
| AK | Designated contracting states |
Kind code of ref document: A2 Designated state(s): BE DE FR GB IT NL SE |
|
| PUAL | Search report despatched |
Free format text: ORIGINAL CODE: 0009013 |
|
| AK | Designated contracting states |
Kind code of ref document: A3 Designated state(s): BE DE FR GB IT NL SE |
|
| 17P | Request for examination filed |
Effective date: 19980703 |
|
| 17Q | First examination report despatched |
Effective date: 19991101 |
|
| GRAG | Despatch of communication of intention to grant |
Free format text: ORIGINAL CODE: EPIDOS AGRA |
|
| RIC1 | Information provided on ipc code assigned before grant |
Free format text: 7G 06T 5/20 A |
|
| RIC1 | Information provided on ipc code assigned before grant |
Free format text: 7G 06T 5/20 A |
|
| GRAG | Despatch of communication of intention to grant |
Free format text: ORIGINAL CODE: EPIDOS AGRA |
|
| GRAH | Despatch of communication of intention to grant a patent |
Free format text: ORIGINAL CODE: EPIDOS IGRA |
|
| GRAH | Despatch of communication of intention to grant a patent |
Free format text: ORIGINAL CODE: EPIDOS IGRA |
|
| GRAH | Despatch of communication of intention to grant a patent |
Free format text: ORIGINAL CODE: EPIDOS IGRA |
|
| GRAA | (expected) grant |
Free format text: ORIGINAL CODE: 0009210 |
|
| AK | Designated contracting states |
Kind code of ref document: B1 Designated state(s): BE DE FR GB IT NL SE |
|
| PG25 | Lapsed in a contracting state [announced via postgrant information from national office to epo] |
Ref country code: IT Free format text: LAPSE BECAUSE OF FAILURE TO SUBMIT A TRANSLATION OF THE DESCRIPTION OR TO PAY THE FEE WITHIN THE PRE;WARNING: LAPSES OF ITALIAN PATENTS WITH EFFECTIVE DATE BEFORE 2007 MAY HAVE OCCURRED AT ANY TIME BEFORE 2007. THE CORRECT EFFECTIVE DATE MAY BE DIFFERENT FROM THE ONE RECORDED.SCRIBED TIME-LIMIT Effective date: 20021218 Ref country code: BE Free format text: LAPSE BECAUSE OF FAILURE TO SUBMIT A TRANSLATION OF THE DESCRIPTION OR TO PAY THE FEE WITHIN THE PRESCRIBED TIME-LIMIT Effective date: 20021218 |
|
| REG | Reference to a national code |
Ref country code: GB Ref legal event code: FG4D |
|
| REF | Corresponds to: |
Ref document number: 69625433 Country of ref document: DE Kind code of ref document: P Date of ref document: 20030130 |
|
| PG25 | Lapsed in a contracting state [announced via postgrant information from national office to epo] |
Ref country code: SE Free format text: LAPSE BECAUSE OF FAILURE TO SUBMIT A TRANSLATION OF THE DESCRIPTION OR TO PAY THE FEE WITHIN THE PRESCRIBED TIME-LIMIT Effective date: 20030318 |
|
| ET | Fr: translation filed | ||
| PG25 | Lapsed in a contracting state [announced via postgrant information from national office to epo] |
Ref country code: GB Free format text: LAPSE BECAUSE OF NON-PAYMENT OF DUE FEES Effective date: 20030927 |
|
| PLBE | No opposition filed within time limit |
Free format text: ORIGINAL CODE: 0009261 |
|
| STAA | Information on the status of an ep patent application or granted ep patent |
Free format text: STATUS: NO OPPOSITION FILED WITHIN TIME LIMIT |
|
| 26N | No opposition filed |
Effective date: 20030919 |
|
| GBPC | Gb: european patent ceased through non-payment of renewal fee |
Effective date: 20030927 |
|
| REG | Reference to a national code |
Ref country code: FR Ref legal event code: TP Ref country code: FR Ref legal event code: CD |
|
| PGFP | Annual fee paid to national office [announced via postgrant information from national office to epo] |
Ref country code: NL Payment date: 20140809 Year of fee payment: 19 Ref country code: DE Payment date: 20140923 Year of fee payment: 19 |
|
| PGFP | Annual fee paid to national office [announced via postgrant information from national office to epo] |
Ref country code: FR Payment date: 20140906 Year of fee payment: 19 |
|
| REG | Reference to a national code |
Ref country code: DE Ref legal event code: R119 Ref document number: 69625433 Country of ref document: DE |
|
| REG | Reference to a national code |
Ref country code: NL Ref legal event code: MM Effective date: 20151001 |
|
| REG | Reference to a national code |
Ref country code: FR Ref legal event code: ST Effective date: 20160531 |
|
| PG25 | Lapsed in a contracting state [announced via postgrant information from national office to epo] |
Ref country code: DE Free format text: LAPSE BECAUSE OF NON-PAYMENT OF DUE FEES Effective date: 20160401 |
|
| PG25 | Lapsed in a contracting state [announced via postgrant information from national office to epo] |
Ref country code: FR Free format text: LAPSE BECAUSE OF NON-PAYMENT OF DUE FEES Effective date: 20150930 Ref country code: NL Free format text: LAPSE BECAUSE OF NON-PAYMENT OF DUE FEES Effective date: 20151001 |