EP0720001B1 - Method for monitoring the position of a fiber - Google Patents
Method for monitoring the position of a fiber Download PDFInfo
- Publication number
- EP0720001B1 EP0720001B1 EP95119165A EP95119165A EP0720001B1 EP 0720001 B1 EP0720001 B1 EP 0720001B1 EP 95119165 A EP95119165 A EP 95119165A EP 95119165 A EP95119165 A EP 95119165A EP 0720001 B1 EP0720001 B1 EP 0720001B1
- Authority
- EP
- European Patent Office
- Prior art keywords
- filament
- light
- spatial frequency
- spatial
- distance
- Prior art date
- Legal status (The legal status is an assumption and is not a legal conclusion. Google has not performed a legal analysis and makes no representation as to the accuracy of the status listed.)
- Expired - Lifetime
Links
Images


Classifications
-
- G—PHYSICS
- G01—MEASURING; TESTING
- G01B—MEASURING LENGTH, THICKNESS OR SIMILAR LINEAR DIMENSIONS; MEASURING ANGLES; MEASURING AREAS; MEASURING IRREGULARITIES OF SURFACES OR CONTOURS
- G01B7/00—Measuring arrangements characterised by the use of electric or magnetic techniques
- G01B7/004—Measuring arrangements characterised by the use of electric or magnetic techniques for measuring coordinates of points
-
- G—PHYSICS
- G01—MEASURING; TESTING
- G01B—MEASURING LENGTH, THICKNESS OR SIMILAR LINEAR DIMENSIONS; MEASURING ANGLES; MEASURING AREAS; MEASURING IRREGULARITIES OF SURFACES OR CONTOURS
- G01B11/00—Measuring arrangements characterised by the use of optical techniques
Definitions
- This invention relates to methods and apparatus for monitoring the position of an optical waveguide fiber or other transparent filament. More generally, the invention relates to methods and apparatus for measuring the distance to an object or to a portion of the surface of an object.
- US-A-5,066,120 which describes a device for testing an optical system, in particular an ophthalmic lens, in which light which has passed through the optical system is passed through a Ronchi ruling before it reaches a detector.
- the present invention provides a further capability to fiber monitoring systems of the type described above, namely, the ability to monitor and thus control the position of the fiber as it is being drawn. Such positional information is needed to keep the fiber centered and to monitor tension in the fiber through the measurement of the temporal frequency of standing waves along the length of the fiber.
- an object of the present invention to provide improved methods and apparatus for monitoring (measuring) the distance to an object, such as an optical waveguide fiber. Further, it is a particular object of an aspect of the invention to provide a position monitor which can be combined with a diameter-defect-coating monitor of the type described above with a minimum addition of hardware.
- the invention provides a method for monitoring the location of a filament comprising the steps of:
- the above method can be used to control the location of a filament by adding the further step of generating a control signal for the location of the filament from the value of ⁇ D .
- the invention further provides an apparatus for measuring the distance to a surface in combination with an object having the said surface, the apparatus comprising:
- the means for determining the spatial frequency ⁇ D of the spatially modulated scattered light at the detecting means can take various forms. For example, this means can perform fringe counting based on peaks, valleys, and/or zero crossings, with the fringe counting being performed directly on the spatial data produced by the detecting means or on spatial data that has been numerically smoothed or filtered.
- the spatial frequency ⁇ D is the number of fringes counted divided by the characteristic dimension of the detecting means, e.g., the length of the detecting means.
- the spatial frequency ⁇ D is determined in the spatial frequency domain by performing a transform, preferably a Fourier transform, of the spatial data produced by the detecting means. Other spatial frequency domain approaches can also be used, if desired, such as a wavelet approach.
- the system includes a lens system between the spatial modulating means and the detecting means, which has a positive optical power.
- the distance between the spatial modulating means and the surface becomes a linear function of ⁇ D .
- the distance measured is that to an optical waveguide fiber and the measurement is used as part of a control system for controlling the drawing of the fiber from a preform.
- the control system preferably also controls fiber diameter and hermetic coating thickness, and monitors the fiber for defects.
- Figure 1 is a schematic diagram illustrating the basic elements of a Watkins-type system for measuring fiber diameters using far-field interference patterns.
- Figure 2 is a schematic diagram illustrating the components of a fiber monitoring and control system with which the present invention can be used.
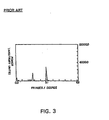
- Figure 3 shows a frequency spectrum of a calculated far-field interference pattern of a 125 micron, coreless fiber containing a 5 micron on-center hole.
- Figure 4 is a schematic diagram of apparatus for practicing the present invention.
- Figure 5 is a schematic diagram illustrating the effects of locating a detector 31 in the back focal plane of a lens system 27.
- Figure 6 is a schematic diagram illustrating the geometric relationships used in determining the relationship between ⁇ M at Ronchi ruling 50 and ⁇ D at detector 31.
- Figures 7 and 8 are stylized drawings of spatial frequency spectra for a defect-free optical waveguide fiber whose position and diameter are monitored using the apparatus of Figure 4.
- the position of the fiber is the same in both figures;
- ⁇ M is about 4.0 cycles/mm in Figure 7 and about 12.3 cycles/mm in Figure 8.
- Figure 9 is a block diagram showing a preferred procedure for generating a spatial frequency spectrum for use in the practice of the present invention.
- Figure 10 illustrates the linearity of a preferred embodiment of the present invention.
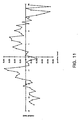
- Figure 11 illustrates the precision of a preferred embodiment of the present invention.
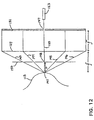
- Figure 12 illustrates the use of the invention to determine the distance "D" to a diffusely reflecting surface 113.
- Figure 4 shows the components of a fiber location monitoring system constructed in accordance with the present invention.
- Fiber 13 is shown at two locations marked A and B in Figure 4.
- Light from the fiber passes through spatial modulating means 50, lens system 27, and is detected by detector 31.
- Detector 31 can be of the type described in the above-referenced U.S. Patent No. 5,309,221.
- Spatial modulating means 50 has a spatial frequency ⁇ M and spatially modulates the light passing through it at that spatial frequency.
- the spatial modulating means can be a mask or similar device having a periodic variation in transmission, phase, or other optical property.
- a preferred form of spatial modulating means 50 is a Ronchi ruling. The following discussion is thus in terms of such a ruling, it being understood that other spatial modulating means can be used if desired.
- a Ronchi ruling consists of alternating opaque and transparent slits, which can be formed, for example, by placing chrome strips on a glass plate. All of the opaque slits have the same width and all of the transparent slits have the same width, but the widths of the opaque and transparent slits do not have to be the same. Accordingly, in addition to its spatial frequency ⁇ M (given by one over the spacing between, for example, transparent slits), a Ronchi ruling is also characterized by its duty cycle, i.e., the ratio of the width of an opaque slit to the sum of the width of an opaque slit and the width of a transparent slit.
- a preferred duty cycle for a Ronchi ruling for use in the practice of the present invention is about 0.15, i.e., about 15% of the area of the Ronchi ruling is opaque. This duty cycle is preferred because it provides a relatively high level of illumination at detector 31, i.e., it avoids light starvation problems at the detector. Other duty cycles can, of course, be used in the practice of the invention if desired.
- Ronchi rulings can be readily added to a diameter-defect-coating monitor of the type shown in Figure 2 by simply mounting a ruling on the fiber side of each of lens systems 26 and 27. Ronchi rulings are commercially available at reasonable cost.
- Lens system 27 is an optional component of the system which, as explained below, linearizes the output of the distance monitoring system.
- Lens systems of the type discussed in the above-referenced U.S. Patent No. 5,309,221 can be used in the practice of the present invention.
- Lens system 27 has a positive optical power, is preferably located between the Ronchi ruling and the detector, and is spaced from the detector by the lens system's focal length "f". That is, the detector is in the lens systems' focal plane, in particular, in its back focal plane.
- the focal plane of a lens system has the important property that parallel rays in object space intersect the focal plane at a common radial distance from the system's optical axis.
- Ray 61 originates at the lens system's front focal point 63. Accordingly, after refraction by the lens system, this ray travels parallel to the optical axis as shown at 64 in Figure 5.
- Equation 1 and Figure 5 can be interpreted as showing that a detector of a given length in the back focal plane of a positive lens system will see the same angular spread of light coming from a fiber, irrespective of the distance of the fiber from the detector.
- This effect is illustrated schematically in Figure 4 for a detector whose length corresponds to an angular spread of 16° about the optical axis of the lens system.
- detector 31 sees light in the ⁇ 8° range irrespective of whether fiber 13 is at position A or at position B.
- FIG. 6 The operation of the distance measuring system of the invention is shown schematically in Figure 6, where 50 is a Ronchi ruling having opaque slits 55 and transparent slits 56 oriented perpendicular to the plane of the figure.
- the transparent slits 56 are separated from one another by the distance "d” which is equal to 1/ ⁇ M .
- the Ronchi ruling is separated from detector 31 by the distance "S”.
- D S ⁇ D /( ⁇ M - ⁇ D ) thus showing that D is a function of ⁇ D and thus can be monitored (measured) by determining ⁇ D for light from the fiber which reaches detector 31 after having been spatially modulated by Ronchi ruling 50.
- this measurement of D is not dependent, at least to first order, upon the transverse location of the fiber.
- this can be seen by imagining that ruling 50 is moved upward in Figure 6 by a distance "d".
- rays 68 and 69 will still strike detector 31 at L 1 and L 2 , respectively, and the above analysis will be unchanged.
- system performance will begin to degrade as the number of illuminated areas on detector 31 decreases. Eventually, the system will stop functioning as the fiber moves completely out of the system's field of view.
- Figure 7 shows a spatial spectrum for a system of the type shown in Figure 4 for a fiber having a diameter of about 125 microns, a Ronchi ruling having an ⁇ M value of about 4.0 cycles/mm, and a Ronchi ruling-to-fiber distance "D" which is approximately equal to the focal length "f" of lens system 27.
- the spectrum includes an O.D. component whose spatial frequency ⁇ OD is about 3.1 cycles/degree and a position component whose spatial frequency ⁇ D is about 4.3 cycles/degree.
- the spectrum also contains two other components labelled 70 and 71 in Figure 7. These components are the result of heterodyning between the position component and the O.D. component, and appear at spatial frequencies corresponding to the sum and difference of the spatial frequencies of the position and O.D. components, i.e., at about 7.4 cycles/degree (4.3 + 3.1) and about 1.2 cycles/degree (4.3 - 3.1) in Figure 7.
- a Ronchi ruling having a spatial frequency of 12.3 cycles/mm is preferred for expected Ronchi ruling-to-fiber distances which are approximately equal to the focal length of lens system 27 and for fibers having expected diameters of less than about 200 microns.
- the heterodynes for such a ruling and, in particular, the lower frequency heterodyne are well above the O.D. component.
- the position component can disappear (drop out) at certain positions of the fiber.
- dropouts arise from diffractive effects as the widths of the transparent and opaque slits of the Ronchi ruling are decreased as the spatial frequency increases. It is also believed that the use of a low duty cycle aggravates this problem.
- ⁇ M 12.3 cycles/mm
- ⁇ M 12.3 cycles/mm
- Values of ⁇ M other than 12.3 cycles/mm can, of course, be used in the practice of the invention.
- the particular value of ⁇ M to be used for any specific distance monitoring system can be readily determined by persons skilled in the art from the disclosure herein.
- FIG. 7 and 8 The spatial frequency spectra of Figures 7 and 8 can be computed using discrete sequence Fourier transforms as disclosed in the above-referenced U.S. Patent No. 5,309,221, and that approach is preferred when high precision is required.
- the procedure will be discussed in terms of a detector which has 2048 pixels, it being understood that the procedure can be readily adapted by persons skilled in the art to detectors having a different number of pixels.
- the first step in the procedure is to select the center 1024 pixels out of the 2048 pixels of raw data in order to reduce the calculation time while still providing sufficient resolution.
- each of the data values for the 1024 center pixels is multiplied by a complex modulation of the form: exp(-i ⁇ n ⁇ x ⁇ 2 ⁇ /2048) where i is the square root of -1, n is the number of the pixel, and x is the desired modulation value selected so that the shifted spatial frequency of the position peak is close to but greater than zero.
- a preferred value for x for a 16° detector is 192 which will shift 12 cycles/degree to zero.
- the next step in the procedure is to filter the modulated data values with a 26 tap low pass FIR filter.
- the filter is applied to remove any aliases generated in decimation step 203.
- the filter has a notch at the frequency of the DC component as shifted by modulation step 201.
- Preferred coefficients for the filter are set forth in Table 1. With these coefficients, the average attenuation of the filter is -30 dB.
- the next step is to decimate the 1024 pixels by 16 to 1. This step is done to reduce the calculation time of the complex fast Fourier transform (FFT) while still retaining sufficient resolution.
- FFT complex fast Fourier transform
- the pseudopixels are then windowed in step 204 to reduce signal leakage and ringing, and thus allow the spatial frequency of the position peak to be determined with sufficient resolution.
- the pseudopixels are preferably windowed with a Blackman-Harris window of the form: 0.35875 - 0.48829 ⁇ cos(2 ⁇ n/63) + 0.14128 ⁇ cos(4 ⁇ n/63) - 0.01168 ⁇ cos (6 ⁇ n/63) where n is the pseudopixel index ranging from 0 to 63.
- the next step is to perform a 64 point complex FFT to transform the pseudopixel values into spatial frequency values.
- the complex FFT can be performed using the Cooley, Lewis, and Welch technique as described in their paper entitled “The Fast Fourier Transform and its Applications,” IBM Research Paper RC 1743, February 9, 1967. See also Rabiner and Gold, Theory and Application of Digital Signal Processing, Prentice-Hall, New York, 1975, page 367; and Cooley et al., IEEE Transactions in Education , March 1969, pages 27-34. Other techniques can be used if desired.
- the frequency coefficients generated by the complex FFT are left in magnitude squared form.
- a complex FFT is used because it produces 64 frequency coefficients out of 64 pseudopixels. Also, the heterodyne peaks will wrap around from 0 to 63 instead of reflecting off of zero frequency. The value of such wrapping around can be seen as follows.
- the position component Because of the presence of the diameter component, the position component has two heterodynes which for a 125 micron fiber are spaced on either side of the position component by about 3.1 cycles/degree (see above). If the position component is shifted from about 13.7 cycles/degree to about 1.7 cycles/degree after steps 202 through 204 have been performed, then the heterodynes will fall at about -1.4 cycles/degree and about 4.8 cycles/degree.
- the lower heterodyne is wrapped around to about 6.6 cycles/degree. If a FFT were used, the lower heterodyne would be reflected to about 1.4 cycles/degree and would thus interfere with the position peak at about 1.7 cycles/degree.
- the final step in the procedure is the determination of the value of ⁇ D .
- the position peak is the largest peak. Accordingly, the position peak location is determined by first finding the largest frequency space peak. A parabolic fit is then performed on the magnitude of this largest peak and the magnitudes of the peaks on either side of the largest peak. The location of the position peak is then the spatial frequency at which this parabolic curve has its maximum value.
- one of the heterodynes can be larger than the position peak for certain fiber positions.
- the position peak is therefore found by limiting the region of search for the largest peak to exclude the heterodynes, e.g., for the numerical values discussed above, the search for the largest peak would be limited to below about 2.3 cycles/degree.
- Figures 10 and 11 show the results of applying the procedure of Figure 9 to the problem of determining the position of an optical waveguide fiber.
- the data shown in these figures was obtained using the apparatus of Figure 4.
- the Ronchi ruling employed had a ⁇ M value of 12.3 cycles/mm and a duty cycle of 15%. No drift was observed for the system over an extended period of use.
- the vertical axis in Figure 10 sets forth the ⁇ D values at detector 31 determined using the procedure of Figure 9 and the horizontal axis sets forth the actual position of the fiber as measured using a test fixture which allowed a segment of fiber to be positioned to within a few microns.
- the vertical axis in Figure 11 shows the differences (residuals) between the actual positions and the ⁇ D positions and the horizontal axis again shows the actual positions. (Note that the system will normally be calibrated using a curve like that of Figure 10.)
- the foregoing procedures for monitoring the position of a fiber are preferably combined with the fiber diameter measurement, defect detection, and hermetic coating monitoring procedures of the above-referenced EPO Patent Publication No. 608,538 and U.S. Patents Nos. 5,185,636 and 5,309,221.
- the procedures are also preferably combined with the techniques for measuring the diameters of non-circular fibers set forth in U.S. Patent No. 5,283,628.
- two detectors are preferably used in these techniques, thus giving two measurements for the position of the fiber when the methods and apparatus of the present invention are employed with each detector.
- the exact position of the fiber in the plane defined by laser beam 25 can be readily determined by using the known positions of the Ronchi rulings which would be placed before lens systems 26,27 in such an overall control system and/or by calibration.
- FIG. 12 shows a system for determining the distance "D" from a Ronchi ruling 150 to a point 141 on a scattering, e.g., diffusely reflecting, surface 113.
- the system includes a lens system 127 and a detector 131 located in the back focal plane of the lens system. As discussed above, the lens system is optional and may be omitted if desired.
- point 141 on surface 113 is shown located in the front focal plane of the lens system for ease in drawing light rays 143 through 146. The point on the surface whose distance is to be determined of course does not need to be at this position.
- Light source 123 produces light beam 125 which passes through aperture 147 in detector 131, lens system 127, and transparent slit 148 of Ronchi ruling 150.
- the light source may be located above or below detector 131, in which case the detector does not need to include an aperture.
- the light source need not produce a coherent monochromatic beam of light, although such a beam can be used if desired, e.g., a laser can be used as the light source. Rather, a light source of any type can be used provided it produces a small spot of light at surface 113 so that the shadows of Ronchi ruling 150 have a sufficient contrast at detector 131.
- the system of Figure 12 operates in accordance with the principles set forth above and thus the distance "D" is given by equation (4).
- the system has a number of advantages in comparison to existing systems for determining the distance to a surface with high precision.
- the system has a number of advantages over laser triangulation systems which have been used in the past to make such measurements.
- Laser triangularization systems can be designed to provide features (1) through (3), but such systems do not have these features intrinsically and thus to provide the features, the cost and complexity of the system must in general be increased.
- Feature (4) cannot be incorporated in laser triangularization systems since such systems require a substantial included angle between the beam which strikes the surface and the detector, e.g., an angle of at least about 15°. Indeed, the sensitivity of a laser triangularization system increases as the included angle increases.
- the present invention is free of this deficit since the included angle between the beam and the detector can be as small as ⁇ 4° or even less.
- the process of the invention as described above is preferably practiced on a digital computer system configured by suitable programming to perform the various computation and identification steps.
- the programming can be done in various programming languages known in the art.
- a preferred programming language is the C language which is particularly well-suited to performing scientific calculations.
- Other languages which can be used include FORTRAN, BASIC, PASCAL, C ++ , and the like.
- the computer system can comprise a general purpose scientific computer and its associated peripherals, such as the computers and peripherals currently being manufactured by Digital Equipment Corporation, IBM, Hewlett-Packard, or the like.
- a dedicated system can be used in the practice of the invention, such as a system using multiple digital signal processing chips.
- the processing portion of the computer system should have the following characteristics: a processing rate of 50 million floating point operations per second, a word length of 32 bits floating point, at least four megabytes of memory, and at least 40 megabytes of disk storage.
- the system should include means for inputting data from the photodetector array and means for outputting the results of the position determination both in electronic form for use in process control and in visual form for observation by system operators, maintenance personnel, and the like.
- the output can also be stored on a disk drive, tape drive, or the like for further analysis and/or subsequent display.
Description
- This invention relates to methods and apparatus for monitoring the position of an optical waveguide fiber or other transparent filament. More generally, the invention relates to methods and apparatus for measuring the distance to an object or to a portion of the surface of an object.
- US-A-5,185,636, 5,283,628, 5,309,221, 3,982,816, 4,067,651 and 4,280,827, Applied Optics., Vo. 19, p. 2031-2033 (1980), and EP-A-608538, describe techniques for monitoring various properties of an optical waveguide fiber during the drawing of the fiber from a preform, including defect monitoring, also of non-circular fibers.
- Some of this known art is schematically represented by Figures 1-3.
- Attention is further directed to US-A-5,066,120, which describes a device for testing an optical system, in particular an ophthalmic lens, in which light which has passed through the optical system is passed through a Ronchi ruling before it reaches a detector.
- In one aspect, the present invention provides a further capability to fiber monitoring systems of the type described above, namely, the ability to monitor and thus control the position of the fiber as it is being drawn. Such positional information is needed to keep the fiber centered and to monitor tension in the fiber through the measurement of the temporal frequency of standing waves along the length of the fiber.
- Current fiber position monitors involve imaging the fiber onto a detector and/or detecting the edge of the fiber. Since there is limited space available for fiber monitoring on a draw tower, the use of a separate position monitor in addition to a diameter-defect-coating monitor of the known type is undesirable.
- Also, existing position monitors cannot detect very small oscillations and consequently, fiber tension information can be lost when the standing waves on the fiber become very small. In addition, current monitors which image the fiber onto a detector are sensitive to front-to-back motions of the fiber which result in the fiber going out of focus at the detector. Specifically, the ability to monitor side-to-side motion at the detector degrades as the fiber moves forward or backward from its in-focus position. This loss of precision with loss of focus further limits the usefulness of current monitors in determining fiber tension.
- In view of the foregoing, it is an object of the present invention to provide improved methods and apparatus for monitoring (measuring) the distance to an object, such as an optical waveguide fiber. Further, it is a particular object of an aspect of the invention to provide a position monitor which can be combined with a diameter-defect-coating monitor of the type described above with a minimum addition of hardware.
- The invention provides a method for monitoring the location of a filament comprising the steps of:
- (a) directing a beam of radiation at the filament so that a portion of the filament comprises a scattering light source;
- (b) spatially modulating light from said scattering light source, said spatial modulation having a spatial frequency ωM;
- (c) detecting said spatially modulated light; and
- (d) determining a spatial frequency ωD for the detected spatially modulated light, said spatial frequency ωD being a function of ωM and the distance between the filament and the location where the light is spatially modulated at ωM.
-
- The above method can be used to control the location of a filament by adding the further step of generating a control signal for the location of the filament from the value of ωD.
- The invention further provides an apparatus for measuring the distance to a surface in combination with an object having the said surface, the apparatus comprising:
- detecting means for detecting light at a plurality of spatially distributed locations;
- illuminating means for directing a beam of light at the surface so that at least a portion of the beam of light is scattered, e.g., diffusely reflected, from the surface onto the detecting means;
- spatial modulating means between the surface and the detecting means for spatially modulating the scattered light, said spatial modulation of the scattered light having a spatial frequency ωM;
- means for determining a spatial frequency ωD of the spatially modulated scattered light at the detecting means, the distance between the spatial modulating means and the surface being a function of ωD and ωM.
-
- The means for determining the spatial frequency ωD of the spatially modulated scattered light at the detecting means can take various forms. For example, this means can perform fringe counting based on peaks, valleys, and/or zero crossings, with the fringe counting being performed directly on the spatial data produced by the detecting means or on spatial data that has been numerically smoothed or filtered. For fringe counting, the spatial frequency ωD is the number of fringes counted divided by the characteristic dimension of the detecting means, e.g., the length of the detecting means. In the preferred embodiments of the invention, the spatial frequency ωD is determined in the spatial frequency domain by performing a transform, preferably a Fourier transform, of the spatial data produced by the detecting means. Other spatial frequency domain approaches can also be used, if desired, such as a wavelet approach.
- In certain preferred embodiments of the invention, the system includes a lens system between the spatial modulating means and the detecting means, which has a positive optical power. By placing the detecting means in the lens system's back focal plane, the distance between the spatial modulating means and the surface becomes a linear function of ωD.
- In other preferred embodiments of the invention, the distance measured is that to an optical waveguide fiber and the measurement is used as part of a control system for controlling the drawing of the fiber from a preform. The control system preferably also controls fiber diameter and hermetic coating thickness, and monitors the fiber for defects.
- Figure 1 is a schematic diagram illustrating the basic elements of a Watkins-type system for measuring fiber diameters using far-field interference patterns.
- Figure 2 is a schematic diagram illustrating the components of a fiber monitoring and control system with which the present invention can be used.
- Figure 3 shows a frequency spectrum of a calculated far-field interference pattern of a 125 micron, coreless fiber containing a 5 micron on-center hole.
- Figure 4 is a schematic diagram of apparatus for practicing the present invention.
- Figure 5 is a schematic diagram illustrating the effects of locating a detector 31 in the back focal plane of a lens system 27.
- Figure 6 is a schematic diagram illustrating the geometric relationships used in determining the relationship between ωM at Ronchi ruling 50 and ωD at detector 31.
- Figures 7 and 8 are stylized drawings of spatial frequency spectra for a defect-free optical waveguide fiber whose position and diameter are monitored using the apparatus of Figure 4. The position of the fiber is the same in both figures; ωM is about 4.0 cycles/mm in Figure 7 and about 12.3 cycles/mm in Figure 8.
- Figure 9 is a block diagram showing a preferred procedure for generating a spatial frequency spectrum for use in the practice of the present invention.
- Figure 10 illustrates the linearity of a preferred embodiment of the present invention.
- Figure 11 illustrates the precision of a preferred embodiment of the present invention.
- Figure 12 illustrates the use of the invention to determine the distance "D" to a diffusely reflecting surface 113.
- Figure 4 shows the components of a fiber location monitoring system constructed in accordance with the present invention. Fiber 13 is shown at two locations marked A and B in Figure 4. Light from the fiber passes through spatial modulating means 50, lens system 27, and is detected by detector 31. Detector 31 can be of the type described in the above-referenced U.S. Patent No. 5,309,221.
- Spatial modulating means 50 has a spatial frequency ωM and spatially modulates the light passing through it at that spatial frequency. The spatial modulating means can be a mask or similar device having a periodic variation in transmission, phase, or other optical property.
- A preferred form of spatial modulating means 50 is a Ronchi ruling. The following discussion is thus in terms of such a ruling, it being understood that other spatial modulating means can be used if desired.
- As known in the art, a Ronchi ruling consists of alternating opaque and transparent slits, which can be formed, for example, by placing chrome strips on a glass plate. All of the opaque slits have the same width and all of the transparent slits have the same width, but the widths of the opaque and transparent slits do not have to be the same. Accordingly, in addition to its spatial frequency ωM (given by one over the spacing between, for example, transparent slits), a Ronchi ruling is also characterized by its duty cycle, i.e., the ratio of the width of an opaque slit to the sum of the width of an opaque slit and the width of a transparent slit.
- A preferred duty cycle for a Ronchi ruling for use in the practice of the present invention is about 0.15, i.e., about 15% of the area of the Ronchi ruling is opaque. This duty cycle is preferred because it provides a relatively high level of illumination at detector 31, i.e., it avoids light starvation problems at the detector. Other duty cycles can, of course, be used in the practice of the invention if desired.
- Ronchi rulings can be readily added to a diameter-defect-coating monitor of the type shown in Figure 2 by simply mounting a ruling on the fiber side of each of lens systems 26 and 27. Ronchi rulings are commercially available at reasonable cost.
- Lens system 27 is an optional component of the system which, as explained below, linearizes the output of the distance monitoring system. Lens systems of the type discussed in the above-referenced U.S. Patent No. 5,309,221 can be used in the practice of the present invention.
- Lens system 27 has a positive optical power, is preferably located between the Ronchi ruling and the detector, and is spaced from the detector by the lens system's focal length "f". That is, the detector is in the lens systems' focal plane, in particular, in its back focal plane. The focal plane of a lens system has the important property that parallel rays in object space intersect the focal plane at a common radial distance from the system's optical axis.
- This property is illustrated schematically in Figure 5, where 51 is the system's optical axis and "L" is the radial distance from the optical axis. For a linear detector 31, "L" is simply the distance from the center of the detector, assuming the detector is centered on the optical axis. As shown in this figure, parallel rays 60, 61, and 62 are all refracted by lens system 27 so that they hit detector 31 at the distance "L".
- Ray 61 originates at the lens system's front focal point 63. Accordingly, after refraction by the lens system, this ray travels parallel to the optical axis as shown at 64 in Figure 5. Using this ray, the distance "L" at the detector corresponding to all rays which intersect the optical axis at the angle Θ can be readily determined. Specifically, as can be seen in Figure 5, "L" is give by:
- Equation 1 and Figure 5 can be interpreted as showing that a detector of a given length in the back focal plane of a positive lens system will see the same angular spread of light coming from a fiber, irrespective of the distance of the fiber from the detector. This effect is illustrated schematically in Figure 4 for a detector whose length corresponds to an angular spread of 16° about the optical axis of the lens system. As shown in this figure, detector 31 sees light in the ±8° range irrespective of whether fiber 13 is at position A or at position B.
- The operation of the distance measuring system of the invention is shown schematically in Figure 6, where 50 is a Ronchi ruling having opaque slits 55 and transparent slits 56 oriented perpendicular to the plane of the figure. The transparent slits 56 are separated from one another by the distance "d" which is equal to 1/ωM. The Ronchi ruling is separated from detector 31 by the distance "S".
- Consider a fiber located at a distance "D" from the Ronchi ruling. Rays 68 and 69 from this fiber will hit detector 31 at heights L1 and L2, respectively, defined by the relationships:
- The tangents of 1 and 2 must also satisfy the following relationships:
- The following relationships then follow:
- These relationships, in turn, lead to the following expression for the ray through the nth transparent slit:
- The distance between the (n+1)th and the nth illuminated area on detector 31 is then:
- Solving for D gives:
- Significantly, this measurement of D is not dependent, at least to first order, upon the transverse location of the fiber. Among other ways, this can be seen by imagining that ruling 50 is moved upward in Figure 6 by a distance "d". Plainly, rays 68 and 69 will still strike detector 31 at L1 and L2, respectively, and the above analysis will be unchanged. Of course, if the fiber is moved sufficiently far off-axis, system performance will begin to degrade as the number of illuminated areas on detector 31 decreases. Eventually, the system will stop functioning as the fiber moves completely out of the system's field of view.
- In equation (3), the dependence of D upon ωD is not linear. The inclusion of a lens system between the Ronchi ruling and the detector, with the detector being in the rear focal plane of the system, provides such linearity as follows.
- From relationships (2) above, n for the nth transparent slit is given by:
- From equation (1) above, n also satisfies the following relationship:
- Accordingly, Ln can be written:
- That is, when a lens system is placed a distance "f" ahead of the detector, and the Ronchi ruling is placed in front of the lens system, the distance of the fiber from the Ronchi ruling becomes a linear function of ωD. Note that the Ronchi ruling can be placed behind the lens system and the system will still work, but the relationship between D and ωD will no longer in general be linear. Accordingly, placing the Ronchi ruling in front of the lens system is preferred. It should also be noted that since equation (1) is only precisely true for paraxial rays, equation (4) is also only precisely true for such rays.
- Figure 7 shows a spatial spectrum for a system of the type shown in Figure 4 for a fiber having a diameter of about 125 microns, a Ronchi ruling having an ωM value of about 4.0 cycles/mm, and a Ronchi ruling-to-fiber distance "D" which is approximately equal to the focal length "f" of lens system 27. As can be seen in this figure, the spectrum includes an O.D. component whose spatial frequency ωOD is about 3.1 cycles/degree and a position component whose spatial frequency ωD is about 4.3 cycles/degree.
- The spectrum also contains two other components labelled 70 and 71 in Figure 7. These components are the result of heterodyning between the position component and the O.D. component, and appear at spatial frequencies corresponding to the sum and difference of the spatial frequencies of the position and O.D. components, i.e., at about 7.4 cycles/degree (4.3 + 3.1) and about 1.2 cycles/degree (4.3 - 3.1) in Figure 7.
- The existence of these heterodyne components raises the possibilities of diameter mismeasurements and false hole detections through the mistaken identification of a heterodyne component as an O.D. component or a defect component. In accordance with the preferred embodiments of the invention, it has been found that these problems can be avoided by choosing ωM so that ωOD is substantially less than (i) ωD and (ii) ωD - ωOD for the expected locations and diameters of the fiber.
- For example, a Ronchi ruling having a spatial frequency of 12.3 cycles/mm is preferred for expected Ronchi ruling-to-fiber distances which are approximately equal to the focal length of lens system 27 and for fibers having expected diameters of less than about 200 microns. As shown in Figure 8, the heterodynes for such a ruling and, in particular, the lower frequency heterodyne, are well above the O.D. component.
- In selecting such a higher ωM value it should be noted that the position component can disappear (drop out) at certain positions of the fiber. Although not wishing to be bound by any particular theory of operation, it is believed that such dropouts arise from diffractive effects as the widths of the transparent and opaque slits of the Ronchi ruling are decreased as the spatial frequency increases. It is also believed that the use of a low duty cycle aggravates this problem.
- The preferred ωM value of 12.3 cycles/mm discussed above has been found to have a dropout position which does not interfere with the monitoring of the position of a fiber during drawing. Values of ωM other than 12.3 cycles/mm can, of course, be used in the practice of the invention. The particular value of ωM to be used for any specific distance monitoring system can be readily determined by persons skilled in the art from the disclosure herein.
- The spatial frequency spectra of Figures 7 and 8 can be computed using discrete sequence Fourier transforms as disclosed in the above-referenced U.S. Patent No. 5,309,221, and that approach is preferred when high precision is required. An alternate approach which provides somewhat lower precision, but takes less compute time, is shown in Figure 9. The procedure will be discussed in terms of a detector which has 2048 pixels, it being understood that the procedure can be readily adapted by persons skilled in the art to detectors having a different number of pixels.
- The first step in the procedure is to select the center 1024 pixels out of the 2048 pixels of raw data in order to reduce the calculation time while still providing sufficient resolution. Next, as shown in block 201 of Figure 9, each of the data values for the 1024 center pixels is multiplied by a complex modulation of the form:
- As shown in block 202, the next step in the procedure is to filter the modulated data values with a 26 tap low pass FIR filter. The filter is applied to remove any aliases generated in decimation step 203. The filter has a notch at the frequency of the DC component as shifted by modulation step 201. Preferred coefficients for the filter are set forth in Table 1. With these coefficients, the average attenuation of the filter is -30 dB.
- As shown in block 203, the next step is to decimate the 1024 pixels by 16 to 1. This step is done to reduce the calculation time of the complex fast Fourier transform (FFT) while still retaining sufficient resolution. The 1024 pixels are reduced to 64 pseudopixels by this step.
- The pseudopixels are then windowed in step 204 to reduce signal leakage and ringing, and thus allow the spatial frequency of the position peak to be determined with sufficient resolution. The pseudopixels are preferably windowed with a Blackman-Harris window of the form:
- As shown in block 205, the next step is to perform a 64 point complex FFT to transform the pseudopixel values into spatial frequency values. The complex FFT can be performed using the Cooley, Lewis, and Welch technique as described in their paper entitled "The Fast Fourier Transform and its Applications," IBM Research Paper RC 1743, February 9, 1967. See also Rabiner and Gold, Theory and Application of Digital Signal Processing, Prentice-Hall, New York, 1975, page 367; and Cooley et al., IEEE Transactions in Education, March 1969, pages 27-34. Other techniques can be used if desired. In order to save time, the frequency coefficients generated by the complex FFT are left in magnitude squared form.
- A complex FFT is used because it produces 64 frequency coefficients out of 64 pseudopixels. Also, the heterodyne peaks will wrap around from 0 to 63 instead of reflecting off of zero frequency. The value of such wrapping around can be seen as follows.
- Because of the presence of the diameter component, the position component has two heterodynes which for a 125 micron fiber are spaced on either side of the position component by about 3.1 cycles/degree (see above). If the position component is shifted from about 13.7 cycles/degree to about 1.7 cycles/degree after steps 202 through 204 have been performed, then the heterodynes will fall at about -1.4 cycles/degree and about 4.8 cycles/degree.
- For a complex FFT, the lower heterodyne is wrapped around to about 6.6 cycles/degree. If a FFT were used, the lower heterodyne would be reflected to about 1.4 cycles/degree and would thus interfere with the position peak at about 1.7 cycles/degree.
- As shown in block 206, the final step in the procedure is the determination of the value of ωD. For a non-hermetically-coated fiber, outside of the dropout regions discussed above, the position peak is the largest peak. Accordingly, the position peak location is determined by first finding the largest frequency space peak. A parabolic fit is then performed on the magnitude of this largest peak and the magnitudes of the peaks on either side of the largest peak. The location of the position peak is then the spatial frequency at which this parabolic curve has its maximum value.
- For a hermetically-coated fiber and polarized illumination, one of the heterodynes can be larger than the position peak for certain fiber positions. The position peak is therefore found by limiting the region of search for the largest peak to exclude the heterodynes, e.g., for the numerical values discussed above, the search for the largest peak would be limited to below about 2.3 cycles/degree.
- Figures 10 and 11 show the results of applying the procedure of Figure 9 to the problem of determining the position of an optical waveguide fiber. The data shown in these figures was obtained using the apparatus of Figure 4. The Ronchi ruling employed had a ωM value of 12.3 cycles/mm and a duty cycle of 15%. No drift was observed for the system over an extended period of use.
- The vertical axis in Figure 10 sets forth the ωD values at detector 31 determined using the procedure of Figure 9 and the horizontal axis sets forth the actual position of the fiber as measured using a test fixture which allowed a segment of fiber to be positioned to within a few microns. The vertical axis in Figure 11 shows the differences (residuals) between the actual positions and the ωD positions and the horizontal axis again shows the actual positions. (Note that the system will normally be calibrated using a curve like that of Figure 10.)
- The linearity of the ωD approach is clearly evident from Figures 10 and 11. As the fiber moves closer to the detector, i.e., towards the right in Figure 10, the value of ωD decreases linearly. As shown in Figure 11, the pointwise error over ±150 mils (±3.8 mm) is less than 50 microns. A measure of the resolution of the system was made using three data points to determine a local slope, and that local slope was used as an estimate of the resolution. The resolution was found to vary somewhat over the ±150 mils (±3.8 mm) range, but at no point was it estimated to be worse than 10 microns. These error and resolution values are more than sufficient to monitor and control the position of a fiber during drawing and to determine and control the tension in the fiber from the monitored position. If desired, as indicated above, even greater precision can be achieved through the use of the analysis techniques of the above-referenced U.S. Patent No. 5,309,221.
- The foregoing procedures for monitoring the position of a fiber are preferably combined with the fiber diameter measurement, defect detection, and hermetic coating monitoring procedures of the above-referenced EPO Patent Publication No. 608,538 and U.S. Patents Nos. 5,185,636 and 5,309,221. The procedures are also preferably combined with the techniques for measuring the diameters of non-circular fibers set forth in U.S. Patent No. 5,283,628. As shown in Figure 2, two detectors are preferably used in these techniques, thus giving two measurements for the position of the fiber when the methods and apparatus of the present invention are employed with each detector. Using these two measurements, the exact position of the fiber in the plane defined by laser beam 25 can be readily determined by using the known positions of the Ronchi rulings which would be placed before lens systems 26,27 in such an overall control system and/or by calibration.
- A more general application of the methods and apparatus of the present invention is illustrated in Figure 12. This figure shows a system for determining the distance "D" from a Ronchi ruling 150 to a point 141 on a scattering, e.g., diffusely reflecting, surface 113. The system includes a lens system 127 and a detector 131 located in the back focal plane of the lens system. As discussed above, the lens system is optional and may be omitted if desired. Also, point 141 on surface 113 is shown located in the front focal plane of the lens system for ease in drawing light rays 143 through 146. The point on the surface whose distance is to be determined of course does not need to be at this position.
- Light source 123 produces light beam 125 which passes through aperture 147 in detector 131, lens system 127, and transparent slit 148 of Ronchi ruling 150. If desired, the light source may be located above or below detector 131, in which case the detector does not need to include an aperture. The light source need not produce a coherent monochromatic beam of light, although such a beam can be used if desired, e.g., a laser can be used as the light source. Rather, a light source of any type can be used provided it produces a small spot of light at surface 113 so that the shadows of Ronchi ruling 150 have a sufficient contrast at detector 131.
- The system of Figure 12 operates in accordance with the principles set forth above and thus the distance "D" is given by equation (4). The system has a number of advantages in comparison to existing systems for determining the distance to a surface with high precision. In particular, the system has a number of advantages over laser triangulation systems which have been used in the past to make such measurements.
- These advantages include: (1) intrinsic insensitivity to surface characteristics such as color or texture so long as the surface is somewhat specular; (2) intrinsic insensitivity to ambient light provided the modulation introduced by the Ronchi ruling is not completely washed out by the ambient light at the detector; (3) intrinsic stability in that the determination of position does not depend upon an analog measurement; and (4) lower included angle between the incident beam and the detected light.
- Laser triangularization systems can be designed to provide features (1) through (3), but such systems do not have these features intrinsically and thus to provide the features, the cost and complexity of the system must in general be increased. Feature (4) cannot be incorporated in laser triangularization systems since such systems require a substantial included angle between the beam which strikes the surface and the detector, e.g., an angle of at least about 15°. Indeed, the sensitivity of a laser triangularization system increases as the included angle increases.
- This need for a substantial included angle is a serious drawback of laser triangularization systems, especially when tracing a sharply concave surface such as a hole. The present invention is free of this deficit since the included angle between the beam and the detector can be as small as ±4° or even less.
- The process of the invention as described above is preferably practiced on a digital computer system configured by suitable programming to perform the various computation and identification steps. The programming can be done in various programming languages known in the art. A preferred programming language is the C language which is particularly well-suited to performing scientific calculations. Other languages which can be used include FORTRAN, BASIC, PASCAL, C++, and the like.
- The computer system can comprise a general purpose scientific computer and its associated peripherals, such as the computers and peripherals currently being manufactured by Digital Equipment Corporation, IBM, Hewlett-Packard, or the like. Alternatively, a dedicated system can be used in the practice of the invention, such as a system using multiple digital signal processing chips.
- Preferably, the processing portion of the computer system should have the following characteristics: a processing rate of 50 million floating point operations per second, a word length of 32 bits floating point, at least four megabytes of memory, and at least 40 megabytes of disk storage. The system should include means for inputting data from the photodetector array and means for outputting the results of the position determination both in electronic form for use in process control and in visual form for observation by system operators, maintenance personnel, and the like. The output can also be stored on a disk drive, tape drive, or the like for further analysis and/or subsequent display.
Coefficients for 26 Tap FIR Filter H(1) = H(26) = 0.01421 H(2) = H(25) = 0.008238 H(3) = H(24) = 0.01194 H(4) = H(23) = 0.01714 H(5) = H(22) = 0.02362 H(6) = H(21) = 0.03097 H(7) = H(20) = 0.03865 H(8) = H(19) = 0.04614 H(9) = H(18) = 0.05295 H(10) = H(17) = 0.05874 H(11) = H(16) = 0.06324 H(12) = H(15) = 0.06631 H(13) = H(14) = 0.06786
Claims (15)
- A method for monitoring the location of a filament (13) comprising the steps of:(a) directing a beam of radiation at the filament so that a portion of the filament comprises a scattering light source;(b) spatially modulating light from said scattering light source, said spatial modulation having a spatial frequency ωM;(c) detecting said spatially modulated light; and(d) determining a spatial frequency ωD for the detected spatially modulated light, said spatial frequency ωD being a function of ωM and the distance between the filament and the location where the light is spatially modulated at ωM.
- The method of claim 1, wherein step (d) is performed by:generating a spatial frequency spectrum for said detected spatially modulated light; andidentifying a component of said spatial frequency spectrum having said spatial frequency ωD which is indicative of said distance.
- The method of claim 1 or 2, wherein a Ronchi ruling (50) is used to perform step (b).
- The method of any preceding claim, wherein between steps (b) and (c), said spatially modulated light is transformed by a lens system (27) so that said distance is a linear function of ωD.
- The method of claim 2, or claim 3 or 4 as dependent on claim 2, wherein the filament (13) is transparent and the beam of radiation produces an interference pattern which is detected in step (c).
- The method of claim 5, wherein the spatial frequency spectrum includes an outside diameter component which is used to monitor the diameter of the filament.
- The method of claim 6, wherein the outside diameter component has a spatial frequency ωOD and wherein ωM is chosen so that ωOD is substantially less than (i) ωD and (ii) ωD - ωOD for the expected locations and diameters of the filament.
- The method of claim 6 or 7, wherein the spatial frequency spectrum is used to monitor the thickness of a hermetic coating on the filament (13).
- The method of any preceding claim, wherein steps (b) through (d) are performed at each of two spatially separated locations.
- The method of claim 9, wherein the beam of radiation defines an axis (51), and the two spatially separated locations are each angularly displaced from the axis.
- A method of controlling the location of a filament, comprising monitoring the location of the filament by the method of any preceding claim, and comprising the further step of generating a control signal for the location of the filament from the value of ωD.
- Apparatus for measuring the distance to a surface, in combination with an object having the said surface, the apparatus comprising:detecting means (29, 31; 131) for detecting light at a plurality of spatially distributed locations;illuminating means (23, 123) for directing a beam of light at the surface so that at least a portion of the beam of light is scattered from the surface onto the detecting means;spatial modulating means (50, 150) between the surface and the detecting means for spatially modulating the scattered light, said spatial modulation of the scattered light having a spatial frequency ωM;means (201-206) for determining a spatial frequency ωD of the spatially modulated scattered light at the detecting means, the distance between the spatial modulating means and the surface being a function of ωD and ωM.
- The combination of claim 12, wherein the spatial modulating means (50, 150) is a Ronchi ruling.
- The combination of claim 12 or 13, further comprising a lens system (26, 27; 127) between the spatial modulating means (50, 150) and the detecting means (29, 31; 131), said lens system having a positive power and the detecting means being in the lens system's back focal plane, whereby the distance D between the spatial modulating means and the surface is a linear function of ωD.
- The combination of any one of claims 12 to 14, wherein the said object is a filament.
Applications Claiming Priority (2)
| Application Number | Priority Date | Filing Date | Title |
|---|---|---|---|
| US368311 | 1994-12-30 | ||
| US08/368,311 US5519487A (en) | 1994-12-30 | 1994-12-30 | Method for monitoring the position of a fiber |
Publications (3)
| Publication Number | Publication Date |
|---|---|
| EP0720001A2 EP0720001A2 (en) | 1996-07-03 |
| EP0720001A3 EP0720001A3 (en) | 1997-04-23 |
| EP0720001B1 true EP0720001B1 (en) | 2002-04-10 |
Family
ID=23450711
Family Applications (1)
| Application Number | Title | Priority Date | Filing Date |
|---|---|---|---|
| EP95119165A Expired - Lifetime EP0720001B1 (en) | 1994-12-30 | 1995-12-06 | Method for monitoring the position of a fiber |
Country Status (12)
| Country | Link |
|---|---|
| US (1) | US5519487A (en) |
| EP (1) | EP0720001B1 (en) |
| JP (1) | JP3677639B2 (en) |
| KR (1) | KR960024248A (en) |
| AU (1) | AU686910B2 (en) |
| BR (1) | BR9506096A (en) |
| CA (1) | CA2163161A1 (en) |
| DE (1) | DE69526321T2 (en) |
| DK (1) | DK0720001T3 (en) |
| RU (1) | RU2152589C1 (en) |
| TW (1) | TW302433B (en) |
| UA (1) | UA32584C2 (en) |
Families Citing this family (13)
| Publication number | Priority date | Publication date | Assignee | Title |
|---|---|---|---|---|
| JP2001527651A (en) | 1997-05-22 | 2001-12-25 | コーニング インコーポレイテッド | Method and apparatus for detecting surface flaws in optical fibers |
| US6771855B2 (en) | 2000-10-30 | 2004-08-03 | Santur Corporation | Laser and fiber coupling control |
| JP2004522986A (en) * | 2000-10-30 | 2004-07-29 | サンター コーポレイション | Tunable controlled laser array |
| WO2002084742A1 (en) | 2001-03-30 | 2002-10-24 | Santur Corporation | Switched laser array modulation with integral electroabsorption modulator |
| US6781734B2 (en) | 2001-03-30 | 2004-08-24 | Santur Corporation | Modulator alignment for laser |
| US6813300B2 (en) | 2001-03-30 | 2004-11-02 | Santur Corporation | Alignment of an on chip modulator |
| WO2003015226A2 (en) * | 2001-08-08 | 2003-02-20 | Santur Corporation | Method and system for selecting an output of a vcsel array |
| AU2002217163A1 (en) * | 2001-12-27 | 2003-07-15 | Pirelli & C. S.P.A. | On-line tension measurement in an optical fibre |
| US6910780B2 (en) * | 2002-04-01 | 2005-06-28 | Santur Corporation | Laser and laser signal combiner |
| JP2008145290A (en) * | 2006-12-11 | 2008-06-26 | Seiko Precision Inc | Range finder |
| JP5017456B2 (en) * | 2009-04-09 | 2012-09-05 | 株式会社フジクラ | Method for measuring hole diameter of optical fiber with hole and method for manufacturing optical fiber with hole |
| CN104537414B (en) * | 2015-01-08 | 2017-09-12 | 山东师范大学 | Optical stripe robot scaler and method of counting based on optical fiber |
| US20230236369A1 (en) * | 2020-06-19 | 2023-07-27 | Lumentum Operations Llc | System and method for vertically aligning optical fiber to photonic wafers |
Citations (1)
| Publication number | Priority date | Publication date | Assignee | Title |
|---|---|---|---|---|
| US5066120A (en) * | 1989-06-05 | 1991-11-19 | Essilor International, Cie Generale D'optique | Optical device for phase detection testing optical system, especially ophthalmic lenses |
Family Cites Families (8)
| Publication number | Priority date | Publication date | Assignee | Title |
|---|---|---|---|---|
| US3982816A (en) * | 1974-06-21 | 1976-09-28 | Western Electric Company, Inc. | Method for measuring the parameters of optical fibers |
| US4067651A (en) * | 1974-06-21 | 1978-01-10 | Western Electric Company, Inc. | Method for measuring the parameters of optical fibers |
| US4280827A (en) * | 1979-09-04 | 1981-07-28 | Corning Glass Works | System for measuring optical waveguide fiber diameter |
| CA2083969A1 (en) * | 1991-12-31 | 1993-07-01 | Leslie James Button | Measurement of fiber diameters and detection of defects |
| US5309221A (en) * | 1991-12-31 | 1994-05-03 | Corning Incorporated | Measurement of fiber diameters with high precision |
| US5283628A (en) * | 1991-12-31 | 1994-02-01 | Corning Incorporated | Method for measuring diameters of non-circular fibers |
| US5185636A (en) * | 1991-12-31 | 1993-02-09 | Corning Incorporated | Method for detecting defects in fibers |
| US5408308A (en) * | 1993-01-29 | 1995-04-18 | Corning Incorporated | Method for monitoring hermetically-coated fibers |
-
1994
- 1994-12-30 US US08/368,311 patent/US5519487A/en not_active Expired - Lifetime
-
1995
- 1995-11-17 CA CA002163161A patent/CA2163161A1/en not_active Abandoned
- 1995-12-06 DK DK95119165T patent/DK0720001T3/en active
- 1995-12-06 DE DE69526321T patent/DE69526321T2/en not_active Expired - Fee Related
- 1995-12-06 EP EP95119165A patent/EP0720001B1/en not_active Expired - Lifetime
- 1995-12-20 AU AU40542/95A patent/AU686910B2/en not_active Ceased
- 1995-12-25 JP JP35001895A patent/JP3677639B2/en not_active Expired - Fee Related
- 1995-12-27 BR BR9506096A patent/BR9506096A/en not_active Application Discontinuation
- 1995-12-28 UA UA95125540A patent/UA32584C2/en unknown
- 1995-12-28 RU RU95122597/28A patent/RU2152589C1/en active
- 1995-12-30 KR KR1019950069650A patent/KR960024248A/en active IP Right Grant
-
1996
- 1996-02-17 TW TW085102112A patent/TW302433B/zh active
Patent Citations (1)
| Publication number | Priority date | Publication date | Assignee | Title |
|---|---|---|---|---|
| US5066120A (en) * | 1989-06-05 | 1991-11-19 | Essilor International, Cie Generale D'optique | Optical device for phase detection testing optical system, especially ophthalmic lenses |
Also Published As
| Publication number | Publication date |
|---|---|
| EP0720001A2 (en) | 1996-07-03 |
| US5519487A (en) | 1996-05-21 |
| TW302433B (en) | 1997-04-11 |
| DK0720001T3 (en) | 2002-07-29 |
| KR960024248A (en) | 1996-07-20 |
| EP0720001A3 (en) | 1997-04-23 |
| UA32584C2 (en) | 2001-02-15 |
| RU2152589C1 (en) | 2000-07-10 |
| AU686910B2 (en) | 1998-02-12 |
| DE69526321T2 (en) | 2002-09-05 |
| DE69526321D1 (en) | 2002-05-16 |
| JPH08247711A (en) | 1996-09-27 |
| CA2163161A1 (en) | 1996-07-01 |
| JP3677639B2 (en) | 2005-08-03 |
| AU4054295A (en) | 1996-07-11 |
| BR9506096A (en) | 1997-12-23 |
Similar Documents
| Publication | Publication Date | Title |
|---|---|---|
| EP0720001B1 (en) | Method for monitoring the position of a fiber | |
| US5309221A (en) | Measurement of fiber diameters with high precision | |
| EP0028774B1 (en) | Apparatus for detecting defects in a periodic pattern | |
| US5661556A (en) | System for measuring the total integrated scatter of a surface | |
| US5185636A (en) | Method for detecting defects in fibers | |
| EP0248479B1 (en) | Arrangement for optically measuring a distance between a surface and a reference plane | |
| US5264909A (en) | Measurement of optical fiber diameter | |
| US5408308A (en) | Method for monitoring hermetically-coated fibers | |
| JP3433238B2 (en) | How to measure the diameter of a transparent filament | |
| US6943898B2 (en) | Apparatus and method for dual spot inspection of repetitive patterns | |
| JPH0758268B2 (en) | System for monitoring spatial filters and surface structures | |
| US6628402B1 (en) | Phase interference detecting method and system in interferometer, and light detector therefor | |
| HU203595B (en) | Process and apparatus for contactless definition of diameter of thin wires | |
| Robinson et al. | The measurement of the frequency response of a photodiode and amplifier using an opto-mechanical frequency response calibrator | |
| KR100284591B1 (en) | Method for precise measurement of fiber diameter | |
| US4190367A (en) | Device for establishing a condition at the surface of a subject | |
| JP2666032B2 (en) | Measurement method of scattering light and scattering angle distribution | |
| JP2761347B2 (en) | Sorting method of semiconductor laser | |
| DE4233336A1 (en) | Focussing error detection using Michelson interferometer - evaluating periodic frequency or phase of interference pattern formed at detector by two reflected sub-beams | |
| US4523842A (en) | Asperic surface test fixture | |
| SU693180A1 (en) | Device for measuring characteristics of liquid optical density | |
| JPS6316232A (en) | Measuring method for diameter of laser beam | |
| JPH0682378A (en) | Defect inspection device | |
| JPH0534147A (en) | Contactless height measuring apparatus | |
| GB2276445A (en) | Detecting faults on a flat, reflective, moving surface |
Legal Events
| Date | Code | Title | Description |
|---|---|---|---|
| PUAI | Public reference made under article 153(3) epc to a published international application that has entered the european phase |
Free format text: ORIGINAL CODE: 0009012 |
|
| AK | Designated contracting states |
Kind code of ref document: A2 Designated state(s): CH DE DK FR GB IT LI NL |
|
| PUAL | Search report despatched |
Free format text: ORIGINAL CODE: 0009013 |
|
| AK | Designated contracting states |
Kind code of ref document: A3 Designated state(s): CH DE DK FR GB IT LI NL |
|
| 17P | Request for examination filed |
Effective date: 19970910 |
|
| 17Q | First examination report despatched |
Effective date: 20000208 |
|
| GRAG | Despatch of communication of intention to grant |
Free format text: ORIGINAL CODE: EPIDOS AGRA |
|
| GRAG | Despatch of communication of intention to grant |
Free format text: ORIGINAL CODE: EPIDOS AGRA |
|
| GRAH | Despatch of communication of intention to grant a patent |
Free format text: ORIGINAL CODE: EPIDOS IGRA |
|
| GRAH | Despatch of communication of intention to grant a patent |
Free format text: ORIGINAL CODE: EPIDOS IGRA |
|
| REG | Reference to a national code |
Ref country code: GB Ref legal event code: IF02 |
|
| GRAA | (expected) grant |
Free format text: ORIGINAL CODE: 0009210 |
|
| AK | Designated contracting states |
Kind code of ref document: B1 Designated state(s): CH DE DK FR GB IT LI NL |
|
| PG25 | Lapsed in a contracting state [announced via postgrant information from national office to epo] |
Ref country code: LI Free format text: LAPSE BECAUSE OF FAILURE TO SUBMIT A TRANSLATION OF THE DESCRIPTION OR TO PAY THE FEE WITHIN THE PRESCRIBED TIME-LIMIT Effective date: 20020410 Ref country code: CH Free format text: LAPSE BECAUSE OF FAILURE TO SUBMIT A TRANSLATION OF THE DESCRIPTION OR TO PAY THE FEE WITHIN THE PRESCRIBED TIME-LIMIT Effective date: 20020410 |
|
| REG | Reference to a national code |
Ref country code: CH Ref legal event code: EP |
|
| REF | Corresponds to: |
Ref document number: 69526321 Country of ref document: DE Date of ref document: 20020516 |
|
| REG | Reference to a national code |
Ref country code: DK Ref legal event code: T3 |
|
| ET | Fr: translation filed | ||
| REG | Reference to a national code |
Ref country code: CH Ref legal event code: PL |
|
| PG25 | Lapsed in a contracting state [announced via postgrant information from national office to epo] |
Ref country code: DK Free format text: LAPSE BECAUSE OF NON-PAYMENT OF DUE FEES Effective date: 20030131 |
|
| PLBE | No opposition filed within time limit |
Free format text: ORIGINAL CODE: 0009261 |
|
| STAA | Information on the status of an ep patent application or granted ep patent |
Free format text: STATUS: NO OPPOSITION FILED WITHIN TIME LIMIT |
|
| 26N | No opposition filed |
Effective date: 20030113 |
|
| PG25 | Lapsed in a contracting state [announced via postgrant information from national office to epo] |
Ref country code: DE Free format text: LAPSE BECAUSE OF NON-PAYMENT OF DUE FEES Effective date: 20030701 |
|
| REG | Reference to a national code |
Ref country code: DK Ref legal event code: EBP |
|
| PGFP | Annual fee paid to national office [announced via postgrant information from national office to epo] |
Ref country code: GB Payment date: 20031105 Year of fee payment: 9 |
|
| PGFP | Annual fee paid to national office [announced via postgrant information from national office to epo] |
Ref country code: NL Payment date: 20041111 Year of fee payment: 10 |
|
| PGFP | Annual fee paid to national office [announced via postgrant information from national office to epo] |
Ref country code: FR Payment date: 20041201 Year of fee payment: 10 |
|
| PG25 | Lapsed in a contracting state [announced via postgrant information from national office to epo] |
Ref country code: GB Free format text: LAPSE BECAUSE OF NON-PAYMENT OF DUE FEES Effective date: 20041206 |
|
| GBPC | Gb: european patent ceased through non-payment of renewal fee |
Effective date: 20041206 |
|
| PG25 | Lapsed in a contracting state [announced via postgrant information from national office to epo] |
Ref country code: IT Free format text: LAPSE BECAUSE OF NON-PAYMENT OF DUE FEES;WARNING: LAPSES OF ITALIAN PATENTS WITH EFFECTIVE DATE BEFORE 2007 MAY HAVE OCCURRED AT ANY TIME BEFORE 2007. THE CORRECT EFFECTIVE DATE MAY BE DIFFERENT FROM THE ONE RECORDED. Effective date: 20051206 |
|
| PG25 | Lapsed in a contracting state [announced via postgrant information from national office to epo] |
Ref country code: NL Free format text: LAPSE BECAUSE OF NON-PAYMENT OF DUE FEES Effective date: 20060701 |
|
| PG25 | Lapsed in a contracting state [announced via postgrant information from national office to epo] |
Ref country code: FR Free format text: LAPSE BECAUSE OF NON-PAYMENT OF DUE FEES Effective date: 20060831 |
|
| NLV4 | Nl: lapsed or anulled due to non-payment of the annual fee |
Effective date: 20060701 |
|
| REG | Reference to a national code |
Ref country code: FR Ref legal event code: ST Effective date: 20060831 |