EP0668497A2 - Data analysis method for use with fluorescent bacterial sensors - Google Patents
Data analysis method for use with fluorescent bacterial sensors Download PDFInfo
- Publication number
- EP0668497A2 EP0668497A2 EP95300462A EP95300462A EP0668497A2 EP 0668497 A2 EP0668497 A2 EP 0668497A2 EP 95300462 A EP95300462 A EP 95300462A EP 95300462 A EP95300462 A EP 95300462A EP 0668497 A2 EP0668497 A2 EP 0668497A2
- Authority
- EP
- European Patent Office
- Prior art keywords
- ratio
- frequency
- radiation
- emission
- sensor
- Prior art date
- Legal status (The legal status is an assumption and is not a legal conclusion. Google has not performed a legal analysis and makes no representation as to the accuracy of the status listed.)
- Granted
Links
Images


Classifications
-
- G—PHYSICS
- G01—MEASURING; TESTING
- G01N—INVESTIGATING OR ANALYSING MATERIALS BY DETERMINING THEIR CHEMICAL OR PHYSICAL PROPERTIES
- G01N21/00—Investigating or analysing materials by the use of optical means, i.e. using sub-millimetre waves, infrared, visible or ultraviolet light
- G01N21/62—Systems in which the material investigated is excited whereby it emits light or causes a change in wavelength of the incident light
- G01N21/63—Systems in which the material investigated is excited whereby it emits light or causes a change in wavelength of the incident light optically excited
- G01N21/64—Fluorescence; Phosphorescence
- G01N21/6408—Fluorescence; Phosphorescence with measurement of decay time, time resolved fluorescence
-
- Y—GENERAL TAGGING OF NEW TECHNOLOGICAL DEVELOPMENTS; GENERAL TAGGING OF CROSS-SECTIONAL TECHNOLOGIES SPANNING OVER SEVERAL SECTIONS OF THE IPC; TECHNICAL SUBJECTS COVERED BY FORMER USPC CROSS-REFERENCE ART COLLECTIONS [XRACs] AND DIGESTS
- Y10—TECHNICAL SUBJECTS COVERED BY FORMER USPC
- Y10S—TECHNICAL SUBJECTS COVERED BY FORMER USPC CROSS-REFERENCE ART COLLECTIONS [XRACs] AND DIGESTS
- Y10S435/00—Chemistry: molecular biology and microbiology
- Y10S435/808—Optical sensing apparatus
Landscapes
- Health & Medical Sciences (AREA)
- Biochemistry (AREA)
- General Physics & Mathematics (AREA)
- Life Sciences & Earth Sciences (AREA)
- Chemical & Material Sciences (AREA)
- Analytical Chemistry (AREA)
- Nuclear Medicine, Radiotherapy & Molecular Imaging (AREA)
- General Health & Medical Sciences (AREA)
- Physics & Mathematics (AREA)
- Immunology (AREA)
- Pathology (AREA)
- Investigating, Analyzing Materials By Fluorescence Or Luminescence (AREA)
- Investigating Or Analysing Materials By The Use Of Chemical Reactions (AREA)
- Measuring Or Testing Involving Enzymes Or Micro-Organisms (AREA)
- Investigating Or Analysing Biological Materials (AREA)
Abstract
Description
- This application relates to an improved method for interpreting data from fluorescent chemical sensors used to detect bacteria in body fluid samples. The present inventive method provides a linear output that is more accurate and more readily utilizable than prior art methods.
- In the prior art, a wide variety of so-called non-invasive chemical sensors are utilized with body fluid samples to provide an indication of whether bacterial activity is ongoing in the sample. As is known, a body fluid sample, such as blood, is injected into a vial containing a culture medium. A chemical sensor has been previously placed within the vial. The vial is then incubated and monitored for bacterial growth. Several known types of instruments are utilized to monitor the bacterial growth by detecting the changes in the chemical sensors.
- A first known type of chemical sensor responds to changes in conditions within the vial, such as a change in oxygen concentration, by changing the intensity of radiation directed into the sensor. Thus, by monitoring the radiation intensity emerging from the sensor, one can predict whether bacterial activity is ongoing in the vial. These types of sensors have enjoyed some success, but there are some deficiencies with their use.
- One practical deficiency occurs since an actual apparatus typically tests hundreds of vials at one time. Each of the vials is equipped with its own light source and photodetector. Station-to-station variations between each of the hundreds of light sources and detectors may result in some variations in the readings. For this and other reasons, intensity based detection systems have not always proven fully satisfactory.
- A second type of chemical sensor is a so-called fluorescent sensor that changes its fluorescent lifetime in response to changes in conditions within the vial. Such fluorescent sensors are not as sensitive to station-to-station variations and, thus, address the above-discussed problem. Many fluorescent sensors are known which change their fluorescent lifetimes with changing carbon dioxide concentration, oxygen concentration, or other chemical parameters. The present invention does not relate to a change in any chemical sensors, but rather to a change in the way that the fluorescent emissions from such chemical sensors are analyzed.
- Typically, a change in the sensor fluorescent lifetime has been monitored by applying the phase shift method. Basically, an intensity-modulated excitation radiation source is directed into the chemical sensor. An intensity-modulated fluorescent emission results that is phase shifted related to the excitation radiation. Instruments read the phase shift angle from the emission radiation. The phase shift angle changes with changing conditions within a vial, and by monitoring the phase shift angle over time a prediction can be made as to whether a particular vial is experiencing bacterial growth.
- Problems exist with the phase shift method, as will be explained by the following mathematical analysis. A phase shift angle ϑ is dependent on the fluorescent lifetime τ according to the equation:

- In
equation 1, ω is equal to 2πf, and is known as the circular light modulation frequency. The f quantity is the frequency of the excitation light directed into the chemical sensor. The τ function changes, and is the component which is indicative of whether the specimen is experiencing bacterial growth. Typically, in the prior art, the ω component remains constant. - In
equation 1, a main disadvantage of the phase shift method of monitoring the emissions of fluorescent sensors can be explained. If ω is small, then the phase shift angle would also be small. Thus, the resolution of the chemical sensor arrangement with regard to the changing chemical state that is being sensed is limited. That is, if the ωτ quantity is small, the resolution with regard to change in, as an example, oxygen concentration, is also limited. A change in the measured phase shift angle Θ for a given change in τ (which may be dependent on oxygen concentration, as an example) would be relatively small and difficult to distinguish. - To overcome this resolution problem, the modulation frequency, f could be increased. However, the resulting phase shift angles would be compressed as they approach the range of 70-90°. The maximum possible phase shift angle is 90°. Since tan Θ would be equal to infinity at 90°, the phase shift angle cannot actually ever reach 90°. Further, as the Θ angle approaches 90° the result of the test would become of little value.
- Due to these limitations, the practical range of analyzing chemical sensor emissions based on the phase shift method is limited. Other limitations of the phase shift method can be seen by reviewing prior art figures 1 and 2.
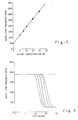
- In figure 1, the solid curve shows phase shift angle Θ plotted as a function of the frequency lifetime product ωτ. The derivative of Θ due to τ is plotted by the dashed line. In this graph, ω is kept constant, and τ changes. As can be seen, the maximum changes occur under the condition ωτ = 1. This condition would be achieved with a phase shift angle of 45°, point B in figure 1. As is also shown by the dashed derivative line curve, high sensor resolutions are obtainable over a very limited frequency lifetime range. The resolution is tied to the changes in Θ, with a corresponding change in τ. As can be seen, the change in Θ with change in τ soon moves to very small amounts. With the phase shift method, it would be desirable to have larger changes in Θ, because it is these changes that are to be monitored to determine the conditions in the vial. Thus, if the ω quantity is kept constant, only a very limited τ range would result in a high sensor resolution. This limited range is a serious disadvantage for analyzing data from fluorescent sensors using the phase shift method.
- Another problem with the phase shift method of analyzing the fluorescent emissions is illustrated in figure 2. Figure 2 plots the phase shift angle Θ as a function of oxygen concentration c for a chemical sensor having a change in fluorescent lifetime based on oxygen concentration. The ω value is kept constant.
- By the Stern-Volmer equation τ can be calculated as follows:

- Taking
equation 1 and 2A together, it can be shown that the phase shift angle Θ is given by the equation:
- In equation 2B, k is a constant. The τ₀ quantity is based upon τ in the absence of oxygen. In Figure 2, ωτ = √2. During operation of the sensor, the product ωτ runs between maximum value ωτ₀, when no oxygen is present, to a very low value for high oxygen concentrations. The resolution of the sensor varies over this range, as is shown above.
- As shown in figure 2, the Θ readings are highly non-linear. In order to utilize these Θ readings to make a determination of whether a particular sample vial is experiencing bacterial growth, one must make readings over time. As is shown in figure 2, the phase shift angle decreases with increasing oxygen concentration. In an oxygen-based chemical sensor, the presence of bacteria will result in a decrease in oxygen concentration. In the illustrated sensor, by studying changes in the phase shift angle Θ over time, and by looking for an increase in phase shift angles, one can determine whether bacterial growth is ongoing in a particular sample vial.
- Thus, two deficiencies with the phase shift method can be summarized as follows. First, high resolutions of the sensors are limited to a very small operational range. The ω value is typically constant. This results in the quantity τ being limited to a very narrow band for high sensor resolution. That is, only a very limited band of, for instance, oxygen concentration changes would come within a high sensor resolution area for the particular chemical sensor. If the sample vial is outside of that range, only low sensor resolution will be provided, and the resulting readings may be difficult to analyze.
- Further, as explained above, one must read the phase shift angles and look for changes over time. Due to the non-linear nature of the phase shift change with the changing oxygen concentration, these changes are difficult to read over time. As an example, during the relatively small change area between 20 percent to 50 percent concentration shown at figure 2, only small changes in Θ would be expected. During the very rapid changes between 0 percent and 10 percent, a small change may appear on a reading as being a very large change in oxygen concentration. The prior art has attempted to overcome this problem, but the non-linear changing values still present difficulties.
- For the foregoing reasons, the phase shift method has not proven fully satisfactory as a method of analyzing fluorescent emissions from chemical sensors based on changing fluorescent lifetimes.
- The present invention provides a method of evaluating fluorescent emissions from a chemical sensor. In the inventive method, a ratio based on the emission is compared to a desired ratio. The frequency of the excitation input is changed if the measured ratio differs from the desired ratio. The input frequency continues to be adjusted until the measured and desired ratios are effectively equal. In this way, the ω quantity is changed, as the τ quantity changes. The desired ratio is selected to focus the ωτ quantity in a high resolution area. The τ quantity is changing with changing conditions in the sample vial. The changing ω quantity is thus indicative of a change in the τ quantity, which is, in turn, indicative of a change of the parameter being measured, such as oxygen concentration. In the invention this adjusted ω quantity is used to determine whether a particular sample vial is evidencing a bacterial growth. In fact, it is the f component of ω which is used, but the two values are proportional.
- As will be shown below, when evaluated using this method, the f quantity will change linearly with the changing oxygen concentration. Thus, not only can the inventive method be used to focus the ωτ quantity into the narrow high resolution sensor band, but further, the resulting ω quantity is a linear function of changes in oxygen. Thus, the inventive results are easy to interpret and utilize.
- In one inventive method of evaluating fluorescent emissions, the ratio is based on the AC and DC components of the emission. This ratio is also known as the emission modulation. A ratio is taken of the AC and DC components and compared to a desired ratio. The desired ratio is preferably calculated to be the ratio that would be expected at a high resolution area for the particular sensor. If the measured and desired ratios differ, then the excitation frequency is changed, and the readings are again taken. These steps continue until the measured ratio is effectively equal to the desired ratio. The adjusted frequency is then measured and plotted on a graph. By comparing the changes in this adjusted frequency over time, one can make a determination of whether a particular sample vial is experiencing bacterial growth.
- In an alternative method of evaluating the fluorescent emissions, the ratio may be based on the relative modulation, which compares the emission modulation to the modulation degree of the excitation light. In this second method, the ratio of the emission modulation and excitation modulation are compared to a desired ratio. As with the first method, the frequency of the excitation radiation is adjusted until the measured and desired ratios are equal. At that time, the excitation frequency is measured and plotted.
- In a preferred embodiment of this invention, the input or excitation radiation is periodically turned off, and DC measurements are made. In this way, so-called dark signal readings can be canceled out from the measured DC quantities. This results in an even more accurate reading from the system.
- Several embodiments of systems capable of performing the method of this invention are disclosed. It should be understood, however, that the main features of this invention relate to its inventive realization that by adjusting the excitation frequency to result in a measured ratio which is equal to a desired ratio, one may ensure that all readings are performed in the high resolution band for the sensor and, further, that the measured values are a linear function of changes in the chemical parameter to be measured.
- These and other features of the present invention can be best understood from the following specification and drawings, of which the following is a brief description.
- Figure 1 is a graph showing feature of prior art methods.
- Figure 2 is a second graph showing other features of prior art methods.
- Figure 3 is a graph explaining features of the inventive method.
- Figure 4 is a graph showing features of the present invention.
- Figure 5 shows experimental results based on the present invention.
- Figure 6 shows calculated results based on the present invention.
- Figure 7 shows further experimental results based on the present invention.
- Figure 8 shows further experimental results based on the present invention.
- Figure 9 shows a first system for accomplishing the method of the present invention.
- Figure 10 shows a second system for accomplishing the method of the present invention.
- Figure 11 shows a third system for accomplishing the method of the present invention.
- Figure 12 is a fourth system for accomplishing the method of the present invention.
- As explained above, the present invention provides a fluorescent lifetime chemical sensor which ensures that readings are taken in a high resolution area of the sensor, and further results in a linear output function for the changing chemical parameter. These features will be explained mathematically and shown to be true experimentally below. Applicant will then disclose several systems for achieving the inventive method.
- When a radiation source illuminates a chemical sensor material with an intensity-modulated excitation light, the fluorescent light emission shows a modulation degree mF given by the known equation:

- As stated above, the emission modulation mF is equal to the ratio of the AC and DC components of the emission radiation. The excitation modulation mE is equal to a ratio of the AC and DC components of the excitation radiation.
- A relative modulation m for the fluorescent signal, can be defined as:

- It is relatively safe to assume that the mE component is effectively 100%. Thus, in a broad method we make the assumption that we need to calculate only the emission modulation mF, to arrive at accurate results. A final embodiment calculates both emission and excitation modulation and thus measures the actual relative modulation.
- Figure 3 shows relative modulation m versus the ωτ frequency-lifetime product. The value of m varies as shown by the solid curve in figure 3. The change in modulation m per relative change in the fluorescent lifetime is of interest. The higher value of the change in modulation, or the derivative of m per change in τ, the better the sensor resolution. The quantity dm/(dτ/τ) can be derived from
equations - In the present invention, the ratio of the AC and DC components is directed to a comparator unit which compares the measured ratio to the desired ratio. The input frequency is adjusted if appropriate. The comparator unit is set such that it will have a voltage of zero when the two ratios are equal. The desired ratio is set to the situation in Figure 3 when ωτ is equal to the √2; that is, when m equals 1/√3 (about 58%). Again, since we are assuming mE equals 100 percent, we need only measure the mF quantity.
- As the quantity τ changes, differences between the measured and desired ratios will occur. This, in turn, will result in a control signal to the input for the excitation radiation directed into the chemical sensor, which will change its frequency. These changes in frequency will eventually result in the desired and measured ratios being equal. At that time, the adjusted frequency will be measured.
- In a sense, the optical sensor arrangement according to this present invention is "locked into" the optimum operating condition for the particular sensor. In the illustrated example it is locked into the situation where m=1/√3.
- We will now show that the adjusted frequency will be a linear function of the oxygen concentration. If we fix m at 1/√3 then, from
equations 
- This shows that the modulation frequency f is inversely proportional to the fluorescent lifetime τ.
- As noted above, the lifetime τ is described (by the Stern-Volmer equation) as follows:

- τ₀ is the fluorescent lifetime in the absence of any of the quencher (oxygen, etc.). c is the quencher or analyte concentration, or quantity to be measured. As an example, c may be the oxygen concentration, and k is a quenching constant. By combining
equations 5 and 2A, the resulting sensor modulation frequency f is shown to be:
-
Equation 8 indicates that f is a linear function of the concentration of the quantity to be measured, c. - Figure 4 illustrates f for a chemical sensor based upon oxygen concentration. As shown, the frequency f would be a linear function of this oxygen concentration.
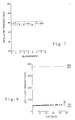
- Figure 5 illustrates experimental results of a series of sample vials having oxygen concentrations of 0 to 21 percent, which were evaluated utilizing the inventive method. As shown, the resulting oscillator frequency is experimentally proven to be a linear function of the oxygen concentration.
- Figure 6 illustrates predicted results with the use of the present inventive method. As shown, at the beginning of time monitored, oxygen is present. The fluorescent decay time is thus short, resulting in a high oscillator frequency. After some time (which would depend on the particular micro-organism or bacteria species), oxygen is consumed which results in a longer fluorescence decay time and consequently lower oscillator frequencies. Once most of the oxygen is consumed, the bacterial growth process comes to an end, and the oscillator frequency will reach a final value. As shown, by monitoring the oscillator frequency over time, one can make a determination of whether a particular sample vial is a positive. The positives are shown moving from the higher value oscillator frequency to the lower value. The five positive sample vials shown change within a relatively short span of time, and with relatively constant slopes of change lines. As further shown, a negative vial would have no change in oscillator frequency. Experimental results are shown to follow the results illustrated in this figure.
- Figure 7 illustrates experimental results of adjusted sensor frequency for a vial which has been repeatedly removed and then reloaded. The resulting frequency variation is shown to be only plus or minus 0.2 kHz, corresponding to a variation in measured oxygen concentration of only plus or minus 0.015%. In intensity based systems, the positioning of the vial could result in some variations in the measured readings. Technicians periodically remove the vials and perform a visual check for bacterial growth. Thus, it is important that a method for analyzing the data be insensitive to repositioning. Decay time-based fluorescent sensor methods, such as the phase shift method, are relatively insensitive to repositioning. Thus, it is helpful to know that this inventive method is also insensitive to repositioning. This is borne out by the experimental results shown in Figure 7, wherein the removal of the vial does not result in any significant changes in the frequency.
- Figure 8 illustrates experimental results of a long-term stability test for a vial having no oxygen. The sensor drift is shown over a period of 42 days as being only .5 percent of oxygen concentration. Due to the lack of oxygen in the vial, this small amount of oxygen could actually be the result of seepage, rather than some problem with the data analysis methods of this invention. Again, it is important to learn that the inventive method would not have any such sensor drift.
- Figure 9 shows a first system for achieving the inventive method. As shown in figure 9, a
vial 21 receives aculture medium 24. Achemical sensor 23 is placed on a bottom surface ofvial 21. Anexcitation radiation source 25, which is preferably a blue or green LED, directs excitation radiation into thesensor 23.Radiation source 25 is connected to anelectronic signal source 26 which provides a DC bias and a high-frequency modulation voltage. Signalsource 26 receives a first and second control input. The first control input allows the source to be turned on and off. This control input is connected to the output of the low-frequency square-wave generator 27. The on/off feature is utilized to periodically take "dark" readings for the DC current. This will allow the elimination of background light from the calculation as will be described below. The second control signal provides for frequency control, as will be described below. Fluorescent light emerging fromsensor material 23 due to the excitation radiation fromsource 25 is detected by aphotodetector 28. Anemission filter 29 may be disposed betweensensor material 23 andphotodetector 28 to reject back-scattered excitation light. The output ofphotodetector 28 is fed topower splitter 30, which splits the emission radiation. One output ofpower splitter 30 is connected to the input of alow pass filter 31, the output of which is fed to the signal input of a lock-inamplifier 32. The output of the lock-inamplifier 32 is connected as the B-input of an A/B ratio unit 33. This is indicative of the DC component from the emission radiation. Also, lock-inamplifier 32 is connected with the low-frequencysquare wave generator 27. -
Power splitter 30 has its second output fed to the input of a high-pass filter 34.Filter 34 is connected via high-frequency volt meter 35 to the A input of the A/B ratio unit 33. This is indicative of a rectified AC component of the emission radiation. - The output of
ratio unit 33 and aDC power supply 37 are connected to the two inputs of an integratingcomparator 38.Comparator 38 is connected with the second control input for the frequency ofelectronic signal source 26.Electronic signal source 26 has an output which is connected to anelectronic frequency counter 39. - As should be understood from the above description,
radiation source 25 directs radiation intosensor 23.Sensor 23 emits radiation which is indicative of the conditions withinvial 24. That emission radiation is detected byphotodetector 28. A ratio of the AC and DC components of that emission radiation is provided tocomparator 38.Comparator 38 compares that ratio to a desired ratio. If the ratios are different, a voltage signal is developed. This voltage signal is received byelectronic signal source 26 to control the frequency of the radiation directed fromradiation source 25 intosensor 23. This process is ongoing until the ratios of the measured radiation and the desired ratio are found to be effectively equal bycomparator 38. Of course, some error margin can be developed such that the inventive method need not achieve absolute accuracy between the measured and desired ratios. - A modification of the system shown in figure 9 for a plurality of
vials 21 is illustrated in figure 10. Adjacent to eachvial 21, anLED 25 is disposed, as is the input of afiber 42. All of the LED's 25 are connected to amultiplexer 44, inputs of which are fed to the output of anelectronic signal source 26. The output of allfibers 42 are bundled together and arranged at the optical output to aphotodetector 46. Anemission filter 47 is mounted between the fiber bundles andphotodetector 28, again to remove back-scattered light. The remaining controls are generally similar to that illustrated in figure 9, and are shown by black box representations. - Figure 11 shows a
third embodiment system 60 according to the present invention.Vial 21 receives thechemical sensor 23. Anexcitation radiation source 25 is positioned adjacent tovial 21. Thesource 25 is connected to a firstelectronic signal source 61 which provides a DC bias and a high frequency modulation voltage at frequency f1. Signalsource 61 is equipped with a frequency control input connected to acomputer 62. Emission from thesensor material 23 are detected byphotodetector 28.Photodetector 28 is connected tosplitter 30. One output of thesplitter 30 is connected to the input of a low-pass filter 31, the output of which is fed to thecomputer 62 as the DC component.Computer 62 comprises standard analog-to-digital convertors, and measures the DC component which passes through the filter at 31. The other output of thepower splitter 30 is fed via a high-pass filter 34 to the RF input of an electronicbroad band mixer 64. This embodiment also comprises a secondelectronic signal source 66 which is equipped with a frequency control input connected tocomputer 62. The output of thesecond signal source 66 is fed at a frequency f2 to the LO input ofmixer 64. The IF output ofmixer 64 is connected via a second low-pass filter 68 to the input of anAC volt meter 70. The output ofvolt meter 70 is fed to thecomputer 62 as the AC component.Computer 62 is equipped with a standard optical data display such as is shown schematically at 72. - The comparison of measured and desired ratios and the adjustment of the frequencies with this embodiment is similar to that disclosed above. In this modification, however, the frequency f2 is maintained at a small difference from frequency f1. The signal leaving the second
electronic signal source 66 has a constant magnitude at the frequency f2. When the frequency at firstelectronic signal source 61 is changed during the measurement of the emissions fromsensor 23, the frequency f2 is also changed to maintain the set difference. The signal seen byfilter 68 is a low frequency signal, and the low-pass filter 68 can be utilized. The high frequency AC component is thus transferred into a low-frequency signal. By selecting a small frequency difference for f1 and f2, the detection band-width can be made extremely narrow, resulting in an increased signal-to-noise ratio for the AC component. The use ofmixer 64 also provides the advantage of a conversion gain for the RF signal. - Figure 12 shows a
further embodiment 80 which also incorporates the secondelectronic signal source 60. Figure 12 includes the ability to fine tune the ratio by correcting for any changes in the excitation modulation. As discussed above, one assumption made in the above calculations was that the excitation modulation would be effectively 100%. This embodiment measures and corrects for any deviation by the excitation modulation from that idealized amount. Thus, inembodiment 80,circuitry 82 for calculating the emission modulation is included which is similar to that shown in figure 11. Further,circuitry 86, which is also similar to that shown in figure 11, is used to calculate the excitation modulation. The excitation modulation is measured by asource monitor photodetector 84. - With this embodiment, one calculates both the excitation modulation and the emission modulation and then calculates a ratio which is the relative modulation m. This relative modulation is compared to the expected relative modulation as described above, and the frequency of the excitation radiation is adjusted until the measured and desired ratios are equal.
- In a further feature of all of the above described systems and methods, the radiation sources are periodically turned off and DC measurements are made. This will provide an indication of the so called "dark current" signal in the environment of the vial. Such dark current signals may be the result of ambient light, etc. The ratios calculated by the inventive methods are preferably adjusted by subtracting out this dark current DC value from the measured DC value prior to calculating the ratios. In this way, the measured results more accurately monitor the actual conditions within the vial, and more accurate test results are provided.
- Preferred embodiments of the instant invention have been disclosed. A worker of ordinary skill in the art would recognize, however, that certain modifications would come within the scope of this invention. For that reason the following claims should be studied in order to determine the true scope and content of this invention.
Claims (10)
- A method of analyzing emissions from a fluorescent chemical sensor comprising the steps of:(a) directing an intensity-modulated excitation radiation into a chemical sensor at a first frequency;(b) measuring the intensity of fluorescent emission from the chemical sensor based on the radiation of step (a);(c) calculating a ratio based on the AC and DC components of the measured emission;(d) comparing the calculated ratio to a desired ratio;(e) adjusting the frequency of the radiation directed into the chemical sensor in step (a), should the calculated ratio and the desired ratio differ;(f) repeating steps (a)-(e) until the calculated ratio is effectively equal to the desired ratio; and(g) measuring the adjusted frequency when step (f) is completed, and using that adjusted frequency to make a determination of whether the particular sample vial is experiencing bacterial growth.
- A method as recited in claim 1, wherein radiation being directed into the chemical sensor in step (a) is periodically turned off, but the measurements of the fluorescent emissions in step (b) continue to measure a dark signal current, and the DC reading of step (c) is adjusted to discount the dark signal current.
- A method as recited in claim 2, wherein there are two inputs controlling the source of radiation of step (a), with the first input controlling the on/off and a second input controlling changes in frequency.
- A method as recited in claim 1, wherein the desired ratio is equal 1/√3.
- A method as recited in claim 1, wherein the intensity of the excitation radiation of step (a) is also measured, and said calculated ratio includes a calculation incorporating the AC and DC components of the measured excitation radiation.
- A method as recited in claim 1, wherein the frequency of the directed radiation of step (a) is used to control a second signal source generating a signal which is sent to a mixer, along with the AC component of the emission radiation, the frequency of the second signal source signal being controlled to remain a small difference from the frequency of the directed radiation.
- A method as recited in claim 1, wherein the AC and DC components of the excitation radiation directed into the sensor in step (a) are also measured, and said calculated ratio is calculated by including said AC and DC components of said excitation radiation.
- A method as recited in claim 7, wherein said calculated ratio includes the ratio of the AC and DC components of said emission radiation divided by the ratio of said AC and DC components of said excitation radiation.
- A method as recited in claim 8, wherein the selected ratio is equal to 1/√3.
- An apparatus for analyzing fluorescent chemical sensors comprising:(a) an excitation radiation source adapted to direct an intensity-modulated excitation radiation into a vial containing a chemical sensor;(b) a photodetector to measure an emission from a chemical sensor due to said excitation radiation;(c) a control to control the frequency of said excitation radiation;(d) means to calculate a ratio of the AC and DC components of the emission radiation detected by said photodetector;(e) means to compare said measured ratio to a desired ratio; and(f) control means to adjust the frequency of said excitation radiation if said calculated and desired ratios differ.
Applications Claiming Priority (2)
| Application Number | Priority Date | Filing Date | Title |
|---|---|---|---|
| US08/197,033 US5593854A (en) | 1994-02-16 | 1994-02-16 | Data analysis method for use with fluorescent bacterial sensors |
| US197033 | 1994-02-16 |
Publications (3)
| Publication Number | Publication Date |
|---|---|
| EP0668497A2 true EP0668497A2 (en) | 1995-08-23 |
| EP0668497A3 EP0668497A3 (en) | 1995-11-02 |
| EP0668497B1 EP0668497B1 (en) | 2002-04-10 |
Family
ID=22727742
Family Applications (1)
| Application Number | Title | Priority Date | Filing Date |
|---|---|---|---|
| EP95300462A Expired - Lifetime EP0668497B1 (en) | 1994-02-16 | 1995-01-26 | Data analysis method for use with fluorescent bacterial sensors |
Country Status (7)
| Country | Link |
|---|---|
| US (1) | US5593854A (en) |
| EP (1) | EP0668497B1 (en) |
| JP (1) | JP2674736B2 (en) |
| AT (1) | ATE216074T1 (en) |
| AU (1) | AU684120B2 (en) |
| CA (1) | CA2140562C (en) |
| DE (1) | DE69526278T2 (en) |
Cited By (3)
| Publication number | Priority date | Publication date | Assignee | Title |
|---|---|---|---|---|
| EP0702226A3 (en) * | 1994-09-19 | 1996-06-26 | Hamamatsu Photonics Kk | Decay characteristic measuring apparatus |
| WO1997010494A1 (en) * | 1995-09-11 | 1997-03-20 | Becton Dickinson And Company | Fluorescence detector |
| EP0997728A2 (en) * | 1998-10-27 | 2000-05-03 | Fraunhofer-Gesellschaft Zur Förderung Der Angewandten Forschung E.V. | Apparatus and method for determining sample fluorescence |
Families Citing this family (19)
| Publication number | Priority date | Publication date | Assignee | Title |
|---|---|---|---|---|
| US6025189A (en) * | 1997-05-14 | 2000-02-15 | 3M Innovative Properties Company | Apparatus for reading a plurality of biological indicators |
| US5863790A (en) * | 1997-05-14 | 1999-01-26 | Minnesota Mining And Manfacturing Company | Biological sterility indicator |
| US6063591A (en) * | 1997-05-14 | 2000-05-16 | 3M Innovative Properties Company | System for measuring the efficacy of a sterilization cycle |
| US6426505B1 (en) | 2000-01-19 | 2002-07-30 | University Of Maryland Biotechnology Institute | Phase-modulation fluorometer and method for measuring nanosecond lifetimes using a lock-in amplifier |
| US8697029B2 (en) * | 2002-04-18 | 2014-04-15 | The Regents Of The University Of Michigan | Modulated physical and chemical sensors |
| JP3958733B2 (en) * | 2002-11-14 | 2007-08-15 | 日機装株式会社 | Blood purification equipment |
| US6872545B2 (en) * | 2003-03-20 | 2005-03-29 | Dade Behring Inc. | Microbiological analyzer using colorimetric means for biochemical color and growth determinations |
| CN105582523B (en) | 2005-10-08 | 2022-04-15 | 阿佩利斯制药公司 | Compstatin and analogs thereof for ocular disorders |
| PL2148691T3 (en) | 2007-02-05 | 2015-12-31 | Apellis Pharmaceuticals Inc | Compstatin analogues for use in the treatment of inflammatory conditions of the respiratory system |
| US9068977B2 (en) * | 2007-03-09 | 2015-06-30 | The Regents Of The University Of Michigan | Non-linear rotation rates of remotely driven particles and uses thereof |
| US20090069743A1 (en) * | 2007-09-11 | 2009-03-12 | Baxter International Inc. | Infusion therapy sensor system |
| CN102132145A (en) * | 2008-07-28 | 2011-07-20 | 医药及科学传感器公司 | Systems and methods for optical measurement of analyte concentration |
| ES2334426B1 (en) * | 2009-06-10 | 2010-09-27 | Adasa Sistemas, S.A.U. | OPTICAL PROCEDURE AND MODULE FOR MEASURING ABSORBANCE TO DISCRETE LAMBS FOR WATER QUALITY CONTROL APPLICATIONS. |
| US8846331B2 (en) | 2010-08-27 | 2014-09-30 | The Regents Of The University Of Michigan | Asynchronous magnetic bead rotation sensing systems and methods |
| US9816993B2 (en) | 2011-04-11 | 2017-11-14 | The Regents Of The University Of Michigan | Magnetically induced microspinning for super-detection and super-characterization of biomarkers and live cells |
| US9897543B2 (en) * | 2012-03-29 | 2018-02-20 | University Of Calcutta | Half-frequency spectral signatures |
| US9797817B2 (en) | 2012-05-03 | 2017-10-24 | The Regents Of The University Of Michigan | Multi-mode separation for target detection |
| US9983110B2 (en) | 2013-11-04 | 2018-05-29 | The Regents Of The University Of Michigan | Asynchronous magnetic bead rotation (AMBR) microviscometer for analysis of analytes |
| JP7423070B2 (en) | 2018-04-06 | 2024-01-29 | ザ トラスティーズ オブ ザ ユニバーシティ オブ ペンシルバニア | Compstatin analogs with increased solubility and improved pharmacokinetic properties |
Citations (4)
| Publication number | Priority date | Publication date | Assignee | Title |
|---|---|---|---|---|
| US4006360A (en) * | 1974-08-21 | 1977-02-01 | Block Engineering, Inc. | Method of discriminating between dyed particles and background fluorescence of the dye |
| US4150295A (en) * | 1978-01-05 | 1979-04-17 | Analytical Radiation Corporation | Method and apparatus for background correction in photoluminescent analysis |
| US4816687A (en) * | 1986-02-21 | 1989-03-28 | Degussa Ag | Method and apparatus for measurement of the fluorescence relaxation period of a fluorescent substance |
| EP0442295A2 (en) * | 1990-02-16 | 1991-08-21 | The Boc Group, Inc. | Frequency domain fluorometry using coherent sampling |
Family Cites Families (7)
| Publication number | Priority date | Publication date | Assignee | Title |
|---|---|---|---|---|
| CA1261717A (en) * | 1982-12-23 | 1989-09-26 | John R. Bacon | Method and apparatus for oxygen determination |
| US5030420A (en) * | 1982-12-23 | 1991-07-09 | University Of Virginia Alumni Patents Foundation | Apparatus for oxygen determination |
| US4945060A (en) * | 1988-03-15 | 1990-07-31 | Akzo N. V. | Device for detecting microorganisms |
| ATE132537T1 (en) * | 1990-03-29 | 1996-01-15 | Avl Photronics Corp | METHOD AND APPARATUS FOR DETECTING BIOLOGICAL ACTIVITIES IN A SAMPLE |
| FR2667894A1 (en) * | 1990-10-15 | 1992-04-17 | Rigeade Michel | Self-adhesive lath for wood panelling, parquet flooring or similar covering with continuous assembly, and method for fitting a covering consisting of such laths |
| US5272090A (en) * | 1992-03-31 | 1993-12-21 | Moshe Gavish | Sensor element for determining the amount of oxygen dissolved in a sample |
| US5293210A (en) * | 1992-04-24 | 1994-03-08 | Becton, Dickinson And Company | Detection of bacteria in blood culture bottles by time-resolved light scattering and absorption measurement |
-
1994
- 1994-02-16 US US08/197,033 patent/US5593854A/en not_active Expired - Lifetime
-
1995
- 1995-01-19 AU AU10296/95A patent/AU684120B2/en not_active Ceased
- 1995-01-19 CA CA002140562A patent/CA2140562C/en not_active Expired - Fee Related
- 1995-01-26 AT AT95300462T patent/ATE216074T1/en not_active IP Right Cessation
- 1995-01-26 EP EP95300462A patent/EP0668497B1/en not_active Expired - Lifetime
- 1995-01-26 DE DE69526278T patent/DE69526278T2/en not_active Expired - Fee Related
- 1995-02-16 JP JP7028282A patent/JP2674736B2/en not_active Expired - Lifetime
Patent Citations (4)
| Publication number | Priority date | Publication date | Assignee | Title |
|---|---|---|---|---|
| US4006360A (en) * | 1974-08-21 | 1977-02-01 | Block Engineering, Inc. | Method of discriminating between dyed particles and background fluorescence of the dye |
| US4150295A (en) * | 1978-01-05 | 1979-04-17 | Analytical Radiation Corporation | Method and apparatus for background correction in photoluminescent analysis |
| US4816687A (en) * | 1986-02-21 | 1989-03-28 | Degussa Ag | Method and apparatus for measurement of the fluorescence relaxation period of a fluorescent substance |
| EP0442295A2 (en) * | 1990-02-16 | 1991-08-21 | The Boc Group, Inc. | Frequency domain fluorometry using coherent sampling |
Cited By (7)
| Publication number | Priority date | Publication date | Assignee | Title |
|---|---|---|---|---|
| EP0702226A3 (en) * | 1994-09-19 | 1996-06-26 | Hamamatsu Photonics Kk | Decay characteristic measuring apparatus |
| WO1997010494A1 (en) * | 1995-09-11 | 1997-03-20 | Becton Dickinson And Company | Fluorescence detector |
| AU702995B2 (en) * | 1995-09-11 | 1999-03-11 | Becton Dickinson & Company | Fluorescence detector |
| EP0997728A2 (en) * | 1998-10-27 | 2000-05-03 | Fraunhofer-Gesellschaft Zur Förderung Der Angewandten Forschung E.V. | Apparatus and method for determining sample fluorescence |
| DE19849585A1 (en) * | 1998-10-27 | 2000-05-11 | Fraunhofer Ges Forschung | Device and method for determining the fluorescence of a sample |
| EP0997728A3 (en) * | 1998-10-27 | 2001-02-14 | Fraunhofer-Gesellschaft Zur Förderung Der Angewandten Forschung E.V. | Apparatus and method for determining sample fluorescence |
| DE19849585C2 (en) * | 1998-10-27 | 2001-06-28 | Fraunhofer Ges Forschung | Apparatus and method for determining the fluorescence of a sample |
Also Published As
| Publication number | Publication date |
|---|---|
| DE69526278T2 (en) | 2002-10-31 |
| ATE216074T1 (en) | 2002-04-15 |
| AU684120B2 (en) | 1997-12-04 |
| DE69526278D1 (en) | 2002-05-16 |
| AU1029695A (en) | 1995-08-24 |
| CA2140562C (en) | 2001-05-15 |
| CA2140562A1 (en) | 1995-08-17 |
| US5593854A (en) | 1997-01-14 |
| JPH07286959A (en) | 1995-10-31 |
| EP0668497A3 (en) | 1995-11-02 |
| JP2674736B2 (en) | 1997-11-12 |
| EP0668497B1 (en) | 2002-04-10 |
Similar Documents
| Publication | Publication Date | Title |
|---|---|---|
| EP0668497B1 (en) | Data analysis method for use with fluorescent bacterial sensors | |
| US5422720A (en) | Blood culture sensor station utilizing two distinct light sources | |
| US5026991A (en) | Gaseous species absorption monitor | |
| US5301014A (en) | Method and arrangement for spectroscopically measuring the concentration of a component of a gas sample | |
| JP2738500B2 (en) | Equipment for measuring biological activity in culture vessels | |
| US5108932A (en) | Process for the quantitative determination of at least one parameter of a liquid or gaseous sample | |
| US5686300A (en) | Fluorescence detector | |
| US4373818A (en) | Method and device for analysis with color identification test paper | |
| US7957001B2 (en) | Wavelength-modulation spectroscopy method and apparatus | |
| US9316585B2 (en) | Method and apparatus for determining a relaxation time dependent parameter related to a system | |
| Junker et al. | Fluorescence sensing of fermentation parameters using fiber optics | |
| PL1549932T3 (en) | Gas detection method and gas detector device | |
| CA2132271C (en) | Improved data collection method for use with chemical sensors | |
| CA2092372C (en) | Methods and apparatus for detecting microorganisms in blood culture vials | |
| EP0697460B1 (en) | Optical blood culture sensor | |
| US3897155A (en) | Atomic fluorescence spectrometer | |
| US4162851A (en) | Simultaneous photometering method and assembly for multi-dimensional measurements concerning biologically related materials | |
| US6903817B2 (en) | Method for optically detecting chemical species contained in condensed media | |
| JPH02195235A (en) | Fluorescence measuring apparatus | |
| JPS6127703B2 (en) | ||
| Vadde et al. | A closed loop scheme for phase‐sensitive fluorometry | |
| SU1190241A1 (en) | Method of determining composition of solid solutions | |
| Opitz et al. | The applicability of fluorescence indicators to measure hydrogen ion activities by optimizing accuracy and minimizing the influence of ionic strength | |
| KR20030086753A (en) | Method of signal detection for multichannel LAPS devices | |
| Lulu et al. | Internal Standard Calibration and Quantitative Measurement Method Based on Water Vapor for Cavity Enhanced Gas Raman Spectrum |
Legal Events
| Date | Code | Title | Description |
|---|---|---|---|
| PUAI | Public reference made under article 153(3) epc to a published international application that has entered the european phase |
Free format text: ORIGINAL CODE: 0009012 |
|
| AK | Designated contracting states |
Kind code of ref document: A2 Designated state(s): AT BE CH DE DK ES FR GB GR IE IT LI LU MC NL PT SE |
|
| PUAL | Search report despatched |
Free format text: ORIGINAL CODE: 0009013 |
|
| AK | Designated contracting states |
Kind code of ref document: A3 Designated state(s): AT BE CH DE DK ES FR GB GR IE IT LI LU MC NL PT SE |
|
| 17P | Request for examination filed |
Effective date: 19960426 |
|
| 17Q | First examination report despatched |
Effective date: 20000914 |
|
| GRAG | Despatch of communication of intention to grant |
Free format text: ORIGINAL CODE: EPIDOS AGRA |
|
| GRAG | Despatch of communication of intention to grant |
Free format text: ORIGINAL CODE: EPIDOS AGRA |
|
| GRAH | Despatch of communication of intention to grant a patent |
Free format text: ORIGINAL CODE: EPIDOS IGRA |
|
| GRAH | Despatch of communication of intention to grant a patent |
Free format text: ORIGINAL CODE: EPIDOS IGRA |
|
| REG | Reference to a national code |
Ref country code: GB Ref legal event code: IF02 |
|
| GRAA | (expected) grant |
Free format text: ORIGINAL CODE: 0009210 |
|
| AK | Designated contracting states |
Kind code of ref document: B1 Designated state(s): AT BE CH DE DK ES FR GB GR IE IT LI LU MC NL PT SE |
|
| PG25 | Lapsed in a contracting state [announced via postgrant information from national office to epo] |
Ref country code: NL Free format text: LAPSE BECAUSE OF FAILURE TO SUBMIT A TRANSLATION OF THE DESCRIPTION OR TO PAY THE FEE WITHIN THE PRESCRIBED TIME-LIMIT Effective date: 20020410 Ref country code: LI Free format text: LAPSE BECAUSE OF FAILURE TO SUBMIT A TRANSLATION OF THE DESCRIPTION OR TO PAY THE FEE WITHIN THE PRESCRIBED TIME-LIMIT Effective date: 20020410 Ref country code: GR Free format text: LAPSE BECAUSE OF FAILURE TO SUBMIT A TRANSLATION OF THE DESCRIPTION OR TO PAY THE FEE WITHIN THE PRESCRIBED TIME-LIMIT Effective date: 20020410 Ref country code: CH Free format text: LAPSE BECAUSE OF FAILURE TO SUBMIT A TRANSLATION OF THE DESCRIPTION OR TO PAY THE FEE WITHIN THE PRESCRIBED TIME-LIMIT Effective date: 20020410 Ref country code: BE Free format text: LAPSE BECAUSE OF FAILURE TO SUBMIT A TRANSLATION OF THE DESCRIPTION OR TO PAY THE FEE WITHIN THE PRESCRIBED TIME-LIMIT Effective date: 20020410 Ref country code: AT Free format text: LAPSE BECAUSE OF FAILURE TO SUBMIT A TRANSLATION OF THE DESCRIPTION OR TO PAY THE FEE WITHIN THE PRESCRIBED TIME-LIMIT Effective date: 20020410 |
|
| REF | Corresponds to: |
Ref document number: 216074 Country of ref document: AT Date of ref document: 20020415 Kind code of ref document: T |
|
| REG | Reference to a national code |
Ref country code: CH Ref legal event code: EP |
|
| REG | Reference to a national code |
Ref country code: IE Ref legal event code: FG4D |
|
| REF | Corresponds to: |
Ref document number: 69526278 Country of ref document: DE Date of ref document: 20020516 |
|
| PG25 | Lapsed in a contracting state [announced via postgrant information from national office to epo] |
Ref country code: SE Free format text: LAPSE BECAUSE OF FAILURE TO SUBMIT A TRANSLATION OF THE DESCRIPTION OR TO PAY THE FEE WITHIN THE PRESCRIBED TIME-LIMIT Effective date: 20020710 Ref country code: PT Free format text: LAPSE BECAUSE OF FAILURE TO SUBMIT A TRANSLATION OF THE DESCRIPTION OR TO PAY THE FEE WITHIN THE PRESCRIBED TIME-LIMIT Effective date: 20020710 Ref country code: DK Free format text: LAPSE BECAUSE OF FAILURE TO SUBMIT A TRANSLATION OF THE DESCRIPTION OR TO PAY THE FEE WITHIN THE PRESCRIBED TIME-LIMIT Effective date: 20020710 |
|
| ET | Fr: translation filed | ||
| NLV1 | Nl: lapsed or annulled due to failure to fulfill the requirements of art. 29p and 29m of the patents act | ||
| REG | Reference to a national code |
Ref country code: CH Ref legal event code: PL |
|
| PG25 | Lapsed in a contracting state [announced via postgrant information from national office to epo] |
Ref country code: ES Free format text: LAPSE BECAUSE OF FAILURE TO SUBMIT A TRANSLATION OF THE DESCRIPTION OR TO PAY THE FEE WITHIN THE PRESCRIBED TIME-LIMIT Effective date: 20021030 |
|
| PG25 | Lapsed in a contracting state [announced via postgrant information from national office to epo] |
Ref country code: LU Free format text: LAPSE BECAUSE OF NON-PAYMENT OF DUE FEES Effective date: 20030126 Ref country code: GB Free format text: LAPSE BECAUSE OF NON-PAYMENT OF DUE FEES Effective date: 20030126 |
|
| PG25 | Lapsed in a contracting state [announced via postgrant information from national office to epo] |
Ref country code: IE Free format text: LAPSE BECAUSE OF NON-PAYMENT OF DUE FEES Effective date: 20030127 |
|
| PG25 | Lapsed in a contracting state [announced via postgrant information from national office to epo] |
Ref country code: MC Free format text: LAPSE BECAUSE OF NON-PAYMENT OF DUE FEES Effective date: 20030131 |
|
| PLBE | No opposition filed within time limit |
Free format text: ORIGINAL CODE: 0009261 |
|
| STAA | Information on the status of an ep patent application or granted ep patent |
Free format text: STATUS: NO OPPOSITION FILED WITHIN TIME LIMIT |
|
| 26N | No opposition filed |
Effective date: 20030113 |
|
| PG25 | Lapsed in a contracting state [announced via postgrant information from national office to epo] |
Ref country code: DE Free format text: LAPSE BECAUSE OF NON-PAYMENT OF DUE FEES Effective date: 20030801 |
|
| GBPC | Gb: european patent ceased through non-payment of renewal fee | ||
| PG25 | Lapsed in a contracting state [announced via postgrant information from national office to epo] |
Ref country code: FR Free format text: LAPSE BECAUSE OF NON-PAYMENT OF DUE FEES Effective date: 20030930 |
|
| REG | Reference to a national code |
Ref country code: FR Ref legal event code: ST |
|
| REG | Reference to a national code |
Ref country code: IE Ref legal event code: MM4A |
|
| PG25 | Lapsed in a contracting state [announced via postgrant information from national office to epo] |
Ref country code: IT Free format text: LAPSE BECAUSE OF NON-PAYMENT OF DUE FEES;WARNING: LAPSES OF ITALIAN PATENTS WITH EFFECTIVE DATE BEFORE 2007 MAY HAVE OCCURRED AT ANY TIME BEFORE 2007. THE CORRECT EFFECTIVE DATE MAY BE DIFFERENT FROM THE ONE RECORDED. Effective date: 20050126 |