EP0664459B1 - Waveform display apparatus for easily realizing high-definition waveform observation - Google Patents
Waveform display apparatus for easily realizing high-definition waveform observation Download PDFInfo
- Publication number
- EP0664459B1 EP0664459B1 EP95105455A EP95105455A EP0664459B1 EP 0664459 B1 EP0664459 B1 EP 0664459B1 EP 95105455 A EP95105455 A EP 95105455A EP 95105455 A EP95105455 A EP 95105455A EP 0664459 B1 EP0664459 B1 EP 0664459B1
- Authority
- EP
- European Patent Office
- Prior art keywords
- frequency
- display
- measurement
- sweep
- waveform
- Prior art date
- Legal status (The legal status is an assumption and is not a legal conclusion. Google has not performed a legal analysis and makes no representation as to the accuracy of the status listed.)
- Expired - Lifetime
Links
- 238000005259 measurement Methods 0.000 claims description 72
- 238000010408 sweeping Methods 0.000 claims description 7
- 238000012545 processing Methods 0.000 claims description 5
- 238000001228 spectrum Methods 0.000 description 99
- 230000006870 function Effects 0.000 description 29
- 238000000034 method Methods 0.000 description 16
- 239000003550 marker Substances 0.000 description 12
- 238000013144 data compression Methods 0.000 description 10
- 238000001514 detection method Methods 0.000 description 10
- 238000010586 diagram Methods 0.000 description 9
- 238000007906 compression Methods 0.000 description 4
- 230000006835 compression Effects 0.000 description 4
- 230000003247 decreasing effect Effects 0.000 description 3
- 230000004044 response Effects 0.000 description 3
- 230000008859 change Effects 0.000 description 2
- 238000007796 conventional method Methods 0.000 description 2
- 230000008569 process Effects 0.000 description 2
- 238000006243 chemical reaction Methods 0.000 description 1
- 230000007274 generation of a signal involved in cell-cell signaling Effects 0.000 description 1
- 230000006872 improvement Effects 0.000 description 1
- 238000000691 measurement method Methods 0.000 description 1
- 230000004048 modification Effects 0.000 description 1
- 238000012986 modification Methods 0.000 description 1
- 230000002035 prolonged effect Effects 0.000 description 1
- 230000002441 reversible effect Effects 0.000 description 1
- 238000012546 transfer Methods 0.000 description 1
- 230000001052 transient effect Effects 0.000 description 1
- 230000000007 visual effect Effects 0.000 description 1
Images


Classifications
-
- G—PHYSICS
- G01—MEASURING; TESTING
- G01R—MEASURING ELECTRIC VARIABLES; MEASURING MAGNETIC VARIABLES
- G01R23/00—Arrangements for measuring frequencies; Arrangements for analysing frequency spectra
- G01R23/16—Spectrum analysis; Fourier analysis
- G01R23/163—Spectrum analysis; Fourier analysis adapted for measuring in circuits having distributed constants
-
- G—PHYSICS
- G01—MEASURING; TESTING
- G01R—MEASURING ELECTRIC VARIABLES; MEASURING MAGNETIC VARIABLES
- G01R13/00—Arrangements for displaying electric variables or waveforms
- G01R13/20—Cathode-ray oscilloscopes
- G01R13/22—Circuits therefor
- G01R13/34—Circuits for representing a single waveform by sampling, e.g. for very high frequencies
- G01R13/345—Circuits for representing a single waveform by sampling, e.g. for very high frequencies for displaying sampled signals by using digital processors by intermediate A.D. and D.A. convertors (control circuits for CRT indicators)
-
- G—PHYSICS
- G01—MEASURING; TESTING
- G01R—MEASURING ELECTRIC VARIABLES; MEASURING MAGNETIC VARIABLES
- G01R23/00—Arrangements for measuring frequencies; Arrangements for analysing frequency spectra
- G01R23/16—Spectrum analysis; Fourier analysis
-
- G—PHYSICS
- G01—MEASURING; TESTING
- G01R—MEASURING ELECTRIC VARIABLES; MEASURING MAGNETIC VARIABLES
- G01R23/00—Arrangements for measuring frequencies; Arrangements for analysing frequency spectra
- G01R23/16—Spectrum analysis; Fourier analysis
- G01R23/173—Wobbulating devices similar to swept panoramic receivers
-
- G—PHYSICS
- G01—MEASURING; TESTING
- G01R—MEASURING ELECTRIC VARIABLES; MEASURING MAGNETIC VARIABLES
- G01R27/00—Arrangements for measuring resistance, reactance, impedance, or electric characteristics derived therefrom
- G01R27/28—Measuring attenuation, gain, phase shift or derived characteristics of electric four pole networks, i.e. two-port networks; Measuring transient response
- G01R27/32—Measuring attenuation, gain, phase shift or derived characteristics of electric four pole networks, i.e. two-port networks; Measuring transient response in circuits having distributed constants, e.g. having very long conductors or involving high frequencies
-
- Y—GENERAL TAGGING OF NEW TECHNOLOGICAL DEVELOPMENTS; GENERAL TAGGING OF CROSS-SECTIONAL TECHNOLOGIES SPANNING OVER SEVERAL SECTIONS OF THE IPC; TECHNICAL SUBJECTS COVERED BY FORMER USPC CROSS-REFERENCE ART COLLECTIONS [XRACs] AND DIGESTS
- Y10—TECHNICAL SUBJECTS COVERED BY FORMER USPC
- Y10S—TECHNICAL SUBJECTS COVERED BY FORMER USPC CROSS-REFERENCE ART COLLECTIONS [XRACs] AND DIGESTS
- Y10S715/00—Data processing: presentation processing of document, operator interface processing, and screen saver display processing
- Y10S715/961—Operator interface with visual structure or function dictated by intended use
- Y10S715/965—Operator interface with visual structure or function dictated by intended use for process control and configuration
- Y10S715/97—Instrumentation and component modelling, e.g. interactive control panel
Definitions
- the present invention relates to a waveform display apparatus of a frequency sweep type including a spectrum analyzer for analyzing the spectrum of a signal, a network analyzer for analyzing the characteristic of a circuit element, and the like and, more particularly, to a waveform display apparatus which can easily perform high-definition observation of a desired peak/dip portion in a displayed waveform.
- a waveform display apparatus such as a spectrum analyzer, a network analyzer, or the like displays the spectrum of a signal to be measured, the transfer characteristic of a circuit element to be measured, or the like while developing it on the frequency axis.
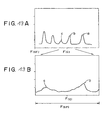
- each spectrum pattern to be observed is not always displayed by a single line segment, but has a mountain-like pattern in which a spectrum upper portion forms a moderate curve, and its lower portion is spread, although it depends on a measurement condition.
- the level and frequency of a maximum level point (peak) of a spectrum display having a mountain-like pattern correspond to those of a spectrum to be observed. For this reason, the maximum point of the spectrum must be searched.
- a spectrum may be displayed to have a valley-like pattern in a direction opposite to the above-mentioned case. In this case, the level and frequency of a minimum level point (dip) correspond to those of a spectrum to be observed.
- zone marker function 1 ⁇ and the zone sweep function 2 ⁇ will be examined below.
- the zone position must be set again.
- a user When a portion adjacent to an observed spectrum is to be enlarged, a user must instruct to change the center frequency (CENTER FREQ) by a panel operation so as to display the corresponding signal at the center of a screen of a CRT. (For example, an instruction for causing the frequency of the marker point to coincide with the center frequency must be issued.)
- the signal (center) tracking function 3 ⁇ will be examined below.
- This function only a portion inside a display range of a CRT screen is searched. For this reason, when a spectrum of a portion adjacent to a given signal is observed by sweeping a narrow band, the signal may abruptly drift, and may fall outside the CRT screen. In this manner, in order to search a signal in an observation disable state, a user must set a wider span (sweep frequency width) again to detect a signal to be observed, and thereafter, must narrow the span to restore an original state.
- the foreground FG & background BG two-frame display function 4 ⁇ will be examined below.
- the display area on a panel surface of a device must be inevitably increased. That is, when the entire display area is suppressed to be reduced in scale, displayed data is not easy to see for a user.
- a user must set the zone position in the BC display again when a signal to be observed drifts.
- spectrum data extends over two traces, and when data is saved or recalled, a large memory capacity is required.
- a spectrum analyzer as shown in Fig. 18 is conventionally used.
- a measurement unit P1 having a heterodyne receiver arrangement capable of sweeping a local frequency continuously sweeps and detects a predetermined frequency range of an input measurement signal, and outputs detection signals.
- a waveform memory P2 updates and stores the detection signals output during one sweep operation as a series of waveform data for each sweep operation.
- a display controller P3 displays waveform data stored in the waveform memory P2 on a display device P4 as a spectrum waveform to have the frequency axis as the abscissa.
- a start frequency setting unit P5 sets a sweep detection start frequency of the measurement unit P1.
- a center frequency setting unit P6 sets a sweep detection center frequency.
- a frequency span setting unit P7 sets a width (span) of a sweep detection frequency.
- a start ⁇ center frequency calculation unit P8 updates and sets a start or center frequency using a changed/set condition frequency with priority, so that the following relation can be established for condition frequencies from the frequency setting units P5, P6, and P7 for determining a range of the sweep detection frequency:
- Center frequency F(c) Start frequency F(st) + Frequency span F(sp)/2
- the start ⁇ center frequency calculation unit P8 calculates and updates/sets a center frequency which can satisfy equation (1) for the new start frequency and the frequency span.
- a spectrum waveform is shifted by a difference in start frequency, and the same applies to a case wherein the center frequency is changed/set.
- the spectrum waveform is displayed in an enlarged or reduced scale to have the start frequency as the center.
- the spectrum waveform is displayed in an enlarged or reduced scale to have the center frequency as the center.
- a spectrum waveform as shown in Fig. 19A is displayed on a screen of the display device P4
- a spectrum near the center frequency (F(c)) is to be observed in an enlarged scale
- the frequency span can be decreased while the center frequency is fixed.
- the spectrum waveform is displayed in an enlarged scale to have the center frequency as the center, as shown in Fig. 19B.
- Fig. 20(A) when a spectrum near a point a is to be observed in an enlarged scale, the spectrum waveform is shifted (by changing the start or center frequency) so that the point a is located at almost the center frequency, and thereafter, the frequency span is decreased while the center frequency is fixed.
- Fig. 20B the spectrum near the point a is displayed in an enlarged scale to have the center frequency as the center, and further detailed spectrum observation is allowed.
- a marker point which is arbitrarily movable on a waveform may be provided, as has been realized in an oscilloscope, and a function (zoom function) of locating the marker point at a display center upon operation of a special-purpose enlargement key, and performing an enlarged-scale display to have the display center as the center may be utilized.
- a function zoom function
- an enlarged waveform is fixed at the display center, resulting in inconvenience.
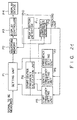
- a spectrum analyzer as shown in Fig. 21 is known.
- reference numeral P10 denotes a tracking unit for preventing movement of a spectrum waveform on a screen for a measurement signal suffering from a frequency drift.
- the tracking unit P10 detects an address corresponding to a maximum value of waveform data stored in a waveform memory P2 from a peak position detection unit 11, causes a frequency difference detection unit P12 to obtain the difference between a frequency corresponding to this address and the center frequency, and shifts a sweep detection frequency range by the difference.
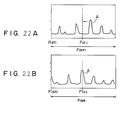
- a spectrum waveform as shown in, e.g., Fig. 22A is displayed on a screen of a display device P4, and the tracking unit P10 is operated, the overall spectrum waveform is shifted, so that the position of a maximum-level spectrum A is located at the center of the screen (at the position of the center frequency), as shown in Fig. 22B.
- condition frequencies (the start frequency, the frequency span, and the like) must be adjusted in advance to cause a spectrum having a large level to fall outside the sweep detection frequency range. As a result, observation on a single screen is undesirably disturbed.
- FIG. 23 A conventional spectrum analyzer having an arrangement as shown in Fig. 23 is also known.
- Fig. 24A shows a display example measured by the arrangement shown in Fig. 23.
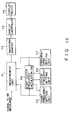
- a local oscillator 1a in a measurement unit 1 outputs a frequency-swept signal to a mixer 1b according to instructions from a control unit 10a and a sweep signal generation unit 11a, and causes the mixer to convert up to 5th-order harmonic components of an input signal to be measured into intermediate-frequency (IF) signals. Therefore, the local oscillator 1a continuously frequency-sweeps the input signal to be measured over a band of almost 500 MHz.
- the IF signals passing through a band-pass filter (to be referred to as a BPF hereinafter) 1c are detected by a detector 1d, are converted into digital data by an A/D converter 2, and are stored in a storage unit 3 in correspondence with the swept frequencies.
- Data stored in the storage unit (waveform memory) 3 are displayed on a display screen of a display device 4.
- the data display on the display screen is made on a coordinate system defined by the abscissa as a frequency axis and the ordinate as a level axis by a predetermined total number of dots, e.g., 500 points for each of the abscissa and the ordinate.
- the numeric values in this case reveal that the comprehensive measurement resolution visually observed from the display screen is determined by the display resolution, and is 1 MHz.
- the analysis resolution 22.4 KHz is not effective.
- the comprehensive measurement resolution tends to be determined by the display resolution as the frequency sweep bandwidth BW is larger, and tends to be determined by the analysis resolution as the bandwidth BW is smaller although it depends on the sweep time.
- a measurement device for making a display as shown in Fig. 24B is known.
- This measurement device designates frequencies of respective harmonic components to measure the levels at the designated frequency points, and processes the data to display the data as a bar graph.
- this measurement device the above-mentioned problem 2 can be solved.
- a signal to be measured which may include components other than harmonic components is to be measured, whether or not harmonic components are measured in practice cannot be confirmed.
- the present invention has been made in consideration of the above situation, and has as its first object to provide a waveform display apparatus of frequency sweep type, which can easily provide, to a user, high-definition waveform observation of a waveform displayed to be developed on the frequency axis.
- a conventional spectrum analyzer shown in Fig. 23 i.e., to realize a waveform display apparatus of frequency sweep type, which can measure a plurality of specified adjacent frequencies as objects to be measured, e.g., adjacent harmonic components with a high resolution while recognizing objects to be measured, and can easily provide high-definition waveform observation to a user.
- the present invention is directed to a (spectrum) waveform display apparatus which selects (spectrum) waveforms near a plurality of frequency components of those of a signal to be measured, and simultaneously displays the spectrum waveforms of the respective measured frequency components on individual display regions obtained by dividing one display screen by the number of the plurality of frequency components in a direction of abscissa (frequency axis).
- the present invention is directed to a (spectrum) waveform display apparatus which is convenient for a case wherein, in, e.g., a spectrum analyzer, when only harmonic components of an unknown signal to be measured are to be measured, waveforms near the respective harmonic components must be separated from components other than the harmonic components by increasing a resolution, and only the harmonic components must be reliably and quickly measured, and a case wherein when a specific harmonic component due to a distortion of a signal output from an electronic circuit such as a signal generator, or the like is adjusted, a state of a change in harmonic component including another fundamental wave must be simultaneously observed in an enlarged scale.
- a specific harmonic component due to a distortion of a signal output from an electronic circuit such as a signal generator, or the like
- a signal to be measured includes frequency components over a wide band
- specific frequency components and waveform near these components can be quickly observed with a high resolution.
- the waveform display apparatus comprises the following frequency range selection means, sweep means, and display means in a spectrum display apparatus for measuring and displaying the spectrum of a signal to be measured.
- the frequency range selection means selects a plurality of frequency ranges between upper and lower limits of a frequency range to be measured.
- the means selects predetermined frequency ranges (2 ⁇ f, 10 ⁇ f ⁇ 5f 1 ) to have frequencies (f 1 , 2f 1 , 3f 1 , 4f 1 , 5f 1 in the order from the lower ones) of first- to fifth- order harmonic components of frequency components of a signal to be measured as the centers on the basis of the fundamental wave f 1 of the signal to be measured.
- the predetermined frequency range 2 ⁇ f is a range to be frequency-swept near each harmonic component.
- the sweep means respectively sweeps only the plurality of frequency ranges (f 1 ⁇ ⁇ f, 2f 1 ⁇ ⁇ f, 3f 1 ⁇ f, 4f 1 ⁇ ⁇ f, 5f 1 ⁇ ⁇ f) at a higher resolution than a measurement resolution when a measurement is continuously performed from the lower limit to the upper limit (the conventional apparatus requires at least a band of 5f 1 ).
- the display means simultaneously displays spectra in the plurality of frequency range obtained by the sweep operations.
- a waveform display apparatus can be characterized by further comprising a data selection unit in addition to the above-mentioned means.
- a sweep velocity when the plurality of frequency ranges are swept is decreased to increase the number of data to be obtained (to increase the total number of dots on the abscissa), and the data selection unit selects the predetermined number of data of spectra of the plurality of frequency ranges in each frequency range, converts them into the predetermined total number of dots on the abscissa, and outputs the converted data.
- the S/N can be further increased since a measurement is performed by increasing the number of data (the total number of dots on the abscissa). If the total number of dots for a display remains the same, the comprehensive measurement resolution is left unchanged.
- the conventional apparatus requires a band of 5f 1 to measure up to a 5th-order harmonic component, its display resolution is 5f 1 /the total number of dots, while the display resolution attained is 10 ⁇ f/the total number of dots. Therefore, the display resolution can be improved f 1 /2 ⁇ f times that of the conventional apparatus, and an effective value of the analysis resolution can be increased correspondingly. Since ranges near desired frequencies (f 1 ⁇ ⁇ f, 2f 1 ⁇ ⁇ f, 3f 1 ⁇ ⁇ f, 4f 1 ⁇ ⁇ f, 5f 1 ⁇ ⁇ f) can be measured in this state, the S/N can be increased as well as an improvement of performance for discriminating a desired signal and other signals.
- a plurality of desired signals including adjacent spectra can be simultaneously observed on a single screen.
- the display resolution is left unchanged, since the measurement resolution can be increased, the S/N can be increased accordingly.
- the multi-screen display function according to an embodiment is directed to a harmonic measurement.
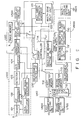
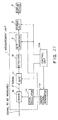
- Fig. 7A is a diagram showing an arrangement of a spectrum analyzer adopting this embodiment of the present invention.
- Fig. 7B shows Fig. 7A in correspondence with the basic arrangement shown in Fig. 1.
- the same reference numerals in Fig. 7B denote the same parts as in Fig. 1 and Fig. 7A, and a detailed description thereof will be omitted.
- a measurement unit 10 (U100), an A/D converter 2 (104), and a storage unit 3 (5) are the same as those described in the prior art (Fig. 23).
- a frequency range selection unit 5a When a frequency range selection unit 5a receives frequency information of a fundamental wave of a signal to be measured, it obtains frequencies (f 1 , 2f 1 , 3f 1 , 4f 1 , and 5f 1 in the order from lower frequencies) of, e.g., up to 5th-order harmonic components. More specifically, a process of obtaining frequencies of 2nd-, 3rd-, 4th-, and 5th-order harmonic components from the frequency of the fundamental wave is the same as that of obtaining the two-signal, 3rd-order frequencies.
- the predetermined bandwidth 2 ⁇ f corresponds to a sweep width near the fundamental wave and the respective harmonic components to be measured by frequency sweep operations.
- the respective sweep frequency ranges BW1 to BW5 are respectively 99.5 to 100.5 MHz, 199.5 to 200.5 MHz, 299.5 to 300.5 MHz, 399.5 to 400.5 MHz, and 499.5 to 500.5 MHz.
- a sweep unit 60 is constituted by a resolution setting unit 6c, a clock generator 6b, and a sweep signal generator 6a in this embodiment.
- the sweep signal generator 6a receives the pieces of frequency range information BW1 to BW5 from the frequency range selection unit 5a, and generates and outputs a sweep signal for causing a local oscillator la to sweep frequencies in synchronism with a clock from the clock generator 6b.
- the clock generator 6b generates a clock corresponding to the total number of dots/period. This clock determines a conversion timing of the A/D converter 2, and designates an address of the storage unit 3.
- the resolution setting unit 6c sets a bandwidth of an analysis resolution which satisfies the above-mentioned equation (1), and is approximate to a display resolution 10 ⁇ f/the total number of dots in accordance with the predetermined bandwidth 2 ⁇ f.
- Fig. 8 illustrates a sweep signal when it is assumed that the sweep time of one period of the present invention is the same as that of the prior art on a coordinate system wherein the sweep time is plotted along the abscissa, and the voltage of the sweep signal and the frequency to be swept are plotted along the ordinate. Note that the local oscillator 1a outputs a frequency proportional to the voltage of the sweep signal.
- the feature of the waveform of the sweep signal of the present invention is that the waveform changes stepwise, and an inclination when each of the desired frequency ranges BW1 to BW5 is swept is slow. Consequently, since a sweep speed when each of the desired frequency ranges BW1 to BW5 is swept is low (a substantial sweep time per unit frequency range is prolonged), the band of a BPF 1c can be narrowed, thus increasing the analysis resolution. Since the desired frequency ranges BW1 to BW5 are selectively swept step-wise while the total number of dots on the abscissa per period remains the same as in the prior art, portions excluding non-selected bands can be measured and displayed in an enlarged scale, thus also increasing the display resolution.
- Outputs from a measurement unit 10 are stored by the A/D converter 2 and the storage unit 3 at the timing of the clock from the clock generator 6b.
- data to be stored data of only the desired frequency ranges BW1 to BW5 are stored in the order from lower frequencies (in the order of sweep frequencies).
- a display data processor U20 for controlling a display device U500 is constituted by the storage unit 3, a display controller 7a, and a trace memory 7b in this embodiment.
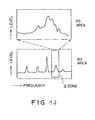
- the display controller 7a receives the pieces of desired frequency range information BW1 to BW5 selected in advance by the frequency range selection unit 5a, and forms a display format obtained by dividing a display screen into a predetermined number of sections, e.g., five sections in this embodiment, and assigning frequencies to these sections. Data stored in the storage unit 3 are read out, and are displayed on the display device U500 according to the display format. Fig. 9 shows this display example.
- the analysis resolution can be about 0.7 kHz according to equation (1).
- the effective comprehensive measurement resolution is 10 kHz which is equal to the display resolution.
- the measurement resolution of this embodiment is better than the conventional analysis resolution as well as the conventional measurement resolution.
- the S/N can be increased accordingly, and the measurement dynamic range can be widened. Since the respective harmonic components can be displayed in an enlarged scale, they are easy to see.
- the frequency range selection unit 5a, the sweep unit 60, and the display controller 7a of this embodiment can be constituted using a CPU.
- Fig. 10A shows a modification of the spectrum analyzer adopting the fourth embodiment.
- each of the desired frequency ranges BW1 to BW5 (each having the bandwidth 2 ⁇ f) is directly assigned to the number of dots, 100, (the number of dots obtained by dividing the total number of dots, 500, on the abscissa with 5 as the number of the desired frequency ranges BW1 to BW5), thereby performing a measurement and a display.
- 1/5 compression can be attained by generating new data point by point every 5 points of the data measured five times.
- data compression processing for generating the 5-point data as new 1-point data processing for obtaining a maximum value, a minimum value, or an average value of the levels is known.
- a data compression unit 8 is newly arranged, and that a sweep signal from the sweep generator 6a (see Fig. 7A) included in the sweep unit 60 has a different waveform in Fig. 10A.
- the storage method of the storage unit 3 is changed in correspondence with the difference in waveform of the sweep signal from the sweep generator 6a.
- a maximum value is detected as the data compression processing.
- the sweep signal generator 6a receives the pieces of frequency range information BW1 to BW5 output from the frequency range selection unit 5a, and generates and outputs a sweep signal for causing the local oscillator 1a to sweep frequencies in synchronism with a clock from the clock generator 6b (see Fig. 7A; the same applies to the following description).
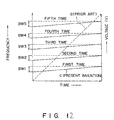
- the sweep signal in this case will be described below with reference to Fig. 12.
- solid lines c are for explaining the sweep signal of Fig. 10A
- dotted lines a are an example of the conventional sweep signal.
- the sweep signal of Fig. 10A sweeps one desired frequency range in a conventional sweep time per period, and performs five sweep operations in correspondence with the pieces of frequency range information BW1 to BW5.
- the storage unit 3 must have a memory capacity five times the total number of dots on the abscissa in Fig. 7A, or must output stored data to the data compression unit 8 in the next stage at proper time intervals if it has the same capacity as that in Fig. 7A.
- the storage unit 3 is assumed have a capacity five times that in Fig. 7A.
- the period of the clock sent from the clock generator 6b to the storage unit 3 is the same as that in Fig. 7A.
- a clock output time must be five times that in Fig. 7A in correspondence with the capacity of the storage unit 3 (or the sweep signal from the sweep signal generator 6a).
- the data compression unit 8 is constituted by a maximum value detector 8a, a display memory 8b, and a data controller 8c.
- the data controller 8c reads out data corresponding in number to the desired frequency ranges BW1 to BW5 from a lower frequency (from a lower address of the storage unit 3), i.e., five data from addresses 0 to 4.
- the maximum value detector 8a detects a maximum value of the five data.
- the data controller 8c selects the maximum value, and writes it at address 0 of the display memory 8b.
- the data controller 8c repeats such an operation every five addresses of the storage unit 3 to convert all the data corresponding to the frequency ranges BW1 to BW5 stored in the storage unit 3, and writes the converted data in the display memory 8b.
- the data compression unit 8 selects every 5th data stored in the storage unit 3 to compress the data to 1/5, thereby converting the number of data to that the same as the total number of dots on the abscissa.
- the unit 8 sends the converted data to the display device U500, and causes it to display the data.
- the analysis resolution is 1 kHz.
- This measurement resolution is five times that in Fig. 14, and the S/N can be increased accordingly, thus widening the measurement dynamic range.
- the value of the display resolution of data output from the storage unit 3, and compressed and stored in the display memory 8b is 10 kHz since it is five times the measurement resolution of 2 kHz. In this manner, at the end timing, the display resolution is the same as that in Fig. 7A. However, the improved measurement dynamic range can be maintained.
- the frequency of a spectrum generally means a frequency corresponding to the maximum level of the spectrum. Therefore, in this measurement, a frequency value corresponding to the maximum level of each spectrum including a harmonic component is finally required.
- the frequency value is obtained from non-compressed data in the storage unit 3, and if the obtained value can be numerically displayed as a frequency value representing a maximum value after compression, frequency measurement precision depending on the measurement resolution before compression can be maintained. In this case, an error caused by visual observation is determined by the display resolution after compression.
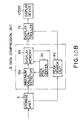
- Fig. 10B shows an arrangement of an embodiment for displaying a marker, and a frequency value of the marker point.
- a peak search unit 8d is arranged in addition to Fig. 10A.
- the display controller 7a adds a marker to display data on the display device U500 upon an instruction from the peak search unit 8d, and at the same time, numerically displays the corresponding frequency value.
- the peak search unit 8d searches a point representing a maximum value in each range on the basis of data from the display memory 8b in units of desired frequency ranges, and instructs the display controller 7a to add a marker to the searched point.
- the unit 8d obtains a frequency value of the searched point on the basis of data stored in the storage unit 3, and instructs the display controller 7a to display the frequency value as the frequency of the marker point.
- the data compression unit 8 can be constituted using a CPU and a storage element.
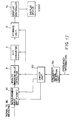
- Fig. 13 shows still another arrangement of the spectrum analyzer adopting the fourth embodiment.
- Fig. 13 the function of the data compression unit 8 in Fig. 10A is realized in an analog manner.
- an analog maximum value detector 9 is arranged between the measurement unit 10 and the A/D converter 2.
- the A/D converter 2, the storage unit 3, and the clock generator 6b have a different clock operation and storage capacity from those in Fig. 10A, and the storage capacity of the storage unit 3 is 500 which is the same as the total number of dots on the abscissa.
- a clock output to the analog detector 9, the A/D converter 2, and the storage unit 3 in Fig. 13 has a period five times that in Fig. 10A, and its output period is the same as that in Fig. 10A.
- the clock output period corresponds to a period in which the sweep signal from the sweep generator 6a sweeps five times like in the second embodiment.
- the analog maximum value detector 9 holds an analog signal output from the measurement unit 1 during the clock period, and is reset in response to the next clock. Therefore, the analog maximum value detector 9 detects and holds the maximum value during the clock period.
- the storage unit 3 selects an A/D-converted maximum value during one clock period, and stores it in correspondence with one address thereof.
- the storage unit 3 receives analog data five times those obtained by the clock in Fig. 10A, and detects the maximum value from the data, thereby compressing and storing the data.
- the harmonic measurement has been exemplified.
- the present invention is not limited to harmonic components.
- the arrangement shown in Figs. 7A and 7B, Figs. 10A and 10B, or Fig. 13 may be applied as long as the frequency of an object to be measured is known.
- the frequency range selection unit selects the plurality of frequency ranges, the plurality of frequency ranges are swept by the sweep unit to allow a measurement with a high resolution, and a plurality of desired frequency ranges obtained in this manner are displayed on a single screen. Therefore, a plurality of desired frequencies of interest can be measured while confirming frequency components near these frequencies. Furthermore, only frequency components of interest can be observed in an enlarged scale. Moreover, a measurement can be performed with an increased S/N.
- the fourth embodiment of the present invention comprises the data selection unit in addition to the above arrangement, a measurement can be performed with a further increased S/N.
- the present invention is applied to a one-screen display using a single screen before and after the magnification is changed.
- the present invention may be applied to a two-screen display wherein data before the magnification is changed is displayed on a first display unit, and data after the magnification is changed is displayed on a second display unit. With this two-screen display, the relative relationship before and after the magnification is changed can be displayed to allow easier understanding.
- a waveform display apparatus of frequency sweep type which can easily provide high-definition waveform observation of a waveform displayed to be developed on the frequency axis to a user, can be realized.
- the present invention can be widely applied to waveform display apparatuses of frequency sweep type, such as spectrum analyzers, network analyzers, and the like, which display waveform data developed on the frequency axis.
Landscapes
- Physics & Mathematics (AREA)
- General Physics & Mathematics (AREA)
- Mathematical Physics (AREA)
- Measurement Of Resistance Or Impedance (AREA)
- Spectrometry And Color Measurement (AREA)
- Measurement Of Mechanical Vibrations Or Ultrasonic Waves (AREA)
Description
- The present invention relates to a waveform display apparatus of a frequency sweep type including a spectrum analyzer for analyzing the spectrum of a signal, a network analyzer for analyzing the characteristic of a circuit element, and the like and, more particularly, to a waveform display apparatus which can easily perform high-definition observation of a desired peak/dip portion in a displayed waveform.
- As is well known, a waveform display apparatus such as a spectrum analyzer, a network analyzer, or the like displays the spectrum of a signal to be measured, the transfer characteristic of a circuit element to be measured, or the like while developing it on the frequency axis.
- When a waveform is observed using a waveform display apparatus of such a frequency sweep type, it is required to be able to easily provide high-definition waveform observation for a user.
- However, a conventional spectrum analyzer, network analyzer, or the like cannot satisfy the above-mentioned requirement in the present state. These problems of conventional techniques will be described below taking spectrum analyzer as an example.
- In general, in a spectrum analyzer, when the spectrum of an unknown signal is to be analyzed and evaluated, the level and frequency of the spectrum displayed to be developed on the frequency axis must be observed.
- However, an actually displayed spectrum resolution suffers from a limitation due to, e.g., characteristics of elements constituting the spectrum analyzer. More specifically, each spectrum pattern to be observed is not always displayed by a single line segment, but has a mountain-like pattern in which a spectrum upper portion forms a moderate curve, and its lower portion is spread, although it depends on a measurement condition. The level and frequency of a maximum level point (peak) of a spectrum display having a mountain-like pattern correspond to those of a spectrum to be observed. For this reason, the maximum point of the spectrum must be searched. When some spectra are present in a narrow frequency range, and their levels and frequencies are to be measured, each spectrum must be selected, and the maximum level on a display must be detected. Furthermore, in some cases, a spectrum may be displayed to have a valley-like pattern in a direction opposite to the above-mentioned case. In this case, the level and frequency of a minimum level point (dip) correspond to those of a spectrum to be observed.
- In the spectrum analyzer for analyzing the spectrum in this manner, many functions allowing convenient analysis have already been added. Since the present invention provides some of these functions, various functions of the conventional spectrum analyzer will be individually explained in different items below for the sake of easy understanding of the characteristic features of the present invention.
- 1 ○ Zone Marker
This function is disclosed in Japanese Patent
Application, "Spectrum Analyzer" (Published Unexamined
Japanese Patent Application No. 63-218869) by the same
applicant (some common inventors) as the present
invention. More specifically, in the zone marker
function, in order to facilitate observation of a peak
(dip) of a spectrum within a desired frequency range
displayed on a display device, a desired frequency range
in a measurement frequency region is set as a zone, the
zone can be horizontally moved in the measurement frequency
region, the zone width is also variable, and a
peak (the top of a mountain) or a dip (the deepest
bottom of a valley) is indicated by a marker.
(See Fig. 14)Thereafter, the same technique was disclosed as a U.S. Patent (USP 4,901,873). - 2 ○ Zone Sweep (Partial Sweep) This function is disclosed in Japanese Patent Application, "Spectrum Analyzer" (Published Unexamined Japanese Patent Application No. 64-9371) by the same applicant (some common inventors) as the present invention. More specifically, in order to allow high-speed observation while maintaining original performance and functions of a spectrum analyzer, a signal is analyzed by analog sweep, so that variation states of a carrier wave and a signal adjacent to the carrier wave are displayed on a single screen to be easy to see, and components to be seen can be quickly observed. That is, in the zone sweep function, a narrow range adjacent to a signal of interest within a measurement frequency region is set as a zone (see Fig. 15), and only this zone range is repetitively swept. Spectrum data obtained by sweeping the narrow range is updated. However, data outside the zone (on the right and left sides of the zone shown in Fig. 15) are stored in a memory without being updated after they are obtained by a single sweep operation, and are displayed together. In this zone sweep function, the sweep range is narrowed to provide partial, high-speed performance.Thereafter, the same technique was disclosed as a U.S. Patent (USP 4,839,583).
- 3 ○ Signal (Center) Tracking This function is used in spectrum analyzers commercially available from U.S. companies (Type 8568 available from Hewlet-Packard Corp., Type 2410 available from Tektronix Corp., and the like). These spectrum analyzers shift the frequency as the abscissa for each sweep, so that a peak point of a spectrum displayed on a screen of a CRT as a display is always located at the center of the screen. More specifically, every time a sweep operation is performed, a peak point is searched by signal (center) tracking, so that the frequency of the peak point corresponds to the center frequency (center) on the screen. (See Fig. 27)
- 4 ○ Foreground (so-called FG) & Background (so-called BG) Two-frame Display This function is disclosed in Japanese Patent Application, "Spectrum Analyzer" (Japanese Patent Application No. 2-15432; filing date 1990-1-25) by the same applicant (some common inventors) as the present invention. A BG display indicates a wide-band sweep result (see a lower graph of Fig. 17), and when a desired signal within the sweep frequency range is selected by designating a zone (see the lower graph of Fig. 17), a bandwidth corresponding to the zone can be displayed as an FG display. The FG display is enlarged, as shown in an upper graph in Fig. 17. In addition, the zone designated on the BG display can be shifted, and the frequency which can be observed on the FG display can be changed in correspondence with a zone shift on the BG display.Thereafter, the same technique was filed in U.S.A (US. Serial No. 644,220; filing date 1991-1-22).
- 5 ○ Data Point Designation & Enlargement Function As an early technique associated with a digital storage oscilloscope, "Digital Measurement Apparatus" (Published Unexamined Japanese Patent Application No. 50-6380) is known. With techniques before this technique, all the several thousands of coordinate points on a display device do not have sufficient resolution for observation. The data point designation & enlargement function is developed in consideration of this situation, and includes an "apparatus for controlling addresses and display positions of data points to be displayed on a display device in response to selected data points and a selected enlargement coefficient" so as to display data at a limited number of coordinate points at a time (in other words, to enlarge and display the data).
-
- Thus, in the above-mentioned techniques added to a conventional spectrum analyzer, some problems remain unsolved.
- First, in the
conventional technique 5 ○, a function of enlarging an image to be observed is realized by selecting desired data points and designating an enlargement coefficient. However, in order to compensate for insufficient functions of this technique upon actual high-definition observation of a spectrum, techniques described initems 1 ○ to 4 ○ have been added according to requirements of users. - Of these techniques, the
zone marker function 1 ○ and thezone sweep function 2 ○ will be examined below. When an observed spectrum drifts due to any cause, and falls outside the zone, the zone position must be set again. When a portion adjacent to an observed spectrum is to be enlarged, a user must instruct to change the center frequency (CENTER FREQ) by a panel operation so as to display the corresponding signal at the center of a screen of a CRT. (For example, an instruction for causing the frequency of the marker point to coincide with the center frequency must be issued.) - The signal (center)
tracking function 3 ○ will be examined below. In this function, only a portion inside a display range of a CRT screen is searched. For this reason, when a spectrum of a portion adjacent to a given signal is observed by sweeping a narrow band, the signal may abruptly drift, and may fall outside the CRT screen. In this manner, in order to search a signal in an observation disable state, a user must set a wider span (sweep frequency width) again to detect a signal to be observed, and thereafter, must narrow the span to restore an original state. - The foreground FG & background BG two-
frame display function 4 ○ will be examined below. In this function, in order to display two frame data, the display area on a panel surface of a device must be inevitably increased. That is, when the entire display area is suppressed to be reduced in scale, displayed data is not easy to see for a user. In addition, a user must set the zone position in the BC display again when a signal to be observed drifts. Furthermore, with this technique, spectrum data extends over two traces, and when data is saved or recalled, a large memory capacity is required. - On the other hand, in order to visually display spectrum components included in a measurement signal, a spectrum analyzer as shown in Fig. 18 is conventionally used.
- In Fig. 18, a measurement unit P1 having a heterodyne receiver arrangement capable of sweeping a local frequency continuously sweeps and detects a predetermined frequency range of an input measurement signal, and outputs detection signals.
- A waveform memory P2 updates and stores the detection signals output during one sweep operation as a series of waveform data for each sweep operation.
- A display controller P3 displays waveform data stored in the waveform memory P2 on a display device P4 as a spectrum waveform to have the frequency axis as the abscissa.
- A start frequency setting unit P5 sets a sweep detection start frequency of the measurement unit P1. A center frequency setting unit P6 sets a sweep detection center frequency. A frequency span setting unit P7 sets a width (span) of a sweep detection frequency.
- A start·center frequency calculation unit P8 updates and sets a start or center frequency using a changed/set condition frequency with priority, so that the following relation can be established for condition frequencies from the frequency setting units P5, P6, and P7 for determining a range of the sweep detection frequency:
- For example, when the start frequency is changed/set while the frequency span is fixed, the start·center frequency calculation unit P8 calculates and updates/sets a center frequency which can satisfy equation (1) for the new start frequency and the frequency span.
- Therefore, a spectrum waveform is shifted by a difference in start frequency, and the same applies to a case wherein the center frequency is changed/set.
- When the frequency span is changed/set while the start frequency is fixed, the spectrum waveform is displayed in an enlarged or reduced scale to have the start frequency as the center.
- When the frequency span is changed/set while the center frequency is fixed, the spectrum waveform is displayed in an enlarged or reduced scale to have the center frequency as the center.
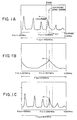
- Therefore, when a spectrum waveform as shown in Fig. 19A is displayed on a screen of the display device P4, if a spectrum near the center frequency (F(c)) is to be observed in an enlarged scale, the frequency span can be decreased while the center frequency is fixed. Thus, the spectrum waveform is displayed in an enlarged scale to have the center frequency as the center, as shown in Fig. 19B.
- As shown in Fig. 20(A), when a spectrum near a point a is to be observed in an enlarged scale, the spectrum waveform is shifted (by changing the start or center frequency) so that the point a is located at almost the center frequency, and thereafter, the frequency span is decreased while the center frequency is fixed. Thus, as shown in Fig. 20B, the spectrum near the point a is displayed in an enlarged scale to have the center frequency as the center, and further detailed spectrum observation is allowed.
- However, as an observation mode of a spectrum analyzer, adjustment of equipment or the like is frequently performed while alternately observing the overall spectrum and an enlarged spectrum of a portion of the overall spectrum. In this case, in the conventional spectrum analyzer shown in Fig. 18, as described above, if a portion to be observed in an enlarged scale is not moved to near the center frequency, when the frequency span is changed, a target waveform may fall outside a display range. In this technique, in order to restore the enlarged waveform to an original spectrum waveform, operations must be performed in a reverse order, resulting in inconvenience.
- For this reason, a marker point which is arbitrarily movable on a waveform may be provided, as has been realized in an oscilloscope, and a function (zoom function) of locating the marker point at a display center upon operation of a special-purpose enlargement key, and performing an enlarged-scale display to have the display center as the center may be utilized. However, with this technique, an enlarged waveform is fixed at the display center, resulting in inconvenience.
- In the spectrum analyzer shown in Fig. 18, every time a waveform is enlarged, the frequency span and the start frequency are updated/set. Therefore, in order to display an original waveform, complicated operations are required.
- As a conventional apparatus which utilizes the above-mentioned signal (center) tracking function so as to visually display a spectrum component included in a measurement signal, a spectrum analyzer as shown in Fig. 21 is known.
- In Fig. 21, the same reference numerals denote the same parts as in the spectrum analyzer shown in Fig. 18, and a detailed description thereof will be omitted.
- More specifically, in Fig. 21, reference numeral P10 denotes a tracking unit for preventing movement of a spectrum waveform on a screen for a measurement signal suffering from a frequency drift.
- The tracking unit P10 detects an address corresponding to a maximum value of waveform data stored in a waveform memory P2 from a peak position detection unit 11, causes a frequency difference detection unit P12 to obtain the difference between a frequency corresponding to this address and the center frequency, and shifts a sweep detection frequency range by the difference.
- Therefore, when a spectrum waveform as shown in, e.g., Fig. 22A is displayed on a screen of a display device P4, and the tracking unit P10 is operated, the overall spectrum waveform is shifted, so that the position of a maximum-level spectrum A is located at the center of the screen (at the position of the center frequency), as shown in Fig. 22B.
- Thereafter, even when this measurement signal suffers from a frequency drift, since the sweep detection frequency range is shifted to follow this drift, the spectrum waveform can be observed while the maximum-level spectrum A is fixed at the center of the screen.
- However, in the conventional spectrum analyzer as shown in Fig. 21, when a spectrum ranging from a fundamental wave having a large level to high-order harmonics having small levels is observed on a single screen like in harmonic measurement, if the above-mentioned tracking function is operated for the measurement signal, the fundamental wave is fixed at the center of the screen, and a display range of harmonics is limited to a region half the entire screen, resulting in inconvenience.
- In the conventional spectrum analyzer, when the level of a spectrum to be subjected to tracking is smaller than the level of other spectra, condition frequencies (the start frequency, the frequency span, and the like) must be adjusted in advance to cause a spectrum having a large level to fall outside the sweep detection frequency range. As a result, observation on a single screen is undesirably disturbed.
- A conventional spectrum analyzer having an arrangement as shown in Fig. 23 is also known. Fig. 24A shows a display example measured by the arrangement shown in Fig. 23.
- A case will be explained below wherein measurement of up to 5th-order (5f1) harmonic components of a signal to be measured whose fundamental wave f1 is at 100 MHz, as shown in Fig. 24A, is performed using the arrangement shown in Fig. 23.
- A local oscillator 1a in a
measurement unit 1 outputs a frequency-swept signal to a mixer 1b according to instructions from acontrol unit 10a and a sweep signal generation unit 11a, and causes the mixer to convert up to 5th-order harmonic components of an input signal to be measured into intermediate-frequency (IF) signals. Therefore, the local oscillator 1a continuously frequency-sweeps the input signal to be measured over a band of almost 500 MHz. The IF signals passing through a band-pass filter (to be referred to as a BPF hereinafter) 1c are detected by a detector 1d, are converted into digital data by an A/D converter 2, and are stored in astorage unit 3 in correspondence with the swept frequencies. Data stored in the storage unit (waveform memory) 3 are displayed on a display screen of adisplay device 4. The data display on the display screen is made on a coordinate system defined by the abscissa as a frequency axis and the ordinate as a level axis by a predetermined total number of dots, e.g., 500 points for each of the abscissa and the ordinate. - An analysis resolution, a display resolution, and a comprehensive measurement resolution will be described below.
- 1 ○ Analysis resolution
The analysis resolution is an index representing
performance capable of analyzing adjacent signals, and
is expressed by the band itself of the BPF 1c. When a
measurement is performed while improving the analysis
resolution, i.e., narrowing the band of the BPF 1c, the
measurement S/N is also increased.In order to perform an optimal measurement by
sweeping frequencies, a transient response with respect
to the velocity of an IF signal passing through the band
of the BPF 1c must be taken into consideration, and this
relationship is given by the following inequality:
- T:
- sweep time
- K:
- constant
- BW:
- frequency sweep bandwidth
- RBW:
- analysis resolution (bandwidth of the BPF 1c)
- 2 ○ Display resolution of frequency axis (abscissa) The display resolution is determined by the total number of dots on the abscissa, and the frequency sweep bandwidth.More specifically, the display resolution = BW/(the total number of dots).
- 3 ○ Example of numeric values:
If T = 2 sec, BW = 500 MHz, K = 2, and the total
number of dots = 500,
analysis resolution = 22.54 KHz
display resolution = 1 MHz/dot -
- The numeric values in this case reveal that the comprehensive measurement resolution visually observed from the display screen is determined by the display resolution, and is 1 MHz. The analysis resolution = 22.4 KHz is not effective.
- In general, the comprehensive measurement resolution tends to be determined by the display resolution as the frequency sweep bandwidth BW is larger, and tends to be determined by the analysis resolution as the bandwidth BW is smaller although it depends on the sweep time.
- In the conventional spectrum analyzer shown in Fig. 23, when only a portion near up to 5th-order harmonic components of a signal to be measured having a fundamental wave of, e.g., 100 MHz is to be measured, the following problems are posed.
- 1 ○ Conventionally, since measurement is performed by continuously sweeping frequencies up to almost 500 MHz corresponding to the 5th-order harmonic component, the measurement resolution (or display resolution) near respective harmonic components of interest is low, thus often causing a measurement error. For example, if a component other than a harmonic is present within the display resolution = 1 MHz per dot in the above-mentioned numeric value example, the harmonic and other components are undesirably measured at the same time.
- 2 ○ Since a band as wide as 500 MHz is measured, if there are many components other than harmonic components, an operation for specifying the harmonic components is necessary, resulting in inconvenience.
-
- In order to solve the above-mentioned problems, a measurement device for making a display as shown in Fig. 24B is known.
- This measurement device designates frequencies of respective harmonic components to measure the levels at the designated frequency points, and processes the data to display the data as a bar graph. In this measurement device, the above-mentioned
problem 2 can be solved. However, when a signal to be measured which may include components other than harmonic components is to be measured, whether or not harmonic components are measured in practice cannot be confirmed. - The document EP-A-0 297 589 discloses a spectrum analyzer comprising
- a measurement unit for sweeping a frequency range so as to obtain waveform data;
- a display device for displaying the waveform data; and
- parameter setting means for setting a base frequency.
- As described above, in the conventional spectrum analyzers and their associated measurement techniques, high-definition waveform observation cannot be easily provided to a user, and it is an urgent subject to realize this in this field.
- The present invention has been made in consideration of the above situation, and has as its first object to provide a waveform display apparatus of frequency sweep type, which can easily provide, to a user, high-definition waveform observation of a waveform displayed to be developed on the frequency axis.
- It is the second object of the present invention to eliminate some problems of, particularly, a conventional spectrum analyzer shown in Fig. 23, i.e., to realize a waveform display apparatus of frequency sweep type, which can measure a plurality of specified adjacent frequencies as objects to be measured, e.g., adjacent harmonic components with a high resolution while recognizing objects to be measured, and can easily provide high-definition waveform observation to a user.
- In order to achieve the first and second objects, according to the present invention, there is provided a waveform display apparatus of frequency sweep type, as defined in
claim 1. - The present invention is directed to a (spectrum) waveform display apparatus which selects (spectrum) waveforms near a plurality of frequency components of those of a signal to be measured, and simultaneously displays the spectrum waveforms of the respective measured frequency components on individual display regions obtained by dividing one display screen by the number of the plurality of frequency components in a direction of abscissa (frequency axis).
- In particular, the present invention is directed to a (spectrum) waveform display apparatus which is convenient for a case wherein, in, e.g., a spectrum analyzer, when only harmonic components of an unknown signal to be measured are to be measured, waveforms near the respective harmonic components must be separated from components other than the harmonic components by increasing a resolution, and only the harmonic components must be reliably and quickly measured, and a case wherein when a specific harmonic component due to a distortion of a signal output from an electronic circuit such as a signal generator, or the like is adjusted, a state of a change in harmonic component including another fundamental wave must be simultaneously observed in an enlarged scale.
- In the waveform display apparatus according to the present invention, when a signal to be measured includes frequency components over a wide band, specific frequency components and waveform near these components can be quickly observed with a high resolution.
- In order to achieve this, the waveform display apparatus according to the present invention comprises the following frequency range selection means, sweep means, and display means in a spectrum display apparatus for measuring and displaying the spectrum of a signal to be measured.
- The frequency range selection means selects a plurality of frequency ranges between upper and lower limits of a frequency range to be measured. As a typical example, when a harmonic component is to be measured, the means selects predetermined frequency ranges (2Δf, 10Δf < 5f1) to have frequencies (f1, 2f1, 3f1, 4f1, 5f1 in the order from the lower ones) of first- to fifth- order harmonic components of frequency components of a signal to be measured as the centers on the basis of the fundamental wave f1 of the signal to be measured. The predetermined frequency range 2Δf is a range to be frequency-swept near each harmonic component.
- The sweep means respectively sweeps only the plurality of frequency ranges (f1 ± Δf, 2f1 ± Δf, 3f1 ±Δf, 4f1 ± Δf, 5f1 ± Δf) at a higher resolution than a measurement resolution when a measurement is continuously performed from the lower limit to the upper limit (the conventional apparatus requires at least a band of 5f1).
- The display means simultaneously displays spectra in the plurality of frequency range obtained by the sweep operations.
- Furthermore, a waveform display apparatus can be characterized by further comprising a data selection unit in addition to the above-mentioned means.
- More specifically, during a measurement, a sweep velocity when the plurality of frequency ranges are swept is decreased to increase the number of data to be obtained (to increase the total number of dots on the abscissa), and the data selection unit selects the predetermined number of data of spectra of the plurality of frequency ranges in each frequency range, converts them into the predetermined total number of dots on the abscissa, and outputs the converted data.
- Furthermore, in addition to the above-mentioned features, the S/N can be further increased since a measurement is performed by increasing the number of data (the total number of dots on the abscissa). If the total number of dots for a display remains the same, the comprehensive measurement resolution is left unchanged.
- In the typical example, if the conventional apparatus requires a band of 5f1 to measure up to a 5th-order harmonic component, its display resolution is 5f1/the total number of dots, while the display resolution attained is 10Δf/the total number of dots. Therefore, the display resolution can be improved f1/2Δf times that of the conventional apparatus, and an effective value of the analysis resolution can be increased correspondingly. Since ranges near desired frequencies (f1 ± Δf, 2f1 ± Δf, 3f1 ± Δf, 4f1 ± Δf, 5f1 ± Δf) can be measured in this state, the S/N can be increased as well as an improvement of performance for discriminating a desired signal and other signals.
- In addition, according to the present invention, a plurality of desired signals including adjacent spectra can be simultaneously observed on a single screen.
- According to the present invention, although the display resolution is left unchanged, since the measurement resolution can be increased, the S/N can be increased accordingly.
-
- Fig. 1 is a block diagram showing a basic arrangement of a waveform display apparatus according to the present invention;
- Fig. 2 is a schematic view of a spectrum analyzer to which the waveform display apparatus according to the present invention is applied;
- Figs. 3A, 3B, and 3C show display screen data;
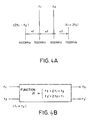
- Figs. 4A, 4B, and 4C, and Fig. 5 are respectively background and principle views, and block diagrams of an apparatus example.
- Fig. 6 shows a display example;
- Figs. 7A and 7B are block diagrams showing an arrangement according to an embodiment of the present invention;
- Fig. 8 is a chart for explaining a waveform of a sweep signal of the embodiment;
- Fig. 9 shows a display example of the embodiment;
- Figs. 10A and 10B are diagrams showing an arrangement of a spectrum analyzer which adopts the embodiment;
- Fig. 11 shows data examples obtained upon measurements of the embodiment, and a display example of the embodiment;
- Fig. 12 is a chart for explaining a waveform of a sweep signal used in Figs. 10A and 10B;
- Fig. 13 is a diagram showing an arrangement of another spectrum analyzer which adopts the embodiment;
- Figs. 14 to 17 show display examples of the prior art;
- Fig. 18 is a block diagram showing an arrangement of a conventional apparatus;
- Figs. 19A and 19B and Figs. 20A and 20B show display screen data for explaining operations of the conventional apparatus;
- Fig. 21 is a block diagram showing an arrangement of a conventional apparatus which utilizes a center tracking function;
- Figs. 22A and 22B show display examples by the apparatus shown in Fig. 21;
- Fig. 23 is a diagram showing an arrangement of a conventional spectrum analyzer; and
- Figs. 24A and 24B show conventional display examples.
-
- The multi-screen display function according to an embodiment is directed to a harmonic measurement.
- Fig. 7A is a diagram showing an arrangement of a spectrum analyzer adopting this embodiment of the present invention.
- Fig. 7B shows Fig. 7A in correspondence with the basic arrangement shown in Fig. 1. The same reference numerals in Fig. 7B denote the same parts as in Fig. 1 and Fig. 7A, and a detailed description thereof will be omitted.
- In the drawings, a measurement unit 10 (U100), an A/D converter 2 (104), and a storage unit 3 (5) are the same as those described in the prior art (Fig. 23).
- A case will be exemplified below wherein harmonics are measured.
- When a frequency
range selection unit 5a receives frequency information of a fundamental wave of a signal to be measured, it obtains frequencies (f1, 2f1, 3f1, 4f1, and 5f1 in the order from lower frequencies) of, e.g., up to 5th-order harmonic components. More specifically, a process of obtaining frequencies of 2nd-, 3rd-, 4th-, and 5th-order harmonic components from the frequency of the fundamental wave is the same as that of obtaining the two-signal, 3rd-order frequencies. Furthermore, theunit 5a automatically selects five bands, i.e., BW1 = f1 ± Δf, BW2 = 2f1 ± Δf, BW3 = 3f1 ± Δf, BW4 = 4f1 ± Δf, and BW5 = 5f1 ± Δf on the basis of a predetermined bandwidth 2Δf. - The predetermined bandwidth 2Δf corresponds to a sweep width near the fundamental wave and the respective harmonic components to be measured by frequency sweep operations.
- For example, if 2Δf = 1 MHz when the fundamental wave = 100 MHz, the respective sweep frequency ranges BW1 to BW5 are respectively 99.5 to 100.5 MHz, 199.5 to 200.5 MHz, 299.5 to 300.5 MHz, 399.5 to 400.5 MHz, and 499.5 to 500.5 MHz.
- A
sweep unit 60 is constituted by a resolution setting unit 6c, aclock generator 6b, and a sweep signal generator 6a in this embodiment. - The sweep signal generator 6a receives the pieces of frequency range information BW1 to BW5 from the frequency
range selection unit 5a, and generates and outputs a sweep signal for causing a local oscillator la to sweep frequencies in synchronism with a clock from theclock generator 6b. - The
clock generator 6b generates a clock corresponding to the total number of dots/period. This clock determines a conversion timing of the A/D converter 2, and designates an address of thestorage unit 3. - The resolution setting unit 6c sets a bandwidth of an analysis resolution which satisfies the above-mentioned equation (1), and is approximate to a display resolution 10Δf/the total number of dots in accordance with the predetermined bandwidth 2Δf.
- The waveform of this sweep signal will be described below with reference to Fig. 8. In Fig. 8, an example of a sweep signal according to the present invention is represented by a solid line b, and an example of a conventional sweep signal is represented by a dotted line a. Fig. 8 illustrates a sweep signal when it is assumed that the sweep time of one period of the present invention is the same as that of the prior art on a coordinate system wherein the sweep time is plotted along the abscissa, and the voltage of the sweep signal and the frequency to be swept are plotted along the ordinate. Note that the local oscillator 1a outputs a frequency proportional to the voltage of the sweep signal.
- The feature of the waveform of the sweep signal of the present invention is that the waveform changes stepwise, and an inclination when each of the desired frequency ranges BW1 to BW5 is swept is slow. Consequently, since a sweep speed when each of the desired frequency ranges BW1 to BW5 is swept is low (a substantial sweep time per unit frequency range is prolonged), the band of a BPF 1c can be narrowed, thus increasing the analysis resolution. Since the desired frequency ranges BW1 to BW5 are selectively swept step-wise while the total number of dots on the abscissa per period remains the same as in the prior art, portions excluding non-selected bands can be measured and displayed in an enlarged scale, thus also increasing the display resolution.
- Outputs from a
measurement unit 10 are stored by the A/D converter 2 and thestorage unit 3 at the timing of the clock from theclock generator 6b. As data to be stored, data of only the desired frequency ranges BW1 to BW5 are stored in the order from lower frequencies (in the order of sweep frequencies). - A display data processor U20 for controlling a display device U500 is constituted by the
storage unit 3, a display controller 7a, and atrace memory 7b in this embodiment. - The display controller 7a receives the pieces of desired frequency range information BW1 to BW5 selected in advance by the frequency
range selection unit 5a, and forms a display format obtained by dividing a display screen into a predetermined number of sections, e.g., five sections in this embodiment, and assigning frequencies to these sections. Data stored in thestorage unit 3 are read out, and are displayed on the display device U500 according to the display format. Fig. 9 shows this display example. - In Fig. 9, if the fundamental wave is 100 MHz, the bandwidth 2Δf of each of the desired frequency ranges BW1 to BW5 is 1 MHz, and the total number of dots on the abscissa is 500, the display resolution is 1 MHz/100 = 10 kHz.
- If a sweep time T is a total of 2 sec, since a sweep time of each band is 0.4 sec, the analysis resolution can be about 0.7 kHz according to equation (1). However, the effective comprehensive measurement resolution is 10 kHz which is equal to the display resolution. As can be understood from comparison with an example of numeric values described in the prior art, since the conventional comprehensive measurement resolution is 1 MHz, and the analysis resolution is 22.4 kHz if other conditions remain the same, the measurement resolution of this embodiment is better than the conventional analysis resolution as well as the conventional measurement resolution.
- In this manner, since a measurement can be performed with a high resolution, the S/N can be increased accordingly, and the measurement dynamic range can be widened. Since the respective harmonic components can be displayed in an enlarged scale, they are easy to see.
- Note that the frequency
range selection unit 5a, thesweep unit 60, and the display controller 7a of this embodiment can be constituted using a CPU. - Fig. 10A shows a modification of the spectrum analyzer adopting the fourth embodiment.
- In the case of Fig. 7A, each of the desired frequency ranges BW1 to BW5 (each having the bandwidth 2Δf) is directly assigned to the number of dots, 100, (the number of dots obtained by dividing the total number of dots, 500, on the abscissa with 5 as the number of the desired frequency ranges BW1 to BW5), thereby performing a measurement and a display.
- In contrast to this, in the case of Fig. 10A, each of the desired frequency ranges BW1 to BW5 is measured five times as the number of measurement points, 500, which is equal to the number of display dots, 500, as indicated by the first time, second time, third time,... in an upper portion of Fig. 11, and data of a total of 500 × 5 = 2,500 points are subjected to processing such as data compression, so that the abscissa is compressed to 1/5, and is displayed. 1/5 compression can be attained by generating new data point by point every 5 points of the data measured five times. In this case, as data compression processing for generating the 5-point data as new 1-point data, processing for obtaining a maximum value, a minimum value, or an average value of the levels is known. Differences between the arrangements shown in Figs. 10A and 7A are that a
data compression unit 8 is newly arranged, and that a sweep signal from the sweep generator 6a (see Fig. 7A) included in thesweep unit 60 has a different waveform in Fig. 10A. The storage method of thestorage unit 3 is changed in correspondence with the difference in waveform of the sweep signal from the sweep generator 6a. In Fig. 10A, a maximum value is detected as the data compression processing. - The basic operations of other principal portions are substantially the same as those in Fig. 7A.
- In Fig. 10A, the sweep signal generator 6a receives the pieces of frequency range information BW1 to BW5 output from the frequency
range selection unit 5a, and generates and outputs a sweep signal for causing the local oscillator 1a to sweep frequencies in synchronism with a clock from theclock generator 6b (see Fig. 7A; the same applies to the following description). The sweep signal in this case will be described below with reference to Fig. 12. In Fig. 12, solid lines c are for explaining the sweep signal of Fig. 10A, and dotted lines a are an example of the conventional sweep signal. - The sweep signal of Fig. 10A sweeps one desired frequency range in a conventional sweep time per period, and performs five sweep operations in correspondence with the pieces of frequency range information BW1 to BW5.
- Therefore, in the case of Fig. 10A, although the bandwidth 2Δf of each of the desired frequency ranges BW1 to BW5 remains the same, the substantial number of measurement dots is increased to a value the number of sweep times, i.e., five times the total number of dots on the abscissa in Fig. 7A.
- The
storage unit 3 must have a memory capacity five times the total number of dots on the abscissa in Fig. 7A, or must output stored data to thedata compression unit 8 in the next stage at proper time intervals if it has the same capacity as that in Fig. 7A. In the following description, for the sake of simplicity, thestorage unit 3 is assumed have a capacity five times that in Fig. 7A. In this case, the period of the clock sent from theclock generator 6b to thestorage unit 3 is the same as that in Fig. 7A. However, a clock output time must be five times that in Fig. 7A in correspondence with the capacity of the storage unit 3 (or the sweep signal from the sweep signal generator 6a). - The
data compression unit 8 is constituted by amaximum value detector 8a, adisplay memory 8b, and adata controller 8c. - The
data controller 8c reads out data corresponding in number to the desired frequency ranges BW1 to BW5 from a lower frequency (from a lower address of the storage unit 3), i.e., five data from addresses 0 to 4. Themaximum value detector 8a detects a maximum value of the five data. Thedata controller 8c selects the maximum value, and writes it at address 0 of thedisplay memory 8b. Thedata controller 8c repeats such an operation every five addresses of thestorage unit 3 to convert all the data corresponding to the frequency ranges BW1 to BW5 stored in thestorage unit 3, and writes the converted data in thedisplay memory 8b. - In this manner, the
data compression unit 8 selects every 5th data stored in thestorage unit 3 to compress the data to 1/5, thereby converting the number of data to that the same as the total number of dots on the abscissa. Theunit 8 sends the converted data to the display device U500, and causes it to display the data. - In this case, since the sweep time is 2 sec, and the sweep bandwidth 2Δf = 1 MHz, the analysis resolution is 1 kHz. The resolution of data stored in the
storage unit 3 at measurement dots is 1 MHz/500 = 2 kHz. Therefore, the measurement resolution when the data are stored in thestorage unit 3 is 2 kHz (the band of the BPF 1c is set to be 2 kHz). - This measurement resolution is five times that in Fig. 14, and the S/N can be increased accordingly, thus widening the measurement dynamic range.
- The value of the display resolution of data output from the
storage unit 3, and compressed and stored in thedisplay memory 8b is 10 kHz since it is five times the measurement resolution of 2 kHz. In this manner, at the end timing, the display resolution is the same as that in Fig. 7A. However, the improved measurement dynamic range can be maintained. - Note that the frequency of a spectrum generally means a frequency corresponding to the maximum level of the spectrum. Therefore, in this measurement, a frequency value corresponding to the maximum level of each spectrum including a harmonic component is finally required. Thus, the frequency value is obtained from non-compressed data in the
storage unit 3, and if the obtained value can be numerically displayed as a frequency value representing a maximum value after compression, frequency measurement precision depending on the measurement resolution before compression can be maintained. In this case, an error caused by visual observation is determined by the display resolution after compression. - Fig. 10B shows an arrangement of an embodiment for displaying a marker, and a frequency value of the marker point.
- In Fig. 10B, a
peak search unit 8d is arranged in addition to Fig. 10A. The display controller 7a adds a marker to display data on the display device U500 upon an instruction from thepeak search unit 8d, and at the same time, numerically displays the corresponding frequency value. - The
peak search unit 8d searches a point representing a maximum value in each range on the basis of data from thedisplay memory 8b in units of desired frequency ranges, and instructs the display controller 7a to add a marker to the searched point. On the other hand, theunit 8d obtains a frequency value of the searched point on the basis of data stored in thestorage unit 3, and instructs the display controller 7a to display the frequency value as the frequency of the marker point. - Note that the
data compression unit 8 can be constituted using a CPU and a storage element. - Fig. 13 shows still another arrangement of the spectrum analyzer adopting the fourth embodiment.
- In Fig. 13, the function of the
data compression unit 8 in Fig. 10A is realized in an analog manner. For this purpose, in Fig. 13, in place of thedata compression unit 8 in Fig. 10A, an analogmaximum value detector 9 is arranged between themeasurement unit 10 and the A/D converter 2. - In Fig. 13, operations excluding those of the analog
maximum value detector 9, the A/D converter 2, thestorage unit 3, and theclock generator 6b (see Fig. 7A) are the same as those in Fig. 10A. - In Fig. 13, the A/
D converter 2, thestorage unit 3, and theclock generator 6b have a different clock operation and storage capacity from those in Fig. 10A, and the storage capacity of thestorage unit 3 is 500 which is the same as the total number of dots on the abscissa. A clock output to theanalog detector 9, the A/D converter 2, and thestorage unit 3 in Fig. 13 has a period five times that in Fig. 10A, and its output period is the same as that in Fig. 10A. The clock output period corresponds to a period in which the sweep signal from the sweep generator 6a sweeps five times like in the second embodiment. - The analog
maximum value detector 9 holds an analog signal output from themeasurement unit 1 during the clock period, and is reset in response to the next clock. Therefore, the analogmaximum value detector 9 detects and holds the maximum value during the clock period. - The
storage unit 3 selects an A/D-converted maximum value during one clock period, and stores it in correspondence with one address thereof. - In this case, since one clock period in Fig. 13 is five times that in Fig. 10A, as has been described above, the
storage unit 3 receives analog data five times those obtained by the clock in Fig. 10A, and detects the maximum value from the data, thereby compressing and storing the data. - In Fig. 13, other operations, and the resolutions are the same as those in Fig. 10A. However, in Fig. 13, non-compressed data cannot be utilized since they are not stored unlike in Fig. 10A.
- In the above description of the fourth embodiment, the harmonic measurement has been exemplified. However, the present invention is not limited to harmonic components. The arrangement shown in Figs. 7A and 7B, Figs. 10A and 10B, or Fig. 13 may be applied as long as the frequency of an object to be measured is known.
- As described above, according to the fourth embodiment of the present invention, in particular, the frequency range selection unit selects the plurality of frequency ranges, the plurality of frequency ranges are swept by the sweep unit to allow a measurement with a high resolution, and a plurality of desired frequency ranges obtained in this manner are displayed on a single screen. Therefore, a plurality of desired frequencies of interest can be measured while confirming frequency components near these frequencies. Furthermore, only frequency components of interest can be observed in an enlarged scale. Moreover, a measurement can be performed with an increased S/N.
- In addition, since the fourth embodiment of the present invention comprises the data selection unit in addition to the above arrangement, a measurement can be performed with a further increased S/N.
- In each of the embodiments described above, the present invention is applied to a one-screen display using a single screen before and after the magnification is changed. The present invention may be applied to a two-screen display wherein data before the magnification is changed is displayed on a first display unit, and data after the magnification is changed is displayed on a second display unit. With this two-screen display, the relative relationship before and after the magnification is changed can be displayed to allow easier understanding.
- Therefore, according to the present invention as described in detail above, a waveform display apparatus of frequency sweep type, which can easily provide high-definition waveform observation of a waveform displayed to be developed on the frequency axis to a user, can be realized.
- The present invention can be widely applied to waveform display apparatuses of frequency sweep type, such as spectrum analyzers, network analyzers, and the like, which display waveform data developed on the frequency axis.
Claims (1)
- A waveform display apparatus of frequency sweep type, comprising:a measurement unit (U100) for measuring a signal to be measured by sweeping a frequency range under a predetermined measurement frequency condition so as to obtain waveform data corresponding to the frequency range;a display device (U500) for displaying the waveform data obtained by said measurement unit (U100) by developing the waveform data on the frequency axis;parameter setting means (111, 112) for setting a frequency as a base;a frequency selection unit (U40) for obtaining a plurality of frequencies having a predetermined relationship with the base frequency and selecting and outputting a plurality of frequency ranges containing these frequencies, respectively;a measurement control unit (U30) for causing said measurement unit (U100) to sweep the plurality of frequency ranges at a resolution higher than a measurement frequency resolution used when a measurement is continuously performed from a lowest lower limit to a highest upper limit using the frequency included in one of the plurality of frequency ranges; anda display data processing unit (U20) for receiving the predetermined measurement frequency condition, and causingsaid display device (U500) to display waveform data in the plurality of frequency ranges measured by said measurement unit (U100).
Applications Claiming Priority (13)
| Application Number | Priority Date | Filing Date | Title |
|---|---|---|---|
| JP86973/90 | 1990-03-30 | ||
| JP8697390 | 1990-03-30 | ||
| JP8697390 | 1990-03-30 | ||
| JP14078290 | 1990-05-30 | ||
| JP140782/90 | 1990-05-30 | ||
| JP14078290 | 1990-05-30 | ||
| JP189754/90 | 1990-07-18 | ||
| JP18975490 | 1990-07-18 | ||
| JP18975490 | 1990-07-18 | ||
| JP33734790 | 1990-11-30 | ||
| JP33734790 | 1990-11-30 | ||
| JP337347/90 | 1990-11-30 | ||
| EP91906506A EP0477379B1 (en) | 1990-03-30 | 1991-03-30 | Waveform display apparatus for easily realizing high-definition waveform observation |
Related Parent Applications (2)
| Application Number | Title | Priority Date | Filing Date |
|---|---|---|---|
| EP91906506.0 Division | 1991-03-30 | ||
| EP91906506A Division EP0477379B1 (en) | 1990-03-30 | 1991-03-30 | Waveform display apparatus for easily realizing high-definition waveform observation |
Publications (3)
| Publication Number | Publication Date |
|---|---|
| EP0664459A2 EP0664459A2 (en) | 1995-07-26 |
| EP0664459A3 EP0664459A3 (en) | 1996-05-22 |
| EP0664459B1 true EP0664459B1 (en) | 2000-05-31 |
Family
ID=27467316
Family Applications (4)
| Application Number | Title | Priority Date | Filing Date |
|---|---|---|---|
| EP95105455A Expired - Lifetime EP0664459B1 (en) | 1990-03-30 | 1991-03-30 | Waveform display apparatus for easily realizing high-definition waveform observation |
| EP91906506A Expired - Lifetime EP0477379B1 (en) | 1990-03-30 | 1991-03-30 | Waveform display apparatus for easily realizing high-definition waveform observation |
| EP95105445A Withdrawn EP0664457A3 (en) | 1990-03-30 | 1991-03-30 | Waveform display apparatus for easily realizing high-definition waveform observation. |
| EP95105454A Ceased EP0664458A3 (en) | 1990-03-30 | 1991-03-30 | Waveform display apparatus for easily realizing high-definition waveform observation. |
Family Applications After (3)
| Application Number | Title | Priority Date | Filing Date |
|---|---|---|---|
| EP91906506A Expired - Lifetime EP0477379B1 (en) | 1990-03-30 | 1991-03-30 | Waveform display apparatus for easily realizing high-definition waveform observation |
| EP95105445A Withdrawn EP0664457A3 (en) | 1990-03-30 | 1991-03-30 | Waveform display apparatus for easily realizing high-definition waveform observation. |
| EP95105454A Ceased EP0664458A3 (en) | 1990-03-30 | 1991-03-30 | Waveform display apparatus for easily realizing high-definition waveform observation. |
Country Status (5)
| Country | Link |
|---|---|
| US (2) | US5434954A (en) |
| EP (4) | EP0664459B1 (en) |
| JP (1) | JP3184832B2 (en) |
| DE (2) | DE69117409T2 (en) |
| WO (1) | WO1991015776A1 (en) |
Families Citing this family (37)
| Publication number | Priority date | Publication date | Assignee | Title |
|---|---|---|---|---|
| US5617523A (en) * | 1990-11-30 | 1997-04-01 | Anritsu Corporation | Waveform display apparatus for easily realizing high-definition waveform observation |
| US20080158261A1 (en) * | 1992-12-14 | 2008-07-03 | Eric Justin Gould | Computer user interface for audio and/or video auto-summarization |
| US8381126B2 (en) * | 1992-12-14 | 2013-02-19 | Monkeymedia, Inc. | Computer user interface with non-salience deemphasis |
| US5623588A (en) * | 1992-12-14 | 1997-04-22 | New York University | Computer user interface with non-salience deemphasis |
| US5684508A (en) * | 1995-11-21 | 1997-11-04 | Fluke Corporation | Method of displaying continuously acquired data as multiple traces on a fixed length display |
| JPH1038927A (en) * | 1996-07-23 | 1998-02-13 | Advantest Corp | Waveform-analyzing apparatus |
| JP3377391B2 (en) * | 1997-02-12 | 2003-02-17 | 日本テクトロニクス株式会社 | Real-time signal analyzer |
| US6393158B1 (en) | 1999-04-23 | 2002-05-21 | Monkeymedia, Inc. | Method and storage device for expanding and contracting continuous play media seamlessly |
| US10051298B2 (en) | 1999-04-23 | 2018-08-14 | Monkeymedia, Inc. | Wireless seamless expansion and video advertising player |
| US6515665B1 (en) * | 1999-06-21 | 2003-02-04 | Tektronix, Inc. | Data filtering/suppression of data acquisitions/samples for multi-channel electronic display and analysis |
| JP3375919B2 (en) * | 1999-11-11 | 2003-02-10 | アンリツ株式会社 | Signal analyzer |
| US7443396B2 (en) * | 2000-11-29 | 2008-10-28 | National Instruments Corporation | Instrument having a virtual magnifying glass for displaying magnified portions of a signal waveform |
| US6751565B2 (en) * | 2002-06-21 | 2004-06-15 | Springsoft, Inc. | Fast waveform display method and system |
| US7227549B2 (en) * | 2003-02-13 | 2007-06-05 | Tektronix, Inc. | Indicating and manipulating a zoom region of a waveform |
| US6904381B2 (en) * | 2003-03-07 | 2005-06-07 | Agilent Technologies, Inc. | Testing of a frequency converter device |
| JP2004347320A (en) * | 2003-05-15 | 2004-12-09 | Advantest Corp | Display and method for measuring and displaying signal |
| US7663624B2 (en) * | 2004-06-30 | 2010-02-16 | Lecroy Corporation | Report generating method and apparatus |
| US7859534B2 (en) * | 2005-03-24 | 2010-12-28 | Advantest Corporation | Measuring device, graphics generating method, program and recording medium |
| US7813825B2 (en) * | 2006-07-10 | 2010-10-12 | Apple Inc. | Multiband dynamic range control graphical interface |
| JP5705395B2 (en) * | 2006-07-21 | 2015-04-22 | テクトロニクス・インターナショナル・セールス・ゲーエムベーハー | Signal analyzer |
| EP2171486B1 (en) * | 2007-07-16 | 2014-11-19 | Tektronix, Inc. | Apparatus and methods of defining spectral regions of interest for signal analysis |
| WO2009069675A1 (en) * | 2007-11-27 | 2009-06-04 | Nikon Corporation | Fluorescent microscope |
| CN101650377A (en) * | 2008-08-11 | 2010-02-17 | 鸿富锦精密工业(深圳)有限公司 | Signal measurement system and method thereof |
| US8284200B2 (en) * | 2009-01-29 | 2012-10-09 | Agilent Technologies, Inc. | Systems and methods for focus plus context viewing of dense, ordered line graphs |
| US8464171B2 (en) * | 2009-06-26 | 2013-06-11 | Eppendorf Ag | Device for displaying a function chart |
| GB201019077D0 (en) * | 2010-11-11 | 2010-12-29 | Benmore Ventures Ltd | Electronic display device |
| US8872504B2 (en) * | 2011-04-29 | 2014-10-28 | Tektronix, Inc. | Method for automatically setting frequency span in a spectrum analyzer |
| JP2013053873A (en) * | 2011-09-01 | 2013-03-21 | Jeol Ltd | Spectrum display device, spectrum display method, and program |
| JP5880314B2 (en) * | 2012-06-29 | 2016-03-09 | 株式会社Jvcケンウッド | Wireless device and frequency display method |
| US9329967B2 (en) * | 2012-11-13 | 2016-05-03 | Tektronix, Inc. | Methods and systems for aiding the analysis of a signal |
| US9858240B2 (en) * | 2012-12-13 | 2018-01-02 | Tektronix, Inc. | Automatic center frequency and span setting in a test and measurement instrument |
| DE102014203355A1 (en) * | 2014-02-25 | 2015-09-10 | Rohde & Schwarz Gmbh & Co. Kg | Measuring method and measuring instrument with fingertip zoom |
| EP2990809B8 (en) * | 2014-08-29 | 2018-10-24 | Rohde & Schwarz GmbH & Co. KG | Measuring device with a display memory having memory cells with a reduced number of bits and a corresponding method |
| JP6862621B2 (en) * | 2015-12-21 | 2021-04-21 | アンリツ株式会社 | Measuring device and measuring method |
| US10852323B2 (en) * | 2018-12-28 | 2020-12-01 | Rohde & Schwarz Gmbh & Co. Kg | Measurement apparatus and method for analyzing a waveform of a signal |
| CN109781856A (en) * | 2019-02-25 | 2019-05-21 | 河北普阳钢铁有限公司 | The method that double-crystal normal probe judges field trash group defect in flat metal plate |
| USD987459S1 (en) * | 2021-04-26 | 2023-05-30 | Yokogawa Electric Corporation | Spectrum analyzer |
Family Cites Families (18)
| Publication number | Priority date | Publication date | Assignee | Title |
|---|---|---|---|---|
| JPS5310413B2 (en) * | 1974-09-06 | 1978-04-13 | ||
| US4257104A (en) * | 1978-08-10 | 1981-03-17 | Hewlett-Packard Company | Apparatus for spectrum analysis of an electrical signal |
| JPS5926902B2 (en) * | 1979-03-31 | 1984-07-02 | アンリツ株式会社 | Frequency marker display device |
| JPS59145970A (en) * | 1983-01-11 | 1984-08-21 | Horiba Ltd | Displaying method of spectrum |
| JPS59157575A (en) * | 1983-02-27 | 1984-09-06 | Anritsu Corp | Spectrum analyzer |
| JPS59157574A (en) * | 1983-02-27 | 1984-09-06 | Anritsu Corp | Spectrum analyzer |
| US4649496A (en) * | 1984-02-16 | 1987-03-10 | Hewlett-Packard Company | Spectrum analyzer with improved data analysis and display features |
| JPS60203862A (en) * | 1984-03-29 | 1985-10-15 | Jeol Ltd | Display control system of spectrum data |
| JPS61288164A (en) * | 1985-06-17 | 1986-12-18 | Advantest Corp | Waveform display device |
| US4947338A (en) * | 1986-08-22 | 1990-08-07 | Tektronix, Inc. | Signal identification method |
| US4868785A (en) * | 1987-01-27 | 1989-09-19 | Tektronix, Inc. | Block diagram editor system and method for controlling electronic instruments |
| JP2627501B2 (en) * | 1987-03-06 | 1997-07-09 | アンリツ株式会社 | Spectrum analyzer |
| JPH0769364B2 (en) * | 1987-03-06 | 1995-07-31 | アンリツ株式会社 | Spectrum analyzer |
| US4839582A (en) * | 1987-07-01 | 1989-06-13 | Anritsu Corporation | Signal analyzer apparatus with automatic frequency measuring function |
| JP2577566B2 (en) * | 1987-07-01 | 1997-02-05 | アンリツ株式会社 | Spectrum analyzer |
| JP2766685B2 (en) * | 1988-09-26 | 1998-06-18 | アンリツ株式会社 | Spectrum analyzer |
| DE3900534A1 (en) * | 1989-01-10 | 1990-07-12 | Boehringer Mannheim Gmbh | DIAGNOSTIC PROOF USING CHIMAIR ANTIBODIES |
| JP2891497B2 (en) * | 1990-01-25 | 1999-05-17 | アンリツ株式会社 | Spectrum analyzer |
-
1991
- 1991-03-30 DE DE69117409T patent/DE69117409T2/en not_active Expired - Fee Related
- 1991-03-30 EP EP95105455A patent/EP0664459B1/en not_active Expired - Lifetime
- 1991-03-30 US US07/776,259 patent/US5434954A/en not_active Expired - Fee Related
- 1991-03-30 DE DE69132242T patent/DE69132242T2/en not_active Expired - Fee Related
- 1991-03-30 EP EP91906506A patent/EP0477379B1/en not_active Expired - Lifetime
- 1991-03-30 JP JP50636691A patent/JP3184832B2/en not_active Expired - Fee Related
- 1991-03-30 WO PCT/JP1991/000425 patent/WO1991015776A1/en active IP Right Grant
- 1991-03-30 EP EP95105445A patent/EP0664457A3/en not_active Withdrawn
- 1991-03-30 EP EP95105454A patent/EP0664458A3/en not_active Ceased
-
1995
- 1995-02-08 US US08/385,555 patent/US5519820A/en not_active Expired - Fee Related
Also Published As
| Publication number | Publication date |
|---|---|
| EP0664458A3 (en) | 1996-05-22 |
| EP0477379B1 (en) | 1996-02-28 |
| EP0664457A3 (en) | 1996-05-22 |
| EP0477379A4 (en) | 1992-09-30 |
| DE69132242T2 (en) | 2001-01-25 |
| EP0664457A2 (en) | 1995-07-26 |
| EP0664458A2 (en) | 1995-07-26 |
| DE69117409T2 (en) | 1996-11-14 |
| EP0477379A1 (en) | 1992-04-01 |
| US5519820A (en) | 1996-05-21 |
| EP0664459A3 (en) | 1996-05-22 |
| DE69117409D1 (en) | 1996-04-04 |
| DE69132242D1 (en) | 2000-07-06 |
| US5434954A (en) | 1995-07-18 |
| JP3184832B2 (en) | 2001-07-09 |
| WO1991015776A1 (en) | 1991-10-17 |
| EP0664459A2 (en) | 1995-07-26 |
Similar Documents
| Publication | Publication Date | Title |
|---|---|---|
| EP0664459B1 (en) | Waveform display apparatus for easily realizing high-definition waveform observation | |
| US5579463A (en) | Waveform display apparatus of frequency sweep type for facilitating display of a high definition waveform | |
| US5617523A (en) | Waveform display apparatus for easily realizing high-definition waveform observation | |
| EP0439157A2 (en) | Waveform analyzer having function of simultaneously displaying wide- and narrow-band spectra of transmission characteristics | |
| EP0297590B1 (en) | Signal analyzer apparatus with automatic frequency measuring function | |
| US4257104A (en) | Apparatus for spectrum analysis of an electrical signal | |
| JP4762382B2 (en) | Spectrum analyzer | |
| US4801873A (en) | Waveform measuring apparatus with marker zone displaying function | |
| US6233529B1 (en) | Frequency spectrum analyzer having time domain analysis function | |
| JP2002506525A5 (en) | ||
| US4264958A (en) | Video processor for a spectrum analyzer | |
| US4568878A (en) | Spectrum analyzers | |
| EP0364771B1 (en) | Spectrum analyzer capable of displaying signals obtained during a specified period by means of continuous sweep | |
| JP2533813B2 (en) | Spectrum analyzer | |
| JPH07209352A (en) | Spectrum analyzer | |
| US7701195B2 (en) | Actual-ray and image-ray distinction in frequency converters for spectrum analysers | |
| US7741830B2 (en) | Image cancellation in frequency converters for spectrum analysers | |
| JPH0769361B2 (en) | Spectrum analyzer | |
| JP2928867B2 (en) | measuring device | |
| JP3269517B2 (en) | Waveform observation device | |
| JP3028388B2 (en) | Electronic circuit frequency characteristic measurement device | |
| JP2022109773A (en) | Measuring device and method for interpolating the same | |
| SU1167526A1 (en) | Device for monitoring phase shift | |
| JPH0552464B2 (en) |
Legal Events
| Date | Code | Title | Description |
|---|---|---|---|
| PUAI | Public reference made under article 153(3) epc to a published international application that has entered the european phase |
Free format text: ORIGINAL CODE: 0009012 |
|
| AC | Divisional application: reference to earlier application |
Ref document number: 477379 Country of ref document: EP |
|
| AK | Designated contracting states |
Kind code of ref document: A2 Designated state(s): DE FR GB |
|
| 17P | Request for examination filed |
Effective date: 19950614 |
|
| PUAL | Search report despatched |
Free format text: ORIGINAL CODE: 0009013 |
|
| AK | Designated contracting states |
Kind code of ref document: A3 Designated state(s): DE FR GB |
|
| 17Q | First examination report despatched |
Effective date: 19981215 |
|
| GRAG | Despatch of communication of intention to grant |
Free format text: ORIGINAL CODE: EPIDOS AGRA |
|
| GRAG | Despatch of communication of intention to grant |
Free format text: ORIGINAL CODE: EPIDOS AGRA |
|
| GRAH | Despatch of communication of intention to grant a patent |
Free format text: ORIGINAL CODE: EPIDOS IGRA |
|
| GRAH | Despatch of communication of intention to grant a patent |
Free format text: ORIGINAL CODE: EPIDOS IGRA |
|
| GRAA | (expected) grant |
Free format text: ORIGINAL CODE: 0009210 |
|
| AC | Divisional application: reference to earlier application |
Ref document number: 477379 Country of ref document: EP |
|
| AK | Designated contracting states |
Kind code of ref document: B1 Designated state(s): DE FR GB |
|
| PG25 | Lapsed in a contracting state [announced via postgrant information from national office to epo] |
Ref country code: FR Free format text: LAPSE BECAUSE OF FAILURE TO SUBMIT A TRANSLATION OF THE DESCRIPTION OR TO PAY THE FEE WITHIN THE PRESCRIBED TIME-LIMIT Effective date: 20000531 |
|
| REF | Corresponds to: |
Ref document number: 69132242 Country of ref document: DE Date of ref document: 20000706 |
|
| EN | Fr: translation not filed | ||
| PG25 | Lapsed in a contracting state [announced via postgrant information from national office to epo] |
Ref country code: GB Free format text: LAPSE BECAUSE OF NON-PAYMENT OF DUE FEES Effective date: 20010330 |
|
| PLBE | No opposition filed within time limit |
Free format text: ORIGINAL CODE: 0009261 |
|
| STAA | Information on the status of an ep patent application or granted ep patent |
Free format text: STATUS: NO OPPOSITION FILED WITHIN TIME LIMIT |
|
| 26N | No opposition filed | ||
| GBPC | Gb: european patent ceased through non-payment of renewal fee |
Effective date: 20010330 |
|
| PG25 | Lapsed in a contracting state [announced via postgrant information from national office to epo] |
Ref country code: DE Free format text: LAPSE BECAUSE OF NON-PAYMENT OF DUE FEES Effective date: 20020101 |